Optimize the value of your construction project · Optimize the value of your construction project...
42
Optimize the value of your construction project from strategy to execution Mexico City, Mexico October 15, 2013 www.pwc.com
Transcript of Optimize the value of your construction project · Optimize the value of your construction project...

Optimize the value ofyour construction projectfrom strategy to execution
Mexico City, MexicoOctober 15, 2013
www.pwc.com

PwC’s Capital Projects and InfrastructureAdvisory Services
Combining engineering, construction and projectmanagement skills, the PwC CP&I team serves the fullasset life cycle from strategy through execution.
Exploration /Concept
Pre-feasibility FeasibilityPlanning &
Construction,Execution and
Operations,closure, and
PwCOctober 15, 2013
Concept Planning &Design
Execution andStart-up
closure, andreclamation
Defineneed
Specifyscope
OptionAnalysis
Businesscase
MonitorBenefits
ReviewProject
EngineerConstruct
Test &Hand-over
Reviewevaluation
Funding/approval
Optimizing Capital Projects - Mexico City2

CP&I global presence
Australia 30
US & Canada,200
UK, 200HK and China, 9
India, 290
PwC
Australia 30
Brazil 4
Canada 35
CEE 25
China/HK 9
India 290
Japan 17
Mexico 20
Middle East 12
Singapore 12
South Africa 23
Spain 12
UK 200
US 165
Australia,30
South Africa, 23
Central andSouthAmerica, 10
Over 200 CP&I professionals within the Americas20 full-time CP&I staff in Mexico
October 15, 2013Optimizing Capital Projects - Mexico City3
Mexico, 20

Industries and sectors the CP&I practice services
Energy Utilities Transportation
PwCOptimizing Capital Projects - Mexico City October 15, 2013
Petrochemical
Mining Mega-events
Entertainment /Hospitality
Healthcare
Communications
4

Optimize the value of your capital project
A. Why do projects fail?
B. Aligning capital project with corporate strategy
C. Case studies - differentiators in practice
PwCOctober 15, 2013Optimizing Capital Projects - Mexico City
5

Why do projects fail?
PwCOctober 15, 2013Optimizing Capital Projects - Mexico City
6

Why do projects fail?
Technical problemsSuppliers’ failures 8%
Inappropriate/inadequateresources
InadequateProject Environment
InadequatePlanning/Monitoring
Directlyrelatedtotechnical aspects
4%
4%
10%
11%
15%
Technicalaspects
Ineffective Projectgovernance,
management &oversight
Weak /ambiguous
contract terms,misalignedincentives
Unanticipatedsite conditions
Poor projectcontrols(cost &
schedule)
Design errors andomissions leadingto scope growth /
re-work
PwCOctober 15, 2013
92%Monitoring
Lackof clearobjectives
Directlyrelatedtomanagerial aspects
Lackof management(organizational)
20%
36%
Managerialaspects
Optimizing Capital Projects - Mexico City
Costoverruns /schedule
delays
Imposed cashconstraints /
delayed payment
Inexperiencedmanagement
teamSkilled laboravailability
Poor riskidentification,
management andresponse strategy
Late design/ poorproject
definition
Inadequatecommunication/ slow decision
making
Insufficientplanning / poor
estimating
7

Only 2.5% of projects are delivered on-time, on-budget, with expected benefits
Under Budget6%
1-25%Over Budget
19%76-100%Over Budget
101% +Over Budget
12%
Projects with cost overruns
PwCOctober 15, 2013
The causes of failure are common and fairly well understood…yet are frequently repeated
Source: PwC analysis on global mega-projects, and industry research. See PwC’s Correcting the Course of Capital Projects, April 2013
26-50%Over Budget
24%
51-75%Over Budget
15%
Over Budget24%
Optimizing Capital Projects - Mexico City8

What causes ‘Surprises”Common challenges with capital projects
Strategic People Process / Systems
• Lack of clearinvestment strategy
• Project by projectfocus
• Investment notaligned with
• Spending withoutauthorization
• Personality based budgeting• Inconsistent project business
case• Multiple project approval
• High variability withforecasts
• Lack of granularity andaccuracy in resourcedemand
• Poor visibility into project
PwCOctober 15, 2013Optimizing Capital Projects - Mexico City
aligned withbusiness priorities
• No linkage betweeninvestment basisand deliveredbenefits
• Multiple project approvalchannels
• Lack of process control,governance
• Lengthy project approvaldelays
• Lack of clear roles &responsibilities
• No linkage to riskmanagement
• Poor visibility into projectprogress and performance
• Ineffective project changecontrol
• No data, reporting, anddocument controlstandards
• Unpredictable cash flow• No benefit realization
reporting
9

How is “Value “ measured?
75% of companies reported an average shareprice drop of 12% within 90 days of reporting a‘troubled project’ (significant negative trend orevent)
n=36
Thirty-seven percent of directors believethere is no clear allocation of specific 37%
75%
PwC
82% of Directors reported havinglimited or no engagement incapital projects
n=400
there is no clear allocation of specificresponsibilities for overseeing major risks
among the board and its committees.
37%
October 15, 2013Optimizing Capital Projects - Mexico City
82%
10

Capital project performance can erode share value- If mismanaged and miscommunicated
PwCOctober 15, 2013Optimizing Capital Projects - Mexico City
11

The true cost of failure
Real or perceived project failure goes beyond the directimpacts associated with increased costs or schedule delays
• Loss of revenue associated with missed production/operation targets
• Inefficient capital allocation and need for short term financing
• Loss of shareholder confidence
PwC
• Loss of shareholder confidence
• Strained relationships with delivery partners / supply chain
• Claims and disputes with vendors / contractors
Optimizing Capital Projects - Mexico City October 15, 201312

Aligning capital projects withcorporate strategy
“This is an opportunity to say, can we makedo with less and do more…”
“We’ve put an extreme focus on issues ofproductivity and capital discipline…”
PwCOctober 15, 2013
“Lower costs and rising production can. andmust, live together in a lower [commodity]price environment…”
“We will spend the minimum amount ofcapital required to maintain the economicpotential of these assets..
PeterMarrone, CEO Yamana Gold Yamana Annual General Meeting, April 30, 2013Andrew MacKenzie, CEO BHP Billiton Australia Financial Review,March 08, 2013
Alec Kodatskym, CIBC World Markets Analyst National Post, May 02, 2013Jamie Sokalsky, CEO Barrick Gold Globe and Mail, February 14, 2013
Optimizing Capital Projects - Mexico City13

Key high performance differentiators
1. Strategic alignment
Plan Execute
Assess Develop Procure Deliver Operate DisposeStrategy
Monitor
Capital Project Lifecycle
Increase the likelihood of success - Strategy throughexecution
PwCOctober 15, 2013
1. Strategic alignment
2. Organizational capability
3. Governance, controls and technology
4. Procurement and contracting
5. Scope, schedule and cost management
6. Risk and issue management
7. Stakeholder management
Optimizing Capital Projects - Mexico City14
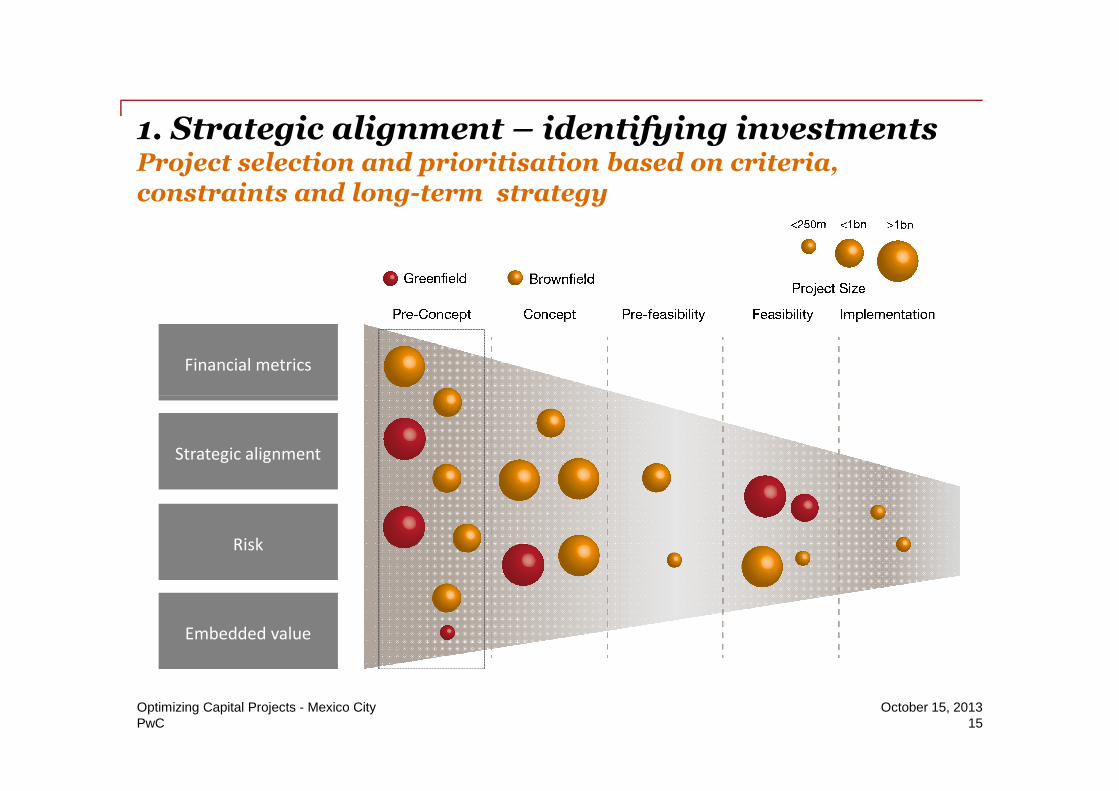
1. Strategic alignment – identifying investmentsProject selection and prioritisation based on criteria,constraints and long-term strategy
Financial metricsFinancial metrics
PwC
Strategic alignmentStrategic alignment
RiskRisk
Embedded valueEmbedded value
October 15, 2013Optimizing Capital Projects - Mexico City15

2. Organization capabilityEveryone is part of ‘Governance’
Execution
Oversight AssuranceProject Sponsor
ExecutiveSteering
Committee
Externalschedule
Advisory Board
PwC
Project Director
ProjectControls
Engineering Procurement
Owner’sEngineer
Consultants
EPC Vendor
Subcontractors
FabricatorsMaterialSuppliers
QualityManagement
Commissioning EHSConstruction
October 15, 2013Optimizing Capital Projects - Mexico City16

2. Organization capabilityOperational “Readiness”
• Integrate capital project planning and execution with corporate functions
• Scale organization to align with planned and active projects
• Establish transparency and early warning mechanisms
• Create the framework and financial mechanisms for driving capital efficiency
Portfolio Management
PwCOptimizing Capital Projects - Mexico City October 15, 2013
Portfolio Management
Financial ManagementAnnual Planning & Budgeting Norms
PortfolioOptimization
Project Planning
HRManagement
Project Management and Controls
P & SCManagement
Project Estimating & Costing Norms
Project AccountingStrategicPlanning
ContractorManagement
17

3. Governance, controls and technologyScalable Governance / Delivery ModelsAvoid a ‘One Size fits all’ approach
Mega ProjectThe mega project is an order of magnitude (or more) largerthan the typical project for the organization.
Margin
OH/RiskCapex
Feed/Opex
$
Time
Capital project delivery risk scenarios
PwC
One-Time Large or Very Large ProjectCapital projects are not executed as a normal course ofbusiness and this is a single capital investment.
Portfolio of Small and Medium ProjectsThe schedule involves a collection of projects for meeting aspecific objective (e.g. growth or regulatory)
Capital Intensive Repeatable ProjectsThe asset base for the company requires steady capitalinvestment to maintain production.
Margin
OH/Risk
Capex
Feed/Opex
$
Time
$
Time
Margin
OH/Risk
Capex
Feed/Opex
$
Time
Margin
OH/Risk
Capex
Feed/Opex
October 15, 2013Optimizing Capital Projects - Mexico City18

4. Procurement and contracting
• Design – bid – build (traditional)
• Design – build
• Engineer, Procure and Construct(EPC)
• Engineer, Procure andConstruction Management
• Fixed price / lump sum
• Fixed price / unit price
• Cost reimbursable
• Target Cost / GMP
Delivery Model Pricing Model
PwC
Construction Management(EPCM)
• PPP – Public Private Partnership
• Construction management
◦ CM - agent
◦ CM - at risk
• Hybrids – BOOT, BOT, PEPC,LSTK
October 15, 2013Optimizing Capital Projects - Mexico City
• Negotiated
• Competitive bid
- Single / Multi stage
- Single / Multi package
Procurement Method
19

4. Procurement and contracting
Project Execution Plan (PEP)The PEP is the detailed execution plan foreach of the projects within the portfolio.
Project Procedure Manual (PPM)The PPM includes detailed processes,procedures, standards and requirements.
Governance documents takes intoaccount all types of capital
projects and contractingstrategies across organization
Align oversight with contracting strategy
PwCOctober 15, 2013Optimizing Capital Projects - Mexico City
Portfolio Oversight Policy (POP)The POP summarizes and communicatescorporate standards that should be appliedto all projects within the capital projectportfolio. The document will includeproject / program management standards,and summary level processes / procedures.
Project Execution Plan
Project Procedure Manual
Portfolio Oversight Policy
20

5. Scope, schedule and cost management
Pre-conceptPre-concept ConceptConcept FeasibilityFeasibility EngineeringEngineering ConstructionConstruction
• Plan forresources
• Define roles• Define success
criteria• Define models
and scope
• Identifyopportunitiesand scenarios
• Classify risks• Align objectives• Identify quick
wins
• Quantifyeconomics
• Define optionsRank by value,risk and effort
• Submit BusinessCase
• Engineering• Procurement• Operations plan• Risk plan• Contracting• Sanctioning
• Construction• Plan and
logistics• Risk
management• Supervision• Measurement
Post Imp. Review
• Track benefitsrealization
• Operations• Measurement• KPI monitoring• Plan correction
Project Optimisation - Industry Best PracticeFront end loading – ‘influence curve’
PwC
and scope wins Case • Measurement
Maximum Influence
Minimum Influence
Cost to implementchange
Project lifecycle October 15, 2013Optimizing Capital Projects - Mexico City21
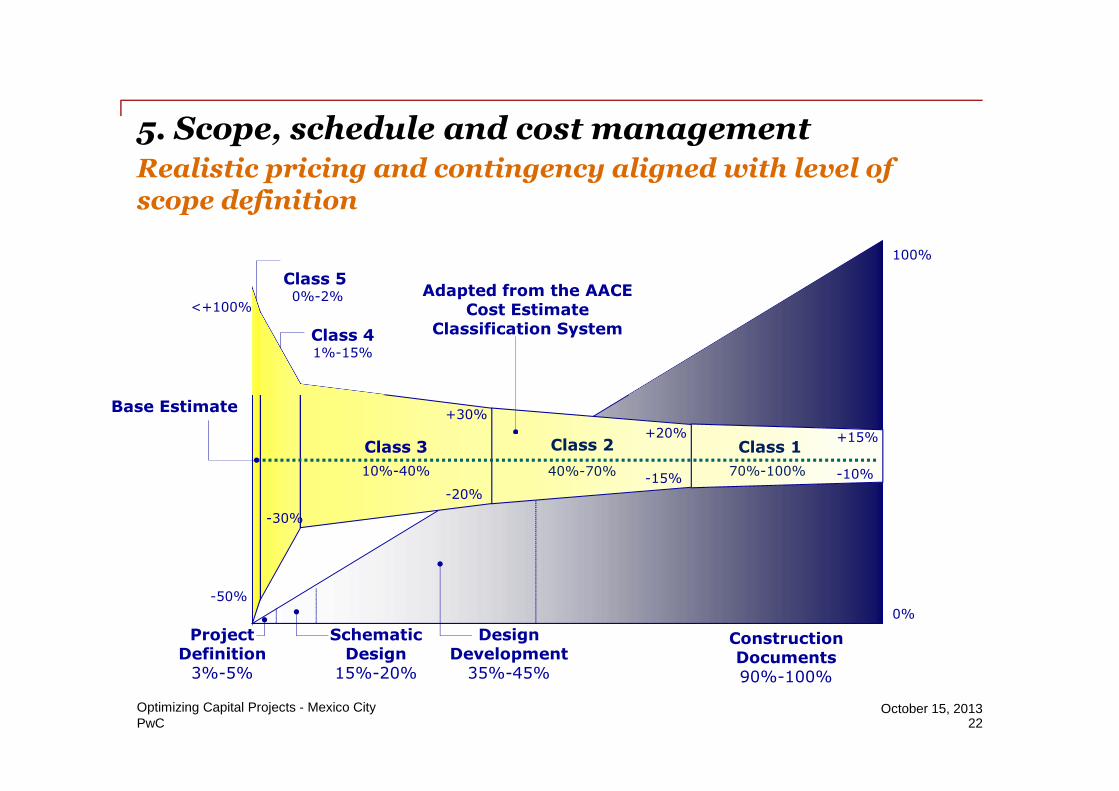
5. Scope, schedule and cost managementRealistic pricing and contingency aligned with level ofscope definition
Class 50%-2%
Class 41%-15%
Adapted from the AACECost Estimate
Classification System
+50%
<+100%
100%
Levelo
fS
co
pe
Defin
ition
PwC
ProjectDefinition
3%-5%
SchematicDesign
15%-20%
DesignDevelopment
35%-45%
ConstructionDocuments90%-100%
Class 3
10%-40%
Class 2
40%-70%
Class 1
70%-100%
Base Estimate
+15%
-10%
+20%
-15%
+30%
-20%
-30%
-50%
0%
Levelo
fS
co
pe
Defin
ition
October 15, 2013Optimizing Capital Projects - Mexico City22

5. Scope, schedule and cost managementIntegrated planning and scheduling
Business Unit - High levelschedule overview
Region - Level 1 schedules withsome level of integration
PwC
some level of integrationbetween projects
Program – Level 2 schedulesintegrated within programs
Project – Detailed level 3-4schedules using standard coding
October 15, 2013Optimizing Capital Projects - Mexico City23

5. Scope, schedule and cost management
Schedule progress output
PwCOctober 15, 2013Optimizing Capital Projects - Mexico City
As-Built Bar
As-Planned Bar
As-Built Bar
As-Planned Bar
24

5. Scope, schedule and cost management
Schedule analytics output
Shows variance between forecasted (original) duration and actual duration.Highlights contractor’s ability to accurately forecast durations.
Outside Battery LimitsCoker
PwC
25% - Lessthan or Equalto OriginalDuration
75% - Greaterthan OriginalDuration
CokerSulfer Recovery UnitGas/Oil Hydrotreater
October 15, 2013Optimizing Capital Projects - Mexico City25

5. Scope, schedule and cost management
Schedule analytics output
1500
2000
Ac
tiv
ity
Co
un
t
A bow wave graphic shows the number of activities scheduled to complete eachmonth for every schedule update.
PwC 26
0
500
1000
1500
Ac
tiv
ity
Co
un
t
Schedule Update Dates (Data Dates)October 15, 2013Optimizing Capital Projects - Mexico City

6. Risk and issue managementCan your execution teams answer these questions?
• How confident are you that we will complete this project on budget?
• How have you identified, tracked and quantified risks and issues?
• Is there enough contingency/unallocated provision remaining?
• Which risks are most likely to threaten success?
PwC
• What is mitigation and response strategy to each?
Quantitative risk assessments are attractive because theyindicate a range of potential outcomes in terms oflikelihood (probability)
October 15, 2013Optimizing Capital Projects - Mexico City27

6. Risk and issue managementRisk management and cost uncertainty
• A risk-based estimate forunforeseeable events impact todefined work scope
• Represents a total estimate ofwhat project is likely to cost.
0.08
0.1
0.12
Co
nfi
den
ce
Level
BaseEstimate
80%ConfidenceLevel (P80)
Contingency
100%
PwC
what project is likely to cost.• Does not include escalation or
changed work scope
• Tracked as separate line –item
• Not a "cushion" or "safety net.“
0
0.02
0.04
0.06
7.3
7.4
7.5
7.7
7.8
7.9
8.1
8.2
8.4
8.5
8.6
8.8
8.9
9.0
9.2
9.3
9.4
9.6
9.7
9.8
10
.0
Co
nfi
den
ce
Level
Estimated Cost $M
October 15, 2013Optimizing Capital Projects - Mexico City28

6. Risk and issue managementCapital cost efficiency
Top-down “bubble” of contingency
Broad brushedContingency “bubble”to cover all wells on site(e.g. 10% on allprojects)
0
0.005
0.01
0.015
0.02
0.025
0.03
0.035
0.04
0.045
0.05
PwCOctober 15, 2013
0
0.05
0.1
0.15
0.2
0.25
Bottom-up “shrink-wrapped” cost estimate
Contingency for eachwell is “shrink-wrapped” aroundindividual risk profiles
Optimizing Capital Projects - Mexico City
29
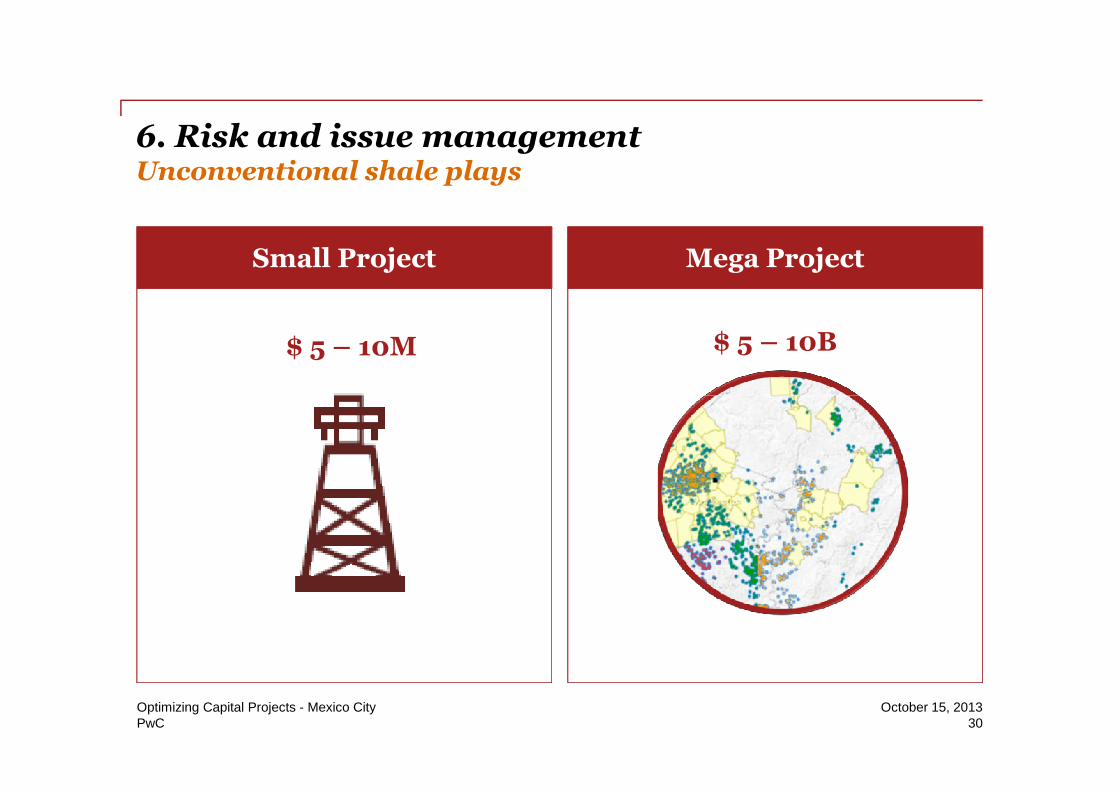
Small Project Mega Project
$ 5 – 10M $ 5 – 10B
6. Risk and issue managementUnconventional shale plays
PwCOctober 15, 2013Optimizing Capital Projects - Mexico City
30

6. Risk and issue managementRisk management – drilling & completion s example
Item Optimistic Expected Pessimistic
Drilling
Site preparation 375,000 400,000 575,000
Rig (Mob/De-Mob) 900,000 1,000,000 1,200,000
Drilling & Cementing 1,325,000 1,500,000 1,700,000
PwC
Drilling & Cementing 1,325,000 1,500,000 1,700,000
Casing 1,000,000 1,100,000 1,250,000
Completion
Stimulation 2,800,000 3,000,000 3,300,000
Perforation & Flowback 1,100,000 1,250,000 1,550,000
Tubing & Surface Equip. 200,000 250,000 325,000
Drilling & Completion 7,700,000 8,500,000 9,900,000
October 15, 2013Optimizing Capital Projects - Mexico City31

P70: $674.76M
P90: $705.62M
60%
70%
80%
90%
100%
2.0%
2.5%
3.0%
Cu
mu
lati
ve
Pr
ob
ab
ilit
y(c
on
fid
en
ce
tha
tc
os
t<=
x)
Dis
cr
ete
Pr
ob
ab
ilit
y(c
on
fid
en
ce
tha
tc
os
t=
x)
6. Risk and issues management
Budget/Bid Strategy aligned with risk appetite andmarket conditions
P90
PwC
P10: $593.63M
P30: $632.62M
Base Estimate*:$639.41M
P50: $653.22M
0%
10%
20%
30%
40%
50%
60%
0.0%
0.5%
1.0%
1.5%
$5
56
$5
65
$5
74
$5
82
$5
91
$6
00
$6
09
$6
17$
62
6$
63
5$
64
3$
65
2$
66
1$
67
0$
67
8$
68
7$
69
6$
70
4$
713
$7
22
$7
31
$7
39
$7
48
$7
57
$7
65
$7
74
Cu
mu
lati
ve
Pr
ob
ab
ilit
y(c
on
fid
en
ce
tha
tc
os
t<=
x)
Dis
cr
ete
Pr
ob
ab
ilit
y(c
on
fid
en
ce
tha
tc
os
t=
x)
Total Project Cost ($Mn)
P50
October 15, 2013Optimizing Capital Projects - Mexico City32

6. Risk and issue managementRisk management - managing contingency
• Separate identification and management of contingency improvescost transparency and enables proactive management actions
• Each risk has an owner and mitigation strategy (most valuable aspectof quantitative risk management)
• Many organizations give “ownership” of contingency amounts to a
PwC
• Many organizations give “ownership” of contingency amounts to asteering committee or senior management team
- PMO must demonstrate need for contingency draw;
- Requires leadership involvement in project decisions and growth;
- Active management of a separate contingency cost pool enhancesoverall project budget management
October 15, 2013Optimizing Capital Projects - Mexico City33

7. Stakeholder management
IdentifyStakeholders
AnalyzeStakeholders
SegmentStakeholders
DevelopCommunication
Strategy
PrepareCommunication
Plan
Stakeholder Analysis Communication Strategy and Plan
• Assess stakeholders
Maximizing likelihood of success while reducing exposure torisks associated with each stakeholder.
PwC
• Identifyindividuals orgroups thathave an impactor will beimpacted bythe selection ofan alternativefundingmethod.
• Assess stakeholdersacross the followingdimensions:Level of influenceLevel of impactLevel of
commitmentAnticipated
resistance
• Segmentstakeholdersbased on similarcharacteristicsand currentpositioningacross thedimensions ofstakeholderinfluence /impact.
• Develop acommunicationsstrategy to meetthe changinginformationalneeds ofstakeholdersover time.
• Prepare adetailedcommunicationplan thatincludes keymessages,timing,frequency, anddistributionmethods.
October 15, 2013Optimizing Capital Projects - Mexico City34

Case studies
PwCOptimizing Capital Projects - Mexico City October 15, 2013
35

Case study – Iron ore mining project
$6Billion Iron Ore project – PwC carried out baseline assessment and quarterlyreviews of this investment in one of the world largest base metal reserve. Site visits,delivery partner interrogation focused on scope definition, estimating accuracy,execution readiness, emerging risks, issues and mitigation strategies, and reportingto the Board through web-based dashboards.
Actions Project Impact and Outcomes
• Conducted baseline assessment ofproject risk profile/team capabilities;
Defined current state findings andrecommendations to achieve target state
PwC
project risk profile/team capabilities;• Developed three year review plan
focusing on key project risks andmilestones throughout the projectlifecycle.
• Reviewed overall project structureincluding the Owner’s team as well asthe EPCm and EPC.
• Performed scheduling analytics andverified current project completiontimeline and performance trending.
recommendations to achieve target state• Improvements in governance, oversight• Standardization and documentation
(Project Execution Plan),• Formal communication strategy,• Scheduling and planning process;• Risk and change management process.• Executive summary presented to the
Board of Directors.
October 15, 2013Optimizing Capital Projects - Mexico City36

Case study - Refinery upgrade & modernization
An Integrated Oil & Gas company needed to establish confidence of its current costand schedule forecasts of one of its major capital projects. Initially sanctioned as a$3.8B, 36 month project, it was projected to be a $7.1B 5-year project. Risk, Costand Schedule validation and analytics were utilized to quantify likelihood of success,and identify actions to improve confidence in delivery.
Actions Project Impact and Outcomes
• Reviewed design and scope definition• Evaluated effectiveness of governance
• Key trends and variances identified inschedule with remediation strategy
PwC
• Evaluated effectiveness of governanceover EPCM firms and Integrated PMO
• Performed schedule analytics• Created Risk Register, and Quantitative
Risk Assessments to test contingency• Analyze performance / cost trends• Established predictive analytics model
linked to CPM schedule and budget• Reviewed procurement and contract
administration and change control• Identified and reported on areas of
concern and/or focus
schedule with remediation strategy• Identified nonconformance issues in risk
reporting and change control• New target completion date and cost
model was established to monitor workto completion
• Established tighter change controls andrisk mitigation strategy
• Established 90% confidence in newtarget completion date and budget
• Established new contingency draw downmechanisms and procedures
October 15, 2013Optimizing Capital Projects - Mexico City37

Case study – Shale field development planning
An integrated oil company needed to improve drilling and completion costs,establish predictability and improve return on investment on shale fielddevelopment The status quo (cost environment) was not sustainable; and significantcycle time improvement and develop implement integrated planning. (land,logistics, pad, rig, post rig crews) was required to decreased standing time,inefficiencies and to ‘reduce the drag’
Objectives Project Impact and Outcomes
Develop consistent understanding &• 10 – 50% improvement in availability
PwCOptimizing Capital Projects - Mexico City October 15, 2013
Develop consistent understanding &application of the NWD workflow andhandover processDefine and clarify standard roles andresponsibilitiesIncorporate ongoing Wells Handover Teamwork into processDefine the standard workflow to establishthe baselineImprove integration and collaborationacross functions
• 10 – 50% improvement in availability• 15 – 25% reduction in costs• 30 – 40% reductions in drilling
cycle time• 15 – 40% improvements in project
schedule performance (vs. originaltarget)
• 10 – 20% lower actual project budgetspending (vs. original target)
38

Case study – New build power generation
$35Bn capital program, including an aggressive program to build new power stations,return to service and major power lines. Two new 4800 MW coal fired power stationsare part of the program, where a ‘no Surprises’ effort has assisted in assessingperformance and trends to date, predicting risks in subsequent phase, enhancing deliverycapabilities, and providing an added layer of assurance and insight.
Actions Project Impact and Outcomes
• Reviewing and assessing selected majorwork packages and current project
• Identify overall exposure to costoverruns and schedule delays
PwC
work packages and current projectmanagement systems and processes:
• Establish whether the identified workpackages are being managed inaccordance with the contract andapplicable policies, mandates, andregulatory prescripts
• Supplemental claim / dispute strategiesto minimize exposure to additional costs
• Schedule and cost support• Risk and issue management support
overruns and schedule delays• Identify potential contractual and
commercial remedies to recover costs• Mitigation plans for overruns, delay or
other significant concerns observed• Improvements to existing contract
management designed to control costgrowth and schedule slippage.
October 15, 2013Optimizing Capital Projects - Mexico City39

Key takeaways / Q&A
• Direct impact of capital project performance on share value
• Key differentiators to add value, increase confidence and reduce risk
1. Strategic alignment
2. Organizational capability
3. Governance, controls and technology
PwC
3. Governance, controls and technology
4. Procurement and contracting
5. Scope, schedule, and cost management
6. Risk and issue management
7. Stakeholder management
October 15, 2013Optimizing Capital Projects - Mexico City40

Our contact information
Anthony Caletka, PE,CCM, CFCC
Francisco J. IbáñezCortina
(55) 52 [email protected]
PwC
Luis R. Infante +52 55 [email protected]
Brett Bisaga, PE [email protected]
Optimizing Capital Projects - Mexico City41
October 15, 2013

gracias
Further reading - CP&I Thought leadership
© 2013 PwC. All rights reserved. "PricewaterhouseCoopers" refers to PricewaterhouseCoopers LLP, a Delaware limited liability partnership, or, as the contextrequires, the PricewaterhouseCoopers global network or other member firms of the network, each of which is a separate legal entity. This presentation is protectedunder the copyright laws of the United States and other countries. This presentation contains information that is proprietary to PricewaterhouseCoopers LLP, andshall not be disclosed outside the recipient's company or duplicated, used in whole or in part, by the recipient for any purpose. Any other use or disclosure, in wholeor in part, of this information without the express written permission of PricewaterhouseCoopers LLP is prohibited.
Please see www.pwc.com/structure for further details. This content is for general information purposes only, and should not be used as a substitute for consultationwith professional advisors.
www.pwc.com/mx/es/industrias/proyectos-capital/