Optimization Study of Multidimensional Big Data Matrix ...
12
Research Article Optimization Study of Multidimensional Big Data Matrix Model in Enterprise Performance Evaluation System Honglin Fu Hong Kong Baptist University, Kowloon Tong, Kowloon, Hong Kong Correspondence should be addressed to Honglin Fu; [email protected] Received 15 July 2021; Revised 1 August 2021; Accepted 10 August 2021; Published 27 August 2021 Academic Editor: Shan Zhong Copyright © 2021 Honglin Fu. This is an open access article distributed under the Creative Commons Attribution License, which permits unrestricted use, distribution, and reproduction in any medium, provided the original work is properly cited. This paper uses a multidimensional big data matrix model to optimize the analysis and conduct a systematic construction of the enterprise performance evaluation system. The adoption of new research methods and perspectives to promote the study of the use of performance information is of great significance to achieve the effectiveness, science, and sustainability of corporate performance management. To solve the problem of objectivity and scientificity of performance information use, this part attempts to analyze performance information use from the perspective of the multidimensional big data matrix, focusing on the techniques and methods in the process of promoting performance information use from the multidimensional big data matrix and tries to construct a system model of enterprise performance information use from two dimensions: the use of performance information sources and the use of performance information results. Based on multiple theoretical hypotheses, a theoretical and empirical basis is provided for the division of demand dimensions of enterprise performance evaluation system. Through social capital theory, three dimensions of network social capital, cognitive social capital, and structural social capital are hypothesized, and the logistic regression method is applied for empirical study. The results show that these three dimensions have significant effects on the knowledge demand of enterprise performance evaluation systems. It is verified that the multidimensional big data matrix can enhance the quality of performance information sources and improve the objectivity of performance information. In the performance information source use dimension, the analysis verified that the collection and preprocessing technology of big data can realize the automation, real-time, and diversification of information collection and preprocessing, and enhance the objectivity of performance information. Big data helps to improve the quality and effectiveness of performance information results use. In the dimension of using performance information results, the distributed computing and analysis processing technology of big data can assist the decision support system, and the use of information can be shifted from micromanagement to decision support, to realize the scientific use of performance information and improve the quality of enterprise management decisions. 1. Introduction The importance of research on corporate performance man- agement and related topics has received continued academic attention. Corporate performance management, which draws on the methods of business administration, is a new administrative model developed from the Western New Public Management. Since the rise of research, the theory of corporate performance management has developed rap- idly, especially in the areas of performance index systems, performance assessment subjects, and performance assess- ment tools. Fruitful research results have been achieved [1]. The academic research results of corporate performance management have been on a growing trend in the last decade or so. Corporate performance management has been one of the important issues in public administration research and a hotspot and key area in the discipline of pub- lic management, and public management academics have devoted greater attention and power to research on the topic of corporate performance management [2]. With the popu- larity of the Internet, artificial intelligence, and 5G technol- ogy, big data has entered all occupations. It has not only Hindawi Wireless Communications and Mobile Computing Volume 2021, Article ID 4351944, 12 pages https://doi.org/10.1155/2021/4351944
Transcript of Optimization Study of Multidimensional Big Data Matrix ...
Research ArticleOptimization Study of Multidimensional Big Data MatrixModel in Enterprise Performance Evaluation System
Honglin Fu
Hong Kong Baptist University, Kowloon Tong, Kowloon, Hong Kong
Correspondence should be addressed to Honglin Fu; [email protected]
Received 15 July 2021; Revised 1 August 2021; Accepted 10 August 2021; Published 27 August 2021
Academic Editor: Shan Zhong
Copyright © 2021 Honglin Fu. This is an open access article distributed under the Creative Commons Attribution License, whichpermits unrestricted use, distribution, and reproduction in any medium, provided the original work is properly cited.
This paper uses a multidimensional big data matrix model to optimize the analysis and conduct a systematic construction ofthe enterprise performance evaluation system. The adoption of new research methods and perspectives to promote the studyof the use of performance information is of great significance to achieve the effectiveness, science, and sustainability ofcorporate performance management. To solve the problem of objectivity and scientificity of performance information use,this part attempts to analyze performance information use from the perspective of the multidimensional big data matrix,focusing on the techniques and methods in the process of promoting performance information use from themultidimensional big data matrix and tries to construct a system model of enterprise performance information use fromtwo dimensions: the use of performance information sources and the use of performance information results. Based onmultiple theoretical hypotheses, a theoretical and empirical basis is provided for the division of demand dimensions ofenterprise performance evaluation system. Through social capital theory, three dimensions of network social capital,cognitive social capital, and structural social capital are hypothesized, and the logistic regression method is applied forempirical study. The results show that these three dimensions have significant effects on the knowledge demand ofenterprise performance evaluation systems. It is verified that the multidimensional big data matrix can enhance the qualityof performance information sources and improve the objectivity of performance information. In the performanceinformation source use dimension, the analysis verified that the collection and preprocessing technology of big data canrealize the automation, real-time, and diversification of information collection and preprocessing, and enhance theobjectivity of performance information. Big data helps to improve the quality and effectiveness of performance informationresults use. In the dimension of using performance information results, the distributed computing and analysis processingtechnology of big data can assist the decision support system, and the use of information can be shifted frommicromanagement to decision support, to realize the scientific use of performance information and improve the quality ofenterprise management decisions.
1. Introduction
The importance of research on corporate performance man-agement and related topics has received continued academicattention. Corporate performance management, whichdraws on the methods of business administration, is a newadministrative model developed from the Western NewPublic Management. Since the rise of research, the theoryof corporate performance management has developed rap-idly, especially in the areas of performance index systems,performance assessment subjects, and performance assess-
ment tools. Fruitful research results have been achieved[1]. The academic research results of corporate performancemanagement have been on a growing trend in the lastdecade or so. Corporate performance management has beenone of the important issues in public administrationresearch and a hotspot and key area in the discipline of pub-lic management, and public management academics havedevoted greater attention and power to research on the topicof corporate performance management [2]. With the popu-larity of the Internet, artificial intelligence, and 5G technol-ogy, big data has entered all occupations. It has not only
HindawiWireless Communications and Mobile ComputingVolume 2021, Article ID 4351944, 12 pageshttps://doi.org/10.1155/2021/4351944

brought great convenience to individuals’ lives but also pro-vided new directions for enterprises to think about. Smalland medium-sized enterprises are the main body of thestructure of the market economy, with a large number, smallscale, limited capital, weak risk resistance, and other charac-teristics [3]. If SMEs want to be invincible in the fierce com-petition of the market economy, they must adapt to thechanges of the times, use big data technology to assist thedevelopment of enterprises, and improve their competitive-ness. Corporate performance management has always beenone of the important issues of public administrationresearch, and it is also a hot and key field of public manage-ment disciplines. Public management academic circles havedevoted greater attention and strength to the research oncorporate performance management topics. As an importantpart of enterprise management, human resource manage-ment has a direct impact on whether the strategic planningof enterprises can be realized. As the core function of HRmanagement, performance management determines thelevel of HR management of an enterprise [4]. The develop-ment of big data technology brings greater opportunitiesand challenges to HRM. How to use big data to collect, orga-nize and analyze macro- and microeconomic information tohelp realize company strategy, promote management level,and make the enterprise invincible in the fierce market com-petition has become a new issue.
However, the management of enterprises in the contextof big data is also facing many new issues. One of the moreprominent issues is the performance management ofemployees and teams. First, the staff and job settings andwork processes of the appraisal team in the context of bigdata are very different from the previous ones. Their mainwork tasks are real estate data mining, database manage-ment, and updating, data platform development and con-struction, network maintenance, and promotion and after-sales of data products. The difference in work tasks inevita-bly makes the performance appraisal indexes of employeesvery different. Traditional performance appraisal indexesfocus more on employees’ assessment experience and skills,while the use of data assessment systems should focus moreon personnel’s ability of data analysis and software develop-ment. Second, the association between jobs in the context ofbig data is stronger and requires a higher degree of team-work. Work tasks include real estate data mining, databasemanagement and update, data platform development andconstruction, network maintenance, and data product pro-motion and after-sales. Therefore, the traditional perfor-mance appraisal system focuses more on the assessment ofindividual performance, while the performance appraisal ofthe team should be more important in the context of bigdata [4]. Again, big data requires the assessment system tohave nationwide massive data resources, which inevitablybrings about the expansion and development of enterpriseorganizational structure. The expanding organizationalstructure brings great difficulty to the performance manage-ment of personnel. The headquarters of the enterprise andits subordinate branches as well as the project teams are scat-tered among many cities in the country, so it is difficult touse a unified performance index assessment system for per-
formance management, and the quality of personnel and jobpositions is very different among different teams. Therefore,the performance appraisal in the context of big data shouldconsider both the correlation between the work of each teamand the differences in the economic development of eachregion [5]. Therefore, the performance appraisal system inthe context of big data should be a complex system consid-ering various factors.
To sum up, the traditional performance appraisal systemcan no longer adapt to the current industry in the context ofbig data. In the context of big data, the strategic objectives ofenterprises have changed a lot, shifting from the original tra-ditional assessment method to the direction of data platformassessment. Therefore, the performance management systemof the enterprise should also reflect the strategic objectives ofthe enterprise. In this way, the value of talents can be betterassessed and staff can be motivated to work creatively.Through a scientific and systematic performance manage-ment system, managers can understand the overall team’swork status and work quality, find problems in time, solveproblems, and help managers make correct decisions, whichcan further improve the company’s management level, whilea scientific performance appraisal system can also provide areference basis for staff salary increases and job promotionsand help managers discover the company’s outstanding tal-ents. The scientific and systematic performance manage-ment system can clarify the development direction of thecompany and the competition between teams, which cangreatly improve the work efficiency, and let the employeessee that they will get the corresponding reasonable compen-sation for their hard work, so that they can stimulate theirwork enthusiasm, continuously improve their workability,and contribute to the further development of the company.
2. Current Status of Research
The calculation of weights among various performance indi-cators has been a difficult problem, and there has alwaysbeen a lack of uniform calculation standards; therefore,attempts have been made to solve the calculation of weightsusing the development of corresponding software [6]. Onthe enterprise side, Intel has proposed a 360-degree perfor-mance evaluation appraisal method. Its evaluation dimen-sions are diversified to ensure a more comprehensiveassessment, and it is mainly used to appraise personnelabove the middle level. Key performance indicators (KPI)are also widely used at this stage. This method is to dividethe goals of the enterprise according to different levels andclasses and to find out the key factors or key events, whichaffect the development of the enterprise, to evaluate the per-formance level of employees, and through the scientificapplication of the KPI, the method can effectively improvethe management level of the enterprise. The key perfor-mance indicator appraisal method is characterized by beingrelatively simple and easy to operate, so it is more widelyused in SMEs [7]. In summary, the balanced scorecardmethod, the key performance indicator method, the 360-degree performance appraisal method, and the goal manage-ment method are the commonly used performance appraisal
2 Wireless Communications and Mobile Computing
methods in foreign companies [8]. These four methods havetheir advantages and shortcomings, as well as their scope ofapplication. There are more in-depth researches in the the-ory of performance appraisal management, and some largeenterprises have made outstanding explorations in the prac-tice of performance appraisal management [9]. The mainproblem is that the corporate culture in different regions isdifferent, the assessment methods used, the assessment sys-tem established and the assessment indexes also differ, anda unified performance assessment management system hasnot been established. At present, enterprises often use thekey performance indicator method, 360-degree performanceappraisal method, etc. The full combination of theory andpractice and mutual promotion make this part of theresearch get continuous and in-depth development [10].And in recent years, foreign countries have begun to payattention to performance evaluation research in the organi-zational context. Researchers in performance appraisalemphasize that performance appraisal is seen as a complexprocess that includes social context, employee feelings, andcognition. Some experts and scholars have also begun tofocus on the study of team performance and have achievedsome results. Performance appraisal should consider notonly the relevance of the work of each team but also the dif-ferences in the economic development of each region.Therefore, the performance appraisal system in the contextof big data should be a complex system that considers vari-ous factors.
Liu et al. emphasize that firms form a large amount ofunique, hard-to-replicate tacit knowledge based on practices,skills, and other resources and transform this knowledgeinto firm competitiveness through effective accumulationand learning within the organization [11]. Based on this,Zhou et al. argue that dynamic capabilities are processes bywhich firms use resources, and he points out that dynamiccapabilities can not only support firms to adjust their strate-gies to match the changing environment, but it can even cre-ate new markets and improve business performance [12]. Ina constantly changing environment, it is difficult to bringlasting benefits to a company with unchanging core compe-tencies. Grant et al. explored the mechanism of corporateknowledge. Xiao et al. argue from the perspective of organi-zational knowledge evolution that enterprise capability isultimately the accumulation of empirical knowledge of theenterprise, which is reflected in the business processes ofthe company’s business [13]. The theory of enterpriseknowledge is an integration of the resource base theory, corecompetency theory, and dynamic competency theory. Corecompetence is a heterogeneous resource of enterprises, whileknowledge is the basis of the core competence of enterprises,and the difference of competitive advantages of enterprisesoriginates from the different mechanisms of knowledge cre-ation and application [14]. Enterprises should not only con-sider enhancing the utility of current knowledge but alsoseek new knowledge acquisition, and constantly updatingknowledge is the key to maintain competitive advantage.
Among the theoretical studies, some scholars mainlyexplore the realization path of innovative enterprise perfor-mance management models utilizing big data thinking and
machine learning technologies [15–17]. Perkhofer believesthat the characteristics of the era of big data and public sec-tor performance management have a fit and build a simplemodel of public sector performance management thinking,suggesting scientific use of data mining techniques to builda database system of public sector performance managementinformation [18]. Through the analysis of massive perfor-mance data, deeper performance management issues are dis-covered. It focuses on exploring the influencing factors ofapplying big data technology [19] in the public sector, pro-poses a key approach to big data application, presents a the-oretical framework to explain the motivation, capability, andperformance of big data application in the public sector, andinvestigates the impact path of big data application on publicservice performance. It also proposes that future researchshould construct and test the theoretical framework of thecauses, processes, and performance of big data applicationsin the public sector and make recommendations to promotebig data applications in the public sector.
3. Multidimensional Big Data Matrix Model inEnterprise Performance Evaluation SystemOptimization Analysis
3.1. Optimal Design of Multidimensional Big Data MatrixModel. Multidimensional data fusion is an automated infor-mation processing approach that brings together multiplesources of information to assist decision-makers in makingdecisions by transforming the collected information intorepresentational values that can be processed [20, 21]. Theprocess of data fusion involves many aspects such as datacollection, processing, detection, combination, and evalua-tion. Through data processing, multisource data is fused,so as to accurately identify the state of the event, the safetyof the environment, and the participants’ identity and otherinformation. The process of data fusion involves numerousaspects of data collection, processing, detection, combina-tion, and evaluation of data from multiple sources to accu-rately identify information such as the state of an event,the level of safety of the environment, and the identity ofthe participants. In sorting out the definition of multidimen-sional data fusion, it can be found that multidimensionaldata fusion is the process of organizing data from multiplesources, identifying the corresponding knowledge, andremoving redundant and useless information, to obtain tar-get state information and rank the importance of things thatneed to be processed, thus helping users to make decisions.The theory of multidimensional data fusion was first appliedto the military field to deal with target tracking and identifi-cation, system warning, and situational assessment in mili-tary information.
Multidimensional data fusion has also undergone a longperiod of development and is also characterized as interdis-ciplinary and cross-disciplinary, a comprehensive disciplineinvolving knowledge and techniques from various fields.Therefore, scholars do not have the same definition of mul-tidimensional data fusion, and the accepted definition forinformation fusion is that proposed by the Federation of
3Wireless Communications and Mobile Computing

Directors of the Tri-Service Organization Laboratory. Thefusion of multidimensional data can be performed usingBayesian estimation. When fusing, the data should be as inde-pendent as possible. By dividing independently, Bayesian esti-mation can be used to evaluate the system for decision-making. Scholars have different definitions of multidimen-sional data fusion. For the definition of information fusion,the universally recognized definition is proposed by theUnited States Tri-Service Organization Laboratory Council.
Suppose that the decisions that can be made in the sys-tem are A1, A2, ..., Am, and the observed outcome isdenoted as B. This allows the emergent prior knowledge tobe used so that the probability of deciding p(Ai) and the out-come p(B|Ai) that occurs under a certain decision can beobtained. The probability of an outcome p(B|Ai) under theprobability of a decision can be transformed into a posterioriprobability p(Ai|B) in the Bayesian formulation. This allowsthe Bayesian formula to be represented using the conditionalformula.
p Ai B ∪ Cjð Þ = p B ∪ C Aijð Þ∑m
j=1p B ∩ C Aijð Þ , ð1Þ
where B is an observation and C is observation underanother source. For the decision condition Ai, the probabil-ity of occurrence of observation C, pðB ∪ CjAiÞ, such that theprobability of simultaneous occurrence of B and C needs tobe calculated. However, this calculation is difficult, so theformula can be further modified. First assume that A, B,and C are independent of each other.
p B ∪ C Aijð Þ = p B Aijð Þp C Aijð Þ: ð2Þ
Then, the equation is rewritten as equation (3).
p C Ai ∪ Bjð Þ = p B ∪ C Aijð Þp C Aijð Þ∑m
j=1p B ∩ C Aijð Þp B Aijð Þ : ð3Þ
Rough set theory can effectively deal with some noisydata or provide solutions to problems such as incompletedata and inaccurate classification. In the rough set theory,the processing method for knowledge is more comprehen-sive, and the knowledge granularity can be divided, to ensurethe accuracy of knowledge, which is also a knowledge theorydomain method. Through rough set theory, it can provide atheoretical basis for the treatment of some uncertainty prob-lems [22]. The coarse and fine-grained knowledge is also thecriterion for determining whether knowledge can be accu-rately divided and whether it can accurately describe theconcept of a certain field. Rough set is used as the dividingbasis, and knowledge is defined on this basis, to describethe concept of the domain more accurately. The advantageof the rough set theory is that it does not require a prioriinformation, can effectively classify knowledge with knowninformation, and can approximate a large amount of repeti-tive knowledge, so that it is easier to find law in this knowl-edge. This feature makes rough set theory widely used in thefields of data mining, expert systems, and pattern recogni-
tion, and it can effectively analyze the hidden laws or rulesin knowledge without adding any information of data.
By these ideas makes rough sets can be better used in thefield of data mining. When performing data mining, it ispossible to uncover the fine-grained nature of knowledgeand uncover associations between data. Knowledge can bepartitioned using rough sets, and this partitioning is oftenbased on a theoretical domain. The coarse and fine granular-ity of knowledge is also the criterion that determineswhether knowledge can be accurately classified and whetherit can accurately describe the concepts of a domain. Usingrough sets as the basis for division, knowledge is definedon this basis to describe the concepts of the domain moreaccurately, as shown in Figure 1.
Cross-source multidimensional government data shar-ing is an extension of the traditional concept of governmentdata, and its data-sharing model architecture is also signifi-cantly different from the traditional model architecture,mainly including three extensions: the data of business sys-tems are different, including the data of many departmentssuch as public prosecution, law enforcement, governmentaffairs, and industry and commerce administration. Whenconstructing the system, some of the data come from theself-built systems of the units at this level, while some origi-nate from the national and provincial vertical systems, inaddition to the interface between the self-built system andthe data sharing and exchange platform, the technology ofdata pipeline is also used to realize the interface betweenthe national vertical system and the data-sharing platform.Part of the data comes from the self-built system of the unitat the same level, and part comes from the national and pro-vincial vertical systems. Therefore, when building the sys-tem, in addition to the connection between the self-builtsystem and the data sharing and exchange platform, the datapipeline technology is used to realize the national verticalsystem, interfacing with the data-sharing platform. Thediversity of data structure includes structured, semistruc-tured, and unstructured data, such as structured data ofbusiness processing in the governmental system, semistruc-tured data of system logs, and unstructured data of each gov-ernmental monitoring system.
BEL Að Þ =〠m Bð Þ2: ð4Þ
The virtual knowledge community contains a largeamount of user behavior data and personalized demanddata. These data constitute the multidimensional data ofthe virtual knowledge community. Using these data forfusion can alleviate the data sparsity and cold-start problemsin traditional recommendation systems, and therefore,hybrid recommendation with fused multidimensional datais an important means for a virtual knowledge communityto solve user information overload. When dealing with mul-tidimensional data, it often faces situations such as missingdata or unknown data, so it is necessary to predict the fillingof missing data or unknown data based on known data.Clustering methods can be used to cluster the data and pre-dict the relationship between missing data using existing
4 Wireless Communications and Mobile Computing

relationships, thus considering the correlation between data,and the process of calculation is easier to understand. Miss-ing data can also be filled using a method based on theexpected maximum. You can also use methods based onthe expected maximum to fill in missing data. This is a fea-ture that uses nonnormal distribution and uses a kernelfunction to calculate the data distribution density. This is afeature that uses nonnormal distributions and calculatesthe density of the data distribution using kernel functions.The classifier in Bayes and the expected maximum can pre-dict the data to be filled. There are also studies on missingdata filling methods based on self-associating neural net-works, which can obtain data with higher accuracy.
The cross-source multidimensional government data-sharing influence factors are n, and each factor is evaluatedby m levels, then the set of influence factors to be classified.Where each u is a set of factor evaluation vectors, represent-ing the set of influence degree measures of the kth factor.The study object matrix can be obtained, as shown in equa-tion (5).
Xn×m =
x11 x12 ⋯ x1m
x21 x22 ⋯ x2m
⋯ ⋯ ⋯ ⋯
xn1 xn2 ⋯ xnm
2666664
3777775: ð5Þ
To reduce the problem of “swallowing small numbers bylarge numbers” when comparing data of different orders ofmagnitude, the original data need to be normalized to theinterval [0,1] by data normalization. The jth column of thematrix X is normalized, see (6).
xij′ =xij +max xij
� �
max xij� �
+min xij� � : ð6Þ
The reference series and the evaluation object are stan-dardized by the data and the correlation coefficient of thecorresponding index between the j-rated evaluation indexof the ith factor and the reference series in equation (7).
ξij =max min xij
� �
max xij� �
+min xij� � : ð7Þ
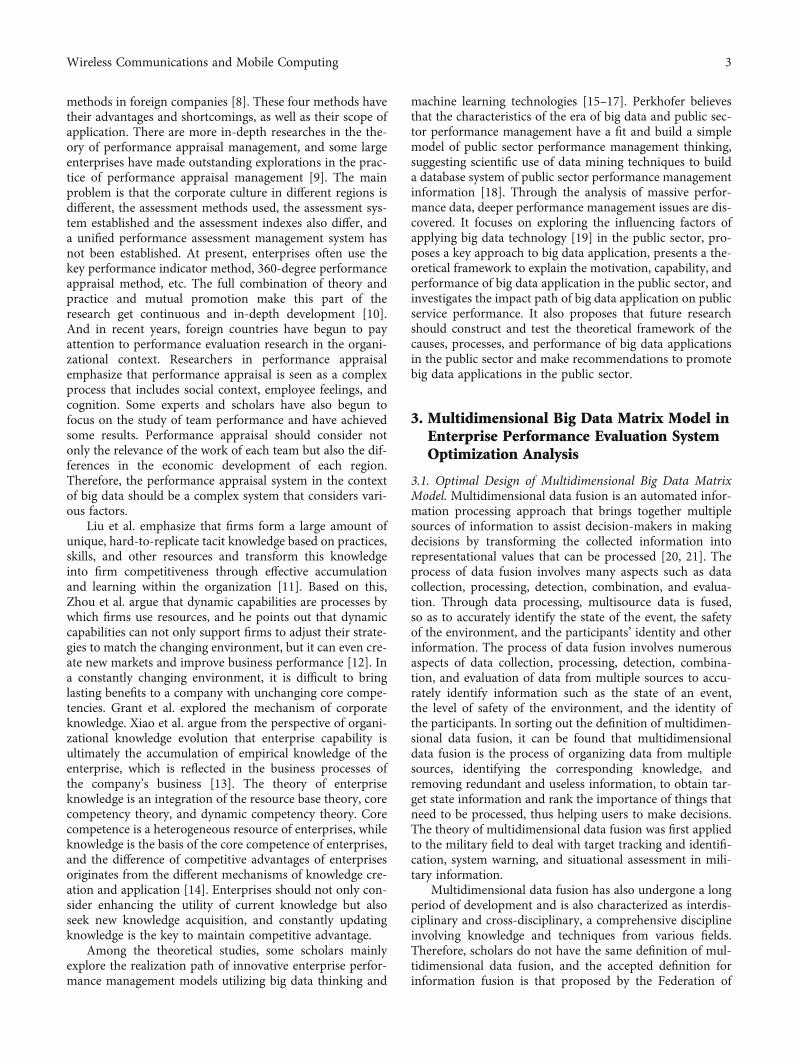
To calculate the correlation degree, the influence degreeof different indicators in the research object needs to be con-sidered comprehensively, so the indicator weights are intro-duced, as shown in Figure 2, which is the weight of theinfluence level of each influence factor, and the correlationcoefficient of all indicators of each factor can be combinedinto one correlation degree, and the correlation degree canbe obtained after considering the weights.
ri = 〠m
j=1pjξi jð Þ: ð8Þ
Performance information is characterized by the proper-ties of information itself but also has some special character-istics of performance management. The characteristics ofperformance information include purpose, accuracy, timeli-ness, formality, consistency, and completeness. The purposeof performance information is that performance informa-tion is not blind and random information but has a specificpurpose. Accuracy of performance information means thatit can accurately fit the purpose of performance manage-ment and meet the needs of performance management.The earlier performance information is obtained, the greaterthe effect; conversely, the later the time, the weaker the func-tion of the information. The formality of performance infor-mation is the value of performance information to realizeevaluation and judgment. Timeliness can also be understoodas timeliness. Performance information reflects the status of
32M 45M 47M 43M 44M
31M 33M 35M 37M 38M
32M 34M 36M 37M 39M
22M 24M 26M 28M 30M
14M 16M 18M 20M 20M
65M
85M
79M
60M
40M
56M
42M
48M
45M
44M
14M
28M
44M
20M
10M
Figure 1: Multidimensional big data matrix model.
5Wireless Communications and Mobile Computing
corporate performance within a certain period. It has maxi-mum value only during a specific validity period. Therefore,its value is closely related to time, and the utility of perfor-mance information is directly proportional to the efficiencyof its supply. The earlier performance information isobtained, the more useful it is; conversely, the later it isobtained, the less useful it will be. The formality of perfor-mance information is that to achieve the value of evaluationand judgment, performance information needs to be in aclear and flexible form to show the real business manage-ment situation in all aspects. Consistency is that perfor-mance information does not diminish its value because ofchanges in time and place. Of course, more importantly, per-formance information must be complete. The performanceof business management requires complete and comprehen-sive information, so the information cannot be left out; oth-erwise, it will bring a negative impact on the use ofperformance information results.
3.2. Experimental Design of Enterprise PerformanceEvaluation System. The goal of performance managementbased on big data technology is to improve the accuracyand credibility of performance management using big datatechnology, make counseling more targeted through timelyfeedback, and ultimately achieve the purpose of mobilizingemployees’ work motivation and creativity, improving indi-vidual performance, and enhancing the overall performancelevel of the enterprise. Unlike the traditional performancemanagement model, the data source channels of HR perfor-mance management based on big data technology arediverse [23]. The source of data information no longer relieson the original data only by manual entry but directlyextracts the performance management information of a cer-tain time point automatically through the system. The form
of data information is richer and more diversified, coveringinformation such as graphics, reports, figures, tables, andsounds in addition to conventional text carriers, whichexpand the dimensionality of data sources and are a fusionof structured data and unstructured data and cannot be con-cluded using statistical analysis only, so it is necessary toorganize, analyze, and store this information through bigdata technology to complete the informatization process.To be used by managers in general big data is stored on anopen cloud platform, which provides a data source for col-lecting data and sharing data and provides support for theopenness of performance management data. The opennessis reflected from two aspects: on the one hand, it is open tothe users of performance data, providing help to those whoneed to use the data for decision analysis within the enter-prise, reducing the cost of acquiring data for the enterprise,and helping to improve the accuracy of their decisions; onthe other hand, it is open to the uploaders, enabling the plat-form to continuously collect more data and cover a widerrange of data, as shown in Figure 3.
The sharing of performance management data can real-ize data transparency and reduce the cost of acquisition thatoccurs due to information asymmetry. Data informationreaches employees and managers directly, and employeescan check their performance results at any time and learnabout the performance results of others, so that employeescan know themselves and their opponents, which can playthe role of self-checking and supervision, and find the gapwith others in time and motivate each other to learn andimprove work motivation. Performance management basedon big data can realize real-time performance feedback andautomation. As shown in Figure 3, the performance man-agement based on big data technology can chase the treadleon aj method in real-time when the fruit exceeds the preset
The purpose of performance information
Accuracy of performance information
Accurately fit the purpose
Utility of performance information
Proportional to the efficiency
The earlier performance information
Comprehensive information
Performance informationInformation
Needs of performance management
Mor
e us
eful
l
Con
vers
ely
Form
ality
Flex
ible
form
Real
bus
ines
s
Perf
orm
ance
in
form
atio
n
Dim
inis
h its
val
ue
Cha
nges
in ti
me
Perf
orm
ance
in
form
atio
n
Corporate performance Certain period
Maximum value During a specific validity period
Performance information reflects
Performance information
Random information
Figure 2: Design framework.
6 Wireless Communications and Mobile Computing

value; the system will automatically issue the results for com-parison and analysis through human-computer interaction[24, 25]. If the assessment results do not reach the pre-corrected instructions, the system will send the results tothe person concerned for guidance and feedback; if theassessment results do not reach the preset indicators, thesystem will send the results to the supervisor at the sametime, so that the supervisor can understand the current situ-ation of employees’ work and conduct targeted counselingon time [26].
For the performance appraisal and feedback process, alldata are made by database for data custody, collecting morecomplete information and more accurate appraisal results.The performance appraisal management system based onbig data can effectively help employees conduct self-exami-nation, correct bias, and improve work efficiency. Perfor-mance management based on big data technology realizesreal-time tracking, data collection, comparison, analysis,and feedback so that the level of human resources perfor-mance management is greatly improved.
At present, many local enterprises still lack a scientificreward and punishment system, and the incentive validityof performance information use is not high. In terms ofincentive direction, there are more positive incentives thannegative incentives in the use of performance informationfor corporate civil servants. In many cases, the results of per-formance evaluation are generally satisfactory. Among theincentive approaches, the positive incentive of job promo-tion is significantly more than the other incentiveapproaches, which has a stimulating effect on civil servants’officialism. Data information forms are more abundant and
diversified. In addition to conventional text carriers, it alsocovers graphics, reports, numbers, tables, sounds, and otherinformation. These data expand the dimensions of datasources and are the fusion of structured data and unstruc-tured data. The unbalanced and unscientific setting of incen-tive methods is often unable to properly guide the attitudesand behaviors of civil servants.
Insufficient degree of disclosure of performance infor-mation results to subjects external to the enterprise. At pres-ent, the content and scope of performance informationdisclosed to the public in practice are still inadequate andinsufficient. The performance information is mainly trans-mitted and shared within the enterprise organization, andthe relatively high degree of public disclosure is mainly foronline evaluation and enterprise satisfaction information,but the degree of disclosure of other information related topeople’s livelihood is relatively low, as shown in Figure 4.
The selected expert should be an authority in the field ofcorporate performance evaluation research or an expertscholar with relevant work experience to ensure the accuracyof the evaluation results. In addition, the selected expertsshould have relevant research or understanding of the newretail innovation ecosystem. The experts should preferablyhave experience in researching innovation ecosystem pro-jects, and experienced new retail workers should preferablybe financial directors or regional directors. The number ofexperts should be neither too many nor too few. If the num-ber of experts is too large, on the one hand, the cost is rela-tively high and the feedback period will be extendedaccordingly; on the other hand, if the opinions of expertsare too diverse in the comprehensive processing, not only
Explain the purpose of the meeting
Reached duringnext evaluation period
Areas that will be evaluated
Be ready that employee may disputeabout rates
Time period that is taken into account
Make sure that employee agrees that this goal can
Whether it meets the standard
Make sure employee understands whyyou set up this goal
Let your employee talk
Review self-appraisal, questionnaire
Be prepared toexplain each rate
Performance data keysection
GradesFocus on points of
disagreement
Compliance withstandard performance
results
Automatic feedbackto the parties
Feedback, coaching
Graded feedback Is to form a record After coaching improvement
Figure 3: Performance feedback process.
7Wireless Communications and Mobile Computing

is it time-consuming and labor-intensive, but it may noteven be possible to reach a unified conclusion. If the numberof experts is too small, the analysis results will not only beinsufficient for scientific accuracy, but the whole study willbe meaningless. Some studies have shown that the numberof experts should be best at 7. When the number of expertsexceeds 7, the accuracy of the evaluation results does notimprove significantly with the number of people, so it is bet-ter to choose 7 experts.
4. Analysis of Results
4.1. Results of the Optimized Multidimensional Big DataMatrix Model. The measurement method of the governmentrecommendation system contains three aspects; one is thecomparison of the calculation results of multiple recommen-dation models. The other is the scoring prediction for resultmeasurement. The recommendation results of a certainenterprise are extracted for manual verification. This studycompares the results of enterprise-based recommendation,matter-based recommendation, SVD-based recommenda-tion, and SVD++-based recommendation, with 90% of theoriginal data as training data and 10% of the randomlyselected data, as test data, as shown in Figure 5.
By comparing several different algorithms to validateG2B recommendations based on cross-source multidimen-sional government data, it is appropriate to use the SVD++algorithm combining enterprise recommendations and mat-ter recommendations as to the core recommendation algo-rithm. The higher recall rate and accuracy rate in thealgorithm comparison indicate that the algorithm is moreeffective and the lower differential mean evaluation is better.90% of the original data is used as training data, and 10% ofthe data is randomly selected. From Figure 5, it can be foundthat the recall rate and the check accuracy rate are muchhigher for both the firm-based recommendation and thematter-based recommendation compared to someone,KNN, SVD, and SVD++. Due to the sparsity of the matrix,the enterprise-based recommendation and matter based rec-ommendation have the situation that some enterprises can-
not calculate the results, while SVD++ achieves all enterpriserecommendations by dimensionality reduction but itsresults are less accurate, so these three methods are com-bined to achieve the complementary and optimized results.Combining enterprise recommendation, matter recommen-dation, and SVD++ recommendation is a kind of hybrid rec-ommendation combining multiple algorithms, which is tomerge and optimize the ranking of multiple calculationresults. The algorithm used in this paper is reasonable andeffective by comparing the three dimensions of recall rate,check accuracy rate, and differential mean evaluation.
To be able to clearly describe the input-output efficiencyof each sector of the enterprise, this study takes each sectorof the enterprise as a decision unit in 2020, constructs theCCR model, BCC model, and super-efficiency model, anduses MATLAB software for calculation. By calculating thecomprehensive efficiency, pure technical efficiency, scale effi-ciency, and super efficiency values, the comparative analysisof the input-output efficiency of each enterprise sector in2020 is carried out, and the calculation results are shownin Figure 6.
The lower the efficiency value, the more serious thewaste of resources. In particular, the overall efficiency ofthe Agriculture Bureau and the Environmental ProtectionBureau is lower than 0.7, which is relatively low. The com-prehensive efficiency in Figure 6 is calculated by the CCRmodel, and the results show that the comprehensive effi-ciency values of Education Bureau, Quality and TechnicalSupervision Bureau, Public Security Bureau, and Healthand Family Planning Bureau are all equal to 1, which meansthat the DEA of these departments is relatively effective,indicating that these four departments do not have puretechnical inefficiency or scale inefficiency, indicating thatthese departments have achieved effectiveness in terms oftechnology and scale. This indicates that these sectors areeffective in terms of technology and scale and that they canachieve efficient and solid returns to scale with proper inputsin the process of operation. In addition to these four depart-ments, the other three departments: Administration forIndustry and Commerce, Bureau of Agriculture, and Envi-ronmental Protection Bureau have integrated efficiencyvalues less than 1. They all have different degrees of inte-grated efficiency inefficiency, indicating that these depart-ments have some degree of resource waste, and some ofthe input resources cannot be effectively transformed intooutputs, and some of the resources invested in the data shar-ing work do not play the proper value. In particular, thecomprehensive efficiency of the Agriculture Bureau and theEnvironmental Protection Bureau is below 0.7, which islow in relative terms. Low overall efficiency may be causedby managerial errors and unreasonable scale, and technicalefficiency can be improved by optimizing resource allocationand improving resource management methods.
According to the calculation of the BCC model, the scaleefficiency values of the Bureau of Quality and TechnicalSupervision, the Bureau of Education, and the Bureau ofHealth and Family Planning are all lower than reasonablelevels, which indicates that there is a waste of resources inthe construction process, so it is recommended that these
3 6 9 12 15 18 21 24 27 300
10
20
30
40
50
60
Val
ues
Number of categories
Figure 4: Dynamic clustering diagram of factors influencing cross-source multidimensional government data sharing.
8 Wireless Communications and Mobile Computing

units do a good job of managing the whole process in thecross-source multidimensional data sharing work. Thisincludes top-level planning at the early stage of the project,consulting and design at the system implementation stage,and more comprehensive and careful management of thebidding process. We should hire professional consulting
companies, supervisory companies, bidding companies,and software evaluation companies to do a good job andconduct forward-looking research jointly with universitiesand professional research institutions to promote the shar-ing of cross-source multidimensional data and actively playthe value of data application.
Slope
0.0
Knn
SVDSVD++
Fusion
Matter
Enterprise
Type
0.2 0.4 0.6 0.8 1.0 1.2 1.4 1.6 1.8 2.0 2.2 2.4 2.6 2.8
Values
0.67431 0.85593 0.86538 0.24581
0.81552 0.87562 0.03539 0.44343
0.62882 0.42969 0.55947 0.89975
0.54992 0.49393 0.20027 0.53639
2E-40.58521 0.0131 0.46881
.17667 0.93363 0.94834 0.62525
Evaluation
Mean difference
Precision
Recall rate
Figure 5: Comparison of the efficiency of various algorithms.
1
80
82
84
86
88
90
92
94
5
1015
20
2
34
5
Type
Values
DMU
5
Figure 6: Efficiency evaluation value of each department.
9Wireless Communications and Mobile Computing

4.2. Experimental Results. A two-dimensional table consist-ing of rows and columns is constructed for the performanceindicators of the same level to be evaluated, and all the per-formance indicators to be evaluated at the same level arelisted in the rows and columns, respectively. The followingis an example of the construction method of the weight fac-tor judgment table for the first level performance indicatorsof the data team performance evaluation system. As shownin Figure 7, the first column lists the four levels 1 perfor-mance indicators of the data team, which are financial level,customer level, internal business process level, and personalgrowth level. The first column also lists these four indicators.
Each cell at the intersection of the rows and columns isfilled with a score that compares the importance of the rowand column indicators to each other. The criteria and rangeof comparative scores were filled in by an expert panel of 18experts based on the quantitative scale of importance. Forexample, if an expert think that the customer-level indica-tors are less important than the financial-level indicators,he/she fills in the cell where the customer-level andfinancial-level indicators are intersected with the value 4.When all the tables are filled, the table of the weighting fac-tors of the first-level indicators of an expert is formed. Thetable of 18 levels 1 index weighting factors is formed. Thearithmetic mean of the values in the 18 cells of the table ofthe weighting factors of the first-level indicators is calcu-lated, and the final table of the weighting factors of thefirst-level indicators of the data team is formed. It is impor-
tant to note that the 18 experts’ scores need to be checked forconsistency, and if they pass, the next step can be performed.Similarly, for the four dimensions of the balanced scorecard,all the following second-level indicators are also used in thesame way to construct the weighting factor judgment tableseparately, and the final weighting factor judgment will beformed.
It is also necessary to combine the weights of the indica-tors of the two tiers, i.e., the indicator weights of the secondtier are multiplied with the corresponding weights of the firsttier, which is called the total arrangement of weights. Thespecific calculation method is to multiply the weights ofthe second tier (C tier) by the respective correspondingweights of the first tier (B tier) to obtain the final team per-formance index weights. The team performance appraisalresults can be analyzed to adjust the pay level of the team.According to the different results of team performanceappraisal, it can be divided into the adjustment of overallteam salary level and the adjustment of salary level of somepositions. The adjustment of the overall salary level of theteam is made according to the comprehensive score of theteam performance appraisal results. And the adjustment ofthe salary level of some positions is based on the completionof each performance appraisal index. The principle of salarylevel adjustment is to first determine the overall performancelevel of the team according to the total score of the team’sperformance appraisal results and, then, adjust the salaryof some positions according to the completion of each
50
45
40
35
30
25
20
15
10Finance Client Internal Business Process Personal Growing
NameFi
nanc
e
Finance
50
45
40
35
30
25
20
Name
Clie
nt
Finance Client Internal Business Process Personal Growing
ClientName
50
45
40
35
30
25
20
15
10
Inte
rnal
Finance Client Internal Business Process Personal Growing
Internal
Name40
35
30
25
20
15
10
Busin
ess
Finance Client Internal Business Process Personal Growing
Business
Figure 7: Judgment of the weighting factor of the first-level index.
10 Wireless Communications and Mobile Computing
performance appraisal index. The principle of salary leveladjustment is to first determine the overall team perfor-mance level based on the total score of the team perfor-mance appraisal results and, then, to adjust the salary ofsome positions according to the completion of each perfor-mance appraisal index.
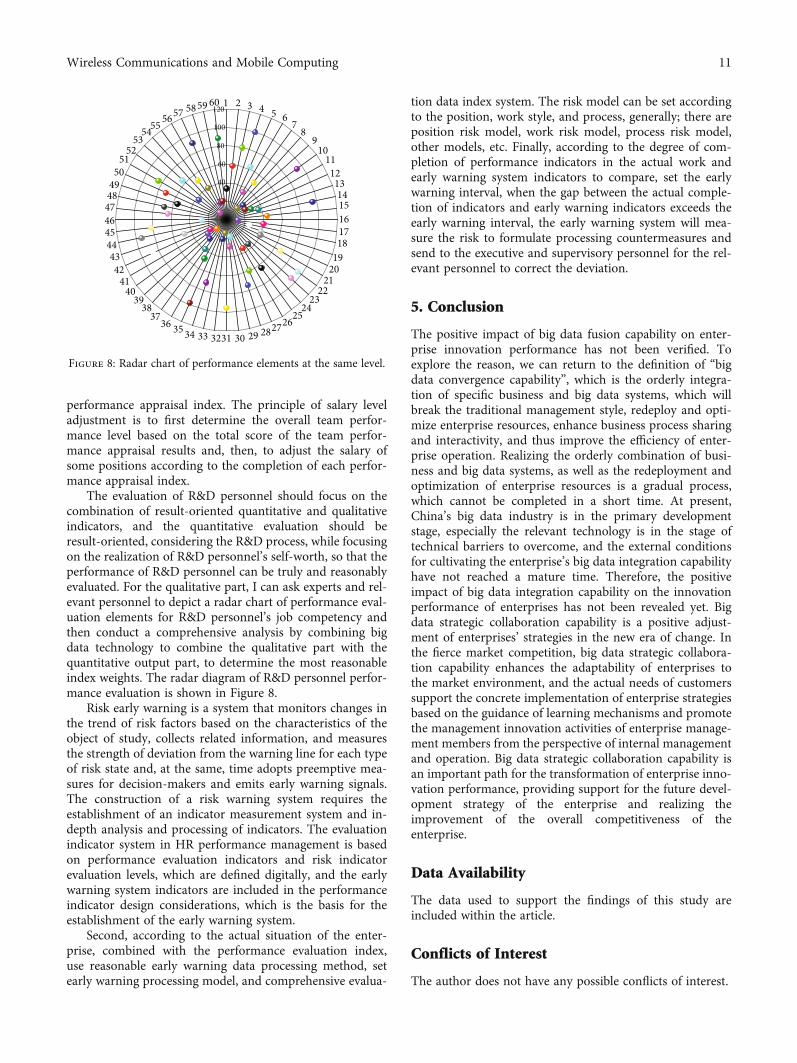
The evaluation of R&D personnel should focus on thecombination of result-oriented quantitative and qualitativeindicators, and the quantitative evaluation should beresult-oriented, considering the R&D process, while focusingon the realization of R&D personnel’s self-worth, so that theperformance of R&D personnel can be truly and reasonablyevaluated. For the qualitative part, I can ask experts and rel-evant personnel to depict a radar chart of performance eval-uation elements for R&D personnel’s job competency andthen conduct a comprehensive analysis by combining bigdata technology to combine the qualitative part with thequantitative output part, to determine the most reasonableindex weights. The radar diagram of R&D personnel perfor-mance evaluation is shown in Figure 8.
Risk early warning is a system that monitors changes inthe trend of risk factors based on the characteristics of theobject of study, collects related information, and measuresthe strength of deviation from the warning line for each typeof risk state and, at the same, time adopts preemptive mea-sures for decision-makers and emits early warning signals.The construction of a risk warning system requires theestablishment of an indicator measurement system and in-depth analysis and processing of indicators. The evaluationindicator system in HR performance management is basedon performance evaluation indicators and risk indicatorevaluation levels, which are defined digitally, and the earlywarning system indicators are included in the performanceindicator design considerations, which is the basis for theestablishment of the early warning system.
Second, according to the actual situation of the enter-prise, combined with the performance evaluation index,use reasonable early warning data processing method, setearly warning processing model, and comprehensive evalua-
tion data index system. The risk model can be set accordingto the position, work style, and process, generally; there areposition risk model, work risk model, process risk model,other models, etc. Finally, according to the degree of com-pletion of performance indicators in the actual work andearly warning system indicators to compare, set the earlywarning interval, when the gap between the actual comple-tion of indicators and early warning indicators exceeds theearly warning interval, the early warning system will mea-sure the risk to formulate processing countermeasures andsend to the executive and supervisory personnel for the rel-evant personnel to correct the deviation.
5. Conclusion
The positive impact of big data fusion capability on enter-prise innovation performance has not been verified. Toexplore the reason, we can return to the definition of “bigdata convergence capability”, which is the orderly integra-tion of specific business and big data systems, which willbreak the traditional management style, redeploy and opti-mize enterprise resources, enhance business process sharingand interactivity, and thus improve the efficiency of enter-prise operation. Realizing the orderly combination of busi-ness and big data systems, as well as the redeployment andoptimization of enterprise resources is a gradual process,which cannot be completed in a short time. At present,China’s big data industry is in the primary developmentstage, especially the relevant technology is in the stage oftechnical barriers to overcome, and the external conditionsfor cultivating the enterprise’s big data integration capabilityhave not reached a mature time. Therefore, the positiveimpact of big data integration capability on the innovationperformance of enterprises has not been revealed yet. Bigdata strategic collaboration capability is a positive adjust-ment of enterprises’ strategies in the new era of change. Inthe fierce market competition, big data strategic collabora-tion capability enhances the adaptability of enterprises tothe market environment, and the actual needs of customerssupport the concrete implementation of enterprise strategiesbased on the guidance of learning mechanisms and promotethe management innovation activities of enterprise manage-ment members from the perspective of internal managementand operation. Big data strategic collaboration capability isan important path for the transformation of enterprise inno-vation performance, providing support for the future devel-opment strategy of the enterprise and realizing theimprovement of the overall competitiveness of theenterprise.
Data Availability
The data used to support the findings of this study areincluded within the article.
Conflicts of Interest
The author does not have any possible conflicts of interest.
555453
5251
5049484746454443
5657 5859 60 1 2 3 4 5 67
89
101112131415161718
1920
2122
2324
252627282930313233343536
3738
3940
4142
60
80
100
120
40
Figure 8: Radar chart of performance elements at the same level.
11Wireless Communications and Mobile Computing

References
[1] Z. H. Munim, M. Dushenko, V. J. Jimenez, M. H. Shakil, andM. Imset, “Big data and artificial intelligence in the maritimeindustry: a bibliometric review and future research directions,”Maritime Policy & Management, vol. 47, no. 5, pp. 577–597,2020.
[2] J. Wen, J. Yang, B. Jiang, H. Song, and H. Wang, “Big datadriven marine environment information forecasting: a timeseries prediction network,” IEEE Transactions on Fuzzy Sys-tems, vol. 29, no. 1, pp. 4–18, 2020.
[3] H. Patel, D. Prajapati, D. Mahida, andM. Shah, “Transformingpetroleum downstream sector through big data: a holisticreview,” Journal of Petroleum Exploration and ProductionTechnology, vol. 10, no. 6, pp. 2601–2611, 2020.
[4] X. Zhu and Y. Yang, “Big data analytics for improving financialperformance and sustainability,” Journal of Systems Scienceand Information, vol. 9, no. 2, pp. 175–191, 2021.
[5] V. Kumar and D. Ramachandran, “Developing firms’ growthapproaches as a multidimensional decision to enhance keystakeholders’ wellbeing,” International Journal of Research inMarketing, vol. 38, no. 2, pp. 402–424, 2021.
[6] S. A. Gawankar, A. Gunasekaran, and S. Kamble, “A study oninvestments in the big data-driven supply chain, performancemeasures and organisational performance in Indian retail 4.0context,” International Journal of Production Research,vol. 58, no. 5, pp. 1574–1593, 2020.
[7] S. Thudumu, P. Branch, J. Jin, and J. Singh, “A comprehensivesurvey of anomaly detection techniques for high dimensionalbig data,” Journal of Big Data, vol. 7, no. 1, 2020.
[8] S. Chehbi-Gamoura, R. Derrouiche, D. Damand, andM. Barth, “Insights from big Data Analytics in supply chainmanagement: an all-inclusive literature review using the SCORmodel,” Production Planning & Control, vol. 31, no. 5,pp. 355–382, 2020.
[9] F. Mohammadi and M. Sahraei-Ardakani, “Multidimensionalscenario selection for power systems with stochastic failures,”IEEE Transactions on Power Systems, vol. 35, no. 6,pp. 4528–4538, 2020.
[10] L. Ismail and H. Materwala, “Computing server power model-ing in a data center,” ACMComputing Surveys (CSUR), vol. 53,no. 3, pp. 1–34, 2020.
[11] Z. Liu, N. Wu, Y. Qiao, and Z. Li, “Performance evaluation ofpublic bus transportation by using DEA models and Shan-non’s entropy: an example from a company in a large city ofChina,” IEEE/CAA Journal of Automatica Sinica, vol. 8,no. 4, pp. 779–795, 2020.
[12] X. Zhou, W. Liang, K. I.-K. Wang, and L. T. Yang, “Deep cor-relation mining based on hierarchical hybrid networks for het-erogeneous big data recommendations,” IEEE Transactions onComputational Social Systems, vol. 8, no. 1, pp. 171–178, 2020.
[13] Q. Xiao, M. Shan, M. Gao, X. Xiao, and H. Guo, “Evaluation ofthe coordination between China’s technology and economyusing a grey multivariate coupling model,” Technological andEconomic Development of Economy, vol. 27, no. 1, pp. 24–44,2021.
[14] W. Höpken, T. Eberle, M. Fuchs, and M. Lexhagen, “Improv-ing tourist arrival prediction: a big data and artificial neuralnetwork approach,” Journal of Travel Research, vol. 60, no. 5,pp. 998–1017, 2021.
[15] J. Zhang, Y. Liu, H. Liu, and J. Wang, “Learning local–globalmultiple correlation filters for robust visual tracking with Kal-man filter redetection,” Sensors, vol. 21, no. 4, p. 1129, 2021.
[16] Y. Jiang, X. Gu, D. Wu, W. Hang, J. Xue, and S. Qiu, “A novelnegative-transfer-resistant fuzzy clustering model with ashared cross-domain transfer latent space and its applicationto brain CT image segmentation,” IEEE/ACM Transactionson Computational Biology and Bioinformatics, vol. 18, no. 1,pp. 40–52, 2021.
[17] M. Gao, W. Cai, and R. Liu, “AGTH-net: attention-basedgraph convolution-guided third-order hourglass network forsports video classification,” Journal of Healthcare Engineering,vol. 2021, 2021.
[18] L. Perkhofer, W. Conny, and P. Hofer, “Does design matterwhen visualizing Big Data? An empirical study to investigatethe effect of visualization type and interaction use,” Journalof Management Control, vol. 31, no. 1-2, pp. 55–95, 2020.
[19] Z. Wang, P. Zhang, W. Sun, and D. Li, “Application of datadimension reduction method in high-dimensional data basedon single-cell 3D genomic contact data,” ASP Transactionson Computers, vol. 1, no. 2, 2021.
[20] C. Zhao, L. Ren, Z. Zhang, and Z. Meng, “Master data manage-ment for manufacturing big data: a method of evaluation fordata network,” World Wide Web, vol. 23, no. 2, pp. 1407–1421, 2020.
[21] W. Cai, Y. Song, and Z. Wei, “Multimodal data guided spatialfeature fusion and grouping strategy for E-commerce com-modity demand forecasting,” Mobile Information Systems,vol. 2021, 2021.
[22] H. Li, X. Bu, X. Liu et al., “Evaluation and prediction of blastfurnace status based on big data platform of ironmaking anddata mining,” ISIJ International, vol. 61, no. 1, pp. 108–118,2021.
[23] A. Li and R. C. Bergan, “Clinical trial design: past, present, andfuture in the context of big data and precision medicine,” Can-cer, vol. 126, no. 22, pp. 4838–4846, 2020.
[24] C. Yan, G. Pang, X. Bai et al., “Beyond triplet loss: person re-identification with fine-grained difference-aware pairwiseloss,” IEEE Transactions on Multimedia., p. 1, 2021.
[25] W. Sun, P. Zhang, Z. Wang, and D. Li, “Prediction of cardio-vascular diseases based on machine learning,” ASP Transac-tions on Internet of Things, vol. 1, no. 1, pp. 30–35, 2021.
[26] Q. G. Shao, J. J. H. Liou, S. S. Weng, and P. Su, “Constructingan entrepreneurship project evaluation system using a hybridmodel,” Journal of Business Economics and Management,vol. 21, no. 5, pp. 1329–1349, 2020.
12 Wireless Communications and Mobile Computing