Optimization of Electricity Consumption for a Galvanising ...
1
Optimization of Water Consumption in Second
Generation Bioethanol Plants
Mariano Martína, Elvis Ahmetović,b, Ignacio E. Grossmanna1
aDepartment of Chemical Engineering, Carnegie Mellon University, Pittsburgh PA 15213 bDepartment of Process Engineering, Faculty of Technology, University of Tuzla, 75000 Tuzla, Bosnia and Herzegovina
Abstract
In this work we address the water consumption optimization of second generation bioethanol
production plants from lignocellulosic switchgrass when using thermo-chemical, thermo-biochemical or
biochemical routes considering corn-based ethanol as a eference. In order to optimize the water consumption
a three stage method is used. First, energy consumption is optimized in the production processes, which
reduces the cooling needs of the processes and thus, the water looses by evaporation and drift in the cooling
tower. Next, a number of technologies are considered to partially substitute the use of water as cooling agent .
Finally, the optimal water networks for each of the ethanol production processes are designed by determining
water consumption, reuse and recycle and the required treatment using a superstructure optimization
approach. The resulting water consumption ratios range from 1.5 to 3 gal/gal, which are in the range or even
below the amount of water needed for gasoline production and with low or no water discharge depending on
the process. Further reduction can be obtained by stressing the use of air cooling and if the water released
from the crop can be properly recovered and treated. Under these conditions the water consumption ratios
range from 0.6 to 1.7 gal/gal and with no or low water discharge.
Keywords: Energy, Biofuels, Alternative fuels, Water, Ethanol
1 Corresponding author. Tel.: +1-412-268-3642; Fax: +1-412-268-7139. Email address: [email protected] (I.E. Grossmann)
2
1. Introduction
Current industrial production and population demands are placing extra pressure on natural
resources. Concerns related to overconsumption and depletion of these resources have focused on energy
sources like crude oil, carbon and natural gas1 . Water has been overlooked from that list mainly due its wide
availability in many regions of the world. As a result, water is inexpensive compared to any other raw material,
in spite of an average annual increase of 6.7% over the last years according to the 2008 GWI/OECD2.
However, the industrial growth and the development suggests that by 2025 the industrial water usage
(including utility cooling and heating, processing, transportation, air conditioning, cleaning, etc.) will account for
about 11% of the total world water consumption 3,4 which can cause water stress in several regions of the
world. The increasing concern towards water resources5,6 and the green policies supported by many
governments are making the management of water consumption and wastewater treatment an important topic
with new economic incentives for implementing technologies that are more environmentally friendly, and that
can ensure efficient use of water resources including the treatment and recycling of wastewater. 7
In the recent past systematic methods for minimizing water consumption have focused on the optimal
synthesis of process water networks. In order for these networks to be more effective in reducing water
consumption, energy optimization has a large impact in decreasing the cooling needs and reducing the water
loss by evaporation and drift in the cooling tower as shown recently for Ahmetović et al. 8 Energy optimization
for biofuel plants involves superstructure optimization, the implementation of multieffect columns together with
the design of optimal heat exchanger networks 9,10 When a sequential approach is used, the design of the
water network is presented after the energy optimization. The design of water networks can be performed
using two different approaches: (a) conceptual engineering approach11-16 or (b) systematic methods based on
mathematical programming.17-23 Simultaneous minimization of energy and water was first addressed by
Savelski and Bagajewicz 24 although this was only in the context of water networks without considering the
process itself. Since then, conceptual techniques25-31 and mathematical approaches have been applied on a
variety of problems. 32-39
3
To further reduce the consumption of cooling water different technologies that substitute water as
cooling agent may also be implemented such as air cooling 40. Thus, the implementation of these technologies
together with the energy optimization and the design of optimized water networks are the key for the economic
and technical feasibility of new production processes like the ones involving bioethanol production from
switchgrass.
2. Problem statement
In this paper we analyze the impact that water saving technologies and methods have on a number of
new processes for the production of ethanol from lignocellulosic material, the so called second generation
bioethanol, by applying to conceptual designs of these processes the water network optimization method by
Ahmetovic and Grossmann68 we compare these results with the water consumed in corn-based ethanol plants
as well as in the production of gasoline to provide further insight into the important topic of the water
consumption in biofuel production processes.
The low price of freshwater makes it difficult to take into account the effect of water consumption in
the economic optimization of biofuel plants. Thus, the optimization of water consumption is performed
sequentially. The first stage consists of reducing the energy consumption of the process through heat
integration. In this paper we used data from previous papers 41-43. Philips et al.40 proposed the use of air
cooling in order to replace water as cooling agent in the condensers of the distillation columns and in the
intercooling stages of gas compression. Thus, in a second stage we assume that the cooling of the
condensers and the inter cooling stages of gas compression are not treated with a cooling tower. Finally an
optimal design of the water network is developed for each of the processes under consideration using
mathematical programming techniques.
The paper is organized as follows. In section 3 we discuss the water consumption in bioethanol
plants. We present a brief explanation of the optimal conceptual design of the different production processes
from corn and switchgrass41-43 to identify the water requirements and wastewater production. In section 4 we
4
present the impact that the implementation of cooling water saving technologies like air cooling and energy
optimization have on the cooling needs of the different flowsheets under consideration. In section 5 we design
optimal water networks for each of the processes. Finally, in section 6 we discuss the effect of the
simultaneous production of hydrogen not only on the economy of the process (see Martin & Grossmann)42 but
also on the water consumption together with the possibility of further reducing in the consumption of water by
stressing the use of air cooling and recovering the water that is extracted from the crop in the pretreatment
stages.
3. Ethanol production processes
The compatibility of ethanol with the current gasoline based transport system has supported its
production to become the most important alternative fuel so far. However, the expected increase in the volume
of ethanol production from corn and lignocellulosic raw materials in order to meet the governmental policies in
the US 44 (see Fig 1) or in the EU45, has raised concerns regarding their technical feasibility in terms of land
usage, energy and water consumption.46-47 In this paper we focus on the problem of water consumption in the
production of first and second generation of ethanol where water is needed at two stages of the process,
irrigation, which depends on the raw material3 and the production process itself.
The expected increase in the production of biofuels as a result of the current policies supporting
biofuel industry3,44,45 has raised questions regarding its impact on the water consumed for irrigation. Thus,
departments of agriculture of different countries have analyzed the effect of those policies on the share of
water needed to grow the crops devoted to biofuel production. It is reported that the impact of biofuel
production policies can be important in certain regions but on the whole, it will affect less than 5%. In contrast,
if the amount of biofuel to be produced is far larger, the production regions as well as the raw material must be
carefully selected so as not to have a big impact on food production and water availability. The use of different
raw materials, rather than corn, that do not compete with the food supply chain and that require less irrigation
5
as well as the proper location of the plantations will also reduce the water consumption for the production of
biomass. 48
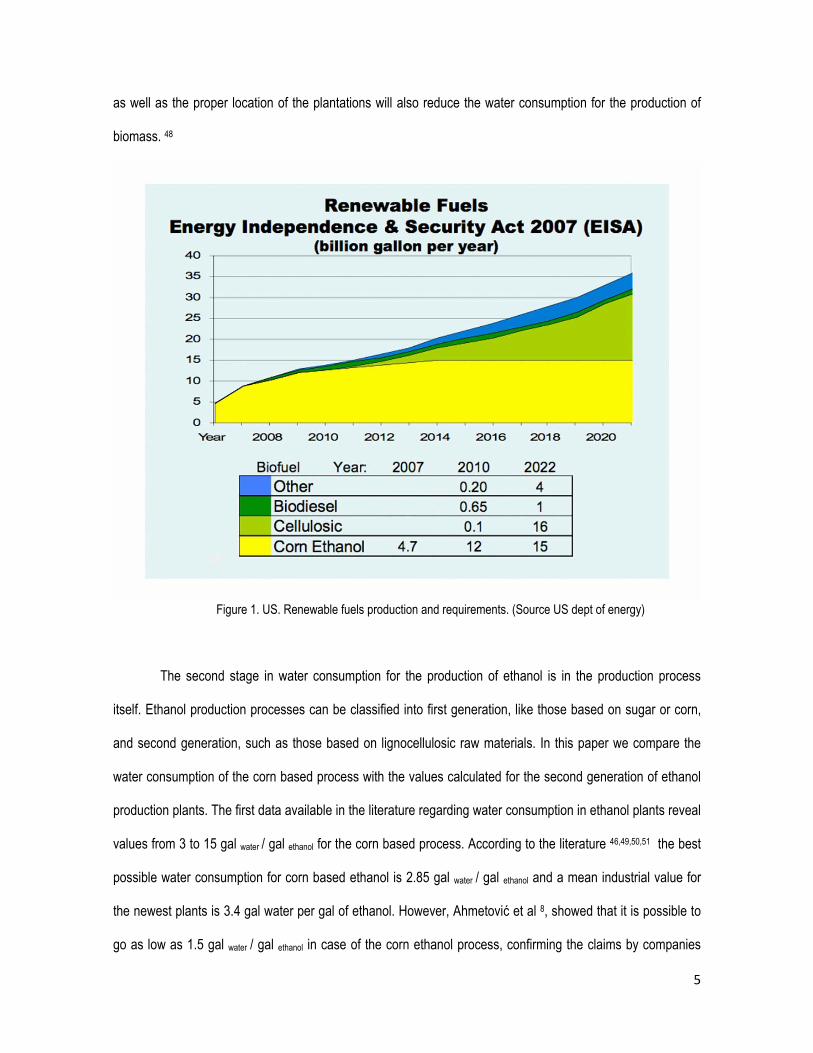
Figure 1. US. Renewable fuels production and requirements. (Source US dept of energy)
The second stage in water consumption for the production of ethanol is in the production process
itself. Ethanol production processes can be classified into first generation, like those based on sugar or corn,
and second generation, such as those based on lignocellulosic raw materials. In this paper we compare the
water consumption of the corn based process with the values calculated for the second generation of ethanol
production plants. The first data available in the literature regarding water consumption in ethanol plants reveal
values from 3 to 15 gal water / gal ethanol for the corn based process. According to the literature 46,49,50,51 the best
possible water consumption for corn based ethanol is 2.85 gal water / gal ethanol and a mean industrial value for
the newest plants is 3.4 gal water per gal of ethanol. However, Ahmetović et al 8, showed that it is possible to
go as low as 1.5 gal water / gal ethanol in case of the corn ethanol process, confirming the claims by companies
6
like Delta T. For the second generation of ethanol production processes from lignocellulosic raw materials,
different values have been reported depending on the raw material such as 6 to 9.8 galwater / gal ethanol for
switchgrass51, or 1.94 - 2 galwater / gal ethanol for hybrid poplar 40, 51,52 .
For a further evaluation and comparison with these values, in this paper we optimize water
consumption in second generation bioethanol plants. In order to identify the needs of water in the different
processes and the sources of wastewater, we briefly discuss first the flowsheet of four different production
routes: corn-based ethanol, thermo-chemical, thermo-biochemical and biochemical. Further details of the
processes can be found in previous papers by the authors. 41, 42,43
3.1. First generation: Corn-based ethanol.
Karuppiah et al. 41 proposed an optimal conceptual design for the production of ethanol from corn
using the dry grind process by optimizing a superstructure for producing 60M gal ethanol/yr. As presented in a
previous paper by the authors8, the plant consists of three different sections. The first section involves the
pretreatment of the corn grain to break its physical and chemical structure making the sugars accessible for
fermentation. The process units employed are grinding, direct contact with steam, saccharification and
liquefaction. The second section is the fermentation of the sugars, mainly glucose, into ethanol using a yeast,
Saccharomyces cerevisiae. Water and starch are fed to the reactor. The amount of water required is such that
the concentration of ethanol at the end of the fermentation is below the toxic levels for the yeast. CO2 is also
generated in the fermentation. After fermentation, two alternatives were proposed for the separation of solids
from the slurry exiting the fermentor: a) mechanical separation before the beer column (BC1), or b) after the
beer column. The third section comprises the technologies used for the purification and dehydration of ethanol
to fuel grade, and involves the following choices: (1) A rectification column which can concentrate ethanol to
the azeotropic composition, (2) adsorption of water in corn grits, and (3) molecular sieves. The superstructure
is optimized in terms of energy consumption. The separation of the solids takes place before the beer column,
7
while the dehydration stage consists of the rectification column together with adsorption in corn grits with final
stage in the molecular sieves. For further details we refer to previous papers by the authors. 8,41
3.2. Second generation: Lignocellulosic ethanol
There are mainly two different technological routes to transform lignocellulosic raw materials into
ethanol. The first one is based on the hydrolysis of the raw material to expose the sugars that are fermented to
ethanol. Due to its similarity with the corn-based production of ethanol and the expected lower capital cost, this
technology has received a great deal of attention by many researchers.53-57 The second possible technology is
the gasification of the raw material into syngas and the synthesis of ethanol either as via mixed alcohols
synthesis, a modification of the Fischer-Tropsch process, or by means of the fermentation of the syngas.
40,45,58,59 Here we briefly discuss optimal conceptual designs of the processes based on the results by Martín
and Grossmann42-43 to identify the water consumption and wastewater generation.
3.2.1. Thermo-chemical process
The process described below is the optimal conceptual design of a thermo-chemical process for the
production of ethanol from switchgrass as proposed by Martín & Grossmann42. The process consists of three
different parts. The first one is the production of syngas from biomass. The raw material is washed, its size is
reduced by grinding and it is partially dried using a mechanical press in the pretreatment. Next, high pressure
direct gasification with steam and oxygen is the best option. The gas generated at the gasifier is cleaned from
solids as well as other compounds like hydrocarbons, NH3, CO2 or H2S. The hydrocarbons are partially
removed using steam reforming. Next, the solids are removed in a ceramic filter and the gas is expanded
generating energy. The last traces of hydrocarbons are removed in a Pressure Swing Adsorption (PSA)
system with a bed of Silica gel. PSA systems work at low temperature and thus water condenses before these
process units. At this point the composition is adjusted to a molar ratio CO : H2 of 1 separating the excess of
hydrogen using a hybrid PSA-membrane system. The hydrogen generated as byproduct is a major source of
income for the process. After the composition adjustment, sour gases such as CO2 and H2S are removed
8
using a PSA system with a bed of zeolites followed by MEA to remove the H2S, which is poisonous for the
catalysis. Water condenses before these operations due to the low temperatures and high pressures and is
withdrawn from the system. Finally, the synthesis of ethanol is carried out using high alcohols synthesis
production. A catalyst based on the one used for the production of methanol is used.40 The light hydrocarbons
and the unreacted gases are recycled back to the cleanup section of the process, while the purification of
ethanol is carried out using a direct sequence of distillation columns where the methanol is recycled back to
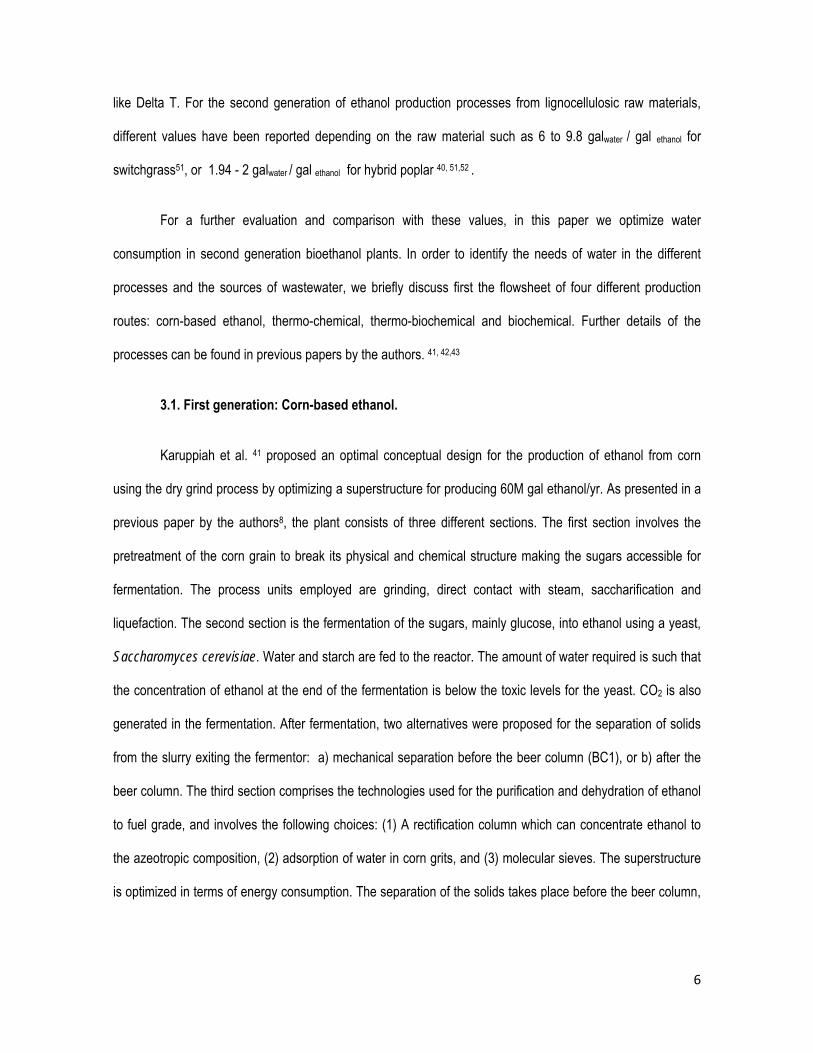
the reactor. Figure 2 shows the flowsheet of the process. 42
In this process wastewater is generated mainly in the condensation before the PSA and the MEA
systems, where different organics may accompany the water, while the water used for raw material washing
contains suspended solids that must be removed for the water to be reused.
We have also considered another alternative, closer to the one presented in Philips et al 40. The
optimized flowsheet is presented in Martin & Grossmann 42 under the label of subproblem C. This production
process uses low pressure indirect gasification, steam reforming of the gas followed by wet removal of solids,
and catalytic synthesis of ethanol which is purified using direct distillation sequence. Thus, wastewater is
generated not only in the condensation previous to the PSA systems, but also from the scrubber. It is assumed
that from the stream leaving the scrubber, basically char (particles) and NH3 are the most important
contaminants. Organics are the contaminants accompanying the condensed water.
Figure 2. Thermo-chemical ethanol production from biomass
9
3.2.2. Thermo-biochemical.
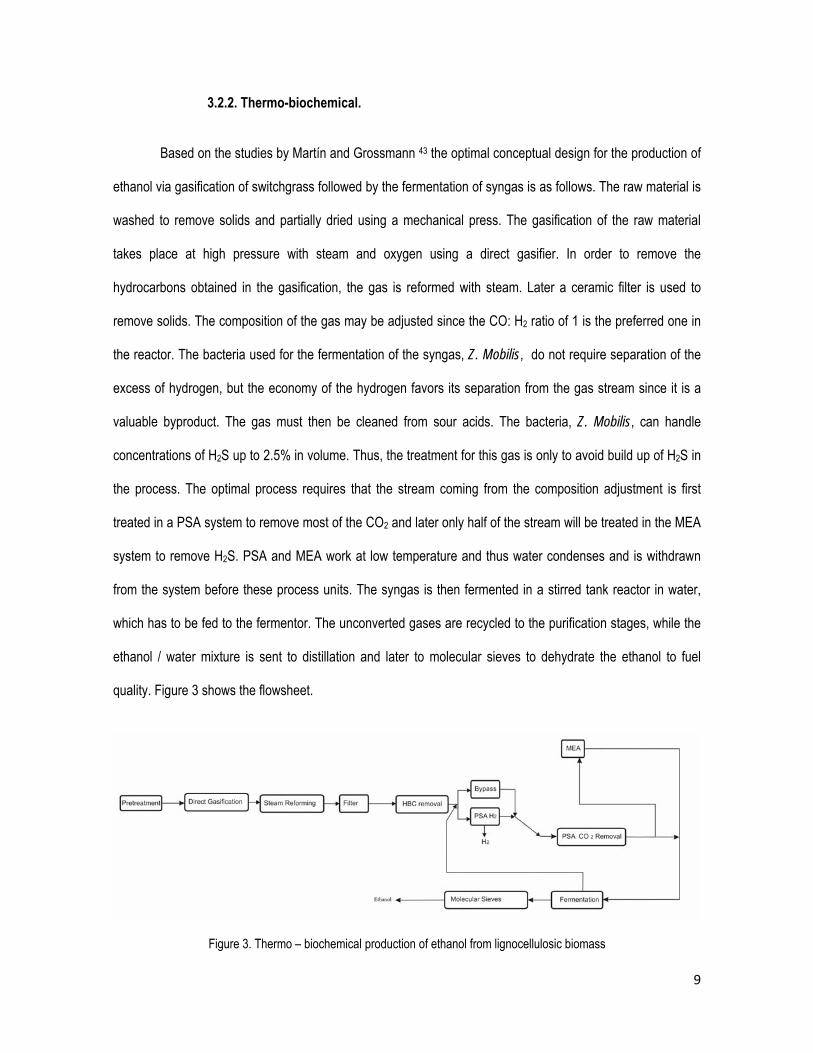
Based on the studies by Martín and Grossmann 43 the optimal conceptual design for the production of
ethanol via gasification of switchgrass followed by the fermentation of syngas is as follows. The raw material is
washed to remove solids and partially dried using a mechanical press. The gasification of the raw material
takes place at high pressure with steam and oxygen using a direct gasifier. In order to remove the
hydrocarbons obtained in the gasification, the gas is reformed with steam. Later a ceramic filter is used to
remove solids. The composition of the gas may be adjusted since the CO: H2 ratio of 1 is the preferred one in
the reactor. The bacteria used for the fermentation of the syngas, Z. Mobilis, do not require separation of the
excess of hydrogen, but the economy of the hydrogen favors its separation from the gas stream since it is a
valuable byproduct. The gas must then be cleaned from sour acids. The bacteria, Z. Mobilis, can handle
concentrations of H2S up to 2.5% in volume. Thus, the treatment for this gas is only to avoid build up of H2S in
the process. The optimal process requires that the stream coming from the composition adjustment is first
treated in a PSA system to remove most of the CO2 and later only half of the stream will be treated in the MEA
system to remove H2S. PSA and MEA work at low temperature and thus water condenses and is withdrawn
from the system before these process units. The syngas is then fermented in a stirred tank reactor in water,
which has to be fed to the fermentor. The unconverted gases are recycled to the purification stages, while the
ethanol / water mixture is sent to distillation and later to molecular sieves to dehydrate the ethanol to fuel
quality. Figure 3 shows the flowsheet.
Figure 3. Thermo – biochemical production of ethanol from lignocellulosic biomass
10
In this process, wastewater is generated before any PSA system as well as from the distillation
column where organics are the main contaminants. Moreover, the water used for the raw material washing
contains suspended solids the must be removed for the water to be reused.
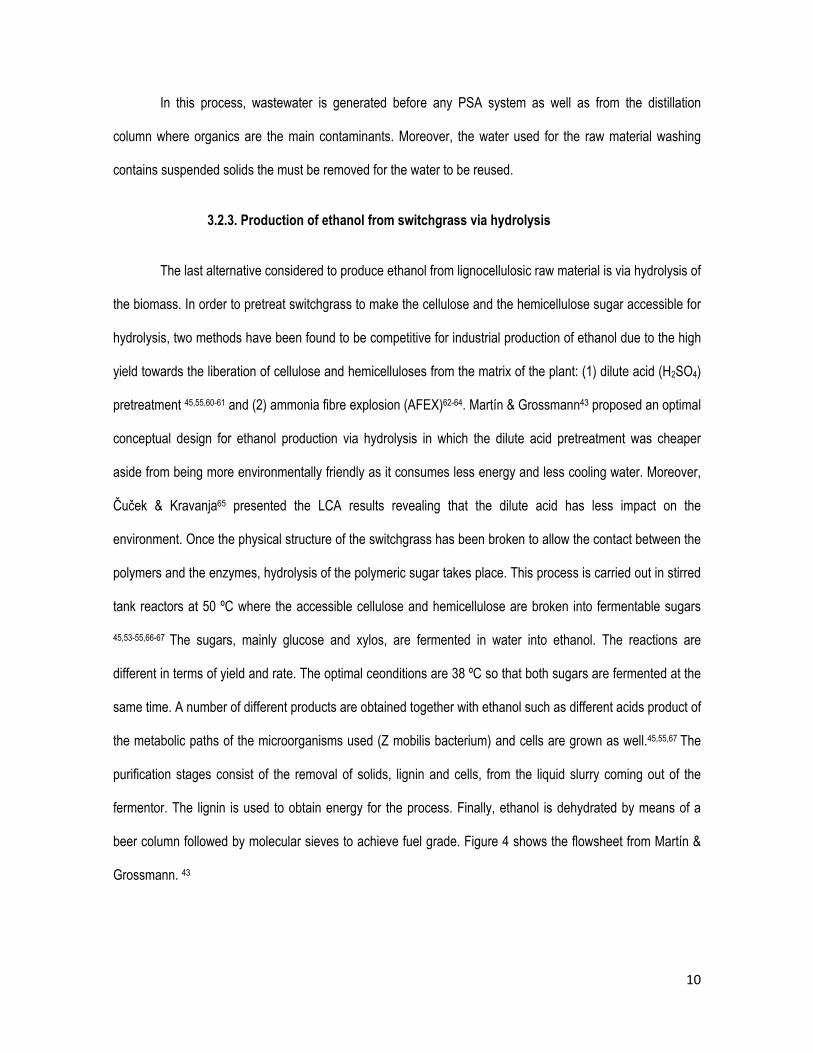
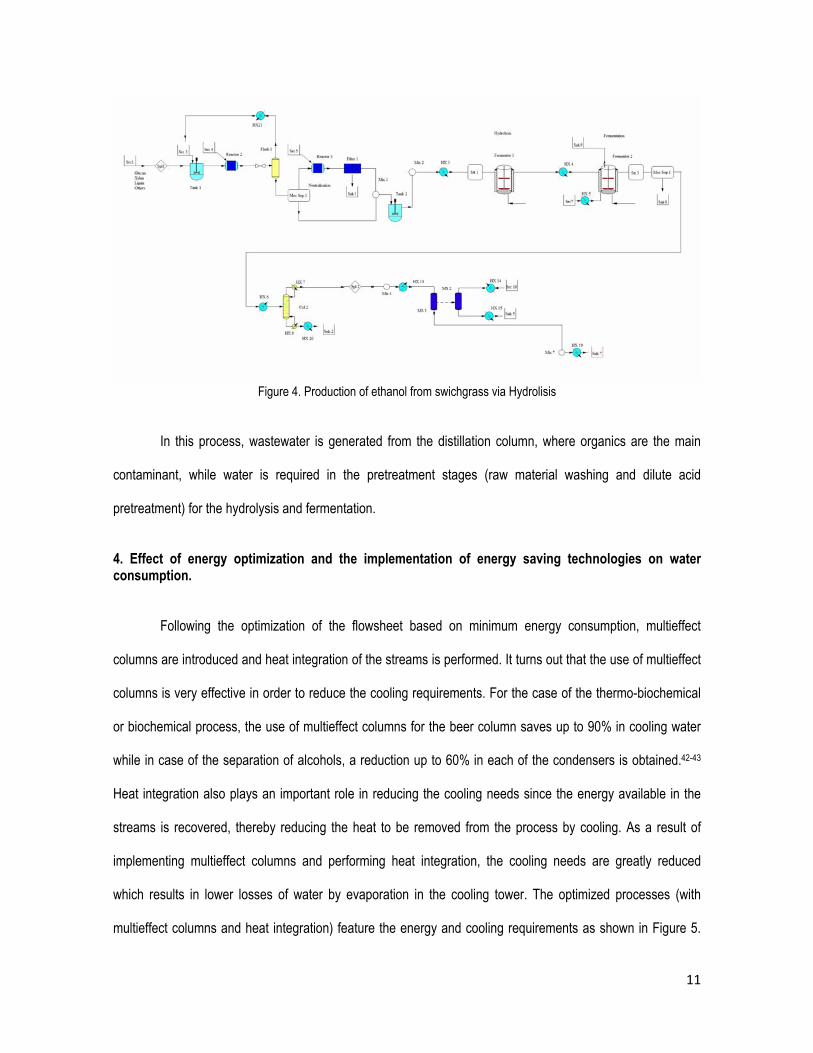
3.2.3. Production of ethanol from switchgrass via hydrolysis
The last alternative considered to produce ethanol from lignocellulosic raw material is via hydrolysis of
the biomass. In order to pretreat switchgrass to make the cellulose and the hemicellulose sugar accessible for
hydrolysis, two methods have been found to be competitive for industrial production of ethanol due to the high
yield towards the liberation of cellulose and hemicelluloses from the matrix of the plant: (1) dilute acid (H2SO4)
pretreatment 45,55,60-61 and (2) ammonia fibre explosion (AFEX)62-64. Martín & Grossmann43 proposed an optimal
conceptual design for ethanol production via hydrolysis in which the dilute acid pretreatment was cheaper
aside from being more environmentally friendly as it consumes less energy and less cooling water. Moreover,
Čuček & Kravanja65 presented the LCA results revealing that the dilute acid has less impact on the
environment. Once the physical structure of the switchgrass has been broken to allow the contact between the
polymers and the enzymes, hydrolysis of the polymeric sugar takes place. This process is carried out in stirred
tank reactors at 50 ºC where the accessible cellulose and hemicellulose are broken into fermentable sugars
45,53-55,66-67 The sugars, mainly glucose and xylos, are fermented in water into ethanol. The reactions are
different in terms of yield and rate. The optimal ceonditions are 38 ºC so that both sugars are fermented at the
same time. A number of different products are obtained together with ethanol such as different acids product of
the metabolic paths of the microorganisms used (Z mobilis bacterium) and cells are grown as well.45,55,67 The
purification stages consist of the removal of solids, lignin and cells, from the liquid slurry coming out of the
fermentor. The lignin is used to obtain energy for the process. Finally, ethanol is dehydrated by means of a
beer column followed by molecular sieves to achieve fuel grade. Figure 4 shows the flowsheet from Martín &
Grossmann. 43
11
Figure 4. Production of ethanol from swichgrass via Hydrolisis
In this process, wastewater is generated from the distillation column, where organics are the main
contaminant, while water is required in the pretreatment stages (raw material washing and dilute acid
pretreatment) for the hydrolysis and fermentation.
4. Effect of energy optimization and the implementation of energy saving technologies on water consumption.
Following the optimization of the flowsheet based on minimum energy consumption, multieffect
columns are introduced and heat integration of the streams is performed. It turns out that the use of multieffect
columns is very effective in order to reduce the cooling requirements. For the case of the thermo-biochemical
or biochemical process, the use of multieffect columns for the beer column saves up to 90% in cooling water
while in case of the separation of alcohols, a reduction up to 60% in each of the condensers is obtained.42-43
Heat integration also plays an important role in reducing the cooling needs since the energy available in the
streams is recovered, thereby reducing the heat to be removed from the process by cooling. As a result of
implementing multieffect columns and performing heat integration, the cooling needs are greatly reduced
which results in lower losses of water by evaporation in the cooling tower. The optimized processes (with
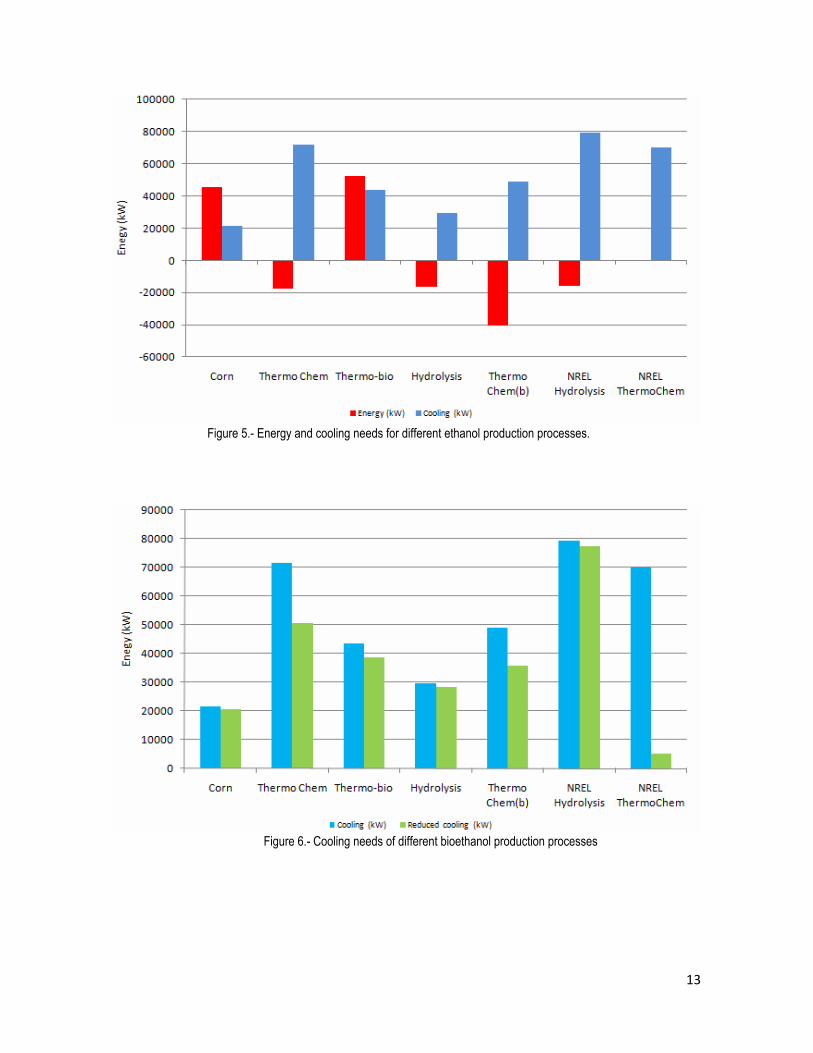
multieffect columns and heat integration) feature the energy and cooling requirements as shown in Figure 5.
12
We have also included data from two reports by the NREL40,52,67. In general, it can be seen that the cooling
requirements for all the processes are larger than in the case of the corn-based ethanol. The more aggressive
pretreatments needed to break the structure of the crop imply higher temperatures and pressures in the
process resulting in larger cooling needs. Furthermore, the lower concentration of ethanol in the fermentor of
the thermo-biochemical process also increases the demand of water for the processes. Furthermore, the
optimized processes presented by Martin & Grossmann42,43 show a large reduction in cooling needs compared
to the ones presented in the NREL reports 40,52,67 as a result of the energy optimization in particular for the
biochemical process based on hydrolysis of the raw material.
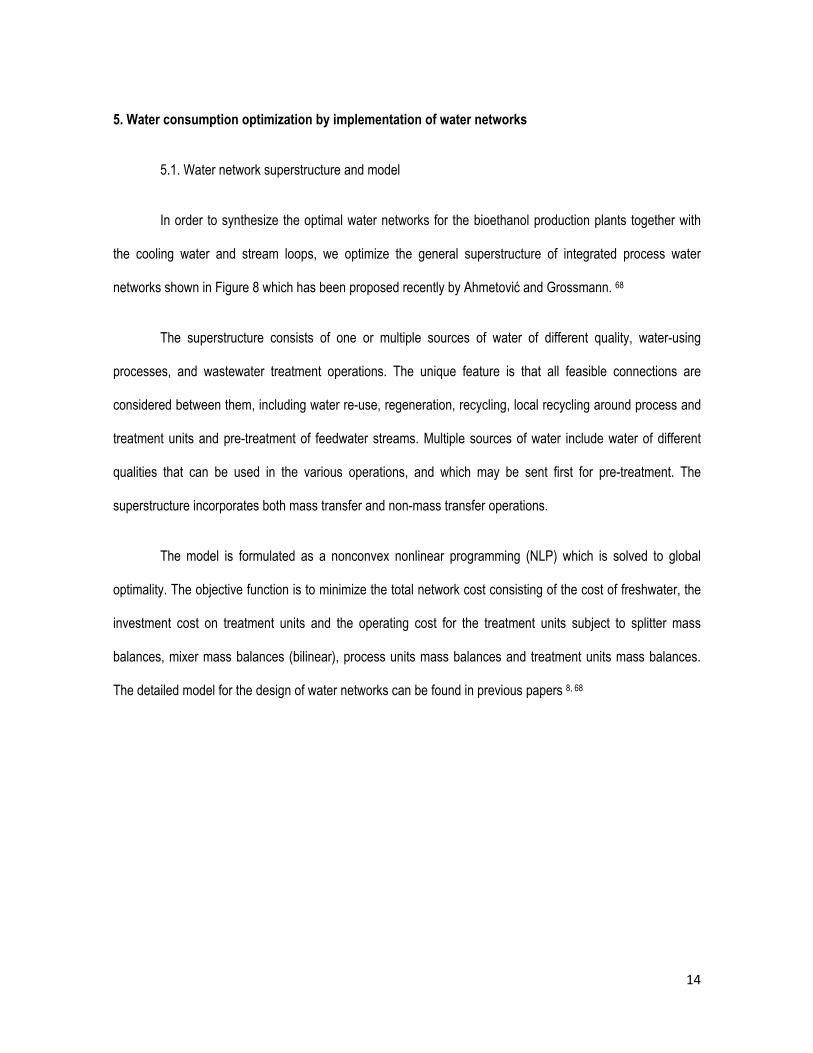
In order to further reduce the use of cooling water, air can be used as cooling agent in the condensers
of the distillation columns as well as the inter coolers between compression stages, as proposed by Philips et
al. 40 As a result of the implementation of this technology, the cooling requirements using water as cooling
agent are reduced and so is the amount of water that is lost by evaporation and drift at the cooling tower. In
Figure 6 we show the decrease in the water cooling requirements when air cooling is used. The results from
the NREL 40,52,67 show larger impact of the air cooling larger because they do not use multieffect columns. It is
important to highlight that substituting water by air as cooling agent has only a large impact in the energy to be
removed by cooling water in production processes based on gasification. This is due to the fact that the high
pressures used across the process flowsheet result in high cooling needs in the compression stages where air
cooling can be implemented. However, for the rest of the processes, the use of multieffect columns is very
effective in reducing the consumption of cooling water 41-43 . Air cooling is extensively used in the case of the
process presented by NREL 40 to reduce cooling water consumption.
Once the cooling needs are established, we proceed to design the water network for the different
processes under consideration.
13
Figure 5.- Energy and cooling needs for different ethanol production processes.
Figure 6.- Cooling needs of different bioethanol production processes
14
5. Water consumption optimization by implementation of water networks
5.1. Water network superstructure and model
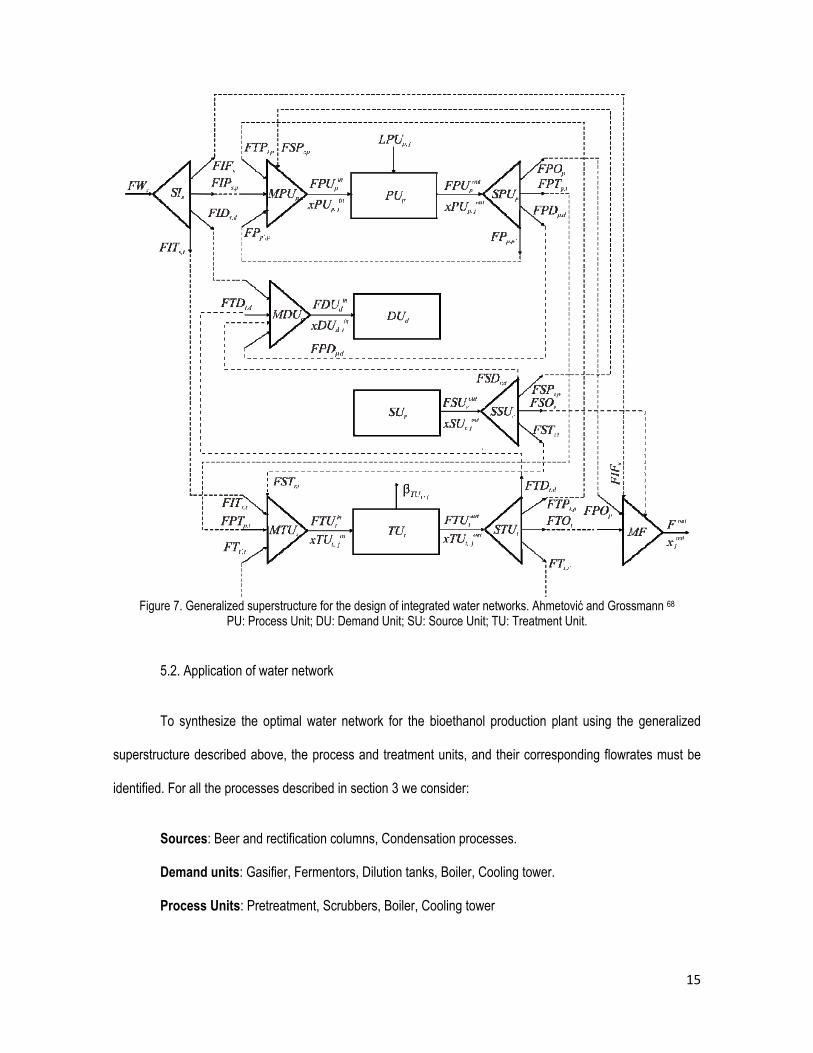
In order to synthesize the optimal water networks for the bioethanol production plants together with
the cooling water and stream loops, we optimize the general superstructure of integrated process water
networks shown in Figure 8 which has been proposed recently by Ahmetović and Grossmann. 68
The superstructure consists of one or multiple sources of water of different quality, water-using
processes, and wastewater treatment operations. The unique feature is that all feasible connections are
considered between them, including water re-use, regeneration, recycling, local recycling around process and
treatment units and pre-treatment of feedwater streams. Multiple sources of water include water of different
qualities that can be used in the various operations, and which may be sent first for pre-treatment. The
superstructure incorporates both mass transfer and non-mass transfer operations.
The model is formulated as a nonconvex nonlinear programming (NLP) which is solved to global
optimality. The objective function is to minimize the total network cost consisting of the cost of freshwater, the
investment cost on treatment units and the operating cost for the treatment units subject to splitter mass
balances, mixer mass balances (bilinear), process units mass balances and treatment units mass balances.
The detailed model for the design of water networks can be found in previous papers 8, 68
15
Figure 7. Generalized superstructure for the design of integrated water networks. Ahmetović and Grossmann 68
PU: Process Unit; DU: Demand Unit; SU: Source Unit; TU: Treatment Unit.
5.2. Application of water network
To synthesize the optimal water network for the bioethanol production plant using the generalized
superstructure described above, the process and treatment units, and their corresponding flowrates must be
identified. For all the processes described in section 3 we consider:
Sources: Beer and rectification columns, Condensation processes.
Demand units: Gasifier, Fermentors, Dilution tanks, Boiler, Cooling tower.
Process Units: Pretreatment, Scrubbers, Boiler, Cooling tower
16
The application of the water network to a particular case also requires the specification of the
treatment units in accordance with the contaminants. Wastewater streams are generated from the boiler,
cooling tower, and beer columns, discharge from condensations. Three main contaminants are considered:
total suspended solids (TSS), total dissolved solids (TDS) and organics (BOD and COD) which are known to
be the most important ones. 69 Suspended solids are present in the water used for washing the raw material;
the organics are the main contaminants in the streams coming out of the distillation columns and the scrubber,
while the dissolved solids include the concentration of salts as a result of the evaporation processes in the
boiler and the cooling tower. Furthermore, the water fed to the fermentor must have no ethanol, which is toxic
for the bacteria or yeast. We assume that there are three different wastewater treatment units as well as the
fact that fresh water has no contaminants at all. In the next section we present the models for the treatment
units and for the boiler and cooling tower.
5.2.1. Models for process and treatment units.
5.2.1.1. Solids removal (TU1)
In order to remove suspended solids such as straw or sand screens are widely used. The removal
rates vary depending on the size of the solids.70 We assume 99.9% removal for suspended solids.
5.2.1.2. Organics removal (TU2)
The water from the distillation columns, the condensed water and the stream coming from the
scrubber require a system of anaerobic and aerobic treatment to remove the organic matter. The anaerobic
stage removes 90% of the organics generating biogas rich in methane that can be reused to obtain energy.
Later, the water is treated in an aerated lagoon to obtain relatively clean water that can be recycled to the
process according to the results presented by Zhang et al.55 Thus, for this study, both treatments are
integrated and modeled as a single treatment unit whose removal efficiency is assumed to be 100%.55
17
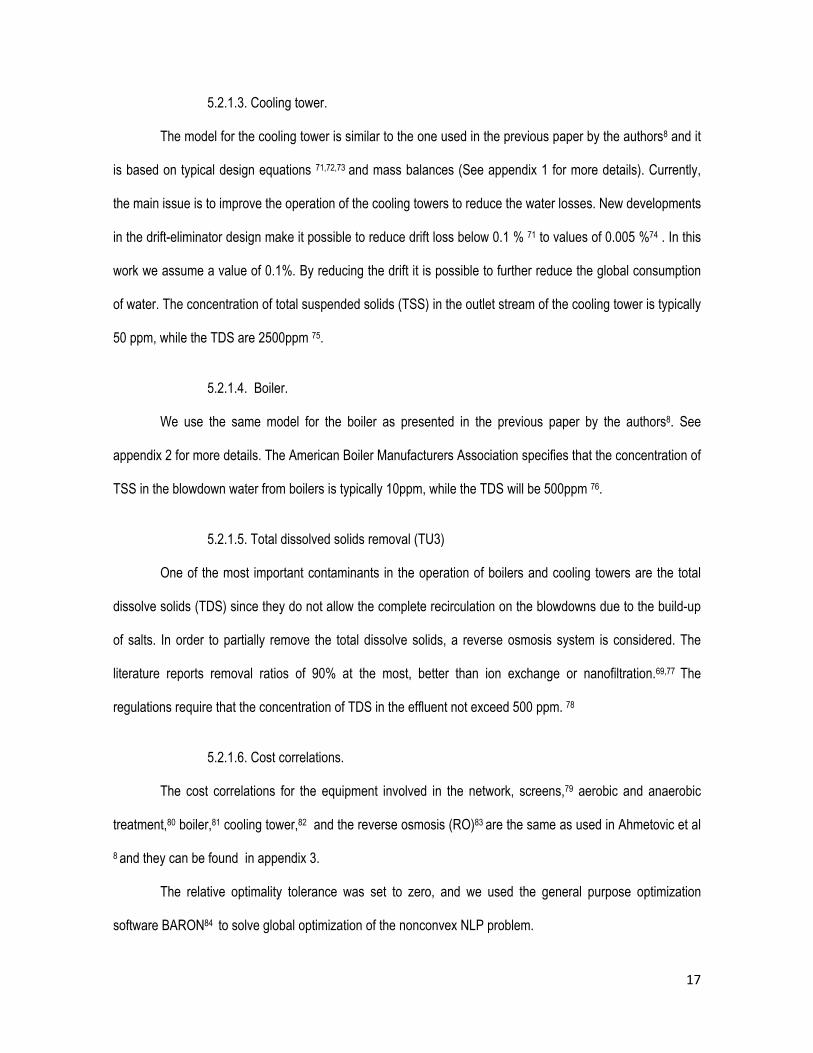
5.2.1.3. Cooling tower.
The model for the cooling tower is similar to the one used in the previous paper by the authors8 and it
is based on typical design equations 71,72,73 and mass balances (See appendix 1 for more details). Currently,
the main issue is to improve the operation of the cooling towers to reduce the water losses. New developments
in the drift-eliminator design make it possible to reduce drift loss below 0.1 % 71 to values of 0.005 %74 . In this
work we assume a value of 0.1%. By reducing the drift it is possible to further reduce the global consumption
of water. The concentration of total suspended solids (TSS) in the outlet stream of the cooling tower is typically
50 ppm, while the TDS are 2500ppm 75.
5.2.1.4. Boiler.
We use the same model for the boiler as presented in the previous paper by the authors8. See
appendix 2 for more details. The American Boiler Manufacturers Association specifies that the concentration of
TSS in the blowdown water from boilers is typically 10ppm, while the TDS will be 500ppm 76.
5.2.1.5. Total dissolved solids removal (TU3)
One of the most important contaminants in the operation of boilers and cooling towers are the total
dissolve solids (TDS) since they do not allow the complete recirculation on the blowdowns due to the build-up
of salts. In order to partially remove the total dissolve solids, a reverse osmosis system is considered. The
literature reports removal ratios of 90% at the most, better than ion exchange or nanofiltration.69,77 The
regulations require that the concentration of TDS in the effluent not exceed 500 ppm. 78
5.2.1.6. Cost correlations.
The cost correlations for the equipment involved in the network, screens,79 aerobic and anaerobic
treatment,80 boiler,81 cooling tower,82 and the reverse osmosis (RO)83 are the same as used in Ahmetovic et al
8 and they can be found in appendix 3.
The relative optimality tolerance was set to zero, and we used the general purpose optimization
software BARON84 to solve global optimization of the nonconvex NLP problem.
18
5.2.2. Water networks
Table 1 shows the identification of the process units, demand units and source units for each of the
processes under consideration. The flows and the level of contaminants of source units are given by the mass
balances presented in previous papers by the authors. 40,42-43 It is assumed that washing only generates solid
contaminants, while distillation columns and condensation mainly generate organic contaminants. Scrubbing,
on the other hand, generates both organics (NH3) and solids (Char and Olivine).
In the next sections we show the design of the optimal water networks with flow rates in t/h,
calculated for each of the processes under consideration (corn-based ethanol, thermo-chemical, thermo-
biochemical, biochemical (hydrolysis) and NREL-based thermo-chemical lignocellulosic bioethanol) assuming
the implementation of air cooling for intercompresion stages and distillation column condensers. Thus, only the
reduced cooling needs presented in Figure 6 will be treated in the cooling tower. We then summarize the
effect of the implementation of air cooling and the impact of the production of hydrogen as byproduct in the
water consumption for all the processes.
Table 1.- Inventory of units for the water networks of the bioethanol processes.
Process Process Units Demand Units Source Units Corn P1: Washing
P2: Boiler P3: Cooling Tower
D1: Fermentor D2: Boiler D3: Cooling tower
S1: Rec Column S2: Beer Column
Thermo-chemical P1: Washing P2: Cooling Tower
D1: Gasifier D2: Cooling Tower
S1: Condensation
Thermo-biochemical P1: Washing P2: Boiler P3:Cooling Tower
D1: Fermentor D2: Boiler/Gasifier D3: Cooling tower
S1: Beer Column S2: Condensation
Hydrolysis P1: Washing P2: Boiler P3:Cooling Tower
D1: Fermentor D2: Boiler D3: Cooling tower D4: Acid treatment
S1: Beer Column
Thermo-chemical (NREL)
P1: Washing P2: Cooling Tower
D1: Gasifier D2: Cooling Tower D3: Scrubber
S1: Scrubber & Condensation
19
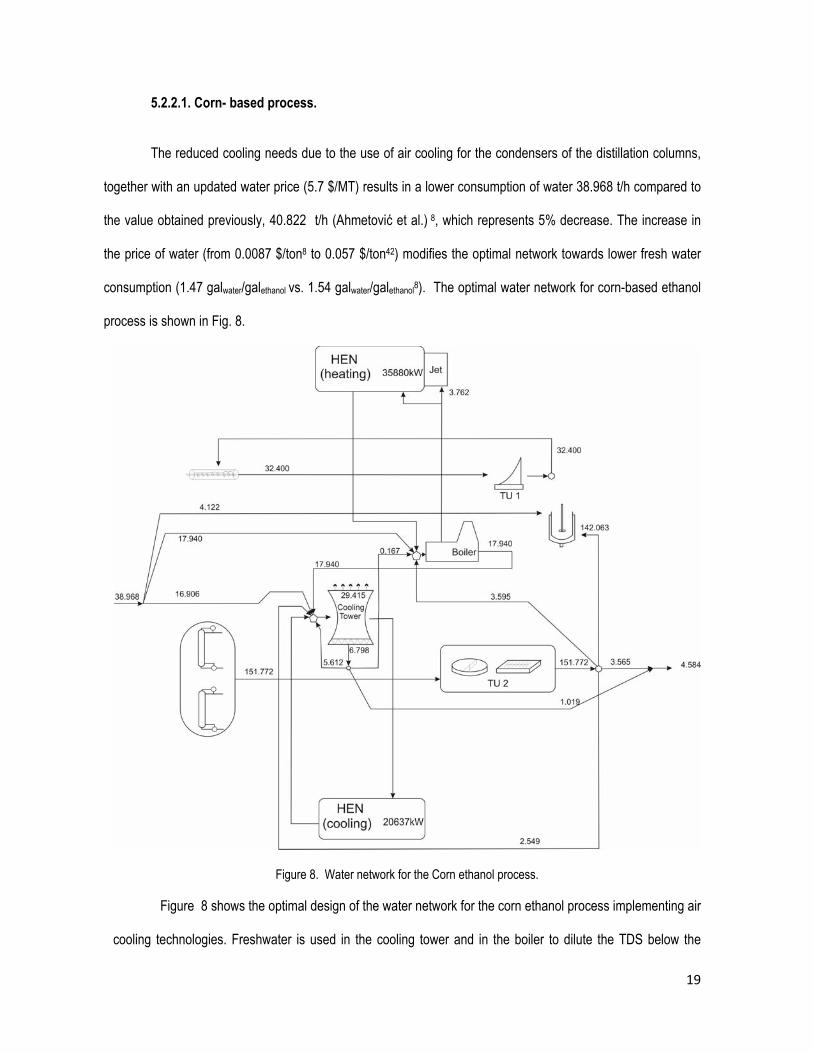
5.2.2.1. Corn- based process.
The reduced cooling needs due to the use of air cooling for the condensers of the distillation columns,
together with an updated water price (5.7 $/MT) results in a lower consumption of water 38.968 t/h compared to
the value obtained previously, 40.822 t/h (Ahmetović et al.) 8, which represents 5% decrease. The increase in
the price of water (from 0.0087 $/ton8 to 0.057 $/ton42) modifies the optimal network towards lower fresh water
consumption (1.47 galwater/galethanol vs. 1.54 galwater/galethanol8). The optimal water network for corn-based ethanol
process is shown in Fig. 8.
Figure 8. Water network for the Corn ethanol process.
Figure 8 shows the optimal design of the water network for the corn ethanol process implementing air
cooling technologies. Freshwater is used in the cooling tower and in the boiler to dilute the TDS below the
20
operating levels. Meanwhile, the water containing solids or organics can be treated and reused. It is not
possible to achieve zero discharge due to the higher cost of freshwater and the low flowrates within the
network. The water discharged is 4.584 t/h.
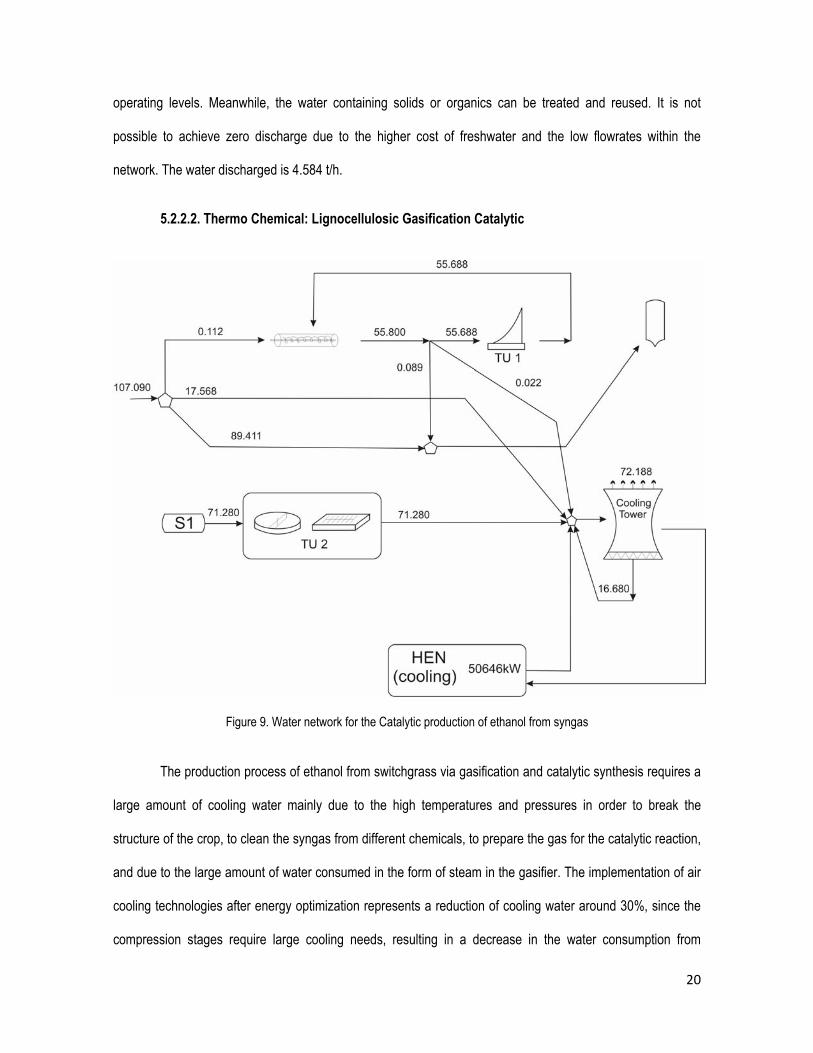
5.2.2.2. Thermo Chemical: Lignocellulosic Gasification Catalytic
Figure 9. Water network for the Catalytic production of ethanol from syngas
The production process of ethanol from switchgrass via gasification and catalytic synthesis requires a
large amount of cooling water mainly due to the high temperatures and pressures in order to break the
structure of the crop, to clean the syngas from different chemicals, to prepare the gas for the catalytic reaction,
and due to the large amount of water consumed in the form of steam in the gasifier. The implementation of air
cooling technologies after energy optimization represents a reduction of cooling water around 30%, since the
compression stages require large cooling needs, resulting in a decrease in the water consumption from

21
120.425 t/h to a value of 107.090 t/h, 4.0 galwater/galethanol. Further reduction in the use of cooling water could be
obtained by extending the use of air coolers to any cooler apart from condensers and compression interstage
coolers. Figure 9 shows the optimal water network for the thermo-chemical process when air cooling is used
since the HEN only accounts for the cooling water. There is no water discharge and the reverse osmosis is not
used because the large flowrates used in the plant allow TDS dilution below the operating limits.
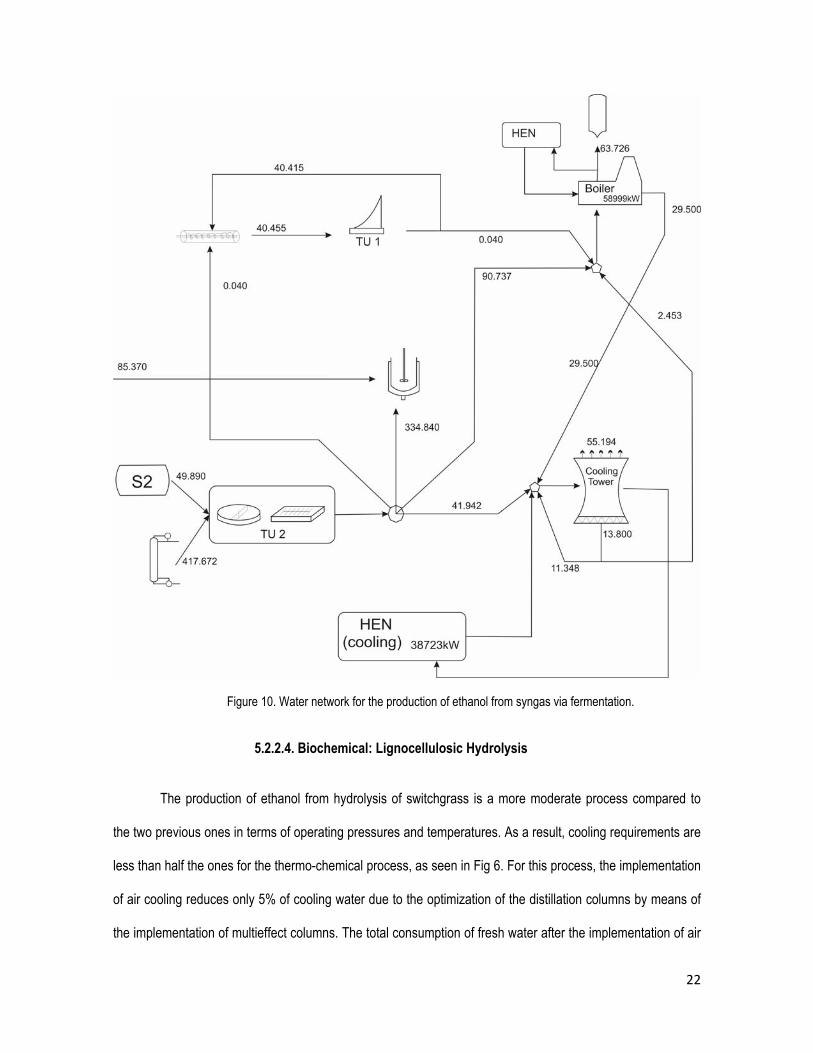
5.2.2.3. Thermo biochemical: Lignocelulosic Gasification Fermentation
The thermo-biochemical process is less water demanding that the thermo-chemical one due to the
lower working pressures in the synthetic part of the process. Thus, the impact of air cooling in the overall water
consumption represents a reduction of 11% in cooling water needs resulting in a total freshwater reduction
from 110.110 t/h (without air cooling) to 85.370 t/h (implementing air cooling), 3.2 galwater/galethanol, which is in
the range of the current corn based ethanol plants.8 The freshwater is used in the fermentor, while treated
water is used as make up in the cooling tower and in the boiler. No water is discharged to the environment.
Figure 10 shows the optimal water network for this process with air cooling technology in operation.
22
Figure 10. Water network for the production of ethanol from syngas via fermentation.
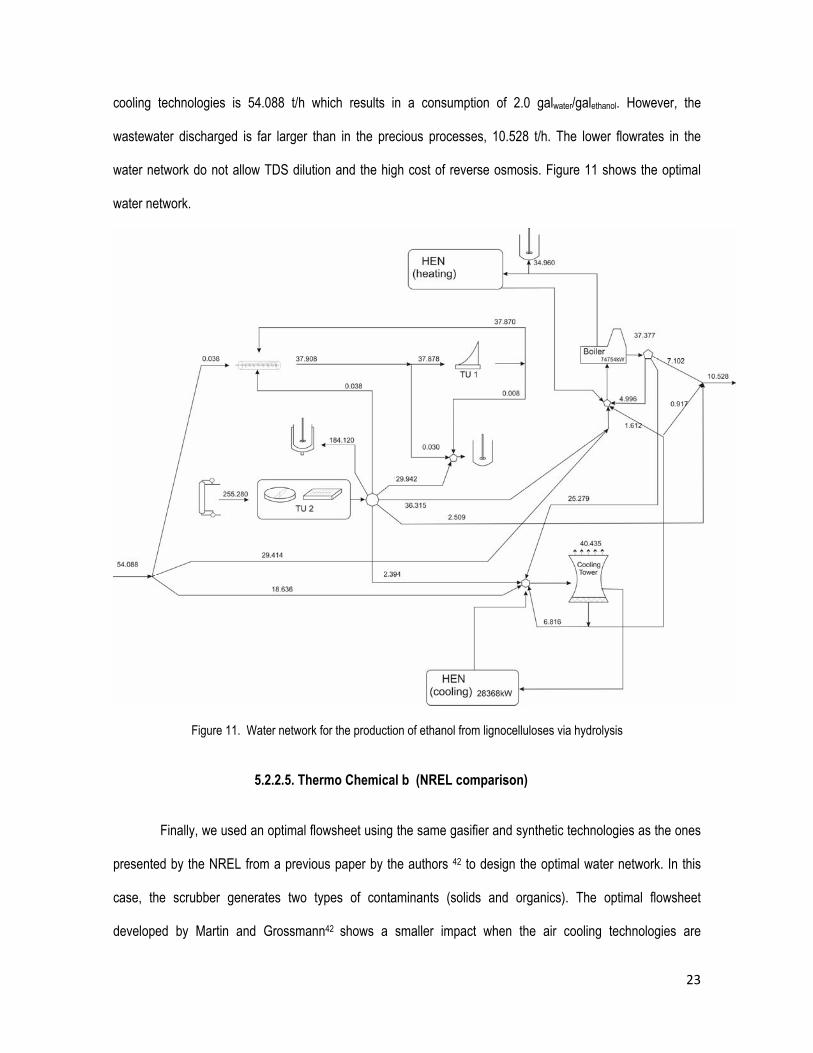
5.2.2.4. Biochemical: Lignocellulosic Hydrolysis
The production of ethanol from hydrolysis of switchgrass is a more moderate process compared to
the two previous ones in terms of operating pressures and temperatures. As a result, cooling requirements are
less than half the ones for the thermo-chemical process, as seen in Fig 6. For this process, the implementation
of air cooling reduces only 5% of cooling water due to the optimization of the distillation columns by means of
the implementation of multieffect columns. The total consumption of fresh water after the implementation of air
23
cooling technologies is 54.088 t/h which results in a consumption of 2.0 galwater/galethanol. However, the
wastewater discharged is far larger than in the precious processes, 10.528 t/h. The lower flowrates in the
water network do not allow TDS dilution and the high cost of reverse osmosis. Figure 11 shows the optimal
water network.
Figure 11. Water network for the production of ethanol from lignocelluloses via hydrolysis
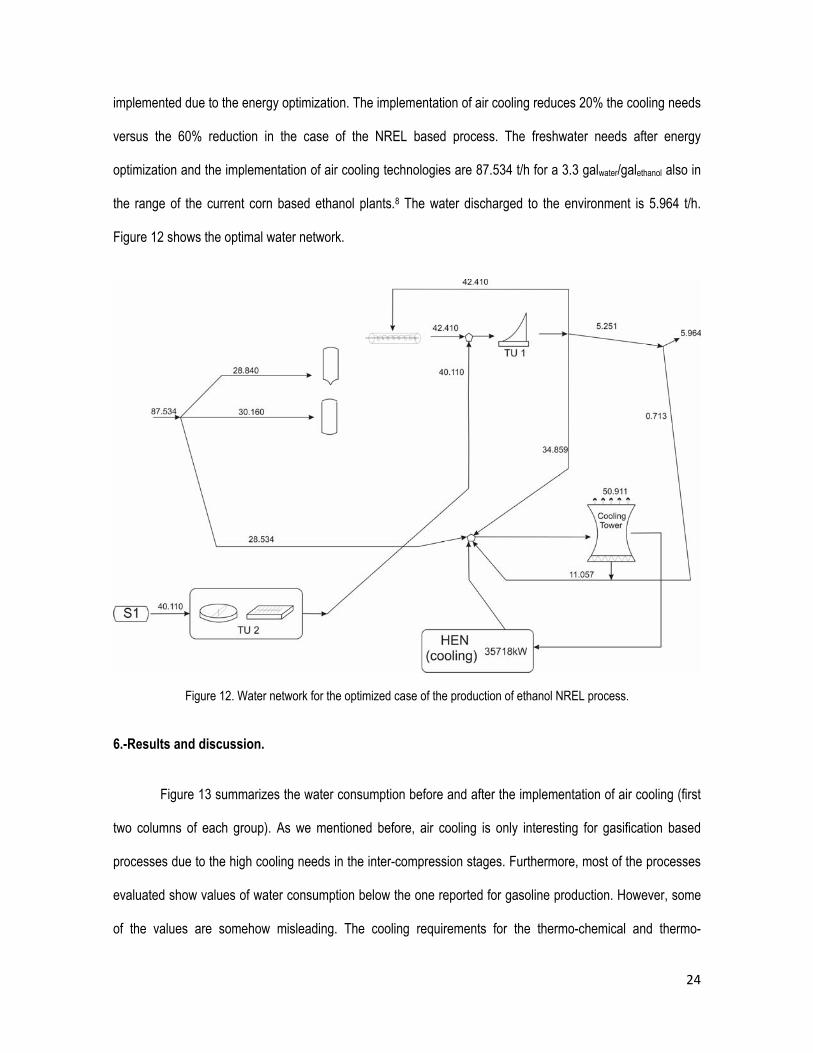
5.2.2.5. Thermo Chemical b (NREL comparison)
Finally, we used an optimal flowsheet using the same gasifier and synthetic technologies as the ones
presented by the NREL from a previous paper by the authors 42 to design the optimal water network. In this
case, the scrubber generates two types of contaminants (solids and organics). The optimal flowsheet
developed by Martin and Grossmann42 shows a smaller impact when the air cooling technologies are
24
implemented due to the energy optimization. The implementation of air cooling reduces 20% the cooling needs
versus the 60% reduction in the case of the NREL based process. The freshwater needs after energy
optimization and the implementation of air cooling technologies are 87.534 t/h for a 3.3 galwater/galethanol also in
the range of the current corn based ethanol plants.8 The water discharged to the environment is 5.964 t/h.
Figure 12 shows the optimal water network.
Figure 12. Water network for the optimized case of the production of ethanol NREL process.
6.-Results and discussion.
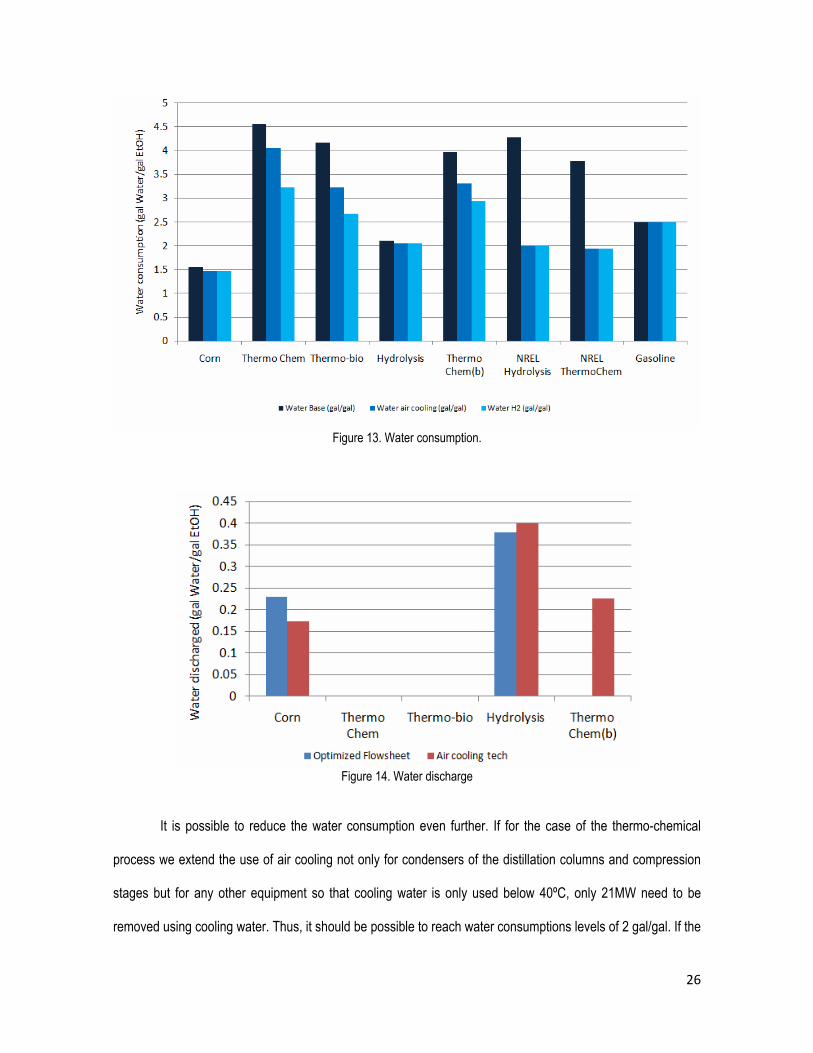
Figure 13 summarizes the water consumption before and after the implementation of air cooling (first
two columns of each group). As we mentioned before, air cooling is only interesting for gasification based
processes due to the high cooling needs in the inter-compression stages. Furthermore, most of the processes
evaluated show values of water consumption below the one reported for gasoline production. However, some
of the values are somehow misleading. The cooling requirements for the thermo-chemical and thermo-
25
biochemical processes not only account for the production of ethanol, but also for the production of a
significant amount of hydrogen. In order to compare with the other ethanol production plants we should also
consider the water consumption and cooling requirements of hydrogen production plants from the gasification
of raw materials. Martin & Grossmann85 optimized the production of hydrogen from biomass. Using the data
regarding the cooling needs and the water consumption for the optimized production of hydrogen, we can also
discount that amount to show the net cooling requirements for ethanol production only. Using this idea we
discount the water consumed for the production of hydrogen. In this way it is possible to determine the
consumption of water just for the production of ethanol as shown in the third column of each group in Figure
13. It can be seen that the water consumption for producing ethanol is lower than the amount needed to
produce gasoline in most of the cases, particularly for corn-based ethanol plants. On the other hand, the most
promising process for producing ethanol from lignocellulosic biomass from the water consumption standpoint
consists of the hydrolysis of the biomass and the fermentation of the liberated sugars into ethanol with a total
consumption of 2gal/gal, while the reported values in the literature range from 1.94 (hybrid poplar)52 to 5.9-9.8
(Switchgrass).51 In the case of the thermo-chemical plants, the water consumption reported in the NREL
report (based on hybrid poplar)40 only accounts for the water that is lost in the cooling tower and the boiler.
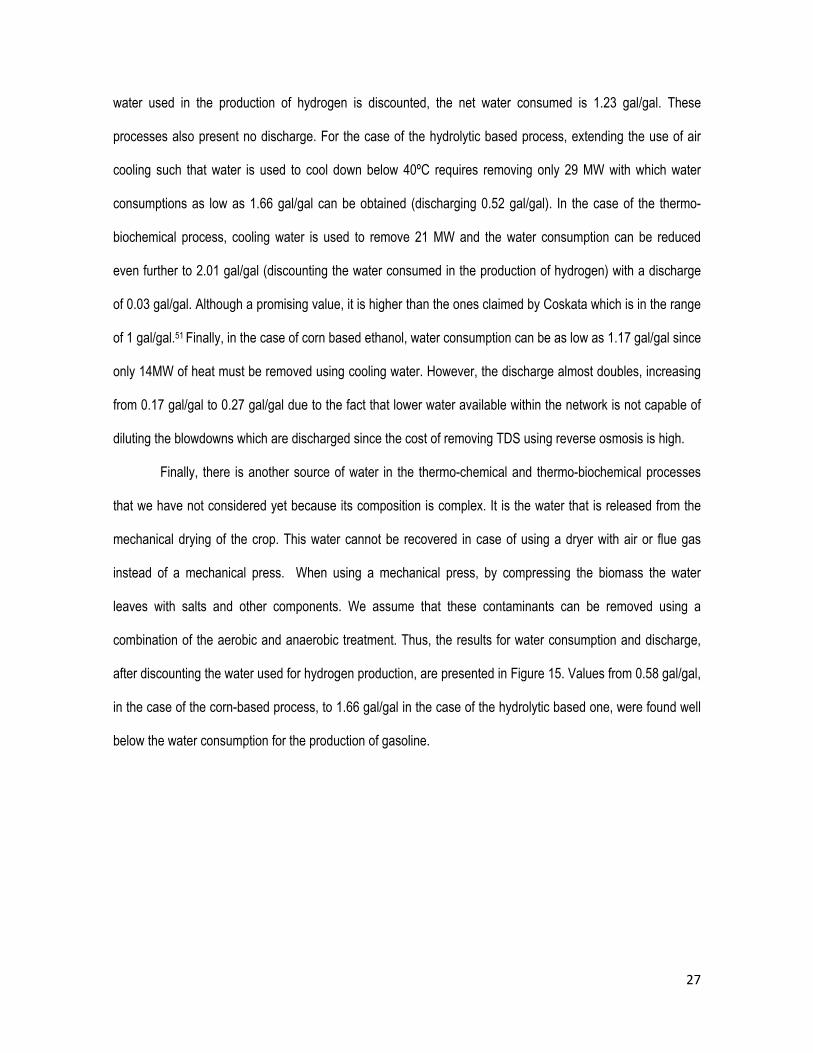
The water discharged from the processs is summarized in Figure 14 whether we use air cooling or
not. It turns out the large amounf of water used in the case of the production of ethanol via gasification allows
dilution of the streams so that water can be recycled. In the case of processes with lower consumption, water
is discharged due to the high cost of treating TDS.
26
Figure 13. Water consumption.
Figure 14. Water discharge
It is possible to reduce the water consumption even further. If for the case of the thermo-chemical
process we extend the use of air cooling not only for condensers of the distillation columns and compression
stages but for any other equipment so that cooling water is only used below 40ºC, only 21MW need to be
removed using cooling water. Thus, it should be possible to reach water consumptions levels of 2 gal/gal. If the
27
water used in the production of hydrogen is discounted, the net water consumed is 1.23 gal/gal. These
processes also present no discharge. For the case of the hydrolytic based process, extending the use of air
cooling such that water is used to cool down below 40ºC requires removing only 29 MW with which water
consumptions as low as 1.66 gal/gal can be obtained (discharging 0.52 gal/gal). In the case of the thermo-
biochemical process, cooling water is used to remove 21 MW and the water consumption can be reduced
even further to 2.01 gal/gal (discounting the water consumed in the production of hydrogen) with a discharge
of 0.03 gal/gal. Although a promising value, it is higher than the ones claimed by Coskata which is in the range
of 1 gal/gal.51 Finally, in the case of corn based ethanol, water consumption can be as low as 1.17 gal/gal since
only 14MW of heat must be removed using cooling water. However, the discharge almost doubles, increasing
from 0.17 gal/gal to 0.27 gal/gal due to the fact that lower water available within the network is not capable of
diluting the blowdowns which are discharged since the cost of removing TDS using reverse osmosis is high.
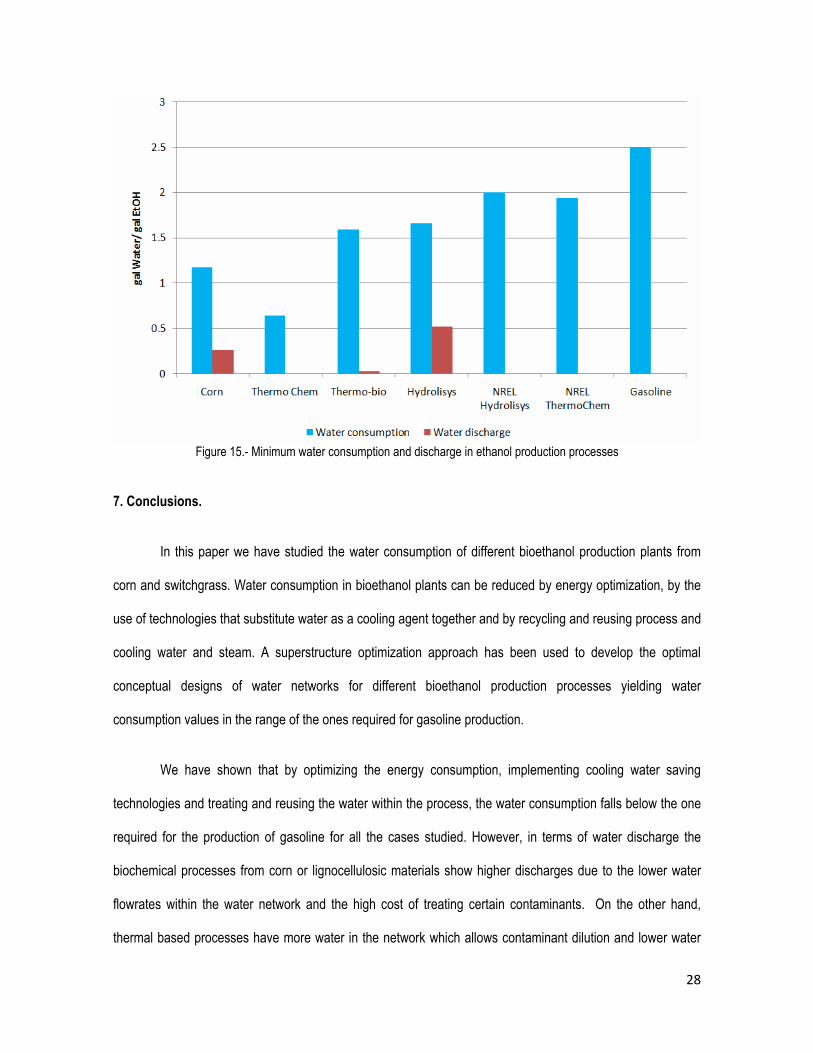
Finally, there is another source of water in the thermo-chemical and thermo-biochemical processes
that we have not considered yet because its composition is complex. It is the water that is released from the
mechanical drying of the crop. This water cannot be recovered in case of using a dryer with air or flue gas
instead of a mechanical press. When using a mechanical press, by compressing the biomass the water
leaves with salts and other components. We assume that these contaminants can be removed using a
combination of the aerobic and anaerobic treatment. Thus, the results for water consumption and discharge,
after discounting the water used for hydrogen production, are presented in Figure 15. Values from 0.58 gal/gal,
in the case of the corn-based process, to 1.66 gal/gal in the case of the hydrolytic based one, were found well
below the water consumption for the production of gasoline.
28
Figure 15.- Minimum water consumption and discharge in ethanol production processes
7. Conclusions. In this paper we have studied the water consumption of different bioethanol production plants from
corn and switchgrass. Water consumption in bioethanol plants can be reduced by energy optimization, by the
use of technologies that substitute water as a cooling agent together and by recycling and reusing process and
cooling water and steam. A superstructure optimization approach has been used to develop the optimal
conceptual designs of water networks for different bioethanol production processes yielding water
consumption values in the range of the ones required for gasoline production.
We have shown that by optimizing the energy consumption, implementing cooling water saving
technologies and treating and reusing the water within the process, the water consumption falls below the one
required for the production of gasoline for all the cases studied. However, in terms of water discharge the
biochemical processes from corn or lignocellulosic materials show higher discharges due to the lower water
flowrates within the water network and the high cost of treating certain contaminants. On the other hand,
thermal based processes have more water in the network which allows contaminant dilution and lower water
29
discharge. In these cases, the use of air cooling is recommended in order to keep the freshwater consumption
at reasonable levels.
In order to further reduce water consumption a number of alternatives should be pursued. First,
cooling technologies that do not use water as cooling agent should be extensively studied and implemented to
reduce the use of cooling towers. Next, cheaper and more efficient treatment technologies must be developed.
Finally, the optimization of the operation of the cooling towers must be addressed, since it represents the
equipment with highest water losses. Very promising values can be obtained, from 0.6 gal/gal to 1.7gal/gal,
below the water consumption for the production of gasoline.
Acknowledgments
The authors gratefully acknowledge the NSF Grant CBET0966524 and the Center for Advanced Process Decision-making at Carnegie Mellon University. Dr. Mariano Martín acknowledges the Ministry of Education and Science of Spain and Fulbright commission for providing a MICINN – Fulbright Posdoctoral fellowship. Dr. Elvis Ahmetović acknowledges the Fulbright Visiting Scholar Program. 8. References. (1) Hayward, T. (2008) BP Statistical Review of World Energy June 2008 (2) GWI/OCDE (2008) http://www.globalwaterintel.com/archive/9/9/analysis/world-water-prices-rise-by-67.html (3) Rosegrant, M.W. Cai, X. Cline, (2002) Global Water Outlook to 2025 – Averting an Impending Crisis. International Food Policy Research institute, Washington (4) Berndes, G Bioenergy and water- the implications of large-scale bioenergy production for water use and supply. Global Environ. Chang. 12, 253-271 (5) Elcock, D. (2008) Baseline and Projected Water Demand Data for Energy and Competing Water Use Sectors, ANL/EVS/TM/08-8, (6) Chiu, Yi-Wen, Walseth, B., Suh, S. Water Embodied in Bioethanol in the United States Environ. Sci. Technol., 2009, 43 (8), pp 2688–2692 (7) Petrakis S. Reduce cooling water consumption. New closed loop cooling method improves process cooling tower operations. Hydrocarbon Processing, 2008, December, 95-98 (8) Ahmetović, E., Martin, M., Grossmann, I. E. Optimization of Energy and Water Consumption in Corn–based Ethanol Plants. I&ECR 2010 DOI: 10.1021/ie1000955
30
(9) Linnhoff, B., et al., User Guide on Process Integration for the Efficient Use of Energy. Institute of Chemical Engineers, 1982, UK (10) Papoulias, S.A., Grossmann, I.E., A structural optimisation approach in process synthesis. II—Heat recovery networks. Comp. Chem. Eng. 1983, 7, 707–721. (11) Wang, Y.P., Smith, R., Wastewater minimisation. Chem. Eng. Sci, 1994, 49 (7), 981–1006. (12) Wang, Y.P. & Smith, R. Design of distributed effluent treatment systems. Chem. Eng. Sci, 1994, 49(18), 3127-3145. (13) Wang, Y. P. & Smith, R. Wastewater Minimization with Flowrate Constraints. Chem. Eng. Res. Des., 1995, 73, 889. (14) Kuo, W.J., Smith, R., Designing for the interactions between water-use and effluent treatment. Transaction of IChemE, 1998, 76 (Part A), 287–301. (15) Forstmeier, M., Goers, B., Wozny. G. Water network optimisation in the process industrydcase study of a liquid detergent plant. J. Clean. Prod., 2005, 13, 495-498 (16) Foo, D. C. Y. State-of-the-Art Review of Pinch Analysis Techniques for Water Network Synthesis. Ind. Eng. Chem. Res., 2009, 489 (11), 5125-5159. (17) Takama, N., Kuriyama, T., Shiroko, K. & Umeda, T. Optimal water allocation in a petroleum refinery. Comp. Chem. Eng. 1980, 4, 251-258. (18) Doyle, S.J., Smith, R., Targeting water reuse with multiple constraints. Transaction of IChemE, 1997, 75 (Part B), 181–189. (19) Alva-Argaez, A., Integrated design of water systems. 1999, Ph.D. Thesis, UMIST, Manchester, UK (20) Bagajewicz, M. A review of recent design procedures for water networks in refineries and process plants. Comp. Chem. Eng., 2000, 24, 2093–2113 (21) Bagajewicz, M., Rodera, H., Savelski M. A robust method to obtain optimal and sub optimal design and retrofit solutions of water utilization systems with multiple contaminants in process plants. In proceeding of the Sevenths International Sysmposium on Process System Engineering (PSE) 2000 (22) Saeedi, M. Hosseinzadeh M Optimization of Water consumption in industrial Systems using lineal and nonlinear programming. J Appl. Sci. 2006, 6, 2386-2393 (23) Karuppiah, R., Grossmann, I.E. Global optimization for the synthesis of integrated water systems in chemical processes. Comp. Chem. Eng. 2006, 3, 650–673 (24) Savelski, M.J. and Bagejewicz, M.J., Design and retrofit of water utilization systems in refineries and process plants, In AIChE Annual Meeting Los Angeles, 1997, paper 188g, (25) Savulescu, L.E. and Smith, R., Simultaneous Energy and Water Minimisation. AIChe Annual Meeting, November 15–20, 1998, Miami Beach, Florida, Unpublished
31
(26) Savulescu, L., Sorin, M. and Smith, R., Direct and indirect heat transfer in water network systems. Appli. Therm. Eng., 2002, 22, 981–988. (27) Savulescu, L., Kim, J.K. and Smith, R., Studies on simultaneous energy and water minimisation—part 1: systems with no water re-use. Chem. Eng. Sci., 2005, 60, 3279–3290. (28) Savulescu, L., Kim, J.K. and Smith, R., Studies on simultaneous energy and water minimisation—part 2:systems with maximum re-use of water. Chem. Eng. Sci., 2005, 60, 3291–3308. (29) Zheng, X.S., Feng, X. and Cao, D.L., Design water allocation network with minimum freshwater and energy consumption. Comp. Aided Chem. Eng., 2003, 15, 388–393. (30) Feng, X., Li, Y. and Yu, X., Improving energy performance of water allocation networks through appropriate stream merging. Chin. J. Chem. Eng., 2008, 16:480–484 (31) Manan, Z. A., Tea, S. Y., Alwi, S. R. W. A new technique for simultaneous water and energy minimisation in process plant, Chem Eng Res Des, 2009, doi:10.1016/j.cherd.2009.04.013 (32) Bagajewicz, M.J., Pham, R., Manousiouthakis, V. On the state space approach to mass/heat exchanger network design. Chem. Eng. Sci., 1998, 53, 2595–2621. (33) Du, J., Meng, X., Du, H., Yu, H., Fan, X. and Yao, P. Optimal design of water network with energy integration in process industries. Chin. J. Chem. Eng. 2004, 12, 247–255. (34) Liao, Z., Wu, J., Jiang, B., Wang, J. and Yang, Y., (2008) Design energy efficient utilization systems allowing operation split. Chin. J. Chem. Eng. 2008, 1: 16–20. (35) Dong, H.G., Lin, C.Y. and Chang, C.T., Simultaneous optimization approach for integrated water allocation and heat-exchange networks. Chem. Eng. Sci , 2008, 63, 3664–3678. (36) Bogataj, M. and Bagajewicz, M.J., Synthesis of non-isothermal heat integrated water networks in chemical Processes. Comp. Chem. Eng., 2008, 32: 3130–3142 (37) Leewongtanawit, B. and Kim, J.K., Synthesis and optimisation of heat-integrated multiple-contaminant water systems. Chem. Eng. Process. 2008, 27: 670–694. (38) Kim, J.Y., Kim, J.K., Kim, J.H., Yoo, C.K. and Moon, I., A simultaneous optimization approach for the design of wastewater and heat exchange networks based on cost estimation. J. Cleaner. Prod., 2009, 17: 162–171. (39) Feng, X., Li, Y. and Shen, R., A new approach to design energy efficient water allocation networks. Appl. Therm. Eng. 2009. 29, 11-12, 2302-2307 (40) Phillips, S., Aden, A., Jechura, J. and Dayton, D., Eggeman, T (2007) Thermochemical Ethanol via Indirect Gasification and Mixed Alcohol Synthesis of Lignocellulosic Biomass Technical Report, NREL/TP-510-41168, April 2007 (41) Karuppiah, R., Peschel, A., Grossmann, I.E., Martín, M., Martinson, W. Zullo, L., Energy optimization of an Ethanol Plant. AICHE Journal. 2008, 54, 1499-1525.
32
(42) Martin, M., Grossmann, I.E: Energy Optimization of Bioethanol Production via Gasification of Switchgrass to be submitted AIChE J. 2010 (43) Martin, M., Grossmann, I.E: Energy Optimization of Bioethanol Production via Hydrolysis of Switchgrass to be submitted AIChE J. (2010b) (44) Bush, G.W. Presidential State of the Union Address 2007 (45) Piccolo, C., Bezzo, F., A techno-economic comparison between two technologies for bioethanol production from lignocelluloses. Biomass and Bioenergy 33 (2009) 478 – 491 (46) Andy Aden. Water Usage for Current and Future Ethanol Production. Southwest Hydrology, September/October 2007. 22-23 (47) Pimentel, D: and Patzek, T. W. Ethanol Production Using Corn, Switchgrass, and Wood; Biodiesel Production Using Soybean and Sunflower Natural Resour. Res., 2005, 14, 1, 65-76 (48) de Fraiture, Charlotte, Giordano, M., Yongsong, L. Biofuels and Implications for agricultural water use: blue impacts of green energy. Water Policy. 2008, 10: 67-81. (49) Pfromm, P H . The minimum water consumption of Ethanol production via Biomass fermentation. The Open Chem. Eng. J., 2008, 2, 1-5 (50) Minnesota Technical Assistance Program, MTAP, Ethanol Benchmarking and best practices. The production process and potential for improvement, 2008 www.mntap.umn.edu/MnTAP%20Ethanol%20Report.pdf (51) Wu, M., Mintz, M., Wang., M., Arora, S., (2009) Consumptive water use in the production of ethanol and petroleum gasoline. ANL/ESD/09-1 (52) Tao, L., Aden, A., Humbird, D., Dutta, A., Kinchin, C., Inman, D., Hsu, D.D., Dugeon, D., Lukas, J., Olthof, B., Schoen, P., Worley, M. Lignocellulosic Biomass to ethanol. Process Desing and Economics for corn stover. Paper 239c. AICHE annual meeting 2009, Nashville. Tennesse (53) Hamelinck, C.N., Hooijdonk, G. v., Faaij, A.P.C Ethanol from lignocellulosic biomass: techno-economic performance in short-, middle- and long-term. Biomass & Bioenergy. 2005 28. 384-410 (54) Cardona Alzate, C.A., Sánchez Toro, O.J. Energy consumption analysis of integrated flowsheets for production of fuel ethanol from lignocellulosic biomass Energy, 2006, 31, 2447-2459 (55) Zhang, S., Marechal, F., Gassner, M., Perin-Levasseur, Z., Qi, W., Ren, Z., Yan, Y., Favrat, D., Process Modeling and Integration of Fuel Ethanol Production from Lignocellulosic Biomass Based on Double Acid Hydrolysis Energy Fuels, 2009, 23 (3), 1759–1765 (56) Keshwani, D. R., Cheng, J.J. Switchgrass for bioethanol and other value-added applications: A review Bioresource Technology. 2009, 100, 1515–1523 (57) Kazi, F.K., Fortman, J.A., Anex, R.P., Hsu, D.D., Aden, A., Dutta, A., Kothandaraman, G, Technoeconomic comparison of process technologies for biochemical ethanol production from corn stover. Fuel, 2010, doi: 10.1016/j.fuel.2010.01.001
33
(58) Huhnke, R. L. Cellulosic ethanol using gasification-fermentation. Resource: Engineering & Technology for a Sustainable World 2008 http://www.articlearchives.com/energy-utilities/renewable-energy-biomass/896186-1.html (59) Zhu, Y., Gerber, M.A., Jones, S.B., Stevens, D.J Analysis of the effects of compositional and configurational assumptions on product costs for the thermochemical cornversion of lignocellulosic biomass to mixed alchohols FY 2007 Progress report. DOE PNNL.17949 Revision 1. 2009 (60) Schell, D.J., Farmer, J., Newman, M., McMillan, J.D. Dilute _ Sulfuric Acid Pretreatment of Corn Stover in Pilot – Scale reactor. Applied Biochemistry and Biotechnology, 2003,105-108, 69-85 (61) Aden, A., Foust, T. Technoeconomic analysis of the dilute sulfuric acid and enzymatic hydrolysis process for the conversion of corn stover to ethanol. Cellulose, 2009, 16, 535-545 (62) Sun, Y., Cheng, J., Hydrolysis of lignocellulosic materials for ethanol production: a review. Bioresource Technology. 2002, 83, 1-11 (63) Alizadeh, H., Teymouri, F., Gilbert, T.I. and Dale, B.E. Pretreatment of switchgrass by ammonia fiber explosion (AFEX) Applied Biochemistry and Biotechnology 2005, 121-124, 1133-1141 (64) Murnen, H.K., Balan, V., Chundawat, S.P.S., Bals., B., Sousa, L.da C., Dale, B.E. Optimization of Amonia fiber expansion (AFEX) pretreatment and enzymatic hydrolysis of Miscanthus x giganteus to Fermentable sugars. Biotechnol. Prog. 2007, 23, 846-850
(65) Čuček, L. Krananja, Z., LCA-Based MINLP Synthesis of a Bioethanol Production Network http://aiche.confex.com/aiche/s10/webprogram/Paper175970.html
(66) Gregg, D., Saddler, J.N. Bioconversion of lignocellulosic residue to ethanol: Process flowsheet development. Biomass and Bioenergy, 1995, 9, 1-5, 287-302 (67) Wooley, R.J., Putsche, V. (1996) Development of an ASPEN PLUS Physical Property Database for Biofuels Components NREL/MP-425-20685 http://www.p2pays.org/ref/22/21210.pdf (68) Ahmetović, E., & Grossmann, I. E. General superstructure and global optimization for the design of integrated process water networks AIChE J. in press. 2010 DOI: 10.1002/aic.12276 (69) Ryan, D., Gadd, A., Kavanagh, J., Barton, G.W. Integrated biorefinery wastewater design. Chem. Eng. Res. Des. 87, 1261-1268 (70) Wang, L.K Hung, Y-T,Howard H. Lo, H.H, Yapijakis, C., Li, K. H. (Eds.) Handbook of industrial and Hazardous wastes treatment Second Edition, Marcel Dekker, Inc., New York-Basel, ISBN 0-8247-4114-5, 2004, (71) Perry, R. H, & Green, D. W. Perry's Chemical Engineer's Handbook, New York: McGraw-Hill. 1997
(72) Mann, J. G., & Liu, Y. A. Industrial water reuse and wastewater minimization. New York, USA: McGraw-Hill. 1999 (73) Fatigati, M., Conserving Water in Ethanol Plants. Wester Region BBI Biofuels Workshop 2006 San Diego CA

34
http://www.bbibiofuels.com/biofuelsworkshop/2006/docs/speakerpapers/west/bww/BWW06-14-Fatigati.pdf (74) http://www.arvanitakis.com/en/c/tower_operation.htm (75) APHA American Public Health Association Standard methods for the examination of water and wastewater, American Public Health Association, 17th ed. 1989 (76) http://www.abma.com/ (77)http://www.waterandwastewater.com/cgi-bin/yabb/YaBB.pl?board=general;action=display;num=1190280253 (78) Patoczka, J., Impact of chemicals addition in water / wastewater treatment on TDS concentration and sludge generation. 2007 http://www.patoczka.net/Jurek%20Pages/Papers/Florida%2007%20Paper.pdf (79) http://www.matche.com/EquipCost/Screen.htm (80) EPA (Environmental Protection Agency), Construction costs for municipal wastewater treatment plants: 1973-1977. Technical Report MCD-37, U.S. E.P.A. Washington, D. C., U. S. A. Adapted in http://www.fao.org/DOCREP/003/V9922E/V9922E09.htm 1978 (81) http://www.matche.com/EquipCost/Boiler.htm (82) http://www.matche.com/EquipCost/Cooling.htm (83) http://www.oas.org/usde/publications/unit/oea59e/ch20.htm (84) Sahinidis, N. V., BARON: A general purpose global optimization software package, J. Global Optim, 1996, 8(2), 201-205, (85) Martin, M. & Grossmann, I.E. Energy optimization of Hydrogen production from biomass. To be submitted. 2010
35
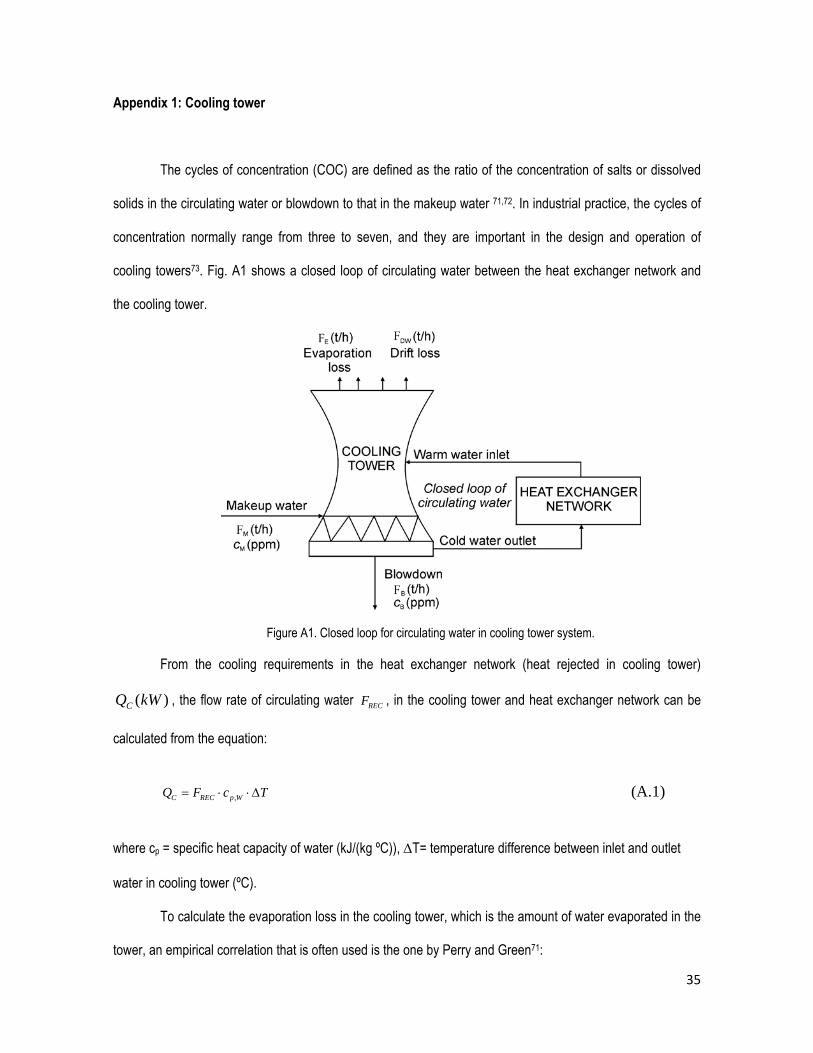
Appendix 1: Cooling tower
The cycles of concentration (COC) are defined as the ratio of the concentration of salts or dissolved
solids in the circulating water or blowdown to that in the makeup water 71,72. In industrial practice, the cycles of
concentration normally range from three to seven, and they are important in the design and operation of
cooling towers73. Fig. A1 shows a closed loop of circulating water between the heat exchanger network and
the cooling tower.
Figure A1. Closed loop for circulating water in cooling tower system.
From the cooling requirements in the heat exchanger network (heat rejected in cooling tower)
)(kWQC , the flow rate of circulating water RECF , in the cooling tower and heat exchanger network can be
calculated from the equation:
,C REC p WQ F c T= ⋅ ⋅Δ (A.1)
where cp = specific heat capacity of water (kJ/(kg ºC)), ΔT= temperature difference between inlet and outlet
water in cooling tower (ºC).
To calculate the evaporation loss in the cooling tower, which is the amount of water evaporated in the
tower, an empirical correlation that is often used is the one by Perry and Green71:
36
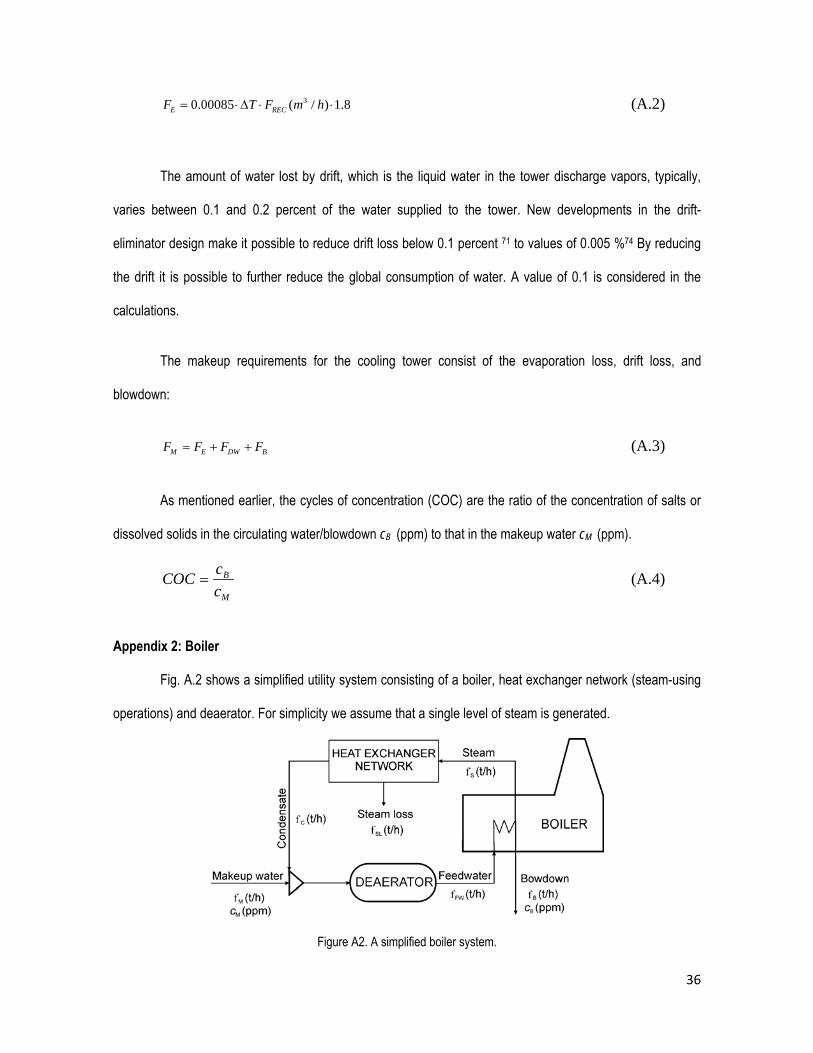
30.00085 ( / ) 1.8E RECF T F m h= ⋅Δ ⋅ ⋅ (A.2)
The amount of water lost by drift, which is the liquid water in the tower discharge vapors, typically,
varies between 0.1 and 0.2 percent of the water supplied to the tower. New developments in the drift-
eliminator design make it possible to reduce drift loss below 0.1 percent 71 to values of 0.005 %74 By reducing
the drift it is possible to further reduce the global consumption of water. A value of 0.1 is considered in the
calculations.
The makeup requirements for the cooling tower consist of the evaporation loss, drift loss, and
blowdown:
M E DW BF F F F= + + (A.3)
As mentioned earlier, the cycles of concentration (COC) are the ratio of the concentration of salts or
dissolved solids in the circulating water/blowdown cB (ppm) to that in the makeup water cM (ppm).
M
B
ccCOC = (A.4)
Appendix 2: Boiler
Fig. A.2 shows a simplified utility system consisting of a boiler, heat exchanger network (steam-using
operations) and deaerator. For simplicity we assume that a single level of steam is generated.
Figure A2. A simplified boiler system.
37
The steam generated in the boiler is used to supply heat in the heat exchanger network, while the
steam condensate is returned to the boiler. In the case that there is no steam consumption in the process or
loss SLf in the heat exchanger network, the flow rate of generated steam in the boiler and returned steam
condensate is the same, S Cf f= . In addition, makeup requirements for the boiler system will be equal to the
discharged blowdown.
According to this water balance for the boiler system, the mixer, and the heat exchanger network is
given by the equations:
M SL Bf f f= + (A.5)
FW M Cf f f= + (A.6)
S SL Cf f f= + (A.7)
11B Sf f
COC=
− (A.8)
The American Boiler Manufacturers Association specifies that the concentration of TSS in the
blowdown water from boilers is typically 10ppm, while the TDS will be 500ppm 76. Assuming the simplified
utility system in Fig. A2, the generated steam in the boiler can be calculated from the heat requirements in the
heat exchanger network.
H S vQ f H= ⋅Δ (A.9)
where ΔHv=latent heat of steam condensation (kJ/kg) for a given temperature and pressure.
In order to control the buildup of contaminants in the closed boiler system, the blowdown has to be
discharged and fresh makeup water supplied to the boiler so that none of the contaminants exceeds its limit.
38
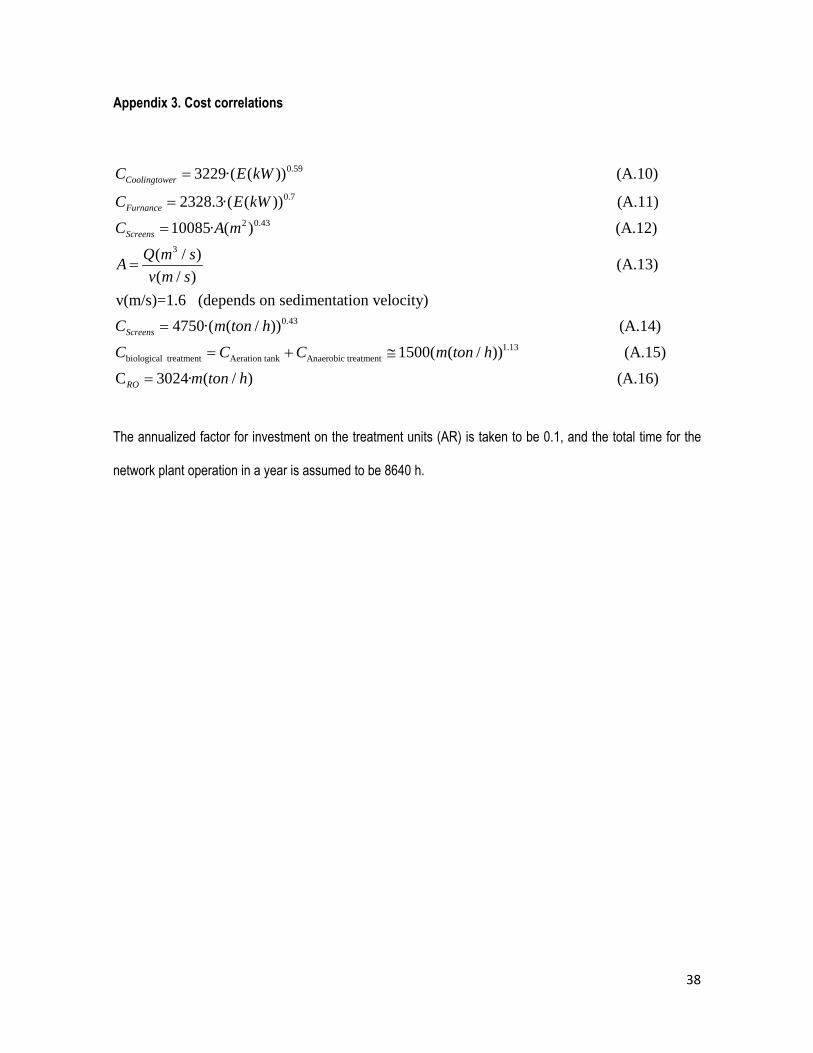
Appendix 3. Cost correlations
0.59
0.7
3229·( ( )) (A.10)
2328.3·( ( )) Coolingtower
Furnance
C E kW
C E kW
=
=2 0.43
3
(A.11)
10085· ( ) (A.12)
( / ) ( / )
ScreensC A m
Q m sAv m s
=
=
0.43
(A.13)
v(m/s)=1.6 (depends on sedimentation velocity) 4750·( ( / )) ScreensC m ton h=
1.13biological treatment Aeration tank Anaerobic treatment
(A.14)
1500( ( / )) (A.15)
C 3024· ( /RO
C C C m ton h
m ton
= + ≅
= ) (A.16)h
The annualized factor for investment on the treatment units (AR) is taken to be 0.1, and the total time for the
network plant operation in a year is assumed to be 8640 h.