Optimization of ionic concentrations in engineered water ...
14
Optimization of ionic concentrations in engineered water injection in carbonate reservoir through ANN and FGA Leonardo Fonseca Reginato 1, * , Lucas Gomes Pedroni 2 , André Luiz Martins Compan 2 , Rodrigo Skinner 2 , and Marcio Augusto Sampaio 1 1 Departamento de Engenharia de Minas e de Petróleo, Escola Politécnica, Universidade de São Paulo, Santos, SP 11013-560, Brasil 2 Centro de Pesquisas Leopoldo Américo Miguez de Mello (CENPES), Petrobras S.A., Rio de Janeiro, RJ 21941-915, Brasil Received: 22 September 2020 / Accepted: 7 December 2020 Abstract. Engineered Water Injection (EWI) has been increasingly tested and applied to enhance fluid dis- placement in reservoirs. The modification of ionic concentration provides interactions with the pore wall, which facilitates the oil mobility. This mechanism in carbonates alters the natural rock wettability being quite an attractive recovery method. Currently, numerical simulation with this injection method remains limited to sim- plified models based on experimental data. Therefore, this study uses Artificial Neural Networks (ANN) learn- ability to incorporate the analytical correlation between the ionic combination and the relative permeability (Kr), which depicts the wettability alteration. The ionic composition in the injection system of a Brazilian Pre-Salt benchmark is optimized to maximize the Net Present Value (NPV) of the field. The optimization re- sults indicate the EWI to be the most profitable method for the cases tested. EWI also increased oil recovery by about 8.7% with the same injected amount and reduced the accumulated water production around 52%, com- pared to the common water injection. 1 Introduction Reservoir engineering seeks to manage the entire productive life of the field. This requires using computational tools to find the best strategy and to guarantee the highest Net Present Value (NPV). Its simulation requires parameters, such as physical, chemical, petrophysical, extension, local- ization, and architecture. Thus, knowing these conditions and considering economic scenarios, it is possible to decide on a better oil recovery method. These numerical models seek to be the best real reser- voir representation, but often some information is disre- garded to enable the simulation, which generates unreliable forecasting data to outline a successful strategy in the production of this field. According to Fabbri et al. (2020), one solution is to calibrate the simulation with experimental work, but this can provide an increase in com- putational effort. Thus, it is ideal to use simulation tools that preserve its real characteristics, especially when com- bined with advanced production methods (Breitenbach, 1991; Dake, 2015; Lie, 2012; Mustafiz and Islam, 2008). Some oil recovery methods have gained attention, such as Low Salinity Water Injection (also called Smart Waterflood (Saudi Aramco), Designer Water (Shell), LoSal (British Petroleum), and Advanced Ion Management (ExxonMobil)). In general terms, Low Salinity Water Injec- tion (LSWI) is an enhanced technique in which the ionic concentration control of injected water results in additional oil recovery of the field (Dang et al., 2015). After intensive laboratory research and field-scale tests with LSWI achieve positive responses, the method is currently accepted and applied by major oil companies worldwide (Zhang et al., 2020). This technique appears in one of the first surveys by Bernard (1967), who observed a different oil recovery in the tested samples, just varying the injected brine composi- tion. The author hypothesizes that this effect happens in the interaction with freshwater and hydratable clay present in sandstone samples. In 1998, Morrow et al. quantified the influence of brine composition in the wettability properties, using the spontaneous imbibition core test, beginning the discussion on a multi-effect occurring during the water, oil, and rock interaction. Other works confirm the LSWI as an appropriate appli- cation in carbonate reservoirs, in which the main effect reported was the reduction of the polar bond between car- boxylic compounds and rock minerals, increasing the pore wall water adsorption (Fathi et al., 2011; Strand et al., 2006; Yousef et al., 2010; Zhang et al., 2007). Therefore, the control of potential ions (SO 4 2 , Mg 2+ , and Ca 2+ ) results in a modification of natural wettability characteris- tics. Thus, the Wettability Alteration (WA) to more * Corresponding author: [email protected] This is an Open Access article distributed under the terms of the Creative Commons Attribution License (https://creativecommons.org/licenses/by/4.0), which permits unrestricted use, distribution, and reproduction in any medium, provided the original work is properly cited. Oil & Gas Science and Technology – Rev. IFP Energies nouvelles 76, 13 (2021) Available online at: Ó L.F. Reginato et al., published by IFP Energies nouvelles, 2021 ogst.ifpenergiesnouvelles.fr https://doi.org/10.2516/ogst/2020094 REGULAR ARTICLE
Transcript of Optimization of ionic concentrations in engineered water ...

Optimization of ionic concentrations in engineered water injectionin carbonate reservoir through ANN and FGALeonardo Fonseca Reginato1,*, Lucas Gomes Pedroni2, André Luiz Martins Compan2, Rodrigo Skinner2,and Marcio Augusto Sampaio1
1Departamento de Engenharia de Minas e de Petróleo, Escola Politécnica, Universidade de São Paulo, Santos, SP 11013-560, Brasil2 Centro de Pesquisas Leopoldo Américo Miguez de Mello (CENPES), Petrobras S.A., Rio de Janeiro, RJ 21941-915, Brasil
Received: 22 September 2020 / Accepted: 7 December 2020
Abstract. Engineered Water Injection (EWI) has been increasingly tested and applied to enhance fluid dis-placement in reservoirs. The modification of ionic concentration provides interactions with the pore wall, whichfacilitates the oil mobility. This mechanism in carbonates alters the natural rock wettability being quite anattractive recovery method. Currently, numerical simulation with this injection method remains limited to sim-plified models based on experimental data. Therefore, this study uses Artificial Neural Networks (ANN) learn-ability to incorporate the analytical correlation between the ionic combination and the relative permeability(Kr), which depicts the wettability alteration. The ionic composition in the injection system of a BrazilianPre-Salt benchmark is optimized to maximize the Net Present Value (NPV) of the field. The optimization re-sults indicate the EWI to be the most profitable method for the cases tested. EWI also increased oil recovery byabout 8.7% with the same injected amount and reduced the accumulated water production around 52%, com-pared to the common water injection.
1 Introduction
Reservoir engineering seeks to manage the entire productivelife of the field. This requires using computational tools tofind the best strategy and to guarantee the highest NetPresent Value (NPV). Its simulation requires parameters,such as physical, chemical, petrophysical, extension, local-ization, and architecture. Thus, knowing these conditionsand considering economic scenarios, it is possible to decideon a better oil recovery method.
These numerical models seek to be the best real reser-voir representation, but often some information is disre-garded to enable the simulation, which generatesunreliable forecasting data to outline a successful strategyin the production of this field. According to Fabbri et al.(2020), one solution is to calibrate the simulation withexperimental work, but this can provide an increase in com-putational effort. Thus, it is ideal to use simulation toolsthat preserve its real characteristics, especially when com-bined with advanced production methods (Breitenbach,1991; Dake, 2015; Lie, 2012; Mustafiz and Islam, 2008).
Some oil recovery methods have gained attention, suchas Low Salinity Water Injection (also called SmartWaterflood (Saudi Aramco), Designer Water (Shell), LoSal(British Petroleum), and Advanced Ion Management
(ExxonMobil)). In general terms, Low Salinity Water Injec-tion (LSWI) is an enhanced technique in which the ionicconcentration control of injected water results in additionaloil recovery of the field (Dang et al., 2015). After intensivelaboratory research and field-scale tests with LSWI achievepositive responses, the method is currently accepted andapplied by major oil companies worldwide (Zhang et al.,2020).
This technique appears in one of the first surveys byBernard (1967), who observed a different oil recovery inthe tested samples, just varying the injected brine composi-tion. The author hypothesizes that this effect happens inthe interaction with freshwater and hydratable clay presentin sandstone samples. In 1998, Morrow et al. quantified theinfluence of brine composition in the wettability properties,using the spontaneous imbibition core test, beginning thediscussion on a multi-effect occurring during the water,oil, and rock interaction.
Other works confirm the LSWI as an appropriate appli-cation in carbonate reservoirs, in which the main effectreported was the reduction of the polar bond between car-boxylic compounds and rock minerals, increasing the porewall water adsorption (Fathi et al., 2011; Strand et al.,2006; Yousef et al., 2010; Zhang et al., 2007). Therefore,the control of potential ions (SO4
2�, Mg2+, and Ca2+)results in a modification of natural wettability characteris-tics. Thus, the Wettability Alteration (WA) to more* Corresponding author: [email protected]
This is an Open Access article distributed under the terms of the Creative Commons Attribution License (https://creativecommons.org/licenses/by/4.0),which permits unrestricted use, distribution, and reproduction in any medium, provided the original work is properly cited.
Oil & Gas Science and Technology – Rev. IFP Energies nouvelles 76, 13 (2021) Available online at:�L.F. Reginato et al., published by IFP Energies nouvelles, 2021 ogst.ifpenergiesnouvelles.fr
https://doi.org/10.2516/ogst/2020094
REGULAR ARTICLEREGULAR ARTICLE

water-wet conditions is a crucial parameter to decrease theresidual oil saturation (Hirasaki et al., 2004; Saikia et al.,2018; Seethepalli et al., 2004; Webb et al., 2004). Zaheriet al. (2020) perform coreflooding analysis with carbonatesusing LSWI. They observed a relation between higher cal-cium content in formation water and a more oil-wet condi-tion. They also noted the calcium concentration reductionand the sulfate presence affected the ultimate oil recovery.
According to Adegbite et al. (2017), wettability alter-ation is the main reason for incremental oil recovery byLSWI in carbonate reservoirs. Also, they suggest a new ten-dency to adapt the original ionic composition with a highersalinity range for each application. Through this concept,an update in the LSWI was generated, called EngineeredWater Injection (EWI). Following the same hypothesis ofthe predecessor method, the differences are in raising thesalinity limits, enabling to use higher ions concentrations.
Regarding the EWI method, a number of researches usean experimental approach to replicate the flow conditions inthe reservoir and to determine the fundamental mechanismpresent in the analysis. Several works classify the effect ofwettability alteration, fines migration, Multi-componentIonic Exchange (MIE), pH modification, effect salt-in, con-tact angle measurement, electrical double layer and interfa-cial tension as the main effects (Bidhendi et al., 2018; Danget al., 2016; Ghosh et al., 2016; Jerauld et al., 2006; Xiaoet al., 2018). According to different authors, it is possibleto represent wettability alteration through changes in therelative permeability curves (Fathi et al., 2011; Reginatoet al., 2019; Yousef et al., 2011). Wettability alteration isextensively investigated to understand the influence in theoil and water behavior, being directly relevant to themacroscopic relative permeability (Zhang et al., 2020).
The combination of these main mechanisms in EWI hasa complex numerical background, making rare the develop-ment of analytical models capable of depicting this injectionscheme. Therefore, it was common to use a simple relation-ship as a linear function among salinity, relative permeabil-ity, and capillary pressure (Dang et al., 2013). To enhancethis modeling, researchers of the Computer Modelling Group(CMG), the University of Calgary and University of Texasat Austin developed a new complete approach that trans-lated some present mechanisms of LS injection, using someexperimental results as input data to perform the simula-tions (Dang et al., 2016). The authors sought to couplesome equations from exclusively geochemical software to acompositional flow simulator. Even knowing the numericallimitations, the authors proposed to validate this couplingby comparing the results of experimental injections in acoreflooding system (Fjelde et al., 2012). This test obtainedquite significant results in this coupling to the flow simula-tor. Another aspect of the existing models for LSW/EWIsimulation is a simplistic assumption whose change in wet-tability implies only in the modification of two-phase flowparameters (Bourbiaux, 2020).
In most cases, the specific parameters required by simu-lation software to model the EWI are unknown, whichmakes this analytical tool useless without an initial experi-mental analysis. Thus, to provide an alternative to modelthis advanced injection with the absence of a laboratory
data source, our study performs the training of a machinelearning tool called Neural Net Fitting (NNF) that can reli-ably predict wettability changes considering a given salinitycombination and relative permeability set in numerical sim-ulation scale.
Moreover, we carry out an NPV maximization in a casestudy benchmark called UNISIM-II (Correia et al., 2015).The ionic concentration of water injected is optimized bythe Fast Genetic Algorithm (FGA), which provides the eco-nomic analysis of EWI and common water injection.
2 Methodology
As this work was performed only in a computational envi-ronment, it was necessary to use synthetic information tocompose the database for future neural network training;therefore, some templates provided by CMG� wereselected. We simulated these templates using EWI geo-chemical modeling with different salinity for each casethrough conventional software (compositional simulator).After that, a specific algorithm (Kr-Module) adjusted theinitial relative permeability curves of a regular template un-til obtaining the same production simulation with geochem-ical modeling. The database generated was composed of theoriginal Kr and corresponding salinity case as input and thenewfound Kr curve as output, starting the network devel-opment. At the training stage, we tested different networkpatterns up to the maximum forecasting quality, based onstatistical tools. The network provided a new Kr curvethrough the original curve and a given salinity. Then, wecoupled the best neural network to the simulation, perform-ing the validation by comparing the production outcomebetween the geochemical simulation (modeled in theCMG software) and the ANN.
Finally, ensuring the reliable application of the neuralnetwork, we coupled it to the optimization phase with theFast Genetic Algorithm (FGA) to maximize the profitsconsidering a range of costs, concluding the workflow(Fig. 1).
2.1 Conventional EWI modeling and simulation
Both modeling ways (geochemical EWI and coupled byANN) use the CMG software for simulation. The softwarerequires informing the initial geochemical conditions ofthe EWI, such as the modeling method, the formationwater salinity, the geochemical reactions considered androck mineralogy. All the simulated cases keep the sameinput parameters, assigning the injection salinity as theonly change agent in the production outcome.
2.2 Database for neural network training
The database consists of 19 synthetic reservoir modelsselected from the CMG collection, from which the similaritywith carbonate petrophysics and the possibility to apply theEWI modeling were the criteria to choose on thesetemplates. Some of these are based on the SPE comparativesolution project, which are generic benchmarks developed
L.F. Reginato et al.: Oil & Gas Science and Technology – Rev. IFP Energies nouvelles 76, 13 (2021)2

through experimental data and used to compare simulationperformance or practice the functions of the software. Theirparticularities were also maintained, such as the wells posi-tion, flow rates, grid size, oil composition, and others, for abetter network generalization, so that the results used intraining were comprehensive in the reservoir configuration.Each template received the EWI modeling 15 times withrandom salinity, totalizing 285 cases. We defined the data-base structure with original Kr curves, their correspondingsalinity, and the new Kr curve produced from conventionalEWI. However, the commercial software becomes limited inthe initial Kr curves and does not provide the state of thecurve after the simulation. Thus, to generate this informa-tion, we developed the algorithm called Relative Permeabil-ity Module. This code aims to minimize the error betweenproductions of the same template with and without EWImodeling, assigning adjustments to the Kr model curvewithout EWI to reduce this error (Fig. 2). In practice, theKr-Module adjusts the relative permeability of the modeluntil the production result with the altered Kr curve beequal to the EWI. Thus, the new Kr correlates with the pro-duction change simulated by the EWI method and itssalinity used.
This module was coupled with the Fast Genetic Algo-rithm (Sampaio et al., 2015) but adapted to minimize theerror between the expected and simulated production out-comes, as shown in Figure 3. The algorithm inspiration isthe evolution of a population through the generations (asin natural selection) using crossover and mutation untilachieving the best solution (elite individual); in this case,it is the result with a minimum of the normalized MeanSquared Error (nMSE). Thus, the code requires the numberof generations and quantities of individuals for generationsto run. This code presents improvements in its solutionspeed, working with advanced modules and enhancing the
simple crossover, parent selection, and evaluation functiontypes.
Recursively, the algorithm performed the adjustmentsto each specified model, saving its results in the database.We also converted the Kr curve into Corey equation param-eters (Eqs. (1) and (2)), establishing as input the originalKr-Corey parameters, their corresponding potential ionconcentration and output the changed Kr-Corey parame-ters (Fig. 4). This Kr curve transformation was necessaryfollowing the network-training criteria to reduce repeateddata. The dataset parameters were selected to achieve thebest of the neural network training. Therefore, the initialconditions (Swc and Kro at Swc) of multiple reservoir typeswere included in order to contribute to the improvement inthe ANN performance.
Thus, the number of input parameters was equal to 12with 8 for the Corey equation, 3 to salinity concentration,and 1 to salt interpolator. The output corresponded to 8from the Corey equation. Brooks and Corey (1964) devel-oped the equations below to allow calculating the perme-ability of a fluid at a given saturation that the medium isat the reference fluid:
kro ¼ krocw1� Sw� Sor1� Scw� Sor
� �no
; ð1Þ
krw ¼ krworSw� Swcrit
1� Swcrit� Sor
� �nw
; ð2Þ
where equation (1) is for oil relative permeability andequation (2) for water relative permeability of Coreyformulation.
The parameters used in the network training are:
� Krocw – Relative permeability of oil with connatewater condition;
� Krwor – Relative permeability of water in oil residualcondition;
� Sw – Water saturation;� Sor – Residual oil saturation;� Scw – Connate water saturation;� Swcrit – Critical water saturation;� No – Corey exponent of oil;� Nw – Corey exponent of water.
2.3 Neural net fitting features
The best ANN following the MATLAB� applications forprediction purposes was the Neural Net Fitting (NNF) thatcan solve the data fitting problem using a simple architec-ture named feedforward. Mohaghegh (2000) defined thefeedforward network as a set of neurons grouped in layers,where they usually consist of an input layer, hidden layerand output layer, as shown in Figure 5. The number of in-put neurons is equal to the number of parameters presentedto the network; this also happens in the output layer, andthe hidden layer can vary in neurons or layers. This inter-connected system and composed of neurons works in three
Fig. 1. Workflow of the general methodology.
L.F. Reginato et al.: Oil & Gas Science and Technology – Rev. IFP Energies nouvelles 76, 13 (2021) 3

main steps: multiplication, sum and activation. The neuronmultiplies each input data with its respective weight, sumsthese results, and uses a filter called the Activation Func-tion (Strik et al., 2005).
This ANN uses a supervised learning method, whichgenerally performs its training process combining the inputdata with the output (or labels), facilitating the creation ofregression or classification, and indicating a quantitativerelationship between them. Yet the limitation is that the
training database needs to be complete, without missingdata (Ghahramani, 2004; Rajasekaran and Pai, 2017;Shobha and Rangaswamy, 2018; Talabis et al., 2015).
Another important aspect of configuring the network isits training algorithm, for which we opted for the BayesianRegularization (BR). We performed some training testswith the other methods available, but both these resultsand theoretical concepts of the BR method converged toits use. This method is a mathematical process to adapt a
Fig. 2. Relative Permeability Module procedure.
Fig. 3. Workflow of Relative Permeability Module coupled to FGA algorithm.
L.F. Reginato et al.: Oil & Gas Science and Technology – Rev. IFP Energies nouvelles 76, 13 (2021)4

nonlinear regression to statistical problems (well-posed).The robustness of the model minimizes the effect of over-training or overfitting and has an Automatic RelevanceDetermination (ARD). The ARD calculates the relevancefor each input parameter, neglecting the irrelevant or highlycorrelated indexes (Burden and Winkler, 2008). The Baye-sian Regularized ANN (BRANNs) incorporates probabilis-tic interpretation into the regularization scheme. Theregularization is a method to penalize the highest and thesmallest weight in the neuron network and to ensure thebest generalization (Kayri, 2016). According to theMATLAB� guide, this BRANNs algorithm is slower inlearning because at each learning epoch, the algorithm per-forms the relevance analysis, reducing the training speedbut conserves the quality of the forecast, being ideal intraining cases with a low number of samples, a high numberof variables and non-linearity.
We also carried out another training test looking for thenumber of neurons in the hidden layer that would guaran-tee the maximum forecasting quality. We tested five differ-ent configurations (12, 15, 17, 20, and 25), and the resultswith 15 neurons in the hidden layer showed the best perfor-mance. All training followed a cross-validation process withthe same configuration (70% of the data for training, 15%for validation and 15% for testing); 30 samples of theUNISIM-II case study (Correia et al., 2015) were generatedto serve as a second validation of each network test, using
the error between the expected and predicted result as aquality analysis. Thus, the best network was called“Net15_BR”.
2.4 FGA and NNF coupling
To assess the economic attractiveness of EWI, we carriedout a process of production optimization aiming at maxi-mizing the NPV. We conducted a first optimization ofthe operational variables of the wells (injection/productionflow rate and pressure) with common water injection, con-sidering the economic scenario of the benchmark used.Next, we performed the optimization of the same model,using EWI; in this case, variables of wells, the ion concen-trations, and the interpolator were added as optimizationparameters. Thus, it was possible to compare which injec-tion method would yield the highest profit and what theoptimized ion configuration would be.
As a tool for optimization, the original Fast GeneticAlgorithm (Sampaio et al., 2015) was used, applied in thisstage to maximize the NPV field. The best-trained networkwas coupled to the optimization, adding a step to the FGAcode with the salinity concentration and interpolator ion asdecision variables. This routine also extracted the originalKr curve from the corresponding model optimized, trans-forming it into Corey parameters and organizing with thechosen salinities, giving these data to the neural network
Input Parameters Output Parameters
No Nw Sorw Scw … SO42- Mg2+ Ca2+ No Nw Sorw Scw …
Tpl-1 EW1 3.4 2.3 0.7 0.2 … 9783 8744 2376 3.2 2.0 0.6 0.3 …
Tpl-1 EW2 2.5 4.3 0.5 0.1 … 3265 6431 3489 1.3 3.5 0.8 0.1 …
… … … …. … … … … … … … … … …
Tpl-1 EWn 3.1 3.7 0.9 0.17 … 4354 9822 3245 2.5 3.1 0.7 0.2 …
Fig. 4. Illustrative structure of the database for ANN training separated into input and output data.
Fig. 5. Architecture of feedforward network, (a) input layer; (b) hidden layer, and (c) output layer.
L.F. Reginato et al.: Oil & Gas Science and Technology – Rev. IFP Energies nouvelles 76, 13 (2021) 5
“Net15_BR”, which provided the new Kr curve. In general,this coupling was necessary to predict the new Kr curve at agiven ionic concentration defined by the optimization pro-cess, inserting this curve in the corresponding model beforethe simulation stage.
3 Case studies
3.1 Engineered water conventional simulation features
As previously mentioned, it is necessary to preset of thesalinity composition of the formation water, mineralogiccontent, the geochemical reactions, and the modelingmethod to perform the simulation with EWI. Thus, to sim-plify the modeling method, we select the interpolator ionmethod and its salinity range (Tabs. 1 and 2).
These settings were defined arbitrarily, as the formationwater composition had about 35 000 ppm of total salinity,composed basically of Na+ and Cl�. For mineral concentra-tions, we set 50% dolomite and calcite, according to the pat-tern found in most carbonates.
Each template selected for constructing the databasegenerated 15 new cases of EWI geochemical modeling, withrandom salinity ranging from 1000 to 9999 ppm and consid-ering the same configurations on the formation water andmineralogical content shown above (Tabs. 1 and 2). Inevery five cases with EWI, the alteration in the potentialinterpolation ion (between SO4
2�, Mg2+, and Ca2+) was de-fined, increasing the diversity of ionic combinations andtheir corresponding effects. Finally, with all the 19 tem-plates with 15 EWI random salinity cases created, we sim-ulated these 285 samples and extracted the required datafor the next step in the training network. With the datain Tables 1 and 2 kept the same for all tested models,changes in production are attributed exclusively to differentionic combinations. That allows the correlation between thenew Kr data via Kr-Module with the corresponding salinityused in each model.
The fluid model was composed of seven components(Cl�, SO4
2�, Ca2+, Mg2+, HCO3�, Na+, H+), and rock con-tained two minerals (Calcite and Dolomite). Four aqueous
phase reactions to describe the ionic interactions in the geo-chemical simulation were included:
HSO�4
� � $ Hþð Þ þ ðSO42�Þ; ð3Þ
CaClþð Þ $ Ca2þ� �þ Cl�ð Þ; ð4Þ
MgClþð Þ $ Cl�ð Þ þ Mg2þ� �
; ð5Þ
NaSO�4
� � $ Naþð Þ þ SO42�� �
; ð6ÞThese reactions were selected, respecting the main interac-tions between the NaCl and the three potential ions. Themineral phase reactions that incorporate the Calcite andDolomite dissolution and precipitation are shown below:
CaCO3ð Þ þ Hþð Þ $ Ca2þ� �þ HCO3ð Þ; ð7Þ
CaMg CO3ð Þ2� �þ 2 Hþð Þ $ Ca2þ
� �þ 2 HCO�3
� �þ Mg2þ� �
: ð8ÞAccording to Dang et al. (2015), the difference between thecomposition of the in-situ and injected water disrupts theinitial geochemical conditions, so the chemical equilibriumreactions calculate the behavior of these salts in each reser-voir cell. On the other hand, the wettability alteration mod-eling occurs through shifting in the relative permeabilitycurves, and the controller of this adjustment in the curvesis the ion compositions obtained through these equilibriumreactions. Thus, this ionic balance in each cell allows a moreprecise adjustment in the relative permeability curves, con-sidering the variation in salinity in different regions of themodel.
3.2 Optimization settings
At the optimization stage, a decision criterion was neces-sary for the algorithm to select an interpolator ion as anadjustable variable defining a chosen range of between 1and 3, and the algorithm was specified as shown in Table 3.
Table 1. Parameters for modeling EWI in the simulator.
EWI parameters for simulator
Kr interpolationbegin (ppm)
Kr interpolationend (ppm)
Sets ofinputs
Sor reduction(Sor-EW/Sorw)
Krw reduction(Kr-EW/Krw)
700 200 2 0.6 0.75
Table 2. Ionic concentration of water injection and mineral percentual range.
Formation watersalinity (ppm)
Formation mineralconcentration
pH Cl� SO42� Ca2+ Mg2+ HCO3� Na+ Calcite Dolomite
7 17 500 100 100 100 100 17 500 0.5 0.5
L.F. Reginato et al.: Oil & Gas Science and Technology – Rev. IFP Energies nouvelles 76, 13 (2021)6

The algorithm thus selected the value within the range,and automatically transformed that number into the equiv-alent potential ion.
After the successful coupling of the neural network tothe FGA, the initial parameters of the optimizations wereconfigured (Tab. 4). We performed a series of tests, settingthe maximum number of 200 individuals in theoptimizations.
3.3 UNISIM-II benchmark
The case study selected in this work was the UNISIM-II,developed by the Unisim group from Unicamp (Correiaet al., 2015). The model structure combines the BrazilianPre-salt and Ghawar fields, providing the description ofan economic scenario as well. The dimension of this carbon-ate reservoir model is 5000 � 5000 � 150 m and composedof 16 faults. Each grid cell has 50 � 50 � 1 m, with a thinsuper-k zone. Further field information is:
� Depth of reservoir between 5000 and 5500 m from thesea level
� Initial reservoir pressure 560 kgf/cm2
� Intermediate-wet relative permeability� Live oil viscosity to 1.14 cP� Reservoir temperature equal to 58.8 �C.
The benchmark determines operational boundaries forinjection and production wells (Tab. 5), used as upperand lower limits in the well optimization step.
To minimize the simulation time, we reduced the reser-voir size selecting a section with 6 � 6 � 30 cells (Fig. 6)chosen in a representative location, that preserves its archi-tecture and behaviors. We also implemented one verticalinjection well with a quarter of the area open to flow inthe corner of this cut model, and a production well withthe same condition in the opposite corner. The layout ofthe wells follows the injection pattern with a quarter offive-spot configuration, with a 450 m distance betweenthem.
The deterministic approach of the benchmark used con-tains its economic scenario (Tab. 6), which updated the gascost and price based on the US natural gas price. Followingthe indications in the model description, we calculated theinvestment cost in the platform using the below equationpresented by Hayashi (2006) (see Eq. (9)). We consideredthe maximum wells capacities of a quarter of the givendescription, adjusting this investment to the settingsdefined for the cut model.
INVPLAT ¼ 417þ ð13:2� Cpo þ 3:2
� Cpl þ 3:2� Cpwþ3:2Ciw þ 0:1� nwÞ: ð9ÞGiven that:
� INVPLAT: Investment on the platform (USD millions)� Cpo: Oil processing capacity (1000 m3/day)� Cpl: Liquid processing capacity (1000 m3/day)� Cpw: Water processing capacity (1000 m3/day)� Ciw: Water injection capacity (1000 m3/day)� nw: Well’s number.
Table 3. Range defined for the algorithm chosen betweeneach interpolator ion.
Definition of Ion Interpolator
SO42� Between 1 and 1.5
Ca2+ Between 1.6 and 2.5Mg+ Between 2.6 and 3
Table 4. Parameters for optimization with FGA.
Fast genetic algorithm parameters
Number of generations 20Population size 10Elite individuals 1Crossover rate 0.8
Table 5. Operational well conditions, adapted by Correiaet al., (2015).
Type Verticalproducer
Verticalinjection
Max. water rate(m3/day)
– 5000
Min. oil rate (m3/day) 20 –
Max. liquid rate(m3/day)
2000 –
BHP (kgf/cm2) Min 190 Max 350
Fig. 6. Cut model from UNISIM-II-D, showing the porosityparameter.
L.F. Reginato et al.: Oil & Gas Science and Technology – Rev. IFP Energies nouvelles 76, 13 (2021) 7

4 Results and discussion
In this section, we divided the results into two parts. First,we approached the quality of neural network predictionbased on statistical tools (nMSE). We then compared theoptimization results, evaluating the final profit with theinjection of seawater and EWI, the wells conditions, andthe optimum salinity solution. We also optimized four casesof EWI varying only the cost of this engineered water injec-tion, which showed its influence on the profits and on theoptimized ion composition.
4.1 Validation of network predictions
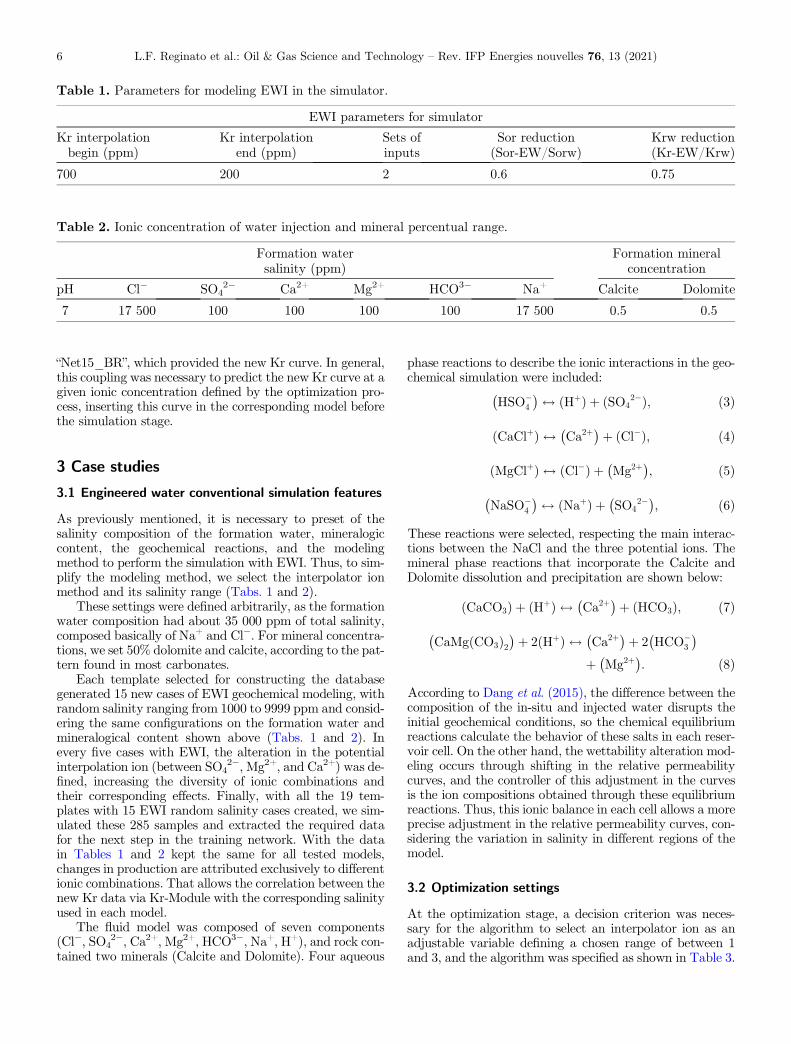
We tested different neural network configurations to guar-antee the best performance. We compared five sizes ofhidden layers with two distinct training algorithms(Fig. 7). According to the theory, the training method ofBayesian Regularization (BR) is more indicated due to itsdata configuration, even so, we tested the training withthe Levenberg-Marquardt (LM) algorithm to ensure that.
In Figure 7, the comparison uses the data generatedspecifically for validating the networks already trained withthe 30 cases of random salinity from the UNISIM-II model.Note that these data are not used in the training of the neu-ral network, proving its ability to predict and to generalizethrough the normalized Mean Squared Error (nMSE). ThenMSE shows that the closer to zero, the more similar theforecast result is than the expected value. Thus, based onnMSE, the neural network that obtains the best result isthe one with 15 neurons in the hidden layer (Net15_BR).We noted that the variation between the nMSE with each
training algorithm is not sharp, but this difference generatesdivergence in the production simulation because the Kr hashigh sensitivity in the software, making it essential to usethe network with the best performance.
It was possible to confirm the benefits of using the BRnetwork with the determination of relevance (ARD) androbust regularization (Fig. 7). The absence of that in theLM algorithm impaired its training, which achieved highlearning speed; but in these conditions, the regularizationeffort by BR is compensated with a better forecast.
The Net15_BR was coupled to the simulator to forecastKr curves at a given salinity of the water injection, and westarted to investigate the quality of this approach in pro-duction simulation. Thus, using the UNISIM-II model andits 30 test cases, we compared the production resultbetween geochemical EWI modeling of GEM simulatorand the ANN approach, following the same salinity compo-sitions as the test models. The nMSE was applied to quan-tify the similarity in the oil and water production curvesbetween these two schemes for EWI modeling (Fig. 8).The comparison of results shows a satisfactory quality inthe replacement of the geochemical modeling CMG packagewith the neural network, which was able to reproduce sim-ilar behaviors in the production simulation through onlychanges in Kr. The mean of the nMSE for the 30 cases com-pared in the analysis was mean-nMSE of oil equal to 0.0528and mean-nMSE of water equal to 0.1189, with satisfactoryresults of the simulation performance coupling the ANN,enabling its use at the optimization stage.
Figure 9 displays a plot referring to model 14, one of thecases with values closer to the average of the tested models.We plot with production histories generated between the
Table 6. Economic scenario used in the optimization study.
Variables Values
Oil price 54.76 US$/STBGas price 0.70 US$/STB
Costs (US$/stb)Oil production 10.952Gas production 0.4675Water production 1.1Engineered water injection 1.98Water injection 1.1
Investments (US$ millions)Drilling and completion vert. well 22.8/mConnection vertical well-platform 13.3Platform Equation (9)
Fiscal Tax (%)Royalties 10Social taxes rate 9Income tax 25PIS1 1.65COFINS1 7.61 PIS and COFINS are specific Brazilian taxes.
L.F. Reginato et al.: Oil & Gas Science and Technology – Rev. IFP Energies nouvelles 76, 13 (2021)8
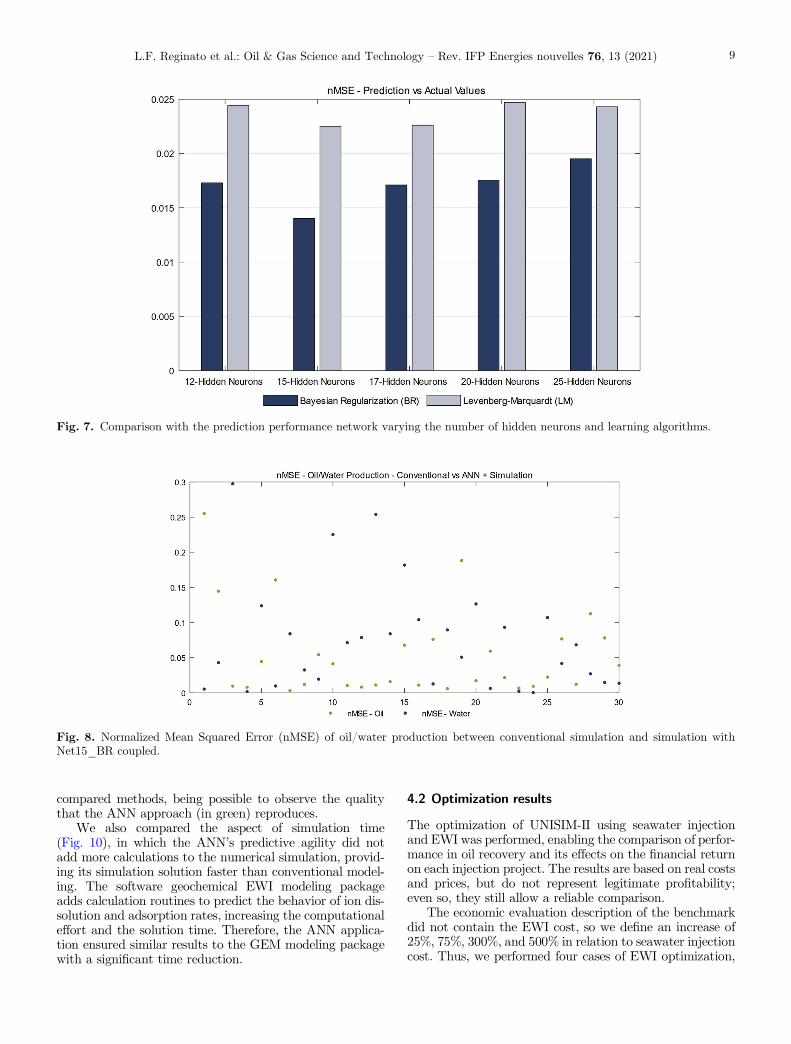
compared methods, being possible to observe the qualitythat the ANN approach (in green) reproduces.
We also compared the aspect of simulation time(Fig. 10), in which the ANN’s predictive agility did notadd more calculations to the numerical simulation, provid-ing its simulation solution faster than conventional model-ing. The software geochemical EWI modeling packageadds calculation routines to predict the behavior of ion dis-solution and adsorption rates, increasing the computationaleffort and the solution time. Therefore, the ANN applica-tion ensured similar results to the GEM modeling packagewith a significant time reduction.
4.2 Optimization results
The optimization of UNISIM-II using seawater injectionand EWI was performed, enabling the comparison of perfor-mance in oil recovery and its effects on the financial returnon each injection project. The results are based on real costsand prices, but do not represent legitimate profitability;even so, they still allow a reliable comparison.
The economic evaluation description of the benchmarkdid not contain the EWI cost, so we define an increase of25%, 75%, 300%, and 500% in relation to seawater injectioncost. Thus, we performed four cases of EWI optimization,
Fig. 7. Comparison with the prediction performance network varying the number of hidden neurons and learning algorithms.
Fig. 8. Normalized Mean Squared Error (nMSE) of oil/water production between conventional simulation and simulation withNet15_BR coupled.
L.F. Reginato et al.: Oil & Gas Science and Technology – Rev. IFP Energies nouvelles 76, 13 (2021) 9

varying only the water injection price with salinity control,adding to the analysis the changes in ion composition gen-erated by differences in its cost.
The results of the variables of wells, ionic concentration,the ion interpolator, and corresponding maximum NPV foreach optimization case are displayed in Table 7. Notice thepressure of wells and flow conditions are similar in all theoptimized cases, assigning the injection salinity in NPV
changes. Also, three cases of EWI (25%, 75% and 300%)had higher profits than the common water (seawater) injec-tion, indicating that the advanced method is potentiallymore profitable considering a margin of up to 300% increasein the injection cost.
When compared the results of accumulated production/injection fluids between the methods used (Tab. 8), the oilrecovery increases by about 8.7% with EWI; the injected
Fig. 9. Simulation results, comparing the traditional EW simulation and simulation with Net15_BR relative permeability results.
Fig. 10. Simulation time comparison between the ANN coupling solution and conventional geochemical modeling.
Table 7. Optimization results for each adjusted variable in the common water injection and engineered salinity.
Case INJ-rate INJ-press PRD-rate PRD-press Ca2+ SO42� Mg2+ EW-mod NPV DNPV
m3/day kPa m3/day kPa (ppm) (ppm) (ppm) (MMUS$) (MMUS$)
Water 4988.29 33 919.73 1996.66 17 943.14 – – – – $16.95 –EW-25 4866.87 33 087.09 1961.96 17 353.35 7127.23 5420.62 1033.83 3 $66.57 $49.62EW-75 4940.44 33 591.59 1982.98 17 710.71 7333.23 6627.23 1975.58 3 $58.54 $41.60EW-300 4975.48 33 831.83 1992.99 17 880.88 8931.33 8038.64 739.54 3 $24.69 $7.74EW-500 4898.4 33 303.3 1970.97 17 506.51 8715.52 8401.6 1661.66 3 $8.22 �$8.73
L.F. Reginato et al.: Oil & Gas Science and Technology – Rev. IFP Energies nouvelles 76, 13 (2021)10

Table 8. Fluids production/Injection and oil recovery factor in the optimum cases.
Case Oil produced (105 m3) Water produced (105 m3) Water injection (105 m3) Oil recovery factor (%)
Water 15.61 19.19 39.63 37.74EW-25 19.66 9.45 36.38 47.53EW-75 19.58 8.61 35.66 45.35EW-300 18.30 10.64 35.25 44.22EW-500 19.06 7.96 34.59 46.07
Fig. 11. Ionic concentration of water injection obtained by the optimization process.
Fig. 12. Relative permeability of engineered water optimized versus normal relative permeability.
L.F. Reginato et al.: Oil & Gas Science and Technology – Rev. IFP Energies nouvelles 76, 13 (2021) 11
volumes are maintained close, and the water production isreduced by around 52%, saving this cost and improvingthe injection performance through ionic calibration. Insum, more oil was recovered with the same injectionamount, and more water remained in the reservoir.
The optimized salinities (Fig. 11) show the sulfate andcalcium with higher concentrations, increased their quanti-ties with rising cost. All four EWI cases show Ca2+ as theinterpolator ion (Tab. 7), but this does not minimize theeffect of the other salts, which in this application changeswith their different combinations, considering multipleinfluences between them.
This step shows the optimized concentrations are notlow, reinforcing that to improve the projected water injec-tion technology requires exploration with a higher rangeof ion concentrations considering their technical and eco-nomic viability. As pointed by Adegbite and Al-Shalabi(2020), the low salinity levels bring benefits in most injec-tion cases. On the other hand, its optimization can convergeto a more concentrated use of some ions, showing a greaterversatility of the EWI technique.
Finally, we plot the relative permeability curves of theoriginal case, EW-25, and EW-500 (Fig. 12), analyzingthe changes that the ionic compositions produced. Weobserved an increase in the Kr-Oil curve values and areduction in Kr-Water with the proposed ionic concentra-tions when compared with the original case. The EWI hasthe potential to increase the difference between connateand critical water saturation due to changes in the oil flow.The Kr-Oil with EWI had lower saturation points of con-nate water than the original case, reinforcing this expectedeffect by the injection method. An increase occurs at theendpoint on the Kr-Oil curve with EWI, indicating a higherfinal water saturation, with a consequent reduction in resid-ual oil saturation. Analyzing Figure 12 based on thechanges in Sor and the shape of the Kr-Oil curve, wenoticed an oil mobility modification by the optimized ionicinjection, which resulted in a direct impact on the behaviorof oil production and on the injection/production water.These comparisons indicate a change in the natural wetta-bility of the rock preferential to water (more water-wet),corroborating the theories approached for the injectionmethod.
5 Conclusion
In this article, we developed a feedforward neural networkthat performed changes in the relative permeability datagiven an ionic condition, having the potential to reproducethe same effects in the numerical simulation, consideringthe EWI geochemical modeling of the CMG software. Thedevelopment of ANN underwent practical tests to defineits configurations, such as the number of neurons in the hid-den layer and the choice of the training algorithm, based onthe forecast quality (nMSE around 0.0137) that reached thebest results with Net15_BR. At this stage, several theoret-ical concepts were applied, showing that the nature andamount of data used require practical tests to guaranteethe best performance of the tool. When coupling the neural
network trained in the simulation software, we comparedits numerical simulation with the results from the conven-tional method of EWI modeling, ensuring a reliable out-come with this new modeling strategy. We also comparedthe simulation time between these methods, in which theneural network is fast to predict the necessary adjustmentsto Kr, not increasing new calculations to the productionsimulation, unlike geochemical modeling, thus reducingthe simulation time by an average of 90%. The UNISIM-II benchmark and its economic scenario provided the opti-mization of seawater injection and EWI. At this step, theNPV of the field was maximized using the flow and pressureconditions of the wells and the salinity of the water injection(in the case with EWI) as adjustable variables. The resultsshowed that the injection with EWI had a positive effect onthe final production profit, with an increase of 49.62 milliondollars (without considering additional Capex due to EWIimplementation). We compared the accumulated produc-tion, in which the projected water injection increased oilrecovery by about 8.7% with the same injected amountand reduced the accumulated water production by around52%, compared to the seawater injection. EWI avoidedexcessive water production and increased the volume ofoil recovered. The EWI-500 (500% base value increase) caseis the only that has NPV less than seawater injection; thisguarantees the application of the advanced method with ahigh-cost margin. We emphasize that although the eco-nomic attributes used are reliable, they do not represent areal production scenario, which certainly has other invest-ments and revenues considered. The optimization resultsconverged to use higher concentrations of sulfate and cal-cium, showing the importance of investigating the injectionwith a higher salinity range, but respecting the technical oreconomic limits. The increase in the Kr of the oil, reductionin the Kr of the water, and a decrease in the residual oil sat-uration confirmed the Kr changes to more water-wet condi-tions. These results in Kr corroborate other studies appliedto the EWI method, reinforcing the advantages of control-ling salinity for managing fluids displacement in thereservoir.
Acknowledgments. The authors would like to thank LASG(Laboratory of Petroleum Reservoir Simulation and Manage-ment), InTRA (Integrated Technology for Rock and FluidAnalysis) and Escola Politécnica of the Universidade de SaoPaulo. This work was conducted with the ongoing Projectregistered as “Projeto de Molhabilidade e Propriedades Petrofísi-cas de Rochas Carbonáticas e sua Relação com a Recuperação deHidrocarbonetos” (USP/Petrobras/ANP) funded by Petrobras,under the ANP R&D levy as “Compromisso de Investimentoscom Pesquisa e Desenvolvimento”. The authors would also liketo thank FAPESP (the State of São Paulo Research Foundation),and CMG� and MATLAB� for software licenses.
References
Adegbite J.O., Al-Shalabi E.W., Ghosh B. (2017) Modeling theeffect of engineered water injection on oil recovery fromcarbonate cores, in: SPE International Conference on OilfieldChemistry, Society of Petroleum Engineers, pp. 1–33.https://doi.org/10.2118/184505-MS.
L.F. Reginato et al.: Oil & Gas Science and Technology – Rev. IFP Energies nouvelles 76, 13 (2021)12

Adegbite J.O., Al-Shalabi E.W. (2020) Optimization of engi-neered water injection performance in heterogeneous carbon-ates: a numerical study on a sector model, J. Petrol. Explor.Prod. Technol. 10, 3803–3826. https://doi.org/10.1007/s13202-020-00912-6.
Bernard G.G. (1967) Effect of floodwater salinity on recovery ofoil from cores containing clays, in: Society of PetroleumEngineers – SPE California Regional Meeting, CRM.https://doi.org/10.2523/1725-ms.
Bidhendi M.M., Garcia-Olvera G., Morin B., Oakey J.S., AlvaradoV. (2018) Interfacial viscoelasticity of crude oil/brine: An alter-native enhanced-oil-recovery mechanism in smart waterflooding,SPE J. 23, 03, 0803–0818. https://doi.org/10.2118/169127-pa.
Bourbiaux B. (2020) Low salinity effects on oil recoveryperformance: underlying physical mechanisms and practicalassessment, Oil Gas Sci. Technol. - Rev. IFP Energiesnouvelles 75, 37. https://doi.org/10.2516/ogst/2020030.
Breitenbach E.A. (1991) Reservoir simulation: State of the art,J. Petrol. Technol. 43, 09, 1033–1036.
Brooks R.H., Corey A.T. (1964) Hydraulic properties of porousmedia, Hydrology Papers, no. 3, Colorado State University.
Burden F., Winkler D. (2008) Bayesian regularization of neuralnetworks, Methods Mol. Biol. 458, 25–44.
Correia M., Hohendorff J., Gaspar A.T.F.S., Schiozer D. (2015)UNISIM-II-D: Benchmark case proposal based on a carbonatereservoir, in: SPE Latin American and Caribbean PetroleumEngineering Conference Held in Quito, Ecuador 1, 18–20.https://doi.org/10.2118/177140-ms.
Dake L.P. (2015) Fundamentals of reservoir engineering,Elsevier, Netherlands, pp. 1–498. https://doi.org/10.1016/B978-0-08-098206-9.00004-X.
Dang C., Nghiem L., Nguyen N., Chen Z., Nguyen Q. (2015)Modeling and optimization of low salinity waterflood, in: SPEReservoir Simulation Symposium, Houston, Texas, USA, pp.1–10. https://doi.org/10.2118/173194-ms.
Dang C., Nghiem L., Nguyen N., Chen Z., Nguyen Q. (2016)Mechanistic modeling of low salinity water flooding, J. Petrol.Sci. Eng. 146, 191–209. https://doi.org/10.1016/j.petrol.2016.04.024.
Dang C.T.Q., Nghiem L.X., Chen Z.J., Nguyen Q.P. (2013)Modeling low salinity waterflooding: Ion exchange, geochem-istry and wettability alteration, in: SPE Annual TechnicalConference and Exhibition, New Orleans, Louisiana, USA,pp. 1–22. https://doi.org/10.2118/166447-ms.
Fabbri C., de-Loubens R., Skauge A., Hamon G., Bourgeois M.(2020) Effect of initial water flooding on the performance ofpolymer flooding for heavy oil production, Oil Gas Sci.Technol. - Rev. IFP Energies nouvelles 75, 19. https://doi.org/10.2516/ogst/2020008.
Fathi S.J., Austad T., Strand S. (2011) Water-based enhancedoil recovery (EOR) by “smart water”: Optimal ionic compo-sition for EOR in carbonates, Energy Fuels 25, 11, 5173–5179.https://doi.org/10.1021/ef201019k.
Fjelde I., Asen S.M., Omekeh A.V. (2012) Low salinity waterflooding experiments and interpretation by simulations, in:SPE Improve Oil Recovery Symposium, Tulsa, Oklahoma,USA, pp. 1–22. https://doi.org/10.2118/154142-ms.
Ghahramani Z. (2004) Unsupervised Learning, in: AdvancedLectures on Machine Learning: ML Summer Schools 2003,Springer, Berlin Heidelberg, pp. 72–112. https://doi.org/10.1007/978-3-540-28650-9_5.
Ghosh B., Sun L., Osisanya S. (2016) Smart-water EOR madesmarter a laboratory development, in: International Petro-
leum Technology Conference, Bangkok, Thailand, pp. 1–13.https://doi.org/10.2523/18988-ms.
Hayashi S.H.D. (2006) Value of flexibility and information infield development by modules, Master Thesis, Faculty ofMechanical Engineering, State University of Campinas, 138 p.(in Portuguese).
Hirasaki G., Zhang D.L., Rice U. (2004) Surface chemistry of oilrecovery from fractured, oil-wet, carbonate formations, in:International Symposium on Oilfield Chemistry, Houston,Texas, USA, pp. 151–163. https://doi.org/10.2118/88365-pa.
Jerauld G.R., Lin C.Y., Webb K.J., Seccombe J.C. (2006)Modeling low-salinity waterflooding, in: SPE Annual Techni-cal Conference and Exhibition, San Antonio, Texas, USA, pp.1–13. https://doi.org/10.1002/app.30886.
Kayri M. (2016) Predictive abilities of Bayesian regularizationand levenberg-marquardt algorithms in artificial neural net-works: A comparative empirical study on social data, Math.Comput. Appl. 21, 2, 1–11. https://doi.org/10.3390/mca21020020.
Lie K.A. (2012) An Introduction to Reservoir Simulation UsingMATLAB/GNU Octave, Vol. 21, Cambridge University Press,pp. 1–659. https://doi.org/10.1016/j.solener.2019.02.027.
Mohaghegh S. (2000) Virtual-intelligence applications in Petro-leum Engineering: Part 1 – Artificial Neural Networks, J.Petrol. Technol. 52, 09, 64–73, 64–71.
Morrow N.R., Tang G.Q., Valat M., Xie X. (1998) Prospects ofimproved oil recovery related to wettability and brine com-position, J. Petrol. Sci. Eng. 20, 3–4, 267–276. https://doi.org/10.1016/S0920-4105(98)00030-8.
Mustafiz S., Islam M.R. (2008) State-of-the-art petroleumreservoir simulation, Petrol. Sci. Technol. 26, 10–11, 1303–1329. https://doi.org/10.1080/10916460701834036.
Rajasekaran S., Pai G.A.V. (2017) Neural networks, fuzzysystems, and evolutionary algorithms: Synthesis and applica-tions, PHI Learning Pvt. Ltd, New Delhi, India, pp. 1–442.
Reginato L.F., Carneiro C.C., Gioria R.S., Sampaio M.A. (2019)Prediction of wettability alteration using the artificial neuralnetworks in the salinity control of water injection in carbonatereservoirs, Offshore Technology Conference Brazil, Rio deJaneiro, Brazil, pp. 1–17. https://doi.org/10.4043/29916-ms.
Saikia B.D., Mahadevan J., Rao D.N. (2018) Exploring mech-anisms for wettability alteration in low-salinity waterfloods incarbonate rocks, J. Petrol. Sci. Eng. 164, 595–602.https://doi.org/10.1016/j.petrol.2017.12.056.
Sampaio M.A., Barreto C.E.A.G., Schiozer D.J. (2015) Assistedoptimization method for comparison between conventionaland intelligent producers considering uncertainties. J. Petrol.Sci. Eng. 133, 268–279. https://doi.org/10.1016/j.petrol.2015.06.023.
Seethepalli A., Adibhatla B., Mohanty K.K. (2004) Physico-chemical interactions during surfactant flooding of fracturedcarbonate reservoirs, SPE J. 9, 04, 411–418. https://doi.org/10.2118/89423-pa.
Shobha G., Rangaswamy S. (2018) Machine Learning, in:Handbook of Statistics, 1st ed., Vol. 38, Elsevier B.V., pp.1–32. https://doi.org/10.1016/bs.host.2018.07.004.
Strand S., Høgnesen E.J., Austad T. (2006) Wettability alter-ation of carbonates - Effects of potential determining ions(Ca2+ and SO4
2�) and temperature, Colloids Surf. A Physic-ochem. Eng. Aspects 275, 1–3, 1–10. https://doi.org/10.1016/j.colsurfa.2005.10.061.
Strik D.P.B.T.B., Domnanovich A.M., Zani L., Braun R.,Holubar P. (2005) Prediction of trace compounds in biogas
L.F. Reginato et al.: Oil & Gas Science and Technology – Rev. IFP Energies nouvelles 76, 13 (2021) 13

from anaerobic digestion using the MATLAB Neural NetworkToolbox, Environ. Model. Softw. 20, 6, 803–810. https://doi.org/10.1016/j.envsoft.2004.09.006.
Talabis M.R.M., McPherson R., Miyamoto I., Martin J.L., KayeD. (2015) Chapter 1 - Analytics defined, in: InformationSecurity Analytics, Syngress, Boston, USA, pp. 1–12.
Webb K.J., Black C.J.J., Al-Ajeel H., Members S. (2004) Lowsalinity oil recovery-log-inject-log, in: Fourteenth Symposiumon Improved Oil Recovery, pp. 17–21. https://doi.org/10.2118/89379-MS.
Xiao R., Gupta R., Glotzbach R.C., Sinha S., Teletzke G.F.(2018) Evaluation of low-salinity waterflooding in Middle Eastcarbonate reservoirs using a novel, field-representative core-flood method, J. Petrol. Sci. Eng. 163, 683–690. https://doi.org/10.1016/j.petrol.2017.10.070.
Yousef A.A., Al-Saleh S., Al-Jawfi M.S. (2011) Smart water-flooding for carbonate reservoirs: salinity and role of ions, in:SPE Middle East Oil and Gas Show and Conference Held inManama, Bahrain, September, pp. 1–11. https://doi.org/10.2118/141082-ms.
Yousef A.A., Al-Saleh S., Al-Kaabi A., Al-Jawfi M., Aramco S.(2010) Laboratory investigation of novel oil recovery methodfor carbonate reservoirs, Canadian Unconventional Resources& International Petroleum Conference, Calgary, Alberta,Canada, pp. 1–35. https://doi.org/10.2118/137634-ms.
Zaheri S.H., Khalili H., Sharifi M. (2020) Experimental investiga-tion of water composition and salinity effect on the oil recovery incarbonate reservoirs, Oil Gas Sci. Technol. - Rev. IFP Energiesnouvelles 75, 21. https://doi.org/10.2516/ogst/2020010.
Zhang P., Tweheyo M.T., Austad T. (2007) Wettability alter-ation and improved oil recovery by spontaneous imbibition ofseawater into chalk: Impact of the potential determining ionsCa2+, Mg2+, and SO4
2�, Colloids Surf. A Physicochem. Eng.Aspects 301, 199–208. https://doi.org/10.1016/j.colsurfa.2006.12.058.
Zhang T., Li Y., Li C., Sun S. (2020) Effect of salinity on oilproduction: review on low salinity waterflooding mechanismsand exploratory study on pipeline scaling, Oil Gas Sci.Technol. - Rev. IFP Energies nouvelles 75, 50. https://doi.org/10.2516/ogst/2020045.
L.F. Reginato et al.: Oil & Gas Science and Technology – Rev. IFP Energies nouvelles 76, 13 (2021)14