
OPTIMIZATION OF IBUPROFEN FORMULATION: MOLECULAR ...
293
University of Rhode Island University of Rhode Island DigitalCommons@URI DigitalCommons@URI Open Access Dissertations 1991 OPTIMIZATION OF IBUPROFEN FORMULATION: MOLECULAR OPTIMIZATION OF IBUPROFEN FORMULATION: MOLECULAR PHARMACEUTICS OF THE BIOLOGICALLY ACTIVE PHARMACEUTICS OF THE BIOLOGICALLY ACTIVE STEREOISOMER STEREOISOMER Alain Joseph Romero University of Rhode Island Follow this and additional works at: https://digitalcommons.uri.edu/oa_diss Recommended Citation Recommended Citation Romero, Alain Joseph, "OPTIMIZATION OF IBUPROFEN FORMULATION: MOLECULAR PHARMACEUTICS OF THE BIOLOGICALLY ACTIVE STEREOISOMER" (1991). Open Access Dissertations. Paper 185. https://digitalcommons.uri.edu/oa_diss/185 This Dissertation is brought to you for free and open access by DigitalCommons@URI. It has been accepted for inclusion in Open Access Dissertations by an authorized administrator of DigitalCommons@URI. For more information, please contact [email protected].
Transcript of OPTIMIZATION OF IBUPROFEN FORMULATION: MOLECULAR ...

University of Rhode Island University of Rhode Island
DigitalCommons@URI DigitalCommons@URI
Open Access Dissertations
1991
OPTIMIZATION OF IBUPROFEN FORMULATION: MOLECULAR OPTIMIZATION OF IBUPROFEN FORMULATION: MOLECULAR
PHARMACEUTICS OF THE BIOLOGICALLY ACTIVE PHARMACEUTICS OF THE BIOLOGICALLY ACTIVE
STEREOISOMER STEREOISOMER
Alain Joseph Romero University of Rhode Island
Follow this and additional works at: https://digitalcommons.uri.edu/oa_diss
Recommended Citation Recommended Citation Romero, Alain Joseph, "OPTIMIZATION OF IBUPROFEN FORMULATION: MOLECULAR PHARMACEUTICS OF THE BIOLOGICALLY ACTIVE STEREOISOMER" (1991). Open Access Dissertations. Paper 185. https://digitalcommons.uri.edu/oa_diss/185
This Dissertation is brought to you for free and open access by DigitalCommons@URI. It has been accepted for inclusion in Open Access Dissertations by an authorized administrator of DigitalCommons@URI. For more information, please contact [email protected].

OPTIMIZATION OF IBUPROFEN FORMULATION:
MOLECULAR PHARMACEUTICS
OF THE BIOLOGICALLY ACTIVE STEREOISOMER
BY
ALAIN JOSEPH ROMERO
A DISSERTATION SUBMITTED IN PARTIAL FULFILLMENT OF THE
REQUIREMENTS FOR THE DEGREE OF
DOCTOR OF PHILOSOPHY
IN
PHARMACEUTICAL SCIENCES
UNIVERSITY OF RHODE ISLAND
1991

(
DOCTOR OF PHILOSOPHY DISSERTATION
OF
ALAIN JOSEPH ROMERO
APPROVED:
Dissertation Committee
Major Professor
€:?_,,~
~' 7
~-~-DEAN OF THE GRADUATE SCHOOL
UNIVERSITY OF RHODE ISLAND
1991

ABSTRACT
A progra m of e x perime nt s comparing t he formulatio n of
rac - ibuprofen to t h at of ( - )-S- i buprofe n was pe r f or med.
Early i nve s tigat i on s revealed that al t h ough complying with
t he Uni t ed Stat es Pharmac opeia c ompendial standards five
different sources of rac-ibuprofen had different processing
characteristics and as a result variable biopharmaceuti c al
properties. Crystal habits critically influenced process ing
parameters. It was possible t o identify l ow and h i gh liquid
requirement powders for the wet granulation end - point.
Further analysis of rac - ibuprofen crystals was performed
during the different stages o f tablet manufacture . Phase
diagrams c onfirmed that rac - ibuprofen crystallizes preferen-
tially in the monoclinic space P2 1 c group as a true
racemate . It was found that crystal distortion translated
int o an hydrophobic network of ibuprofen causing a dr op of
8.5 KJ mole - 1 in the enthalpy of fusion. This is thought t o
be responsible for the poor performance of ibuprofen
tablets. The extent of this network seemed to be dose de -
pendent as suggested by the dissolution profiles.
Using single crystal x-ray diffraction. the crystal lat
tice of (+)- S- Ibuprofen was elucidated a nd the molecular
pharmaceutics of the S and racemate investigated . The (+)
isomer. although crystallizing with the same number of
molecules in the unit cell. exhibited a t otally independent

crys~al ~ith a mel~ing point of 54°C a~d a~ enthalpy of fu -
sion ( c.E ) of 17 . 9 -1 KJ mo le less. ".'he stereoisomer of
ibuprofec was more soluble than rac - ibuprofen in aqueous
media . However , a study of the solution thermodynamics
revea::.ed that standard free energy of s olution ( L>G o = rac 30.3
and t>G o = 29.5 in KJ mole ) were comparable. whereas heats s and entropy of solution were very different at pH 1. 3
( L>H = rac 32. 2 and L>HS = 51 . 5 in KJ ! mole ) . The small
specific surf ace area of the s isomer ( 2.8.10-3 m 2 g ) com-
pared to the racemate (0. 34 m2 1g ) is pr obably responsible
for the slower intrinsic dissolution ( IDRrac = 11.6
µg . sec - 1 .cm-2 ) . The study of
biopharmaceutical properties of (+)-S- Ibuprofen f ormula-
tions. however , indicated an excellent flow and better
dissolution than the racemate . Extensive eutectic behavior
of the S(+) stereoisomer might be of some concern to the
formulators.
In order to formulate the pure enantiomer. the phar -
macokinetic of rac - ibuprofen was investigated. Using the
Stellatm simulation software it was determined that 1 / 3 of
the (+)- S- Ibuprofen was derived from the inversion of (-)-R-
ibuprofen systemically rather than pre - systemically. Thus
150 mg of (+)-S-ibuprofen might be therapeutically
alent to 200 mg of rac-ibuprofen .
equiv-

ACKNOWLEDGEMENTS
I want to express my profound appreciation for not only
the guidance and assistance of C.T. Rhodes. but also his
support of all my endeavors . The project led me down avenues
that nearly exhausted the breadth of exploration I ever
thought possible. Without the help of my major professor my
growth over these last three years would have been undoub
tedly stunted.
I want especially to thank Ciba-Ceigy Corporati on for
the award of a fellowship over the last three years. Under
the supervision of Dr. George Lukas, Executive Director of
PPT . I had guidance and advice to continue on the right
direction and also the freedom to alleviate my scientific
curiosities. A handful of individuals at Ciba- Geigy went
beyond the call of duty to assist me . among them Lou
Savastano. Russ Rackley and Franck Clarke: they made my stay
in Summit most productive, fruitful and enjoyable.
I would like to extend my thanks to Dr . Bauer and Ethyl
Corp. for providing me with the (-)- S- ibuprofen. thus giving
me the opportunity to work on a very challenging topic.
Mrs Reba Whitford deserves particular acknowledgement.
Time and again she has been the cohesion of the department.
taking under her wing all the graduate students including
myself. Over my tenure at URI I have enjoyed and benefited
from her professionalism. care and devotion .
iv

?~~a::y. ~c all o: ~hose wtc have shared in the trial
anc a~tic~pacion of gradua~e work. my fellow students. thank
you. The comple tion of this dissertation was achieved within
the heart of this group. To Alex and Mary Kay with whom I
have and will enjoy the greatest of friendship.
v

PREFACE
I elected t o write this dissertation following the for
mat of the manuscript plan described in section 11-3 of the
Graduate manual at the University of Rhode Island. This op
tion was most appropriate to present my results in several
sections.
Section I consists of a general presentation of the
problem with introduction and objectives of my investiga
tions. The five manuscripts. chronologically numbered in
Section II. are the core of this study . Most of the papers
have been either accepted or submitted for publication.
Section III. a published manuscript on the topic of clinical
research. was not directly related to the core of this work.
but some of the analytical method was later employed in the
pharmacokinetic methodology used for the (•)- S- ibuprofen.
Section IV is a set of appendices A to D giving ex
perimental details on this work.
vi

TABLE OF CONTENTS
ABSTRACT.
ACKNOWLEDGEMENTS.
PREFACE .... .... ...... .
LIST OF TABLES .. .
. .. iv
. .. vi
. . ix
LIST OF FIGURES ... . . . .. . . . . .. .... xii
LIST OF PUBLICATIONS AND PRESENTATION. . . . ... . . . . . xviii
SECTION I
INTRODUCTION .......... . . . . . . .. . ...... 2
SECTION II
MANUSCRIPT I : INFLUENCE OF DRUG SOURCES ON THE
BIOPHARMACEUTICAL PROPERTIES AND PROCESSING OF
HIGH DOSE IBUPROFEN FORMULATIONS. . .... 10
MANUSCRIPT II: MONITORING CRYSTAL MODIFICATIONS
IN SYSTEMS CONTAINING IBUPROFEN.
MANUSCRIPT III: AN EVALUATION OF IBUPROFEN
BIOINVERSION BY SIMULATION ...
MANUSCRIPT IV: AN APPROACH TO STEREOSPECIFIC
PREFORMULATION.
vii
. .. 55
. ..... 86
. . ... . 102

MANUSCRIPT V: S'.:'EREOCiEMICAL ASPECTS OF THE
MOLECULAR PHARMACEUTICS OF IBUPROFEN. . .127
MANUSCRIPT VI: FORMULATION OF THE BIOLOGICALLY
ACTIVE STEREOISOMER OF IBUPROFEN............. .149
CONCLUSIONS AND SUGGESTIONS FOR FUTURE WORK. . ... 169
SECTION III
MANUSCRIPT VII: USE AND LIMITATIONS OF THE
TRUNCATED AREA UNDER THE CURVE IN
BIOEQUIVALENCE TESTING ... . . 174
SECTION IV
APPENDI X A.
APPENDIX B.
.. . .... . . . . . ......... . . .. . .. . ..... 220
. ..... . . . ............ . . .. . . .. ..... 223
APPENDI X C ... .. ...... . ... . . ..... . .......... ..... . ... 231
APPENDIX D . ... . . . . ... ... . . . .. . . . ... .. .... . ...... .... 253
BIBLIOGRAPHY ... . .. .. .... .. . .. . .. . .. .. ... . . ....... ... 258
viii

Tables
Manuscript I
Table I
Table II
Table III
Table IV
Table v
Table VI
Table VII
LIST OF TABLES
Source and Origin of Ibuprofen . .
Starting Formulation ........ . . .
?age
.31
.32
Mean Particle Size. . .33
Surface Area. BET values ................. 34
Melting Ranges. Differential Scanning
Calorimetry . . ....... ........ 35
Enthalpy of Fusion of Various Sources
( J i g ) Analysis of Variance. . .... 36
Liquid Requirements for Ibuprofen
Granulations End-Point. .37
Table VIII: Effect of Different Sources on Liquid
Table IX
Table X
Table XI
Manuscript II
Table I
Table II
Requirements. . .................. 38
Moisture Content of Wet Granules. . . 39
Hardness Levels. ... ........... .......... 40
Analysis of Variance for Tablet Hardness
One Degree of Comparison. . .. 41
Formulation Used in This Study ............ 72
Experimental Design. . .............. 73
ix

Table III: Thermal AnalyE i S of Ibuprofe=
Formulation. ~-...... .. ..... . .. . ... { ~
Table I V Analysis of Variance for Enthalpy
of Fusion .............. . . . 75
Table v Crystal Modifications and Initial
Dissolution Rates. . .. . ... . . 76
Manuscript III
Table I Simulation Parameters and Results for
Bio inversion of Ibuprofen .... ........... 99
Table II: AUC Values in Man after administration of
Individual Ibuprofen Enantiomers or
Racemate .. ..... ....... . . ........ 100
Manuscript IV
Table I Thermal Analysis of Ibuprofen ..... .... ..... 116
Table II: Heats of Solution for ibuprofen. . ... 117
Manuscript v
Table I : Crystal Data of (+)-S-ibuprofen. . .... 140
Tabl e II: Thermodynamic Functions of Melting and
Solubility .......... . . ................. 141
Manuscript VI
Table I Experimental Design ..... . .. . ........ 161
Table II Thermal Analysis of (+)-S-ibuprofen
x

24 H OU~E of M~xing . .
Tab : e III : Thermal Analys is of (-)- S- ibuprofen
One Week St orage at Room Temperature
Table IV Thermal Analysis of ( +)-S-ibuprofen
162
.. 163
Tablets. . .... 164
Table v Biopharmaceutical Properties of
( + )- S- ibuprofen Tablets. . 165
Manuscript VII
Table I One Compartment Model Simulation
Parameters. .. . . 198
Table II Two Compartment Model Simulation
Parameters ... . ...... . 199
Table III: Pharmacokinetic Parameters of
the Reference Products ..... . ........ . . .. 200
Table IV Pharmacokinetic Relevance of
AUCtmax ........... . .. . .. .. 201
Table v One Compartment Model
AUG ratios for Bioequivalence .. . ... 202
Table VI : Bioinequivalent Products-AUG Ratios ....... 203
Table VII: False Inequi valence. . . 204
Table VIII:Truncated AUG ratios of Bioavailability
Appendix D
Table I
Percentage and Corresponding AUCinf . ...... 205
:Pure Ibuprofen Compacted:
Thermal Analysis .... 257
xi

Figur es
Manuscript I
Figure
Figure 2
Figure 3
Figure 4
Figure 5
Figure 6
Figure 7
Figure 8
Figure 9
LIST OF FIGURES
Page
Size Frequency distribution
Surface-Weighted Mean .............. .. . . .... 42
Apparent Bulk and Tapped Density ... .... .... 43
Scanning Electron Microscopy
Photographs of Ibuprofen Crystals
from I : Fld. II: Fhd, III: Boots
and IV:Ethyl. . ............... 44
Scanning Electron Microscopy Photographs of
Ibuprofen Crystals from I and II: Cheminor,
II and IV: different batches of Ethyl. 46
Typical DSC endotherms of Ibuprofen ..... . .. 48
X-Ray Diffraction Patterns of Ibuprofen .... 49
Power Consumption for Wet Granulation I. .50
Power Consumption for Wet Granulation II ... 51
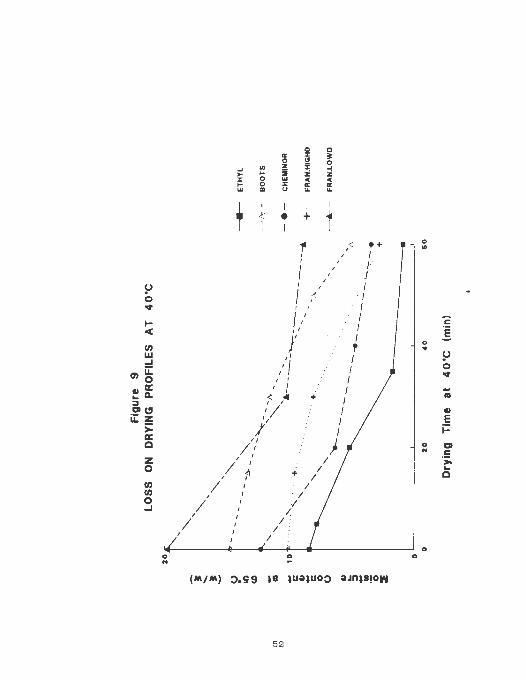
Loss on Drying Profiles at 40°c.
Figure 10: Dissolution of Ibuprofen Cores ..
.. 52
. . .. 53
Figure 11: Dissolution of Ibuprofen Cores (CHEM ) ...... 54
Manuscript II
Figure
Figure 2
Unit Cell of Rae-ibuprofen ............ .
Crystal Packing ......... .
xii
.77
.78

Fibure 3
Figure 4
Figure 5
Figure 6
Figure 7
Figure 8
Manuscript III
X- Ray Di ffraction Patcerns of A) pure
ibuprofen. E )Granulati ons and C) Tablet s .... 79
Scanning Electron Mi c r oscopy Photographs . . . 80
Effect of Compact i on on Melting .
Effec t of Compacti on on Enthalpy .
Dissolution Prof iles of Ibupr ofen
.82
... 83
Cores (0 and 1 Intragranular Ratio ) . . .84
Dissolution Profiles of Ibuprofen
Cores ( 1 , 2 and 1 / 3 Intragranular Ratio ) .... 85
Figure 1 : Chiral Bioinversion Model Pr oposed
by Jamali et al ( 5). . .. ... 101
Manuscript IV
Figure Cross Section of the Modified Woods
Rotati n g Apparatus ..... ...... ............ . 118
Figure 2 : Powder X- Ray Diffraction Patterns:
Effect of Grinding ................... . 119
Figure 3 Scanning Electron Microscopy of
(+)- $- ibuprofen.
Figure 4 : Flowability / Packing
. .. . .. . . .. 120
Log V0
/ V against the Number of Taps ... . . .. 122
Figure 5 : Intrinsic Dissolution of
(+)- S- ibuprofen . .. . . . .. . . . .... . . . ... 123
Figure 6 : Effect of Aging . .. . . .. . . . .. . . . . . . . . .... 124
xiii

Figc:re 7
!'igc:re 8
Manuscript v
Figure
Figure 2
Figure 3
Figure 4
Figure 5
Manuscript VI
Figure
Figure 2
Manuscript VII
Figure
Figure 2
Figure 3
Vant' Hoff Plots [rac-ib~profen ) .
Vant ' Hoff Pl ots [(-)- 5- ibuprofen l.
.125
. 126
Thermograms of ibuprofen A) Pure
rac - ibuprofen. B) pure (-)-8 - ibuprofen ..... 142
Thermograms of ibuprofen
Different Enantiomeric Compositions.
Phase Diagram of Ibuprofen.
Test of the Prigofine-Defay Equati on.
Molecular Modeling
a ) Unit Cell of (+)-S-ibuprofen.
b ) Crystal Lattice of (+)-S- isomer.
c ) Superposition of C~) Stereoisomer
.143
. .. 144
.145
. . 146
. 147
Molecules Involved in H2 Bonding .. ... .. 148
Crystal Distortion in Tablets ...... .... ... 166
Dissolution of Ibuprofen Cores ..... ... .. .. 167
One Compartment Model .... .. . . . ... 206
Two Compartment Model . . . ...... 207
Pharmacokinetic Relevance of AUCtmax a ) .. . 208
Pharmacokinetic Relevance of AUCtmax b ) ... 209
xiv

Figure 4
Figure 5
Figure 6
Figure 7
Figure 8
Figure 9
Percentage of AUC~n: Reference
a ) One Compartmen~ Kodel. . . 210
b) Two Compartmen~ Model ..... ............. 211
Percentage of AUCinf Required to show
Bioequivalence. . . . . . . . . . .. . 212
Kinetics of AUC Ratios ( Slow Absorpti on ) .. 213
Kinetics of AUC Rati os ( Fast Absorption ) .. 2 14
Percentage of AUCinf
when AUC ratio ~ ( F ) ... . ..... 215
Percentage of AUCinf at any time after
dosing
a ) One compartment Model ..
b ) Two Compartment Model . ............ .
Figure 10: Therapeutic Window.
.216
. . 217
... 218
Appendix A
Figure
Figure 2
Appendix B
Figure
Figure 2
Figure 3
Typical Power Consumpti on Trace.
Calibration Curve for Ibuprofen.
Molecular Packing in the Crystal
.221
. . . 222
Lattice of Rae-ibuprofen . . . ..... . ... . . . 225
Representation of the S-(+ ) -ibuprofen
Crystal Lattice from a different angle . ... 226
Arrays of (+) -S and (-)-R Molecules
Cryst al Lattice of Rae-ibuprofen . . . 227
x v

Fi gu:::e 4
Figure 5
Figure 6
Appendix C
Figure
Figure 2
Figure 3
Figure 4
Figure 5
Details of the ~omochiral Eydrogen Bond
in the S Crystal Lattice. . .... 228
Identification of the Molecular Torsion .. . 229
Theoretical X- ray Diffract og rams .......... 230
Typical DSC thermogram of
Ethyl ibuprofen.
DSC Scan of Polyvinyl Pirrolidone
( Povidone ) in the temperature range of
. . 235
interest . . . ..... 236
DSC Scan of Na Starch Glycolate ( Explotab)
in the temperature range of interest ...... 237
DSC Scan of Lact ose ( Fast Flow Lactose ) in
. . 238 the temperature range of interest .
Example of a typical endotherm of Ethyl
El3l;An 77% ibuprofen formulat i on with 1%
of disintegrant 113 intrgranular . . ... 239
Figure 6 : Example of a typical endotherm of a ground
ibuprofen tablet obtained at regular
Figure 7
Figure 8
Figure 9
compaction. . ............... 240
Example of a typical endotherm of a ground
physical mixture ( before wet granulation ) .241
Typical Endotherm of (+)-S-ibuprofen .... . 242
Endotherms of (+) -S-ibuprofen and
rac - ibuprofen recrystallized at 4°C from
xvi

methanol liquors.
Figure 10: Therm og ram of a Sand racemate mix"ure
( 25 - 75 ) melted and
.24 3
recrystallized at 4 °c .. . .... . .. ... ....... 244
Figure 11: Example of Sand racemate physical mixtures
[(75-25%)-24 h ours-Labshaker-Room
Temperature l .
Figure 12: Thermogram of a directly compressible
(+) S-ibuprofen formulation [24 hours of
mixing ].
Figure 13: Thermogram of a directly compressible
. . 245
. .246
(+)- S- ibuprofen formulation [72 hours of
mixing l . . . . . . . . . . . . . . . . . . . . . . ..... 247
Figure 14: Thermogram of a ground C~)- S-ibuprofen
tablet obtained at 600 lbs ................ 248
Figure 15: Thermogram of a ground (~)- S-ibuprofen
tablet obtained at 1200 lbs .......... . .. . . 249
Figure 16: High Purity Indium Melt ......... . . . .. 250
Figure 17: (+)-S-ibuprofen Purity Run ............ . ... 251
Figure 18: (+)-S-Ibuprofen Purity Determination ...... 252
Appendix D
Figure 1
Figure 2
Disintegration Time of IBU Formulation .... 255
Effect of Compression on Hardness. .. 256
xvii

LIST OF PUBLICATIONS AND PRESENTATIONS
Manuscript I has been published in the journal Pharm
Acta Helv 66(2 ) :34-43. ( 1991 ) and was presented. in part. at
the 1989 A.A.P.S. meeting in A"lanta.
Manuscript II was presented in part at the 1990 A.A.P.S.
nati onal meeting in Las Vegas and will be submitted "o Int .
J. Pharm.
Manuscript III has been accepted for publicati on in the
journal Chirality 1991.
Manuscript IV has been accepted for publication in the
journal Drug Dev . and Ind . Pharm. 17(5 ) , 1991.
Manuscript V will be submitted for publicati on in the
J ournal of Pharmacy and Pharmacology
Manuscript VI will be submitted for publication as a
technological note in the Journal de Pharmacie de Belgique.
Manuscript VII has been published in the journal
Clin . Res. Practices and Reg. Affairs 8 ( 2): 123- 151. ( 1990 )
and was presented. in part , at the GRASP ' 90 meeting in
Chapell Hill, NC .
xviii

"The hard Things We Do Immediately.
The Impossible Takes A Little Longer "
Pete DeMaria
Ciba-Geigy Corporation
xix

To my Parents and to Teri.
To Colette.
xx

SECTION I

INTRODUCTION
The production o f pharmaceutical compressed tablets is
very common despite the fact that our understanding of the
process is by n o means complete. In many instances. the
choice of formulati on variables is based on an intuit ive
rather than a rati onal function . Thus the processing tech
nology may or may not be optimal . As a result there are
problems in fully validating the process as required by the
Food and Drug Administrati on ( FDA ).
Ibuprofen is currently administered as a racemate and~
oral dosage forms are manufactured using wet granulation.
This technology improves the flow and compactibility of pow
ders by increasing the particle size and cohesion . The
effect of processing on crystal and granule characteristics
have been carefully discussed in the literature . The dis
tribution of particle size depends substantially on the
binder solution (1). its volume ( 2 ) . the mixing time ( 3 ) and
many other factors ( 4 ). The drying stage may have critical
effects on the hardness ( 5 ) and other physical properties of
the granules ( 6 - 9 ). Several authors have correlated compac
tion parameters to the granule characteristics ( 10- 12 )
Similarly . the properties of pharmaceutical tablets such as
dissolution ( 13- 16 ), disintegration time ( 16 ) or hardness
( 14 ) , were related to the primary processing technology. To
date it is generally recognized that some characteristics of
2

the r a~ materials are responsible f or c ertain a spe cts o f t he
pr oce ss ing behavior ( 16- 21 ) . Althou gh g ranu l e gr owth
mech anisms have been studied rather successful l y ( 17.21 - 25 ),
the the oreti c al models proposed fail t o explain some am
biguities of the ibuprofen formulati on. There are a number
of articles describing the relationship betveen the
molecular behavior of povdered drugs and tablet processing
( 26-29 ) . These studies addressed the crystal modifications
of carbamazepine(28), sulfanilamide ( 29 ) . phenobarbital(30 ) .
aspirin ( 31 ) or many other drugs ( 32 ) but at this time. there
are no such publications for ibuprofen.
The development of ibuprofen , a non steroidal an
tiinflammatory agent ( NSAI ), with several doses strengths
presents many challenges (33) to the formulators. Yet. new
challenges emerge from the recent possibility of manufactur
ing the biologically active stereoisomer [( +)- S- ibuprofenl
using an economically viable chemical synthesis .
During the course of this study ( Spring 1990 ) . we vere
able to obtain a substantial amount of (+)-S-ibuprofen. At
the time several prestigious pharmaceutical companies
( Johnson & Johnson. Merck Sharp & Dohme and McNeil ) were ac
tively investigating possible synthetic routes to obtain the
(+) isomer in a large scale fashion and presently the
benefits as well as possibilities of formulating this com
pound are under heavy scrutiny . This general interest in
stereospecif ic drug development meets the new trends in
3

regul a to r y bodies . especially t he FDA under the leader s hip
of Carl Peck. in promocing the pharmaceutical devel opment of
pure pharmaco l ogically active enanciomers.
With the exception of Napr oxen ( Sy ntex ). all profens
currently used as antiinflammat or y products in the United
States are marketed as racemates ( 34 ). In most of chese
cases, the
responsible
dextrorotary or S
for che therapeutic
optical isomer seems to be
activity that is the
stereospecific inhibition of the cyclooxygenase and further
the prostaglandin synthetase. Various pharmacokinetic
reports have been published. suggesting that for some of~
these aryl propionic acids bioinversion of the inactive
stereoisomer could
mechanisms ( 35 ) .
take place in vivo by enzymatic
While it was my intention to investigate the relations
between processing and ibuprofen crystals at a molecular
level, (in order to improve and optimize ics formulation ),
it would have been unreasonable to consider sol ely the
racemate at this stage. Therefore during the spring 1990 I
decided to redirect my research work with an emphasis on
comparing the rac-ibuprofen to ( +) -S - ibuprofen crystals. As
a result, a combination of several "expertise " some ex
clusively reserved to basic research (i.e. single crystal X
Ray diffraction ) were applied to the study of the active
isomer. The hypothesis were that ibuprofen crystal was
modified during formulation and in turn influenced the
4

pr ope r ties o f resulting f ormulac i ons . We a l s o hypothe s ized
chat . using similar techniques the f ormulati on o f the
b i ologically active scereoisomer was indeed possible.
My review of the published literature indicated that
predicting or understanding the molecular behavior of
ibuprofen under processing had never been reported. On the
chirality issue. most reviews on the topic approached the
problem from a pharmacodynamic or drug metabolism point of
view ( 33 , 36). There were no published reports investigating
the possibility of developing the pure ibuprofen enantiomers
nor addressing the issue of stereospecif ic drug development
in terms of molecular pharmaceutics. It is believed that
this approach is a unique concept in the development of pure
enantiomers that can be used in many othe r comparable cases.
The specific obj ectives of this research work were
1 ) to demonstrate the effect of ibuprofen crystal on the
processing and biopharmaceutical properties of resulting
formulations
2 ) to assess crystal distortion qualitatively and
quantitatively during formulation
3 ) to use these crystal properties in the development of
the pharmacologically active (+)-S-ibuprofen
4 ) and to compare the molecular pharmaceutics of
racemate and the S enantiomer
5

REFERENCES
( 1 ) J. W. Wallace. J.T. Capozzi. R.F. Shangraw.
Pharm.Tech. Sept 1983.
(2) A. Mehata . K. Adams. M.A. Zoglio. J.T.
Carstensen , J.Pharm.Sci. 66(10 ) :1462 -1 464 (197 7 )
(3) H.M. Unvala . Joseph B. Schwartz and R . L . Schnaare
D.D.I.P. 14 ( 10). 1327 - 1349 ( 1988 )
( 4 ) N- 0 Lindberg , C . Jon sson and B. Holmquist
D. D.I.P.11( 4 ). 917-930 (1 985 )
(5) Z.T. Chowan , J.Pharm.Pharmacol. 32:10-1 4 (Jan )
1980
( 6 ) P . Arnaud et al . Pharm.Acta . Helv . 58 (1 1 )
290 - 297 (1 983 )
( 7 ) L.Benkerrour. F. Puisieux. D. Duchene .
Pharm.Acta . Helv . 57 ( 10 ) :301-308 ( 1982 )
(8) H. Leuenberger.
Int.J.Pharm. 12:41-55 (1 982 )
( 9 ) Ian Kryce, David G. Pope , J ohn A. Hersey
Int.J.Pharm. 12:113-134 ( 1982 )
( 10 ) Z.T. Chowan and Y.T. Chow Int . J.Pharm . Tech . &
Prod.Manuf. 2 ( 1 ) :29-34 ( 1981 )
( 11 ) F.A . Menard , M. G. Dehdiya , and C.T. Rhodes
D. D.I.P. 14(11 ), 1352 , 1988
( 12 ) R.N. Chilamkurti . J.B. Schwartz and C.T. Rhodes ,
Pharm.Acta .Helv. 58:253 ( 1983 )
6

( 13 ) Z . T . Ch owan and L Palagy i J. Pharm.Sci.
67 ( 10 ) :1385 - 1389 (1 978 )
(1 4 ) J. P. Rernon and J. B. Schwartz D.D . I.P. 13 ( 1 ) .
1- 14 ( 1984 )
( 16 ) T . M. J ones J. Pharrn . Pharrnaco. 31, 17-23 ( 1980 )
( 17 ) J . Carstensen et al. J.Pharrn.Sci . 65:992 - 997
( 1977 )
(18 ) H. Vrornans. A.H. DeBoer. G.K. Bolhuis and C . F. Lerk
Acta Pharm. Suec. 22:163-172 ( 1985 )
(19 ) H. M. Unvala. J.B. Schwartz and R.L. Schnare
D.D.I.P. 11(14):1327-1350 1988
(20 ) Z . T. Chowan and A.A. Amaro
D . D.I.P . 8 ( 14 ) :1 079-1106 ( 1988 )
(21 ) zoglio M.A. et al , J.Pharm.Sci. 65:1205 - 1208
( 1978 )
(22 ) Newitt and Conway - Jones , Trans.Intn.Chem.Eng.
36: 42 2. (1958)
(23 ) H. Leuenberger , H-P. Bier. H.B. Sucker
Pharrn.Tech. 60-66 , June 1979
(24 ) A. Stamm and L. Paris
D.D.I.P .. 11(2&3). 333-360 ( 1985 )
(25 ) Rumpf H. Chem.Ing.Tech. , 30:144-158 (1 958 )
( 26 ) H.G. Brittain
D.D.I.P. 15(13), 2083-2103 (1989 )
(27 ) C . Lefebvre. A.M. Guyot-Hermann , M. Draguet
Brughmans , R. Bouche and J.C. Guyot
7

D.D.I.P. 12 ( 11 - 13 ) . 1913- 1927 ( 1986 )
( 28 ) Y. Nakai D. D. I. P. 12(7 ) . 1017- 1039 (1986 )
( 29 ) o. Cruaud. D. Duchene. F. Puisieux. A. Chau vet et
J. Masse J. Pharm.Belg. 36(1 ) . 15-20. 1981
(30) s. Kopp. c. Beyer. E. Graf. F. Kubel and E . Doelker
J. Pharm.Pharmaco .. 41:79-82 ( 1989 )
( 31 ) M.P. Summers. R.P. Enever. and J.E. Carless
J.Pharm.Sci (66)8 11723-1175 (1977 )
(32) A Chan and E. Doekler D.D.I.P. 11(2&3) 315-332
(1 985 )
(33) Robert M. Franz
U.S. Patent ~ 4.609.675. Sept.2. 1986
( 34) J.M. Mayer
Acta Pharm.Nord. 2(3). 196-216. 1990
( 35 ) A. J. Hutt and J. Caldwell
J.Pharm.Pharmaco. 35:693-704 , 1983
( 36 ) D.B. Campbell
Eur.J . Drug Met .Pharmacok . 15 ( 2 ): 109-125. 1990
8

SECTION II
9

MANUSCRIPT I
INFLUENCE OF DIFFERENT SOURCES
ON THE PROCESSING AND BIOPHARMACEUTICAL PROPERTIES
OF HIGH DOSE IBUPROFEN FORMULATIONS
10

ABSTRACT
It is known that depending on the manufacturing and
synthetic processes. drugs may exist as different forms. As
a result. physico-chemical properties. compression charac
teristics. intrinsic dissolution and bioavailability may
vary substantially . The purpose of this study was to inves
tigate the effect of different sources of ibuprofen on the
processing of tablets and on their properties . Another em
phasis o f this work was to rational ize one or s everal key
characteristics of the raw material as directly related to
wet granulation parameters and to the behavior of final
tablets. Commercially available ibuprofen was obtained from
different
eluding
manufacturers and a preformulation program , in
X- ray crystallography. differential scanning
calorimetry. scanning electron microscopy , determinati on of
particle size distribution and fl owability , was performed to
characterize the raw material. Granules were prepared with a
planetary mixer and liquid requirements for the end - point
were obtained by monitoring power consumption. Tablets were
manufactured on Stokes rotary and single punch instrumented
presses . Data acquisition interfaces produced compression
data for each formulation. Granules and final tablets were
analyzed for hardness ,
uniformity. Statistical
dissolution profiles and content
evaluations using analysis of
variance and multiple comparison procedures were performed
11

on the re s u lts to decermine the s i gnificance o f the
variabili t y be tween independent paramecers. The ibuprofen
tested was f ound c o be a unique p ol y morphic form wi t h some
diffe r enc e s in the external c r ystal linity . The particl e s ize
characteristics of the material also allowed a differentia
tion between s ources and although there was no differences
in dissolution patterns or content uniformity. particle size
was f ound to account for 50% of the variability in tablet
hardness . Two sources of ibuprofen with l ower mean particle
size showed significant variations in end - point liquid re
quirements resulting in variable tablet crushing strength .
I NTRODUCTI ON
It is now widely recognized that grade variability
of the starting material can be responsible for major dif
ferences when processing and formulating ( 1 ) oral solid
dosage forms. Inadequate control of the synthetic process
can lead to the production of different polymorphs or crys
tal forms having variable intrinsic dissolution and
exhibiting differences in
behavior ( 3 ) or wet
bioavailability ( 2 ) , compaction
granulation parameters ( 4 ) . Those
phenomena have been frequently addressed in the pharmaceuti
cal literature. For example. the changes in molecular
pharmaceutics resulting from grinding , compression and in
general processing, have been discussed extensively ( 5 ) . The
12

kn owl edge o f phy s ico - chemical characteristics of the s cart
i ng material s i s critical f or the f ormulat or (6 ) . es pe c ially
when high dose drugs are formulated. where the nature of the
active itself can also influence subs tantially the process
ing of the final products. To date . although. industrial
pharmaceutical specifications recommend two suppliers for
materials used in a formulation . it has been shown thac
small changes may occur between products from different
manufacturers and within products provided by a same sup
plier ( 7 ) . As a result, formulation problems arise when
processing the corresponding formulations (4 ) . It is the
role of the formulating pharmacist t o understand and monitor
the transfer of technology involved in switching sources or
suppliers. in order to avoid nonideal or unexpected behavior
during large scale manufacturing. therefore insuring the
good quality of a drug product to guarantee the patient ' s
safety. Ibuprofen, our model compound. is a widely used OTC
Non Steroidal Antiinflammatory Agent. Different polymorphs
of recrystallized ibuprofen have been shown to exhibit vari
able extent and rate of biological absorption (2 ) and this
molecule could exist under different crystal forms depending
on the synthetic process. As many therapeutic applications
of ibuprofen may become available for children at low dose
levels (B ). minor changes in the crystal structure could
result in dramatic changes in the pharmacologic disposition
of this compound. The objectives of this investigation were
13
to determine if several sources of ibupr ofen could exist as
dif:erent forms and exhibit variations in their physical
pharmacy p r ofile . A correlation between s ome characteristics
of the raw material. processing parameters and properties of
the final products was studied. In further studies . the ef
fect of processing on ibuprofen is investigated in more
detail and at a molecular level. For example. it has been
shown that particle size (9). particle morphology ( 4 ) and
surface area ( 10 ) of the starting material can influence
significantly granule formation and binding properties
during compaction .
Fractional factorial designs were utilized to in
vestigate the extent of variability between the different
sources and multiple comparison procedures were performed on
the results for processing parameters and biopharmaceutical
characteristics. This study is the first of a three paper
serial investigation leading to the optimization of some
aspects of ibuprofen formulation. The information obtained
in this work served to correlate key material characteris
tics to product properties , isolate them from processing
parameters and support recommendations regarding the use of
different validation procedures for various raw materials if
they are provided by different suppliers as it is the case
in most industrial pharmaceutical settings.
14

EXPERIMENTAL
MATERIALS
Ibuprofen was obtained through intermediate dis
tributors and manufacturers. The identity and origin of the
five different sources analyzed in this study are presented
in table I. Monobasic phosphate and sodium hydroxide were of
analytical grade and obtained through the Fisher Scientific
Company. Ibuprofen standards for calibration purposes were
obtained from the Drug Standard Division o f the United_
States Pharmacopeial Convention in Rockville , MD. Wet
granulations containing Fast flow Lactose (Schieffield).
Povidone ( GAF Co. ). Explotab ( Edward Mendell ) were prepared
using purified water. Lubrication was performed with
Magnesium Stearate ( Fisher Scientific Co. ).
METHODS
GRANULATION PROCESS
Ibuprofen was formulated at three different
strengths , in order to study the effect of increasing
amounts of active on the processing and biopharmaceutical
properties of the final products. The formulation inves
tigated in this work may not be the most appropriate for
15

large scale manipulations. Nevertheless. it was the most
convenien~ combinat ion available. given the complexity of
variables i nvolved in the wet granulation process. thus
unabling the study of pure s ource effect.
Blends composed of the active. the diluent. the
disintegrant and the binder were dry mixed for ten minutes
in a Turbular mixer. The mixture was transferred on an in
strumented planetary mixer ( Kitchen Aid Model K5 - A Hobart )
interfaced with an IBM personal computer. A data acquisiti on
software from Extech Co . allowed the recording of Power con
sumption . The pre-mixed powder was then dry mixed in the
planetary mixer allowing the Watt - reading to stabilize t o a
baseline (11) . The granulating fluid was added to the mix
ture using a peristaltic pump at a rate adjusted t o 10
ml / min. with five seconds interruption every minute. Wet
granulation was proceeded until the end point. In order to
have a uniform distribution of liquid bridges the mixer was
stopped three minutes after the end-point.The power data was
plotted against the granulation time which corresponds to
the real wet mixing time and the volume of water added was
recorded Although we fully understand the importance of
time and rate at which the liquid is added, it was not the
scope of this investigation to study this aspect of the
granulating process Granules were then gently hand
screened through a number 8 mesh screen and dried at 40°c
during 12 hours in a convection oven to reach a one to two
16

percent final moisture content. The dry granules were
screened through a • 16 mesh screen. mixed for ten minutes
with the lubricant and the appropriate amount of disin
tegrant. and compressed into tablets on an instrumented B-2
Stokes rotary press. An instrumented single punch press ( F3 -
Stokes) was used to validate 350 mg tablets with acceptable
tensile strength ranging from 8 to 15 Sc. The compaction
force was recorded and the different formulations compared
using this parameter. Another experiment was conducted and
the hardness of tablets , made at the same level of compac
tion. was recorded . Three different levels of compression
force were investigated as some biopharmaceutical properties
are known to be proportional to the compaction behavior
( 12 ). Compression data were recorded as fingerprints of each
formulation. Table II shows the starting formulation.
PRKFORMUI.ATION AND PHYSICAL TESTING
Analytical testing was performed at different
stages of the study and during the formulation process ( 8).
The five d ifferent sources of raw material were screened
through a sol id state preformulation program to characterize
the active . Thi s preliminary testing included the following
analysis:
-particle size analysis
-surface area determination
17

-differential scanning calorimetry
- x - rays diffraction patterns
- scanning electron microscope
phot ographs
This reduced physical pharmacy profile was under
taken to detect any remarkable differences between sources.
The particle size was characterized on ibuprofen water
suspensions ( 10 mg 1 ml ) with a Brinckman Particle Size
Analyzer model 2334A using a laser light scattering tech
nique . Surface area was determined using a gas adsorption .~
monolayer method and calculated using the B.E.T. equation.
This technique was available on a Quantasorb Sorption
Analyzer from Quantachrome , NJ. The melting processes were
measured by differential scanning calorimetry on a Perkin
Elmer Thermal Analysis Series 7 interfaced with a Perkin
Elmer P7500 E computer. X-Ray crystallography and scanning
electron microscopy photographs of the raw materials were
performed by the Analytical R&D services of Ciba-Geigy in
Ardsley. NY . Flowability measurements were obtained with a
custom designed recording powder flow meter on ibuprofen
powders and granules; a powder flow linearity index was
derived from the flow charts when applicable (13). Apparent
tapped density was recorded with an Erweka tap density
tester with 2000 taps. Statistical evaluation with analysis
of variance was used to differentiate between independent
18

variables and support interpretations . Final granule size
was measured using a conventional sieve method. the size
distributions were compared by plotting the percentage over
size vs the amount of active on the screen .The median point
wa s used as the mid - point to compare the different formula
tions. Mois ture contents and loss on drying profiles we re
determined on a Computrac Moisture Analyzer from Computrac
Co. NJ. Tabl et c rushing s trength was measured on an Erweka
Aut omated Hardness tester. Dissolution testing was performed
with an Easylift model 63 - 734-100 from Hanson Co. The method
consisted of a rotating paddle at 50 RPM in a pH 7.2 USP~
phosphate buffer at 37°c . In order to avoid time consuming
dilutions. the working wavelength was adjusted to 264
nanometers. This technique was applied successful ly in a
previous work (1 4 ). Gr anulations were tested for moisture
content, l oss on drying curves. liquid requirement s for
granulation end point, f l owability and size distribution.
Ibuprofen cores were analyzed f or hardness and dissolution
profiles in correlation t o compaction forces.
RESULTS AND DISCUSSION
PREFORKULATION
The preformulation profiles of ibuprofen showed
several differences in the solid state characteristics of
19

the various sources. Neveroheless . it is underst ood that
analy tical testing can present s ome variations and one has
t o be extremly cautious with interpretation. For example.
the ibuprofen- water suspensions used with the particle size
analyzer may be a fraction not representative of the overall
sample populations and each analysis was performed in
triplicate. The mean particle sizes and log-normal frequency
size distributions are given in table III and figure
respectively. Both measuremen•s were performed on ibuprofen
particles suspended in an inert solvent and micronized for
ten minutes to obtain uniform suspensions. we believe that
the micronization divided the aggregates into primary par
ticles but did not generate sufficient energy to dislocate
the primary crystals related to processing characteristics.
Further experiments including a study of the effect of in
creasing micronization time on particle size will be
performed. The average particle size was obtained from the
surface weighed equation (15). It is appreciated that sam
pling may also be subject to certain variation in this case.
The Francis High density had the largest mean particle size
with a right skewed tendency. The Cheminor source seemed to
exhibit a narrow distribution with an intermediate average
particle size. The Boots and Francis Low density sources ex
hibited the lowest mean particle size , with the narrowest
distribution of almost 100% of the sizes below 25
micrometers. The surface area results of unmicronized
20
ibuprofen samples are presented in table IV . The v olume
surface measurements of average parcicle size are mostly
used for pharmaceuticals because they are inversely propor
tional to the specific surface. Combined with surface area
measurements. it allows an accurate evaluation of physical
properties of medicinal powders. Some BET results were not
expected as Francis low D. and Boots . which exhibited the
l owest mean particle size, had intermediate surface area
values. On the other hand , Francis High D. which showed the
largest mean particle exhibited the highest surface area in
dicating a very broad size distributi on in accordance with~
the frequency curve. The apparent tapped densities reported
in figure 2 summarize the micromeritics behavior of
ibuprofen powder based on the previous experiments .
According to the packing theory , as a result of size charac
teristics and surface area, Franc is High D. exhibited the
largest density. Boots and Francis Low D. showed the smal
lest apparent density. probably indicating the unif ormity of
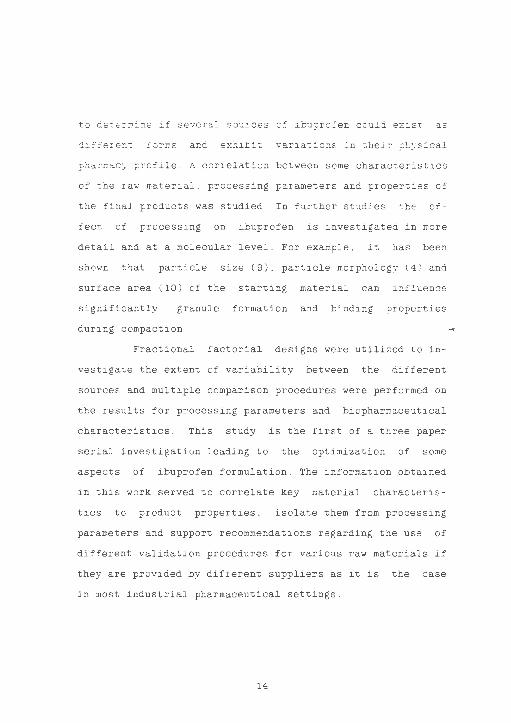
the shape distributions. Figures 3-4 are scanning electron
microscopy photographs of ibuprofen raw material . The mac
roscopic observation of X500 magnified ibuprofen crystals
allowed rational conclusions on the differences between
sources as sorted by particle size , BET values and density
results . There was no significant visible difference between
Ethyl and Boots , which exhibited lamellar needle type crys
tals . On the other hand , Francis low D. has a very uniform
21

distribu•ion of the smallest needle type particles. Francis
high D. has the largest rounded macrocrystals with small
microcrystals and Cheminor exists as laminated square plates
of intermediate size. The surface of Francis High density
macrocrystals seems to be very irregular. probably an ex
plaination of the high surface area value. Clearly. this
visual evaluation indicated that the final crystallisation
step of the synthetic process could be very different for
the various sources leading to differences in crystal formE.
This observation could not be predicted from the BET results
which did not show any significant differ e nces between~
Cheminor.Ethyl and Boots but appeared to vary from the sur
face area of the two Francis sources as indicated by an F
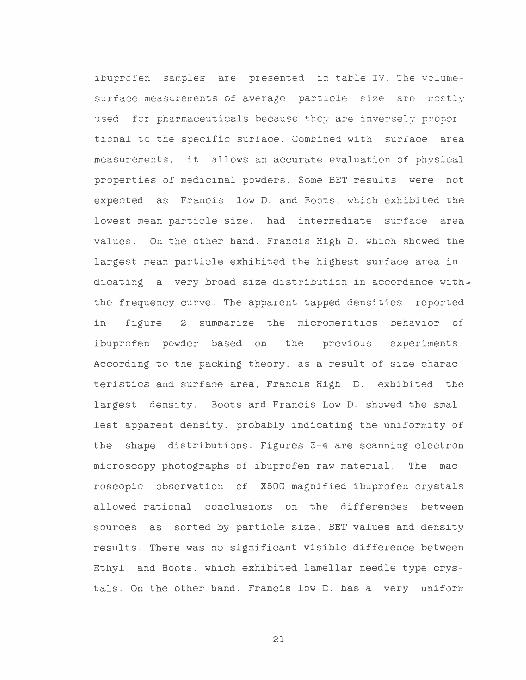
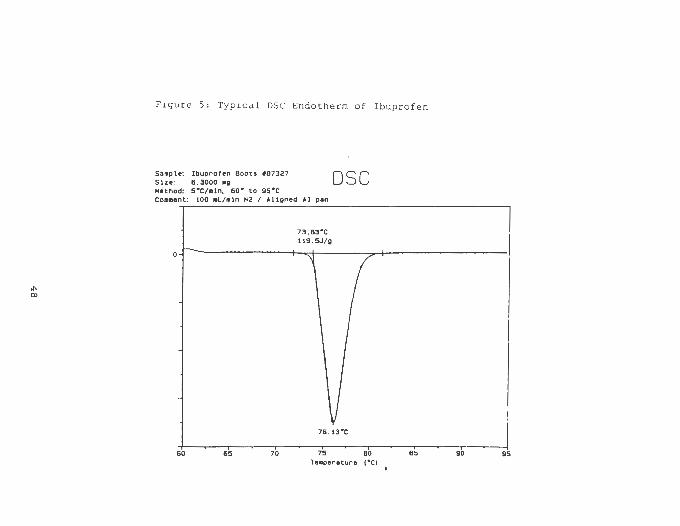
test. The thermal analysis gave more information on the
crystal structure. All the DSC curves exhibited a unique en
dotherm in the range 75-76°c with enthalpies of fusion
ranging from 113 J i g to 118 J i g. An example of a typical DSC
profile of ibuprofen is shown in figure 5 and all melting
points are reported in table V. An analysis of variance did
not show any significant differences indicating that the
ibuprofen tested do not exist as different polymorphic forms
and the internal crystal structure is equivalent for all
sources. Nevertheless. the enthalpies of fusion are statis
tically different. The results of an F-test , shown in table
VI. suggest that ibuprofen has variable crystal surface
22

structure. as anticipated from the scanning electron micros
copy photographs and the X-ray diffraction patcerns in
figure 6. The general shapes are similar for all sources
however. for low angles of the spectra. the intensity of the
first deflection peak varies between materials indicating a
difference in external crystallinity. Except from Francis
high D. which exhibited a flow index of 18.5 ( a flow index
of 19 is representative of good flowability properties ) all
ibuprofen powder did not flow through the orifice of the
flowmeter.
The wet granulation process divided the sources into two~
groups: raw materials with l ow liquid requirements for the
end-point ~figure 7) and crystal s with high liquid require
ments ( figure 8). It is appreciated that the power scale
does not represent means of differentiating between sources.
rather the general shape of the power consumption curves was
analyzed in detail with emphasi s given to the inflection
points where the torque required to rotate the paddle at the
same speed within the wet granules increased suddenly. The
increase in wattage was attributed to a change in the physi
cal state of the wet mass, which we associated with the end
point of the granulation also represented by the arrows on
the power consumption curves. The addition of water was in
terrupted upon observat ion of this increase. The arithmetic
average of liquid requirements are reported in table VII.
23

This categorization between sources was not performed ar -
bitrarily but using an analysis of variance and Duncan ' s
mulciple comparison procedures which divided the raw
materials into two groups with a 95% confidence level ( table
VIII ) . Ibuprofen powders with high liquid requirements and
ibuprofen sources with low liquid requirements. As a conse
quence of end point requirements. the moisture content of
the wet mass. measured ac 65°c before the drying step ex
hibited differences recorded in table IX. Loss on drying
profiles ( figure 9 ) were also different probably indicating
variations in the channels and pore tortuosity of the~
granules in which the moisture migrates to the surface to
evaporate. Granules from different sources were mixed with
lubricant for ten minutes and tabletted. An acceptable com
paction force was applied (10-15 KN ), the hardness of the
corresponding tablets measured and reported in table X.
Several comparison procedures were applied to evaluate the
effect of independent variables such as particle size or
amount of active. Although, not using an interactive model.
some inferences could be made on the size effect with the
ANOVA in table XI. The sum of square due to the particle
size of the raw material demonstrated that about 50% of the
hardness variability among granulations was due to dif
ferences in particle size fraction and distribution of the
starting material. The differentiation and classification of
24

l
the sources by liquid requirements was confirmed on the com
pacti on versus hardness investigation. The crushing strength
of tablets made with Boots and Francis Low D. sources was
higher for the same level of compression forces as compared
to the other powders. Dissolution profiles of ibuprofen
cores did not indicate any significant differences in the
release from the various formulations and based on the pre-
vious preformulation experiments, we
problems of biological availability with
do not forecast any
the use of dif-
ferent sources. Further studies will include the analysis
for the enantiomeres of ibuprofen . Figure 10 shows the.
various dissolution profiles and calibration curve for the
ibuprofen cores. In order to preserve the clarity of the
figure. the percentage dissolved after 70 minutes are not
represented as they did not bring further information on
possible differences between sources. Figure 11 shows a com
plete dissolution profile of ibuprofen cores made with one
source (Cheminor ) . The low disintegrant level ( 1% ) and its
position in the tablet formulation (100% intragranular) are
responsible for the slow ibuprofen release rate. Further
studies include the optimisation of the concentration and
position of the disintegrant when the active / diluent ratio
is increased.
25

CONCLUSIONS
The process of chemical synthesis or isola0ion of
drug substances and excipiencs used in tablet formulation
although designed to produce materials of reproducible high
chemical purity , may not necessarily result in batches of
product with equivalent physico-technical properties . The
nature of the solvents or the concentration of intermediates
present in the liquors used for crystallisation can affect
particle morphology including crystal dislocations. surface
rugosity and surface area. Those properties. although not.
reflected in significant differences in melting points.
solubility or crystal forms. can influence compression
characteristics and possibly the amount of granulating fluid
required to produce a coherent mass. This conclusion under
lines the importance of the preformulation and in-process
testing when using different suppliers and possibly dif
ferent batches of the same material.
As the different ibuprofens tested did not exhibit
major variations in physical-chemical properties and d o not
exist as different polymorphs, various sources of this ac
tive could be used in oral solid dosage forms without risks
of altering the biological availability. Nevertheless,
during the course of this study several important dif
ferences were detected. Possibilities of variations in
liquid requirements for the end-point. which could be
26

predicted from particle size analysis and apparent density
measurements. have to be kept in mind as they affected the
final hardness of ibuprofen cores. To date all commercial
ibupr ofen tablets are coated and the ease of coatability.
mostly relat ed t o friability and hardness. is a crit ical
parameter in f ormulati on technology. Certainly , s ince dif
ferent sources led to substantial differences in hardness
( as a result of higher end-point liquid requirements ) .
coatability functi on may be affected by slight differences
between sources. As a consequence. when consistent varia
tions between two sources can be detected through a solid,
state preformulation program , key parameters such as den
sity. crystal size . surface area and crystal s urface
morphology may be used to predict problems in the formula
tion behavior. It is appreciated that the conclusions of
this work d o not advantage one s ource over another. since at
any moment of the formulati on stage the processing
parameters can be modified to obtain final products in ac
cept able ranges , rather those observations underline the
importance of a strict and detailed physical pharmacy
profile for materials from different suppliers and suggest
the usefulness of two validation procedures or two standard
operating procedures specific to each one of the sources.
thus avoiding costly unexpected pharmaceutical behavior
during large scale operations.
2 7

( Aknowledgeme nts
One of us ( AJR ) thanks Ciba-Geigy Co. for the award
of a summer fellowship and the opportunicy of using the
equipment available in the Pharmaceutics and Pharmaceutical
Technology laboratories . we also would like to acknowledge
the support and expert advice of many Ciba - Geigy scientists.
especially Mr . Louis Savastano whose careful supervision
made this project possible.
28

REFERENCES
1. Hakan Nyqvist
Dru g Dev .Ind . Phar m. 15 ( 16&17 ). 957 - 964 (1989)
2. N. Udupa
Dr u g Dev . Ind.Pharm . 13 ( 15 ). 2749-2769 (1987)
3. M. P . Summers. R.P. Enever and J.E. Carless
J.Pha rm. Sci . 66 (8), 1172-1175 ( 1977 )
4. C. Lefebvre. R. Bouge. J. Ringard and A.M. Guyot-Herman
"Modification de l ' aptitude a la granulation d ' un
principe actif imputable a l ' augmentation de la
solubilite de surface de ses particules.
Presented in Agpi Paris (1 989 )
5. C. Lefebvre . H . M. Guyot-Herman. J.C. Guyot. R. Bouchet ,
and J . Ringard
Dr u g Dev . Ind . Pharm . 13(9-11 ) . 224-235 (1988)
6 . Harry G. Britain
Drug Dev . Ind . Pharm . 15(13 ), 2083-2103 ( 1989 )
7. T . M. Jones
J.Pharm . Pharmaco. 31, 17-23 ( 1980 )
8. P.D. Walds on , Gary Galleta. Nancy Jo Brade n and Laura
Alexander
Acta . Pharmaco.Toxico . 59 ( Supp . V). 155- (1986)
9 . H. Vromans. A. M. DeBoer , G.K. Bolhuis and C.F . Lerk
Acta Pharm . Suec . 22, 163-172 ( 1985 )
10 . Jue Chen Lin et al
29

Drug Dev .Ind.Pbarm. 13 ( 12 ) . 2087 - 211 0 ( 1987 )
11. A. Stamm and L. Paris
Drug Dev.Ind .Pbarm . 11 ( 2&3 ). 333 - 360 ( 1987 )
12. Kumar A. Khan and C.T. Rhodes
J . Pharm . Sci . 65 ( 12). 1835- 1837 (1976 )
13. R . P . Jordan and C.T. Rhodes
Drug Dev . Ind . Pbarm .. 5. 151- ( 1979)
14 . A.J . Romer o. L.T. Grady and C.T. Rhodes
Drug Dev . Ind . Pbarm . 14 ( 11 ) . 1549-1586 (1988 )
15. I.e. Edmonson
"Advances in Pharmaceutical Sciences· Vol.2
Edited by H. S . Bean. J . E. Careless and A.M. Beckett
Acade mic Pr ess. London 1967 pp-95
16. Z.T. Chowan and L. Palagyi
J . Pbarm . Sci . 67 (10). 1385-1389 (1 978 )
30

Table I SOURCE AND ORIGIN OF IBUPROFEN
Name Origin Abbreviation
Francia Low Density Italy Franl.D
Francia High Density Italy FranH.D.
Boots U.S.A. Boots Ethyl U.S.A. Eth Chemin or India Chem.
31

Table II :
STARTING FORMULATION
IBUPROFEN 57 "' FAST FLOW LACTOSE 36 "' PLASDONE 6 "' EXPLOTAB "' LUBRICANT "' GRANULATING FLUID (WATER) q.s.
32

Table Ill
MEAN PARTICLE SIZE < .. cRoHsl
SOURCE
FRANCIS LOW D.
BOOTS
ETHYL
CHEMINOR
FRANCIS HIGH D.
SRINCKMAN PART ICLE SIZE
M1cron1sed Water Suspensions
lurfac•-Numb.,.
Mean
3.17 3 .58
5 .23 7.94
10.54
ANALYZER
33
Surface-Wtlgtlttd .....
5.03 6.22 18.18 31.07
38.25

"' ii>
2
Table IV
SURFACE AREA
B.E.T. VALUES (SD) in m /gram
FRANCIS LOW D. 0.76 (0.03)
FRANCIS HIGH D. 0.86 (0.09)
ETHYL 0.34 (0.01)
BOOTS 0.41 (0.03)
CHEMINOR 0.36 (0.04)
(•) UNMICRONIZED SAMPLES

Table V
MEL TING RANGES
DIFFERENTIAL SCANNING CALORIMETRY
SOURCE ONSET (SD) MEL TING POINT (SD)
CHEMINOR 73.0 (0.2) 75.4 (0.05)
"' ETHYL 73.2 ( 1.4) 75.6 (0.10) (JI
BOOTS 73.8 (0.2) 76.1 (0.10)
F.LOW D. 72.4 (0.1) 7 5.1 (0.10)
F.HIGH D. 73.4 (0.1) 75.3 (0.10)
All valuas ara reported in degrees Celsius

Table VI
ENTHALPY OF FUSION OF VARIOUS SOURCES (Jig) ANALYSIS OF VARIANCE TABLE
SOURCES
ERROR
TOTAL
df
4 16
20
SS
67.63 57.96
125.60
MS
. ;.91
3.62
F
4 .67
p
0.01
At the 991' confidence l•vel tt'•«• Is • • lgnUlcent difference In AH'• o t 3 to 5 J/ g
36

VI -'I
Table VII
LIQUID REQUIREMENTS FOR IBUPROFEN
GRANULATIONS END-POINT
SOURCE MEAN VOLUME (SD) IN ML
ETHYL 27.8 (4.2)
F.HIGH D. 31.2 (3.4)
CHEMINOR 31.5 (5. 1)
BOOTS 44.0 (6.7)
F.LOW D. 58.2 (2.2)
Liquid requir ement s for 1 7 5 gm batches
The average repor ted was obtained trom ell granulations

(
Table VIII EFFECT OF DIFFERENT SOUR - cS :
LIQUID REQUIREMENTS FOR GRANULATION END-POINT
DUNCAN'S MULTIPLE RANGE TEST
SIGNIFICANCE LEVEL ex • 0 .05
27.8
ETHYL
31.2
FHIGHD.
31.5
CHEM.
44. 0 58.2 (ML)
BOOTS FLOWD.
ANT TWO AVERAGE NOT ~ERLINED BY THE SAllE SEGMENT ARE SIG .. ICANTL T DFFERENT
38

Table IX WET GRANULES: MOISTURE CONTENT
ETHYL FRANCIS HIGH D. CHEMINOR BOOTS
FRANCIS LOW D.
Loss on cty1no at 65 degrees C
11 %
13 % 18 %
23 % 32 %
39

Table X
HARDNESS LEVELS COMPACTION RANGE (KN) 10-15:
SOURCE FORCE(KN) HARDNESS(Sc)
ETHYL 10 - 15 19-22
BOOTS 12-14 22-29
CHEMIN OR 12-14 12-24 FRAN.LOW 11-13 19-28
FRAN.HIGH 10-12 18-25
40

Table XI AHlyal1 of Variance for tablet hardneaa Ona degree of lreedoom compariaons
Source di SS MS F p- value
Among granulations 11 3651.1 331 .9 25 .7 0 .001
Ethyl Va. Boote 1 127 . 1 - 9.8 0 .025 Size1 Va. Size3 1 390.1 - 71 .0 0.000
"' Slze2 Va. Size3 1 891 .6 - 69 . 1 0 .000 .... Size1 Va. Size2 1 427 .5 - 33 . 1 0.000
Within Granulations 66 852 . 1 - 12.9
S1ze1 : Sieve Frac tion 20/40 ; S1ze3: Sieve Frac ti on BO/Pan S1ze2: ibuprofen as 1s

. ,_ 0
~ c: 0 :;:: .. :::s I :e
.!:: c ~ • =
VI • Q :IE
l"" ;"" ~ 1" <l,,
r ~ + ~
0 0
+ '~- -+ ,'<l'',q
' '\.
0 0
+ ' ea~~&. ..
--:~:'~ 0
+ ' l'l + 'Q:i
- -.............. . _ + ~ . - ............ ___ + \~
0 ..,
4 2
..... ,_ + O<i
' " ~ + \ \ "
\ I
It)
00
. ..

figure 2 App.rent Butk •nd T•pped Den11tle1
- Bulk fiml Tapped
100
75
!
i 50
25
0 ETHYL BOOTS CHEM. FRANLO. FRANHO.
43
Figure 3:
Scanning Electron Microscopy Photographs of
Ibuprofen crystals
I) FLO: Francis Low Density
II) FHD: Francis High Density
III) Boots
I V) Ethyl
44

45

Figure 4:
Scanning Electron Microscopy Photographs of
Ibuprofen crystals
I) and II) Cherninor
II) and IV) Ethyl: different batches
46

47
II> Cl>
Figure 5: Typical DSC Endotherm of Ibuprofen
Sample: Ibuprofen Boots 187327 Size: 6 . 3000 11g Method: 5•c1a1n. 60" to 95•c Co•••nt: 100 •L/a11n N2 I Al 1gned Al pan
73.eJ•c 119 . 5J/ g
DSC
or---~~~~~~-+-.:+-~~~-,,-+~~~~~~~~~-
7& . 13•c
60 65 70 75 80 85 90 95 Te•pereture c•c1

F,~ure 6: X- Ray Diffraction Patterns of Ibuprofen
Sources A. Francis High o. B. Francis Low o.
c . Cheminor D. Boots E. Ethyl
49
A B
c
D
E

...
z 0 j:: <( ..... ::> z <( a:
" I-
"' :t a:
.. 0 ..... " .~z ... 0
j:: Q.
2 ::> Ill z 0 (,)
a: "' :t 0 Q. . = "
'<l
= •n•M
50
\
.. E i= c .2 ii :; c .. <;

z 0 j:: «( ...J :::> z «( 0: ~
.... • ... 3: • co 0:
~ 0 ...
::s .~z ... 0
j:: ... :I :::> Cl) z 0 <..>
0: ... 3: 0 ...
0 ..
~ •0
~~ ~II I I ...
.. '
"· ... ,.'~ •, ··· ... ..
I I
~ 0 . ~
311
•
'-.._ ··· ..... -----...--·--.-~
• ,, <=i I . ~ ' .. ' --. ,,
.• ,,. I
51
"'
"' z ~
O> • E j::
c .2
"' ii '; c • (;
.. 0
0
(
0 0 a: :t ;i: 0 " 0 _, "' z :;: _,
>- .... i z z :t 0 w < < .... 0 :z: a: a: w .. u ... ...
f I I <i • + t I
I
r ;:i •:+- 0 .. , 1.· : ,
I I , 1 I
I
I ~ I <I · / 0 I
"' I I
...... / ,' I c < ,, I ! r I 0
"' , ...
w /I I ~ ...I u::: I 0
en "' 0 I I I ti a:: I I -... CL ./] .... + I
co :I I , .!!!'CJ '/ I ti LL Z 1, I E
> I I j:: a: I/ ) Q /'
0 Q .. . : z I I I I I >
0 ./] I ... + Q I I I
"' I I
"' · 1 0
I
I :; ...I I I
I / : I
I I
0 0 ~ 0 ..
(M/M) 0.59 J8 iuaiuoo aJnJS!OW
52

0 0
~)Ci ... h• f~
"' ' ~p ' 2 0 I .
I 0 ~Q
z f I w
I LL : o• a:
0
~· · c
~ ~~ 0 !
0 :I ' w ~ LL tb :I u... 0 ' j:::
' z• <I,
28 I- • :::>' ...I -0 O • "' '
"' = cE
T 0 0 0 0 0 "'
0311\10SSIO .l.N31::>113d
53

0
"' ::E w ::t: 0
fl) -----< w "' a: M
0 -1 0
z w u.. c 0 ! a: 0
~ Cl. .,, .. " :::> "' E ii: ~ i=
u.. 0
z 0 "' j:: • :::> :IE _, w 0 J: fl)
()
fl)
f 2i 0
0 .. 0 .. 0 0 ... .. "'
P•AIOHIO ,.
54

MANUSCRIPT II
MONITORING CRYSTAL MODIFICATIONS IN SYSTEMS CONTAINING
IBUPROFEN
55

Key words: Ibuprofen: Crystal analysis: Hydrophobic network:
Intermolecular interactions: Formulation effects.
SUMMARY
Qualitative and quantitative crystal analysis . including
differential scanning calorimetry, X-ray powder diffraction
and scanning electron microscopy were performed at different
stages of ibuprofen tablet manufacture obtained at three ._
levels of compaction. Melting points and enthalpy of fusi on
were carefully monitored and compared using statistical
techniques ( ANOVA and one degree of freedom procedures ).
Drug - disintegrant interactions were investigated using a
fractional factorial design. wetting and compaction affected
the crystal surface as measured by a 0.2 to 8 .6 KJ mole
decrease in the heat of fusion.and a shift of 2-3 °c in the
melting point. The differences were too small to suggest the
existence of enantiotropically or monotropically related
polymorphs. The results. however. indicated a lattice
modification of ibuprofen during processing . The initial
dissolution rates appeared to be inversely related to the
amounts of ibuprofen in the formulation and the fastest drug
release was obtained for a 1 / 3 intragranular ratio .
56

INTRODUCTION
Fundamenoal investigations. especially in the field of
compaction and weo granulation. have long established that
pharmaceutical processing can modify some characteristics of
raw materials in such a way that can be detrimental to the
overall performance of the final drug product ( Lefevbre et
al 1986, Chan et al, 1985 ). Monitoring crystal changes has
become essential in order to optimize many formulations
(Haleblian et al, 1975). For example, sulfanilamide crystal
habit was altered as a function of increased compression
forces or exposure to liquids ( Cruaud et al. 1981 ) and
physical interactions between ibuprofen and excipients can
induce eutectic behavior (Gordon et al. 1984; Mura et al.
1987 ) . The latter does not necessarily mean adverse incom
patibility but may explain handling difficulties. Many
pharmaceutical manipulations will affect the crystal habit
of drug substances and these modifications may have adverse
consequences on the formulation ( Cruaud et al , 1981 ) or the
drug bioavailability (Aguiar et al, 1967 ).
Crystal properties of ibuprofen are known to influence
the processing behavior ( Romero et al. 1991; Hiestand et al .
1981 ) . This aspect of ibuprofen formulation is well docu
mented and it is generally recognized that the drug
undergoes changes due to processing ( Franz et al. 1986). For
57

example. eutectic behavior has been proposed with some phar
maceutical excipients ( Gordon et al. 1984 ) and although
never experimentally proven . surface sintering has been sug
gested as a theory for rearrangement of crystal lattice
during compression ( Alhe c et al. 1990 ).
Nevertheless. very little has been published to support
evidence of the crystal modifications of ibuprofen. Thus .
the mechanisms and consequences of such alterations have yet
to be identified for this particular compound.
The objectives of this work were to elucidate the
mechanisms of crystal distortion by which ibuprofen is
modified during its processing and to investigate these ef
fects on ·the biopharmaceutical properties of a model
formulation.
EXPERIMENTAL
Materials
Ibupr ofen USP grade was obtained from the Ethyl Co .
(LottLH-6-72 ) . Wet granulations containing Fast Flow Lactose
( Sheffield lot *59009). Povidone (P.V. P.-GAF lotiG-30223A)
and Explotab ( Edward Mendell lot #l 336 ) were prepared using
purified water. Granule lubrication was achieved using
Magnesium stearate ( Fisher Scientific Co. ). The potassium
58

monobasi c phosphate and sodium hydroxide used for dissolu
tion medium and buffers were obtained from Fisher
Scientific. All chemicals were of analytical grade.
Ibuprofen standards for spectrophotometry and differential
scanning calorimetry ( DSC ) were provided by the Standard
Divisi on of USP Rockville. MD .
Methods
The experimental design consisted of analyzing ibuprofen
after dry mixing with excipients , wet massing and tableting. -
The model formulation . defined in table I was prepared using
five process steps presented in table II . The percentage of
active were 57, 67 , and 77 percent . Mixtures of ibuprofen.
the diluent , the binder ( 6 percent ) . and the appropriate
amount of disintegrant were dry mixed for ten minutes. The
powder was wet granulated in a planetary mixer ( Kitchen
Aid. model K5 - A. Hobart ) until the end- point , monitored by
power consumption , was reached. Flow rate o f the granula
tion liquid remained constant throughout the entire
experiment. Granules were dried on a tray at 40 °c for
twelve hours and later mixed with lubricant in a V-blender
for ten minutes. Lubricated granules were then compressed
into 350 mg tablets using an instrumented F3 single punch
press. Three compaction pressures were investigated : low.
59

int ermedi ate
respecoively ) .
and high ( averag ing 1.10 and 3 C KN
At the end of the manufacturing steps I , III , I V and v
( table II ) . s amples were withdrawn and analyzed by X-Ray
powder diffraction and scanning electron microscopy ( SEM )
photographs. Thermal analysis ( DSC ) was performed on all
samples ( Kim et al , 1985 ) using a Perkin Elmer. series 7 in
strumented unit, calibrated with i ndium and interfaced with
a P 7500 E computer. For whole tablets , the electron micros
copy photographs were shot at 35 and 80 ° angles on pressed
and side surfaces, on hor izontal and vertical cross section _
of table ts embe dded a nd prepared according to a method
describe d by Hess , ( 1978 ) .
Cry stal Packing
The unit cel l of ibuprofen crystal was analyzed using
the mo l ecular mode l ing software. The coordinates of single
X- ray reflection data was obtained from the literature
(McConne ll , 1974 ) and t he molecular arrangement of a cryst al
lattice , simulated on thi s program.
Comparative Analysis
I n an effort to mimic the effect of processing,
ibuprofen and physical mixtures of the formulation were
60

gr ound thor oughly for t en minute s in a mortar or melted at a
temperature above 80 °c and recry stallized u pon coo ling at
r oom t e mperature ( RT ) . Di fferential scanning calorimetry was
further performed on the samples and their thermal profiles
compared t o those of pure and formulated ibuprofen .
Additionally. ibuprofen hygroscopicity was meas ured after
storage at 35 °c and 85% relative humidity ( RH ) . Karl Fisher
analysis was performed at regular time intervals on 100 mg
samples exposed to humidity.
Biopharmaceutical Properties
The dissolution apparatus used a paddle rotating at 50
RPM in a USP phosphate buffer at pH 7 . 4 and a temperature of
37 °c. This method using a six vessel dissolution apparatus
(Vankel ) had been shown to discriminate between various
ibuprofen formulations ( Romero et al , 1988 ) . An ultra-violet
spectrophotometer wa s used to determine the concentration of
ibuprofen at 264 nm in the dissolution fluid. For low
ibuprofen concentrations. the percentage dissolved was also
calculated f r om measurements obtained at 220 nm.
Statistical Analysis
61
All results were analyzed statistically using an
analys is of variance at the 99% confidence level to deter
mine differences between enthalpy of fusion and melting
ranges . Sums of squares were calculated to perform one de
gree of freedom comparisons using orthogonal contrasts.
These tests allowed the investigation of pure compaction ef
fect on the thermal parameters . A restricted fracti onal
factorial design was used to test the effects of
drug disintegrant interactions. The independent variables
were amounts of active and the concentration of ex
tragranular disintegrant. All factors had three levels . In _
the interpretation of the data greatest weight was placed on
a ny effects on dissolution.
RESULTS AND DISCUSSION
Crystal Packing
The single crystal unit cell for the racemate included
four molecul es: two R(-) and two S(+) isomers. two central
hydrogen bonds between the carboxyl ic f unctions of
dextrorotary and levorotary molecul es ( Fig . 1). In addition
figure 2 shows the juxtaposition of eight crystal unit
cells. The hydrogen bonds between cells could be identified.
Each inte r molecular interaction was shared betwe en fou r
other cells as favored by the preferential positioning of
62

R(-) and S ( ~) molecules . Except for the top - left cell
retained f or baseline comparison. each unit has been cleared
of the molecules not involved in the intercellular interac
tions. The resulting effect is the delimitation of a plane.
on which intermolecular distances are most likely to be af
fected during tangential stress. Thus this eight cell system
may explain the observed lattice weakness.
The mass fraction of water obtained by the Karl - Fisher
technic , averaged ( 0.063% + 1- 0.001 ) and (0.55% + - 0.004 )
before and after exposure to humidity respectively. This
analysis confirmed that although the moisture increased ten _
fold after exposure to 85% relative humidity for 76 hours .
it did not.exceed 0.55% possibly concentrating at the sur
face since ibuprofen does not include crystallization water.
This amount of moisture. was defined by Alhec and Zografi
(Alhec et al, 1990 ) as plasticization or molecular mobility.
Thermal Analys is
Thermal analysis of ibuprofen indicated that only com
paction or grinding of the physical mixture affected the
melting point and the heat of fusion (table III ) . All
parameters were compared at the 99% confidence level.
Furthermore. the enthalpy of fusion decreased progressively
to as low as 18.l KJ / mole during the tablet manufacture. If
the assumption that a pure equilibrium exists at the melting
63

point ( Tm ) is valid. then the changes are probably ~ndica-
tive of enthalpic modifications ( weaker intermolecular
interactions ) at the crystal surface before compression.
then :
t.G - t.H - Tm . t.S equation 1
at Tm the melting po int. t he free energy t.G sh ould
equal zero. with t.Hf the enthalpy of fusion of the sample,
t.t.Hf the enthalpy loss and t.Tm the melting decrease.
t.G O and t.H Tm . t.S equation 2
Mixing with excipients and process ing are the combina-
tion factors responsible f or the enthalpy drop. Table I V
summarizes the statistical analysis of thermodynamic
parameters . All enthalpy of fusion were significantly dif
ferent as determined by the F test ( see table IV ) . The
magnitude of the shift depended on the stage of processing.
The orthogonal contrasts Ll , L2.L3 were found statistically
significant. Compression had an effect on the enthalpy of
fusion and ibuprofen in lower strength formulation appeared
to be less sensitive than in higher strength tablets . The
heat of fusion for ibuprofen was less affected in granules
than in tablets.
64

X- Ray Crystallography
In figure 3 the X-Ray diffraction patterns of pure
ibuprofen dry granules and ground tablets indicated crys-
tal changes of ibuprofen during pharmaceutical
manipulations: dilution with excipients only decreased the
intensity of the diffractogram. Wet granulation , h owever.
induced a slight rearrangement of the cr··stal lattice . At
low angles of the spectrum , the 12.2° deflect i on peak com
pletely d isappeared leaving an amorphous region. No further
changes were visible on the X-ray diffraction pattern after
compaction.
Scanning Electron Microscopy
In order to complement results of the thermal analysis ,
qualitative observations were performed by SEM.
Morphological changes from pure to formulated ibuprofen were
visible at the XlOOO magnification as shown on figure 4. On
the tablets. the crystals are visible but the particle
boundaries are not detectable (indicating cold bonding or
fusion at the surface). Thus , an ibuprofen network appeared
to result from sintering of the ibuprofen crystals during
processing. Cross sections of tablets showed a film of PVP
( light membrane ) covering packs of ibuprofen crystals
( dark). Some starch glycolate particles are also visible.
65

The macroscopic observation of SEM phocographs confirmed the
crystal disorder suggested by chermal analysis : the wet
granulation process induc ed the lattice fragilization and
upon compaction . further crystal disrupti on occurred with a
poss ible consolidation of the hydrophobic matrix . The dis
integration and dissolution analysis confirmed that the
ibuprofen network was indeed hydrophobic. When two ibuprofen
particles are in contact. within a formulation . thermal
properties have already been disturbed; upon compaction.
enough mechanical ener gy is provided to induce cold welding
or sintering of the crystalline envelopes of ibuprofen as _
visualized on these S.E.M photographs.
Effect of Process ing
The decrease in Tm averaged a statistically significant
2-3 °c upon compaction. ATm was not proportional to the com
pression as indicated by paired t tests (fig.5 ) . The
reported values of compaction are arithmetic means of upper
punch compression forces recorded on the instrumented press.
The e n thalpy decrease AAHf was defined as t he difference be
tween the heat of fusion of pure ibuprofen and the energy of
fusion of the formulated ibuprofen . AAHf was indicative of
the extent of some crystal modifications. The effects of
compaction and low ibuprofen strength on the thermodynamic
parameter have been found statistically significant ( table
66

I V). I n f i gure 6 f or all Sorengths studied t he enthalpy l oss
inc rease d a nd stabilized at a plateau value . Low conc ent ra -
oio n s of ibuprofen seemed t o be less sensitive t o me chanical
stre s s . The latter. however. had the highest shif t before
tableting. These results are conclusive of two opposite ef -
fects of a low active excipient rati o during tablet
manufacturing. Similar effects had been previously sug ge s ted
by a study on the pharmaceutical processing of sulfanilamide
( Cruaud et al. 1981 ) .
Dissolution Studies
The dissolution profiles of ibuprofen cores also ex-
hibited similar trends , as seen in figures 7 - 8 . Low
ibuprofen content led to cores with fast dissolution rates
as compared to higher strength dosage forms. Although the
data suggested that initial drug release rates might be re
lated to the extent of the ibuprofen network ( table V) . any
correlation was insignificant because of the limited number
of points. The crystal modi fication of ibuprofen created the
surface hydrophobic network within the tablet that may be
quantified by AAHf. The latter seemed to be the limiting
factor of drug release . The dissolution efficiency was op
timal for the lowest amount of ibuprofen and the highest
concentration of disintegrant (3% ) in the 1 / 3 intragranular
67

ratio. Formulati on with 100% ex,ra or intragranular disin
oegrant had l ower dissolution efficiencies than did
formulati on c ombining extra ' intragranular disintegrant at
the same c onc entrati on.This might be another evidence of the
existence o f the hydrophobic network.
CONCLUSIONS
The crystal packing of ibuprofen occurs with a preferen
tial orientation in which a weak plane has been identified
as probably responsible for the crystal modifications during _
compaction.
Pharmaceutical processing does alter the crystal habit
of ibuprofen ( not its internal structure ) in a stepwise man
ner. We identified three progressive mechanisms:
Mixing with excipients: destabilization and fragilization of
intermolecular interactions, wet granulation: distribution
of water in the amor phous regions. Both mechanisms account
for a drop of 4.1 KJ / mol e in the enthalpy of fusion and
predispose the ibuprofen to col d welding. Compaction: brings
the enthal py decr ease to another 6.2 to 8.6 KJ / mole and
provides enough energy to catalyze sintering as observed on
the scanning electron microscope. In addition to lattice
rearrangement , the resulting ibuprofen network is
hydrophobic and could be the limiting factor of drug dis
solution. As a consequence formulators must be extremely
68

cautious vhen increasing ibuprofen concent ration in t ablet
formulation.
REFERENCES
A. J . Aguiar , J . Krc, A. W. Kinte l and J .C . Samyn
"Effect of Polymorphism on the Absorption of
Chl oramphenicol from Chl o ramphenicol Palmitate "
J.Pharm.Sci . , 56 (7), pp 847 - 853. 1967
C . Alhec and G. Zografi
J . F .
H. K.
"The Molecular Basis of Moisture Effects on Drugs
in the Solid State."
Accepted Int . .r.Pharm . , 1991
McConnell
"2 -( 4-Isobutyl Pheny l ) Propionic Acid.
Cr~:;it.S:truQ:!; . CQmm . 3 , pp 73 - 75. 1974
Chan and E . K. Doelker
"Polymor phic Transformation of Some Drugs under
Compr ession"
I.llll.E . 11 ( 2&3 )' pp 315 -332. 1985
O. Cruaud , D. Duchene, F. Puisieux, A. Chauvet, J . Masse
"Etude des Transformations Poly morphiques du
Sulfanilamide au cours de la Fabrication des
Comprimes"
.r . Pham . Belg. , 36 ( 1 ). pp 15 -20, 1981
Robert . J . Franz ,
69

"Stable High Dose. Hi gh Bulk Density Ibuprofen
Granulati ons for Tablet and Capsule Manufacturing"
U.S . Patent 4 , 609.675 Sept. 2. 1986
P.E. Gordon , C . L . Van.Koevering , and D.J. Reits
"Utilization of DSC in the Compatibilty Screening
of Ibupr ofen with Stearate Lubricants and
Construction of Phase Diagrams "
Int.J . Pharm. 21 : 99-105. 1984
John K. Haleblian
"Characterization of Habits and Crystalline
Modifications of Solids and their Pharmaceutical
Applicati ons "
J.Pharm.Sci 64 ( 8 ), pp 1269-1288. 1975
H. Hess
"Tablets Under the Microscope. "
Pharm.Tech., pp 36- 50 , Sept. 1978
E . N. Hiestand , G.E . Amidon , D. P. Smith , and B.D . Tiffany
"Mechanical Property Changes of Compacts from
Various Rates of Crystallization of the Solid.
Proc.Techn.Prog.Int.Powd.Bulk Solids Handling
Proc. , Rosemont. IL 1981
H. Kwon Kim , M. J. Franck , and N. L . Henderson
"Application of DSC to the Study of Solid Drug
Dispersion " J.Pharm.Sci .. 74 ( 3 ), pp 283-289 . March
1985
C . Lefevbre, A. M. Guyot - Hermann , M. Draguet , R . Bonde ,
70

and J.C. Guyot
"Polymorphic Transition of Carbamazepine during
Grinding and Compression·
rilll.E.... 12(11&13) , pp 1913-1927. 1986
P. Mura , A. Liguori, G. Bramanti , and L. Poggi
"Phase Equilibria , Crystallinity and Dissolution
Rates of Ibuprofen-PEG 20.000 Solid Dispersions ·
Il Farrnaco-Ed . Pr., Vol. 42. Fasc. 6. pp 157-164 ,
1987
A. J. Romero , L.T . Grady and C. T . Rhodes
"Dissolut ion Testing of Ibuprofen Tablets "
D. D.I.P. , 14 ( 11 ). pp 1429-1457 , 1988
A. J . Romero , G. Lukas, C. T . Rhodes
"Influence of Drug Sources on the Processing and
the Biopharmaceutical Properties of High Dose
Ibuprofen Formulations.·
Pharm.Acta Rely .. 66(2 ), 34-43 , 1991
Aknowledgements
This work was supported by Ciba-Geigy Corporation
We aknowledge, with gratitude the help of Dr . Franck Clarke ,
Basic Research at Ciba- Geigy who made invaluable contribu
tions to the success of this project
71

Teble I: Formuletlona UHd In thla Study
Ingredient Amount In %
Ibuprofen 57 67 11 Feat Flow LectoH 36 26 16 P.Y.P. 6 6 6 Ilg Steerete 1 1
% Ne Sterch Glycolete • 1 2 3 1 2 3 1 2 3 -'1
"' •D11tails on th11 111• lntragr11nul11r ratio 1 1/2 1/3 1 1/2 1/3 1 1/2 1/3
Purified Weter q.1. q.1. q.1.
All ay1tema contelned 1 % of lntregrenuler dl1lntegrant
. '

-<I Vl
Table I: Experimental llethodology
ProceHlng
Dry ••Int (V-Blender) 1 O mlnutea (Ibuprofen, LactoH, Explotab, PVP) Wet Granulatlon (llonltored by power conaumptlon) 12 how tray drying at 40 C •xllllg (V-Blender) 10 mlnutH (QranulH, Explotab, Lubricant) Compaction
Stepa
II
HI IV
v
Analyala
DSC, SEii, X
DSC, SEii, X DSC, SEii, X DSC, SEii, X DSC, SEii, X DIHolutlon Hardneaa
DSC: clfferentlal acannlng calorlmetry, SEii: acannlng electron .icroacopy, X: X-ray cryatallography,
' .

T8ble •: Thermal Analyal• of Ibuprofen
II.Pt.( SD) AH (SD) AS [J.G - . 'K ] [oC) [KJ/mole)
IBUPROFEN Pwe 77.7(0.6) 25.7(0.53) 0.35 Ground 76.8(0.2) 23.7(0.93) 0.33 Melted(•) 76.9(0.,) 23.0(0.91) 0.11 RH(••) 77.2(0.3) 25.6(0.06) 0.35
~ Phyalcal
ti> Mixture 77., - 21.0 - 0.29 Ground 75.3 - 18.1 - 0.25
Granule• 77.3(0.2) 21.9(1.29): 0.30
Tablet• 75.2(0.9) 18.2(1.71) 0.25
(•) recryatalllzed at RT, (••) 76 hour• at 85 " RH (., atellotlNllr alllllf!CMI ...,.,....,. _.,... lo -· ._ ....
' '

Table IV: ANALYSIS OF VARIANCE (ENTHALPY OF FUSION) One degrH of Freedom comparisons
SOURCE DF SS llS F F o .0 1.1,4t
Among Formulations 9 •365.7 •B5.1 13.62 7.3
• L 1 KN Vs. NoKN 1 - - 948
-.;i L.Z Low KN VS
• (JI High/Reg KN 1 - - 429
£3 A-57% Vs. C-67% or • E-77% 1 - - 19.8
Within Formulations 33 1157.3 35.6
(•) indicates a significant difference (99% confidence level)
' '

'al c .~ • 0 • .,
• CID C! • • Cit 0 0 c
: E 0 0 ... ::: • .. • • Q • a: -;:: - • • a: • a: 0 • • 4'! 0 GI! • ~ • • Cit .... ... ii • .. .... .. .,
"" -- ... • • ,.. a: .. ;f - i i '#. 1- - .... .... ....
!. ID • .... .. I c u iii
76

• .. • I u • .. c • -0
i a ;
= :! .. ... • I. it
c
77

! i a c :; Q
:. : ~= • • :i -Q .;. • • 0 '; e "" • ti .. - c • o!
Q.
iJ -• • as
! >/ I / '
I )'(\ '
78

... OU • e: .! • ; . a. • c '! .! : u & ~ c ~~ • 0
,.. i ~. I )( iii ;;
• I ii:
-0 N
"'
N
N N
"'~====~S:~~=
79

O> 0
,,-..
Figure 4: Identification of the Ibuprofen network Electron microscopy photographs of A) Ibuprofen, Bl grHulea, C) tablets: C1,C2: preaHd surface, C3: aide walls C4: vertlcal croaa section

81

w w > > i= i= u u <l: <l:
~ ~ r--- r---l!l r---
D ~ .. 0 0 .. 0 .! ("") -z • ~ • • ...
,\~~"~ 1111
0 .. 2i u A.
• IL ; :! .. 'i ! ¥• 0 ii =. • 1111
1115 ~I ,;;
• I u
0 IL
("") (\J 0
(~) 'ld'lll .. J..-tS
82

"' "'
50
Figure 6: Effect of Compression Forces on the Enthalpy Parameter
-i!t- 77% DRUG --'Y-- 67% DRUG - -..-·- 57% DRUG
l .. u: _,,,-'"'l-----------------------------------------'V ... , ., , - ,' ···-·-z 25 < .... .---·-1 ·-·-·-·-·-·-·-·-·- T • rv-· ·-·-·-·-·-·-·-·---...... • ~ 1
I I
I I
o --~~~~~~~~~--~~~~~~~~__,
0 15 30
COMPRESSION LEVEL (KN)

f'ltur• 7 : DIHolutlM of IMlpfofetl CorH Dlalntegronl (0 MCI 1 lntHgronulor r•tlol
-0- 57% QR.JG
110 ...------------------~
55
Dlalol ... Mt l•••I t ... 1001'11t!nw1N11ar
o"---------'-----------l 0 5 0 100
110 .------------------~
5 5
o.-.--------'-----------' 0 50 100
T IPllE (M1N.JTE)
84

Figure 8 : DluolutlH of Ibuprofen C.rH DlalntegrHt ( 112 Hd 1 II lntr1gr1nul1r retlol
--.- 77% CA...G -:>-- 57% ~L.G -+- · 57% OR\...G
alt:.~~~~~~~~~~~~~~~~~
~ g 5 5
i5
0 ~ ~
77% Of:l.UG
Dlollt-.rant LeHI I'll 1/S mt:r•1r.w•
o~~~~~~~~~ ...... ~~~~~~~--' 0 50 100
T IME (MINUTE)
85

( MANUSCRIPT III
AN EVALUATION OF IBUPROFEN BIOINVERSION BY SIMULATION
86

INTRODUCTION
In an e ffort to formulate the pharmacologically active
enantiomer of ibuprofen into a solid ora l dosage form. we
examined the literature regarding investigations of
stereoselective pharmacokinetics of this arylpropionic acid .
Early reports (1) indicated that urinary ibuprofen metabo
lites were essentially all dextro-rotary (S enantiomer )
following administration of
Sensitivity of stereoselective
separations have improved and it
the racemate in man.
assays and enanti omeric
is generally recognized .
that there is an enzyme catalyzed inversion of the inactive
R enantiomer into the therapeutically active S enantiomer
(2.3) . Bioinversion of the R to the S enanti omer has been
suggested to occur either presystemically ( 4 , 5) and or sys
temically ( 6 ) . Also. differences in the fraction of R
inverted int o Shave been reported (7. 8 ). To date only four
studies have involved the administration of a pure ibuprofen
enanti omer t o man (6, 9 ). Using the pharmacokineti c model
proposed by Jamali et al . ( 5 ), we simulated (-)-R- and
(+)-S- ibuprofen plasma concentrations following oral ad
ministration of (+)-S- ibuprofen, (-)-R-ibuprofen , or the
racemate . Simulated and literature values for area under
the plasma concentration- time curves ( AUC ) were used to com
pare ratios of SI R for different cases of the model and for
87

comparison of different methods calculating fraccion of R
inverced to S.
METHODS
Simulations
The one-compartment model proposed by Jamali et al . ( 5 )
was used for all simulations of ibuprofen enantiomer plasma
concentrations. This model (Fig. 1) assumes first-order
processes for absorption and elimination for both R and S
enantiomers , as well as for the bioinversion of the R to the .
S enantiomer. This model appears to have been designed such
that total elimination of R. by bioinversion and non-
bioinversion routes , should be equal to elimination of S.
The literature , however, supports a faster apparent elimina
tion for the R isomer ( 6-8 ). The racemate dose was assumed
to be 200 mg of (-)-R-ibuprofen and 200 mg of (+)- S-
ibuprofen enantiomer. Pharmacokinetic parameters similiar
to those used by Jamali et al. ( 5) were incorporated.
Volumes of distribution (Vd) were 10 L for each enantiomer.
Absorption rate constants ( kar.kas ) and elimination rate
constants (kr , ks) for both enantiomers were 1.0 and
0.34 - 1 hr , respectively . The four cases of presystemic
(kip) and / or systemic ( kic ) bioinversion reported by Jamali
et al. ( 5 ) were reproduced as follows: 1 ) kip=l.5 and kic=O
hr - 1 , 2) kip=l.O and kic =0.08 hr- 1 , 3) kip=0.5 and
88

kic-0.15hr- 1 . and 4 ) kip-0 and kic -0.225 hr - 1 . Numerical
simulation of the model was performed with the Stella
simulation software ( 10 ), using Euler ' s method with a time
step of 0.01 hr. The apparent terminal elimination rate
constants for the R and S ibuprofen enantiomers ( App kr and
App ks) were estimated from simulated plasma concentrations.
The area under the simulated plasma concentration-time
profile from time zero to 24 hr after start of dose. AUC (0-
24) , was calculated for both enantiomers. These simulated
AUC's were used to calculate an S I R AUC ratio. The AUC 's
from these simulations were also used to compare different .
methods of calculation the fraction of the R enantiomer in
verted to the S enantiomer following oral administration.
In additon. literature values for AUC of Rand S (4.6-9,11)
were used to calculate an SI R AUC ratio and assess different
methods for estimating fractions inverted.
Calculation of Fraction Inverted
For calculations of fraction of ibuporfen inverted in
the body. it was assumed that both enantiomers have similiar
absorption and disposition parameters. Also , it was assumed
that oral administration of racemate was similar to oral ad-
ministration of equal amounts of S and R ibuprofen
enantiomers. These assuptions are recognized as potential
limitiations of the calcualtion method but have been used by
several authors (5-9, 12 , 13 ) .
89

The relationship assumed was :
( AUC of s after racemate ) - ( AUC of s after S) - ( AUC of S
after R) Equation 1
where dose of racemate - dose of s - dose of R. and the dose
of R and S are equal.
The fraction of R inverted to S ( Fr s ) may be approximated
by :
Fr- >S = ( AUC of s after R) / ( AUC of s after S)
for equal doses of R and S.
Equation 2
Substitution Equation into Equation 2 , additional equa-
tions for Fr s may be derived:
Fr - >s - (( AUC of S after racemate )-( AUC of S after S)) i ( AUC
of S after S ) Equation 3
where dose of recemate 2•dose of S:and ,
Fr s = ( AUC of S after R) / (( AUC of S after Racemate )-( AUC
of S after R)) Equation 4
where dose of racemate 2*dose of R.
Based on the previous assumptions of identical absorption
and disposition for both enantiomers , it may be possible to
90
approximate fraction inverted in the body following oral ad
ministration of the R and S enantiomers. the racemate and S
enantiomer, or the racemate and R enantiomer.
In addition one can estimate the contribution of the
chiral bioinversion to the plasma levels of the therapeuti
cally active isomer. Rather than calculating the fraction
of R converted to S ( Equation 2-4). an alternate method of
looking at bioinversion is by estimation of the fraction of
S which is inverted from R ( Fs- >r) for a dose of racemate.
This may be approximated by the following equation:
FS- >r ( AUG of S after R) / (AUC of S after racemate )
Equation 5
where dose of racemate 2* dose of R(-).
Additional variations of Equation 5 are also possible if one
assumes the relationship in Equation 1 to be valid.
RESULTS AND DISCUSSION
Simulated ( -)-R- and (+)-S-ibuprofen enantiomer plasma
concentration-time profiles and t he corresponding S I R plasma
concentration ratios appeared to be identical to that
reported Jamali et al. (5) for the four different cases of
91

presystemic and or systemic bioinversion following ad
ministration of 400 mg of racemate as 200 mg each of R and S
enantiomers Simulations of the S R AUC ratios. following
administrati on of the racemate. ranged from a value of 4.0
for a presystemic-only bioinversion ( Sim #1. Table I) to
1 .66 for systemic-only bioinversion ( Sim *4. Table I ) .
Simulati ons of the S R AUC ratios. for administration of 200
mg of the R enantiomer only, ranged from a value of 1. 5 f or
a presystemic-only bi oinversion ( Sim #5 . Table I ) to 0.66
for systemic-only bioinversion ( Sim ~s. Table I ).
Calculati ons SI R AUC ratios from literature reports of AUC ' s .
of R and S enanti omers following administration of the
racemate averaged 1.53±0.20 ( average±sd ) . while S / R AUC
ratios following administration of the R enantiomer were
found to be 0.50±0.09 ( Table II ) . Thus. these simulations
support a conclusion of systemic bioinversion in man s ince
they appear to be in good agreement with the literature
data. Different conclusions by Jamali et al . (4,5) . based
on use of a plasma concentration SI R ratio . may be due to
increased variability in plasma concentrations R and S enan
tiomers . Since the emphasis of that ratio was placed toward
the end of the sampling period when plasma concentrations
were relatively low ( 4,5 ), a greater error in calculation of
the plasma concentration SI R rati o could have arisen from
assay variability. It is speculated that calculations S and
92

R AUG'S. for the S R AUG ratio. are not as susceptible to
the same degree of such error .
Agreement of simulated S R AUG ratios with literature
values does not necessarily support the hypothesis of
sytemic bioinversion , since the mode proposed by Jamali e t
al. ( 5 ) may be questioned. The mode ( Fig . 1 ) appears to
have been designed to demonstrate similiar elimination for R
and S. The sum total of R is ( kr - ki c)Tkic. which equals ks.
This creates some confusion since elimination of R by non -
bioinversion routes and elimination of S could be
comparable. However , elimination of R by processes other
than bioinversion was adjusted by the systemic bioinversion
rate constant ( i.e . kr-kic, Fig. 1 ), according to the model
defined by Jamali et al. (5). It was assumed that this
model was derived to demonstrate similiar ' apparent '
elimination rate constants for both R and S ( App kr and App
ks , Table I ), which holds true for the presystemic-only
bioinversion case (Sim # l and Sim *5. Table. I ) . However.
as the model is admusted toward systemic-only bioinversion ,
the apparent eliminat i on rate constant for S , determined
from simulated plasma concentrations (App ks ) , decreases.
ne suggested modification of the model is not to adjust non
b i oinversion elimination of R by the changes in kic . Other
model modifications are a l so possible , such as suggested
from the studies by Ahn et al. in the dog ( 12 ) . from which
93
it may be speculated that the rate and extent of bioinver
sion decreases with increasing amounts of (+)-S-ibuprofen.
Thus. a model incorporating saturable enzymatic inversion
may prove to be a more correct model. We also appreciate
the fact that gastro-intestinal membranes of different
animal species contain the enzymatic system responsible for
the stereospecific inversion. Therefore. presystemic bioin
version. if any. could be formulation dependent.
An assessment of the fraction of R inverted to S (Fr- >s)
was based on calculations using Equations 2-4 for simula
tions and literature values for AUC ' s of the S enantiomer . •
following administration of S and R. S and racemate. or R
based on the same model ( Sim #9, Table I ). Using Equati on
2. and the results for simulation of the R and S enan-
tiomers, the
pre systemic-only
simulation. It
fraction inverted ranged from 0.6 for
simulation to 0.66 for systemic-only
must be noted that Jamali et al. ( 5 ) chose
parameters for presystemic and systemic bioinversion which
would approximate a fraction inverted of 0 . 6 , which i s con
sistent with the data of Lee et al. (8). Assessment of
Geisslinger et al . ' s data ( 7 ), using Equation 2. indicates
the fraction of R inverted to S was 0.48 ( Table II ), al
though these autors who reported a fraction inverted of 0.33
did not indicate their exact mathematical operation .
Calculations of Fr - >S using Equation 2 ranged from 0.36 to
94

0.64 f or all literature values o f AUC after S for ad -
ministration of the R and S enantiomers ( Table II ).
Fractions inverted calculated for Equations 3 using litera
ture values ranged form 0.25 to 0.74. while Equation 4
yielded values of Fr- >s ranging from 0.51 to 0.96 . It is
important to note that when AUC data was not available for a
particular enantiomer, data from Lee et al. ( 8 ) or Cox et al
(6 ) were used after normalization for dose. Since dif
ferences were found for literature values when fraction
inverted was calculated using Equations 2-4. it might be
concluded that the relationship described in Equation is.
not a rigorous as originally assumed. In the four studies
involving administration of (- ) -R - ibuprofen. the AUC of S
and R averaged 1 / 2 of the AUC of Rafter R (49 . 7%). Using
Equation 5 , we calculated that after oral administration of
the racemic mixture. (+)-S-ibuprofen bioinverted from ( - ) -R
ibuprofen averaged 38 . 5% of the total ( T) -S-ibuprofen in the
systemic circulation.
CONCLUS I ONS
The model presented by Jamali et al. (5 ) , for bioinver
sion of ibuprofen after administration of a racemic mixture ,
was reviewed and found to be more indicative of systemic
bioinversion when the AUC SI R ratio was taken into account
and compared to literature values. Results of simulations
95

with this model demonstrate no diffenece between equaoions
fo r Fr - •s. based on AUC of S following administration of R
and S. racemate and S. or racemate and R. for ohe four cases
of presystemic and or syst emi c bi oinversi on inve stigated.
However. comparison of results of Equati ons 2-4 using
literature data differ such that it does not appear that the
relationships assumed f or the model h old true under all
dosing situations . Calculations Fr - s ( Equations 2-4 ) using
literature data averaged 0.52 overall.
We estimated that after racemate oral administration.
1 / 3 of the total (+)-S-ibuprofen ~ n the plasma is derived .
from the inversion of (-)-R- ibuprofen. Possibly a 150 mg
dose of (~)-S-ibuprofen will be bioequivalent to a 200 mg
dose of rac-ibuprofen after oral administration . Whether or
not the formulation of the active stereoisomer is a
therapeutic improvement can be still argued and other phar
maceuticial characteristics of the drug must be considered.
96

REFERENCES
l. Adams SS . Cliffe EE. Lessel B. Nicholson JS
J Pharm Sci. 56:1686, 1967 .
2. Adams SS. Bresloff P, Mason CG. J Pharm Pharmac. 28:256-
257 .1976.
3. Mayer JM, Acta Pharm Nord. 2 (3) : 197-216, 1990.
4. Jamali F. Sing NN , Pasutto FM. Russell AS. Coutt RT .
Pharm Res, 5 ( 1 ) :40- 43 , 1988 .
5. Mehvar R, Jamali F , Pharm Res , 5:76- 79 , 1988 .
6. Cox SR . February 1988. Clin Pharm Therapeu, 43:146 .
1988.
7. Gesslinger G. Stock KP. Back GL. Loew D, Brune K. Agents
and Actions , 27 ( 3 / 4 ) :455 - 457, 1989.
8. Lee EJD, Williams K, Day R, Graham G, Champion D. Br J
Clin Pharmac, 19:669-674, 1985 .
9. Baillie TA , Adams WJ , Kaiser DG , Olanoff LS. Hastead GW.
Harpoot lian H. Van Giesen GJ , J Pharmaco Exp Thera.
249 ( 2):517- 523, 1989.
10. Richmond B, Ve scuso P, Peterson S , A Business user ' s
Guide to STELLA. High Performance Systems , inc., Lyme
New Hampshire , 1987 .
11. Cox SR, Brown MA , Squires DJ, Murrill EA. Lednicer D,
Knuth DW , Biopharm Drug Disp. , 9:539-549, 1988.
12 . Hae - Young Ahn. G. L . Amidon and D.E. Smith , presented at
the A. A.P.S meeting in Las Vegas , Pharm Res ,
97

7 . ( 9 ) :234.Sept . 1990.
13 . Kni~inicki RD. Day Ro. Graham GG and Williams KM.
Chirality 2:134- 140. ( 1990 ) .
98

<D <D
Dosing ·
Race male Racemale Race male Race male
Ronly A only A only A only
• Dose of A .. 200 mg Dose ol S • 200 mg
1.5 1.0 0.5 0 .0
Table I
S1mulat10n Paramelers and Rosulls lof 81omve1s1on ol Ibuprofen, Based on lhe Model ol Jamah el al. (5)
w11h Cak:ulalions ol AUC SIA Aalio and Fraction ol R lnvef1ed lo S (fr->s)
0.0 0.08 0.15
0.225
0.341 0 .341 0.341 0.341
0.341 0.317 0.305 0.296
23.52 29.40 39.20 58.80
35.28 36.30 36.84 38.78
1.501 1.23 0.94 0.66
Addilional Parameters used tor all simulations A S
Dose of Racemale • 200 mg of A and S each ka. 1.0 1.0 hr ... · 1 k • 0.34 0.34 hr• -1 Vd • 10 10 L

,_, 0 0
l .iblu II
Al.JC Values in Man alttH Adm1rns1ia1ion of lnd1vldual lbuprnhm l:nanhomurs or Aacama1a wllh Cak:ulalions ol Al.JC SIA Aallo, F1ac11on ol A Inverted 10 S (Fr ·>S), and Frac11on ol S lnve11ed F1om A (fs<- r)
-· Geissl"- 7 PO 600 89.8 57.0 1.58 0.34 0.56 0.36 Cox 6 PO 600 91 .0 61 .0 1.49 • 0.30 0 .63 0.38 Cox 6 IV 600 89.0 59.0 1.51 • 0.27 0.51 0 34 Cox 11 PO 400 58 0 42.0 1.38 • 0.25 .6 0 .67 " 0.40 Cox 11 PO 400 580 50.0 1.16 • 0.25 "0.67 "0.40 Jama' 4 PO 600 106.9 74.2 1.44 ' 0.53 • 0.7 1 • 0.42 Jamai 4 PO 600 121 .7 73.9 1.65 • 0.74 • 0.58 • 0 .37 Jamai 4 PO 600 90.8 56.9 1.60 • 0.30 • 0 96 • 0.49 Jamai 4 PO 600 100.2 51.5 1.95 • 0.44 • 0.80 • 0.44
Average (OveraU) • 0 ·I ' 0.38 0 70 0 41 SO (Overall\ - 0 10 0 16 0 IL 0.05
Average (True"") - 0.56 0.36 0.64 0.39 sp tlrue .. ) • 0 11 0 03 0 15 0 05
Avg ol Eqns 2-4. 0.52 Ava of Eans 2 ·4 llrue""I • 0.55
•compared lo lee dala (8) tor admimslralion ol S, normalized for dose 6 compared Jo Cox data (6) for adm1nistralion ol A. normalized tor dose •compared 10 lee data (8) tor adrmnis11auon ol A. normalized lor dose •• al parameters used in 1he equation were obtained from individual stud10s

Cii E co , >. .0 -0 Q) Vl 0 a. 0 a: Qi -0 0
:::? c 0 ·u;
~ c "Ci al
~ .c (.)
Q)
::; Cl u:
(.)
:::;:: ' ~
Vl ::.::
(.)
:::;:: + Cf ~ "(])
ca Vl co
::.:: ::.::
a. '
:::;:: + Cf "(])
1 --, I
I I
l::l %OS pue S %OS = uaJOJdnq1 a1ewaoel::j
101
....:
ci
- -'

MANUSCRIPT IV
APPROACHES TO STEREOSPECIFIC PREFOR.MULATION OF IBUPROFEN
102

Abstract
In an effort to formulate the pharmacologically active
ibuprofen isomer ((- )- S- ibupro fen ) into a solid oral dosage
form , preformulation studies were performed on both the
racemate and this stereoisomer of ibuprofen . Results of the
respective physical pharmacy profiles were compared to
predict the pharmaceutical behavior of the S( - ) ibuprofen
compound. The enantiomer was more soluble than the racemate
in aqueous media but exhibited l ower intrinsic dissolution
rates. as would be expected from the very small specific .
surface area. This characterisitic could be a limiting step
in the formulation of the optical isomer although less
energy was required for the solution of S(+) ibuprofen . On
this crystal , there was ten times more moisture layered at
the surface and comparative thermal analysis indicated that
for both compounds a l oss in crystallinity occured upon
grinding . Properties in the solid state of S(+) ibuprofen
included higher density and excellent flowability as com
pared to the racemate.
INTRODUCTION
Recently extensive emphasis has been given to the
stereospecific nature of drug disposition in the context of
103

drug development. Re gu l ato r y bodies in Eur ope already r e com
mend che use of s tereospecific assays when a r a c emate is
fo r mulaced ( 1 ). In this case. when the chi r al s ynthes i s i s
p oss ible. the f o rmulati on of pure active enantiomer s also
becomes a priority for research and devel opment. Thu s . f or
drug candidates in the development pipeline stereospecific
considerations are critical . For drug products al r eady
marketed as racemates. the study of their optical i somers
might present a different set of problems ( 2 ) .
The use of an enantiomer as part of a solution for c om
mon pharmaceutical problems is not new . In the early .
seventies. formulators at Wyeth had described the advantages
of using the pure optical isomer of a cytotoxic agent to
overcome a solubility problem (3). The differences in
physico- chemical properties between racemic and enantiomer
have been known and studied for a long time ; s olid state
properties , crystal structures and the effect o f isomeric
purity on phase solubilities ( 4-6 ) have been investigated.
Recently the effect of chiral asymmetry on crystal
properties was reviewed and it was concluded that for such
compounds. biopharmaceutical characteristics must be care
fully monitored ( 7 ).
Ibuprofen is administered as a racemate and is one of 50
compounds for which detailed stereospecif ic pharmacokinetics
have been reported. Properties in solution and the solid
104

state have been documented in the literature and conven
tional preformulation programs have been applied to the
study of this antiinflammatory agent ( 8). It is now
generally recognized that formulating ibuprofen is difficult
and relies mainly on the expertise of the formulator . Its
low solubility in aqueous media at low pHs as well as its
poor handling properties contribute to its tedious process
ing. S(+) ibuprofen , the biologically active isomer of
ibuprofen, is now available in large scale quantities
through economically viable chemical synthesis and the ob
jectives of this study are to draw a preformulation profile .
for this enantiomer. investigate the feasibility of a con
ventional formulation and compare this stereoisomer to the
racemate currently used.
EXPERIMENTAL
MATERIALS
Rae-ibuprofen (lot# LH6 - 72 ) and (+)-S-ibuprofen (lot¥
AC-lR) were obtained from the Ethyl Co., Baton Rouge , LA.
Monobasic potassium phosphate and sodium hydroxide from the
Fisher Scientific Company, were of analytical grade.
METHODS
105

Analvtical: all quantitative determinations in solut i on
were performed using an ultra violet spectrophotometer
(Hewlett Packard 8450) at 264 and 220 nanometer wavelengths.
Intrinsic Dissolution Rate ( IDR )
The procedure desribed by Woods ~ ( 9 ) was used to
determine the intrinsic dissolution rates. A modified Woods
apparatus , designed by Ciba-Geigy researchers ( fig. 1 ) was
used. One gram of sample powder was weighted in the die and
precompressed at 500 lbs with a Carver hydraulic press.
After cleaning the exposed surface the compact was
recompressed at 1000 lbs for a dwell time of 5 seconds. The
rotating disk assembly was immersed in 500 ml of USP simu
lated intestinal fluid ( SIF ) at 37 + / - 0.8 °c and rotated
at 100 rpm. The sampling regimen . included
2.5 , 10.15.20 , 25 . 30 and 35 minute time points. Sample volume
was 4 cm3 . withdrawn with micro-syringes and replaced with
the same volume of SIF at 37°c. All samples were passed
through a 0.45 um cellulose acetate filter before analysis.
Amounts of drug dissolved were plotted versus time and the
slope of the straight line portion was divided by the area
of the pellet ( A-1.281 cm2 ) to yield the intrinsic dissolu
tion rates in mg.sec-l cm-2 .
106

Solubility and Heat of Solution
The method used was the procedure described by Higuchi
et al ( 10 ). Ibuprofen was added in large excess t o buffered
solut i on s in screw-capped vials at various pHs. The tubes
were r otated on a labquake shaker in dry ovens for 24 hours
to reach saturation ( 11 ) . The vials were then centrifuged at
2000g for 10 minutes, supernatants withdrawn. filtered. and
further analyzed for pH and drug concentrations. Four pH ' s
were studied at temperatures ranging from 25 to 51 ° c .
Solid State Properties
Particle size was measured using a laser light scatter
ing technique ( Brinckman Particle Size Analy zer ) . Surface
areas were determined with a Nitrogen ads orption technique
and calculated using the B . E . T . equation. This experiment
was performed on a Quantasorb instrument. Compressibility
and density were evaluated using a procedure proposed by
Rees et al (12). About 100 mg of powder were weighted in a
v o lumetric cylinder . Up to 2000 taps were performed on an
Erweka instrument. Moisture contents were estimated with a
Karl-Fisher technique. Crystal analysis included differen-
ti al scanning calorimetry to monitor temperatures and
enthalpies of fusion on a Perkin-Elmer P7500 , all thermal
analysis were conducted with a heat fl ow of 5°C / minute;
107

samples were also analyzed through scanning electron micros
c opy and X- Ray powder diffraction at the R&D analytical
services o f Ciba-Geigy in Ardsley , NY.
RESULTS AND DI SCUSSIONS
Solid State Properties
Under similar storage conditions ( 22°c +/ - 2 and 35% RH )
the mass fraction of moisture for the rac - ibuprofen averaged
0 . 065 + 1 - 0 . 013% where ( + ) -S-ibuprofen exhibited 0 . 34 + ' -
0.24% of water corresponding to ten times more moisture for
this enantiomer. After careful analysis of X-Ray diffraction
patterns of dried and humidity exposed ibuprofen samples.
there was no change in the crystallinity of both powders
upon removal of water. It was speculated that the moisture
essentially sticks to the crystal surface . Both compounds
had a very low water content but according to Ahelc et al
( 13 ) they still require special attention because the water
distributes only in amorphous regions. X- ray powder diffrac
tion patterns indicated different crystal structure for the
racemate and its enantiomer with very different deflection
peaks especially at low angles of the spectrum. Ten minutes
grinding resulted in a loss of crystallinity for both pow
ders with a decrease in deflection peaks intensity (fig. 2).
For ground S(+ ) ibuprofen , some peaks were more intense at
low angles of the spectrum ( 11-15). This difference might be
108

due to the decrease in particle size but ind i cate d a
modi f i c ati on of the c rystal nature. The thermodynami c
pa rameters. presented in table confirmed these conc l u -
sions . The endotherm temperature was 20 ° c l ower f o r the S(-)
enantiomer and the enthalpy of fusion averaged 35 J t g less
than the racemate. Upon grinding there was a decrease in the
enthalpy of fusion for the ibuprofens proportional t o
entropy changes. There was no modifications in the melting
points in either case confirming no rearrangement of the in-
ternal lattice ( s ) . Nevertheless . although the internal
structure might not have been modified , upon grinding there
was a decrease in the particle size of ( + ) -S-ibuprofen and
the compound became difficult to handle as a result of
flowabili t y loss .
Based on the monolayer gas adsorption theory we calcu
lated the true surface area of the two compounds using the
B.E.T. equation . The B . E . T. values for racemate and the S( T)
isomer were respectively 3 . 4 10-l ( 0.01 ) and 2.8 10- 3 ( 1.9
10-4 ) m2 1gram indicating a specific surface area more than
100 times smaller for the enantiomer. Although it has been
found that BET values vary between sources ( 14 ). the
amplitude of this difference might be a potential problem of
the formulation specifically in the
dissolution / bioavailability behavior. The particle size with
a mean ranging from 83 to 149 um was very large compared to
5 - 38 um for the racemate ( 14 ) and was responsible for the
109

excellent flowability of the bulk material. The scanning
electron microscopy observations in fig.3 indeed confirmed
the descriptive analysis and the unusual nature of the c r ys-
tal surface o f (+)-S-ibuprofen . The optical isomer existed
as large box y needle s consisting of the crystal un i t . All
particles had a very smooth surface.
Bulk and tapped densities averaged 34 and 56 % respec -
tively and were similar t o the racemate analyzed. The
compressibility / flowability as evaluated by plotting Log
Vo / V against the number of t aps ( fig .4 ) . where Vo is the
initial volume and v the tapped volume. was consistently .
above the 0 . 1 assymptote for the racemate and considered
poor ( 12 ) as compared to the S(T ) enantiomer. Thus the opti -
cal isomer might be a good candidate for direct compression .
Dissolution Kinetics
Because of the unique dissolution characterisitics of
each compound. the rate plots presented in fig.5 had dif -
ferent slopes , and consequently different intrinsic
dissolution rates. Surprinsingly the IPR for S(+) ibuprofen
averaging 8. -1 -2 ug.sec .cm was smaller than the IPR of the
racemate with a mean at 11.6 ug.sec - 1 .cm- 2 . It appears that
under our experimental conditions , the dissolution rate of
the enantiomer was limited by its very small surface area
( rather than enhanced by its high solubility) . In addition.
110

age d c ompac t s at Room Temperature f or 3 days a nd further
analyzed und er the same conditi ons had lowe r int rinsic dis
solution rat e s I DR than ori ginal disks immedi ately analyzed
a ft e r manufa cture ( f ig. 6 ).
Heat of Solution
The s olubility of the two ibuprofens was determined at
different temperat ures in vari ous buffers . The van ' t Hoff
equat i on relates the s olubility in mole fraction or mole
percent to the inverse of the absolute temperature of an .
ideal solution:
-Log Xi ( ~Hf / RT ) + constant
where Xi is the ibuprofen c oncentration i n mole frac
tion , ~Hf the heat of s ol uti on , R the perfect gas constant
and T the absolute temperature in degree Ke l vin . The Van ' t
Hoff
plots for rac - ibuprofen ( fig.7 ) and (+)- S- ibuprofen (fig . 8 )
y ield heats of solution at different pH ' s presented in table
2. The slopes varied with pH indicating that the heat ab
sorbed by the systems during dissolution varied with the
extent of ionization . The energy of solubilization decreased
with ionized species and at pH 7.7 , the heat of s o lution be
came slightly exothermic for both ibuprofens . This result
111

confirmed that when i onization was the principal f a c t or in
di ssolut i on ( at high pHs ) this phenomena actually release d
energy . At ohis level of l ower [H+) c oncentrat i on s . S( - )
ibupro fen cons istently exhibited l ower heat of s olu t i ons
than its racemate form showing that the enantiomer i s more
soluble in aqueous media . For example the aqueous solubility
of ( - )- S- ibuprofen in a pH 7 . 7 phosphate buffer at 37 °c was
6.0 mg / ml compared to 5.0 mg t ml f or the racemate . Under our
experimental settings . at pH 4.5 ( pKa of ibuprofen ) the con
centrations were most variable and yield close to zero
slopes for both ibuprofens.
CONCLUSI ONS
The physical pharmacy profiles of S(+) ibuprofen and its
racemate form were compared . Thermal analysis indicated that
the optical isomer existed as a different crystal form ex
hibiting different solid state properties which could be of
concern for the formulator. Particle size was increased and
the flowability was improved. The enantiomer existed as
large boxy crystals with unusually low surface area. This
might be a major limitation for an oral solid formulation.
In fact the intrinsic dissolution rate of this compound was
found smaller than the IDR of the rac-ibuprofen which was
not predicted from the solubulity data and not previously
documented in the literature. Solubility determinations
112

revealed that ( • )-S-ibuprofen was more soluble in aqueous
media at pHs higher than 4.5 but not to the extent an
ticipated f r om a review of the stereochemical literature.
Al so at pH 7.7 heats of solution were slightly exothermic
for both ibuprofens indicating that at this pH the
solubilization pr ocess released some energy. It has been
argued from a pharmacokinetic / pharmacodynamic stand point
that formulating S(+) ibuprofen might be a therapeutic im
provement ( 9 ). however, considering these elements of
physical pharmacy special attention should be given to the
formulation , in order to overcome the potential problems of .
dissolution . low melting levels and compatibility . Thus.
S (+) ibuprofen might be readily absorbed through the j ejunum
but its dissolution characteristics could be a rate limiting
step of bioavailability for an oral solid dosage form. If
lower doses are required , it is anticipated that S(+)
ibuprofen could be a good candidate for direct compression .
In summary, we believe that the formulation of (+)-S
ibuprofen is cert ainly achievable provided the unique
characterist i cs of t his drug are kept in mind. There are
significant diffe rences between this enantiomer and t he
racemate and the potential advantages (therapeutic and
biopharmaceutical ) of the S(+) drug might be considerable.
Aknowledgements : This work was supported by Ciba- Geigy
Corporation. We greatly appreciate the input from Dr. G.
113

Lukas . Director of PPT and we thank Dr. D. Bauer from Ethyl
Co . who provided us with the ibuprofen.
REFERENCES
l . A.C. Cartwright, rLI....A.. Vol 24. pp 115-116, 1990
2. PMA Ad Hoc Committee on Racemic Mixture s.
Pharm.Tech. pp 46-52. May 1990
3 . A. Repta , M.J. Baltezor and PC Raussal , J. Pharm .Sci.
Vol 65.2, pp 238-242 , Feb. 1976
4 . A. Formi. I . Moretti and G. Torre .
J.Chem.Soc.Perkin.Trans. 2 . pp 791-797. 1984
5. G.P . Bettinetti. F . Gioardano , A. Italia .
R. Pellegata and P . Ventura, A. G.P .I. , 3.
pp 232-240.1988
6. S-Tsuen Liu and A. Hurvitz , J . Pharm.Sci . . Vol 67.
5 , pp 636-638 , 1978
7. Harry R. Britain . Pharm Res . . Vol 7. 7 , 683-690.
1990
8. C.D. Herzfeldt and R. Kummel , DD I.P., 9(5),
767-793 , 1983
9. J.H. Wood, J . E . Syarto and H. letterman .
J.Pharm.Sci. 54 , 1068-1075 , 1965
10. D.J.W . Grant , M. Medhizadeh , A. H. Chow and
J.E.Fairbrother Int .J. Pharm. 18 , 25-38, 1984
11. C.D. Herzfeldt and R Kummel , D.D . I .P .. 9(5 ),
114

767-793. 1983
12. J.E. Rees. Bull.Chem . Pharm .. 112. 216 - 220, 1973
13. C. Alhec and G. zografi
In press Int.J.Pharm. 1991
14. A.J. Romero. G. Lukas and C.T . Rhodes
In press Pharm . Acta Helv .. 1991
115

Table I : THERMAL ANALYSIS OF IBUPROFEN
"As Received" Racemate S( +) R(-)
MELTING 0 0
RANGE 75 - 77 oC 53 - 55 c 53-55 c
ENTHALPY OF FUSION 13 5 .1 J/G 8 6. 8 J/G 87.0 J/G
"Ground" ..... (j)
MELTING POINT 7 5 . 3 c 55. 1 c
ENTHALPY OF FUSION 11 5 . 2 J/G 8 2 . 3 J /G

TABLE II: HEAT OF SOLUTION FOR (+)-S AND RAC-IBUPROFEN
pH ~H _, _, (KJ.lolOLE • • K)
RAC-IBUPROFEN 1.3 32.2 4.5 -0.3 6.0 38.8
.... 7.7 -5.2 .... -;z
( + )-S-IBUPROFEN 1.3 51.5 4.5 -0.04 6.0 29.9 7.7 -16.4

Figure l
cross-section ot the Modified Woods Rotating Apparatus
JJ
disk holder
i-------i--die hole
ie
118
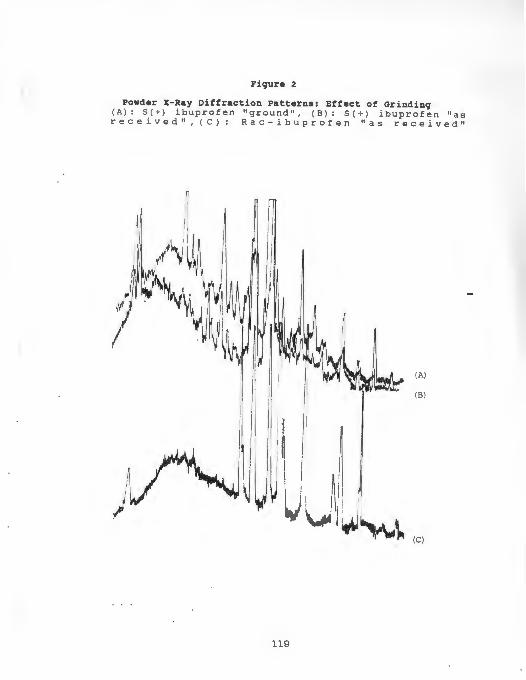
Figure 2 f Grinding "as Effect 0 ofen . Patterns: . S (+) ibupr ei v ed" Diffraction d " ( B ) . "as re c Powder X-R~:, profen " g rco.217 b.; p r of en (A ) : S(+) l" ( C ) : R a r eceiv ed ,
(A)
(8 )
U I
' \1
1 I
VI 1 1,11~~ (CJ
119

Figure 3
Scanning Electron Microscopy Photographs of S(+) Ibuprofen
so , 250, soo and lOOOX Magnification
120

121

0
~ \[)
N '
• 0 a. 0 • <1>
N I-
"' -E 0 <1>
u ro
0 • 0 ([
z \[) Cl.
"' • ~
I-
• • ; .. :I :I • .. a~ • u: > ~ qi
0 J 0
> .... 0 > a
0 0 • c -' '
\[)
+ us '
f --~. l .. .•... , . .... ...... ... .... 0
0 0 0 0 ("') N q ci ci ci 0
A/OA 1101
122

c .., 0 • • :;:: :I Ill ... :I -- c • ro Ill • 0 E - ·~ .. Ill 0 • • .! A ~~ : I QA a: - ": lt c u -. ·; • • I II: ,, c 0 ... ·;: - 0
~ 31 .,, ,,
.! • -.. :a :I 0 8 ~ .!l~ II. u. 0
I~ If) -
a
0 <O
• ... oa -· • •o .:: I
~. -. I II:
0 (')
(1111/ln) UOA•4UHUO:)
123
0
0 (')
0 (\J
0
0
j • i I-

0 l()
c: • -0 .. a. ::J :e + Cl ~ Ci) c: ·a. -~ i 0 • c: - l()
0 0
~ (\J
I ::: -::J u j: 0 • • --• w i5 • co
• .. ~I ::J
Cl u::
D
8 0 l()
(1111/ln) UOA1411HUO:)
124

"" .. ;; 0 I
!!!
~
c :z: ti ... Q,
0 ... a. • =i
.Cl ·r .... Q
• I • .!5 0
ci " ~ ... .. 0
=i • i 0 a- ... ·- 0 ... u. -A. ... ... ...
0 :z: .. c .... • > ..:
i
• 0 .. 0 .. " .. .,,c>
I I I I
uxJloi
125

.. ., 0 c:;
I !!!
c "! 0
ti :z: - A 0 .. a.
0 :::IJ
:9 I
Cl) -co ..!. ';-
• !. 0 ... Ille ...... • ., ._ :::IJ i 0 0 a. ...
u:: 0 ... A: <l --0 ::c .. ... ~ • ,.; > i
0 0 .. 0 ... .. 0
I I
(IX)Ool
126

( MANUSCRIPT V
STEREOCHEMICAL ASPECTS OF THE MOLECULAR PHARMACEUTICS
OF IBUPROFEN
127

ABSTRACT
Thermal analysis. thermody namics of s olution and
molecular modeling of (+)- S- ibuprofen and rac - ibuprofen gave
information on how heterochiral or homochiral interactions
would affect the processing of ibuprofen. The study con
firmed that rac-ibuprofen exists as a true racemate with a
10% eutectic pure enantiomer composition. Both the racemate
and the ( +) isomer crystal unit cells include four molecules
and crystallize in the P2 1 / c and P2 1 space groups respec -
tively. Thus the intermolecular forces were different _
between the crystals. As a consequence the (+) enantiomer
lattice was more fragile but only slightly more soluble than
the racemate in aqueous media. The solid- state structure
contributions to solubility were very different between the
two crystals (AH~( +)- 51 . l and AH~ac- 32.2 in KJ mole ) but
the standard free energy of solution were found to be com
parable for both compounds.
INTRODUCTION
It is generally recognized that (+)-S-ibuprofen is the
enantiomer of ibuprofen inhibiting the prostaglandin syn-
thetase (1 - 2 ) . Stereospecif ic and conformational
characteristics of this isomer are required for interaction
128

with the cell receptors responsible for the therapeutic an
tiinflammatory activity. Another consequence of chirality
could be the differences between the crystal habit of the
tw o s e parate isomers and the racemate. We now report a con
tinuation of our studies in this area ( 3).
We have previously reported higher solubility , lower
melting point and smaller intrinsic diss olution rate s f or
the (+) isomer compared to the racemate form ( 3 ). The com
bination of tests used in this study is , we believe ,
essential when one is investigating a chiral compound or an
optically pure isomer. For example , the thermal behavior of _
sobrerol and diastereoisomers was reported ( 4 ) and the crys
tal structures of cytostatic agents (stereoisomers and
mixtures ) were elucidated (5), both in support of formula
tion efforts. In another study the thermodynamic functions
of solution of non steroidal antiinflammat or y agents , in
cluding ibuprofen have been thoroughly studied by Pecci e_t_
al (6) to determine the contribution of the solid state
structures in promoting solubility. The physical charac
teristics can be related to the molecular packing of the
crystals under study ( 7 ) .
The combination of all these tests and the comparative
analysis is a unique approach to the formulation of
ibuprofen enantiomers that has been largely overlooked
before the stereospecific synthesis became economically vi
able .
129

EXPERIMENTAL
Materials
Racemic and S(+) ibuprofen were supplied b y the Ethyl
Corp. ( Baton Rouge . LA ). Methanol from the Fisher Scientific
Co. was used for ibuprofen recrystallization and was of
analytical grade. Potassium phosphate monobasic and sodium
hydroxide were obtained from the Malinckrodt and J . T. Baker
chemical companies , respectively.
Me thods
Thermal Analysis: Ibuprofen mixtures containing various
enantiomeric proportions were prepared by slow recrystal
lization at 42 .6 °F from methanol and after melting. Thermal
analysis were performed on (-)- S- ibuprofen [S (+)J. (-)-R
ibuprofen [R(-)] , rac-ibuprofen [Rael and mixtures using a
differential scanning calorimeter [DSC] from Perkin Elmer,
series 7. The heating rate was set at 5 °c1minute under
nitrogen flushing . Thermal endotherms were integrated t o ob
tain thermodynamic functions used for the phase-diagrams.
Theoretical solid-liquid equilibr ium curves were drawn using
the Prigofine- Defay equation ( eq.l ) for the racemate com
pletely dissolved in the melt and the Schroeder Van - Laar
130

( equati on ( eq.2 ) for che simple eutectic formation (9). Thus.
eutect i c temperature and compositions could be determined:
Ln4x ( l - x ) equation 1
Lnx equati on 2
where x is the mole fraction of the more abundant enan
tiomer in the mixture. whose melting ends at Tf (°K) AHs
and AHrac are the enthalpy of fusion of the pure S(+) and
the r acemic form respectively: Tms and Tmrac are the cor
responding melting points and R is the gas constant at 1.987
cal.mol- 1 . _ °K- 1 .
Crystal Analysis: Single crystal X-ray diffraction was
performed on small crystals o f (+)-S- ibuprofen from the
bulk compound. Reflection data was obtained from Ethyl Co .
and processed on a molecular modeling program (Shelxtlr ).
Crystal data is given in Table I . The structure was solved
in the space group P2 1 / c Analysis of the unit cell allowed
the identification of the molecular packing and hydrogen
bonds network within the monoclinic crystal . Similar infor
mation on the racemate was obtained from the literature ( 10)
and compared to the newly obtained molecular packing data of
the (+) enantiomer .
Solubility: Excess amounts of both compounds were
suspended in 0.05M aqueous buffered solutions at pH 1.3. At
131

this pH. the drug is essentially unionized since the
ibuprofen pKa is believed to be in the range of 4.6 to 5 .2 .
Screw cap vials were rotated on a Labshaker for 24 hours at
temperatures ranging from 25 ° to 52 °c in walk-in ovens.
Quantitative analysis was performed using ultra violet
spectrophotometry at selected wavelengths (220 and 264 nm ) .
The thermodynamic functions of solubilities were evaluated
as follows:
The chemical potential of a solute (s) in equilibrium
with its pure form (s) may be written as:
µ µ + R'T *Ln x equation 3
The variation of the solubility expressed in xw (mo le frac
tion in the solution ) can be integrated to
Cstant + ( - ~Ho I R) > ( l / T ) equation 4
and experimental data can be analyzed by plotting Ln of the
solubility versus l / T. The free energy of solubility at a
given temperature can be obtained from
-R *T*Ln xw equation 5
and the entropy of solution is derived from the third law of
thermodynamics:
132

e quat i on 6
Al l thermody namic parameters were analyzed t o compare
the racemate and S (+) ibuprofens. The c ontribution of
ibuprofen stereochemistry ( solid state structures ) t o
solubility , was investigated In a recent study, ther -
modynamic functions were used to predict and separate the
roles of solid- state struc tures from s olute - s olvent interac
tions in promoting the solubility of a solid nonelectrolyte
( 6 ) .
RESULTS AND DISCUSSION
Thermal Behavior
Thermodynamic functions f or both compounds are reported
in Table II. Melting parameters ( Tm and 6H ) obtained from
the thermograms in figures 1 - 2 , were used in equations l and
2 to obtain the phase - diagram in figure 3 (10 ) . Experimental
data were in good agreement with the theoretical lines in
dicating the fusion of the Eutectic at about Teu_ 321 °K and
a eutectic composition of 10.0 % on each side. As previously
anticipated ( 3 , 10 ) the thermal analysis confirmed that
ibuprofen naturally occurs as a unique racemic compound. A
133

Peter son "i" ratio of 1.77 was calculated from equati on 7
( 9 ) :
" i " equation 7
where Tmeu is the eutectic temperature as determined ex
perimentally and from the phase diagram.
Although somewhat arbitrary in character. this rati o
clearly indicated that ibuprofen has a strong tendency t o
crystallize as a true racemate. The melting point of both
optical isomers was 20 to 22 °c lower than the racemate f orm -
and eutectics were very close to the edges of the diagram
making any enantioselective resolution by crystallizat ion
impossible . The test of the Prigofine- Defay equation was
perf ormed a posteriori and the straight line in figure 4
confirmed the model.
Crys tal Packing
Perspective drawings of the molecular packing in the
crystals of (+)-S-ibuprofen are given in figures 5a-5c.
(+)-S-ibuprofen is more water soluble than the racemate ( 3 )
and it is of interest to seek the basis for the differing
solubilitie s or thermal behavior in terms of intermolecular
attractions forces. Although having the same number of
molecules , S(+) crystals have a totally different unit cell
134

than the racemace ( Fig.5a ). The array of S molecule s in
volved in homochiral interactions probably spreads the
mechanical stability / strength of the crystal ( Fig.5b ) . The
preferential molecular arrangement in the P2 1 plan exhibit
some of the acid groups " face-up " and others "face down· so
that all the layers of molecules are interconnected with
pairs of hydrogen bonds to carboxyl groups. As suming that
the top layer of the c r ystal is one. crystal surface is dif
ferent for the two compounds. Thus in the case of C~)- S -
ibuprofen there are more exposed carboxyls and less
hydrophobic layer s. There are several points of interest: _
first the greater number of crystallographically independant
molecules in the S crystals ; secondly there are no obvious
relationships between molecular packing in the lattice of
racemate and enantiomers . Finally. the structural data
reflects different intermolecular environments. In order to
pack together, molecules of the same chirality had to be
somewhat flexed in order to meet the space requirements of
the lattice. A qualitative measure was the superposition of
two (+)-S- ibuprofen molecules involved in the same hydrogen
bond which clearly demonstrate the torsion (Fig.5c). We
hypothesize that further crystal elasticity or fragility
would result from the packing.
135

Solubility
The s o lubility of crystalline solid is determined b y che
free energy changes from the solid state to a solution . As
indicated in table II. ~Go at 25 °c is slightly higher f or
the racemate than for its S C~) isomer which may account for
the differing solubilities. Similar conclusions could be
drawn from the analysis of fusion parameters. The enthalpy
and entropy contributions to water solubility as revealed by
the thermodynamic functions in table II. are very different
suggesting that solid state structures are responsible for
these differences.
CONCLUSI ONS
It was confirmed that rac-ibuprofen naturally occurs as
a racemic compound (10) with a eutectic temperature ap
proaching 320 °K. This behavior although quite conventional .
has some serious implications in the formulation of the
biologically active stereoisomer. Heterochiral interactions
formed preferentially. Thus, both qualitatively and quan
titatively, the intermolecular network of interactions in
crystal unit cells of the racemate significantly exceeds
that existing within cells of the pure enantiomer and can
also reasonably account for the differing solubilities.
thermal behavior and further processing characteristics. The
136

literature ind i cates chat in some ins tances. when the melt
ing po inc of pure stereoisomers is substantially l ower.
these optical isomers are several fold mo re s oluble than the
corresponding racemate ( 5,8 ) . In this case, the S isomer was
only slightly more water soluble than r ac -ibuprofen . We at
tribute this phenomena to the molecular arrangement in the
lattice of ( +)-S- ibuprofen . Solid- state structure contribu
tions ( ~H ) to s olubility were different between the (+)
isomer and the racemate. At pH 1 .3 the entropy effect ( ~S )
counterbalanced this effect and standard free energy were
almost equivalent for the two c rystals. These results con
firmed the l ow specific surface area and the slow intrinsic
dissolution rate of ( +)- S- ibuprofen. In addition , the crys
tal lattice exhibi ted potentials for mechanical instability
if perturbed by components of high hydr ogen bonding af
finities.
Acknowledgements : We are indebted to Ciba- Geigy Corporati on
for the award of a fellowship and to Dr. Lukas , Director of
P.P.T. fo r his supervi sion during the course of this
project. We thank Dr D. Bauer. Ethyl Corp. for providing us
with single crystal X-ray diffraction data.
REFERENCES
137

l. Pharmac ol og ical differences between the optical is omer s
of ~buprofen: evidence for metabolic inversion of the
( - )-R-isomer .
SS Adams , P. Bresloff and CG Ma son J.Pharm.Pharmaco.
28:256-257. 1976
2. Stereoselectivity in Clinical Pharmacokinetics and Drug
Development
D.B. Campbell. Europeen J. Drug Metab . &
Pharmacokinetics , 5(2 ) pp 109-125. 1990
3. Approaches to Stereospecific Preformulation of Ibuprofen
A.J . Romero and C.T. Rhodes accepted for publication in
D.D . I.P ., 17 ( 4 ). 1991
4. Thermal Behavior and Phase Diagrams of Sobrerol
Enantiomers and Racemates.
G. P . Bettinetti . F . Giordano , A. Italia. R . Bellegata
and P.Ventura , A. G.P.I. Paris 1989 , pp 232 - 242
5. Stereochemistry of the Antitumor Agent 4.4 '-( l , 2
Pr opanediyl bis (4- Piperazine-2, 6,Dione ) : Crystal and
Molecular Structures of the Racemate ( ICRF - 159 ) and a
Soluble Enantiomer.
A.Hempel. N. Camerman and A. Cammerman J.Ame Chem.Soc .
2, 3453-56. 1982
138

6. Solubility and Par titioning I: Solubility of
Nonelectrolytes in Wat er .
S.H. Yalkowsky and S.C . Valvani J.Pharm.Sci. 69 ( 8 ) .
9 12 - 921. August 1980
7. Relationships between Solid-State Structures of
Enantiomers and the Corresponding Racemic Compounds in
Small derivatives
A. Forni . I. Moretti , G. Torre. S. Bruckner. L. Malpezzi
and G. DiSilvestro. J . Chem.Soc . Perkin Trans II
2:791-797 , 1984
8. Enantiomers. Racemates and Resolutions
J.Jacques . A. Collet and s.w. Wilen J. Wiley 1981
a ) pp 32 - 43: b ) pp 88-104
9. 2- ( 4 - Isobutyl Phenyl ) Pr opionic Acid
J.F. McConnell , Cryst . Struct.Comm. 3 : 73 - 75 , 1974
139

Table I: Crystal Data for (+)-S-Ibuprofen and Rae-ibuprofen
(+)-S-ibuprofen Rae-ibuprofen
Formula Cl3H1802 C13H1802 Molecul.Weight 206.3 grams 206.3 grams Crystal System Monoclinic Monoclinic Space Group P21/c P21
a( i\) 12.46 14.67 b(i\) 8.03 7.88
,_, c( i\l 13.53 10.73
"" ()l(i\) 0 ( ) 112. 95 99.36
~( e # of molecules in the cell 4 4 Density (g. cm ) 1. 098 CuK GI Radiation

Table II: Thermodynamic Functions of Melting and Solubility
Ibuprofen Rae (+)-S (-)-R -
Melting
Tm Melting Point (~K) ·1
349 327 327
oH Enthalpy (KJ.mole ) 25.5 17.9 17.9 · 1 · 1
>--' oS Entropy (J.mole ·~ K ) 73.2 54.8 54.8 ti> >--'
Solution · 1
oH ( KJ.mole ) 32.2 51. 5 · 1
oS ( J.mole .o K ) 6.7 73.4 · 1
oG, < KJ.mole ) 30.2 29.6
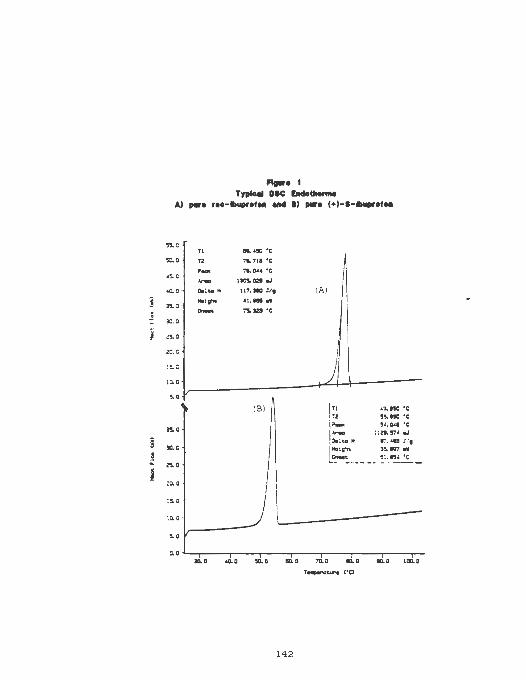
l'lts• t Typlcal DIC ladetllenM
Al ,... rH-llluprot .. M4I I) ,... (+)-1-..._,ot•
"'-C
TZ
•5. c
35. 0
30. 0
l 5. 0
20.0
71L 111 •c
11173..QZI aJ
117. - J/ 1
41 • .S ••
""121 •c
(A )
ts.:
10. 0 · ,__-----+--)4-+---5.0
~ 35.0
10.C
... 0
.'.!D. Q
:s.o
10.0
5.0 .v
..... .... o
In '1nc •c ~z '5!. HD •c
l;a._. ''·o"' •c ......_ i 1Zl.S7'&1
!le l t.a N r.'."8 1:9
l~'. ___ -- ~~:: ~~ -'"/ I \
....
I
\~-------~
1111.D 70.D .... ID.Q IDD.0
T~<"O
142

,..... 2 DIC TMrmo1rame of lbuprof..,
Dfft•rut Enantlom- Compoaltlon
I 40
I
50 I
60 I
70
143
I 80

0 0 0 C! 0
~ ~ 41 41 E E
.I 0 0 !! ... · D ···· !!
i - -I f I Cl + _u ii' Cl Cl c;; -e .2 • 41 .. ! J s:. 0 Cl s:. - 0 -IO IO
iiJ - 0 0 -0 0
.. - c: c: a • 0 .2 ~J
; -u u
ii • • ~ ~
&I. .................... &I.
! • • & 0 0 2 2
0 0 C! 0 '""o 0 oo • .. 0 .. " "
{)I.) •Unl8J9dW9,l
144

FICllll'•' Teet of the Pritoflne-Det•r Equ•Uon
- 1.JO ~---AH--.-l-1.-1-K-.a..ol----,.-.K-,1
0
0
-)i I ...
;c -1.70
3
-2.10 L---~-~--~-~ 2.84 2.91 2.98
145

Figure Ila Cryatal Unit Cel of (+1-S-llluprofen
146

Flfllre lb Crrttal Lattice of ( + J-1-lbuprolen
147

FIOur• le luperpo1illon of (+)-1-lbuprolen moleculH lnwolved
In the Hm• hydrogen bond
';, .... :· _ ..:'-, >--
,'
\
\
148

MANUSCRIPT VI
FORMULATION OF THE BIOLOGICALLY ACTIVE
STEREOISOMER OF IBUPROFEN
149

ABSTRACT
As part of an effort to formulate the biologically ac
tive stereoisomer of ibuprofen. the effect s of
pharmaceutical processing on rac-ibuprofen and ( +)- S
ibuprofen crystals were compared. This comparative analys i s
is a unique concept used in stereoselective formulati on. It
was not found possible - - formulate the (+ ) isomer using
wet granulation , however direct compression appeared most
promising. Tablets so formulated showed rapid diss olution
and other tablet properties were fully acceptable. Mixing .
with excipients decreased the enthalpy of fusion of
ibuprofen and compaction induced low temperature eutectics
indicated by DSC endotherms. Stress storage of the (+)-S
ibuprofen seriously affected the handling properties of the
dry formulations.
INTRODUCTION
With the exception of Naproxen, all profens currently
used as non-steroidal antiinflammatory agents are marketed
as racemates ( 1). For most of these drug substances the
dextro-rotary or S(+) optical isomer seems to be responsible
for the therapeutic activity , that is the stereospecific in
hibition of cyclooxygenase. In addition , various
pharmacokinetic reports have been published suggesting that
150

for some of these aryl p r opioni c acids. bioinve rsion of the
inactive enanti ome r int o the active isomer S(-) take place
in vivo. by enzymatic mechanisms ( 2 ) . For ibuprofen. a s much
as 33% of the S(+) fo rm could result fr om this biotransfor
mation. Thus a racemate (containing 50% of R( -)) could yield
2 / 3 of active ibuprofen in the systemic ci rculation ( 3 ).
Unfortunately, this pharmacokinetic rationale is only
one of the factors which must be considered for the success
ful f ormulation of the pure enantiomer in a drug delivery
system . Previous investigations by Romero et al ( 4 ) have
shown that the presently available (+)-S-ibuprofen has a
relatively small specific surface area which might be some
what of an impediment to bioavailability (although
solubility was found higher than the racemate). Some han
dling properties such as flowability were greatly improved
while compatibility screening indicated substantial crystal
distortion under processing ( low temperature eutectic ). The
molecular packing structure in the crystal lattice was
elucidated ( 5 ) and it was concluded that (+)-S- ibuprofen ex
ists as a totally different crystal than the racemate form.
Analysis of homochiral interactions also revealed that the
enantiomer crystal might be fragile and more susceptible to
distortion.
The study of a pure enantiomer as an answer for a phar
maceutical problem is not new in process development ( 6 ) but
the analysis comparing the relationships between molecular
151

aspects of crystal stereochemistry and biopharmaceutical
performances appears to be a new approach co stereospecif ic
drug formulacion. Recommendations on the processing of ( + )
S-ibuprofen were f ormulated based on this study and previous
reports.
EXPERI MENTAL
Materials
Ibuprofens (racemate and S isomer) were obtained from _
the Ethyl Corporation ( Baton Rouge. LA ). Fast flow lactose
(Sheffield). polyvinylpirrolidone ( GAF) and Explotab ( Edward
Mendell) were selected as diluent. binder and disintegrant
respectively . Simulated intestinal fluid was prepared using
potassium phosphate monobasic ( Fisher Scientific ), distilled
water and the pH adjusted to 7.4 with sodium hydroxide
(Malinkrodt) .
Methods
A formulation program was undertaken, including a com
patibility screening, tablet manufacture a nd analysis of
biopharmaceutical properties.
As in previous investigation (7), emphasis was given to
the study of crystal modifications during processing and
152

their effects on the performance of the final product for
both ibuprofens .
Thermal a nd Compa t i b i lity Studies
Calorimetry was the analytical tool selected for these
studies. A Perkin Elmer Series 7 thermal unit was used. A
P7500E computer. interfaced with the system. all owing data
aquisition and integration of the thermal endotherms .
Systems o f increasing concentrations of (+)-S- ibuprofen and
excipients were mixed at room temperature for 24 hours on a
Labshaker rotating at 40 RPM. Table I summarizes the ex-
perimental design . Samples were withdrawn , tested for
differential scanning calorimetry ( DSC ) profiles on a Perkin
Elmer differential scanning calorimeter and stability after
exposure to the followi ng stress conditions in humidity
chambers ; 37 °c at 85 % relative humidity ( RH) , and 50°c at
75% RH for one and seven days. Macroscopic observations were
also recorded. Tablets made of 67% (T)-S- ibuprofen and ex
cipients were ground and analyzed for endotherms to assess
crystal mod if i cation.
Attempts made to formulate the (+)- S-isomer into tablets
by wet granulation wer e unsuccessful . It was found impos
sible to dry the granule s at temperature s between 30 a nd
40°c. A direct compression formulation was deve l oped using
the same excipients used for the racemate and compared to
153

tablets havi ng t he same rac - i buprofen concentration. Tablets
of rac-ibupr ofen were prepared according to a formulation
design already validated ( 6). Dry mixtures of 67% (-)-S
ibuprofen. 23% Fast flow lact ose . 6% binder and 3%
disintegrant ( Explotab ) were prepared using a V- blender
r otat ing at 30 RPM for ten minutes and further lubricated
with 1% magnesium stearate for five minutes. A Carver
hydraulic press was used to produce 350 mg tablets at 2500
lbs compression force for a 15 second dwell t ime. Three
regions of the compaction spectrum (low. intermediate and
high ) were also investigated f or crystal distortion . The ex
perimental protocol included measurement of disintegration
time , hardness . dissolution profiles and thermal analysis.
When possible statistical analys is was performed at the
95% confidence level either using a paired t test or ANOVA
to compare (+)-S-ibuprofen and Rae-ibupr ofen powders.
RESULTS AND DISCUSSION
DSC profiles of ibuprofen mixtures were integrated for
melting points , enthalpy of f usion and heat capacity. Mixing
with excipients had an influence on the thermodynamic
parameters of fusion largely due to increasing amounts of
impurities (table II ) and the extent of surface crystal dis
tortion appeared inversely proportional to the ibuprofen
concentration. Similar observations were made f or the
154

racemate. The mixtures became more difficult to handle with
increasing concentrations of (+)- S- ibuprofen. Samples of the
formulations. kept at different temperatures and relative
humidities ranging from 35° t o 50°c and 35 to 85% re s pec
tively were withdrawn at dif ferent time intervals . After
only 24 hours under the above storage conditions it was im
possible to handle any mixtures which had been stored at
50°C , 37°C and 75% RH . All high strength miniformul ations
had "melted ". After one week of storage at r oom temperature
the thermal analysis revealed that eutectic f ormation lower
ing the melting point and heat of fusion (table III ) _
apparently made the ibuprofen mechanically unstable.
It appeared that S(+) had a greater tendency t o form eutec
tics than the racemate with the selected pharmaceutical
excipients. The crystal distortion is further facilitated by
stressful mixing ( e.g. planetary mixer ). This observation i s
in agreement with the previous analysis of molecular ar -
rangements in the crystal unit and the peripherical
localization of the intermolecular "Hydrogen" bond network
of the (+) enantiomer (7).
Biopharmaceutical analysis was performed on the 350 mg
tablets. Conventional rac-ibuprofen formulations ( using Wet
Granulation ) were compared to (+)-S-ibuprofen (Directly
Compressible ) formulation. Disintegration times averaged
8 '( 4 ') for the S(+). These tablets did not erode as did the
corresponding racemate tablets averaging 53 '( 6 ') . instead
155

they disintegrated rather quickly and became a paste stick
ing to the grid. The mean hardness for these tablets was
30 (1 9 ) N.
Using a procedure testing for the extent of crystal
modifications in solid dosage forms ( 7 ) thermodynamic
parameters of ground tablets were analyzed to compare (+)-8-
ibuprofen to the racemate. Results of the calorimetric
analysis are presented in table IV and figure l. Thermal en
d otherms of mixtures after compaction indicated a "clear "
eutectic ( first endotherm) at lower temperature. The eutec
tic also appeared after three days of mixing and was not .
proportional to the compaction level, as was previously
found fo~ the racemate (7). As predicted from molecular
modeling the manifestation
compaction are different
racemate.
of lattice rearrangement upon
between (+)-8-ibuprofen and the
Although higher intrinsic dissolution rates had been
found for the racemate (partly due
size), the dissolution for 67%
to its small particle
(+)-8-ibuprofen from the
directly compressible formulation was faster than for the
racemate (Table V). The time for 50% dissolution of (+)-8-
ibuprofen was three times smaller (figure 2 ) and at twenty
minutes 58.2(12)% ( average ( 8D )) of (+)-8 isomer had dis
solved whereas only 22.8(4) % of rac-ibuprofen was released.
It is speculated that the presence of excipients and crystal
156

distortion might be bene ficial in enhancing the dissolution
of the S isomer.
CONCLUSIONS
The results of this
preformulati on profile ( 6 )
study were in a greement with a
reporting that (~ J -S-ibuprofen
crystal particles are very "fragile" and loose their han
dling properties when stressed or ground. Therefore further
processing will require a gentle mixing. Crystal arrays of
(+) and (-) molecules in racemic crystals are totally dif
ferent than molecules in the lattice of (T)-S- ibuprofen ( 7 ).
As a consequence. crystal distortion was significantly dif
ferent between the two compounds. In additi on to
modification of the crystal habit. the S isomer exhibited a
eutectic upon compact ion . The dissolution of (+)-S-ibuprofen
from the dosage forms was faster when compared to the
racemate . It is hypothesized that the particle size
decreased upon compression and / or the excipients improved
the dissolution . Another result of the thermal analysis in
dicated that as observed for the racemate. excipients
protected the ibuprofen crystal from further distortion.
Lower strength formulations had decreased heat of fusion but
improved mechanical properties .
In conclusion a directly compressible formulation of the
S(T) isomer is a feasible alternative to the conventional
157

wet granulation formulation currenoly used for rac -
ibuprofen. Based on the analysis of the stereoisomer at the
molecular level , suggestions for future work can be formu
lated. Research for neutral excipients including flow
properties and the effect of storage under various condi
tions could bring practical answers. Mixing (time and
techniques ) appear to be critical . It is important to
preserve the S crystal intact before tabletting. Finally.
the effect of storage on the biopharmaceutical properties of
the tablets should be studied. There was eutectic formation
resulting from compaction.
Acknowledgement s: We greatly appreciate the support provided
by Ciba-Geigy Corporation and the input of Dr. G. Lukas
Director of Pharmaceutics and Pharmaceutical technology.
REFERENCES .
1. Stereoselective Metabolism of Antiinflammatory
2-Aryl Propioniates.
J.M. Mayer
Acta Pharm.Nord. 2(3 ), 196- 216 , 1990
2. Metabolic Chiral Inversion of 2 Aryl Propionic
Acids: A Novel Route with Pharmacological
158

3.
Consequenses.
A.J. Hu"t and J . Caldwell
J . Pharm . Pharmac ol. 35:693 - 704. 1983
An Evaluation
Simulation.
of Ibuprofen Bioinversion
A.J. Romero. R. Rackley and C.T. Rhodes
Chirality. III ( 5 ) . 1991
4. An Approach to stereospecific Preformulation of
Ibuprofen.
Accepted for publication D.D.I.P. 17(4 )
5 Molecular Biopharmaceutics and Stereochemistry of
Ibuprofen. Unpublished report
A.J. Romero, F. Clarke and C.T. Rhodes
6. Utilization of an Enantiomer as a Solution to a
Pharmaceutical Problem: Application to
Solubilization of l,2-Di ( 4 - piperazine -2.6 Dione)
Propane.
A.J. Repta.M.J. Baltezor and P . C. Bansal
J.Pharm.Sci , 65(2):238-242, 1976
7. Monitoring Crystal Modification in Systems
Containing Ibuprofen.
159
by

r A.J. Romero. L. Savastano and C.T. Rhodes
submitted for publication
160

,_, O>
Table I: Experimental Design
a a Formulation A B
(+)-S-ibuprofen 17 37 Binder (PVP) 6 6 Diluent (F.F.Lactose) 73 53 Disintegrant (Explotab) 3 3 Lubricant (Mg.St.) - -
*· Tabletted at several compression forces (ranging from 600 to 15000 lbs)
a. subjected to stress storage
a * a ,, c D E
57 67 77 % 6 6 6 %
33 23 13 % 3 3 3 % - l - %

I-'
m (\)
Table II: Thermal Analysis of (+)-S Formulation (24 hr mixing)
Formulations: Thermodynamic Pure Functions ibuprofen A B c E
0 a a a a a Melting Point (Tm in K) 327 325.5 325.8 326.4 326.4
Enthalpy of Fusion (KJ/mole) average +/- (SD) 18.3 11. 6 14.6 16.0 16.5
(0 . 2) ( 1.1) (1.6) (1.1) (1. 0)
a. Relative standard deviation (RSD) less or equal than 0 . 05

,..., Ol c;I
Table III: Thermal Analysis of (+)-S Formulation (One week storage at RT)
Formulations: Thermodynamic Pure Functions ibuprofen A B c E
0 a Melting Point (Tm in K) 327 324.2 325.0 325.3 325.5
Enthalpy of Fusion (KJ/mole) 18.3 +/- 10.5 12.7 16.2 15.4 0.2
a. Relative standard deviation (RSD) less or equal than 0 . 05

,_, Ol ol>
'
Table IV: Thermal Analysis of (+)-S-ibuprofen Tablets (67%) Effect of Compaction
1 1 2 2 Compression Force Tm .6H Tm AH
0 0
(KN) ( K ) (KJ/mole) . ( K ) (KJ/mole)
a
0.0 - - 327.8 18.3 b
o.o - - 325.7 17.3 c
o.o 314.5 1. 79 325.4 16.8
2.7 313. 9 0.66 325.1 16.9 5.3 318.1 0.92 324.7 16.2
10.7 314.3 0.53 325.7 17.7 22.2 314 .1 0.53 325.9 18. 6 26.7 313. 8 0.68 325.4 17. 5 35.6 314 . 5 0.35 326.2 19.0 44.5 314 .0 0.41 325.7 18.5
a. Pure (+)-S-ibuprofen "as is" b. 67% (+)-S-ibuprofen formulation after ten minutes of mixing c. 67% (+)-S-ibuprofen formulation after three days of mixing

'-' Ol (JI
Table V: Biopharmaceutical Properties of Ibuprofen Tablets
Ave rage +/- (SD)
Time for 50% % Dissolved Hardness Disintegration (Minutes) in 20 Min . (KN) Time (Minutes)
(+)-S-ibuprofen 17 58.2(12) 30.0(19) 8 ( 4) ..
Ra e-ibuprofen 5 3 22.8 (4) 22. 2 (5) 53 ( 6 )

.:! • :a • • e ... li s5
0 c,, 0 c ; Ill .. !~ i5 0
:ao
.. • a:
:. g ... i;·.:::::::·::·:::; .•.... 0 -! ... ... f • 0 !; u a ii:
... . ::!'.'.~:::.~ .. ··~-0
166
_j) . -~· ·· ·· ..
0 OI
0 ...
0
'°
·- .J 0 ..
'() . • ~ • .. • A e • ... a ~ .. :II

• ti ... 0 ti o-; c E ti ti - u 0 Ill ~a: :I "Cl :e c
Ill -0 ..... + g u;
;; :I -0 0
• • Q c 0 • ..:
C"1 l . ~ !; 0 a u::
• ii E • ... • a: I • I
I 0 I
,, . :: . :§ ! - ... a. • 0 a: I + I
167
0 <IJ
.. • -; c s • s ....

CONCLUSIONS
168

CONCLUSIONS AND SUGGESTIONS FOR FUTURE WORK
In the early stages of this study. I defined tests and
methods that made possible the identification of crystal
properties that affect the processing of ibuprofen. It was
shown that different sources of ibuprofen , all meeting the
United States Pharmacopeia compendial standards , had very
variable crystal characteristics. These differences had a
dramatic effect upon the selection of processing parameters
and not all the sources of ibuprofen can be regarded as in
terchangeable . This report is one of the first promoting the
use of different standard operating procedures (SOP's) for
sources from different suppliers of ibuprofen. Also . given
the five sources of this NSAID agent , it is conceivable that
it might be advantagous to make USP standards more rigorous.
I have no reason to doubt that other drugs may also require
this adjustment of the formulation process if they are ob
tained from different manufacturers or different synthetic
routes.
This study underlines the importance of crystal en
gineering and strict physical pharmacy profiles in drug
development. I was able to demonstrate , with relative con-
fidence that sintering is the molecular mechanism by which
ibuprofen transformation is achieved during formulation. A
resulting hydrophobic network within tablets was the cause
169

of many formulation problems with chis compound. Several
analytical tools usually re served to other fields of phar
maceutical research ( e.g. SEM. DSC. molecular modeling )
proved extremely useful and should be incorporated in
regular formulation / preformulation activities especially
when single isomers are being considered as replacement for
racemic drugs.
The same methodologies were applied to the analysis of
the (-)-S- ibuprofen . It is well established that drug sub
stances with a chiral center may exhibit pharmacologically
active and inactive stereoisomers. When this is the case.
there might be indeed a powerful argument to replace
racemate with the single pure enantiomer. The rational for
this change has to be carefully reviewed.
It is believed that this thesis is one of the first
report to demonstrate that in addition to biological dif
ferences (previously publicized ). rac- ibuprofen and (+)- S
ibuprofen are essentially different in terms of processing
and formulation. Both quantitatively and qualitatively dif
ferences in homo and heterochiral interactions can account
for a certain degree of the differences in mechanical
properties and solubility . For example, direct compression
is impossible and wet granulation is the only way to formu
late the racemate. whereas the reverse may be true for the S
isomer . Some characteristics of the racemate must be kept
170

in mind but I c an assess with confidenc e that the (-)- S
i bupr ofen is a totally independent crystal that s hould be
for mul a ted a s a new drug subs tanc e .
The comparative analysis o f molecular pharmaceutic s of
the racemate and stereoisomers revealed a u seful tool f or
stereospecific drug development. Enantiomers should be con
sidered as early as possible as new c andidates fo r
formulation. I t may well be that conclusions for ibupr ofen
could be applied to others chiral compounds and in view of
the above factors. I strongly recommend that all changes
from racemate to pure isomers be subjected to extensive _
molecular scrutiny in early preformulation program . using
the approach that was designed.
My results suggest, however. that more studies on the
effect of stress storage of ( +)- S- ibuprofen and its formula
tions should be conducted. This compound is very fragile.
Formulators must proceed with extreme caution as it is more
likely that ( +) - S-ibuprofen will sublime even at room tem
perature. Other studies are currently under way to refine
the model of stereospecific bioinversion in man . adding a
feed back inhibition from the S isomer. Such studies could
involve the administration of different enantiomeric com
position in a rat model and the monitoring of systemic
plasma concentrations of S and R ibuprofen. A faster absorp
tion of (+)-8-ibuprofen has been observed when this isomer
171

is administered within the racemate form than alone.
Optimizing i buprofen therapy could lead to administering a
small amount of (-) -R-ibuprofen. In this thesis it was found
that chiral bioinversion occur essentially systemically. The
results suggested that enantiomeric AUC ratios were ex-
tremely powerful in studying realistic ibuprofen
pharmacokinetics.
The work reported in this dissertation has demonstrated
that careful attention has to be directed to crystal charac
teristics and physico-chemical properties of raw materials. -
Consequently USP compendial standards should be more
rigorous. The results clearly indicate that a profound
change of the approach to formulating drug substances is
necessary using combinations of new testing methods readily
available. This concept is in my opinion essential when the
drug substance includes a chiral center and developing pure
isomers might be a possibility.
172

SECTION III
173

MANUSCRIPT VII
USE AND LIMITATIONS OF THE TRUNCATED
AREA UNDER THE CURVE IN BIOEQUIVALENCE TESTING
1 7 4

ABSTRACT
Computer simulat i ons were used t o evaluate the truncated
area under the plasma level - time curves ( AUCt ) as indicators
o f the bioequivalence between test and reference products.
Plasma concent rations were simulated from one and two corn-
partrnent open models using first order absorption rate
constants ( Ka ) and bioavailability ( F ) ranging respectively
from 45 to 200% and 60 to 140% of the reference values. The
pharrnacokinetic parameters were selected to cover a wide
range of disposit ion rate constants (0.0 1-0 .79 hr . - 1 ) . The
area under the blood level - time curves was calculated using
the trapezoidal rule at each time point ( t ) according to a
conventional sampling regimen. The extent of absorpti on
( AUCinf ) was calculated , using integrals of the general
blood equations. The ratios of AUCt: test to reference and
AUCt t o AUCinfwere determined. For most simulations . the
ratios changed very little between the end of the absorpti on
period. the last time point and the time infinity .
AUCtrnax was not a good parameter t o compare the
bioavailability of two drug products. Three groups of dif
ferent mathematical behavior were identified , in which
bioequivalence determination might present some problems
when using a single AUG. Several truncated AUC ratios,
however. could provide meaningful information on absorption
175

rates for bioequivalence testing. In our study the Auc8 0 was
consistently a good indicator of bioequivalence.
I NTRODUCTION
Since the seventies. the rate of discovery and develop
ment o f new therapeutic entities has been decreasing while
the number of major drugs going off patent has been increas
ing ( 1 ) . As a result there has been a steady expansion o f
the generic market (2). This phenomena was enhanced by the
Drug Price Competition and Patent Restoration Act which ex -
pedited the approval of generic drugs.Under this act, the
therapeutic equivalency of generic products may be assessed
on the basis of a bioequivalence test. The fundamental as
sumption being that once in the general circulation, the
same active drug undergoes the same disposition and metabo
lism independent of the dosage forms . Therefore, drug
products showing "similar " bioavailability could be termed
bioequivalent according to specifications provided by the
Food and Drug Administration ( FDA ).
Bioavailability has been defined as the rate and extent
at which a drug ingredient is absorbed from the drug for
mulation and becomes available to the site of action (3).
Details on the experimental design and statistical tech
niques for these bioavailability studies have been described
extensively elsewhere ( 4 - 5 ) and for some drugs the Division
176
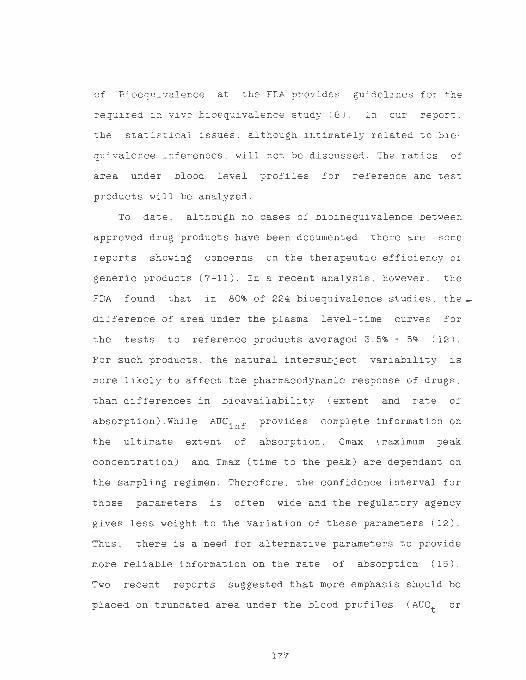
of Bioequivalence at the FDA provides guidelines for the
required in-vivo bioequivalence study ( 6). In our reporc .
the staciscical issues. although int i mately related to bie
quivalence inferences , will not be discussed. The rat ios of
area under blood level profiles for reference and test
products will be analyzed.
To date , although no cases of bioinequivalence be tween
approved drug products have been documented . the re are some
reports showing concerns on the therapeutic efficiency of
generic products (7- 11 ). In a recent analysis. however , the
FDA found that in 80% of 224 bioequivalence studies , the _
difference of area under the plasma level -t ime curves for
the tests to reference products averaged 3.5% ! 5% (1 2 ).
For such products , the natural intersubj ect variabilit y is
more likely to affect the pharmacodynamic response of drugs.
than differences in bioavailability ( extent and rate of
absorption ). While AUCinf provides complete information on
the ultimate extent of absorption. Cmax ( maximum peak
concentration) and Tmax ( time to the peak ) are dependant on
the sampling regimen . Therefore , the confidence interval for
those parameters is often wide and the regulatory agency
gives less weight to the variation of these parameters (12).
Thus , there is a need for alternative parameters to provide
more reliable information on the rate of absorpt i on ( 15 ) .
Two recent reports suggested that more emphasis should be
placed on truncated area under the blood profiles ( AUCt or
177

AUCxx· where t is the sampling time corresponding to XX per
cent of the AUCinf ) in the determination of bioequivalence
( 16.23 ) . Many bioequivalence studies compared AUCtlast
(tlast =time of last measurable concentration ) (17 - 19), but
only recently. few used the truncated area AUCt ( 22 ) or ad
dressed the pharmacokinetic relevance of this parameter
(20,2 1 , 23). In Japan. statistical testing on AUCtlast
instead of AUCinf is required to assess bioequivalence be
tween two products (19). The issue of the last sampling time
remains a question mark. The approach required by the FDA is
that AUC's should be calculated from plasma levels which _
have fallen to at least 10% of the peak concentration. This
method is useful but empirical. In essence. there is no
simple rule of thumb governing the principles of bioe
qui valence testing.
The objectives of this computer simulation are to inves
tigate the use and limitations of truncated areas in
bioequivalence studies and to stress the pharmacokinetic
relevance of this parameter. We hope to define rational
limitations and boundarie s in the practical use of incremen
tal AUC 's. Our goals are to demonstrate that ratios of
truncated AUC's can be used with good reliability in bioe
quivalence testing as they conform to both the statistical
appropriateness and
relevance
the pharmacokinetic / pharmacodynamic
178

METHODS
Plasma levels were simulated from one and two compart -
ment open model equations using first order elimination
constants ( KE ) ranging from 0 . 04 to 0.2 hr - 1and sets of al
pha ( a ). beta(~) fr om 0. 17 t o 0.79 and 0.01 t o 0. 17
hr - 1respectively . For each KE and each set of a ,~ the phar-
macokinetic parameters characterizing the dosage forms.
bioavailability ( F ) and rate of absorption ( Ka ), were ranged
from 60% to 140% and 45% to 200% of the reference product
values . All conditions are reported in table I and II. All
necessary nomenclature is given in the appendix. It is well _
known that AUCinf remains constant with varying rates of ab
sorption and we were interested in observing the behavior of
truncated areas in the various combinations . The one com-
partment open model ( figure 1 , equation 1 ) and the two
compartment open model ( 24 ) with elimination from the
central compartment , ( figure 2. equation 2 ) were used in
these simulations.
Ct ( F.D.Ka / V) . ( e - KEt _ e - Kat ) eq.l
Ct Ka.F.D. ( K21 - a ) [ e - atl + -v~cfa=a ;~c~=a ;-
Ka.F.D.(K21- ~) [ e- ~ tl + -v~cfa=~;~ca=~;-
179

e q . 2
The dispositi on parameters for a drug. were assumed t o
be independent o f the dosage f orm and for each KE or set of
C a .~) . the pharmacokinetic parameters of the dosage fo rms. F
and Ka were varied. The reference products that we ar -
bitrarily designated for comparison purposes had the same F.
Ka over the KE or a. ~ ranges.
Simulation algorithms were coded in Pascal and
TurboPascal and compiled on IBM Personal Computers. Mos t o f
the equations we used were derived from mono , bi and triex-
ponential traditional relationships between concentration
and time. Calculations of AUC ratios (AUCtest AUCref )
depended on the time available for absorption T ( 20. 25 ).
where T was the end of the absorption period. Derivat ions
and calculations for one and two model compartments are
given in Appendix 2.
T. the time for 99% of the absorption to occur. can be
estimated from the first order process using the wagner
Nelson method (22) where the fraction unabsorbed is obtained
with :
T 4.606 / Ka eq . 3
T ranged from 1 . 6 to 5.8 hours. It has been suggested
that AUC should be calculated at least through 3.5 half
180

lives f or accuracy ( 24 ) . However. it appeared that AUCt at
t =2T is usually within a few percent of the AUCinf ( 17 , 24 ) .
For the two compartment study. the procedure was similar
except the classic triexponential function ( equation 2 )
describing an open two compartment model. If we maintain our
assumption that v. K21. D, a and ~ remain constant and inde
pendent of time. we can express the extent of absorption as
At = f Ctdt eq.4
Using the ranges of pharmacokinetic parameters reported and
reference values from table III. area under the curves were_
calculated using the trapezoidal rule (AUCt ) and equations
previously defined (AUCinf) : the area at t = infinity was
A= F.D / V. KE eq . 5
for one compartme nt a nd
A = AT + [ CT / a + CT I ~
for two compartme nts
eq.6
AUC rat i os ( test / ref) were than evaluated. Time points
such as t= T, 3 / 2T and 2T. 3T were given special attention.
This study is not exhaustive in any means because we had to
use a limited set of parameters. Nevertheless , this report
presents an approach in the potential use of truncated area
in bioequivalence determination.
181

RESULTS AND DISCUSSION
Area under the curve ratios have been discussed by
Wagner ( 24 ) and Loo and Riegelman (2 5 ) who proposed several
mathematical relations for percent of drug absorbed. inde
pendent of the model. Incomplete availability can influence
the absorption process and true absorption rate constants
cannot be calculated with complete accuracy from plasma
levels ( 27 ). Furthermore. when the absorption is the limit
ing factor. flip-flop phenomena may occur ( Ka <KE ) and
AUCinfcannot be correctly estimated (28) . In other in-
stances . when both zero and first order kinetic model
describe the absorption process ( 29 ) . the rate of absorption
is very difficult to estimate with accuracy. For bioe-
qui valence testing, however. the extent and rate of
absorption , as measured from blood concentrations , by com
paring using AUCs , Tmax and Cmax do not fall within the
previous limitations. In this study, the Ka ' s are apparent
absorption rate constants and represent also immediate
release characteristics of the dosage forms being tested . We
fully understand the limitations of the simulations since
the pharmacokinetic models apply to situations where the
formulation behavior is the limiting factor of drug absorp
tion .
182

I n many bioe qui va lence stud ies. an anal ys i s of var iance
is conducted on pharmacokinetic par ame ters such as Ct or
AUCt a nd t he class i cal hy p otheses a re te s ted:
H0 : Test = Reference or ~ = O
Ha . Test # Referenc e o r ~ # 0 . where ~ is a measure of
the difference in bi oa vailability . Th i s t e st i s n ot cons i s
t ent wi th the definiti on o f bioequivalenc e be c ause the powe r
o f the test is aimed at testing Ha not the null hypothesi s
H0 The current acceptance criteria f or bioequivalenc e i s
that the true AUG or AUCinf of the t est f ormulation s h ould
be within 20% of the reference mean :
AUCtest - AUCref ~ 10. 20 1 ( AUCref )
which can be written as:
I 0. 2 I
Therefore the AUG ratios are c ompatible with the nature
of bioequivalence testing .
In a previous investigation ( 16 ) three cases of bioe
quivalence testing were simulated. In all simulations the
truncated area under the curve ( AUCt ), accounting for 6 0% o f
183

the AUCinf ' resulted in making the tests more sensitive to
bioavailability differences. It was also anticipated that
the ratios of AUCtmax could be of critical importance fo r
the determination of bioequivalence as it i s intimately re
lated to the rate of absorption . Unfortunately. we fou nd
that f or high bioavailability ( F ) . and low rate of absorp
tion ( Ka ) ( 50 to 75% of the reference value ). the
AUCtmax still falls within the acceptable range 80- 120% In
other cases. the AUCtmax ratio did not indicate equivalence
for bioequivalent products . The AUCtmax ratios are not reli
able indicators of the absorption rate as they failed to_
indicate equivalence in instances when Ka and relative
bioavailability were actually within the acceptable 20% of
the reference value ( Table IV ). In the bioavailability
profiles illustrated in figure 3. drug product B having a Ka
of 2.0 ( 143% of the reference value ) with a relative
bioavailability of 70%, and drug product C having a Ka of
0.8 ( 50% of the reference
bioavailability of 130%,
formulation A.
value ) with a relative
were compared to the reference
All truncated AUC ratios identified the inequivalence
except when approaching tmax for which the AUC ratios indi
cated false bioequivalence as marked by the bold vertical
line . Furthermore , the calculation of this parameter is very
sensitive t o the sampling regimen and we do not recommend
its use in bioequivalence comparison .
184

( In this proj e ct. mo re than 700 s imulat ions were per
formed and analyzed. although only significant figures are
presented in this report. The discussion is divided into
three scenarios whi ch we found critical in bioequivalence
t est ing: l ) the re lat i ve bioavailability (F) is outside the
acceptabl e range of 80 to 120% 2) the relative
bioavailability is within the allowed int erval with Ka rang
ing from 50 t o 200% of the reference v alue . and 3 ) at the
boundaries o f bioequivalence F=80% and F=l20%. In each case
the effects of unacceptable performances for the rate of ab
sorption were c arefully monit ored.
Case 1: when Ka and F of the test product were both out
side the range o f 80 to 120% of the reference values. 94% of
the time the truncated AUG detected the bioinequivalence at
all time points (tables V and VI ) . In particular situations ,
when the bioavailability is above 120% and the absorption
rate i s below 80%. the effect of the truncated estimate for
the extent of absorption is counterbalanced by those two
parameters and the ratio of truncated areas indicated false
bioequivalence. As KE or a. C increase , more absorption is
included in the truncated AUG ( 30 ) and larger portions of
AUCinf are sens itive to absorption rates. In figure 4 , the
high relative bioavailability ( F ) compensates for the slow
rate of bioavailability ( Ka =5 7% ) and AUC ratios indicate
false bioequivalence. This situation shows that a product
185

wit h unacce pt a b l y hi gh ext ent of absorption and u nacce ptably
low rate of absorpti on c an be f ound bioequi valent using c er
tain truncated e s timates .
Cas e 2 : when the relative bioavailabili ty is within a c
c eptable ranges and the Ka varies from 50 t o 200% of t he
reference product , 74% o f the AUCt rati os ( RAT .XX) s h owed
bioequivalence for only 30% of truly bioequivalent c ase
products. indic ating that truncated areas are more s ens it i ve
to the extent than the rate of absorpti on as shown i n table
v. Nevertheless . the sensitivity o f the AUCt ratios to t he
rate o f abs orption is proportional to the disposit ion
phases. It is known that changes in elimination affect phar
macokinetic parameters of one and two compartment model s
( 31 ) and this study confirmed that as a consequence . suc h
changes also influence bioequivalence determination .
Case 3: at the boundaries , when F=80% . the truncated
AUC20 is only discriminating when absorption rates are low .
When F=l20% and Ka is more than 20% of the acceptable limit.
AUc20 is sensitive to the high rate of absorption. In both
cases , if you increase the disposition rate constants ,
larger portions of the the AUCinf become discriminating and
show inequivalence. The percentage of the AUCinf indicative
of true bioinequivalence due to the absorption rate . varies
with the elimination phases. Figure 5 illustrates two ex
amples of minimum AUC ratios required to demonstrate true
186

bioinequivalence. for formulations exhibiting l ow absorpcion
rate.
Particular cases where the AUC ratios showed bioine -
quivalence for products with extent and rates of absorption
within the acceptable range were critical. For all cases ex-
cept a slow elimination rate constants of 0.01 - 1 hrs . when
F=l20% and the absorption rate constants were high buc
within the acceptable 100 to 120% of the reference values.
the truncated AUC ' s for 20 to 50% of the AUCinf indicated
consistently fal se inequivalence ( Table VII). In our study.
the truncated racio of AUC accounting for 80% of the AUCinf
did indicate bioequivalence consistently throughout these
disposition situations.
Another limitation when relative bioavialability ( F )
ranged from F=lOO to 120% in which AUC and Ka ranged from 67
to 196.4% the truncated area ratios did not indicate bioine-
quivalence at any time (t) or for any proportional section
of the AUCinf. The same limitations apply to the use of
AUCinf in the bioequivalence comparison since AUCinf is in
dependent of the absorption rate. Within this interval , the
truncated AUC was completely dependent on the extent of
bioavailability.
In all cases , when F was 80 to 120% of the reference
value , 98% of the time AUC80
was also within the same range
confirming what had been previously reported (21) on the
similarity of truncated and infinity AUC ratios. Truncated
187

ratios for early p ortions of the AUCin f were smaller than
the relative bioavailabi lity ( fi gure 6 ) when the absorption
rate constant was below the reference value 1 .4 hrs- 1 for
the test products. Conversely. when Ka was greater than the
reference value, early truncated area ratios were larger
than the relative bioavailability ( figure 7 ). The cut-off
point or time where the truncated AUG rati os became equal t o
the relative extent of absorpt i on was related to the absorp
tion rate const ants and exhibited a u-shaped curve in figure
8 , which indicated that these critical times or percentages
of AUCinf were high for low absorpt ion rate products.
decreased as Ka increased and increased again when the rate
of absorption was above 100% of the re f erence value. The
slope of AUG ratio Vs. time, in early porti ons of the plasma
profile . was proportional to rate and extent of absorption.
This parameter could be an additional est imator t o compare
absorption kinetics in bioequivalence study and further in
vestigations are needed on this topic. In our study, the
cut-off point ranged from 35 to 85% for acceptable formula
tions ( table VIII). For perfectly bioequivalent products ,
this point could theoretically be 0. The time corresponding
to these percentages depends on the elimination characteris
tics , (figure 9 ). Furthermore , if the MEG or MIC [Minimum
Efficient Concentration or Minimum Inhibi tory Concentration ]
can be estimated accurately , it has been argued that the
comparison of truncated AUC 's for bioequivalence purposes
188

has also a pharmacodynamic relevance ( 31 ) . s ince the AUCxx
ratios compare portions of the plasma levels signif i cant for
the therapeutic window (figure 10 ) .
CONCLUSIONS
A first criticism of the emphasis given t o AUCinf in
bioequivalence t e st ing was the fact t hat bioequivalence i s
aimed at comparing the absorption characteristics of two
dosage f orms. It is well known that AUCinf is not dependent
on the rate of absorption Ka , thus onl y extent of absorption_
could be c ompared with accuracy .
We feel that extrapolation of the AUCtlast to infinity
could bring unnecessary variations not representative of
realistic differences or equivalences between a reference
and a test produc t. On one hand, if the extrapolated area
is large , the true difference in extent of absorption may
become proportionally insignificant. On the other hand, the
extrapolation is calculated from the last p oints , usually in
the most variable analytical region and this might introduce
differences between truly bieoquivalent products. In most
cases the AUCinf ratios and Auc80 ratios for our simulations
did not vary significantly indicating that 80% of the AUCinf
was a good indicator of the extent of bioavailability .
AUCtmax was not consistently representative of AUCinf or
rate o f absorption . We do not recommend the use of AUCtmax
189

alone to compare bioavalailability because extent and rate
of absorption outside acceptable ranges can in some cases
balance each other.
The proportion of the AUCinf required for sensit i vity in
bioequivalence testing depends on the combination of
e limination rate constants and the absorption rate constant .
In all cases. the AUC ratios at early times overestimated
relative bioavailability for low absorption rates of test
products , and underestimated for high absorption rate s
before reaching the true relative bioavailability val ue.
Important failures of the truncated areas occurred where the.
relative bioavailability was high and the rate o f abs orpti on
was l ower than the reference value as well a s cases where
acceptable l ow F and l ow Ka led t o false inequivalence as a
result of a counterbalancing effect . As or KE increased
-1 over 0 . 0 1 hr. . larger portions of the AUCinf were neces-
sary to assess bioinequivalence . These simulations suggested
that 80% of the AUCinf was substantially reliable in the
range of our study for determining the relative extent of
absorption which had more influence on bioequivalence than
the rate of absorption. Although truncated AUC ratios have
to be further investigated ( as indicators of absorption
rates ), we feel that examining truncated areas provides ad-
ditional and qualitative information that strengthen
bioequivalence testing.
190

APPENDIX 1: Nomenclature
D
v
Ka
hr. - 1
KE
in hr. -1
At
Ct
AT
absorption
CT
AUCi.
AUCref
AUCtest'
Ka%:
cent age
F% :
Area
Area
reference in
RATXX
under
under
responding to XX%
i- inf
Dose
Volume of di stributi on
First order absorption constant in
First order elimination rate constant
Distribution rate constant
Elimination rate constant
Area under the curve at time t
Blood concentration at time t
Area under the curve at the end of the
period
Plasma concentration at
Area Under the Curve
the Curve for the reference product
the curve for the test product
Ratio of Ka test to reference in per -
Ratio of bioavailability test to
percentage
Ratio of truncated AUC ' s at t cor
of AUCinf reference
at time infinity
i - tmax : at time of the peak
191

i - t at time t
APPENDIX 2 : Calculations
For the one compartment model if t ~ T. blood levels are
given by eq.l and the extent of absorption can be integrated
and written as ( 21. 22 ) :
At eq.
where At is the area under the blood level-time curves •
from 0 to time t. The following ratios can be derived (21)
where Ka' and F' indicate the pharmacokinetic parameters for
the reference product:
At F
eq. 2
If t , T the plasma levels can be described (17) by :
Ct CT . e -KE(t-T) eq . 3
where CT is the blood concentration at time T . thus the
AUC at time t can be written (2 1 ) as :
192

At; AT - Ct. ( l - e-KE( t - T )) .l / KE eq . 4
with AT. the area unde r the curve from time O to T. The
rat ios can the r efore be calcul ated ( 2 1 ) :
At
AT ' At " + ( 1- e - KE ( t - T•) ) . Ct / KE
For the two compartment model if t T ,
therefo re . At can be derived
At
F . D. ( K21 - Ka ) -v~r a =Ka)~\~=Ka)-
a
1 - ~ -
eq. 5
+
+
eq .6
The area under the curve at t infinity can be derived
from equation 9 and calculated using the pharmacokineti c
parameters independent of time :
A + a
193

1 -~ - +
eq .7
The ratio At / At * can also be estimated easily . On the
other hand. if t >T , the blood levels can be expressed as:
Ct ~ CT eq.8
therefore , At the area under t he curve at time t can be in -
tegrated and written as:
At AT + (1-e - a ( t - T) ].CT/ a + (1 -e-~(t -T ) ].CT / ~ eq.9
The area at t - infinity is derived in equation 10
A AT + [ CT / a + CT I ~ ] eq. 10
and the ratios can be calculated from At / At • :
At AT+ (1-e-a (t - T)].CT / a + (1-e - ~(t-T)) .CT I ~
eq . 11
At0
AT "+ (1-e-a(t - T) ) . CT0
1a + (1-e-~(t-T)) .CT · / ~
194

with T 4.606 Ka and T 4 .606 Ka. In this parcicular
case. AT and AT· are calculated from equacion 9 and CT. CT·
from
equati on 2 for c~T.
REFERENCES
l. Generic Drug Scandal Pharm . Tech . (12). 10. 23-27. 1988
2. Peter P. Lamy J . Clin . Pharmmacol ( 26 ) . 309- 316. 1986
3. "New Prescription Drugs-Proposed Bi oavailability
Requirements " FDA Washingt on, CFR Part 130. 1973
4 . Carl M. Metzler J.Clin.Pharmaco ( 29 ) . 289-292. 1989
5 . Robert w. Mackuch. Mary F. Johnson Arch.Intern . Med
( 146 ), 986 - 989 , 1986
6 . Di vision of Bioequivalence . "Guidance for In Vivo
Bioequivalence and In Vitro Dissolution Studies f or
Indomethacin " FDA 21 CFR 10.90 ( 1988 )
7. Stephen Levine Hippocrates March . April 1989
8. Elaine Wyllie , C. E. Pippenger , A. David Rother
s!AHA ( 258 ) , 9 , 1216-1217 , 1987
9 . Rudl Ansbacher slll.H.fl. ( 259 ), 2, 220. 1988
10. Robert Schulma n ..rAM1I (261 ) , 17. 2499 , 1989
11 . Sheldon S . Stoffer. Walter E. Szpuner <LAMA ( 244) , 15 .
1704- 1705 , 1980
12 . Stuart L . Nightingale. James C. Morrison .rAMA (258). 9.
1200-1204 , 1987
195

13 . John D. Haynes J . Phar m.Sci ( 70 ) . 6. 673 - 675. 1981
14 . Stephen C. Ol son. Michael A. Eldon . Roge r D. Toothaker .
J ames J. Ferry a nd Wayne A. Co l burn J . Clin . Pharmacol .
( 27 ) . 342 - 345. 1987
15. David J . Greenblatt . Ri chard I. Shader J .Clin . Pharmacol.
( 27 ) , 85-86. 1987
16. S.E. Rosenbaum. C. Bon. C.T. Rh odes Drug Dev . Ind . Pharm
( 16 ) . 1. 157- 163 . 1990
17. H.P. Ringhand , W.A. Ritschel , M. C. Meyer. A. B. Straughn
and B.E. Cabana J.Pharm.Sci. (72 ). 12. 1983
18. W. A. Mahon. J . S . Leeder, M.M. Bril l-Edwards . J . Correia
and S.M . MacLeod Clin . Pharmacokinetics ( 13 ) . 118 - 124.
1987
19. Mark L. Powell, Miryam Weisberger , Richard Gural. Menger
Chung , James A. Patrick . Elaine Radwanski and Samson S.
Symchowicz J.Pharm.Sci . ( 74 ) . 2 . 217 - 219, 1985
20. E.G. Lovering. I.J. McGilveray. I.McMillan ,
W. Tostowaryk. T. Matula and G. Marier Can . J.Pharm . Sci.
( 10 ). 2 . 36- 39 , 1975
21. E.G. Lovering, I.J. McGilveray , I.McMillan and w.
Tostowaryk J.Pharm . Sci. ( 64 ) . 9. 1521-1524. 1975
22. K.K . Midha. B.S. Chakraborty , R . Schewde , E.M . Hawes. G.
McKay, J. W. Hubbard and M. Moore
J . Pharm . Sci . ( 79 ) . 1, 3-8 , 1990
196

23. Nahoko Kaniwa. Hiroyasu Ogata. Nobuo Aoyagi. Yasushi
Takeda and Mitsuru Uchimaya J.Pharm.Sci. (78). 12. 1020-
1024 . 1989
24. John G. Wagner J.Pharm . Sci . ( 72 ) . 7. 838-884. 1983
25. John G. Wagner and Eino Nelson
J.Pharm.Sci. (52), 6. 610-611. 1963
26. John G. Wagner "Pharmacokinetics: Notes· pp 132- 138.
161-166 Published by J.M. Richards Laboratory 1969
27. Donald Perrier and Milo Gibaldi
J.Pharm.Sci. ( 62 ) . 2. 225-228. 1973
28. Peter R. Byron and Robert E. Notari J.Pharm. Sci. (65l.
8, 1140-1144. 1976
29 . Lilian E. Riad. Keith K.Chan. William E. Wagner and
Ronald J. Sawshuk J .Pharm.Sci. ( 75 ). 9. 897-900. 1986
30. William J. Jusko and Milo Gibaldi J.Pharm.Sci. ( 61). 8.
1270-1273. 1972
31. Jack N. Moss and C.T. Rhodes Can.J.Pharm . Sci. (9). 1.
30-32. 1974
197

,_, tO ():>
Table I : One compartment model simula tions Parameters
Variable Parameters
Elimination rate constant KE l/hr 0.04, 0.08, 0.12, 0. 1 6 , 0.2
0. 8' o. 9 ' 1. 0' 1.1, 1. 2' 1.)' Absorption rate constant Ka l/hr 1. 4' 1. 5 , 1. 6 ' 1. 7 ' 1. 8' 1. 9
Absorption Period T hrs. 5 . 7 4' 5.12 , 4.60, 4' 18' ) . 84' ) . 4 J. JO' ). 06, 2.88, 2.70, 2.56, 2. 4
Relative bioavailability 0. 7' 0.8, 0.9, 1. 0, 1.1, 1. 2' 1.)
Constant Parameters
Volume of distribution Vd 1 10
Dose D mg 1000
Sampling Regimen in hours: 0. )) ' 0.67, 1. 0' 1. 5' 2.0, 2 . 5 ' ) . 0' 4 . 0 5. o, 6.0, 8. 6' 10, 12, 16, 48, 72, 96 , 1 20

>-' <D <D
Table II : Two Compartment Model Simulations Parameters
Variable Parameters
Disposition Rate Constants QI l/hr 0. 17, 0.32, .0.4 7, 0.63, 0.79 p l/hr 0 .01, 0.09, 0. 17
Absorption Rate Constant Ka l/hr 0.65, 0 . 95, 1. 4. 2. 0. 2.7 5
Absorption Period T hrs 7.08, 4.84, 2 . 30, 2.30, 1. 68
Relative Bioavailability F 0.6, 0. 8. 1. o, 1. 2. 1. 4
Constant Parameters
Volume distribution V 1 10
Dose D mg 1000
Sampling Regimen: 1. 0, 1. 5, 2. 0. 2 . 5. 3. 0. 4. o, 5.0, 6. 0, 7.0, 8.0 10, 12, 15, 24, 48, 72, 96, 120, 144, 168, 192, 216 (hours)

ti)
0 0
Table III : Pharmacok inetic Parameters of the Refere nce Produc ts
One compartment model
First Order Absorpt i on Rate Ka : 1. 4 l / hr. Bioavailability, F : 1. 0
Two compartment model
First Order Absorption Rate Ka : 1. 4 l/hr. Disposition K21: 0. 2 l/hr . Bioava ilabi 1 i ty F : 1. 0
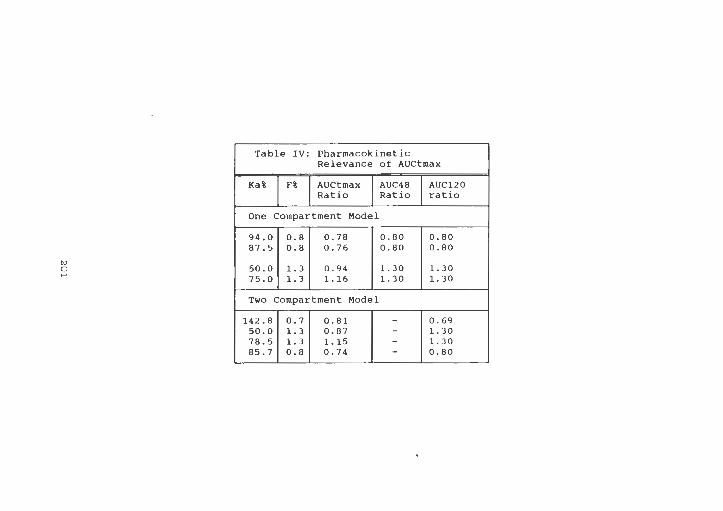
ti) 0
~
Table IV: Pharmacokinetic Relevance of AUCtmax
Ka% F% AUCtmax AUC48 AUC120 Ratio Ratio ratio
One Compartment Model
94.0 0 . 8 0.78 0.80 0.80 87.5 0.8 0.76 0.80 0.80
50.0 1. 3 0.94 1. 30 1. 30 75.0 1. 3 1.16 1. 30 1. 30
Two Compartment Model
142.8 0.7 0.81 - 0.69 50.0 1. 3 0.87 - 1. 30 78.5 1. 3 1. 15 - 1. 30 85.7 0.8 0.74 - 0.80

ro 0 ro
KE
0.04
0.20
Table V : One Compartment model, AUC ratios for bioinequivalence
F% KA% RAT.20 RAT.30 RAT.40 RAT . 50 RAT. 60 RAT. 80
70 57 0.63 0.66 0.67 0.68 0.68 0.68 70 143 0.73 0. 71 0. 71 0.71 0.70 0.70
130 57 1.17 1. 23 1. 25 1. 29 1. 39 1. 30 130 143 1. 35 1. 32 1. 32 1. 31 1. 31 1. 30
70 57 0.50 0.56 0.58 0.61 0.63 0.68 70 143 0.81 0. 77 0.75 0.74 0.72 0.71
130 57 0.94 1. 03 1. 07 1.13 1.17 1. 27 130 143 1. 51 1. 43 1. 40 1. 37 1. 34 1. 31
RAT.XX AUC ratios (test to reference) at XX% of the AUC infinity

ti)
0 VJ
F%
KA%
RAT20
RAT30
RAT40
RAT50
RAT60
RAT70
RAT80
Table VI :
60
46
0.585
0.590
0.593
0.596
0.597
0.598
0.599
Bioinequivalent Rroducts-AUC Ratios Twocompartment Model
140
196 46 196
0.600 1. 35 1. 40
0.600 1. 37 1. 40
0.600 1. 38 1. 40
0.600 1. 39 1. 40
0.598 1. 39 1. 40
0. 599 1. 40 1. 40
0 . 600 1. 40 1. 40

"' 0
"'
Table VII :
Ke 0 . 04 0.12 0. 20
'0.01 0 . 03 0.09 0.17
False Inequivalence (for F = 120% and Ka = 114%)
RAT20 RAT40 RAT60 RA TSO MODEL
1. 22 1. 22 1. 2 1 1. 20 0 1. 24 1. 24 1. 22 1. 20 N 1. 27 1. 25 1. 2 4 1. 21 E
1. 20 1. 20 1. 19 1. 19 T 1. 27 -- -- 1.19 w 1. 28 1. 21 1. 19 1. 19 0 1. 30 1. 27 1. 2 2 1.19

ti)
0 (Jl
Table VIII: Truncated AUC Ratios equating Relative Bioavailability Time and Corresponding \ of AUCinf
One Compartment KE (l/hr) 0.04 0. 12 0.20
Ka (l/hr) 1. 2 1. 7 1. 2 1. 7 1. 2 1. 7
F=0.7 Time (hr.) 16 12 24 24 24 24 \ AUCinf 46 36 61 61 61 61
F=l.O Time (hr.) 14 14 15 15 15 15 \ AUCinf 74 74 84 84 84 84
F=l. 3 Time (hr.) 13 13 14 13 14 14 \ AUCinf 84 84 89 84 89 89
Two Compartment
' (l/hr) 0.01 0.09 0.17
Ka (l/hr) 0.95 2.00 0. 95 2.00 0.95 2. 00
F=0.6 Time (hr.) 24 10 12 7 7 6 \ AUCi nf 32 13 70 49 82 75
F=l.O Time (hr.) 36 12 15 8 15 9 \ AUCinf 39 16 78 5 4 87 65
F=l. 4 Time (hr.) 48 24 15 9 9 5 \ AUCinf 52 32 78 59 90 65

206

l\)
0 -'I
Ka• ..
Figwe 2 : Two Compartment Model
K12
Centra l Peripherical Compartment ..._ Compartment ...-
K21
KE
~ ~

• I .. I
. .... 1. )( I
' I • () I .. E I .. .. ' I
() ; I ·• .... . .. .. .. .. .. .... . .• ..
::::> I ' A. I ' c • I ., -ch 0 I
I
• 0 ~ ()
., • c ::::> ., • • 0 > e • • ' .. J, .. ; .. ... a: A. w
' :II
.2 .ci • i= .. ' • ' c :;: .. 0 ()
• E <lj .. • • • .I: II: A.
f 0 0 0 0 0 0 0 0 • • .. ...
111111•-1 NOl.L Yll.LNJONOO
208

(\J
' ' ' ' u / '
* ' 0 'i5 ' 0.. ' ' Ji I qi
~ ' ' I
I <D I I I
.II ··········· !fl <I ! .. aJ I I 0
• * (j) = l 'i5 I i I I 0.. I ii:: di .!J e ' .... I-<i
I I I : I~
<t
• ; . IC
<l: (\J Qi a:
T 8 0 0 0 0
<D (j) <t (\J
(1111/l:IUI) NOIJ. YIU.NJONOO
209

"i ,, 0 ~
• .. :I a iL
! ~ I
0 (\J
t 0 '<I:
' . ' ' . ' ' ' . ,
' . ' . J . , 'ii ,
I I i , i : i : ii rf i , i : i . i ' I ' I • i :: : ,'
1 + ~~ i / , ,' I f : ,' !' : I : ,, ~'
0 "!
0 q
101i•Y onv
210
0 (\J
0
(\J
0
<ll 0 0
<t 0 0
8 oo <ll 0

"i ,, 0 :I
0
"' ! ~ I
'Cl 0 - <I> • CJ : I- ~
0 (')
.Ci ~ . ' <i
• .. =i a ii:
'
0 N
t
i i i i
Q 'tl I ' I
I I I I I I I I
i i
I ' : . i i i i 1 .. ; I ; ; i I I : I'
(// ///,' //,:· "h
I I I I I I I I
"' I
0 C'!
•on•Y :>nv
211
0 N 0
"' 0
<t 0 0
8 oo a:i 0

~ ~ <O
0 II
- - <{ '#. :,( lol .t:: Cot :J -er I • II. .. _
• ... :J 0 ~I:. II. •
0 0
N ci
<O
ci • c ~ • c 0
N u
ci J ~
Cl) I q Ill
0
<t 0 ci
0 0 If)
1uionv 10 •1181u•~ac1
212

c ,g -D. .. 0 • .tea c
• 0
co ~ • • ~ E Cl·- .... II. • >
• 0 :;::: • a: <> :) c
0 <t:
"! ... I ...
": ... I ...
213
... 0 I ...
'
. '• ¥ J! ! .. . . ...... e I a:: •
lili:
0 l{)
0 <t
0 (")
0 N
0
0 0 <t 0
.. j • !

<t N
~ • ... c ... ... c:i c:i
I I I I 0 ... ... ... ... :; a. ... 0 '• <Xl • ~·· .c:a <( :i .i .. -• c: ... .... .., • I""• • • 0 0
..... ~ Ill:~ co .. ,. •• C! 0 • • c.> ·C'4 N = '"E C: .,. I
:II·- ~ I • • .~ ... ••111: I I&. 9111: I-• a:
> • 0 :; <O • a: (J ::::> <(
0 0 0 "': <q
0
IOllU :>nv
214

-c: .. () .!. ~ ...... i
!!: 0
O I
&.!! ~ii o. c: ... ~ (,) I ... ;::::) ... :. ~ <J
c: CIO e .c: • • ... :I a ii:
... 0 I ... I .. I
0 ..
i I 0 ..
\ '\ ,, CJ .... ! l
Cl
' ' .. !/ • /I
o .. !J • 8 0
l()
215
0 l()
0 "1
0 I'-
0 o'°

0 (J\
>-c: • 'i _ w ,, . :..:: 0 0 N :I ,, -ci • 0
t -.. - c: .. u • • • E 0 ·- '° .Q - -0 II.I .. • - Q. i c: E u Cl N 0 e :::> c: '"-: () • • ·; 0 .I
0
T • I-
0 ,, c: 0 .. 0
~ • (') .. -• • • • • .§ <t
0 .. -ci :I Cl
1 ii:
8 0 I[)
(~) IUIOflV •Ill JO IUOAJOcl
216
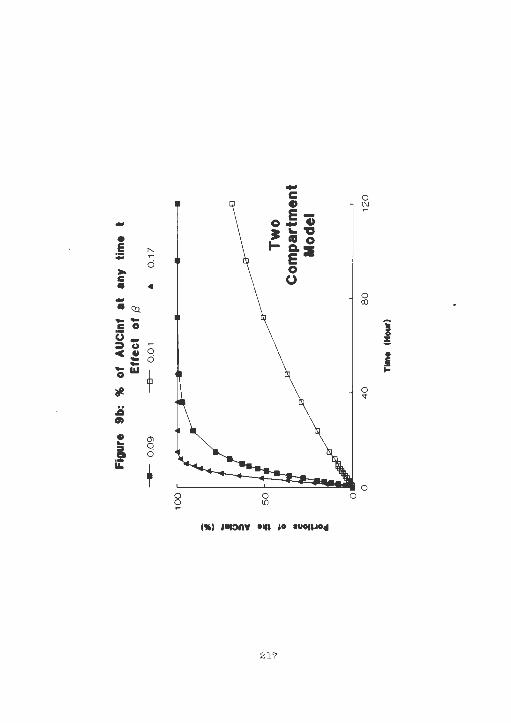
-c 0 C> ~ .. 0 .! 'ii
• . .. ,, t- al 0 E ~ a. :I :; E ci
""' 0 c:
r 0 • .. 0
• <n ClJ
-- i c: 0 () .. = u : c. 0 • -ci i -0 Ill
~ ~
~ 0 'I"
.Q O>
• °' ~ 0 :I a ci ii:
T 8 0
I[)
<~> 1111onv •111 10 lllOflJOcl
217

•
. .. 1 . ..
''"' ""''' "'" "'"''''"'"""""''""""'•• . . . . . . . . .
,,,,, ,,,,,,: ... ....... ,,,,,,,,,,,,,, , ,,,,,,/~ ·· • f' .
. • ' ' '
0 <t
0 C'J
0 N
····· ······:· .. · ······ · ····· ~ ... ~ .. . ~ .
··· ~: ······· w ······ "''"''""
0 N
.:"·
0 <O
~· .
(IW/15n) .:JN<)'.)
218
0
0 0
I !

SECTION IV
219

APPENDIX A
In early stages of the wet granulation experiment. a
power meter or wattmeter , was connected between the power
and our planetary mixer in order to validate the end - point
determination. A plotter was wired to the meter to record
the variation in the power needed to rotate the paddle
within the granulation. Thus if the courant can be assumed
to be constant. one has a fair approximation of the torque
or resistance to movement of the mass being granulated.
The apparatus was improved and the wattmeter was
connected with a interface and an IBM PC. A data acquisition
software averaged and reduced the noise thus allowing the
recording of clear variation wattage. Figure 1 is a typical
power consumption t race for ibuprofen formulations without
the computerized interface.
Figure 2 is a calibration curve used in the dissolu
tion experiment. Ibuprofen concentration were measured by
ultra violet spectrophotometry at 264 nm.
220

== .. 0 .... ct .., .... ~u
~= e:: :I • . -g ~ u ;s .. II. • c 1~
ii A ,.. .. .... 0
.... • t
221

0 0 •
I • • ... -· ... c Ill :i > ...
.. ! -- a
... (J .!
·1 0 g 0 :::
I~ ... •
~ • ... c
g (J
(J
I -I
0 0 0 0
~ • 0 ... 0 0
•H9Cl'O•CIY
222

APPENDIX B
X- RAY CRYSTALLOGRAPHY AND MOLECULAR MODELING
223

Single X- ray diffraction data o f rac - ibuprofen and
(-)- S- ibuprofen were used with the "macromodel " software t o
examine the 3D molecular packing in the crystal lattice
( figures 1 to 5 ) .
From single crystal coordinates it was a simple mat
ter to generate powder X- ray diffractograms. Thus it was
possible to predict and validate the single powder X-ray
crystallography (figure 6 ) . however. the intensities were
dependant on how randomly the crystal is oriented in the
x-ray beam. Therefore. only the position of the peaks could
be predicted not the optical purity.
224

l'lour• 1: llolecul•r P•cklno in th• cryat•I l.8ttlc• of Ru-ibuprofen
225

,...,. 2: llepr•-t•tloll et tH l+l-1M1prefe11 orretal lattioe ,,_ • 41fferut .....
226

l'lfUt• S: Arroyo of <•l-1 - <-1-11 11...,010• llolecllloo Ill Ill• oryotal of rac-lt...,ofoa
(Doo• -· oro hydr- bolMlol
227

l'igur• '' Detella of Ille ~--• h1•01.., l>oi. llMI <-1-1-... 01.. ..,.... l•ttlo•
228

...... I: kle•t"IO•tlo• of tll• lllOloCuelr tor•lo• l11porpHHIOft of • molectllH A 811411 I IHOIH411 In tlle HIM hJdrogen bolHI
229

l\)
VJ 0
10
........ I: TheoreUc81 X-rey Dilfrectogre,.e
20
X-RAY POIJOER DIAGRAMS
Ibuprofen !optically active)
Ibuprofen (racernicl
30 40 so

APPENDI X C
THERMAL ANALYSIS : VALIDATION OF THE EXPERIMENTAL DESIGN
231

( Differ e ntia l Scanni n g Calorimetry Procedures
DSC scans of all ingredients of the formulations in -
eluding ibuprofen. were performed ( Figures to ) .
Qualitative assessment of all melting characteristics were
evaluated to check if the thermal behavior of excipient s
will affect the fusion of the pure active drug in the range
of 70 to 79 °c and 45 to 60 °c. Physical mixtures were also
tested for endotherms and compared to pure ibuprofen. From
all the thermograms analyzed. there was no evidence of ad-
verse interference in the range of our study.
When necessary. the fusion parameters ( Tm and~ H )
were recalculated from the indium standard using the foll ow-
ing equations:
K ~Hf Mc ----------Ac equation 1
K . M As -----Ms _____ _ equation 2
with K: the calibration constant; Mc: the mass of
I ndium; Ac: the area under the thermogram for the calibrant;
As : the peak area of the sample: M: the MW of the sample
232

Purity Determination:
Using a differential scanning calorimetry method. it
was p ossible to validate the enantiomeric purity of the (+)-
S-ibuprofen. This thermal approach has been described in the
Thermal Analysis Newsletter #3. and ¥5 by A.P Gray and
edited by Perkin-Elmer . Norwalk Conn. The method consisted
of calculating the amount of impurities from the melting
point depression
6T To - Tm equation 3
and using the Van ' t Hoff equation:
To-Tm
with To
Tm
R
X2
RTo2 equation 4
Absolute melting temperature of the sample
the experimental fusion temperature
the enthalpy of fusion in cal / mole
- 1 0 - 1 the molar gas constant:l.987cal.mole . K
the mole frcation of impurity
The fraction melted can be calcuated from
F ( To - Tm) / (To-Ts) equation 5
233

and Ts ~ To - ( To -Tm). l F equation 6
with Ts: the melting point of the sample for a given
fracti on melted.
F Fraction melted
Fr om a DSC scan of the pure indium, the angle a was
determined ( figure 16 ) and used in figure 17 t o obtain true
values of melting. The cor responding fracti on mel ted were
calculated.
Ts was plotted against l / F in figure 18 . The inter
cept To and the slope were derived from the straight line
and used in equation 4 to produce the amount of impurities .
In (+)-8-ibuprofen , X2 the mole fraction of impurit ies
ranged from 0.0081 to 0.0115. Thus the purity of this com
pound ranged from 98.85 to 99.18 %. It is not known if the
impurities responsible for Lattice deffects might be in part
( - )-R- ibuprofen molecules. Enanti omeric purity was also in
vestigated with phase diagrams in manuscript V.
234

ti)
VJ (J1
Piqure 1: Typical DSC thermogram of Ethyl ibuprofen
DSC Data F t la. t.oot
Sa.ple Wai ght• 13. 300 .g Sun Hor 11141501061990
ETHVL !BU
,--- - - - --·-- -
~ ~ . ~ ll l
70.0 i
···1 so. 0 i •~o i 30.0 i
I 20. 0
10. 0 jt
0.0
25. u
Tl
T2
Poak
llrno
Daito II
llutqht
nn~:mt
73. 40o · c
ao. '.i66 ·c ·1e. ·110 · c
159.(1. "/34 rnJ
119. 1S3 Ji g
~iS . 17fi ,..w .'Ii. "l l 7 "C
...v
I - - - --- T - -- -- - ··- ,--- --- --- - -, -·-~o. o '/'J. o 100. 0 12s.n
2et S0111f>h Tc111po1 ·ature c•c) ALAlN f~ l: ,~:8 ~ u..; ,. 0.0 •In ftJllTl!: 1. S .D C/•I "'
--··--

ti) u CJ)
Figure 2: DSC scan of Polyvinyl Pirrolidone (Povidone) in
DSC Doto Ft I• pov2
So.pl• Wal!flt.. U. 400 "9 Tue 1Lr1 20 12' 241 30 :999
POV I DONE <2nd Rt.ti>
3. s
3.0
.. 2. s
.!I . 0 ;;: 2. 0
j 1.5
I. 0
0. s
the temperature range of interest
PERKIN-ELIER
7 Series Ther110l Analysis Syste111
o.o ~-- 1 ··-- 1 -· . I -!50.0
I llO.O 30.0 "1.0
- -i -70.0
T..,_.-otlM"'• c•o AA. J. Ro.aro
JIS 1: g:n H:I ~: O. O •I" RATf: t. 0.0 •In
111.0

[\) V> -J
Figure 3: DSC ~=an of Na Starch Glycolate (Explotab) in the
temperature range of interest
DSC Data Ft 1 .. e.cp12 PERI< IN-ELMER S011f>le Weig-.t1 27. 700 1t9 Tue Jun 20 13. 31.00 1989
EXPLOTAB Uat Rt.ti) 7 Serles Thermal Analysis System
---------··------------
• !
~ u: " D
:!
3. 0
2. s ~II
Tl
T2 --Delta H
11.10 •c S7.en •c 111.•11 •c
2.0il \ .......
1.maJ
O.O!IO J/9
O.D!!ll •
1. 5
1.0
0. 5
0.0 - ,-·- --- 1--· 30. 0 4D. 0
ms: t ii:&~ ;u: 1: 8: ~ ::~ ltA ll! I+
.. ,!iO.O
1· - - -·- ,---· ea. o 7D. o
r...,,.,.ot ...... c•o AA . J. RolftQro
811.0

t\) Vl Ol
Figure 4: DSC Scan of Lactose (Fast Flow Lactose) in the
nsc Doto Fl 1111 l oct~
So..,.p:o Wc lght1 21. If.it) 119 Tue ; , n-. 20 13157111 l999
:... ALTOSE {!st RUIH
2. 6 Tl
T2
2. 2 -i -Ar ...
2. 0 I O.lto H
temperature range of interest
7 Series Thermal Analysis System
IM. 183 •c 118. ll50 •c 1111.415 ·c
~
~ . 0
"-
~
, ' \ . . 8 : Hol!l>t
1.6 . I
\ l. <
:. 2 .
0
1. 1 .. 11 •J
0. 054 Jig
0. 054 ...
r-----~J\J I u. 8
o. 6
tl. 4
o. 2
0. 0 ao I so. 0
11: ~~ l o .l~·'' L tl-. lo hi! "'' ' ' " ' ! ~ : , 0,, 1 '·' '" ' '' f£- ~ o • 5 . 0 I.. f/- .lo 1 . 1 • I•• •<'\ 1 1. ..! o 11. , lJ 1;·..,, ., 1E- 'loo 15U.U C.
I 75. 0
I I
I 100. 0
T mwperature < • C>
I 12'5. 0
A. A. J. fi o • "l~rt •
I I

riqur• 5: Example of a typical endotherm of Ethyl ElJl;
An 77\ ibuprofen formulation with l\ of
disintegrant 1/3 intrgranular
JS\.. ilat.o Fl } Q1 00130
<:i •• unplo 'io!qht1 !.~. 5:rr. "'9 Sc:.. ;..;; 29 ::. : ~ . 16 1999
:· - 11i. :... : Ji
40. c I Tl e5.1183 ·c
T2 78.1183 •c
35. c . Peak 11. 518 ·c Ar-eo 933. 91 2 .1
[') Datte H 7• .Zll7 J ·9 C>I 30. G
'° ; Hotght 32. l :'I .. ~
25. 0 - Oneel 75. 3Je •c .~ "· .. ~ 2G. 0
15. 0 .
IO. n
5. 0
0. u 1 I I I I I I I I I I 30.0 .a.a 50. 0 80. 0 70. 0 80.0 !ID. 0 100. 0 110. 0 120. 0 130. 0
nu• co: l !Jrllth .. 1 T•mparoture c•c> A. J . ROMl::'.RC Tk.loOI' lo al. D c JI-. l o 1-D • I" "IA"tc. lo lt!MI" z. 1.in.o 1:

"" "' 0
Figure 6: Example o f a typ i cal endotherm of a ground
ibuprofen tablet obtained at regular compaction
DSC Oato I· i l 01 c.ht;i111
S0111plo rlo1 g~t1 13. 550 ing VGd ~r l .4 151'j'3107 ) gqo
§ . ~ " l
Cl I TRi o\L I I
1 ·
35. o I 30. 0 j
-, : .•
.. ,, ..... '· .. , ~,.
I • 11. j ~ .• 1 1 1
~5. 01 20. 0
l l1dq'1';
: ·n .,1 •~ .
I 15. 0 J
l:::Jr-0.J .
.:u.i: ·~ 1 ; . u
f3 ·l. 916 •r.
: :· . ' ~· :11 • l.
: •; . ')~ifl • 1 •
c;•· f.l. n:·11 ·11;
: 1:. >:1; f,'l j
.:r: . .'~1 .. ,·,;
."3.fl '.H •r:
t; t:. G
ThQ For111u l o tton we ight 1• llilll.•·• ;:::; l: 1~g ~ n.a lo o. o •I n •4TW 1•
.!.! : 1•1.l '. 11 1.l J
T uw1p,wt..:t~11·,! l "t.> ALAIN
~ I ;n. ~ : :i:. r

!\)
>I>
Fiqure 7: Example of a typical endotherm of a ground
physical mixture (before wet granulation)
DSC Doto F 11 "' grr So.pl" 'lig19ht1 ? . 169 •g 'liq\.! Mor 14 12153130 \990
GROUND PHYSIC'L MIXT:JR£
.. ~ . ~ ..
r- --~- -
::J ' ~.c j
P1.:°"
.'\nlu
l '.,l :.• J II
t!1.Jl •Jl 1 ...
;.·1::1.J T •
;·u. ·: &J ' ·
°.'9.'.iiH "l.
/ 6 . ".'611 • ·.
6JO. •1''11 111 1
Hfi. l.J .; I ' -;
.!H. 'i~h 1t1 4
·. · ; . ~ .u · 1.
l I
I 20. 0 j 15.0 I l ! I
10. a ·
I 5. 0
o. 0 l i ! •. I , 'tr. II
I
' ' ' h ll . • I '.,, :1 tl ll.11 •1:J. !I \l lU.11 ; II• .• 1 II. ,, I lt•. LI
Th1m w'°'l9ht. of tl'\GI phys.11i x l o '10.7 mg ~'" · l ' ' ' "t l h t' l ' l.i ALAIN l~: ~: ,sg: ~ ~ fJ14:. l, 0 . 0 •l t1 MArli I• S . O C · , , ,..
I _J

Figure 81 Typical Endotherm of (+)-S-ibuprofen
JS: Jc :.:o t= t l a. • PERK I N- ELM<'.R Smpla 1auj"l':.1 14.CCC "9
- SC!riC?s -;-hC?rmcl .1~C~f'3is SyGtC!m ~bl ;u: C2 GS. .:.e. 23 lG'ie S<+> :aJ P' ... 'RE
7C..G ~ · - - 1
Ro~u~ :.1 ?oc:k '.'/ 2 ' 90 g, 53 ·~ I !s(•> :o:; P:;a..: I 85. 0 "1
~ I
80. 0 - r: 49. 1sc: •c ! 55. 0 i ' TZ 57. 233 °L i p~ s-t. 6G8 •c
50.0 i ~
"' Arc:!o i~25. 670 .; ii>
! : l)glt.c;; H e:·. ~'8 ; :g
"' 45.0 ~ Uo:c;h t .&6. 987 •i . 40.0 ·' Cnect 52. 474 .,. .
"-I
u 35. c ~ " o!' 30. c
25.0
20.0 -.
15. 0
:a. 0 "
5. 0 -:
0. 0 ·i I I I ' I 25. 0 50.0 75. 0 100. u ~25. 0 150. ~
Tc111parotura c•C>
lll:t:i: ,itg ~ fllllllrO lo c. 0 ., ... "" ~"' 1.

ro
"' (,)
Figure 9: Endotherms of (+)-S-ibuprofen and rac-ibuprofen
recrystallized at 4°c from methanol liquors.
osc o. ... r n ... 111r PERKIN··i:l.M'..'.R 'laopl• •·1~.. 1a. 000 ., Thu Jul 05 1a.21o'8 lllQll 7 Series Thermal Analysis System
IETH I · II RIDl19T <....- ! ocol
~ g ;;:
j
2•. o
Z2.0
20.0 .
1a.o
1a.o
1'. 0
12. D
10. 0
2.0 I
o.o-l ... - 1 30.D
ll:U: ,11:8£ Tl• h
I 40. D
0.0 •1" llA1• I t
I 50. 0
L 0 C/•I"
I
60. 0 I
.. ll. O
lOlllj)Qroturo c• C)
A~. 0 I
90.0 I
100. 0
·1
I I I
- ! 110. D

"' "" ~ "" . " .. ~
:::;:; ~:
. '6. r.
..?~.LI
~.!. r,
.""r. . c
:a. G
:o. r.
;t,r.
::~. c
:; . .r
u.r.
J. : .
.....
... u
l:. n
~iqure 10: Thermogram of a Sand racemate mixture (25- 75)
melted and recrystallized at 4 °c
:!S. 0 5ll. Q "".i.CJ ~ t.~~ - :. : . ~J . e ~ ..:1rp 1 :r ~ .'.. :1• , 1 \ • L )
.:· .. : . . tlil. .•
ISO. u

l\)
"' (]J .
¥
~~~:: ~
Fiqure 111 Example of s and racemate physical mixtures
[(75-25\)-24 hours-Labshaker-Room Temperature]
.!';. I : ,,
.oC. :J
11 'i'::. c .
1r:. :.;
I: .'."~ . c
I,
.~c " I \ l 'i.G~ . r ' ' " · '· 5. G
c. 0 ~ 25, 0 '..i0. 1,; ·: :i.:1 :r.t:. u ::!:.i. 0 150.0
';'" l!ir.1 u.:irut J:~u ~ • L )
:~:t t

!\)
"' (l)
riqure 12: Thermogram of a directly compressible (+)-S-
ibuprofen formulation [24 hours of mixing]
DSC Data Ft l• eMKI~
Saooplo Wotghto 9. !lOO '"9 Mon jut C2 10. 2t1 52 1990
SC .. > lBU
45. 0 .
40. 0
35.0 -.
" 30. 0 . . ~ 25. 0 -... j
20. 0
15. 0
10. 0 -
5. 0 -
o. 0 -i 25.o
n: ~: ,118 ~ •ow 1o
I ~::l. 0
PLRK IN· ·E'. .Ml"R
7 s~rieG Therma l Ana:/G!G System
'.'5. c
r ·R~su : t • Puck 11 2/ 90 101 30 AM
! SC+) IBU RECRYST METHANOL 0 C
Tl
I T2 ; Pook i Aruo
j0a1to H
Hotght
I Gnsot
:r.c.o :"umpnro tur c <"C>
•1. 2:n ·c 55 . "93 •c 53. BU •t
8 48. 381 .1
65. 493 Jig 29. 538 • ..,
si. 2e2 ·c
I 1 ~5. G
I 150. 0

N
"' -.;z
riqure 13: Thermogram of a directly compressible
(+)-S- ibuprofen formulation [72 hours of mixing]
i)SC Dato i: 11 .. c30kn
So.pl• Wotqhto 10. 4QQ "S T ..... Jul 12 IS. 5S. 14 1990
FOR>!. C- 3 ro ~N J days
s: !J
! ... J
30. a~ I
25. a i I
20. a~
I I
1s. a j ; i I
10. a " I !
i a.al I
30.0 JO. O '.JC. ::
¥A: ,11:8 E Tl•h a..o •t" IVIT• h
6~.r.
RMult.1 Peok 7/ 12/ QO 31 5Q PM
FORM. C··3 rm KN 3 doy• PEAK l
: Tl 37. 583 •c · T2 Jl. ns •c iPoak •t. 3511 ·c · Ar.a 311. 250 •J
Dolt.a H 3. 742 J i g
H.l!#'t 1. 171 .w 0.-t 311.200 •c
I 8! .. :i 110. 0 uci. a lOC. 0 :·n. o
T{',,1 1~~rat:.Jrn ( • !:>
' ·1
I 11
J

--·--,
., Q)
"" .c .. ., c Q) .... 0 ... c. ::l .c ..... I
"' I
+ 'O c ...: ::l 0 Ill
.. ~= ... .c
"' "" .. 0 0 .... "' 0 .,
a .. .. ... 'O g Q)
c a ..... ... .. Q) ., .c .c E-< 0
... ... • k
& " -g ... "" -, - '
., - , •• · - t - - "'T ·- l·· · - ··r- · : · ' .. ~ 0 0 0 0 0 0 0 0 0 0 0 0 0
,;! ~ ~ N 1'1 !! !! .. !::! ~ al ol ... <\! d
248

l\) II> <O
Piqure 15: Thermogram of a ground (+)-S-ibuprofen tablet
obtained at 1200 lbs
DSC Dato F' 1• c3k2.4
!looplo Welcf>to ID. 150 "'l Thu Jul 12 lllo 52. 211 1111111
FIJl!N C- 3 IZIJO Lbe CllNPAtTI~
~ ! ... j
i 25.01
i 20.0 1
!
15. 0 -
10. 0 ~
o.o ... 30. 0
,-40.G
I 30.G
lllS 1: .11: 8 ~ " .. h D.O •l" ""Tl: lo
eu. e !
70. [J
7oinpQroturo c•o
R: :. D 9G.G I
100. 0 i
: 10.0

ro "' 0
Fiqure 16: High Purity I ndium Melt
DSC Data F I }Q1 t a9 t
Sor.pl a 'ial 9ht1 9. 390 ing
Tua Fab OS 17104138 1991 Indium
50.0 { Tl
45. 0 i T2
Pooh
WO 1 Ar oo
[)QJto H .. 35. 0 Holght
.!> . 30. 0 Oneot 0
'L " 25. 0 l u !/
I 20. 11 } - ••
15. o I I
10. 01 5. 0 .
0. 0 · \ I -150. 0 152. 0
TE .... l o •O.O C TE- z, :J .&O. 0 C
PERKIN-ELMER 7 Series Thermal Analysi s System
: :::~ :~ \ 1si . 111 ·c I 252. 957 .J I
2ti. 968 Jig
30.302·• I\ 1se.002 ·c /
I 15 4. 0
J. \, I
I 156.0
I 158.0
1 160. 0
I 162. 0
h,lllJ>Oratura ( • C>
I · 1 164. 0 166. 0
I I
---~
I 168. 0
I
I ~
170. 0

ti) (JJ ....
Fiqure 17: DSC Scan of Ibuprofen
DSC Doto F- I I a, gpura
Sa111pla Wul gh t 1
Thu Ju l 12 121 481 IS 1990 CONTROL S< •l 42. 6 I-
I 55. o I Tl
T2
50. 01 Paok
45. 0 Arao
I 40.0 ~
" .!)
35. o I . 0
30. 0 l ~
~ l 2r,. o I
?O. 0 I
"'t-10. 0
5. 0 \
0. 0 46. 0
TE"IP lo TIMf" lo u: ... 2 . l~~: g ~
( +)-S-i buprofen Purity Run
PERKIN-EL MER 7 Ser ies Thermal Analys i s System
•e. 503 ·c 56. s16 · c
s•. 693 ·c 12 14. 27 4 m)
f" ' ' ' ' ' !" ' \ ' ' ,
I I ,' / ,' / I
' ' ' I , I I I • / ' 'I ' . ~ _/ __ ,· _~ _}_ L. ---- ·--- -
I I I I I 40. 0 50.0 52.0 54.0 56.0
T c mparotura < •c> 0 . U "' '" Jt ... TF.: lo
I
-~ I
I j
58. 0

!\) U1 !\)
l' -• .... • .. B ~ • ~ • ....
Figure 18 (+)-8-lbuprofen Purity Determlnetlon
53 $lope • - .e1ee • : To-Tm . • (x2) • RTq1 I 4H1
·•·· .......... .
52
51 0.25 1.00
xi • 0.0 11 !'urKr LH • 98.8~"
r:;.~ ;,; ai • :: 0~•1<;:~ :.>r;.:.;: 1AF Reqr • 0. 9 .
1.75 2.50
1/F
APPENDIX D
EXPERIMENTAL COMPLEMENT OF MANUSCRIPT II
253

(
In this work other experiments were performed to
complement the results. However I found some of it incom
plete or noc statistically powerful. Therefore. in agreement
with the authors it was deci ded not to incorporate these
data in the manuscript for publ ication. Some of the data is
graphically presented in figures 1 and 2 or tabulated (table
I ) .
254

c: 0 ;; f'-• f'-
-; ~ E ... 0 c: .. 0 ::I -• e! ... ... -c: .. • • 0 f'- u ... <O c:
:I. 0 ,gt E
111= ()
u.. ·-.... '"l c: • - ~. .. c: 0 • ;. ~ ... ... Q. a ~i :I • ! .. :e -c: i5 ... f'-•• .. l{)
i5
0 0 0 0 N co ""
<•inu111> 8W!.1
255

0 .i-
'# c .... 0 .... ·;; I ... • <j> ~
0 • I f'l .. ~ I I a. I • z E I I I 0 : i ~
() . ~t ... u • II: -· '# 0
0 .. .... 0 ... ..
'° ... n N z U% I 0 •c u :i j:: :: 0 I ! \ u Ill ~ c
I I Q, I I i ::.
c-. ~-r 0 u
• 1, 0 .. t--\~ ::I '# t-~~Q~ a .... u:: IO
I \ ............ c ' ',
t ' ' ',, ' ' ' 0
0 0 0 0 0 .i- f'l N
I'S) SSJNOllYH
256

Table I: Pure ibuprofen Compacted: Thermal Analysis
Compaction 4H1 Tm
Level in KN (J/g) ( 'C)
Mean (SD)
0 127.1 77.5 1(1) 127.8 75.3
N 8(3) 124.5 74.7 (Jl
-'1 30(3) 125.0 75.5

BIBLIOGRAPHY
Adams SS. Bresloff P , Mason CG,
Journal of Pharmacology & Pharmacology 28:256-257. 1976.
Adams SS. Cliffe EE , Lessel B, Nicholson JS .
Journal of Pharmaceutical Sciences 56:1686, 1967.
Aguiar AJ . Krc J, Kintel AW and Samy n JC
Journal of Pharmaceutical Sciences 56 , pp 847-853, 1967
Ahn Hae-Young, Amidon GL and Smith DE presented
at the A. A.P.S . meeting in Las Vegas
Pharmaceutical Research 7. (9): 234. Sept . 1990 .
Akbuga J. and Gursoy A.
Drug Development & Industrial Pharmacy 13 ( 14 ) :2541-1552 (1 987 )
Alhec C . and Zografi G.
Accepted International Journal of Pharmaceutics . , 1991
Ansbacher Rudl Journal of the American Medical Association
(259 ), 2 , 220, (1988 )
Arnaud P. Pharmaceutica Acta Helvetica 58 ( 11 ), 290 - 297 ( 1983 )
258

Baille TA. Adams WJ. Kaiser DG. Olanoff LS. Halstead GW
Harpootlian H. VanGiesen GJ. Journal of Pharmacol ogy &
Experime ntal Therapeutics 249 ( 2 ) :517 - 523. (1989).
Benkerrour L. Puisieux F. Duchene. D.
Pharmaceutica Acta Helvetica 57 ( 10 ) :301 - 308 ( 1982 )
Bettinetti GP. Gioardano F. Italia A, Pellegata R
and Ventura P , AGPI , 3 , pp 232 - 240. ( 1988)
Britain, Harry G. Drug Developement & Industrial Pharmacy
15 ( 13 ) , 2083-2103 ( 1989 )
Britain Harry G .. Pharmaceutical Research 7 ( 7 ) :683-690 (1990)
Byron PR and Notari RE
Journal of Pharmaceutical Sciences 65 ( 8 ), 1140-1 144 , 1976
Campbell DB, Europeen Journal of
Pharmacokinetics 5 ( 2) pp 109-125. ( 1990 )
Drug Metabolism
Carstensen JE Journal of Pharmaceutical Sciences 65:992- 997.
( 1977 )
Cartwright, AC Drug Information Association Journal
Vol 24 , pp 115 - 116, ( 1990 )
259

Celik M and Marshall K. Drug Development & Industrial Pharmacy
15(2 ) . 758-800. ( 1989)
Chan HK and Doekler EK
Drug Development Industrial Pharmacy 11 ( 2&3 ) 315 - 332. ( 1985 )
Chilamkurti RN. Schwartz JB and Rhodes CT. Pharmaceutica Acta
Helvetica 58:253 ( 1983 )
Chowan ZT , Journal of Pharmacy & Pharmacology
32:10- 14 ( Jan ) 1980
Chowan ZT and Amaro AA
Drug Development & Industrial Pharmacy 8 ( 14 ) :1079- 1106 (1988 )
Chowan ZT and Chow YT International Journal of Pharmaceutical
Technology & Product Manufacture 2 ( 1 ) :29-34 ( 1981 )
Chowan ZT and Palagyi LH
Journal of Pharmaceutical Sciences. 67(10 ) , 1385 - 1389 (1978 )
Cox SR . February (1988)
Clinical Pharmacology and Therapeutics 43 : 146 (1988).
Cox SR. Brown MA , Squires DJ . Murrill EA. Lednicer D, Knuth DW.
Biopharmaceutics & Drug Disposition 9:539-549. ( 1988 ) .
260

Cruaud 0. Duchene D. Puisieux F. Chauvet A. Masse J
Journal d e Pharmacie de Belgique 36(1 ) . pp 15-20. (1981 )
Edmonson IC
"Advances in Pharmaceutical Sciences· Vol.2
Edited by H.S. Bean, J.E . Careless and A.M. Beckett
Ac ademic Press. London 1967 pp-95
Formi A. Moretti I and Torre G, Chemical Society & Perkin
Transcripts 2. pp 791-797, 1984
Franz , Robert. M.
"Stable High Dose. High Bulk Density Ibuprofen Granulations
for Tablet and Capsule Manufacturing·
U.S. Patent 4.609 . 675 Sept. 2. 1986
P.E . Gordon , C.L . VanKoevering , and D.J. Reits
International Journal of Pharmaceutics 21 : 99- 105. ( 1984 )
Haleblian , John K.
Journal of Pharmaceutical Sciences 64 ( 8 ), pp 1269- 1288 , ( 1975 )
Grant DJW , Medhizadeh M. Cho~ AH and Fairbrother JH
International Journal of Pharmaceutics 18 , 25 - 38 , ( 1984 )
Greenblatt.DJ and Shader , RI
261

Jou r nal of Cl inical Pha rmacology ( 27 ) . 85-86. ( 1987)
Gesslinger G. Stock KP. Bach GL, Loew D. Brune K. Agents and
Ac tion s . 27(3 4 ) :455-457. (1 989)
Haynes , J ohn D. Journal of Pharmaceutical Sc iences
( 70 ). 6. 673-675, (198 1 )
Hempel A, Camerman N and Camme r man A, Journal American
Chemical Society . 2, 3453-56, ( 1982 )
Herzfeldt HR a nd Kummel R , Drug Development & Industrial
Pharmacy 9(5 ). 767-793 . 1983
Hess . Hans
Pharmaceutical Technology pp 36- 50. Sept . (1 978 )
Hiestand EN, Amidon GE. Smith DP. and Tiffany BD
International & Powder & Bulk Solids Handling Procedures,
Rosemont. I L (1981)
Kwon HK . Franck MJ. and Henderson NL
Journal of Pharmaceutical Sciences 74(3 ) , pp 283-289 ,
March ( 1985)
A.J . Hutt and J. Caldwell
262

Journal of Pharmacy & Pharmacolology 35:693-704. ( 1983 )
Jacques J . Collet and Wilen SW
Enantiomers. Racernates and Resolutions J. Wiley 1981
a) pp 32-43: b) pp 88-104
Jarnal i F. Sing NN. Pasutto FM. Russell AS. Coutts RT .
Pharmaceutical Research 5(1):40-47. ( 1989 )
Jones. TM
Journal of Pharmacy & Pharmacology 31. 17 -23 ( 1980 )
Jordan RP and Rhodes CT
Drug Development & Industrial Pharmacy 5, 151 - 171 (1 979 )
Jusko WJ and Gibaldi M
Journal of Pharmaceutical Sciences ( 61 ) .8 , 1270-1273, (1 972 )
Nahoko Kaniwa , Hiroyasu Ogata , Nobuo Aoyagi , Yasushi Takeda
and Mitsuru Uchimaya Journal of Pharmaceutical Sciences ( 78 )
12 , 1020-1024 , (1989 )
Khan KA and Rhodes CT
Journal of Pharmaceutical Sciences 65 ( 12), 1835 - 1837 ( 1976 )
Khan KA and Rhodes CT
263

Pharmaceutica Acta Helvetica 50 ( 6 ) . 20 - 24. ( 1975 )
Knihinicki RD. Day RO . Graham GG and Wi lliams KM.
Chirality 2:134- 140. ( 1990 ) .
Kopp S , Beyer C. Graf E. Kubel F and Doelker EK
Journal of Pharmacy & Pharmacology 41:79- 82 ( 1989 )
Kryce I. Pope DG, Hersey JA
International Journal of Pharmaceutics 12:113- 134 ( 1982)
Lamy , PE, Journal of Clinical Pharmacolology ( 26 ) . 309- 316 ,
( 1986 )
Lee EJD. Williams K. Day R. Graham G, Champion D.
British Journal of Clinical Pharmacology 19:669-674, ( 1985 )
Lefebvre C, Bouge R, Ringard J and Guyot - Herman AM
"Modif ication de l ' aptitude a la granulation d ' un principe
actif imputable a l ' augmentation de la solubilite de
surface de ses particules. "
Presented at Agpi Paris (June 1989 )
Lefebvre C, Guyo t - Herman AM, Guyo t JC, Bouchet R and Ringard J
Drug Development & Industrial Pharmacy 13 ( 9-11 ) , 224 - 235 ( 1988 )
264

Lefevbre C. Guyot - Hermann AM. Draguet M. Bonde R and Guyot JC
Drug Developme nt & I ndus t rial Pharmacy 12 ( 11g13 ) . pp 1913 - 1927.
( 1986 )
Leuenberger . H . International Journal of Pharmaceut ics
12 : 41 -55 (1 982 )
Leuenberger H, Bier HP and Sucker HB
Pharmaceutical Technology 60- 66 , June 1979
Levine Stephen Hippocrates Ma rch April 1989
Levy G
Journal of Pharmaceutical Sciences 52 : 1047 (1963)
Lin Jue Chen Drug Development & Industrial Pharmacy 13(12).
2087-2110 (1 987 )
Lindberg NO , Johnsson C a nd Holmquist B
Drug Development & Industrial Pharmacy , 11 ( 4 ), 917-930 (1 985 )
Liu ST and Hur v i tz A,
Journal of Pharmaceutical Sciences , Vol 67, 5, pp 636-638. 1978
Lovering EG , McGilveray IJ. McMillan I and Tostowaryk W
Journal of Pharmaceutical Sci ences ( 64 ), 9 , 1521 -1 524. 1975
265

Lovering EG. McGilveray IJ. McMillan I. Tostowaryk W.
Matula T and Marier G
Canadian Journal of Pharmaceut ical Scienc e s (10). 2. 36-39.1975
Mackuch RW , Johnson MF , Archive of Inte rnal Me dicine (1 46 ) .
986-989, 1986
Mahon WA. Leeder JS. Brill - Edwards MM, Correia J and
MacLeod SM Clinical Pharmacoki netics ( 13 ), 118-124. 1987
Mayer . JM , Ac ta Pharmaceutic a Nordica 2 ( 3 ). 196-216, 1990
McConnell . JF , Crystal Structure Communication s 3:73-75. 1974
Mehata A. Adams KS. Zoglio MA , Carstensen JT
Journal of Pharmaceutical Sciences 66(10 ) :1462-1464 ( 1977 )
Mehvar Rand Jamal i F, Pharmaceutical Research , 5:76- 79. 1988.
Metzler. Carl M. , Journal of Clinical Pharmacology (2 9 ),
289-292 , 1989
Menard FA , Dehdiya MG. and Rhodes CT
Drug Development & Industrial Pharmacy 14 ( 11 ), 1452 (1 988 )
Midha KK. Chakraborty BS , Schewde R, Hawes EW ,
266

McKay G. Hubbard J W and Moore M
Journal of Pharmaceutical Sciences ( 79 ) . 1. 3-8. 1990
Moss JN and Rhodes CT. Canadian Journal of Pharmaceutical
Sciences (9), 1. 30-33, 1974
Mura P , Liguori A, Bramanti G. and Poggi L
Il Farmaco- Ed. Pr .. Vol. 42 , Fasc. 6 , pp 157 -164 . 1987
Nakai Y Drug Developemnt & Industrial Pharmacy 12(7 ). 1017-1039 ,
(1 986 )
Newitt JN and Conway-Jones , Transcript of International
Chemical Engineering 36:422, ( 1958 )
Nightingale SL , Morrison JM. Journal of the American Medical
Association ( 258 ) . 9 , 1200 - 1204. 1987
Nyqvist . Hakan
Drug Development & Industrial Pharmacy 15 ( 16&17 ), 957 - 964 ( 1989 )
Olson SC, Eldon MA , Toothaker RD, Ferry JJ and Colburn WA
Journal of Clinical Pharmacology (27), 342-345, 1987
Perrier , Donald D and Gibaldi M
Journal of Pharmaceutical Sciences ( 62 ), 2 , 225 - 228 , 1973
267

PMA Ad Hoc Committee on Racemic Mixtures .
Technology pp 46 - 52. May 1990
Pharmaceutical
Powell ML. Wei sberger M. Gural R. Chung M. Patrick JA. Radwanski
E and Symchowicz SS Journal of Pharmaceutical
Sciences ( 74 ) .2 , 217-219 , 1985
Rees JE. Bulletin of Chemistry & Pharmacy , 112. 216-220 . 1973
Remon JP and Schwartz JB Drug Development & Industrial
Pharmacy 13(1), 1-14 ( 1984 )
Repta AJ , Ealtezor MJ and Bansal PC
Journal of Pharmaceutical Sciences , 65 (2): 238-242. 1976
Riad LE , Chan KK , Wagner WE and Sawshuk RJ
Journal of Pharmaceutical Sciences (75), 9, 897-900, 1986
Richmond B, vescuso P. Peterson S, A Business User ' s Guide
STELLA. Hight Performance Systems, Inc. Lyme, New Hampshire .
1987.
Ringhand HE, Ritschel WA , Meyer MC, Straughn AB and
Cabana BE Journal of Pharmaceutical Sciences ( 72 ), 12 , 1983
Romero AJ , Grady LT and Rhode s CT
268

Drug Development & I ndustrial Pharmacy , 14 (11). pp 1429- 1457.
1988
Romer o AJ. Lukas G. Rhodes CT Pharmaceutica Acta Helvetica ,
66 (2). 34-43. 1991
Romer o AJ , Rackley R and Rhodes CT
Chirality . Accepted for Publication. III ( 5 ) . 1991
Romer o AJ and Rhodes CT accepted for publication in
Drug Development & Industrial Pharmacy . 17 (5), 1991
Romero AJ. Bon C., Johnson EF , Rosembaum SL and Rhodes CT
Clinical Research Practices & Regulatory Affairs 8 ( 2 ): 123-15 1,
( 1990)
Rosenbaum SE, Bon C. Rhodes CT
Drug Development & Industrial Pharmacy ( 16 ), 1. 157 - 163. 1990
Rumpf H. Chemical Engineering & Technology , 30:144- 158 ( 1958 )
Schulman. Robert A Journal of the American Medical Association
(26 1 ), 17 , 2499 , 1989
Stamm A and Paris L
Drug Development & Industrial Pharmacy 11 (2&3 ), 333- 360 ( 1987)
269

St offer SS Szpuner WE Journa l of t h e American Medic al
Association 244 ( 15 ) . 1704 - 1705. 1980
Summers SE . Enever RP and Carless JE
Journal of Pharmaceutical Sc ienc e s 66 ( 8 ), 1172-1175. ( 1977 )
Wyllie E. Pippenger CE , Rother AD
Journal of the American Medical Association ( 258 ) . 9 ,
1216-1217 , 1987
York P and Grant DJW
Acta Pharmaceutica Suecica . Symposium on Tablet Technology
February 24 - 27 , pp 63-64, 1987
Udupa N. Drug Development & Indus trial Pharmacy 13(15). 2749-
2769 ( 1987 )
Unvala HM. Schwartz JB and Schnaare RL
Dru g Developemnt & Industrial Pharmacy 14(10) , 1327- 134 9 (1988 )
Vromans H. DeBoer AM, Bolhuis GK a nd Lerk CF
Acta Pharmaceutica Suecica 22, 163-172 (1985)
Wagner. John G "Phar macokinetics: Notes" pp 132- 138, 161-166
Published by J.M . Richards Laboratory 1969
270

Wagner, John G. J ournal of Pharmaceutical Sciences ( 72 ) . 7.
838 - 884. 1983
Wagner JG and Nelson E
of Phar maceutical Sc iences (52). 6 , 610-611 , 1963
Walds PD , Galleta G, Braden NJ and Alexander L
Ac ta Pharmacologica & Toxicologica 59 ( Supp.V ) . 155 (1986)
Wallace JW. Capozzi JT. Shangraw RF,
Pharmaceutical Technology Sept 1983.
J ournal
Wood JH, Syarto JE and letterman H, Journal of Pharmaceutical
Sciences 54, 1068-1075, 1965
Yalkowsky SH and Valvani SE Journal of Pharmaceutical Sciences
69 (8) , 912-921. August 1980
Zog l io MA. Journal of Pharmaceutical Sciences 65:1205 - 1208 ,
(1978)
Division of Bioequi valence , "Gui da n ce f or In Vivo
Bioequivalence and In Vitro Di ssol ution Studies for
I ndomethacin " FDA 2 1 CFR 10.90 ( 1988)
271

![Formulation Development and Optimization of Ibuprofen ...€¦ · granulation are the commonly used methods to enhance drug solubility at a molecular level [7]. Melt granulation technique](https://static.fdocuments.us/doc/165x107/5f051ddf7e708231d4115926/formulation-development-and-optimization-of-ibuprofen-granulation-are-the-commonly.jpg)


![Resolution of Ibuprofen Enantiomers by Rhizomucor miehei … · ibuprofen [9] Enzymatic kinetic resolution of racemic ibuprofen: past, present and future [10] Lipases for biotechnology](https://static.fdocuments.us/doc/165x107/60fb9a046f3ed71e8020a41e/resolution-of-ibuprofen-enantiomers-by-rhizomucor-miehei-ibuprofen-9-enzymatic.jpg)

