

Optimization of High-Frequency Trading Systems
40
Transcript of Optimization of High-Frequency Trading Systems

HFT

High-Frequency Trading
• Dynamics/signals timescale < seconds
• Demanding telecom/network & software/hardware engineering
• Machine Learning, Simulation, Experimentation
• Revenue-generating, agency execution
- microstructure - ex, trading strategy: buy/sell for profit - ex, execution system: fill an order for a customer

HFT: Technological Progress
• <1980’s: telephone, runners
• 1980’s/1990’s: computers, handhelds
• 2000’s: colo, fiber, FPGA
• 2010’s: microwave, mmwave, shortwave
• Technology is commoditized and widespread
- ongoing computerization of trading — like every other industry; steady progress - called “program trading” in 1980s - “electronic/algorithmic trading” in 1990s & early 2000s - “high-frequency trading” since then - roughly (by end of each decade):
- 1980s: seconds - 1990s: millis - 2000s: micros - 2010s: nanos
- microwave: long distance, med. bandwitdth - mmwave: short distance, high bandwidth - shortwave: very long distance, very low bandwidth - HFTs usually on the cutting edge of this progress -

HFT: Automation of Trading “Stack”
• Exchange: where trading occurs
• Liquidity Provision: be available to trade
• Arbitrage: keep prices at fair values
• Execution: trade on behalf of a customer
- bottom three are HFT - market “stack” is like:
- (bottom) exchange, MM/arbitrageurs, execution services, investors (top)
- liquidity provision reduces the time to trade [like a used car dealer; easier than scanning posts on Craigslist] - arbitrage makes sure assets are priced correctly, so you get a fair price when you trade [Do you own SPY or another ETF? Did you buy it at a fair price?
How do you know?]
- You an investor (top of stack) goes to an exchange to trade and there’s a counterparty to trade with at a reasonable cost (liquidity), the asset are priced fairly (arbitrage), then the market is functioning well.
- execution algos takes work off of your hands; you hire a expert to do the grunt work and know the market [like a real estate agent helps you buy a house]; ex: (i) slowly work a large order, (ii) offer an interface that simplifies access to a large number of related markets (i.e., US equities)

Questions?

Optimization

A Trading Strategy
If signal > threshold: Buy Long
If signal < -threshold: Sell Short
If end of day: Liquidate and Stop
Rule set called a policy
threshold is a parameter
- Keep this example in mind as we go along
- Best threshold value depends on cost to trade, signal quality, how fast signal changes (decorrelates), cost to liquidate at EOD, and your definition of strategy quality (pnl, pnl - risk, etc.)
- How do you find the best threshold? That’s the subject of this talk…

Prediction Control
independent estimations sequence of decisions
known targets no targets
error function arbitrary: pnl, sharpe, …
signal weights thresholds, weights, limits, …
(signal, response) simulation, reality
- a prediction might be a useful component of a trading strategy, but the strategy is a controller - prediction: ex: midprice 1 second from now, 1 minute from now, next trade price, etc.* - “reward” for good decision might be given over time, while making other decisions; hard to determine *exactly which decisions responsible for pnl, etc. - could make prediction a subproblem of controller (strategy) design; but not always clear what the target should be

Simulation …
• can evaluate sequence of decisions, long-term effects
• includes risk, liquidity
• cheap: run many sims
- long-term effects: ex., order has to sit in queue for long time - cheap compared to trading

… vs. Reality
• But: Market reacts to our actions
• But: Hidden liquidity is … hidden
• But: Latencies complicated
• But: Exchange is complex
• But: Unknown unknowns
- trying to simulate a system with hidden state and complex dynamics - matching engine processes our orders — even if they don’t get filled; takes time, changes market - other traders (computers) see our orders/executions in public data and make different decisions than they would/could have - Any visible queue can have hidden liquidity, too + dark pools = more hidden queues than visible; *most* queues are hidden (not most shares, but most
queues) - long-holding-time strategies (i.e., days) may treat all of these effects as a small, noisy cost; but they are significant for HFT where profits/share are on par
with these costs - latencies possible at every network node; latencies coupled to each other and likely also to signals - exchange: what book is the exchange seeing right now? How are nearly-simultaneous messages reordered? How do complex order types *really* work? - simulation useful for testing code quality, optimization methodology, operational risk assessment

Private Data?
• Model market’s response to our orders, cancels
• Better, but not great:
• What if we placed an order at a different time?
• What if we *didn’t* place an order at this time?
- incorporate private data (our orders and cancels) into simulation - can build model of execution, but face
- little private data to work with (relative to public data) - missing “counterfactuals” — what if we took a different action?

Wrong Objective
• Quality estimate in simulation != quality estimate in real trading
• similar to overfitting
• “Online-Offline Gap” [ FB ML Field Guide ]
• “Reality Gap” [ Ev. Robotics ]
- not unique to trading; pervasive in engineering
- similar to overfitting in SL problem: error function over your data sample != error function over full population - but worse: your simulated dynamics might not even be a reasonable estimate of real dynamics; sometimes called “model bias” or overfitting of “tasks”,
but less-clearly understood than SL overfitting (sample bias)
- Facebook Field Guide to ML [ https://research.fb.com/videos/the-facebook-field-guide-to-machine-learning-episode-6-experimentation/ ] - M. Palmer, D. Miller, An evolved neural controller for bipedal walking with dynamic balance [http://citeseerx.ist.psu.edu/viewdoc/download?
doi=10.1.1.1016.6201&rep=rep1&type=pdf]

Questions?

Experiment
Prescription: experiment

Experimentation
• Measure quality (Q) of parameters by trading
• Measurement has a cost: loss, risk, opportunity
• Goal 1: Find highest-quality parameters
• Goal 2: Minimize cost of measurement
- “quality” could be pnl, pnl - risk, etc.; you decide - Every day that you trade at a suboptimal parameter — even if you’re making money — you’re paying an opportunity cost. You’ve missed out on the
extra money you would have made by trading at a better parameter setting. - competing goals: Goal 1 says “more measurements”, Goal 2 says, “fewer measurements”

Satisficing
• Guess parameters (“reasonable”)
• Do they work? Be thankful and don’t touch!
- satisfice = “satisfy” + “suffice” [ https://en.wikipedia.org/wiki/Satisficing ] - go build another strategy: other instruments, other markets, etc. - at HFTMM: scaled-up satisficing; ran many small strategies, turned off ones that lose money - Why optimize? (i) lots more revenue available, (ii) System loses money w/o it, (iii) don’t have experience/intuition to guess

A/B Test
• Compare two parameter sets / policies
• Call them “Policy A” and “Policy B”
• Ex: threshold=1 vs. threshold=2
• Ex: “JPM SOR” vs. “KCG SOR”
- can compare continuous parameter values or categorical, non-parameterized design decisions

A/B Test
• Trade A and B side-by-side for N days
• N determined by noise level and desired precision
N ≈ σ2/δQ2
- sigma = std. dev. of a q measurement - delta Q= smallest Q(A)-Q(B) you care to detect - Ask, “Is B better than A?” - EXAMPLE: VWAP Buy + VWAP Sell for each of A and B to test a change in execution signals, N = 1 day - EXAMPLE: HFTMM in ~1000 stocks divided up into A & B sets to compare threshold (liquidity cost) settings, N = 10 trading days (two weeks)
- nice overview: https://towardsdatascience.com/data-science-you-need-to-know-a-b-testing-f2f12aff619a

Improving A/B
• Lower cost of measurements
• Evaluate more parameters, more settings
- Can we improve upon an A/B test? - What if B is a *lot* better? Can’t we stop early and lower the cost? [No, b/c your plan to deal with noise required N days.] - What if we have more than two options to compare? A, B, C, …? A vs. B, then winner vs. C, then … This could take a long time and be very expensive. - queue of ideas to try can fill up quickly; want to service that queue quickly, too
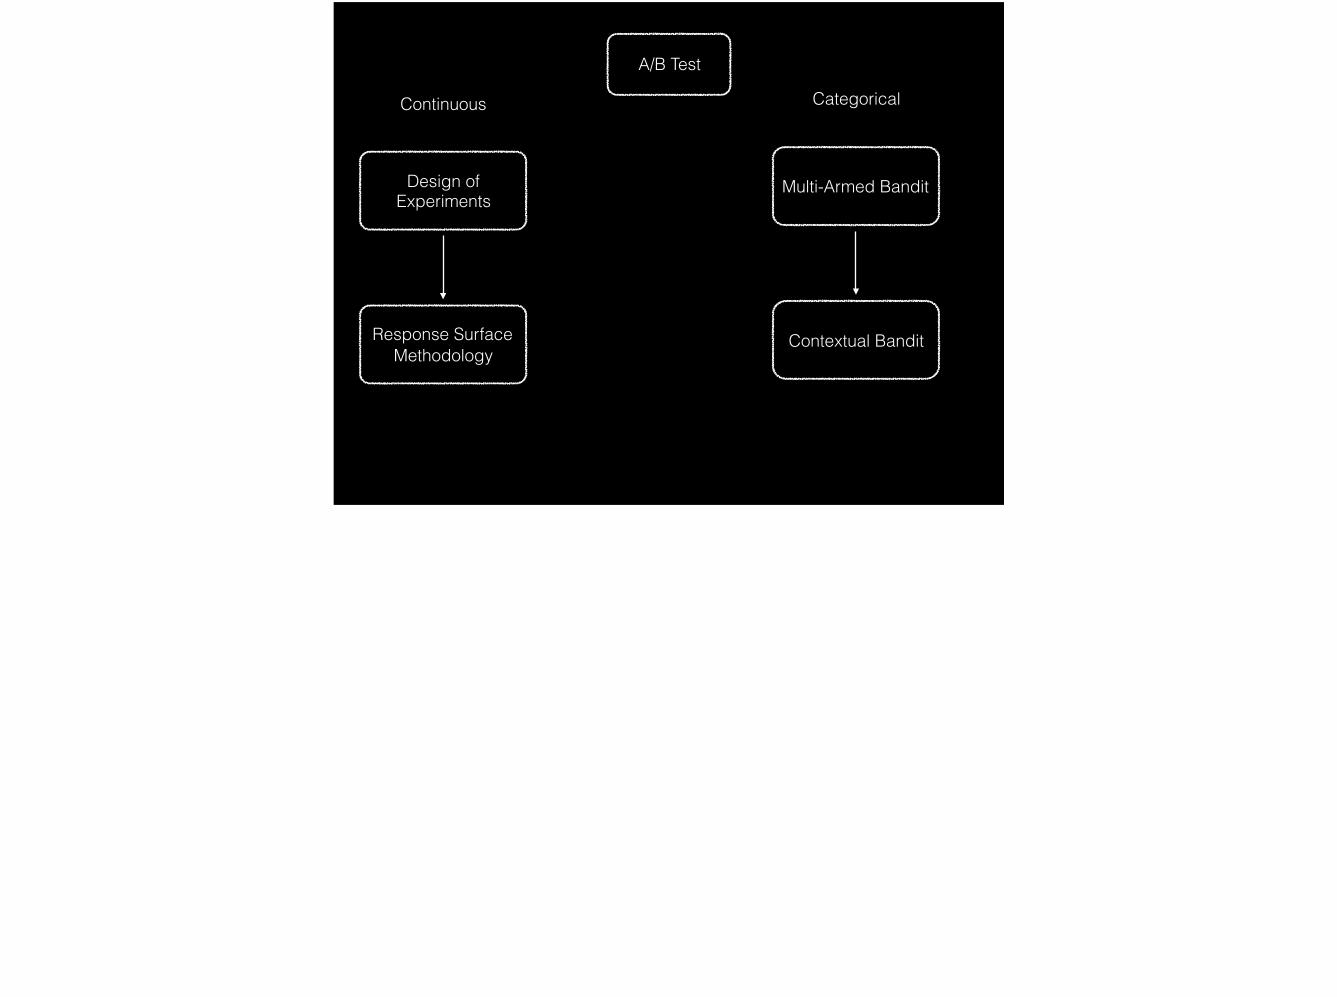
A/B Test
Design of Experiments
Multi-Armed Bandit
Response Surface Methodology
Contextual Bandit
Continuous Categorical

A/B Test
Design of Experiments
Multi-Armed Bandit
Response Surface Methodology
Contextual Bandit
Continuous Categorical

Design of Experiments
• Evaluate multiple parameters’ settings
• Choose which parameter values to measure to keep information high and cost low
- ex: threshold = 1, 2, 3, … - *not* JPM vs KCG, however - try to minimize # of experiments needs to evaluate settings of K parameters

Design of Experiments
p1 p2 p3
- - -
+ - -
- + -- - +
+ + -+ - +
- + +
+ + +
p1 p2 p3- - -+ + -+ - +- + +
Fractional Factorial
Factorial
- Factorial: all combinations, 2^n measurements - Fractional Factorial: Try to assess each parameter independently by removing pair-wise correlation; (only measure 1st and 2nd order effects) - avoid: “Hey! When I increased p1, quality improved!” “But when you increased p1 you also increased p2. So which parameter is responsible for the
improvement?” - Fewer measurements = lower cost - EXAMPLE: MM strategies, would run full-factorial designs on two parameters and fractional factorial designs on three parameters - more complicated with more parameters; There are tables online. :) - What about values between - and +? Can we be more precise? Can we handle more parameters without a large number of experiments?
NIST Engineering Handbook https://www.itl.nist.gov/div898/handbook/pri/section1/pri1.htm

A/B Test
Design of Experiments
Multi-Armed Bandit
Response Surface Methodology
Contextual Bandit
Continuous Categorical

Response Surface Methodology
• Model (regress) quality vs. parameters from D.O.E data
• Infer the best parameters from model!
• Verify/Improve: D.O.E. around inferred-best
- Model (regress) quality vs. parameters - The “best” parameters likely won’t be in the data set. - Re-center the measurements around the inferred-best. Then take measurements to verify your inference. - Repeat if desired until your inferred-best stops changing. - This is an iterative (manual) optimization routine - EXAMPLE: Designed intraday strategy, ~1000 stocks, using simulation. Ran with various values of a threshold parameter, modeled quality vs. parameter,
and set to inferred-best value. Did not iterate, however.

“Automated RSM”
Model (regress) response surface, Q(params)
Maximize Acquisition Function, ex: Q + stderr Q
Run experiment
Repeat
- many algorithms; Kriging, Bayesian Optimization, Efficient Global Optimization, Surrogate-function Black-Box optimization methods - (3) tries to optimally trade off the need to collect more data (to build a better model) which has a cost with the desire to trade at the optimal parameters; aka “exploration vs.
exploitation” - exploitation => higher revenue now; exploration => higher revenue in the future - accounts for noise / uncertainty in each measurement, so each trading day can use a new experiment design; all data are combined optimally into RSM
Efficient Global Optimization of Expensive Black-Box Functions http://www.ressources-actuarielles.net/EXT/ISFA/1226.nsf/0/f84f7ac703bf5862c12576d8002f5259/$FILE/Jones98.pdf

A/B Test
Design of Experiments
Multi-Armed Bandit
Response Surface Methodology
Contextual Bandit
Continuous Categorical

Multi-Armed Bandit Problem
• “one-armed bandit” == slot machine
• MAB: K arms, each with different, noisy payout
• Strategy to optimize total payout?
- MAB is a problem definition - “MAB methods” are ways to solve that problem - arms are parameter settings - K=2 arms == a more efficient A/B test - MAB cares about measurement cost - MAB handles multiple choices (not just two)

Multi-Armed Bandit Methods
1. Pull each arm several timesQ(arm) = mean(arm quality measurements) Thereafter only pull highest-Q arm
2. p=.9: pull highest-Q armp=.1: pull random arm
3. Pull arm with maximal “Q + stderr(Q)”
- (1) spends a lot of time measuring, but ultimately pulls the best - (2) (eps-greedy) “explores” 10% of time to improve estimates, but usually (90% of time) pulls the one we think is best; but never stops exploring - (3) (UCB1, if stderr is modified a bit) expression makes exploration vs. exploitation explicit; adds more samples to the noisier estimates (more efficient
exploration); eventually stops exploring (more efficient exploitation);
- EXAMPLE: HFTMM; would run ~10,000 arms each day dropping worst arms each night and adding new arms each morning; arm design initially manual, but grew more and more systematic (and higher-parameter) over time
Multi-Armed Bandit Algorithms and Empirical Evaluation https://cs.nyu.edu/~mohri/pub/bandit.pdf

A/B Test
Design of Experiments
Multi-Armed Bandit
Response Surface Methodology
Contextual Bandit
Continuous Categorical

Contextual Bandit
• context (aka. state) == signals, time of day, product traded, etc.
• Q(arm, context) = regression model
• Fit model from measurements so far
• Decision like MAB: Q + stderr(Q)
- Follow same rules as MAB — 90%/10% or maximal mean+se, except means are replaced by conditional means, i.e. model’s prediction of arm quality - EXAMPLE: Execution Router: four brokers to route orders to; model slippage of parent order based on broker, time of day, product, other signals;
rebuild model every night to “learn” from the day’s activity - EXAMPLE: ad-hoc in HFTMM; choice of strategies to run was conditioned on time of day, market volume/volatility
Learning for Contextual Bandits (slides) http://hunch.net/~exploration_learning/main.pdf A Contextual Bandit Bake-off https://arxiv.org/abs/1802.04064 THOMPSON SAMPLING WITH THE ONLINE BOOTSTRAP https://pdfs.semanticscholar.org/d623/c2cbf100d6963ba7dafe55158890d43c78b6.pdf

Questions?

Reinforcement Learning
- modern ML methods; “AI”, even

Reinforcement Learning
• SL : Prediction :: RL : Control
• RL Goals:
• automate engineering of controllers
• increase controller sophistication
- SL: predict outcome from signals; learn from examples (face recognition, translation) - RL: decide actions based on signals; learn from experience (Go, robots) - sophistication: more signals, more actions, more complex sequences of actions
Sutton & Barto, Reinforcement Learning: An Introduction, http://incompleteideas.net/book/bookdraft2017nov5.pdf Robot Hand https://arxiv.org/abs/1703.06907

RL Methods
• Evolutionary Algorithms (DeepGA, OpenAI-ES)
• Policy Gradient (PPO, DDPG)
• Value-based (DQN)
• Model-based (ME-TRPO, World Models)
- lots more, too - RL: flexible, parameterizes models; automated optimization of parameters
DeepGA: https://arxiv.org/pdf/1712.06567.pdf OpenAI-ES: https://arxiv.org/pdf/1703.03864.pdf PPO: https://arxiv.org/abs/1707.06347 DDPG: https://arxiv.org/abs/1509.02971 DQN: https://storage.googleapis.com/deepmind-media/dqn/DQNNaturePaper.pdf ME-TRPO: https://arxiv.org/abs/1802.10592 World Models: https://arxiv.org/abs/1803.10122

Sample Efficiency
• Most methods run (too) many experiments to run in production
• Maybe:
• Model-based methods
• Meta-learning
- 1MM - 100MM “experiments” (simulation runs in published papers) - MBRL: experiments collect data, optimization happens in simulation
- MBRL: http://rail.eecs.berkeley.edu/deeprlcourse-fa17/f17docs/lecture_9_model_based_rl.pdf - Meta: http://www.cantab.net/users/yutian.chen/Publications/ChenEtAl_NIPS16Workshop_L2LBlackBoxOptimization.pdf

Model-Based RL
• Learn the simulator from data
• Optimize controller in simulation
• Run controller to collect more data
• Repeat
- maybe optimize controller maximize pnl as well as collect more data to improve sim

Meta RL
• Construct an optimizer customized for:
• Your controller and your environment
• Optimize the optimizer in simulation
• Optimize the controller by experimentation
- custom optimizer is flexible (lot of parameters) - (one) objective is to optimize controller with *very* few experiments

Questions?


![Trading, Investments & Optimization Strategy Trading Risk Management [Market & Volumetric Risks] Presented By Xavier Veillard APAC Director Trading, Investments & Optimization Strategy](https://static.fdocuments.us/doc/165x107/5aa5580d7f8b9a517d8d1e15/trading-investments-optimization-strategy-trading-risk-management-market-volumetric.jpg)


