Optimization of Distributed Energy Resources to Balance Power Supply and Demand in a Smart Grid
29
Group 55 Group Members: Fuad, M.A.Raqib 11-19651-3 Ahmed,Tashrik 11-19648-3 Ali, Md. Rashed11-19631-3 Al-Imran, Shah Md. 11-19511-3 Thesis Supervisor: Md. Nasimul Islam Maruf Final Defense on Analysis on Power Supply-Demand Balance for a Smart Grid to Optimize Distributed Energy Resources
-
Upload
shah-md-al-imran -
Category
Engineering
-
view
291 -
download
4
Transcript of Optimization of Distributed Energy Resources to Balance Power Supply and Demand in a Smart Grid
Group 55
Group Members:
Fuad, M.A.Raqib 11-19651-3Ahmed,Tashrik 11-19648-3Ali, Md. Rashed 11-19631-3Al-Imran, Shah Md. 11-19511-3
Thesis Supervisor: Md. Nasimul Islam Maruf
Final Defense on
Analysis on Power Supply-Demand Balance for a Smart Grid to Optimize Distributed Energy Resources

Thesis GoalObjectives:
•Balancing the power supply and demand for a smart community
•Making the system more reliable during the peak hour for the consumer
• Integration of Renewable Energy Sources(RES) based plants in a system
• Improvement of the overall system efficiency •Analyzing the load demand

Accomplishment
•Energy production from RES (Solar, Wind, Biomass)
•Matching the power supply and demand
•Residual energy calculation
• Implementation of smart meter using MATLAB Graphical using interface(GUI)

Expected impact of our work
• It enables the operator and the consumer to solve complex power system problems through energy balance and quick demand response
•Dependency on traditional fossil fuel is minimized
•The final model is a sustainable system
•The consumer can utilize the residual energy so that the efficiency of the system is increased

Thesis Methodology

ModelBlock diagram of the proposed smart grid system

EquationsSolar Power, Psolar=(Area per-sq-ft×watts per sq-ft)
Efficiency, ɳsolar= JmVm
Wind Power, Pwind= ρAV3 Cp
Capacity factor, CF=Efficiency, ɳwind=
Biomass power, Pbiomass=NCV×W×(1/860)Efficiency, ɳbiomass=
Total generation= Psolar+Pwind+Pbiomass
Jm= maximum current density
Vm= maximum bias voltage
ρ = air density (kg/)
A= swept area ()
V= wind speed (m/s)
Cp= co-efficience of performance
NCV= net calorific value (Kcal/kg)
W= total waste quantity (kg)
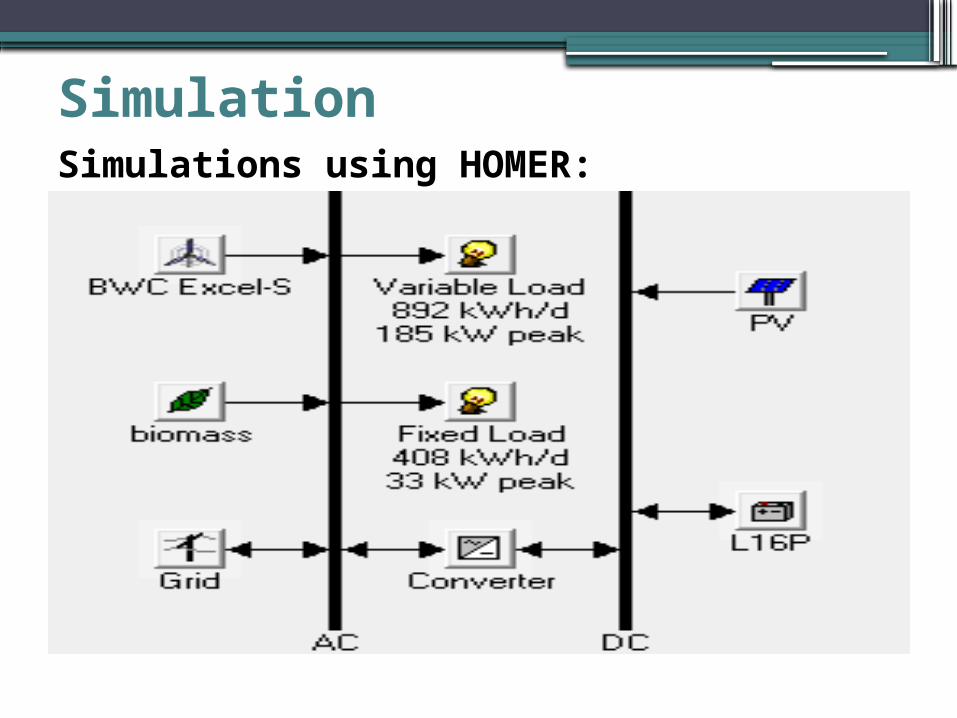
SimulationSimulations using HOMER:
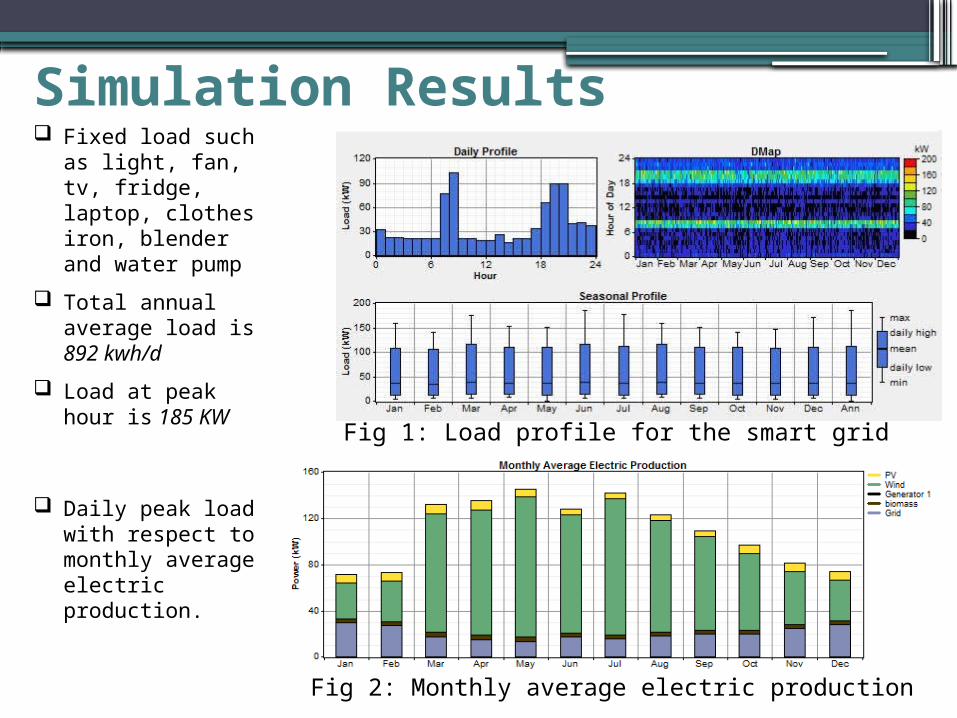
Simulation Results
Fig 1: Load profile for the smart grid
Fig 2: Monthly average electric production
Fixed load such as light, fan, tv, fridge, laptop, clothes iron, blender and water pump
Total annual average load is 892 kwh/d
Load at peak hour is 185 KW
Daily peak load with respect to monthly average electric production.

Simulated result of solar
Fig 5: global solar horizontal radiation
Fig 6: PV output
The average global solar horizontal radiation is 4.66 kwh//d
The average clearness index is 0.504
Total rated capacity is 40 kW
Mean output is 6.8 kw and 162 kwh/d
Capacity factor=16.9%
Total production is 59,172 kwh/yr.

Simulated result of wind
Fig 7: Monthly wind data
Fig 8: Wind output
Average wind speed is 6.74 m/s
Hub height is 50 m
Total rated capacity is 400 KW
Mean output is 79 KW
Capacity factor=19.7%
Total production yields 690,829 kWh/yr.
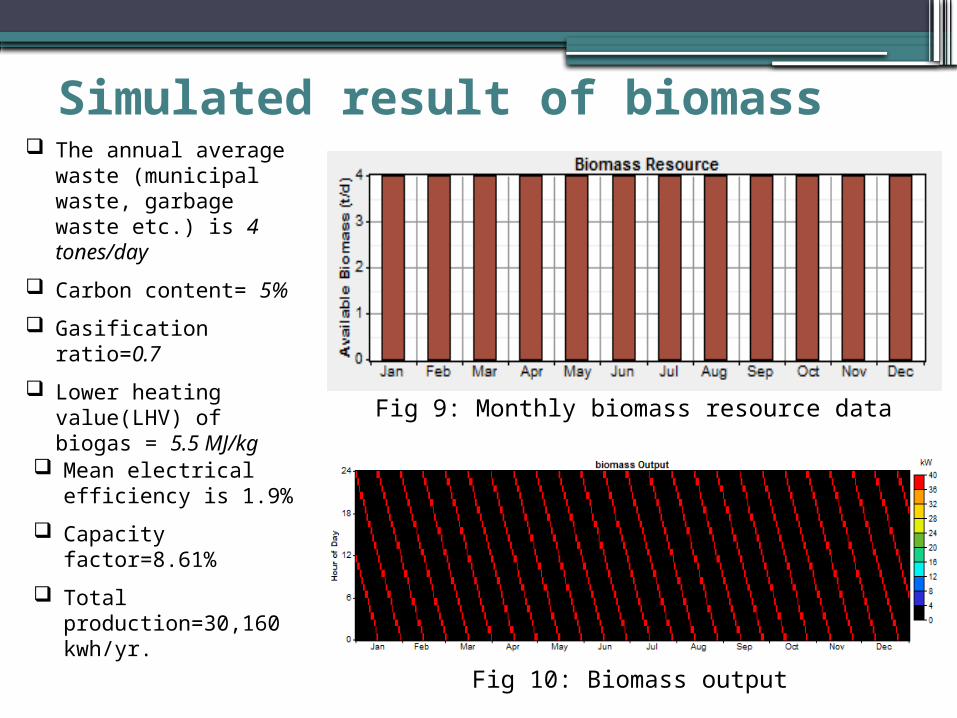
Simulated result of biomass
Fig 9: Monthly biomass resource data
Fig 10: Biomass output
The annual average waste (municipal waste, garbage waste etc.) is 4 tones/day
Carbon content= 5% Gasification ratio=0.7 Lower heating value(LHV)
of biogas = 5.5 MJ/kg
Mean electrical efficiency is 1.9%
Capacity factor=8.61%
Total production=30,160 kwh/yr.

Energy Storage:
Figure: Energy storage system topology
Quantity Value UnitsNominal capacity 2.16 kWhUsable nominal capacity 1.51 kWh
Autonomy 0.0279 hrLifetime throughput 1,075 kWh
Battery wear cost 0.362 $/kWh
Quantity ValueString size 1Strings in parallel
1
Batteries 1Bus voltage (V) 6
Battery Calculation :
Efficiency of each converter is 96%
The overall efficiency of the conversion procedure approximately 75%
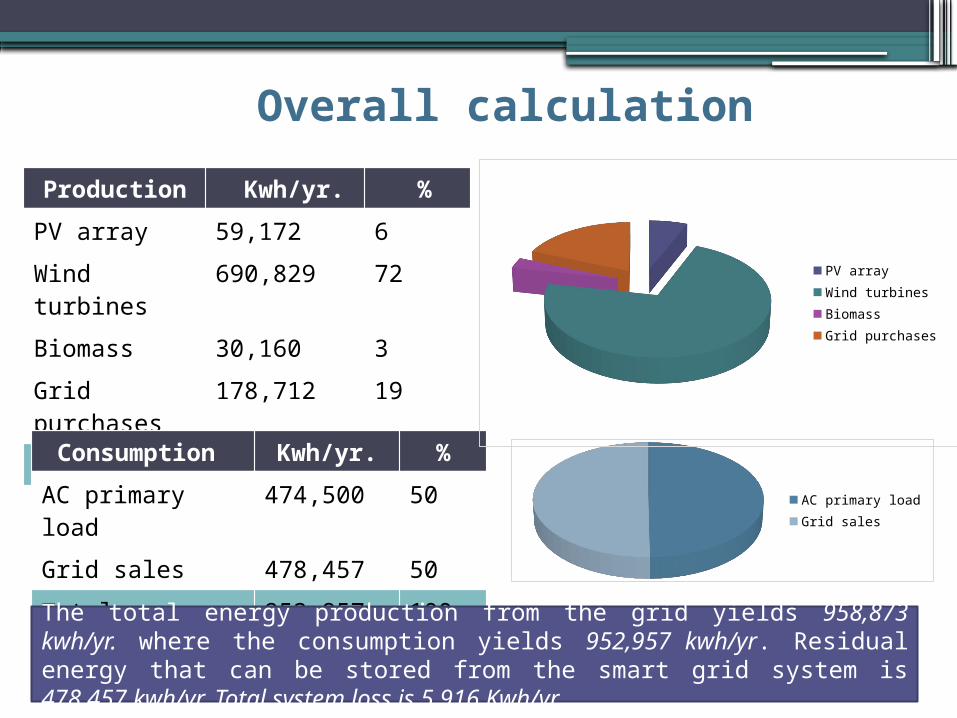
Overall calculationProduction Kwh/yr. %
PV array 59,172 6
Wind turbines 690,829 72
Biomass 30,160 3
Grid purchases 178,712 19
Total 958,873 100
Consumption Kwh/yr. %AC primary load 474,500 50
Grid sales 478,457 50
Total 952,957 100
The total energy production from the grid yields 958,873 kwh/yr. where the consumption yields 952,957 kwh/yr. Residual energy that can be stored from the smart grid system is 478,457 kwh/yr. Total system loss is 5,916 Kwh/yr.
AC primary load Grid sales
PV array Wind turbines Biomass Grid purchases

Cost Flow Analysis: Components Installation
Cost
$
Replacement
Cost
$
Operation &
Management
Cost
$
Salvage
Cost
$
Total Cost
$
PV 8,050 2,510 25,567 -1,407 34,720
Wind Turbines 44,700 18,652 127,834 -3,472 187,714
Generator 1 528 0 0 -120 408
Biomass 40 2 0 -1 41
Grid 0 0 -77,361 0 -77,361
Storage
System
359 312 1,278 -42 1,908
Converter 150 63 1,278 -12 1,479
Total 53,827 21,538 78,596 -5,053 148,909

Net Present Cost by Cost Type:

Smart Meter• It enables Two way communication between meter
and central system
• The metering interface model is coded using MATLAB
•RES generation, load consumption, residual energy calculation are done
•A particular time can be given as a variable and it will show the output of the system

Smart Meter(Cont.)“sMeter_v2015a” Output Model for Smart Meter
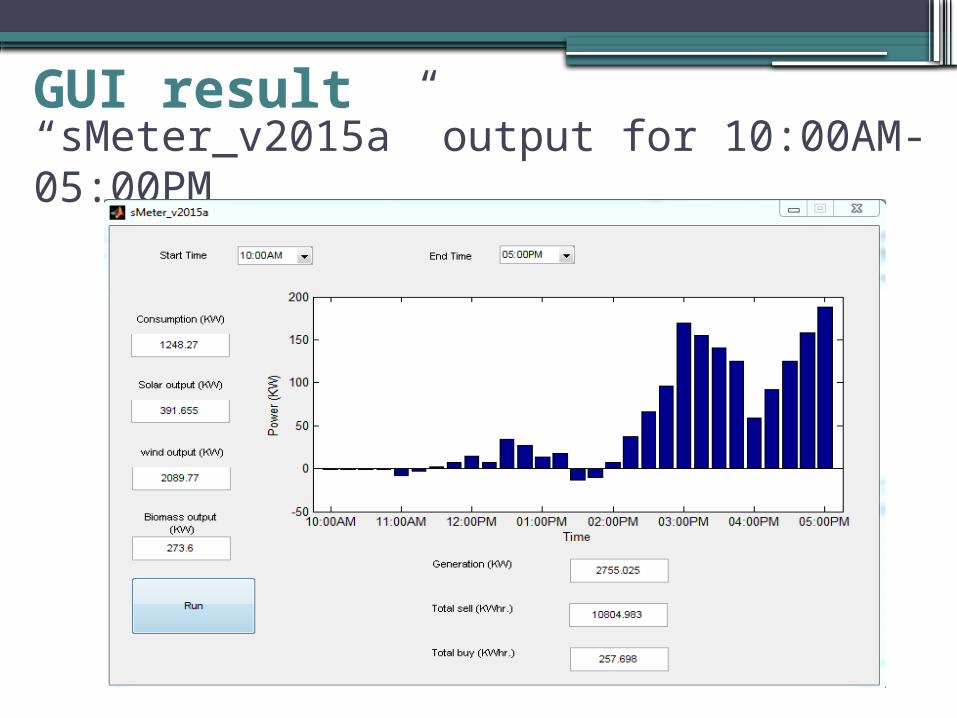
“sMeter_v2015a” output for 10:00AM-05:00PM
GUI result

“sMeter_v2015a” output for 12:00PM-12:00AMGUI result (Cont.)

“sMeter_v2015a” output for 24 hoursGUI result (Cont.)

Advantages of the overall system
•Supply and Demand Management
•Peak Load Balancing
•Consumer Online Controls
•Consumer Control Consoles
•Offsite Power Integration
•Smart Grid City and Smart Networks

Drawbacks
•Biggest concern: Privacy and Security
•Some types of smart meter can be hacked
•Hugely reliable in Battery or Storage System
•Expensive in terms of installation
•Not simply a single component
•Various technology component

Possible Improvements• Smart Grid can be redesigned considering as a large scale area
• Smart Meter can be more upgraded including new appliances
• The user may analyze the load consumption from any place at any time by Developing Web Site
• Using Others RES

Possible Improvements
•Can be used as an alternative option for existing
traditional power system
• Possible increment of overall installs capacity
• Additional use of hydro-micro hydro energy
should be checked
References• Chetan Singh Solanki, “Renewable Energy Technologies”, ISBN: 978-81-203-3434-2 , PHI Learning Pvt. Ltd., Mar 9, 2008
• M M Rahman & M A Uddin, “Solar beam radiation estimate’s correlation for Bangladesh”, Indian Journal of Radio & Space Physics, Vol. 28, December 1999, pp. 277-285
• Anik Deb, Dr. M.A Matin Bhuiyan & Arefin Nasir, “Prospects of Solar Energy in Bangladesh”, (IOSR-JEEE) e-ISSN: 2278-1676 Volume 4, Issue 5 (Jan. - Feb. 2013), PP 46-57
• Rifat Abdullah &Mahzuba Islam,”Prospects of Wind Energy in the Coastal Region of Bangladesh”,International Journal of Engineering Research & Technology (IJERT),Vol. 2 Issue 11, November – 2013, ISSN: 2278-0181.
• R. D. Prasad,”A Case Study for Energy Output using a Single Wind Turbine and a Hybrid System for Vadravadra Site in Fiji Islands”, The Online Journal on Power and Energy Engineering (OJPEE), Vol. (1) – No. (1).
• Md Mosleh Uddin &Md Sadman Sakib Mojumder,” Biogas Production from Municipal Waste: Prospect in Bangladesh”, Cyber Journals: Multidisciplinary Journals in Science and Technology, Journal of Selected Areas in Renewable and Sustainable Energy (JRSE), October Edition, 2011.
• Nusrat Jahan Imu & Dido Mann Samuel,” BIOGAS PRODUCTION POTENTIAL FROM MUNICIPALORGANICWASTES IN DHAKA CITY, BANGLADESH”, IJRET: International Journal of Research in Engineering and Technology eISSN: 2319-1163 | pISSN: 2321-7308
• [53] Lingxi Mi, “Analysis on Energy Balance for a Smart Grid in Stadshavens Area, Rotterdam,” M. sc. thesis, Delft University of Technology, Delft, Netherlands, Jan. 2012.
• [52] Aunanna Rashid, Nabil Hasan, Khandaker Tanvir Parvez, Shamsul Arefin Siddique, “STUDY AND ANALYSIS OF A SMALL SCALE MICRO-GRID USING RENEWABLE ENERGY RESOURCES”

Paper Submitted to conference

Thank You !
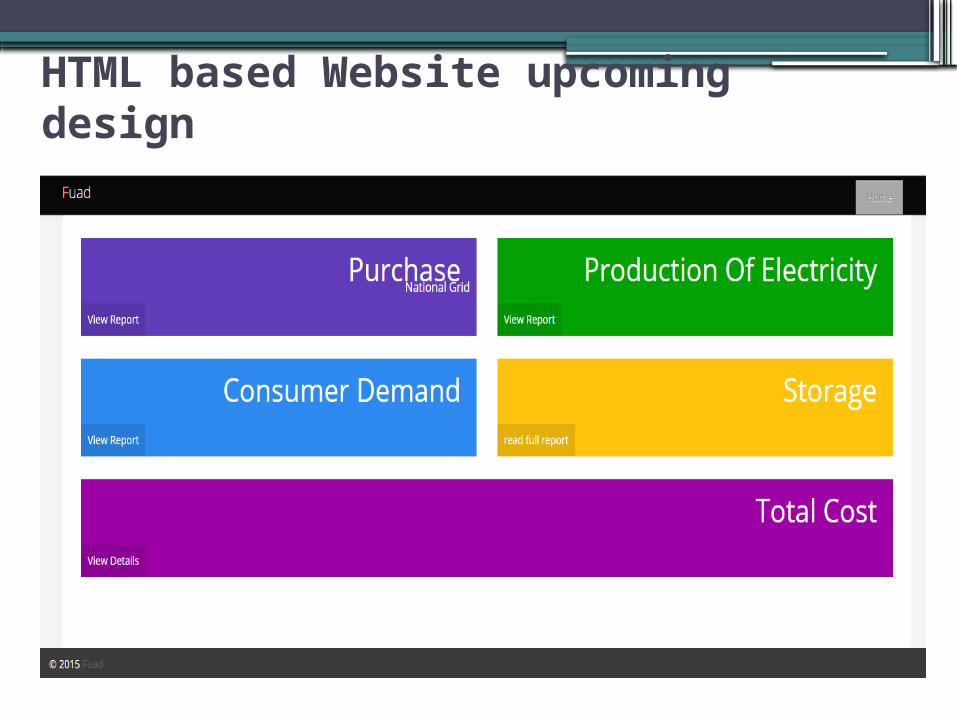
HTML based Website upcoming design