Optimization of bio-methane production process for combined …1115060/FULLTEXT01.pdf · Figure 2.7...
46
Optimization of bio-methane production process for combined treatment of sewage & municipal solid waste D.W.N Wijesinghe (830122A399) Open University of Sri Lanka 2009 Batch KTH Supervisor: Professor Anders Nordstrand Local Supervisor: Dr. N. S.Senanayake Eng. Ruchira Abeweera Master of Science Thesis
-
Upload
duongtuyen -
Category
Documents
-
view
219 -
download
0
Transcript of Optimization of bio-methane production process for combined …1115060/FULLTEXT01.pdf · Figure 2.7...
Optimization of bio-methane
production process for combined
treatment of sewage & municipal
solid waste
D.W.N Wijesinghe (830122A399) Open University of Sri Lanka
2009 Batch
KTH Supervisor:
Professor Anders Nordstrand
Local Supervisor: Dr. N. S.Senanayake
Eng. Ruchira Abeweera
Master of Science Thesis

ii
KTH School of Industrial Engineering and Management Energy Technology EGI-2009-2010
SE-100 44 STOCKHOLM
Master of Science Thesis EGI 2010:2016
Optimization of bio-methane production process for
combined treatment of sewage & municipal solid waste
D.W.N. Wijesinghe
Approved
Examiner
Name
Supervisor
Prof. Anders Nordstrand
Dr. N. S.Senanayake
Eng. Ruchira Abeweera
Commissioner
Contact person
Abstract
Handling solid waste such as municipal solid waste (MSW) has become a booming problem in highly
populated urban areas. Even though it has a high potential of biogas generation in anaerobic digestion, it is
not that successful as a single substrate. The early researches proved that it can be treated combined with
sewage sludge as a co-digestion process. This study was done to find the best performing mixing ratio of
MSW and sewage sludge (SS) which gives maximum bio methane output. In this study three mixing ratios for
MSW to SS were used as 50:50, 60:40, and 80:20. The retention time was selected as 20 days and the process
was continued for 11 days. The highest cumulative methane production was observed at 80:20 (MSW: SS)
mixing ratio as 2957.8 ml of methane. The methane and carbon dioxide content in gas was measured by using
gas chromatograph. Highest Total Volatile Solids reduction also recorded at 80: 20 (MSW: SS) ratio as
57.32% after 11 days. The best soluble COD reduction, 95.19% and COD reduction, 36.85% also recorded at
80:20 mixing ratio.
iii
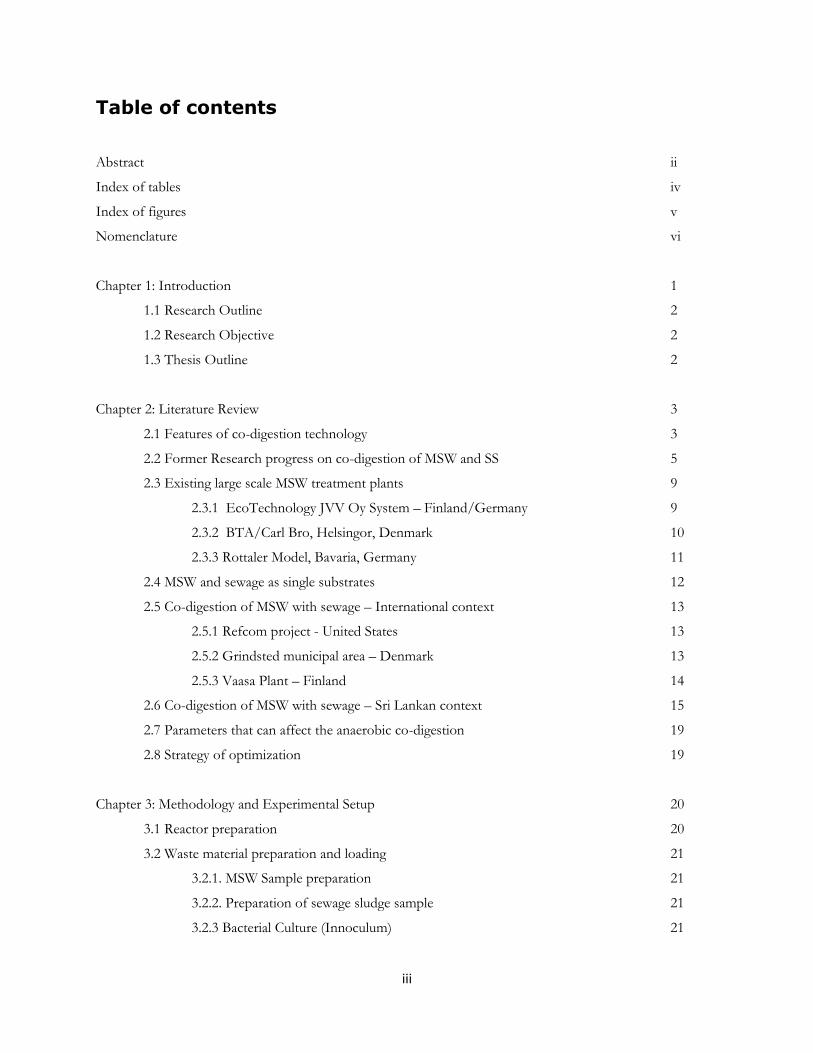
Table of contents
Abstract ii
Index of tables iv
Index of figures v
Nomenclature vi
Chapter 1: Introduction 1
1.1 Research Outline 2
1.2 Research Objective 2
1.3 Thesis Outline 2
Chapter 2: Literature Review 3
2.1 Features of co-digestion technology 3
2.2 Former Research progress on co-digestion of MSW and SS 5
2.3 Existing large scale MSW treatment plants 9
2.3.1 EcoTechnology JVV Oy System – Finland/Germany 9
2.3.2 BTA/Carl Bro, Helsingor, Denmark 10
2.3.3 Rottaler Model, Bavaria, Germany 11
2.4 MSW and sewage as single substrates 12
2.5 Co-digestion of MSW with sewage – International context 13
2.5.1 Refcom project - United States 13
2.5.2 Grindsted municipal area – Denmark 13
2.5.3 Vaasa Plant – Finland 14
2.6 Co-digestion of MSW with sewage – Sri Lankan context 15
2.7 Parameters that can affect the anaerobic co-digestion 19
2.8 Strategy of optimization 19
Chapter 3: Methodology and Experimental Setup 20
3.1 Reactor preparation 20
3.2 Waste material preparation and loading 21
3.2.1. MSW Sample preparation 21
3.2.2. Preparation of sewage sludge sample 21
3.2.3 Bacterial Culture (Innoculum) 21
iv
3.2.4 Identification of TS 21
3.2.5 pH Adjustment 22
3.2.6 Preparing Calcium Hydroxide solution 22
3.2.7 TS Adjustment 22
3.2.8 Test sample preparation 22
3.3 Continuous Feeding Plan 22
3.4 Analysis of gas composition 23
Chapter 4: Results and analyses 24
4.1 Calculation of TS values 24
4.2 pH Adjustment 25
4.3 TS adjustment 25
4.3.1 Adjusted dosing volumes 25
4.4 Gas Collection records 26
4.2 COD measurement 28
4.2.1 Soluble COD 29
4.3 TS & TVS calculation 30
Chapter 5: Discussion & Conclusion 32
References 34
Annexure 1: Feeding schedule of S1 36
Annexure 2: Gas collection records 37
Annexure 3: Gas Composition Data 38
Annexure 4: pH variation inside the reactors 39

v
Index of Tables
Table 2.1 Values of measured parameters before and after treatment 6
Table 2.2: Mixing proportion of MSW : SS 7
Table 2.3 Summery of Experimental Results 8
Table 4.1 TS measurement data of MSW 24
Table 4.2 TS measurement data of SS 24
Table 4.3 pH adjustment 25
Table 4.4 TS adjustment 25
Table 4.5 Adjustment of dosage 25
Table 4.6 Summary of COD Measurements 29
Table 4.7 Summary of Soluble COD Measurements 29
Table 4.8 TVS of Digested samples 30
Table 4.9 TVS of feed samples 30
Table 4.10 Average values of TS 30
Table 4.11 Average Values of TVS 31
vi
Index of Figures
Figure 2.1 Biogas production of different samples 5
Figure 2.2 Co-digestion reactor used by Nirawan Sanphoti 7
Figure 2.3 Flow Diagram of Ecotec JVY Oy System 9
Figure 2.4 Flow Diagram of BTA/Carl Bro, Helsingor, Denmark system 10
Figure 2.5 Rottaler Model – Anaerobic Digestion System 11
Figure 2.6 Different substrate characteristics of MSW and sewage sludge 12
Figure 2.7 Status of existing bio gas plants in Sri Lanka. 17
Figure 4.1 Reactor preparation for the experiment 26
Figure 4.2 Gas Chromatograph 26
Figure 4.3 Graphical Representation of Gas Collection 27
Figure 4.4 Cumulative Gas Collection 27
vii
Nomenclature
MSW - Municipal Solid Waste
SS - Sewage Sludge
AD - Anaerobic Digestion
ADR - Anaerobic Digestion Reactor
VS - Volatile Solids
OFMSW - Organic Fraction of Municipal Solid Waste
HRT - Hydraulic Retention Time
VFA - Volatile Fatty Acids
TS - Total Solids
TVS - Total Volatile Solids
VS - Volatile Solids
COD - Chemical Oxygen Demand
BOD - Biochemical Oxygen Demand
OLR - Organic Loading Rate
NERDC - National Engineering Research and Development Center
C: N - Carbon to Nitrogen
GC - Gas Chromatograph

1
Chapter 01
Introduction
Co-digestion is one of the advanced technologies available to enhance the yield of bio-methane from
anaerobic digestion of solid wastes. The co-digestion differs from anaerobic digestion because of uses more
than one substrate in the reactor instead of single substrate. Hence there will be a main substrate and one or
more core substrates. This co-substrates are used to improve the biogas yields mainly due to positive
synergisms developed in the medium as well as it provides missing nutrients to the process.
Sri Lanka being a country with mostly agriculture based economy lot of organic wastes (vegetables and rice)
are generated in day to day life of people that are collected as Municipal Solid Waste (MSW). Due to its high
volume, the disposal of MSW has become a serious environmental issue especially in urban areas. Most of the
MSW is dumped in bare lands without any protective action. So it has over the time lead to serious health
issues due to unsecure dumping. Air pollution, ground water pollution, damaging the environmental aesthetic
value, pollution of water bodies and their aquaculture are some of the major issues. But still very little efforts
have been made to manage MSW by responsible parties- so it is very much timely need that proper ways of
making use of MSW to the benefit of the public. This study made an attempt to provide a solution to the
manage MSW by using them to generate bio methane as an energy source
Due to the high growth rate of population, the population density has increased tremendously specially in
urban areas. So within the past decade a lot of high rise apartment buildings were built. So there were
common sewage collection systems and treatment plants built with apartments. Also most of the hotels and
motels have there own sewage treatment plants in order to treat toilet waste. Even the water is treated and
disposed; disposal of solid part (primary and secondary sludge) is still a problem for them. Also it has to be
stabilized chemically and hygienically prior to dispose. Methane fermentation is one of the better solutions for
this stabilization.
There are several researches done on this subject especially for the identification of appropriate mixing ratios
for OFMSW and sewage sludge (SS). But the results they had obtained have some variations rather receiving
a common ratio. This may be due to the variation in the quality of MSW in different regions as well as
climatic changes. Other than that there is no such research evidence found from Sri Lanka. So the importance
of investigating the optimum operating conditions for said co-digestion is very high.
2
1.1 Research Outline
Usually anaerobic digestion of MSW yields low levels of bio-methane. Even though it creates more Volatile
Fatty Acids (VFA), it tends to accumulate rather converting it to bio-methane. So this accumulation inhibits
the process and results in to a lower yield (Schmidell, 1986). This is the major issue to treat MSW alone.
Therefore the focus of this research was to enhance the yield of bio-methane by the addition of primary SS
with MSW.
1.2 Research Objective
The objective of this study was to determine the best mixing ratio of MSW to SS for maximizing the
generation of bio-methane in co-digestion process
1.3 Thesis Outline
The thesis report begins with the introduction and literature review on similar kind of experiments and
current scenario in Sri Lanka. Chapter 3 has provided the details of the methodology of the experiment from
the beginning to the end. The experimental results were produced in chapter 4. At last discussion and
conclusions are expressed in chapter 5.

3
Chapter 02
Literature Review
2.1 Features of co-digestion technology
Improved digestion/gas yield
With the use of co-substrates it can have better nutrient balance hence the conditions for AD process is
enhanced. This helps improve the digestion rate as well as bio-methane yield. Wei Wu (2007) highlighted that
he was able to have a higher gas yield of 0.8 -1 m3/Kg VS from a highly buffered co-digestion process of
solid slaughterhouse waste, manure and fruit and vegetable waste.
Improved process stability
Especially solid phase substrates have higher gas potential but the process is very unstable. The balance of
nutrients, constant pH level and suitable C:N ratio are the essentials for a stable process. (Alvarez, 2003) Co-
digestion of solid waste with a liquid phase substrate improves the process stability.
Effective utilization of existing reactors
Brawn (2007) stated that there are well distributed sewage treatment plants available which has spare reactor
volumes to digest co-substrates with lower transportation costs. It is almost valid in Sri Lankan context,
therefore it provides overall economic advantages by utilizing this existing reactors for co-digestion.
Pre-treatment requires prior to the anaerobic digestion
Co-substrates like MSW which is in solid form needs common pre-treatments like sorting and crushing prior
to dilute with sewage. In addition to that it may have some specific pre-treatments based on the process
design.

4
Increased mixing requirement
Mixing is not a must in anaerobic digestion. But the performance of AD can be increased by mixing. There
are varies methods of mixing such as mechanical stirring, gas circulation or displacement under gravity.
Biomass particles are generally floating on the surface of the digester due to the lower density than the
digester liquid.
In co-digestion there is more than one substrate involved and solid content also increased. So the mixing is
preferable in order to transfer nutrients as well as to eliminate the phase separation of solids & liquid.
Post treatment of wastewater
The outlet liquid from co-digestion process is not treated up to the standard levels. So the post treatment step
is required prior to release to the environment. Also it has to be sanitized prior to disposal to meet hygienic
conditions.
Special arrangements needed to remove solid portion from the reactor
There should be special mechanism to remove solids due to the high accumulation of solids compared to
liquid phase single substrate and continuous processes.

5
2.2 Former Research progress on co-digestion of MSW and SS
Example 01 In a study done by Amirhossein Malakahmad et al. (2007) emphasizes some important facts of co-digestion
of MSW and sewage sludge. Batch processes were carried out with different co-digestion ratios of MSW and
sewage sludge while keeping some parameters unchanged i.e. pH at 7, temperature at 350C and HRT at 15
days.
In this experiment five samples were tested in different mixing ratios as follows.
Sample 1: 100% OFMSW
Sample 2: 75% OFMSW and 25% sewage sludge
Sample 3: 50% OFMSW and 50% sewage sludge
Sample 4: 25% OFMSW and 75% sewage sludge
Sample 5: 100% sewage sludge
In every sample TS, VS, pH, ammonical nitrogen, COD were measured as initial and final properties.
According to this study the highest yield of biogas has obtained from second sample which had 75% of MSW
and 25% of sewage sludge.
According to Schmidell (1986), MSW as a single feedstock is producing lower yield of biogas compared to co-
digestion with sewage. This happens because VFA is tends to accumulate and inhibit the process rather
convert it to biogas when MSW digest alone By adding sewage sludge to the process the accumulation of
VFA limits, hence releases more bio-methane.
Figure 2.1: biogas production of different samples

6
Table 2.1: Values of measured parameters before and after treatment

7
Example 02
Proper mixing ratio of MSW and sewage sludge has experimented by Nirawan Sanphoti et al.(2007) referred
to the anaerobic co-digestion of organic municipal solid waste and sewage sludge. The MSW to sewage sludge
proportions as follows.
Table 2.2: Mixing proportion of MSW : SS
Initial pH was kept at 5.43 at every sample and temperature was maintained at 32-38 0C which was common
for all. A gas meter was used to measure the gas yield and methane to carbon composition was measured by
gas chromatography. Leachate properties were analyzed for
pH, alkalinity, TVA and COD by standard methods by Standard Methods for the Examination of Water and
Wastewater (1995). A pH buffer solution (NaHCO3) was added to all samples in 26th and 62nd days to
increase the leachate pH.
Figure 2.2: Co-digestion reactor used by Nirawan Sanphoti

8
The results of this experiment are illustrated in following table.
Table 2.3: Summery of Experimental Results
Based on this experiment best results have come from the MSW: SS mixing ratio of 60:40.
9
2.3 Existing large scale MSW treatment plants
MSW is a complex substrate which has to be segregated prior to introducing to an AD reactor. There are lot
of plants have been commissioned worldwide but almost all the plants consisting waste segregation part as
the initial step.
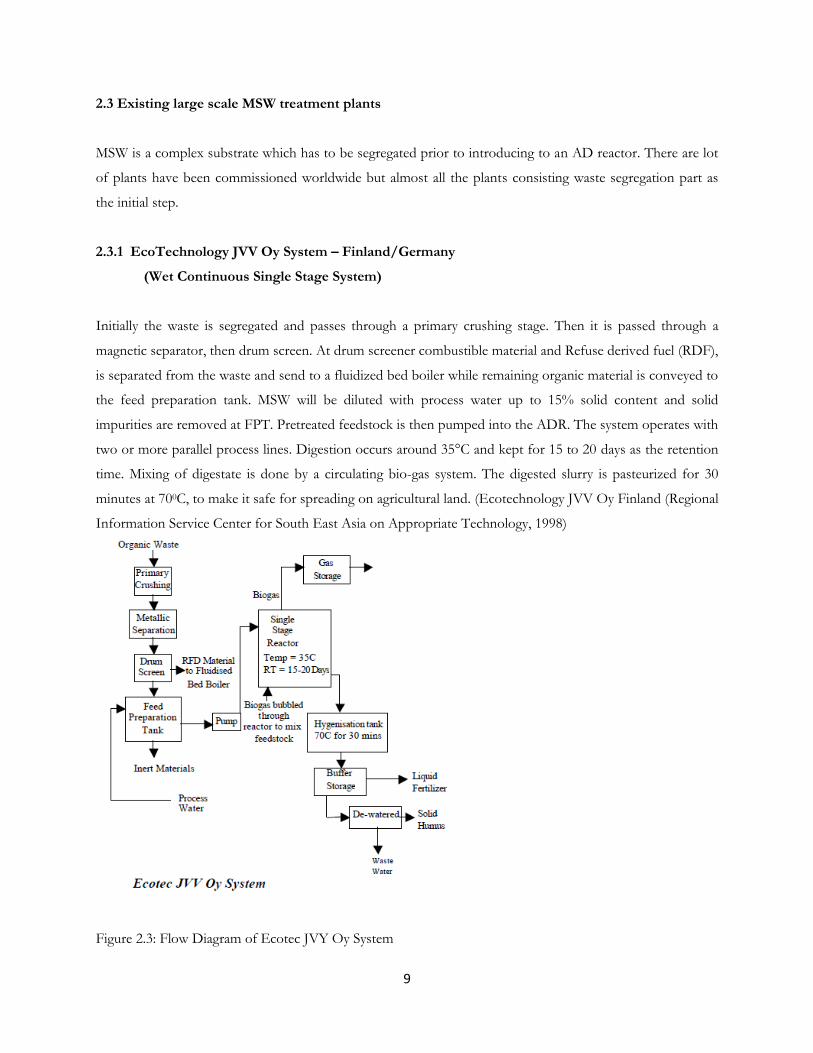
2.3.1 EcoTechnology JVV Oy System – Finland/Germany
(Wet Continuous Single Stage System)
Initially the waste is segregated and passes through a primary crushing stage. Then it is passed through a
magnetic separator, then drum screen. At drum screener combustible material and Refuse derived fuel (RDF),
is separated from the waste and send to a fluidized bed boiler while remaining organic material is conveyed to
the feed preparation tank. MSW will be diluted with process water up to 15% solid content and solid
impurities are removed at FPT. Pretreated feedstock is then pumped into the ADR. The system operates with
two or more parallel process lines. Digestion occurs around 35°C and kept for 15 to 20 days as the retention
time. Mixing of digestate is done by a circulating bio-gas system. The digested slurry is pasteurized for 30
minutes at 700C, to make it safe for spreading on agricultural land. (Ecotechnology JVV Oy Finland (Regional
Information Service Center for South East Asia on Appropriate Technology, 1998)
Figure 2.3: Flow Diagram of Ecotec JVY Oy System
10
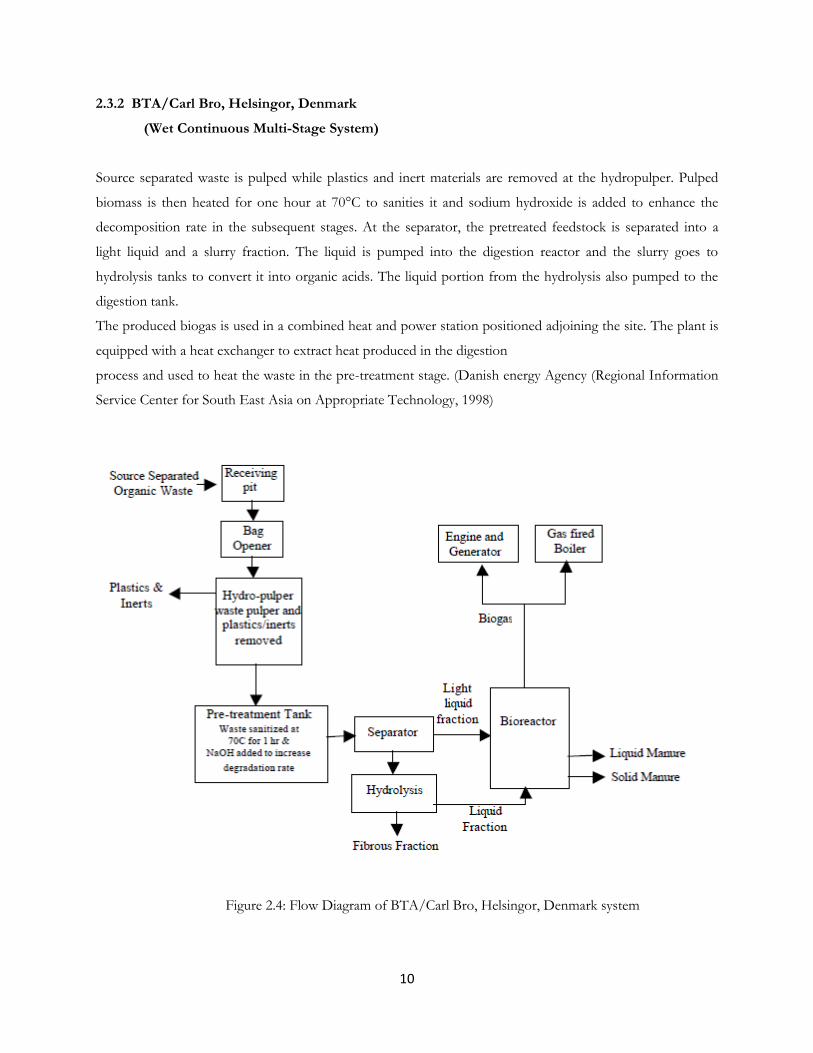
2.3.2 BTA/Carl Bro, Helsingor, Denmark
(Wet Continuous Multi-Stage System)
Source separated waste is pulped while plastics and inert materials are removed at the hydropulper. Pulped
biomass is then heated for one hour at 70°C to sanities it and sodium hydroxide is added to enhance the
decomposition rate in the subsequent stages. At the separator, the pretreated feedstock is separated into a
light liquid and a slurry fraction. The liquid is pumped into the digestion reactor and the slurry goes to
hydrolysis tanks to convert it into organic acids. The liquid portion from the hydrolysis also pumped to the
digestion tank.
The produced biogas is used in a combined heat and power station positioned adjoining the site. The plant is
equipped with a heat exchanger to extract heat produced in the digestion
process and used to heat the waste in the pre-treatment stage. (Danish energy Agency (Regional Information
Service Center for South East Asia on Appropriate Technology, 1998)
Figure 2.4: Flow Diagram of BTA/Carl Bro, Helsingor, Denmark system
11
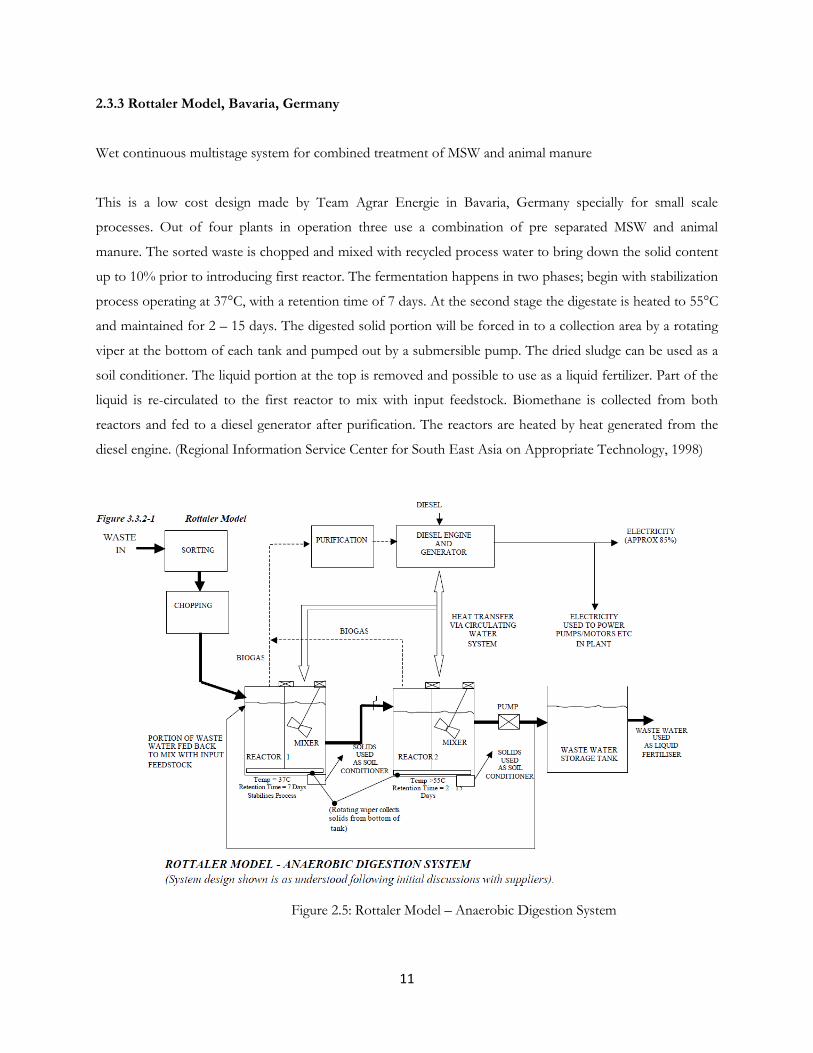
2.3.3 Rottaler Model, Bavaria, Germany
Wet continuous multistage system for combined treatment of MSW and animal manure
This is a low cost design made by Team Agrar Energie in Bavaria, Germany specially for small scale
processes. Out of four plants in operation three use a combination of pre separated MSW and animal
manure. The sorted waste is chopped and mixed with recycled process water to bring down the solid content
up to 10% prior to introducing first reactor. The fermentation happens in two phases; begin with stabilization
process operating at 37°C, with a retention time of 7 days. At the second stage the digestate is heated to 55°C
and maintained for 2 – 15 days. The digested solid portion will be forced in to a collection area by a rotating
viper at the bottom of each tank and pumped out by a submersible pump. The dried sludge can be used as a
soil conditioner. The liquid portion at the top is removed and possible to use as a liquid fertilizer. Part of the
liquid is re-circulated to the first reactor to mix with input feedstock. Biomethane is collected from both
reactors and fed to a diesel generator after purification. The reactors are heated by heat generated from the
diesel engine. (Regional Information Service Center for South East Asia on Appropriate Technology, 1998)
Figure 2.5: Rottaler Model – Anaerobic Digestion System
12
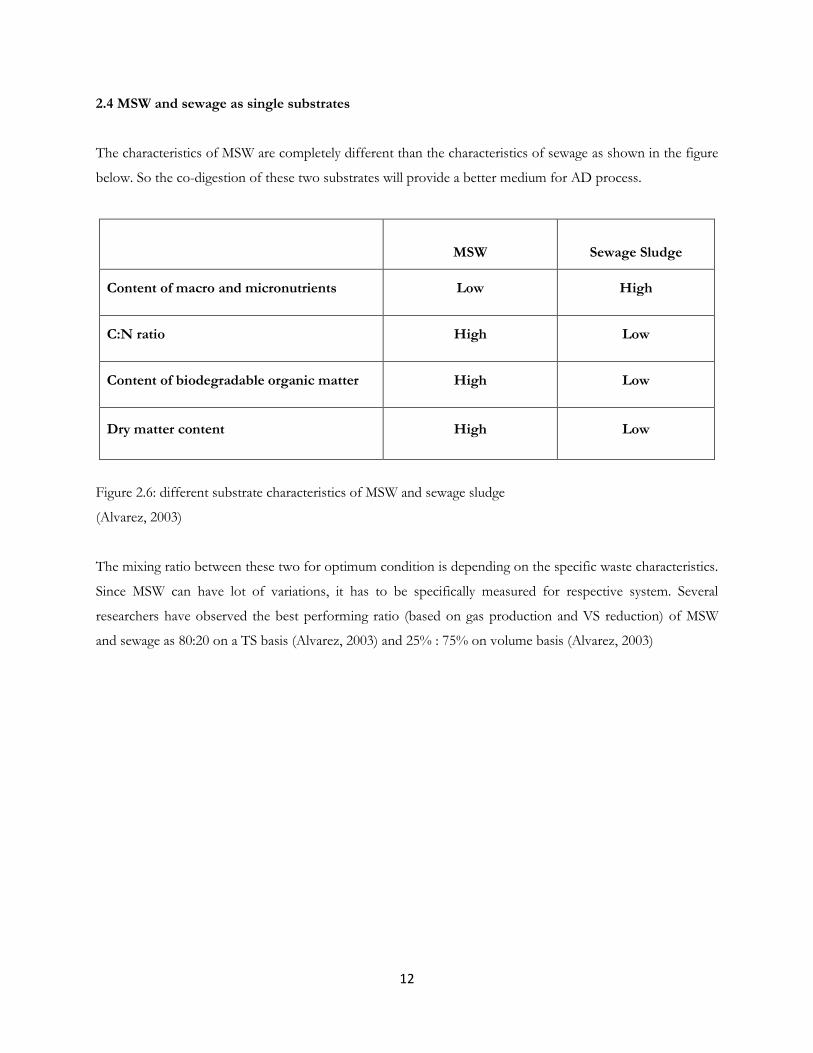
2.4 MSW and sewage as single substrates
The characteristics of MSW are completely different than the characteristics of sewage as shown in the figure
below. So the co-digestion of these two substrates will provide a better medium for AD process.
MSW
Sewage Sludge
Content of macro and micronutrients Low High
C:N ratio High Low
Content of biodegradable organic matter High Low
Dry matter content High Low
Figure 2.6: different substrate characteristics of MSW and sewage sludge
(Alvarez, 2003)
The mixing ratio between these two for optimum condition is depending on the specific waste characteristics.
Since MSW can have lot of variations, it has to be specifically measured for respective system. Several
researchers have observed the best performing ratio (based on gas production and VS reduction) of MSW
and sewage as 80:20 on a TS basis (Alvarez, 2003) and 25% : 75% on volume basis (Alvarez, 2003)
13
2.5 Co-digestion of MSW with sewage – International context
2.5.1 Refcom project - United States
This is one of the first large scale co-digestion plants commissioned in the1980s.
(Alvarez, 2003)
2.5.2 Grindsted municipal area - Denmark
In this plant MSW is co-digested with sewage and small amount of industrial organic waste. The plant is used
1500 tons of MSW collected from 6200 houses per year. The waste is source separated in paper bags at
houses itself by educating them to do so. Metal impurities are removed Furthermore the metal impurities are
removed before mix with sewage sludge and then glass and stones are removed.
Key features
Mixing ratio of MSW : Sewage sludge is 1 : 9
Dry matter content is 8 – 10%.
Hygienization done for 1 hour at 70 0C
Digestion takes place at mesophilic conditions at 35 0C
Biogas yield is 25 m3 per 1 m3 of influent
TS content is reduced to 3% by treatment
(Alvarez, 2003)
14
2.5.3 Vaasa Plant – Finland
This is one of the first co-digestion plants in Europe commissioned in 1989. The plant is used several waste
types such as MSW, thickened sewage sludge, slaughterhouse waste, fish waste and manure.
Key features
Wet digestion process is used
Dry matter content is 10 – 15%
Two parallel reactors are used for mesophilic and thermophilic reactions.
Small portion of liquid from the digested slurry is mixed back to the input feedstock.
(Alvarez, 2003).
15
2.6 Co-digestion of MSW with sewage – Sri Lankan context
There is lack of co-digestion experiences for sewage & MSW documented in Sri Lankan context, but co-
digestion practices were observed for some other waste types.
The development of Sri Lankan dry batch biogas unit (http://www.kulasinghe.com/main.htm) is done by
National Engineering Research Development Centre (NERD) which is the pioneer research institute for
biogas in Sri Lanka. The NERD batch dry system can feed straw, MSW and water born plants, water hyacinth
as their main digestive material. At the International Inventors competition held in Switzerland in 1996,
NERD won the Silver Award for this design. But it was argued by a study conducted by the Wageningen
University in 2005 that the NERD batch dry system is not properly designed and anaerobic digestion of
biodegradable waste is fails in this reactor. At the end of this research, It was concluded that the biogas
technology is not yet successful in this system due to various reasons as mentioned below. (Muller (2007))
The system is not properly designed
Operational management failures to provide source separated biodegradable waste and operation of
the system
Lack of expert knowledge and necessary skills of digester technology in Sri Lanka.
16

17
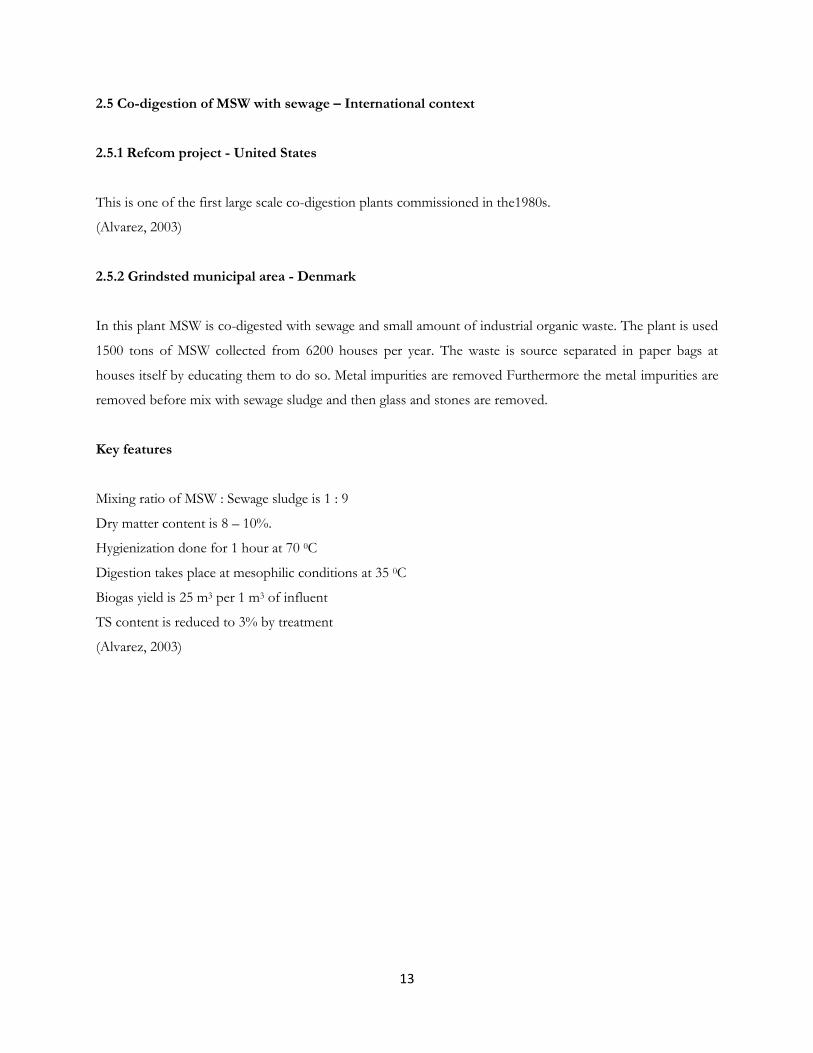
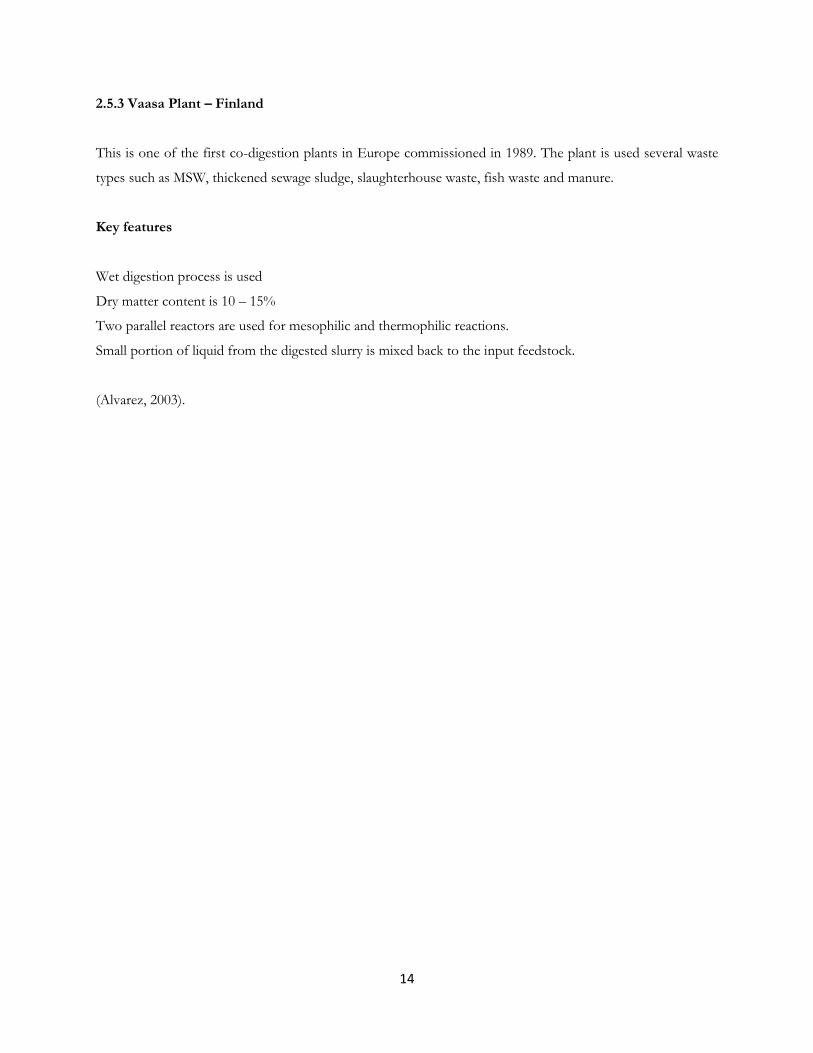
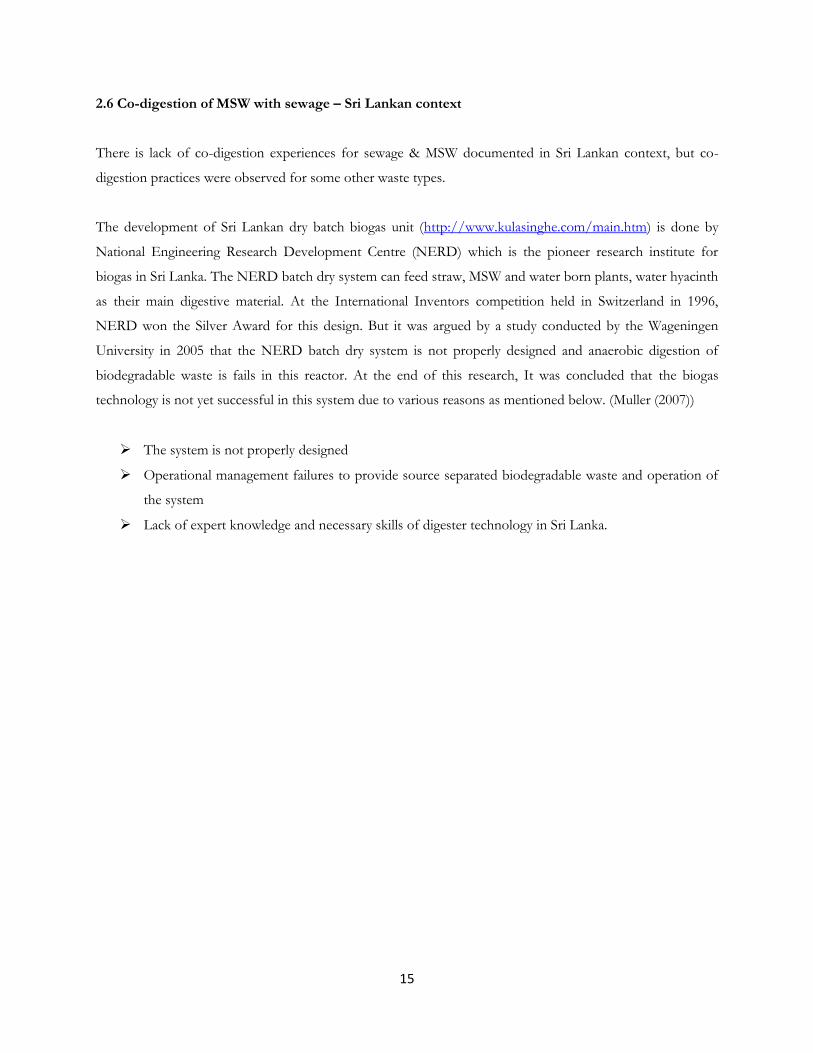
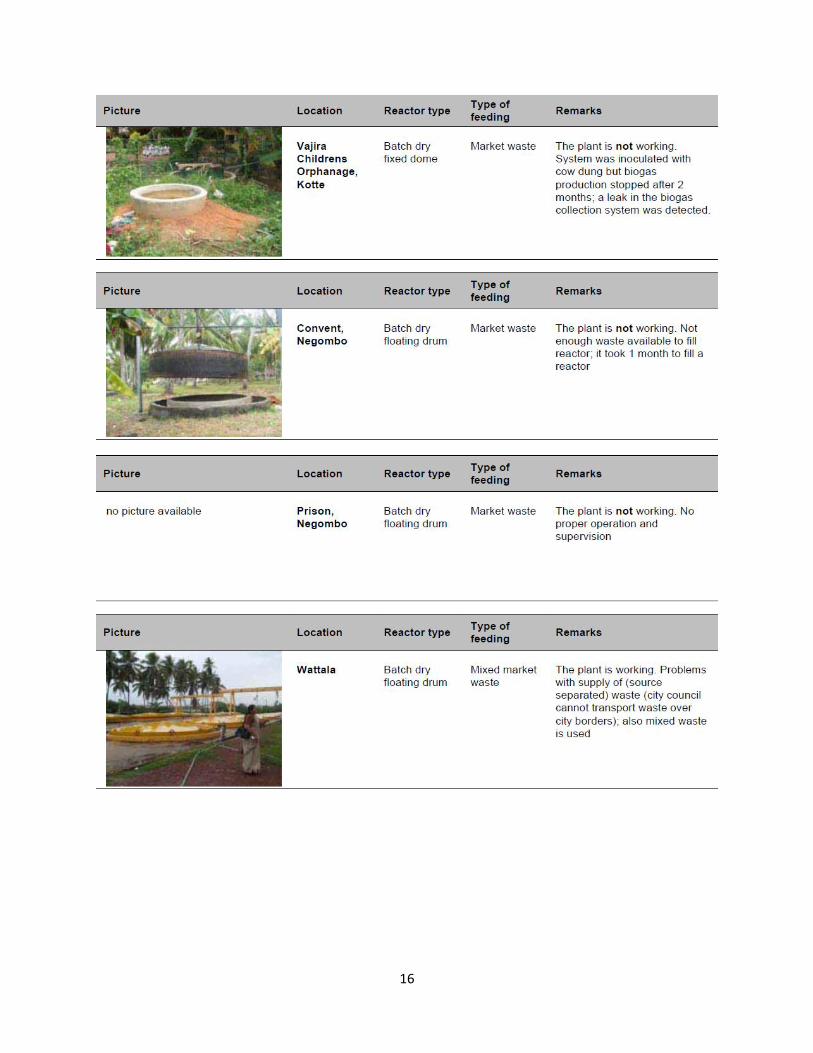
Figure 2.7: Status of existing bio gas plants in Sri Lanka.
18
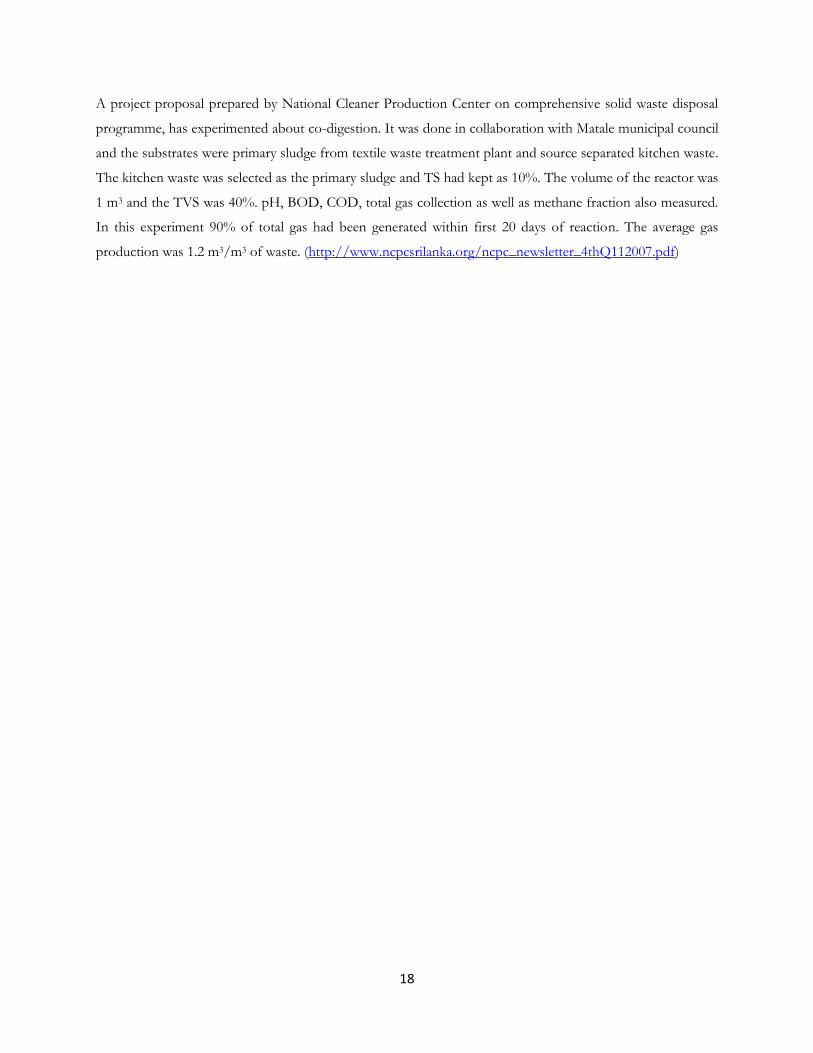
A project proposal prepared by National Cleaner Production Center on comprehensive solid waste disposal
programme, has experimented about co-digestion. It was done in collaboration with Matale municipal council
and the substrates were primary sludge from textile waste treatment plant and source separated kitchen waste.
The kitchen waste was selected as the primary sludge and TS had kept as 10%. The volume of the reactor was
1 m3 and the TVS was 40%. pH, BOD, COD, total gas collection as well as methane fraction also measured.
In this experiment 90% of total gas had been generated within first 20 days of reaction. The average gas
production was 1.2 m3/m3 of waste. (http://www.ncpcsrilanka.org/ncpc_newsletter_4thQ112007.pdf)

19
2.7 Parameters that can affect the anaerobic co-digestion
Mixing ratio of MSW and sewage sludge
COD value of leachate
Total solids content of leachate
Volatile solid content
Temperature
pH value
HRT
Characteristics of MSW
Volatile Fatty Acids in leachate
Mixing and mixing speed
C:N ratio
2.8 Strategy of optimization
The optimization of co-digestion process for combined treatment of MSW and sewage sludge is done
experimentally at biogas test bench at University of Moratuwa. The optimization is decided based on the
quantitative and qualitative results of collected biogas of each substrate. Further the treatment parameters
such as BOD & COD reduction, TS & TVS reduction were considered to decide optimum mixing ratio of
MSW & SS.

20
Chapter 03
Methodology and Experimental Setup
3.1 Reactor preparation
The process is selected as semi continuous. Three reactors were selected in order to have three different
mixing ratios of MSW and sewage sludge.
1000 ml glass bottle was used as the reactor and the lid had two silicone ports to collect gas and to introduce
substrates. The gas was collected to a floating collector and facilitated with a 60 ml syringe to measure the gas
volume. There was another port connected to the tube between syringe and gas collector in order to remove
generated gas when needed. All the tube connections were properly sealed by silicone and two ports for gas
removal and substrate transfer are properly closed by valves. All ports and lids were checked for the leakages
by using a soap solution and gas filled systems were kept for three days prior to filling substrates to assure
that it was fully leak proof.

21
3.2 Waste material preparation and loading
3.2.1. MSW Sample preparation:
The sample of MSW was taken from the garbage dumping yard at University of Moratuwa. It is mainly
consist of raw vegetable and fruit waste, waste food such as rice and curries, and little amount of waste
papers.
Raw MSW was chopped properly in order to ease the work of the blender. Then it was mixed with 1 liter of
water. The prepared mixture is introduced to the blender while adding some water in order to have proper
blending conditions. The blending is continued until all the solids converted in to liquid phase slurry. Water
was added from a 1.5 L bottle hence the added quantity is quantified. 6 liters of water had to be added to
blend 1.5 kg of waste completely. Prepared MSW sample was filled in bottles and lid was kept partially closed.
All the samples were stored in a refrigerator below 40C.
3.2.2. Preparation of sewage sludge sample
Primary sewage sludge was taken from anoxic tank at sewage treatment plant at Hibiscus Beach Hotel,
Wadduwa. 300 grams of sewage sludge was measured and diluted with 1 l of water.
3.2.3 Bacterial Culture (Innoculum)
The bacteria culture was obtained from UASB plant at Elephant House factory, Ranala. All samples were
stored in the refrigerator at University of Moratuwa, under 40C in order to control the bacterial activities. The
initial tests were done for both samples separately by standard methods to identify TS. The samples are kept
until it becomes to room temperature prior to use it for testing and sampling.
3.2.4 Identification of TS
Six numbers of sample dishes were cleaned dried and measured the weight for three decimal places by an
electronic balance. 10 ml of MSW sample was measured and added in to the sample disc. All the remaining
solids trapped in the measuring flask were taken by mixing with some water. Then the prepared samples were
kept in the oven at 1050C. The samples were kept for 24 hours and measured the weight. The samples were
kept in the oven again for two hours and weight is measured in order to verify the accuracy of results. Since
the both readings present the same value it has been taken as the final weight. The difference of this value
and the initial weight of empty disc is the weight of solids in 10 ml of sample.

22
Similarly the TS value of SS also measured. The mixing proportions of each substrate will be decided based
on the TS value of each.
3.2.5 pH Adjustment
Initial pH was tested in each sample prior to feeding. The volume of Calcium Hydroxide needed to adjust the
pH of 50 ml of each sample was measured. Then the pH value of the bulk samples were adjusted by dosing
Calcium Hydroxide ( Ca(OH)2 ) up to 6.8.
3.2.6 Preparing Calcium Hydroxide solution
25 g of Calcium Hydroxide powder was diluted in 500 ml of DI water. Then the mixture is kept 10 minutes
for settling. Once the powder is settled at the bottom the liquid portion is collected to another flask. Then it
was filtered by filter papers to another bottle. The pH value of the clear solution was 12.5.
3.2.7. TS adjustment
The TS value of three samples was changed after addition of Calcium Hydroxide. Since the Ca(OH)2 solution
is a clear liquid with least solids, TS value is considered as zero. Then the TS will be changed only with
volumes of Calcium Hydroxide. Considering that, the new TS values will be calculated.
3.2.8 Test sample preparation
The substrates of reactors were prepared while keeping pH and TS values equal. First the pH is balanced to
6.8 and then the dosing volume of each substrate is calculated to keep the TS equal. 300 ml of inoculum was
introduced to all three reactors. The dosing volume of substrate S1 is selected as 10 ml per day. The dosing
volume of S2 and S3 is calculated. The feeding is continued for 20 days without removing the substrate.
Annexure 01 illustrates the feeding schedule of substrates.
3.3 Continuous Feeding Plan After 20th day the continuous process is started. The retention time is taken as 20 days. Hence 5% of digested
slurry is removed and 5% of fresh substrate is added from the same port. Then the substrates inside the
reactor are mixed properly. This process is continued for 11 days as a continuous process.

23
3.4 Analysis of gas composition The collected gas is analyzed by gas chromatograph to identify methane and carbon dioxide ratios.
24
Chapter 4 Results and Analyses
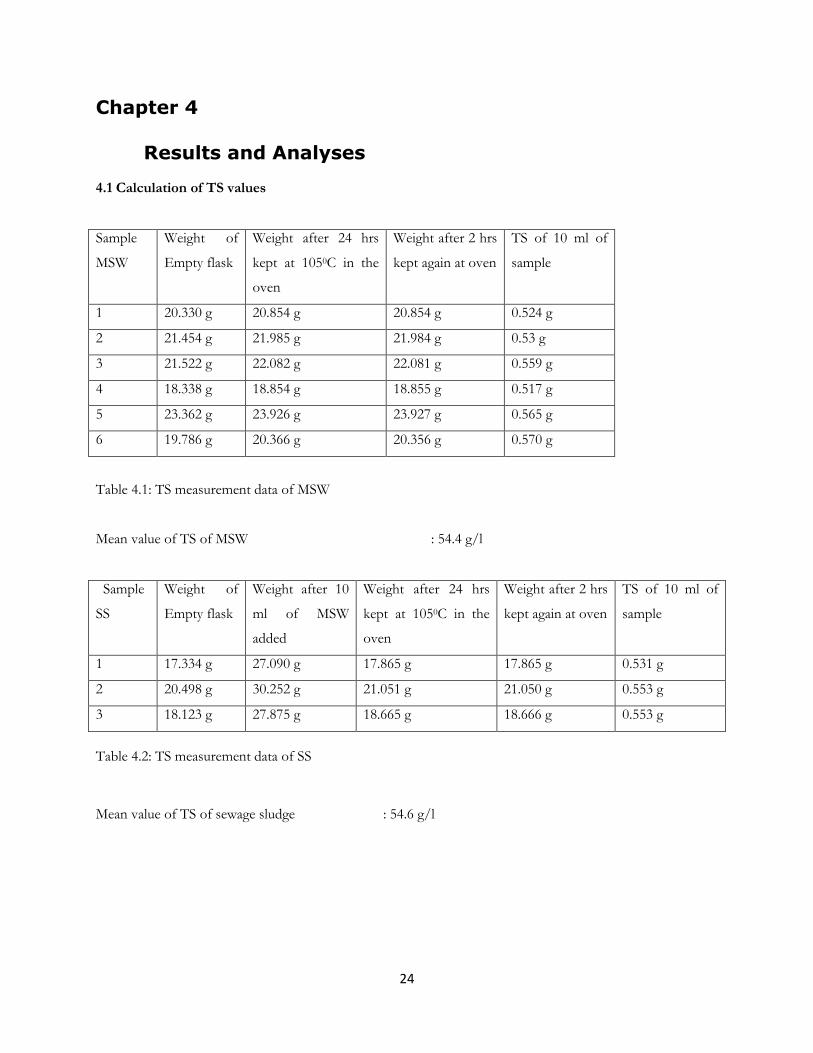
4.1 Calculation of TS values
Sample
MSW
Weight of
Empty flask
Weight after 24 hrs
kept at 1050C in the
oven
Weight after 2 hrs
kept again at oven
TS of 10 ml of
sample
1 20.330 g 20.854 g 20.854 g 0.524 g
2 21.454 g 21.985 g 21.984 g 0.53 g
3 21.522 g 22.082 g 22.081 g 0.559 g
4 18.338 g 18.854 g 18.855 g 0.517 g
5 23.362 g 23.926 g 23.927 g 0.565 g
6 19.786 g 20.366 g 20.356 g 0.570 g
Table 4.1: TS measurement data of MSW
Mean value of TS of MSW : 54.4 g/l
Sample
SS
Weight of
Empty flask
Weight after 10
ml of MSW
added
Weight after 24 hrs
kept at 1050C in the
oven
Weight after 2 hrs
kept again at oven
TS of 10 ml of
sample
1 17.334 g 27.090 g 17.865 g 17.865 g 0.531 g
2 20.498 g 30.252 g 21.051 g 21.050 g 0.553 g
3 18.123 g 27.875 g 18.665 g 18.666 g 0.553 g
Table 4.2: TS measurement data of SS
Mean value of TS of sewage sludge : 54.6 g/l

25
4.2. pH Adjustment
Sample Initial pH Ca(OH)2 dosage Final pH
S1 (50:50) 6.72 30 ml 6.80
S2 (60:40) 6.63 60 ml 6.80
S3 (80:20) 6.26 160 ml 6.80
Table 4.3: pH adjustment
4.3. TS adjustment
Sample Initial TS of 1000 ml Ca(OH)2 dosage Final TS
S1 (50:50) 54.6 g/l 30 ml 53.01 g/l
S2 (60:40) 54.6 g/l 60 ml 51.51 g/l
S3 (80:20) 54.6 g/l 160 ml 47.07 g/l
Table 4.4: TS adjustment
Assumption: TS value of Calcium Hydroxide was neglected since it is very similar to clean water.
4.3.1 Adjusted dosing volumes
Day Initial feed volume of
substrate
Adjusted volume of
S1
Adjusted volume of
S2
Adjusted volume of
S3
1-20 10 ml 10 ml 10.29 ml 11.26 ml
Table 4.5: Adjustment of dosage
26
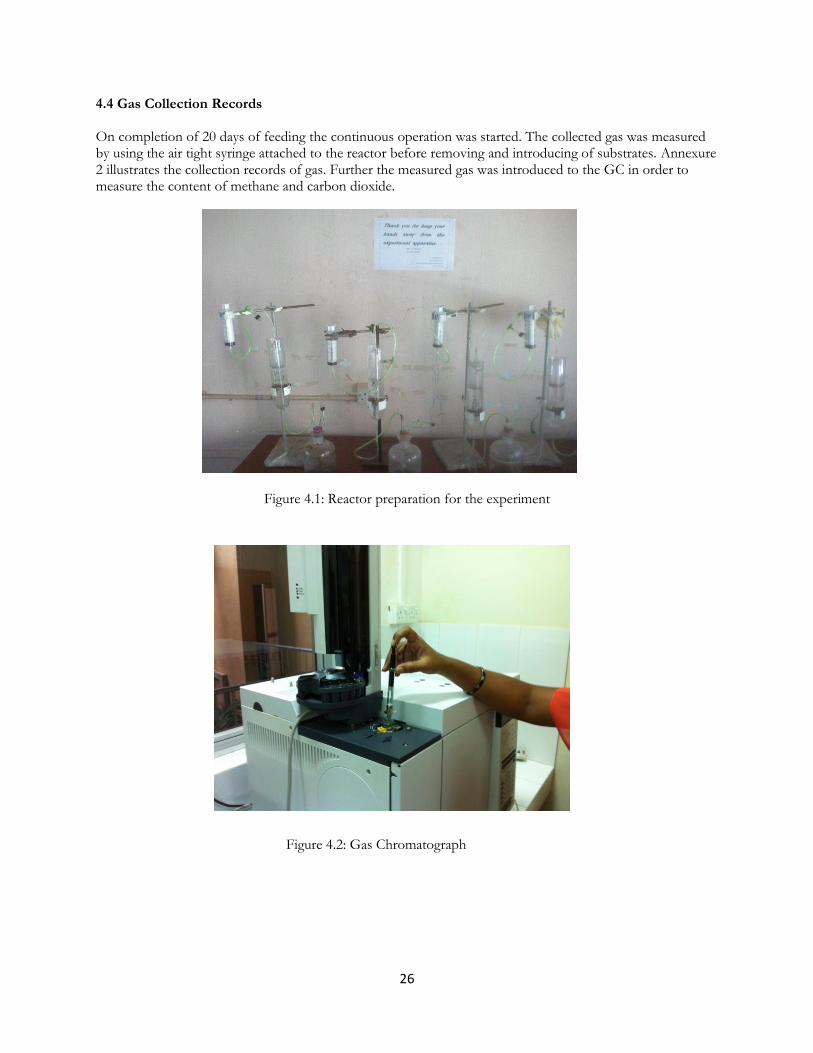
4.4 Gas Collection Records On completion of 20 days of feeding the continuous operation was started. The collected gas was measured by using the air tight syringe attached to the reactor before removing and introducing of substrates. Annexure 2 illustrates the collection records of gas. Further the measured gas was introduced to the GC in order to measure the content of methane and carbon dioxide.
Figure 4.1: Reactor preparation for the experiment Figure 4.2: Gas Chromatograph

27
Figure 4.3: Graphical Representation of Gas Collection Figure 4.4: Cumulative Gas Collection

28
4.5 COD measurement FAS – Ferrous Ammonium Sulfate Molarity of FAS solution = M
M = 0.1111
A – Volume of FAS used in the blank sample
B – Volume of FAS used in the original Sample
= 142.208 Dilution factor = 250
COD = 35552 mg/l
Similarly,
COD of sample 2 (S2) = 62216 mg/l
COD of sample 3 (S3) = 42221.8 mg/l
COD of innoculum = 39999.6 mg/l
COD of feed sample 1(S1) = (1.5 – 1.05)*0.1111*8000/2.5 = 39999.6 mg/l COD of digested sludge S2 = 35552 mg/l COD of digested sludge S3 = 26664 mg/l

29
4.5.1 Soluble COD Dilution factor = 50
Sample 1 (S1) =
= 12740 mg/l
Sample 2 (S2) = 14517.7 mg/l Sample 3 (S3) = 15998.4 mg/l Soluble COD at digested samples Dilution factor = 40 for S1
10 for S2
5 for S3
Sample 1 (S1) = 3910.7 mg/l
Sample 2(S2) = 1066.6 mg/l
Sample 3(S3) = 770.2 mg/l
Sample
COD mg/l
At beginning After 11 days digestion COD Reduction
S1 35552 31108 4444 (12.5%)
S2 39996 29330.4 10665.6 (26.67%)
S3 42221.8 26664 15557.8 (36.85%)
Table 4.6: Summary of COD Measurements
Sample
Soluble COD mg/l
At beginning After 11 days digestion COD Reduction
S1 12740 3910.7 8829.3 (69.30%)
S2 14517.7 1066.6 13451.1 (92.65%)
S3 15998.4 770.2 15228.2 (95.19%)
Table 4.7: Summary of Soluble COD Measurements

30
4.6 TS & TVS calculation
Sample Weight of empty dish
Weight with 25 ml after 24hrs at 1050C
Weight after kept at 5500C for 20 min
TS (g/l) TVS (g/l)
S1-1 42.482 43.410 42.652 37.12 30.32
S1-2 40.213 41.091 40.382 35.12 28.36
S1-3 43.794 44.712 43.979 36.72 29.32
S2-1 16.812 17.584 16.982 30.88 24.76
S2-2 20.267 21.058 20.442 31.64 25.36
S3-1 23.356 24.032 23.498 27.04 21.36
S3-2 18.422 19.087 18.542 26.6 21.8
Table 4.8: TVS of Digested samples
Sample Weight of empty dish
Weight with 25 ml after 24hrs at 1050C
Weight after kept at 5500C for 20 min
TS TVS g/l
1-1 62.795 64.120 62.966 53 46.17
1-2 17.343 18.668 17.511 53 46.28
2-1 65.227 66.552 65.381 53 46.84
2-2 20.509 21.834 20.670 53 46.56
3-1 64.447 65.772 64.608 53 46.56
3-2 18.134 19.459 18.257 53 48.08
Table 4.9: TVS of feed samples
Sample
Initial TS (g/l) Final TS (g/l) TS Reduction (g/l)
S1
53 36.32 16.68 (31.47%)
S2
53 31.26 21.74 (41.02%)
S3
53 26.82 26.18 (49.4%)
Table 4.10: Average values of TS
31
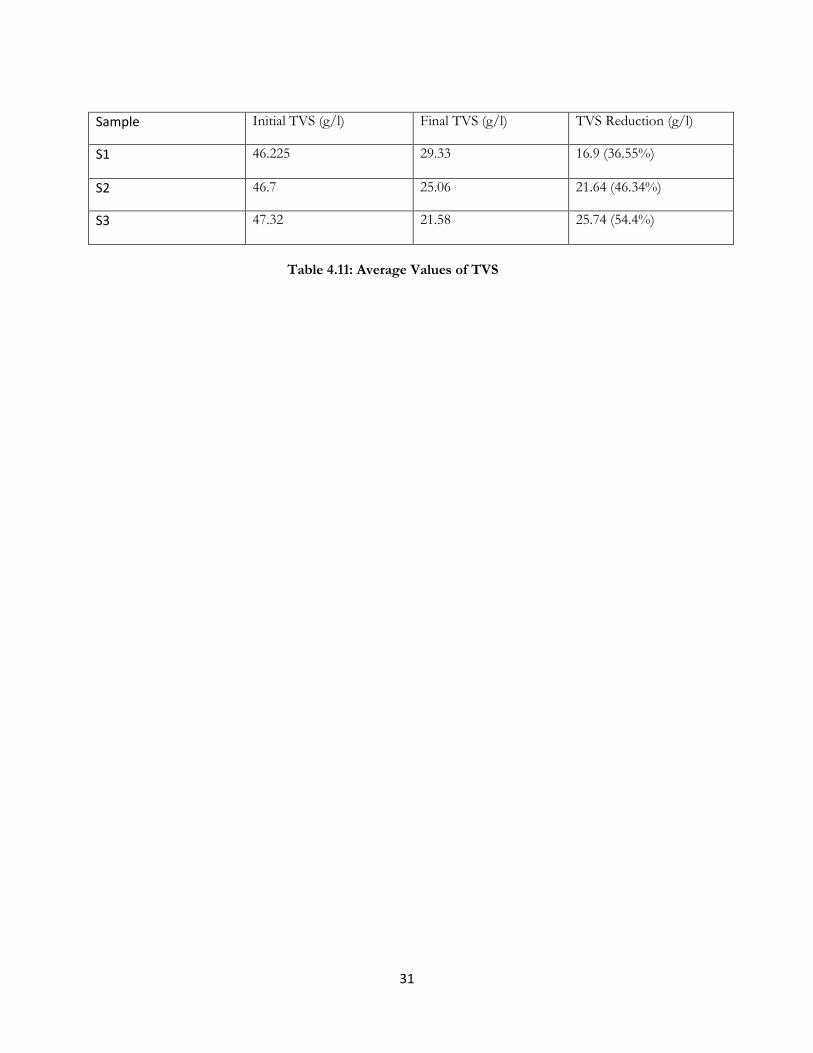
Sample Initial TVS (g/l) Final TVS (g/l) TVS Reduction (g/l)
S1 46.225 29.33 16.9 (36.55%)
S2 46.7 25.06 21.64 (46.34%)
S3 47.32 21.58 25.74 (54.4%)
Table 4.11: Average Values of TVS
32
Chapter 5
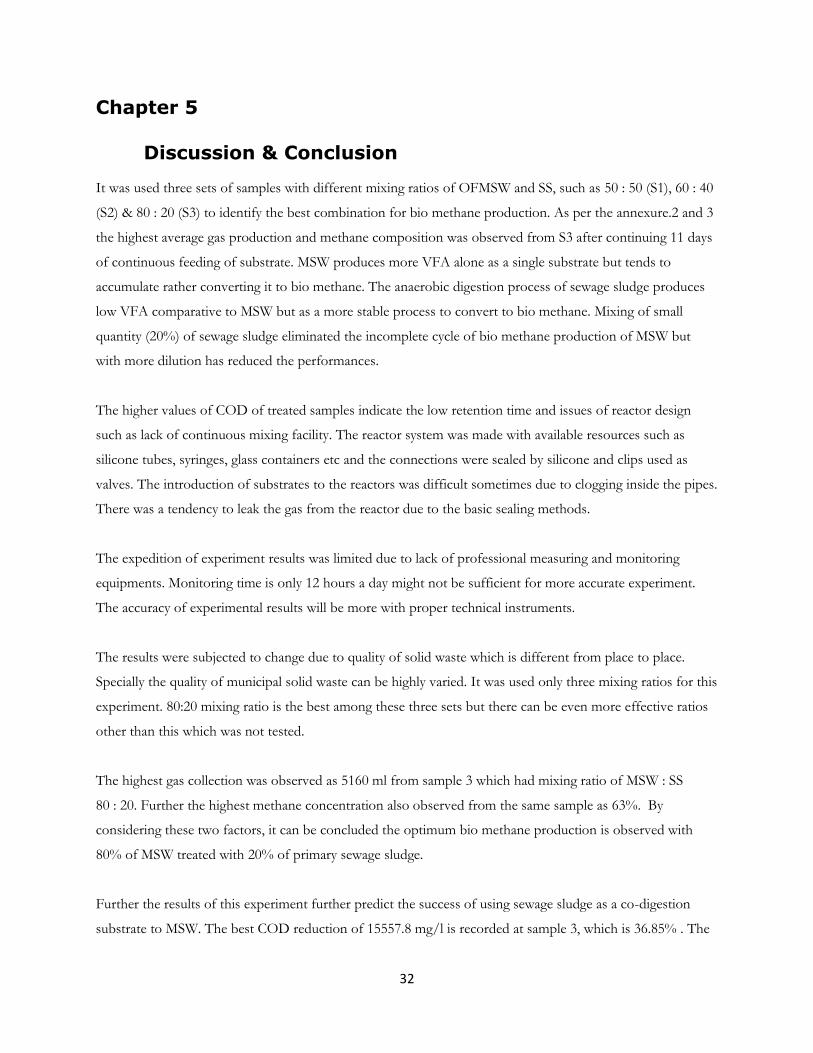
Discussion & Conclusion It was used three sets of samples with different mixing ratios of OFMSW and SS, such as 50 : 50 (S1), 60 : 40
(S2) & 80 : 20 (S3) to identify the best combination for bio methane production. As per the annexure.2 and 3
the highest average gas production and methane composition was observed from S3 after continuing 11 days
of continuous feeding of substrate. MSW produces more VFA alone as a single substrate but tends to
accumulate rather converting it to bio methane. The anaerobic digestion process of sewage sludge produces
low VFA comparative to MSW but as a more stable process to convert to bio methane. Mixing of small
quantity (20%) of sewage sludge eliminated the incomplete cycle of bio methane production of MSW but
with more dilution has reduced the performances.
The higher values of COD of treated samples indicate the low retention time and issues of reactor design
such as lack of continuous mixing facility. The reactor system was made with available resources such as
silicone tubes, syringes, glass containers etc and the connections were sealed by silicone and clips used as
valves. The introduction of substrates to the reactors was difficult sometimes due to clogging inside the pipes.
There was a tendency to leak the gas from the reactor due to the basic sealing methods.
The expedition of experiment results was limited due to lack of professional measuring and monitoring
equipments. Monitoring time is only 12 hours a day might not be sufficient for more accurate experiment.
The accuracy of experimental results will be more with proper technical instruments.
The results were subjected to change due to quality of solid waste which is different from place to place.
Specially the quality of municipal solid waste can be highly varied. It was used only three mixing ratios for this
experiment. 80:20 mixing ratio is the best among these three sets but there can be even more effective ratios
other than this which was not tested.
The highest gas collection was observed as 5160 ml from sample 3 which had mixing ratio of MSW : SS
80 : 20. Further the highest methane concentration also observed from the same sample as 63%. By
considering these two factors, it can be concluded the optimum bio methane production is observed with
80% of MSW treated with 20% of primary sewage sludge.
Further the results of this experiment further predict the success of using sewage sludge as a co-digestion
substrate to MSW. The best COD reduction of 15557.8 mg/l is recorded at sample 3, which is 36.85% . The
33
soluble COD reduction of S3 was 15228.2 mg/l which is the best reduction among all three sets with a
95.19% reduction. The best TS reduction was 26.18 g/l with 49.4% reduction rate at S3. The TVS reduction
also best at S3 with 25.74 g/l reduction and 54.4% reduction rate. Hence By considering results of TS
reduction rate, TVS reduction rate, COD reduction rate and soluble COD reduction rate, it’s evident that
mixing ratio of 80:20 (MSW: SS) is the best ratio for combine treatment of MSW and SS.
34
References
Agilent Technologies Inc. 2011. Agilent 7890A Network Gas Chromatograph [online] [Accessed on 22 April
2016] Available from https://www.agilent.com/cs/library/datasheets/public/5989-6317EN.pdf
Agilent Technologies Inc.2010. Simultaneous Analysis of Greenhouse Gases by Gas Chromatography
[Online] [Accessed on 22 April 2016] Available from http://www.chem-agilent.com/pdf/5990-5129EN.pdf
A.I. Garcia, X. Gomez, A. Moran, M. Otero. 2010. Anaerobic Co-digestion of sewage sludge and organic fraction of municipal solid wastes: Different proportions of sludge in the mixture.
Amirhossein Malakahmad, Noor Ezlin Ahmad Basri, Sharom Md Zain. 2007. Anaerobic co-digestion of
kitchen waste and sewage sludge for producing biogas. PP 48-50.
Andrew D. Eaton, Lenore S. Clesceri, Arnold E. Greenberg, M. A. H. Franson. 1995. Standard Methods for
the Examination of Water and Wastewater. American Public Health Association
Christian Müller. 2007. Anaerobic Digestion of Biodegradable Solid Waste in Low- and Middle-Income
countries. PP 60
Giovanni Esposito, Luigi Frunzo, Antonio Panico and Francesco Pirozzi. 2012. Enhanced bio-methane
production from co-digestion of different organic wastes.
J. C. Costa, D. Z. Sousa, M. A. Pereira, A. J. M. Stams and M. M. Alves. 2013. Biomethanation Potential of
Biological and Other Wastes/Chapter 15.
J Mata Alvarez. 2003. Biomethanization of the Organic Fraction of Municipal Solid Wastes.
[Online].[Accessed on 13April2011]. Available from http://areascontaminadas.cetesb.sp.gov.br/.,
PP 188, 195-196
Levien van Zon & Nalaka Siriwardena. 2000. IRMP Colombo. Garbage in Sri Lanka.
National Cleaner Production Center Sri Lanka, News Letter. 2007. [Online]. [Accessed on 20April2011].
Available from http://www.ncpcsrilanka.org/ncpc_newsletter_4thQ112007.pdf/ Volume 04.

35
Nirawan Sanphoti1, Sirintornthep Towprayoon, Pawinee Chaiprasert, Annop Nopharatana. 2007
Anaerobic co-digestion of organic municipal solid waste and sewage sludge.
ICEE2007137-411, PP 1
Regional Information Service Center for South East Asia on Appropriate Technology. 1998
Review of Current Status of Anaerobic Digestion Technology for Treatment of Municipal Solid Waste.,
PP 10-11, 15-16
Wei Wu. 2007. [Online]. [Accessed on 13April2011]. Anaerobic Co-digestion of Biomass for Methane
Production: Recent Research Achievements. Available from
https://www.researchgate.net/file.PostFileLoader.html
W Schmidell, AM Craveiro, CS Peres, YS Hirata, RF Varella. 1986. Anaerobic digestion of municipal solid
wastes. Water Science and Technology 18 (12)., PP 163-175
36
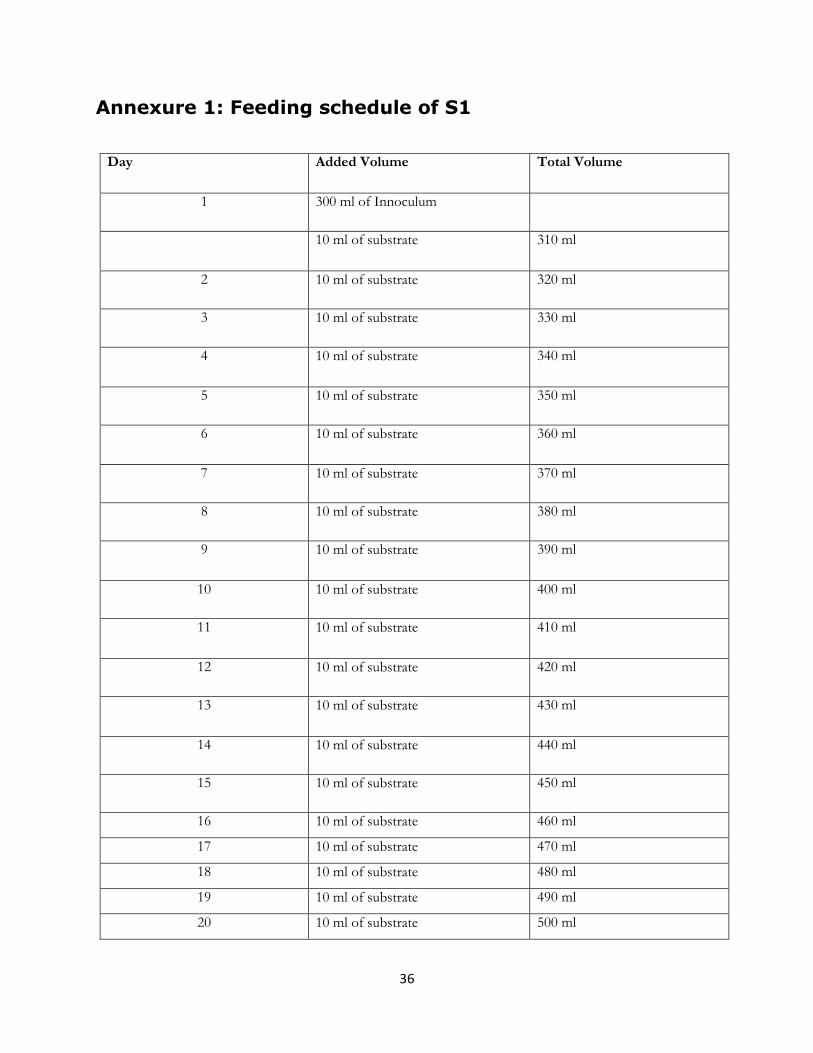
Annexure 1: Feeding schedule of S1
Day Added Volume Total Volume
1 300 ml of Innoculum
10 ml of substrate 310 ml
2 10 ml of substrate 320 ml
3 10 ml of substrate 330 ml
4 10 ml of substrate 340 ml
5 10 ml of substrate 350 ml
6 10 ml of substrate 360 ml
7 10 ml of substrate 370 ml
8 10 ml of substrate 380 ml
9 10 ml of substrate 390 ml
10 10 ml of substrate 400 ml
11 10 ml of substrate 410 ml
12 10 ml of substrate 420 ml
13 10 ml of substrate 430 ml
14 10 ml of substrate 440 ml
15 10 ml of substrate 450 ml
16 10 ml of substrate 460 ml
17 10 ml of substrate 470 ml
18 10 ml of substrate 480 ml
19 10 ml of substrate 490 ml
20 10 ml of substrate 500 ml

37
Annexure 2: Gas collection records
S1 (50:50) ml S2 (60:40) ml S3 (80:20) ml
Day 1 277 377 442
Day 2 294 398 351
Day 3 327 534 493
Day 4 285 337 504
Day 5 274 378 467
Day 6 288 404 492
Day 7 273 349 451
Day 8 271 372 493
Day 9 295 394 481
Day 10 252 358 453
Day 11 287 432 533
Total 3123 4333 5160
38
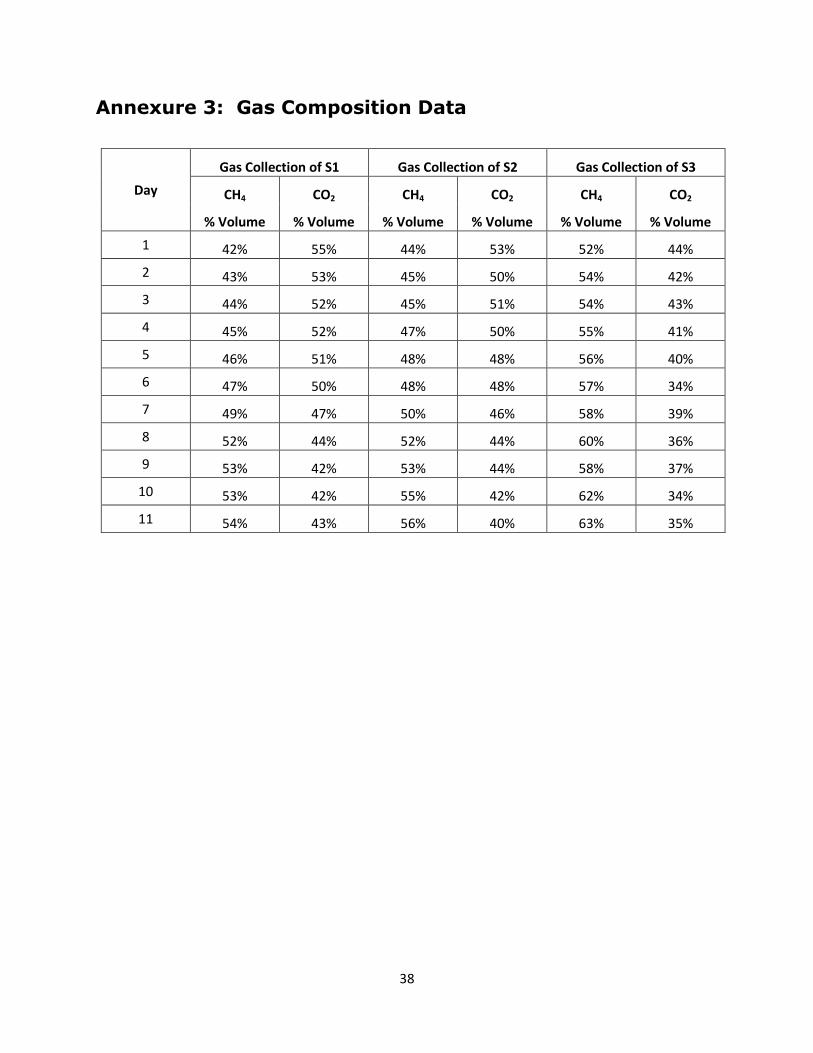
Annexure 3: Gas Composition Data
Day
Gas Collection of S1 Gas Collection of S2 Gas Collection of S3
CH4 CO2 CH4 CO2 CH4 CO2
% Volume % Volume % Volume % Volume % Volume % Volume
1 42% 55% 44% 53% 52% 44%
2 43% 53% 45% 50% 54% 42%
3 44% 52% 45% 51% 54% 43%
4 45% 52% 47% 50% 55% 41%
5 46% 51% 48% 48% 56% 40%
6 47% 50% 48% 48% 57% 34%
7 49% 47% 50% 46% 58% 39%
8 52% 44% 52% 44% 60% 36%
9 53% 42% 53% 44% 58% 37%
10 53% 42% 55% 42% 62% 34%
11 54% 43% 56% 40% 63% 35%

39
Annexure 4: pH variation inside the reactors
Date Inside the reactor
S1 S2 S3
1st day 6.89 6.74 6.8
4th day 6.98 6.97 6.90
7th day 7.36 7.23 7.13
9th day 7.06 7.26 7.18
11th day 7.16 7.16 7.09