Optimization of a solar chimney design to enhance natural ... · design will be tested at the final...
10
Optimization of a solar chimney design to enhance natural ventilation in a multi-storey office building M. Gontikaki BSc. dr. Dipl.-Ing. M. Trcka prof.dr.ir. J.L.M. Hensen Ir. Pieter-Jan Hoes Unit Building Physics and Systems Eindhoven University of Technology Eindhoven, Netherlands ABSTRACT Natural ventilation of buildings can be achieved with solar-driven, buoyancy-induced airflow through a solar chimney channel. Research on solar chimneys has covered a wide range of topics, yet study of the integration in multi-storey buildings has been performed in few numerical studies, where steady-state conditions were assumed. In practice, if the solar chimney is to be used in an actual building, dynamic performance simulations would be required for the specific building design and climate. This study explores the applicability of a solar chimney in a prototype multi-storey office building in the Netherlands. Sensitivity analysis and optimization of the design will be performed via dynamic performance simulations in ESP-r. The robustness of the optimized design will be tested at the final stage, against e.g. windows’ opening by users. This is an ongoing project; calibration of the solar chimney model and preliminary sensitivity analysis results are presented here. INTRODUCTION The exploitation of sustainable energy sources to cover the functional demands of buildings (for heating, ventilation, cooling etc) can contribute to significant energy savings and thus to alleviation of the current environmental, economical and social problems related to conventional energy practices. Passive (natural) ventilation of buildings is a successful means to save energy otherwise consumed for mechanical ventilation and/or cooling. Solar chimneys (SC) are passive elements that make use of the solar energy to induce buoyancy-driven airflow and naturally ventilate the building. A SC differs to a conventional chimney in that at least one wall is made transparent; solar radiation enters the chimney through the glazed part and heats up the walls. The temperature of the air inside the SC channel rises due to heat transfer from the walls and the resulting buoyancy drives the airflow through the channel. The SC pulls air from the interior of the building, which is replaced by fresh air through openings or other paths, and natural ventilation is accomplished. Performance of the SC is primarily described by the induced ventilation flow rates; in case heat harvesting is also of interest, air temperature in the channel is the other important performance indicator. The geometry of the SC channel is described by its height, length and cavity width. The elements of the SC are presented in Fig. 1; the terms indicated in Fig. 1 will be used in the following sections to refer to the solar chimney’s parts and geometrical features. Integration of a solar chimney in a building is possible in many ways (Fig. 2), e.g. as part of the south-facing façade (or the façade where maximum solar availability applies), on the roof (also known as ‘roof solar chimney’), in the place of a conventional chimney or as extension of a double façade (usually for multi-storey buildings). The present study explores the passive ventilation potential of a SC integrated in a multi- storey office building in the Netherlands. It forms part of a broader project under the name ‘Earth, Wind & Fire’, concerning the exploitation of solar, geothermal and wind energy in a prototype building. This is an ongoing research and results are not yet available. The following sections present an extensive literature review, the applied methodology and envisaged results. Figure 1. Cross-section and top view of a SC. Figure 2. Integration possibilities of SC in buildings.
Transcript of Optimization of a solar chimney design to enhance natural ... · design will be tested at the final...

Optimization of a solar chimney design to enhance natural ventilation in a multi-storey
office building
M. Gontikaki BSc. dr. Dipl.-Ing. M. Trcka prof.dr.ir. J.L.M. Hensen Ir. Pieter-Jan Hoes
Unit Building Physics and Systems
Eindhoven University of Technology
Eindhoven, Netherlands
ABSTRACT
Natural ventilation of buildings can be achieved with solar-driven, buoyancy-induced airflow through a solar
chimney channel. Research on solar chimneys has covered a wide range of topics, yet study of the integration in
multi-storey buildings has been performed in few numerical studies, where steady-state conditions were
assumed. In practice, if the solar chimney is to be used in an actual building, dynamic performance simulations
would be required for the specific building design and climate. This study explores the applicability of a solar
chimney in a prototype multi-storey office building in the Netherlands. Sensitivity analysis and optimization of
the design will be performed via dynamic performance simulations in ESP-r. The robustness of the optimized
design will be tested at the final stage, against e.g. windows’ opening by users. This is an ongoing project;
calibration of the solar chimney model and preliminary sensitivity analysis results are presented here.
INTRODUCTION
The exploitation of sustainable energy sources to
cover the functional demands of buildings (for
heating, ventilation, cooling etc) can contribute to
significant energy savings and thus to alleviation of
the current environmental, economical and social
problems related to conventional energy practices.
Passive (natural) ventilation of buildings is a
successful means to save energy otherwise consumed
for mechanical ventilation and/or cooling. Solar
chimneys (SC) are passive elements that make use of
the solar energy to induce buoyancy-driven airflow
and naturally ventilate the building.
A SC differs to a conventional chimney in that at
least one wall is made transparent; solar radiation
enters the chimney through the glazed part and heats
up the walls. The temperature of the air inside the SC
channel rises due to heat transfer from the walls and
the resulting buoyancy drives the airflow through the
channel. The SC pulls air from the interior of the
building, which is replaced by fresh air through
openings or other paths, and natural ventilation is
accomplished. Performance of the SC is primarily
described by the induced ventilation flow rates; in
case heat harvesting is also of interest, air
temperature in the channel is the other important
performance indicator.
The geometry of the SC channel is described by
its height, length and cavity width. The elements of
the SC are presented in Fig. 1; the terms indicated in
Fig. 1 will be used in the following sections to refer
to the solar chimney’s parts and geometrical features.
Integration of a solar chimney in a building is
possible in many ways (Fig. 2), e.g. as part of the
south-facing façade (or the façade where maximum
solar availability applies), on the roof (also known as
‘roof solar chimney’), in the place of a conventional
chimney or as extension of a double façade (usually
for multi-storey buildings).
The present study explores the passive
ventilation potential of a SC integrated in a multi-
storey office building in the Netherlands. It forms
part of a broader project under the name ‘Earth, Wind
& Fire’, concerning the exploitation of solar,
geothermal and wind energy in a prototype building.
This is an ongoing research and results are not yet
available. The following sections present an
extensive literature review, the applied methodology
and envisaged results.
Figure 1. Cross-section and top view of a SC.
Figure 2. Integration possibilities of SC in buildings.
Adelya Khayrullina
Text Box
Gontikaki, M., Trcka, M., Hensen, J.L.M. & Hoes, P. (2010). Optimization of a solar chimney design to enhance natural ventilation in a multi-storey office building. Proceedings of 10th International Conference for Enhanced Building Operations, Kuwait: ICEBO.
LITERATURE REVIEW
General Literature Review
During the past few decades numerous research
studies have been performed on the SC concept, that
have deepened our knowledge on the performance,
the parameters that affect the performance and the
applicability of the system for natural ventilation and
passive cooling of spaces. The studies can fall under
the broad categories of experimental, analytical and
numerical modeling studies. A general overview of
previous studies based on the above categorization
will be presented initially. This section offers a
general impression of the various research topics and
approaches, and no findings will be reported for
brevity reasons. Instead, the findings of parametric
analysis studies and of the ones regarding integration
in multi-storey buildings will be grouped and
presented in two consecutive separate sections, since
they are greatly related to the present study.
Experimental studies.
Field studies concerning the ventilation induced
by SC configurations in a small-scale single-room
house were performed in Thailand (Khedari et al.,
2000). In a consecutive study Khedari et al. (2003)
studied the performance of SC systems in an air-
conditioned small-scale house. Barozzi et al. (1992)
tested a 1:12 small-scale model of a building where
the roof functions as a solar chimney. Hirunlabh et al.
(1999) performed a similar study for a 31m3 volume
house where a metallic solar wall was placed on the
southern façade. Laboratory experiments on small-
scale models were also performed, where temperature
distribution of the air and the walls’ surfaces, the
velocity profile in the chimney’s channel and the
magnitude of the air flow rates were studied, in
combination with parametric analysis (Chen et al.
2003, Burek and Habeb 2007). The performance of a
full-scale 2m high SC that was part of a 12m3 room,
was studied under laboratory conditions by Bouchair
(1994), while Arce et al. (2009) studied a 4.5m high
model, under real meteorological conditions in Spain.
Analytical studies.
In a number of analytical studies mathematical
models were developed for the prediction of the solar
chimneys’ performance. Experiments were usually
performed, in order to validate the models. Bansal et
al. (1993) developed a steady-state mathematical
model to calculate the mean air flow rates and
temperatures of a solar chimney connected to a
conventional one. Wall temperature was assumed
uniform. Awbi and Gan (1992) analytically derived
the air temperature distribution along the SC channel
by making the same assumption. A steady-state
mathematical model was also developed by
Bassiouny and Koura (2008) to predict the air
changes per hour1 (ACH) induced in a room by a SC.
The thermal resistance network approach was
adopted to set up the steady-state heat transfer
equations in the model of Ong and Chow (2003),
which predicts the performance of a solar chimney
under varying ambient conditions. Mathur et al.
(2006) followed a similar approach to calculate the
ACH induced in a room by a small-sized solar
chimney integrated to a normal window. A simplified
thermal model and a computer program to calculate
ventilation flow rate through a chimney were
developed by Afonso and Oliveira (2000) which also
takes into account varying climatic conditions, the
thermal inertia of the back wall and dependence of
the convective heat transfer coefficient on the air
flow rate.
Numerical modeling studies.
The buoyancy-driven airflow and heat transfer in
vertical heated cavities were investigated
numerically, mainly through Computational Fluid
Dynamics (CFD) simulations in an increasing
number of studies during the past decade. Some of
the studies focused on the airflow regime and the heat
transfer mechanisms in the SC channel, while others
on parametric investigations. The latter will be
mentioned here briefly, since more details will be
given in the following section. Numerical
investigations on the airflow within the Trombe wall
channel, which can be considered a type of SC,
preceded by many years, with the first one being that
of Borgers and Akbari (1979). Rodrigues et al.
(2000) studied the airflow regime and the transition
from laminar to turbulent flow in a SC channel using
a finite-volume method. The heat transfer
mechanisms (by conduction, convection and
radiation) in the SC channel were studied in detail,
using the numerical method of finite-difference
control volumes, by Nouanégué and Bilgen (2009).
In certain studies numerical modeling was
employed to perform parametric analysis on the SC
system. The effects of solar heat gain and glazing
type (Gan and Riffat, 1998), cavity width (Gan,
2006), inclination and low emissivity coating (Harris
and Helwig, 2007) were some of the issues
investigated using CFD modeling. Recently Gan
(2010) found that the size of the computational
domain (for CFD simulations) has an impact on the
airflow and heat transfer coefficient predictions in
solar heated cavities, and made corresponding
suggestions. An extensive parametric analysis for a
SC integrated in a prototype residential building was
performed by Ho Lee and Strand (2009), using
numerical modeling in the program EnergyPlus. The
authors developed a SC module for the program and
1 Ventilation rate expressed as a factor of the space volume:
ACH [-] = (ventilation induced in one hour –[m3])/(space
volume – [m3])

performed single-day dynamic simulations, assuming
three different locations for the building. Numerical
investigations have also been performed to study the
application of solar chimneys or similar
configurations of solar heated cavities (e.g. double
façades) in multi-storey buildings (Punyasompun et
al. 2009, Ding et al. 2005, Letan et al. 2003, Gan
2006). The corresponding findings of these and of the
parametric analysis studies are reported in the
following two sections.
Parametric Analysis Findings
In parametric analysis, parameters are varied one
by one to determine the sensitivity of the system’s
performance against each. It has been employed in
the vast majority of studies and has played a
substantial role in understanding the mechanisms
controlling the performance of the solar chimney and
their interactions. The most influential (and thus
mostly studied) parameters can fall under the
category of geometrical (e.g. wall height, gap width),
construction (e.g. type of glass, insulation) and
climatic (e.g. solar radiation, wind) parameters. Some
indicative results will be presented in this section,
regarding the effect of these parameters on the
system’s performance.
Effect of wall height and cavity width.
The effect of wall height and cavity width has in
some cases been studied and expressed separately,
while in others inextricably, in terms of the height-to-
width aspect ratio (also referred to as height-to-gap
ratio). Air flow increases with height, since the back
wall’s heat gains increase: in a parametric study on
Trombe walls, Gan (1998) found that an increase in
wall height by a quarter is equivalent to an increase
in heat gains by three quarters. In the study of Ho Lee
and Strand (2009) air flow rates increased in all three
assumed locations of the building, by ~73% when the
wall height increased from 3.5 to 9.5m (a cavity
width of 0.3m was considered).
With respect to the cavity width, it was found
that the induced flow rate increases with increasing
width. In the analytical study of Ong and Chow
(2003) it was estimated that a 0.3m wide channel
induced 56% higher flow rate than one of 0.1m.
Similarly, according to the model of Bassiouny and
Koura (2008) a threefold increase in cavity width
causes an increase of ACH by 25%. Rodrigues et al.
(2000) argued that airflow rates grow with cavity
width, but the growth ratios decrease as the width
increases. In some studies an optimum cavity width
(or optimum height-to-width ratio) was reported; for
this optimum width the flow rate became maximum,
while for wider gaps reverse flow occurred that
reduced the mean flow through the SC (Spencer et al.
2000, Chen and Li 2001). This discrepancy between
studies is attributed to the different ranges of height-
to-width ratios investigated and to the influence of
the inlet size. The term ‘inlet’ is used here to describe
the opening from where the room air is admitted into
the SC channel. In case the inlet size increases along
with the cavity width, a lower pressure drop in the
inlet can counterbalance the reduction in the flow rate
caused by reverse flow, so that no optimum width is
found (Gan 1998, Chen et al. 2003). Gan (2006) later
reported an optimum width of 0.55m for a 6m high
SC and supported that the optimum width increases
with height.
Effect of inlet size.
The effect of inlet size was also explored in
some studies, and was found to have a wicker effect
on the performance compared to that of the cavity
width. Increasing the inlet size by a factor of three
increased the induced ACH by 11% in the analytical
study of Bassiouny and Koura (2008), while
Nouanegue and Bilgen (2009) found that volume
airflow rate is a decreasing function of inlet size. Gan
(1998) claimed rising airflow rates for cavity width
beyond 0.3m, as long as the inlet size has the same
size as the width.
Effect of inclination angle.
Various inclination angles (15o/30
o/45
o/60
o) were
studied experimentally by Chen et al. (2003) for a
constant height, cavity width and uniform heat flux.
The air velocity profile across the cavity width was
found to be more uniform when the SC was inclined,
leading to lower pressure losses at inlet and outlet,
and thus to higher airflow rates (45% higher airflow
rate was found for the angle of 45o). Harris and
Helwig (2007) numerically studied the consequences
of inclining the SC along the roof line of buildings
(for the latitude of Edinburgh, Scotland). They
argued that although the heat gains can be favored
due to tilt, heat transfer between air and glazing is
higher, resulting in higher heat losses that could
reduce the performance. Higher flow rates by 11%
were found (for the optimum angle of 67.5o), while
the performance at 45o angle was almost the same as
that of the vertical SC. It is implicit that the impact of
SC inclination is highly dependent on the latitude of
the location.
Effect of back wall properties.
Increasing the thickness of the back wall (i.e its
thermal mass) favors night-time ventilation because
the time distribution of the induced airflow rates
changes; their magnitude on the other hand is not
significantly altered (Charvat et al. 2004, Martí-
Herrero and Heras-Celemin 2007). Insulation of the
back (and side) wall(s) is imperative to prevent
devastating heat losses of the SC (as well as
overheating of the adjacent spaces): airflow rates
decreased by 60% without back wall insulation
according to the study of Afonso and Oliveira (2000),
while Gan (1998) reported that 40% of available heat
gains would be lost through a non-insulated back

wall (0.3m thick). In that study the surface
temperature of the back wall rose by 9oC when
insulation was applied. Back wall absorptivity should
be as high as possible to maximize solar heat gains.
Increasing the absorptivity from 0.25 to 1, led to
increased airflow rates by 42-57% in all three
locations assumed for the building (Ho Lee and
Strand 2009). Back wall emissivity should be as low
as possible to restrict radiative heat losses; when a
low-e coating was applied at the back wall, airflow
rates increased by 10% in the study of Harris and
Helwig (2007).
Effect of glazing type.
The use of double glazing can prevent
downdraught (and thus reverse flow) along the cold
glass surface during winter, but was also found to
increase the induced airflow rates up to 17% when
applied to a Trombe wall used for passive ventilation
in the summer (Gan, 1998). Harris and Helwig
(2007) argued that double glazing improves the
performance of a SC but only marginally, so that it is
not a cost-effective measure (only summer conditions
were considered).
Effect of climate: solar intensity and wind.
The intensity of solar heat flux is the motive
force for the operation of the SC and is thus the most
determinant factor for its performance. In the
experimental study of Chen et al. (2003) varying
values were considered for the uniform heat flux on
the back wall and the airflow rate was found to rise
by ~38% for a threefold increase of heat flux (from
200W/m2 to 600W/m
2). Mathur et al. (2006) found
that airflow rate increases linearly with solar
radiation and Bansal (1993) estimated that a SC with
surface area of 2.25m2, would induce 100m
3/hr and
350m3/hr for solar radiation of 100W/m
2 and
1000W/m2 respectively. Based on experimental
investigations on a small-scale SC, Burek and Habeb
(2007) derived that the mass flow rate is proportional
to Qi0.572
where Qi (W/m2) the uniform heat flux
supplied to the back wall. The simulations of Ho Lee
and Strand (2009) showed flow rates to vary as much
as 200% between the three assumed locations of the
building, as a result of the varying solar availability.
Wind is the second most influential climatic
parameter, as it can create positive or negative
pressures at the outlet of the SC and thus obstruct or
enhance the airflow. In the outdoor experiments by
Arce (2009) at a full-scale SC, the highest airflow
rates coincided with the highest recorded wind
velocity, while Afonso and Oliveira (2000) altered
their model to include wind effects which proved
significant (error between model predictions and
measurements was then lower than 10%). In the
analytical study of Mathur et al. (2006) the large
error of 23% was attributed to wind effects, which
were neglected in the model. In practice, devices can
be incorporated at the outlet of the SC so that wind of
all directions creates negative pressures.
Integration in Multi-Storey Buildings
Investigating the performance of a SC in a multi-
storey building holds great interest due to the high
potential benefits involved in actual, large-scale
applications. This subject has been studied only
numerically in the past few years, mainly with CFD
simulations assuming steady-state temperature and
air velocity fields. The CFD models were validated
against small-scale experimental data.
Passive ventilation of a five-storey building was
found feasible in the study by Letan et al. (2003).
Numerical simulations were performed with
commercial CFD software assuming steady-state
temperature and velocity fields and summer
conditions. It was found that the induced airflow rates
decreased with floor height: the lower the floor, the
higher the airflow rate. Acceptable thermal conditions
were found for the first four floors with air
temperatures close to that of the incoming air (at
maximum 25.5oC), while the fifth floor was
overheated up to 29.9oC. The authors argued that
extending the SC by one storey height would improve
the situation, but mechanical ventilation would still be
required for the top floor.
Ding et al. (2005) investigated a prototype eight-
storey office building with an atrium on the northern
side and a double-skin façade on the southern side,
which extends to a SC channel above the roof height.
Reduced scale experiments and CFD simulations
were employed in this study. The size of the openings
connecting the atrium to the occupant spaces were
fixed, while for the size of the openings between the
floor spaces and the double-skin channel three values
were tested (1m2/2m
2/4m
2 per floor). Different
heights for the SC were also examined. Here as well
the airflow rates got lower with floor level. By
increasing the openings’ size higher airflow rates
resulted at all floors, but the pressure difference at the
upper floors got lower, resulting in lower percentage
of the overall flow going through these. The authors
recommended that the SC should be at least two-
storey high.
Ventilation of a four-storey building (total height
of 12m) via buoyancy-induced flow in a double-skin
façade channel was studied by Gan (2006) using
CFD analysis. Although not a SC channel was
studied here, the double-skin façade works in a
similar way, with the difference of more symmetrical
heating of the two glass skins. Varying cavity widths
for the double-façade channel and different exhaust
configurations from the floors to the channel were
investigated. Replacing the outer skin of the façade
with photovoltaic panels (PV) was also examined.
For the design where each floor has its own opening

Figure 3. Applied Methodology.
to the double-skin channel (referred to as ‘room
ventilation’ in the study), flow rates decreased from
bottom to top, due to lower stack heights in the upper
levels: for a cavity width of 0.4m, 34% and 17% of
the total flow was induced at the bottom and top floor
respectively. These floor-to-floor variations were
significantly reduced when PV panels were
integrated at the outer skin of the façade. For this
four-storey structure a cavity width of 0.6-0.8 is
proposed as optimum for the ‘room ventilation’
design.
Punyasompun et al. (2009) performed small
scale experiments for a three-storey building under
the Bangkok climatic conditions and developed a
simplified model that could be used for designing a
‘multi-solar chimney building’. They tested two
possible ways of SC integration; one where each
floor had a separate SC channel (i.e. outlet openings
at every floor), and one where the floors were
connected to a common SC channel, extending from
bottom to top floor (i.e. one outlet opening at the top
of the channel). The latter proved to perform better
and induce higher airflow rates in the floors.
Concluding Remarks
It is evident that fair background knowledge has
been gained so far on the physical mechanisms and
the various parameters affecting the performance of
SC systems. The potential of SC systems to drive
airflow and achieve sufficient passive ventilation in
buildings has been explored in several studies and
was found satisfactory. Most of these studies
however, involved single-room or single-zone
buildings and assumed steady-state conditions, while
most of the outdoor experimental studies (subjected
to dynamic climatic conditions) were performed for
hot and arid climates and specific building types,
typical of the location. Recent studies have
demonstrated the additional complexity and
challenges posed by integrating a SC system with a
multi-storey building, indicating the need for further
research on various related topics.
In practice and for large-scale applications of SC
systems in buildings, it is imperative that the design
be based on performance estimations for dynamic
conditions and for the specific building, climate and
surroundings. Numerical modeling in building
performance simulation (BPS) tools should be
employed when it comes to practical applications:
dynamic thermal and airflow simulations for the SC-
building system can be performed and the feasibility,
potential benefits as well as possible improvements
of the design can be fully explored.
This project studies the feasibility of a SC
integrated in a prototype multi-storey office building
in the Netherlands. Performance simulations will be
performed in the BPS tool ESP-r and results will be
used for sensitivity analysis (SA) and Optimization of
the design. At present only the SA results are
available. The calibration procedure and the SA
results are presented in the following sections.
AIM
The aim of this part of the project is the
investigation of the applicability and optimization of
a solar chimney to enhance natural ventilation in a
multi-storey office building in the Netherlands.
METHODOLOGY
To achieve the aim of the project we envisaged
the research methodology which involves the
following stages (Fig. 3):
1. Calibrating the model of the solar chimney with
the available data from the small-scale
measurements set-up.
2. Performing Sensitivity Analysis (SA) for a SC
design and for the following parameters: length,
cavity width, inside face short-wave absorptivity
and long-wave emissivity, insulation thickness
and thermal mass of the back and side walls,
glazing type and glass percentage of the glazed
wall. For the selected range of variance of the
aforementioned parameters, the Latin Hypercube
sampling method is employed and 200 samples

are generated in total. These are translated to an
equal number of sets of input files for ESP-r and
SA is based on the produced sets of simulation
results. The performance indicators for the SA
are (i) the annual harvested energy (i.e. the air
enthalpic gains in the SC) and (ii) the annual fan
energy savings.
3. Multi-objective optimization of the SC design to
maximize: (i) the air enthalpic gains in the SC
that could be recovered and used for e.g. heating
purposes and (ii) the fan energy savings.
4. Testing the robustness of the final optimized
design using the model of the SC integrated to
the model of the prototype building (e.g.
influence of operating windows, alternate design
for air supply etc).
At the absence of results for stages [4 & 5], the
calibration and SA results are reported in the next
sections. A short description of the case study
building is also included in the last section.
CALIBRATION
Calibration Procedure
The objective of the procedure is to calibrate the
airflow components of the SC model so that pressure
losses, airflow rate and temperatures in the SC
channel are predicted reliably. The calibration is
based on available data from experimental
measurements performed in a small-scale SC test set-
up, constructed in the context of the ‘Earth, Wind &
Fire’ project and located in Mook, Netherlands.
Calibration was performed of the ESP-r model of the
test set-up (i.e. a small-scale SC), which was created
in line with the physical model in terms of geometry
and materials. A presentation of the test set-up and
calibration methodology follows.
The small-scale test set-up.
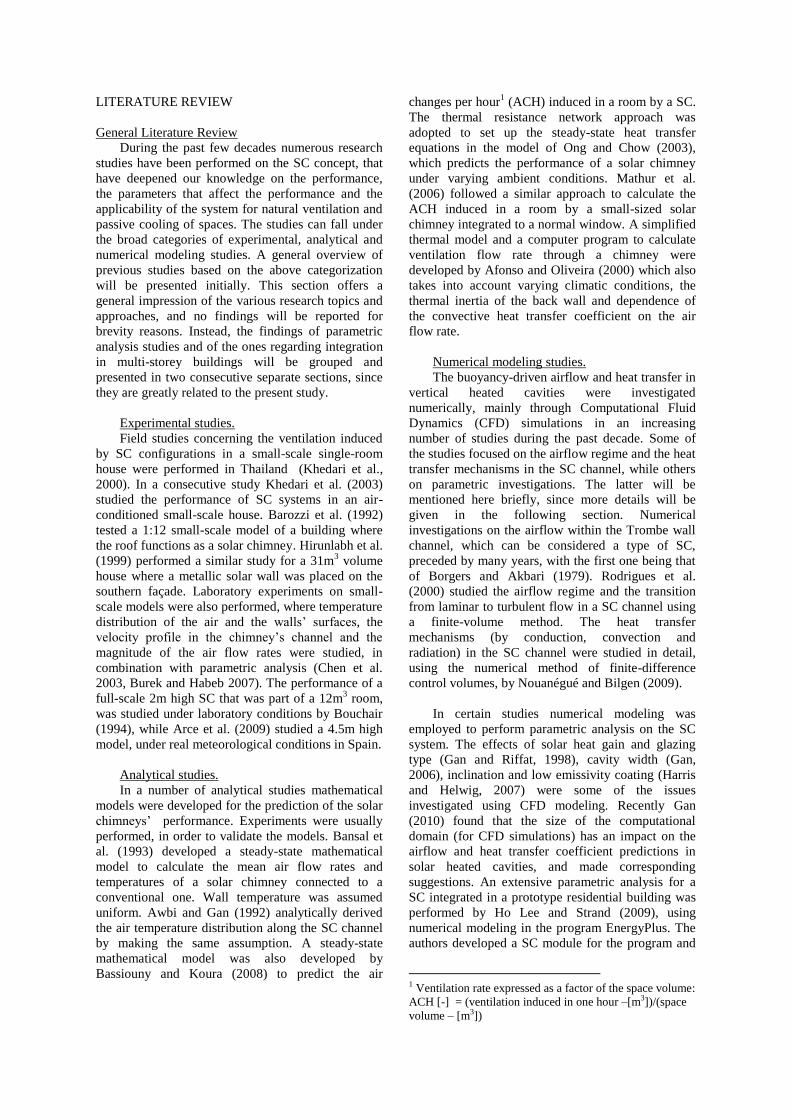
The SC test set-up (Fig. 4[a]) is 11m high, the
channel is 2m long and 0.25m wide (width-to-height
ratio is 1:44). An aluminum layer with absorptivity of
0.95, emissivity of 0.05 and thickness of 0.5mm is
used for the inside surfaces of the back and side
walls. The walls are well insulated to the outside (U-
value = 0.16 W/m2K) and a double glazing (U-value
= 1.32 W/m2K) is used with a visible light
transmission factor of 0.56 and low-e coating on both
glass panes. The SC channel is connected at its
bottom to a small room (volume is ~20m3) intended
to pre-condition the incoming air up to 20oC. Air
flows naturally into the room through a window
located at its north side (opening is ~1m2) and into
the solar chimney channel through an inlet opening
located close to the floor level (at 0.25m) and which
has the same area and shape as the cross section of
the SC.
An extensive measurements’ schedule was
designed but will not be presented here for brevity
reasons. The data used for the calibration include: (i)
inside surface temperatures for the glazing, back and
side walls at single points and four heights along the
SC channel (0.5/4.0/7.5/9.5m), (ii) air temperatures at
nine points evenly distributed over the channel’s
cross-section and at four heights (0.25/4.0/7.5/11m),
(iii) pressure difference between inlet and outlet of
the channel and (iv) air velocities at two single points
of the cross-section at four heights
(0.25/4.0/7.5/11m). Due to unfavorable weather
conditions and costs involved, measurements were
performed for a limited number of days from
December till April. Measurements from 15/12/09,
08/01/10 and 15/04/10 were used for calibration.
Calibration in ESP-r.
The airflow through the SC is modeled using the
‘general flow conduit’ component, which is assumed
the equivalent of a duct. The required input
parameters for this component are the hydraulic
diameter [m] (equal to the diameter in case of a round
duct), cross-section surface area [m2], length [m],
roughness [m] and local dynamic loss factor [-].
From the above parameters the first three are fixed as
they are determined by the geometry of the SC duct,
while the roughness and local loss factor are the
parameters to be calibrated.
Due to restrictions in the ESP-r program, it was not
possible to impose transient measured boundary
conditions; instead measurement data corresponding
to one-hour timeslots were used and calibration was
performed assuming steady-state conditions for these
hours. Surface temperatures and pressure difference
along the channel are the boundary conditions (input)
to the model. The output data (air temperatures and
mass flow rate) are compared to the corresponding
measured values and the model is calibrated until
reasonable agreement is accomplished. For the air
temperature measurements, the statistical measure of
Figure 4[a,b]. The small –scale experimental set-up
(a) and its model counterpart in ESP-r (b).

R-squared (R2) is used to judge statistical correlation
which can take values from 0 to 1, with 1 being the
absolute agreement between measurements and
model predictions. Since the SC is modeled in ESP-r
with nine thermal zones over the height (see Fig.
4[b]), i.e. model’s input and output data refer to nine
points representing the average conditions in the
zones, the available measured data (at four heights)
were fitted linearly with curves and ‘measured’
values were estimated for the nine model heights, so
that the calculation of the R2 is possible. The R
2 value
of the linear fitting curves was usually above 0.90,
indicating a linear relationship between height and air
temperature in the SC.
It is noted that the measured mass flow value,
derived from velocity measurements at two points of
the SC cross-section (at four different heights), is
assigned an error of 40%, which is the maximum
variation between points along the length and width
of the SC channel, found in measurements performed
specifically to have an idea of the velocity profile
distribution in the channel. Therefore, a valid range
of ±40% around the measured mass flow value is
estimated, within which the predicted value should
fall.
Calibration Results & Discussion
The calibration procedure outlined in the
previous section was performed for ten timeslots. It is
noted that the roughness parameter was found to have
negligible effect in the predictions, therefore it was
fixed at 1mm and calibration consisted of adjusting
the local loss factors of the SC components (Ci). In
all cases a loss factor value between 0.6 and 1.0 was
found to be appropriate (for each timeslot a different
value gave the best results) but since this value is a
fixed input parameter in the model, results are
presented here for a Ci value of 1.0. Agreement
between model predictions and measurements with
respect to air temperatures for every timeslot is
presented in Table 1, expressed with the value of R2,
while agreement of measured and predicted mass
flow rates is presented in Table 2, where predicted
values should fall with the valid range. For brevity
reasons in Table 2 only the number of the timeslot is
included; for more data one can refer to Table 1.
Given the errors introduced by pre-processing of
the measured data (e.g. data fitting with curves and
assumption for the surface temperatures of the walls
at the upper part of the SC) the model’s performance
is considered satisfactory and the calibration
procedure successful. In most cases the R2 value is
above 0.70, whereas lower values are found at times
of low solar radiation intensity values (e.g. timeslot
no.5) or for the timeslots of 15/4/10, where a
significant error is traced back to the trendline of the
surface temperatures. Wind speed is also high during
this day, which could account for the poor
performance of the predictions, since wind is
neglected in the model.
The above are an indication that the model (where the
Ci value is fixed) will not be able to represent mass
flow and air temperatures accurately in some hours of
the day where extreme conditions, in terms of solar
radiation and/or wind speed might come to play a
role in the real system. The complexity of flow
characteristics in a naturally ventilated duct and the
various parameters that affect the flow cannot
possibly be all represented equally well in a model,
which is a simplification of the real system.
The calibrated model was also validated for
whole-day dynamic conditions and results were
found to be satisfactory. Validation results are not
presented here for brevity reasons. Confidence
acquired in the ESP-r model of the SC through
validation allows us to use it for the simulation
predictions required in the next steps.
Table 1. Calibration results: air temperature
agreement between measurements and model
predictions
Table 2. Calibration results: mass flow rate
agreement between measurements and model
predictions.
CASE STUDY
Some information regarding the prototype
building is presented here, since the sensitivity
analysis is performed for a SC design intended to
work for the specific building. The case study is

based on a simplified model of the faculty of
Architecture at the Eindhoven University of
Technology (TU/e) campus, in the Netherlands. The
floor plan of the building is rectangular with
dimensions of 43.2*32.4m (floor surface area is
~1400m2). The 32.4m dimension, corresponding to
the southern and northern façade determines the
maximum possible length of the SC (see next
section). The total building height is 49.5m (9 floors
of 5.5m height each), and ventilation requirements
are estimated at 32.66 m3/s (3.63m
3/s for each floor).
Outdoor air enters the building through a main supply
duct on the northern side (conditioning of the air is
assumed up to 18oC in the supply duct), diverges into
the floors and is consecutively exhausted in the main
exhaust duct on the southern side (exhaust air
temperature is 20oC). The SC channel is connected to
the exhaust duct at ground level; a fan located at the
bottom of the SC will guarantee an airflow of 32.66
m3/s at all times. The pressure drop through the duct
network of the building (excluding the SC channel)
was estimated to be aprox. 40Pa. Dampers are
located at each floor level to balance the system and
ensure that all floors receive the same airflow rate.
The building is assumed to be an office building, thus
the functional hours are from Monday to Friday and
from 7am to 7pm (3132 hours per year).
SENSITIVITY ANALYSIS
Sensitivity analysis is performed for a full-scale
SC of 50m height, intended to be integrated with the
prototype office building previously described. The
parameters considered in the SA are presented in
Table 3, along with the corresponding ranges and
step changes; discrete values and uniform
distributions were considered for each parameter.
Table 3. Parameters and their range of values
considered for SA.
With the term ‘thermal mass’ the thickness of a
concrete layer placed behind the absorbant layer2 of
the back and side walls is considered. Absorptivity
(short-wave) and emissivity (long-wave) are material
2 the term is used here for the surface material of the
opaque walls of the SC, which is usually a low thermal
mass layer with a dark-coloured outer surface for
maximum solar radiation absorption.
properties of the absorbant layer. Three glazing types
are taken into account (single, double and low-e) with
a visible light transmission value of 0.87, 0.76 and
0.79 respectively. Restrictions were imposed so that
the cavity width is less than 25% of the length (to
avoid shading) and that the cross-section area of the
SC results in air velocities not more than 3m/s in the
SC shaft. The parameter ‘glass percentage’ is
considered to account for the reduction of the total
glazed area due structural framing of the glazing
wall. The parameters (independent variables) were
sampled simultaneously using the Latin Hypercube
Sampling method and 200 samples were generated
(for the matrix generation the freeware tool Simlab
was used). The performance indicators considered for
the SA (dependent variables) are (i) the annual
harvested energy in KWh and (ii) the annual fan
energy savings in KWh.
The annual harvested energy is calculated as the sum
of the air enthalpic gains in the SC for all functional
hours:
(1)
Where [m3/s] the volume flow rate through the
SC, [kg/m3] the air density of the incoming air,
[KJ/kgK-1
] the specific heat capacity of air at the
inlet temperature, [oC] the air temperature at the
outlet of the SC and the temperature of the
incoming air, assumed to be 20oC.
The annual fan energy savings are calculated as the
sum for all functional hours of the quantity:
(2)
With the building volume flow rate equal to 32.66
m3/s, =0.65 [-] the fan’s efficiency and the
pressure difference induced by the SC equal to:
(3)
with [kg/m3] the density of the air at the
supply duct (temperature of supply air is assumed
18oC), [kg/m
3] the air density at the SC channel
and [Pa] the pressure losses (local dynamic
and friction losses) of the SC. In case results a
negative quantity the energy savings are set to zero
for that hour, since a negative value would mean that
the fan would have to consume more power to
account for the SC’s high losses. It is reminded that
the fan would need to generate a pressure difference
equal to:
(4)

For the total of 200 samples, simulations were
performed in ESP-r and the two performance
indicators were derived for each sample. The method
of standardized regression coefficients (SRC) was
used to analyze the results, which is a linear
regression method. For every performance indicator
(harvested energy and fan savings) the parameters of
the SA are assigned an SRC value between 0 and 1,
which indicate the sensitivity of the model output to
that parameter. The higher the SRC value, the more
sensitive the model (i.e. the performance indicator) to
that parameter. A positive value of the SRC means
that a positive change of the parameter’s value will
result in a positive change of the performance
indicator. A negative SRC value means that for a
positive change of the parameter a negative change of
the performance indicator is expected. Results of the
SA are presented in the next section.
SA Results
For each performance indicator, the ranking of
the eight parameters, starting from the most
influential, and the SRC values are presented in Table
4. It is noted that the R-square values are 0.875 for
the harvested energy model and 0.871 for the fan
energy savings model, reassuring that the linear
regression method was a good choice; in case these
values were low a non-linear regression analysis
would have been more appropriate.
Table 4. Ranking of the SA parameters.
For the harvested energy the most important
parameters are the length of the SC, the short-wave
absorptivity of the walls, the glazing type (the
positive SRC value here means a double is preferable
to a single glazing and that the low-e would be the
best choice out of the three) and the thermal mass.
For the fan energy savings only the second most
influential parameter is different compared to
harvested energy, and that is the gap width, which
ranks only 7th
in the harvested energy model.
Parameters 5 to 6 are not as important, whereas the
ones ranking 7th
and 8th
could be discarded from the
regression model (the p-value is more than 0.05)3. It
should be noted that the ranking of the insulation
3 The p-value is the probability that the true SRC is zero. If
p-value is higher than 0.05 the variable should be discarded
from the model.
thickness is low because the backwall of the SC is
assumed to be in contact with the wall of the exhaust
duct, where the air temperature is 20oC. The negative
value of the SRC for the thermal mass indicates that
it is preferable to have the lower thermal mass
possible in the walls construction in order to
maximize harvested energy and fan energy savings.
From the results of the 200 simulations a scatter-
plot is produced with the x-axis being the harvested
energy and the y-axis the fan energy savings; each
dot corresponds to one sample. It can be derived from
Figure 5 that the two performance indicators are not
conflicting, i.e. there will be a solution that will
maximise both, as is for example the solution
encircled in the figure. It can also be seen that a large
number of solutions results in zero fan energy
savings (or increased required fan power).
Figure 5. Scatter-plot of the 200 simulation results.
CONCLUSIONS
The applicability of a SC for passive ventilation
of a prototype multi-storey office building in the
Netherlands is explored. Measurement data in a
small-scale SC were used to calibrate and validate the
SC model. Modeling and simulations were performed
in the building simulation tool ESP-r. A case study
office building has been chosen and a sensitivity
analysis (SA) of a SC design intended for this
building was performed. The dimensions of the SC
(length and gap width), the short-wave absorptivity
of the walls, the glazing type and thermal mass were
identified as the most influential parameters with
respect to the annual harvested energy in the SC and
the annual fan energy savings. The next step is the
optimization of the SC design and at the final stage a
robustness analysis of the optimized design against -
among others- active user behavior (e.g. opening of
windows). At the final stage the integrated model of
the SC and the office building will be used.

REFERENCES
Afonso, A. and Oliveira, A. 2000. Solar chimneys:
simulation and experiment. Energy and
Buildings 32: 71-79.
Arce, J., Jimenez, M.J., Guzman, J.D., Heras, M.R.,
Alvarez, G., Xaman, J. 2009. Experimental study
for natural ventilation on a solar chimney.
Renewable Energy 34:2928-2934.
Awbi, H.B. and Gan, G. 1992. Simulation of solar-
induced ventilation. Renewable Energy
Technology and the Environment 4:2016-30.
Bansal, N.K., Mathur, R., Bhandari, M.S. 1994. Solar
chimney for enhanced stack ventilation. Building
and Environment 28:373-377.
Barozzi, G.S., Imbabi, M.S.E., Nobile, E., Sousa,
A.C.M. 1992. Physical and numerical modeling
of a solar chimney-based ventilation system for
buildings. Building and Environment 27:433-
445.
Bassiouny, R. and Koura, N.S.A. 2008. An analytical
and numerical study of solar chimney use for
room natural ventilation. Energy and Buildings
40:865-873.
Borgers, T.R. and Akbari, H. 1979. Laminar flow
within the Trombe wall channel. Solar Energy
22:165-174.
Bouchair, A. 1994. Solar chimney for promoting
cooling ventilation in southern Algeria. Building
Services Engineering Research and Technology
15(2):81-93.
Burek, S.A.M. and Habeb, A. 2007. Air flow and
thermal efficiency characteristics in solar
chimneys and Trombe walls. Energy and
Buildings 39:128-135.
Charvat, P., Jicah, M., Stetina, J. 2004. Solar
chimneys for ventilation and passive cooling.
World Renewable Energy Congress, Denver,
USA.
Chen, Z.D., Bandopadhayay, P., Halldorsson, J.,
Byrjalsen, C., Heiselberg, P., Li, Y. 2003. An
experimental investigation of a solar chimney
model with uniform wall heat flux. Building and
Environment 38:893-906.
Chen, Z.D. and Li, Y. 2001. A numerical study of a
solar chimney with uniform wall heat flux. In:
Proceedings of the Fourth International
Conference on Indoor Air Quality, Ventilation
and Energy Conservation in Buildings, Human,
China, p.1447-54.
Ding, W., Hasemi, Y., Yamada, T. 2005. Natural
ventilation performance of a double-skin façade
with a solar chimney. Energy and Buildings
37:411-418.
Gan, G. and Riffat, S.B. 1998. A numerical study of
solar chimney for natural ventilation of buildings
with heat recovery. Applied Thermal
Engineering 18: 1171 -1187.
Gan, G. 1998. A parametric study of Trombe walls
for passive cooling of buildings. Energy and
Buildings 18:1171-87.
Gan, G. 2006. Simulation of buoyancy-induced flow
in open cavities for natural ventilation. Energy
and Buildings 38:410-420.
Gan, G. 2010. Impact of computational domain on
the prediction of buoyancy-driven ventilation
cooling. Building and Environment 45:1173-
1183.
Harris, D.J., Helwig, N. 2007. Solar chimney and
building ventilation. Applied Energy 84:135-
146.
Hirunlabh, J., Kongduang, W., Namprakai, P.,
Khedari, J. 1999. Study of natural ventilation of
houses by a metallic solar wall under tropical
climate. Renewable Energy 18:109-119.
Ho Lee, K. and Strand, R.K. 2009. Enhancement of
natural ventilation in buildings using a thermal
chimney. Energy and Buildings 41:615-621.
Khedari, J., Boonsri, B., Hirunlabh, J. 2000.
Ventilation impact of a solar chimney on indoor
temperature fluctuation and air change in a
school building. Energy and Buildings 32:89-93.
Khedari, J., Rachapradit, N., Hirunlabh, J. 2003.
Field study of performance of solar chimney
with air-conditioned building. Energy 28:1099-
1114.
Martí-Herrero, J., Heras-Celemin, M.R. 2007.
Dynamic physical model for a solar chimney.
Solar Energy 81:614-622.
Mathur, J., Bansal, N.K., Mathur, N.K., Jain, M.,
Anupma. 2006. Experimental investigations on
solar chimney for room ventilation. Solar Energy
80:927-935.
Nouanégué, H.F. and Bilgen, E. 2009. Heat transfer
by convection, conduction and radiation in solar
chimney systems for ventilation of dwellings.
International Journal of Heat and Fluid Flow
30:150-157.
Ong, K.S. and Chow, C.C. 2003. Performance of a
solar chimney. Solar Energy 74:1-17.
Punyasompun, S., Hirunlabh, J., Khedari, J.
Zeghmati, B. 2009. Investigation on the
application of solar chimney for multi-storey
buildings. Renewable Energy 34:2545-2561.
Rodrigues, A.M., Canha da Piedade, A., Lahellec,
A., Grandpeix, J.Y. 2000. Modeling natural
convection in a heated vertical channel for room
ventilation, Building and Environment 35:455-
469.
SIMLAB. 2009. Version 3.2 Simulation
Environment for Uncertainty and
Sensitivity Analysis, developed by the Joint
Research Centre of the European
Commission.
Spencer, S., Chen, Z.D., Li, Y., Haghighat, F. 2000.
Experimental investigation of a solar chimney
natural ventilation system. In: Proceedings of
Room Vent, Seventh International Conference
on Air Distribution in Rooms, Reading, UK, 9-
12 July, p.813-8.