Optimising Multi-Stage Filtration Units for Use in...
62
APSU Optimising Multi-Stage Filtration Units for Use in Bangladesh: Research Findings ARSENIC POLICY SUPPORT UNIT i
Transcript of Optimising Multi-Stage Filtration Units for Use in...

APSU
Optimising Multi-Stage
Filtration Units for Use in
Bangladesh: Research Findings
ARSENIC POLICY SUPPORT UNIT
i

OPTIMISING MULTI-STAGE FILTRATION UNITS FOR USE IN BANGLADESH: RESEARCH FINDINGS
This report was prepared by Dr Farooque Ahmed, Bangladesh University of Engineering and Technology. The inputs from staff at ITN-BUET are gratefully acknowledged: Khalequr Rahman SG Mahmud Sk, Abu Jafar Shamsuddin Dr. M .Feroze Ahmed Dr. M. Rahman The comments and review by Dr Guy Howard, International Specialist, APSU are also gratefully acknowledged. Published by: Arsenic Policy Support Unit (APSU), Ministry of Local Government Rural development & Cooperatives, Government of the People’s Republic of Bangladesh With Financial Support from: Department for International Development (DFID), UK. February, 2006 This publication or any part of it can be reproduced in any form with due acknowledgement. The citation should be: APSU (2006) The sustainability of arsenic mitigation: a survey of the functional status of water supplies, Arsenic Policy Support Unit, Dhaka, Bangladesh.
ii

EXECUTIVE SUMMARY In order to develop an appropriate design criteria for multi-stage filtration (MSF) units for use in Bangladesh a research was undertaken by ITN Center, BUET for the Arsenic Policy Support Unit (APSU). The MSF system considered under the research comprised of three units; Dynamic Roughing Filter(DyRF) unit, Up-flow Roughing Filter(URF) unit and Slow Sand Filter (SSF) unit. Dynamic Roughing Filter was capable to handle raw water with high level of turbidity and on an average 58% turbidity removal was achieved during the last three experimental runs. Subsequent removal of turbidity through Up-flow Roughing Filter process was also around 64%, resulting in an average combined 85% turbidity removal in two-stage pre-filtration processes. These removal performances were found almost same for all ranges of raw water turbidity level up to 470 NTU, indicating that removal efficiency of turbidity through DyRF and URF were independent of raw water turbidity level. Because of substantial turbidity removal through coarse media pre-filtration processes, removal of turbidity through slow sand filtration process was not very significant. Overall removal of turbidity through the three MSF units were around 99% and average SSF effluent turbidity values in all the experimental runs reduced from 85 NTU to 0.75 NTU which is much lower than the Bangladesh Environmental Quality Standard (EQS,1997) of 10 NTU. Removal of colour was not found as effective as turbidity removal and in total, around 35% colour was removed through two-stage pre-filtration processes. To obtain a reasonable residual colour value, the role of slow sand filtration was found very significant and overall removal of colour through the three MSF units were around 78%. Average SSF effluent colour values in all the experimental runs reduced from 41 Pt.Co.Unit to 8.9 Pt.Co.Unit which is also lower than the Bangladesh EQS,97 of 15 Pt.Co.Unit. This value is usually acceptable to consumers and above which most people can detect colour. It was observed that two-stage coarse media pre-filtration units reduced the densities of all four microbial indicators, thermotolerant coliforms (TTC), E. coli, C. perfringens and coliphages over 50% and in case of TTC and C. perfringens this removal efficiency was 83% and 71% respectively. Under uninterrupted flow condition maximum overall removal of TTC and E. coli through the three MSF units were around 99.97% and 100% respectively at a filtration rate of 0.1 m/h. ‘Coarse media size range’ and ‘depth of bed’ in DyRF and URF are more important design parameters for MSFs rather than SSF media size range for the reduction of turbidity. A coarse media size range from 4.75mm to 25 mm for DyRF and 6.3 mm to 25 mm for URF placed in three layers have been found suitable. Slow sand filter bed materials size range and grading particularly on the top layer of filter bed are very important design parameters for efficient microbial removal performance. Filter sand having following characteristics have been found appropriate: FM = 1.8-2.0, D10=0.21-0.22 mm, D60 = 0.45-0.47 mm, U = 2.14 -2.16 and Filter Media Size Range = 0.15 mm to 1.1 mm. iii

A moderate influent turbidity limit of around 20 NTU may be proposed for SSF. In case of raw water turbidity level greater than 150 NTU, either pre-settling process in a plain sedimentation tank would be necessary, or water should be passed through an infiltration gallery for the removal of settleable suspended solids before putting into the two-stage pre-filtration processes(DyRF and URF) in multistage filtration system. If the raw water level remains within 60 NTU, the DyRF step may be omitted. For a maximum filtration rate of ≤ 0.1m/h, an acceptable level of microbial quality of water may be obtained and at a filtration rate up to 0.15 m/h, TTC and E. coli may appear occasionally. Beyond a 0.20-0.25 m/h filtration rate, microbial quality deteriorates significantly. To maintain slow sand filter influent turbidity value within 20 NTU and colour value within 25 Pt.Co.Unit, filtration rate should be within 0.20-0.25m/h. Intermittent operation affected the colour removal performance but not the turbidity removal performance. Effluent of consistently satisfactory microbial quality was obtained in the MSF system operated without interruption. However, when switched over to intermittent operation, a definite deterioration in microbiological quality was noticed except for two indicator microbes. Removal of coliphage and C. perfringens removal remained comparatively good. However, to obtain a better removal performance uninterrupted flow condition should be maintained. For a slow sand filtration rate of around 0.20 m/h, a maximum of 40 cm head loss may be expected for an influent turbidity level less than 20 NTU and cleaning of bed within 6-8 weeks operation period would be required. For an Up-flow coarse media filtration rate of 0.43 m/h, a maximum of 10 cm head loss may be observed before cleaning of bed within 8 weeks operation period. For a Down-flow coarse media filtration rate of 1.6 m/h, a maximum of 2 cm head loss may be experienced before cleaning of bed within 8 weeks operation period. At the beginning of each filter run, the removal efficiencies of microbial contaminants were low in comparison to the subsequent periods and approximately 7 to 10 days were required to improve the removal performances under the laboratory test conditions. At least 7 to 10 days interval should be allowed for the ripening of the “Schmutzdecke” on filter sand (SSF) before the filter bed is brought in to full operation for domestic use. Twin bed filter chambers may be used in place of single bed and cleaning may be performed alternatively to achieve the above objective. Exposure of filters increased the algal activity on filter bed and affected the physical water quality improvement performance slightly. However, occasional sloughing of algal mats from the surface of sand bed not only seriously affected the microbial quality improvement performance, but also become very unpredictable. On the other hand, shading of filters helped reduce the algal activity on the filters but did not affect the filter performance. Filter beds should therefore, be kept covered to avoid the unnecessary growth of algae particularly on slow sand filter bed.
iv

Reduction of the dissolved oxygen level was inversely related to the flow rate of water, and on an average 40% reduction was observed during nominal flow rates maintained in the experimental runs. Around 50% of average reduction of organic matters was achieved and this removal is approximately independent of rate of flow. Complete removal of ammonia was achieved through multi stage filtration processes. Like organic pollutant reduction, this reduction happened due to biological activity in filter media, i.e. biological oxidation of ammonia by nitrifying bacteria. During the filtration process there was a slight decrease of pH value due to mainly formation of CO2 as an end product of biological activity. There was an increase of electric conductivity due to dissociation/ionization of complex compounds into simple substances through biological activity.
v

Abbreviations and Acronyms APSU-Arsenic Policy Support Unit. ITN- International Training Network. BUET- Bangladesh University of Engineering and Technology. MSF- Multistage Filter SSF- Slow Sand Filter URF- Up-flow Roughing Filter DyRF- Dynamic Roughing Filter TTC- Thermotolerant Coliform E.Coli- Escherichia Coli. NTU- Nephelometric Turbidity Unit. Pt.Co.Unit- Platinum Color Unit. EC-Electric conductivity. MS- Mild Steel. ICDDRB-International Center for Diarrhoeal Disease Research-Bangladesh. EQS- Environmental Quality Standard. PSF-Pond Sand Filter. AWWA- American Water Works Association.
vi
Table of Contents
Chapter 1: INTRODUCTION................................................................................................. 7 1.1 Background.............................................................................................................. 7 1.2 Problem statement.................................................................................................. 7 1.3 Rationale of the Study ................................................................................................. 8 1.4 Study objectives ...................................................................................................... 8 1.5 Organization of the report ........................................................................................... 8 1.6 Literature review and data collection ................................................................... 8
1.6.1 Multistage filtration units ...................................................................................... 9 1.6.2 Design Parameters ............................................................................................... 9 1.6.3 Source Water Quality Considerations ............................................................. 10 1.6.4 Effluent Water Quality ........................................................................................ 10
Chapter 2: METHODOLOGY AND LABORATORY PROCEDURES ....................... 122.1 Design and set up of model MSF Units............................................................. 12
2.1.1 Number of filter units .......................................................................................... 12 2.1.2 Construction materials ....................................................................................... 12 2.1.3 Size and shape.................................................................................................... 12 2.1.4 Number of experimental run and duration ...................................................... 12 2.1.5 Filter materials characteristics .......................................................................... 47 2.1.6 Range of filtration rate........................................................................................ 48
2.2 Simulation of surface water quality .................................................................... 48 2.2.1 Collection of surface water samples from field .............................................. 48 2.2.2 Preparation of laboratory raw water................................................................ 49
2.3 Collection of water samples for laboratory analysis ........................................ 49 2.3.1 Sampling procedure and water quality analysis ............................................ 49 2.3.2 Duration of experimental run and interpretation of data ............................... 50
2.4 Problems encountered during the experimental runs ..................................... 50 Chapter 3:ANALYSIS OF PHYSICAL WATER QUALITY IMPROVEMENT ......... 51
3.1 Removal Mechanisms ............................................................................................... 51 3.1.1 Roughing Filters .................................................................................................. 51 3.1.2 Slow Sand Filter .................................................................................................. 51 3.2 Effect of process variables on removal efficiency ............................................. 51 3.2.1 Effect of filter bed materials............................................................................... 52 3.2.2 Effect of raw water turbidity ............................................................................... 55 3.2.3 Effect of flow rate of slow sand filtration.......................................................... 57 3.2.4 Effect of intermittent operation of flow ............................................................. 60 3.2.5 Variation of removal performance and head loss with operation period.... 62 3.2.6 Effect of Shading on Filter Bed ......................................................................... 63
3.3 Role of different filtration stages ......................................................................... 63 Chapter 4: ANALYSIS OF MICROBIAL WATER QUALITY IMPROVEMENT...... 66
4.1 Removal Mechanisms ............................................................................................... 66 4.2 Effect of Process Variable on Removal Efficiency................................................ 66 4.2.1 Effect of Filter Bed Materials ................................................................................. 66 4.2.2 Variation of removal with operation period ......................................................... 67 4.2.3 Effect of rate of filtration ......................................................................................... 68 4.2.4 Effect of intermittent operation of flow ................................................................. 71 4.2.5 Effect of Shading on Filter Bed ............................................................................. 74 4.3 Role of different filtration stages .............................................................................. 76
4.3.1 Uninterrupted flow............................................................................................... 76
vii

4.3.2 Intermittent flow ................................................................................................... 76 Chapter 5: ANALYSIS OF CHEMICAL WATER QUALITY IMPROVEMENT ....... 80
5.1 Removal mechanisms ............................................................................................... 80 5.2 Change of Dissolved Oxygen level ......................................................................... 80 5.3 Reduction of Organic Pollutants .............................................................................. 81 5.4 Reduction of ammonia concentration ..................................................................... 81 5.5 Variation of pH values ............................................................................................... 82 5.6 Variation of Electric Conductivity value .................................................................. 83
Chapter 6 OVER VIEW AND DESIGN PARAMETERS FOR MSF UNITS ............ 84 6.1 Design parameters of MSF Units ............................................................................ 84
6.1.1Maximum range of raw water quality (particle size) and number of filtration units 84 6.1.2 Characteristics of filter bed materials ........................................................ 84 6.1.3 Permissible range of filtration rate.............................................................. 85 6.1.4 Method of filter operation ............................................................................. 87 6.1.5 Permissible head loss and length of run between cleaning ................... 87 6.1.6 Exposure condition of filter bed .................................................................. 87
6.2 Cleaning and maintenance of MSF units .......................................................... 88 6.2.1 Roughing filter units............................................................................................ 88 6.2.2 Slow sand filter chambers ................................................................................. 88
6.3 Conclusions and recommendations................................................................... 88 REFERENCES...................................................................................................................... 91
viii
Chapter 1: INTRODUCTION
1.1 Background Arsenic contamination of water from shallow tube wells in excess of acceptable limits has recently become a major public health problem in the country. The alternative options available for water supply in the arsenic affected areas include avoidance of shallow tube well through use of alternative water sources or treatment of arsenic contaminated groundwater. In either case, the drinking water supplied must be free from harmful bacteriological and chemical contaminants. The use of alternative water sources will require a major technological shift in water supply. It would be a serious mistake to revert back to use of unsafe surface water sources without proper treatment.
A number of initiatives have been focused on the development of simple treatment technologies for water taken from ponds and a number of designs for pond sand filters(PSF) have been developed and deployed. In addition to ponds, Bangladesh has many rivers, canals and streams that could be used as a source of water supply. However, exposed to contamination, these sources of water are an important route for the transmission of waterborne diseases. Moreover, during the rainy season the concentration of suspended particles in the flowing water sources increases tremendously. In order to make this water safe for drinking, some kind of treatment is necessary. Very little work has been done for the treatment of these surface water sources. Although slow sand filter(SSF), on account of its simple construction and operation has become a most appropriate water treatment technology in developing countries, direct use of high turbid and contaminated water sources on SSF bed may not be feasible without pretreatment. The Arsenic Policy Support Unit (APSU) commissioned ITN-BUET to undertake research into multi-stage filtration units for the treatment of surface water for drinking and other domestic purposes to support the implementation of a national arsenic mitigation programme.
1.2 Problem statement Slow sand filtration (SSF) accomplishes its treatment primarily through biological activity, with the bulk of this activity taking place on the surface of the sand bed, as a result SSF is very sensitive to particulate matter which, at high concentration, clogs the filter after short time. SSF, therefore operates only satisfactorily with raw water of low turbidity. Filtration of raw waters with higher turbidities particularly during rainy season causes a rapid increase of the filter resistance and short filter runs. Obviously, frequent cleaning is the consequence of poor raw water quality. Moreover, the most desired biological activities of the filter required for microbial water quality improvement are seriously affected, and application of SSF becomes very questionable under such conditions. In general, the presence of algae in the source water reduces filter run lengths. Therefore, it is prudent to reduce algae content in source water to as low a level as possible to limits its effect on the filter performance. Source water colour should also
7

be limited as high coloured water is not acceptable due to aesthetic reason and gives undesirable taste.
1.3 Rationale of the Study The conventional way of pretreatment through separating suspended solids from
surface water sources consists of flocculation and sedimentation. However, these processes are difficult to implement in developing countries since it involves high cost and skilled personnel to apply chemicals. Roughing pre-filtration processes using coarse materials as filter media eventually will be required to improve the influent water qualities of SSF and is a sound technique in handling highly turbid waters. Two stages pre-filtration (first down-flow and then up-flow) may be required if the raw water quality is very unsatisfactory. In corporation of all such units into a multistage filtration process and optimization of their operations demands further intensive study.
1.4 Study objectives Some work has been done in Bangladesh to develop units for treating water from surface water sources. However, in optimizing appropriate treatment procedures, more work is required in particular to use the successful experiences gained in other developing countries in using multi-stage filtration plants. Key areas to be investigated in Bangladesh include the evaluation of more efficient down-flow and up-flow configurations, identification of appropriate media size and type of performance in removal of physical, microbial and chemical contamination. The specific objectives were: • Design and construct a laboratory model multi-stage filtration(MSF) units; • Investigate the water quality improvement performance of laboratory model units; • Determination of appropriate design criteria for MSF units for use in Bangladesh.
1.5 Organization of the report The report has been divided into six sections. The background to this research project, statement of problems, rationale and objectives of the study has been explained at the beginning. At the end of Chapter 1, the findings of different research projects on multistage filtration units have been reviewed and summarized. Methodology and laboratory procedures are discussed in the Chapter 2. Physical, microbial and chemical analysis of water samples collected from different units of multistage filter and interpretation of water quality analysis results are presented in the Chapters 3, 4 and 5 respectively. The last section (Chapter 6I) describes the design parameters of multistage filtration units, developed on the basis of performance of different units and comparing with other available results and findings. Conclusions and recommendations are also included in that chapter.
1.6 Literature review and data collection Relevant literatures have been reviewed and necessary design data have been collected regarding roughing pre-filtration and slow sand filtration systems and are shown in reference list at the end of the document. 8

1.6.1 Multistage filtration units There are basically three types of roughing filter, which are differentiated by their direction of flow. Structural constraints and available head limit the use of vertical up-flow filters, but high filtration rate and back washing of the filter media are possible. On the other hand, horizontal- flow filters enjoy practically unlimited filter length, but normally are subjected to lower filtration rate and generally required manual cleaning of the filter media5. Dynamic Roughing Filter(DyRF) includes a shallow layer of medium size filter media in their upper part and coarse media that covers the under-drains. With moderate levels of suspended solids in the source water, DyRF gradually clogs. If quick changes in water quality occur, the clogging may be much faster. Eventually the gravel bed will be blocked and the total water volume will just flow over the clogged surface area to waste, protecting the subsequent treatment steps that are more difficult to maintain. A combination of down-flow at the beginning and an up-flow at the end may be advantageous10. 1.6.2 Design Parameters The following are the fundamental design parameters of roughing pre-filtration system and SSF: Type, size and gradation of filter media; filtration rate or face velocity; and depth and length of filter bed. The rate of filtration and size of coarse materials depend on the desired degree of turbidity removal. (a) Size and Grading of Filter Media Recent designs used gravel filter materials that decreases in size with flow direction and size range is between 5 mm to 50 mm1. Schulz and Okun have recommended coarse media size range between 4 mm to 15 mm5 for up-flow roughing filter. AIT study recommended an effective size(D10) of coarse media varying from 2.8 mm to 9.1 mm2. The International Research Center (IRC) manual recommends filter sand with effective size(D10) of 0.15 mm to 0.30 mm with a uniformity coefficient between 3 and 51. Schulz and Okun have recommended an effective size(D10) of sand in between 0.15 mm to 0.35 mm5. McGhee has indicated that effective sizes of 0.10 mm to 0.3 mm and uniformity coefficient of 2 to 3 are commonly employed for slow sand filtration17. (b) Filtration Rates Good turbidity reductions were obtained at filtration rates less than 2 m/h through coarse media10. In AIT a horizontal flow roughing filter operated at a filtration rate of 0.6m/h produced a filtrate of 10 -15 NTU from raw water turbidity range of 20 -120 NTU2. The acceptable range of filter filtration rate for up-flow roughing filter has been found in the range of 0.5 m/h to 4 m/h5. AWWA has recommended typical roughing filtration rate in the range of 0.3 m/h to 1.5 m/h and slow sand filtration in the range of 0.09 m/h to 0.24m/h 1. McGhee has proposed that the filtration rate of SSF should be normally less than 0.4 m/h17. SSF operated at 0.3 m/h always produced a filtrate of lowest turbidity while those operated at 0.2 m/h and 0.3 m/h gave filtered waters of higher turbidity but less than
9

1 NTU8. Although the normal flow rate for SSF is between 0.1 m/h and 0.4 m/h, a conservative filtration rate of 0.29 m/h was chosen in North Haven9. (c) Depth of Filter Media and Under-drainage System McGhee has also indicated that sand bed depth around 1000 mm should bed be used for slow sand filtration17. The American Water Works Association (AWWA) has suggested that the sand bed depth should generally be between 460 mm and 800 mm, however, the minimum depth before re-sanding should be 460 mm1. The sand layer of SSF is supported by a layer of coarse media of about 300 mm thick which is graded from effective size of about 5 mm at the top to 50 mm at the bottom. Under drains, normally constructed of perforated pipes17. Regarding the under-drainage system plastic piping system has been proposed in some study1. 1.6.3 Source Water Quality Considerations The treatment capacity of SSF and effect of environmental conditions on the removal performance have been investigated by many investigators to determine the source water quality parameters with recommended limits. The degree of pre-treatment through coarse media should attain these recommended limits for better performance of SSF. (a) Turbidity and colour values Infiltration galleries have been proved a simple and efficient method of pre-treatment before SSF and raw water turbidity as high as 500 NTU could be reduced to a uniform low level of less than 5 NTU15. It has been observed that most of the existing SSF plants successfully treat surface water having turbidity of less than 10 NTU which is recommended as an upper limit in designing new facilities. A higher level will block the bed after a short time1,3. Similarly source water colour should be limited within 15 to 25 Platinum colour units1. (b) Presence of Algae In a few instances, it has been found that the presence of certain types of algae(filamentous species) actually enhances the filtration process by providing greater surface area for biological activity. In general, however, the presence of algae in the source water reduces filter run lengths. Therefore, it is prudent to reduce algae content in source water to as low a level as possible to limit its effect on the filter performance through shading of the bed1. (c) Dissolved Oxygen Level The presence of dissolved oxygen (> 6 mg/l)in source water is critical for stimulating a healthy "schmutzdecke" for proper SSF operation and to reduce taste and odors. Reduction of dissolved oxygen levels commonly occurs following algal blooms. Some SSF plants use aeration of the water as a pretreatment1. 1.6.4 Effluent Water Quality It is expected that a properly designed and carefully operated Multistage Filtration systems should have the effluent water quality which would be acceptable to most of the consumers and satisfy the international and local recommended water quality standards. Improvement of effluent water quality from MSFs observed in various research projects have been highlighted below:
10

(a) Physical water quality • Coarse media filters have normally been specified to produce an effluent with
turbidity less than 10-20 NTU10. • SSF effluent turbidities in the range of 0.1 to 0.2 NTU were typical for high-quality
source waters. However, in general effluent turbidities less than 1 NTU can be achieved1.
• Under varying condition of operation, SSF treating raw waters of turbidity 5-30 NTU produced a good quality filtrate with turbidity well below 1 NTU14.
(b) Chemical water quality • Under varying conditions of raw water quality, there was a marginal reduction in
the pH value of water due to filtration14. • Under tropical conditions, shading of SSF did not materially influence the length
of filter run and produced a filtrate with a more or less uniform Dissolved Oxygen(DO) throughout the day14.
• Removal of organic substances was generally in the range of 15 % to 25 %1. • The DO in the filtrate was found to be lower with lower rates of filtration8. • The organic content (COD) of raw water ranged from 4.5 to 10.5 mg/L reduced
from 50% to 72% through filtration process and this reduction was independent of rate of filtration14.
• 33% to 66% TOC removal was achieved through multistage filtration units9. (c) Microbial water quality • Slow Sand Filtration has been shown to be effective in achieving removal of
Giardia and viruses1. • Bacteriological results have clearly shown that when the filter was run without
interruption, a filtrate of consistently satisfactory quality was obtained. However, when switched over to intermittent operation, a definite deterioration in bacterial quality occurred13.
• It has been observed that the slow sand filter operated at 0.1 m/h delivered water free from E. coli on 66 occasions out of total 71 samples tested and when it was operated at 0.2 m/h delivered water free from E. coli on 72 occasions out of total 76 samples tested8.
• In a study in Latin America 69.5 to 75.2 percent reduction of faecal coliform densities were achieved through coarse media filtration11.
• To evaluate the effectiveness of SSF for rural water supply schemes it has been proposed to provide extra filter area or stand by units for allowing sufficient time for the growth of biological layers on sand surface16.
11

Chapter 2: METHODOLOGY AND LABORATORY PROCEDURES 2.1 Design and set up of model MSF Units 2.1.1 Number of filter units As shown in the Figure 2.1 the experimental set up consisted of a dynamic roughing filter (DyRF) chamber at the beginning, followed by an up-flow roughing filter (URF) chamber before final slow sand filter(SSF) chamber to cope with high turbidity load. Plate-2.1 and 2.2 show the laboratory experimental multistage filtration units with water feeding arrangement. 2.1.2 Construction materials These chambers were made of MS sheet welded with MS angle at the edges and supported on MS angle legs to allow the influent water flowing by gravity from inlet to outlet end. All chambers were fitted with interconnecting pipes, water sample collection port and drainage outlet. 2.1.3 Size and shape Cross sectional area, height and other particulars are listed below in Table 2.1 Table 2.1: Detail description of laboratory experimental units
MSF units Shape Size (mm) and Area Height (mm) DyRF Rectangular (250+150) x 250 = 0.625 m2 800 URF Circular 540 Dia = 0.23 m2 1200 SSF Rectangular 500 x 1200 = 0.50 m2 1200
2.1.4 Number of experimental run and duration Total four experimental runs were conducted under different environmental and filter bed
conditions during a period of six months from July 2006 to December 2006.
Table 2.2: Details of experimental runs - duration, bed and flow conditions MSF Units Duration Bed Materials &
Bed Exposure Condition Flow Rate & Type of Flow
1st Run 28 days Comparatively Coarser Materials Unshaded
Fixed Flow (0.2 m/h) Uninterrupted Flow
2nd Run 40 days Moderately Coarse Materials Shaded
Variable Flow Rates Intermittent/Uninterrupted
3rd Run 21 days Moderately Coarse Materials Shaded
Variable Flow Rates Intermittent /Uninterrupted
4th Run 40 days Comparatively Finer Materials Shaded
Variable Flow Rates Intermittent /Uninterrupted
12

Dynamic Roughing Filter Size: (250+150)mm x 250mm
Area : 0.0625 m2
Up-flow Roughin Size: 500 mm Area : 0.23 m Area : 0.5 m2
125 FB Over flow
Drain
Filtrate
Drain
100
1200
800
700
200
Slow Sand Filter Size: 1000mm x 500mm
Over flow
River Water
Figure 2.1: Layout Diagram o imental Set up of Multi stage Filtration Units
9
g Filter Dia 2
f Exper

Plate 2.1: Front View of the Laboratory Multistage Filtration Units
Plate-2
46.2: Laboratory Raw water Feeding Arrangement to MSFs
Particularly, during the 4th experimental run, variable flow conditions were maintained. Table 2.2 shows the variable conditions and the duration of experimental runs. 2.1.5 Filter materials characteristics The DyRF and URF chambers were filled with different sizes of brick chips as shown in the Table 2.3 and Table 2.4. The SSF chamber was also filled by graded sand layers placed on graded brick chips under drainage system as shown in Table 2.5. The filters were washed to remove all dust before use. During the 1st run, coarser sand materials were used and during the 2nd and 3rd runs, comparatively finer sand materials were used. However, two different sand layers were maintained during the 4th run. Table 2.3: Characteristics of coarse media in dynamic roughing filter
Position in Filter Bed
Sieve Analysis Results
1st Run* (28days)
2nd Run** (40days)
3rd Run** (21days)
4th Run ** (42 days)
Passing through Sieve #
⏐ ∀ (12.5 mm)
… ∀ (6.3 mm)
… ∀ (6.3 mm)
… ∀ (6.3 mm)
Top Layer (50 mm thick)*
(125mm thick)** Retaining on
Sieve # … ∀
(6.3 mm) # 4
(4.75 mm) # 4
(4.75 mm) # 4
(4.75 mm) Passing through Sieve #
⏐ ∀ (12.5 mm)
⏐ ∀ (12.5 mm)
⏐ ∀ (12.5 mm)
⏐ ∀ (12.5 mm)
Middle Layer (225 mm thick)
Retaining on Sieve #
… ∀ (6.3mm)
… ∀ (6.3mm)
… ∀ (6.3mm)
… ∀ (6.3mm)
Passing through Sieve #
1 ∀ (25 mm)
1 ∀ (25 mm)
1 ∀ (25 mm)
1 ∀ (25 mm)
Bottom Layer (225 mm thick)
Retaining on Sieve #
⏐ ∀ (12.5 mm)
⏐ ∀ (12.5 mm)
⏐ ∀ (12.5 mm)
⏐ ∀ (12.5 mm)
Table 2.4: Characteristics of coarse media in up-flow roughing filter Position in Filter Bed
Sieve Analysis Results
1st Run* (28days)
2nd Run**(40days)
3rd Run** (21days)
4th Run** (42 days)
Passing through Sieve #
⅜ ∀ (9.5 mm)
⅜ ∀ (9.5 mm)
⅜ ∀ (9.5 mm)
⅜ ∀ (9.5 mm)
Top Layer (250 mm thick)*
(350 mm thick)**
Retaining on Sieve #
… ∀ (6.3 mm)
… ∀ (6.3 mm)
… ∀ (6.3 mm)
… ∀ (6.3 mm)
Passing through Sieve #
⏐ ∀ (12.5 mm)
⏐ ∀ (12.5 mm)
⏐ ∀ (12.5 mm)
⏐ ∀ (12.5 mm)
Middle Layer (250 mm thick)*
(350 mm thick)** Retaining on
Sieve # ⅜ ∀
(9.5 mm) ⅜ ∀
(9.5 mm) ⅜ ∀
(9.5 mm) ⅜ ∀
(9.5 mm) Bottom Layer
(250 mm thick)* Passing through
Sieve # 1 ∀
(25 mm) 1 ∀
(25 mm) 1 ∀
(25 mm) 1 ∀
(25 mm)
47

(100 mm thick)**
Retaining on Sieve #
⏐ ∀ (12.5 mm)
⏐ ∀ (12.5 mm)
⏐ ∀ (12.5 mm)
⏐ ∀ (12.5 mm)
Table 2.5: Characteristics of filter sand materials in slow sand filter
4th Run (42days) Characteristic of sand materials
1st Run (28days)
2nd Run (40days)
3rd Run (21days) Top 15
cm Top 15 to 150
cm Fineness Modulus
(FM)
2.42 2.26 2.21 1.84 1.98
D60 0.67 0.60 0.56 0.46 0.47
D10 0.25 0.25 0.25 0.21 0.22
Uniformity Coefficient
(U)
2.68 2.40 2.24 2.16 2.14
Passing through
Sieve #
8 16 16 16 16
Retaining on Sieve # 100 100 100 100 100
Filter Bed Exposure Unshaded Shaded Filter Bed
2.1.6 Range of filtration rate Six different ranges of filtration rate were maintained for three filtration steps as follows: Table 2.6: Various range of filtration rates maintained in multistage filter units
Range and Rate of Filtration (m/h) MSF Units 1st 2nd 3rd 4th 5th 6th
DyRF 0.80 1.20 1.60 2.00 2.40 3.20 URF 0.22 0.33 0.43 0.54 0.65 0.87 SSF 0.10 0.15 0.20 0.25 0.30 0.40
2.2 Simulation of surface water quality 2.2.1 Collection of surface water samples from field Prior to the laboratory experiment work, river water samples from the arsenic affected areas were collected during high rainy season and analyzed for turbidity, color and thermotolerant coliforms (TTC) concentrations to assess the extreme water quality situation of the field. The results have been summarized in the Table 2.7 which indicates that flowing waters of river and streams contain more suspended particles causing more turbidity than still water of pond.
48

2.2.2 Preparation of laboratory raw water During the experimental run fresh water was collected every day from polluted ponds and was mixed with tap water and a small portion of silt/clay at desired proportions for the simulation of field surface water quality and to obtain a concentration within the average range of values shown in the Table 2.7. Continuous mixing was done with electric motor driven propeller to maintain homogenous condition and to keep the turbid particles in suspension. From the mixing tank water was pumped to an elevated tank provided with overflow pipe and flow control valves to maintain fixed head flow conditions. The desired rate of flow was maintained through regular measuring pf the flowing water and adjusting the check valve.
Table 2.7: Water quality of river water in the arsenic affected area Sampling Location Water quality
Parameters River Gomoti (Muradnagar)
River Dakatia
(Hajigonj)
River Dhaleswari
(Sirajdikhan)
Average Range of
Conc.
Turbidity (NTU) 55 – 65 85 – 95 100 – 110 80 – 90
Color
(Pt.Co.Unit)
40 – 45 50 – 55 50 – 60 46 – 53
TTC
(CFU/100ml)
250 – 300 300 – 350 400 – 500 320 – 550
2.3 Collection of water samples for laboratory analysis 2.3.1 Sampling procedure and water quality analysis Water samples were collected from different sampling points after certain interval from the starting of the process, determining the average detention times of water in each unit on the basis of flow rate and pore volume of the media. For physical and chemical quality investigation water samples were analyzed for turbidity and color regularly. However, time to time samples were analyzed also for pH, electroc conductivity (EC), dissolved oxygen (DO), ammonia and the permanganate values. A visible range spectrophotometer was used to measure color value and ammonia concentration. Portable turbidimeter, pH meter, DO meter and EC meter was used to determine the results directly at the experimental set up site. For microbial quality analysis TTC numbers were determined regularly using membrane filtration and occasionally E. coli numbers were also determined. During the 3rd and 4th runs samples were sent to ICDDR-B Environmental Microbiology Laboratory for Coliphage and Clostridium Perfringens (C. Perfringens) analysis. C. Perfringens is considered as an index of faecal pollution particularly an index of enteric viruses and protozoa in treated drinking water supplies. Similarly Coliphages which typically replicates in the gastrointestinal tract of humans and warm blooded animals, is an index of viral movement and removal 4. 49

2.3.2 Duration of experimental run and interpretation of data Experiments were conducted under variable flow rates, types of flow, different range of impurity concentrations in raw water and filter bed conditions. For a particular combined set of experimental condition, physical water quality parameters were tested at least for two weeks, however, microbial and chemical water quality parameters were tested for a period of at least one week. Daily at least three water samples were collected with some interval from each sampling point to get an average value result. Excel spread sheets were used for the calculation of mean, median and percentage removal from raw water analysis data.
2.4 Problems encountered during the experimental runs • During the experiment runs following problems were encountered, however,
measures were taken to solve those problems: • Collected pond water quality was not uniform and organic pollutants concentration
and TTC counts were some times very high. • Overnight storage of pond water in the mixing tank gave rise of high TTC count • Maintaining uniform raw water turbidity level through the experimental period was
very difficult. • Adjustment of a particular rate of flow was not simple. • Trapping of air inside the interconnecting pipes some times stopped the flow of water. • Bulking of sand filter chamber during high head loss caused cracks in the filter bed.
50

Chapter 3: ANALYSIS OF PHYSICAL WATER QUALITY IMPROVEMENT
3.1 Removal Mechanisms Physical quality of effluent water, particularly turbidity and colour, is important in assessing the efficiency of a surface water treatment system. These two physical water quality parameters are also important from aesthetic considerations, particularly acceptability to consumers for domestic consumption. The following sections describe the mechanism of removal of turbidity and colour through different MSF units. 3.1.1 Roughing Filters The water enters the Dynamic Roughing Filter(DyRF) unit from the top and passes downward through the coarse media before entering the subsequent Up-flow Roughing Filter(URF). Both the Roughing Filters allow deep penetration of suspended materials in to a filter bed and they have large silt storage capacity. When raw water flows through a packed bed of coarse media, a combination of filtration and gravity settling takes place which invariably reduces the concentration of suspended solids. Moreover, sinuous flow of water through the interstices of coarse media provides repeated contacts among the small suspended particles to form compact settleable flocs5. A portion of the agglomerated floc settle on the surface and within the interstices of coarse media, which further helps in adsorbing finer particles as they come into contact with the settled flocs. In an up-flow system as the flow emerges from the coarse media, due to sudden drop of velocity, agglomerated flocs settle on the top of coarse media bed forming a layer of sludge blanket which is also effective in the removal of finer particles.
3.1.2 Slow Sand Filter The removal mechanisms of particles in a Slow Sand Filter(SSF) include mechanical straining, sedimentation, adsorption, and chemical and biological activities. Large and fine particles of suspended matter are deposited at the surface of the filter bed by the action of mechanical straining and sedimentation respectively. The sedimentation process is enhanced by the flocculation of fine particles during sinusoidal/converging flow across the interstices of filter media. While colloidal and dissolved impurities are removed by the action of adsorption. By chemical and biological oxidation, the deposited organic matter is converted into inorganic solids and discharged with filter effluent5.
3.2 Effect of process variables on removal efficiency The physical quality improvement performances of coarse media pre-filters, were investigated in all the experimental runs observing the effects of the following process variables and appropriate design criteria have been developed. The maximum raw water turbidity and color concentrations, mean values and average percent removals under different environmental conditions have been calculated and
51

presented in the following sections to describe the performance of respective units and to determine the design criteria. 3.2.1 Effect of filter bed materials It was noted in section 2.1.5, that for the DyRF and URF, comparatively smaller sizes coarse media with higher depth were used in the 2nd, 3rd and 4th experimental runs, compared to the 1st experimental run, as a consequence slightly better turbidity removal of suspended particles were observed in those runs. The effect of the bed materials on turbidity reduction performance is presented in the Table 3.1 and also shown in Figure 3.1. The results indicate that average turbidity reduction through DyRF and URF in the 2nd, 3rd and 4th experimental runs were identical, i.e. around 58% and 27% respectively, because sizes and depths of coarse media were symmetrical in those cases.
Table 3.1: Role of filter bed materials on MSFs effluent turbidity value Average Effluent Concentration
(NTU) Experimental
Run #
Average Raw Water
Conc. (NTU) DyRF URF SSF
Average Cumulative %
Removal
1st Run (0.20 m/h) 90 43.2 (52%)
22.5 (23%)
1.05 (23.8%)
98.8%
2nd Run (0.20 m/h) 85 35.7 (58%)
12.8 (27%)
0.7 (14.2%)
99.2%
3rd Run (0.20 m/h) 77 32.2 (58%)
11.3 (27%)
0.7 (14.1%)
99.1%
4th Run (0.20 m/h) 87 35.2 (59%)
13.0 (26%)
0.6 (14.3%)
99.3%
[Rate of Filtration: DyRF = 1.6 m/h, URF = 0.43 m/h and SSF = 0.20 m/h]
52

Figure 3.1: Variation of turbidity removal performance in different MSFs with experimental run
52 58 58 59
23
27 27 26
23.814.2 14.1 14.3
1.2 0.8 0.9 0.7
0
20
40
60
80
100
1st Run 2nd Run 3rd Run 4th RunExperiment Run Number
% R
emov
al E
ffici
ency
DyF URF SSF Residual
Whereas, Figure-3.2, indicates that average colour removal under the same experimental condition through DyRF and URF processes were only 11% and 25% respectively. In SSF bed comparatively finer sand media having successively lower Fineness Modulus(MF), D60 and Uniformity Co-efficient(U) were used in the subsequent experimental runs, however, more or less same effective size(D10) sand was used.
53Figure 3.2: Variation of color removal performance in different MSFs
with experimental run
9 10 10 12
2025 26 25
44
2721 20 17
44
44 46
0
20
40
60
80
100
1st Run 2nd Run 3rd Run 4th Run
Experiment Run Number
% R
emov
al E
ffici
ency
DyF URF SSF Residual

Figure 3.1 indicates that, because of substantial turbidity removal through coarse media pre-filtration processes, removal of turbidity through slow sand filtration process were not very significant (less than 15%) particularly during the last three experimental runs. Figure-3.3 shows that overall average SSF effluent turbidity values in all the experimental runs reduced from 85 NTU to 0.75 NTU which is much lower than the Bangladesh Environmental Quality Standard (EQS, 1997) of 10 NTU. This effluent turbidity value matches with other research findings1. Although this turbidity value does not satisfy the recommended turbidity value of 0.1 NTU for effective disinfection process, however, it is much less than the turbidity value which is usually acceptable to consumers, i.e. 5 NTU4.
Figure-3.3: Reduction of Turbidity Value in Different MSF Units
0
10
20
30
40
50
60
70
80
90
Raw DyRF URF SSFFiltration Stages
Turb
idity
in N
TU
1st Run 2nd Run 3rd Run 4th Run
Avg. Raw WaterTurbidity = 85 NTUAvg. SSF Effluent Turbidity = 0.75 NTURate of Filtration = 0.20 m/h
The completely reverse situation was observed in case of color removal, where major portion of color removal occurred through slow sand filtration process and average removal of color through slow sand filtration was about 45% as depicted in Table 3.2. Figure 3.4 shows that overall average SSF effluent colour values in all the experimental runs reduced from 41 Pt.Co.Unit to 8.9 Pt.Co.Unit which is lower than the Bangladesh EQS,97 of 15 Pt.Co.Unit. This value is usually acceptable to consumers and above which most people can detect color4.
Table-3.2: Role of filter bed materials on MSFs effluent colour value
Experimental Run #
Average Raw Water
Average Effluent Concentration (Pt.Co.Unit)
Average Cumulative %
54

Conc. (Pt.Co.Unit)
DyRF URF SSF Removal
1st Run 50 45.5 (9%)
35.5 (20%)
13.5 (44%)
73%
2nd Run 41 36.9 (10%)
26.7 (25%)
8.6 (44%)
79%
3rd Run 35 31.5 (10%)
22.4 (26%)
7.0 (44%)
80%
4th Run 37 32.5 (12%)
23.3 (25%)
6.3 (46%)
83%
[Rate of Filtration: DyRF = 1.6 m/h, URF = 0.43 m/h and SSF = 0.20 m/h]
Figure-3.4: Reduction of Color Value in Different MSF Units
0
10
20
30
40
50
60
Raw DyRF URF SSFFiltration Stages
Col
or in
Pt.C
o.U
nit
1st Run 2nd Run 3rd Run 4th Run
Avg. Raw Water Color = 41 Pt.Co. Unit Avg SSF Effluent Color = 8.9 Pt. Co. UnitRate of Filtration = 0.20 m/h
Summary
Filter media Size Range- Coarse media pre-filtration steps are effective only for the reduction of turbidity, while SSF is effective for the reduction color value. Coarse media size range and depth of bed in DyRF and URF are more important parameter rather than SSF media size range for the reduction of turbidity. Filter bed materials used during the 4th experimental run may be selected for the design. 3.2.2 Effect of raw water turbidity Variation of turbidity value through different multi filtration stages under different raw water turbidity levels have been presented in the Table 3.3 and shown in Figure 3.5.
55

56
Figure-3.5: Turbidity Removal Efficiency in MSF Units under Different Raw Water Turbidity Level
0
10
20
30
40
50
60
70
DyRF URF SSFFiltration Stages
% T
urbi
dity
Red
uctio
n 75 125 300 400 475

Dynamic Roughing Filter was capable to handle high level of turbidity and on average 60% removal was achieved, which was almost same for all ranges of raw water turbidity tested. Subsequent removal through URF process only was also around 64% and overall further reduction of turbidity through URF process was 26%, resulting an average cumulative removal of 86% after two stage prefiltration processes. Average final removal of turbidity through SSF process was found around 13.5% only. Table-3.3 indicates that removal of turbidity through all the multistage filter units were almost same irrespective of raw water turbidity level. Table 3.3: Role of Raw Water turbidity on the Turbidity Removal Performance
Raw Water Average Turbidity Range (NTU)
75 125 300 400 475
Filtration Stages
of MSFs Average Effluent Concentration (NTU)
Average Turbidity
Removal (%)
DyRF 31.6 (59%)
51.6 (59%)
121 (60%)
160 (60%)
180 (62%)
Raw/DyRF= 60%
URF 11.6 (26%)
18.4 (27%)
42 (26%)
55 (26%)
60 (25%)
Raw/URF = 86% DyRF/URF = 64%
SSF 0.69 (14.1%)
0.94 (13.3%)
1.0 (13.5%)
1.2 (13.7%)
1.3 (12.7%)
Raw/SSF = 99.5%
[Rate of Filtration: DyRF = 1.6 m/h, URF = 0.43 m/h and SSF = 0.20 m/h]
Summary It is usually recommended that influent turbidity to SSF should not exceed 10 NTU for effective operation of SSF1,3, however, in other study it has been observed that SSF treating raw waters turbidity value up to 30NTU produced a good quality of water with turbidity well below 1NTU14. Therefore, a moderate influent turbidity limit around 20 NTU may be proposed for SSF and from the Table-3.3, it may be concluded that in case of raw water turbidity level greater than 150 NTU, either pre-settling process in a plain sedimentation tank should be adopted, or water should be passed through an infiltration gallery for the removal of settleable suspended solids before multistage filtration processes. If the raw water level remains within 60 NTU, DyRF step may be omitted. 3.2.3 Effect of flow rate of slow sand filtration The performance of different filtration units operated at various rates of filtration is summarized in Table-3.4 and presented in Figures-3.6. It was observed that the turbidity removal performance of DyRF reduced with successive higher filtration rate, however, increased in case of URF and SSF and ultimately total cumulative turbidity removal variation was found negligible up to maximum SSF operation rate of 0.20-0.25m/h. This result occurred because of the fact that, suspended particles which were washed away due to higher velocity of flow from upper units finally retained on sand filter bed.
57

Table-3.4: Variation of turbidity (reduction in percent) with flow rate of filtration
Figure-3.6: Variation of Turbidity Removal Efficiency with Rate of Filtration [Uniterrupted Flow]
6054
48
2328
27
16.3 17.223.8
0
20
40
60
80
100
0.10-0.15m/h 0.20-0.25m/h 0.30-0.40m/hFiltration Rate
% R
emov
al E
ffici
ency
DyRF URF SSF
Multistage Filtration Units Average
DyRF Rate of
F0.80 - 1.20 m/h 1.60 - 2.00 m/h 2.40 - 3.20 m/h in Turbidity
Variation
(Decrease) iltration Cumulative % 60 % 54 % 48 %
Removal - 20 %
URF Rate of
F0.22 - 0.33 m/h 0.43 - 0.54 m/h 0.65 – 0.87 m/h
Average
iltration Variation
(Increase) Cumulative % 83 % 82 % 75 %
Removal + 15 %
SSF Rate of
F0.10 - 0.15 m/h 0.20 - 0.25 m/h 0.30 - 0.40 m/h
Average
iltration Variation
(Increase) Cumulative % 99.3 % 99.2 % 98.8 %
Removal + 31.5 %
hen the SSF filter was operated at a filtration rate of 0.30-0.40m/h, a definite Wdeterioration of performance was observed as it happened in other studies8. Moreover, it was observed from the Figure 3.7, that increases of filtration rate beyond 0.20-0.25m/h also exceed the proposed slow sand filter influent turbidity value of 20 NTU.
58

59
egarding the effect of rate of filtration on color removal performance, Figure 3.8 shows
Figure-3.7: Variation of SSF Influent Turbidity with Rate of Filtration
10
12.5
15
17.5
20
22.5
25
0.10-0.15m/h 0.20-0.25m/h 0.30-0.40m/h
Rate of Filtration
Turb
idity
in N
TUContinous Flow Discontinous Flow
Rthat removal performance of DyRF and SSF processes decreased with rate, and the rate of decrease of performance was comparatively higher in case of colour than turbidity removal.
Figure-3.8: Variation of Color Removal Efficiency with Rate of Filtration [Uniterrupted Flow]
11 10 7
21 21 23
5550 49
0
20
40
60
80
100
0.10-0.15m/h 0.20-0.25m/h 0.30-0.40m/hFiltration Rate
% R
emov
al E
ffici
ency
DyRF URF SSF

Since the average color removal capacity of slow sand filter bed was about 44%, to maintain an influent color value below 25 PT,Co.Unit, it is recommended that the flow rate should be limited within 0.20-0.25m/h as depicted from Figure 3.9.
ummary Rate of Filtration-To maintain slow sand filter influent turbidity value within
f intermittent operation of flow both interrupted and intermittent flow
Figure-3.9: Variation of Slow Sand Filter Influent Color Value With Filtration Rate
15
17.5
20
22.5
25
27.5
30
32.5
35
0.10-0.15m/h 0.20-0.25m/h 0.30-0.40m/hRate of Flow of Water
Colo
r in
Pt C
o Un
it
Continous Flow Discontinous Flow
SPermissible20 NTU and Color value within 25 Pt.Co.Unit, a filtration rate below 0.20-0.25m/h may be accepted.
.2.4 Effect o3The results of turbidity and colour tests undercondition have been compared in Figure-3.10 and Figure-3.11. It was observed that the method of filter operation did not have any effect on turbidity removal performance, however, removal performance of colour reduced during the intermittent flow condition. Because, during intermittent flow condition further decomposition of organic matter contributed colour to the effluent water.
60

ummary f Filter Operation- Intermittent operation affected the colour removal
ry f Filter Operation- Intermittent operation affected the colour removal
Figure-3.10:Variation of Cumulative Turbidity Removal Efficiency with Type of Flow Pattern
95
96
97
98
99
100
0.10-0.15m/h 0.20-0.25m/h 0.30-0.40m/hFiltration Rate of SSF
Perc
ent R
emov
alUninterrupted Flow Intermittent Flow
SMethod oMethod operformance not the turbidity removal performance. To obtain a better removal performance uninterrupted flow condition should be maintained. performance not the turbidity removal performance. To obtain a better removal performance uninterrupted flow condition should be maintained.
Figure-3.11: Variation of Cumulative Color Removal Efficiency with Type of Flow Pattern
60
65
70
75
80
85
0.10-0.15m/h 0.20-0.25m/h 0.30-0.40m/hFiltration Rate of SSF
Perc
ent R
emov
al
90Uninterrupted Flow Intermittent Flow
61

3.2.5 Variation of removal performance and head loss with operation period w in Figure-3.12 indicates that initially through DyRF turbidity removal efficiencies was lo
comparison to the subsequent periods, however, this reduction was not very significant. Although removal through URF and SSF processes were uniform throughout the operation period, there was an increase of head losses with operation period in both the filtration units. Figure 3.13 revealsl that initial head loss across URF bed was around 6.9 cm for a flow rate of 0.43 m/h and increased to a maximum value around 9.7 cm after
operation period. The SSF was quite different, where terminal head loss after 6 weeks of operation reached to a value around 20 cm. The head loss increase curve with time was extrapolated to determine the maximum expected head loss before cleaning. Maximum head loss through DyRF during this operation period was found less than 2 cm.
Figure-3.12: Variation of Turbidity Removal with Operation Time
0
5
10
15
20
25
30
35
40
45
1 2 3 4 6 7 8 9 10 11 12 13 14 15 16 17 18 19 20Operation Period in days
Efflu
ent T
urbi
dity
in N
TU
50 DyRF URF SSF
two weeks period of operation and remained almost constant for the rest 6 weeks
62
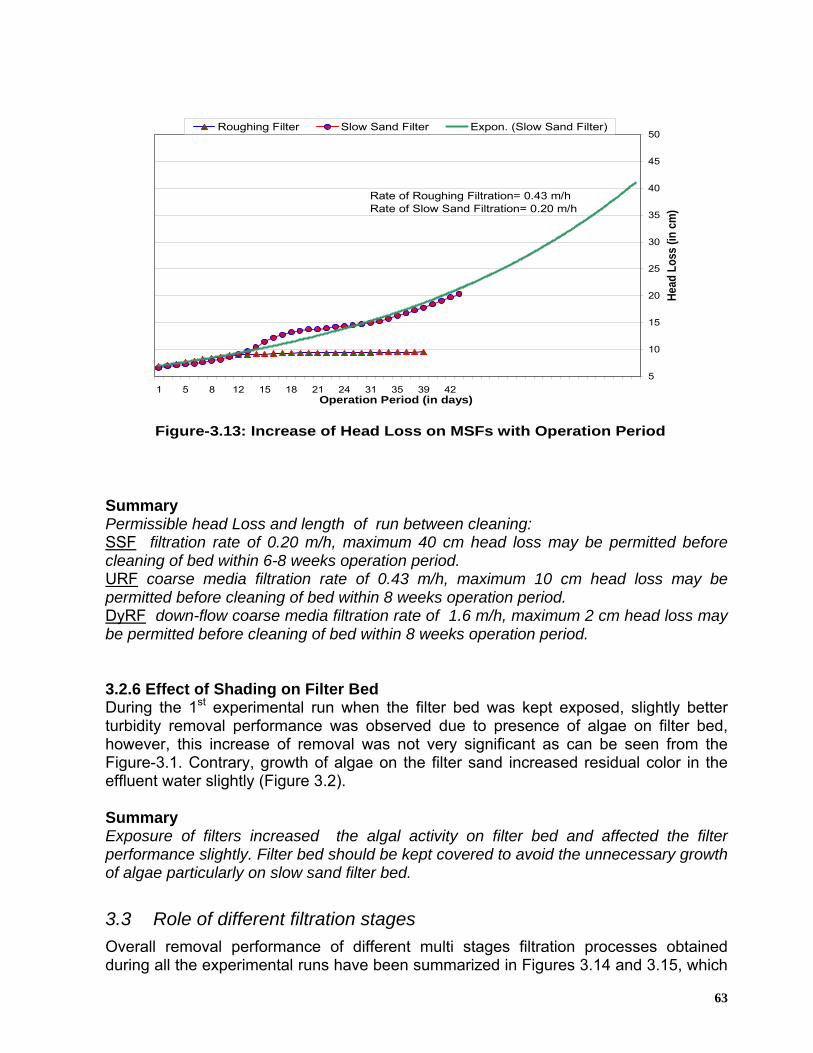
Figure-3.13: Increase of Head Loss on MSFs with Operation Period
5
10
15
20
25
30
35
40
45
50
1 5 8 12 15 18 21 24 31 35 39 42Operation Period (in days)
Head
Los
s (in
cm
)
Roughing Filter Slow Sand Filter Expon. (Slow Sand Filter)
Rate of Roughing Filtration= 0.43 m/h Rate of Slow Sand Filtration= 0.20 m/h
Summary Permissible head Loss and length of run between cleaning: SSF filtration rate of 0.20 m/h, maximum 40 cm head loss may be permitted before cleaning of bed within 6-8 weeks operation period. URF coarse media filtration rate of 0.43 m/h, maximum 10 cm head loss may be permitted before cleaning of bed within 8 weeks operation period. DyRF down-flow coarse media filtration rate of 1.6 m/h, maximum 2 cm head loss may be permitted before cleaning of bed within 8 weeks operation period. 3.2.6 Effect of Shading on Filter Bed During the 1st experimental run when the filter bed was kept exposed, slightly better turbidity removal performance was observed due to presence of algae on filter bed, however, this increase of removal was not very significant as can be seen from the Figure-3.1. Contrary, growth of algae on the filter sand increased residual color in the effluent water slightly (Figure 3.2). Summary Exposure of filters increased the algal activity on filter bed and affected the filter performance slightly. Filter bed should be kept covered to avoid the unnecessary growth of algae particularly on slow sand filter bed.
3.3 Role of different filtration stages Overall removal performance of different multi stages filtration processes obtained during all the experimental runs have been summarized in Figures 3.14 and 3.15, which
63

reveal that regarding reduction of turbidity, the role of two pre-filtration processes were very significant and on an average around 83% turbidity removal was achieved. Therefore, for moderately polluted surface water sources a residual turbidity value close to Bangladesh Standard (EQS,97) may be achieved without slow sand filtration. During a field investigation on PSFs attached with roughing prefiltration system, a better turbidity removal performance (around 90%) was observed through single stage URF process, however, removal through SSF process was less than the laboratory SSF model plant turbidity removal performance6,7.
Figure-3.14: Average Overall Turbidity Removal Efficiency of Multi Stage Filter Units
Residual Turbidity0.9%
Up-flow Roughing Filter25.5%
Slow Sand Filter16.6%
Dynamic Roughing Filter57%
Water quality results reveal that colour removal performance of two pre-filtration processes were not as effective as turbidity removal and around total 34% colour removal was achieved. However, in the field around 50% colour removal was observed through single stage URF process attached with PSFs. Removal of colour through SSF process was around 44% which was much better than the removal performance(21%) of field PSF6,7.
64

Figure-3.15: Average Overall Color Removal Efficiency of Multi Stage Filter Units
Residual Color21.5%
Up-flow Roughing Filter24%
Slow Sand Filter44.5%
Dynamic Roughing Filter10%
Summary Performance of two stage pre-filtration units was found very effective for the removal of turbidity and on an average 83% turbidity removal was achieved, however, removal of colour was found around 34% only. To obtain a reasonable residual colour value, the role of slow sand filtration was found very significant.
65

Chapter 4: ANALYSIS OF MICROBIAL WATER QUALITY IMPROVEMENT
4.1 Removal Mechanisms Roughing pre-filtration by coarse media can certainly provide the requisite protection for slow sand filtration in adverse raw water conditions as already been explained; but, in addition, it may contribute valuable improvements in microbiological quality. While some of this microbial removal may be assumed to be solids-associated and, therefore, removed from water by physical processes of adsorption and sedimentation, the contribution of the gravel pre-filter to overall microbial improvement is clearly significant. Previous examinations of the micro-fauna colonizing the mature gravel media confirmed that organisms were in fact identical to those usually associated with slow rate, finer grain filters such as slow sand filters10,11. This is an important observation because in many small scale water supplies in developing countries where reliable disinfection is rare, the addition of an extra dimension of biological treatment means that the multiple barrier principle may be applied even on a very small scale. Slow sand filtration accomplishes its treatment primarily through biological activity, with the bulk of this activity taking place on the surface of the sand bed. A layer develops on the sand surface that is called “Schmutzdecke,” an accumulation of organic and inorganic debris and particulate matter in which biological activity is stimulated. It has been found that some biological activity also extends deeper into the bed, where particulate removal is accomplished by bioadsorption and attachment to the sand grains1.
4.2 Effect of Process Variable on Removal Efficiency Microbiological quality of the end water passing through a treatment system is of utmost concern in terms of efficiency of the system in producing water suitable for domestic consumption. The microbial quality improvement performances of the multistage filtration units were investigated in all the experimental runs observing the effects of the following process variables on the removal of four types of indicator organisms. The maximum, median, mean, minimum values and average percent removals under different environmental conditions have been calculated and presented in the following sections to describe the performance and to determine the design parameters of MSFs.
4.2.1 Effect of Filter Bed Materials The effect of the bed materials on thermotolerant coliforms (TTC) removal performance has been presented in the Table 4.1 and also shown in Figure 4.1. The results indicate that average cumulative TTC removal performance through different filtration stages gradually increased during the successive experimental runs, because size, grading and depth of filter media, particularly slow sand filter materials were improved during the
66

successive experimental runs. It was observed that not only the Fineness Modulus (FM) or Effective Size(D10) of filter materials are the important criteria for filter material design, the size range (Passing sieve # and retaining on Sieve #) and gradation (Uniformity co-efficient) are also to be considered in the selection of filter materials. Table-4.1: Role of filter bed materials on microbial quality of SSF effluent
Effluent Concentration (TTC in CFU/100 ml)
Experimental Run #
Influent Average Concentration (TTC in CFU/100ml) Min Median Mean Max
Average Percent Removal
1st Run 1700 15 60 58 100 96.6 2nd Run 550 0 4 8 45 98.6 3rd Run 480 0 2 3 8 99.5 4th Run 570 0 1 2 6 99.6
[Rate of Filtration: DyRF = 1.6 m/h, URF = 0.43 m/h and SSF = 0.20 m/h] Summary Filter sand with following characteristics which was used during the 4th experimental run may be selected for the design: FM = 1.8-2.0 D10=0.21-0.22 mm D60 = 0.45-0.47 mm U = 2.14 -2.16 Filter Media Size Range = 0.15 mm to 1.1 mm.
4.2.2 Variation of removal with operation period On average, it was found that SSF performed well in removing TTC. Observation from the Figure 4.2 indicates that at the beginning of each filter run, the removal efficiencies were low in comparison to the subsequent periods and approximately 7 to 9 days were required to improve the removal performances under the laboratory test conditions. This can be attributed to the fact that during this period, the filter was establishing itself in terms of full development and establishment of the filter skin- Schmutzdecke. Rate of filtration, quality of feed water and other factors which obviously determine this ripening period. Summary At least 7 to10 days interval should be allowed for the ripening of the “Schmutzdecke” on filter sand before the filter bed is brought in to full operation for domestic use. Twin bed filter chambers may be used in place of single bed and cleaning may be performed alternatively to achieve the above purpose.
67
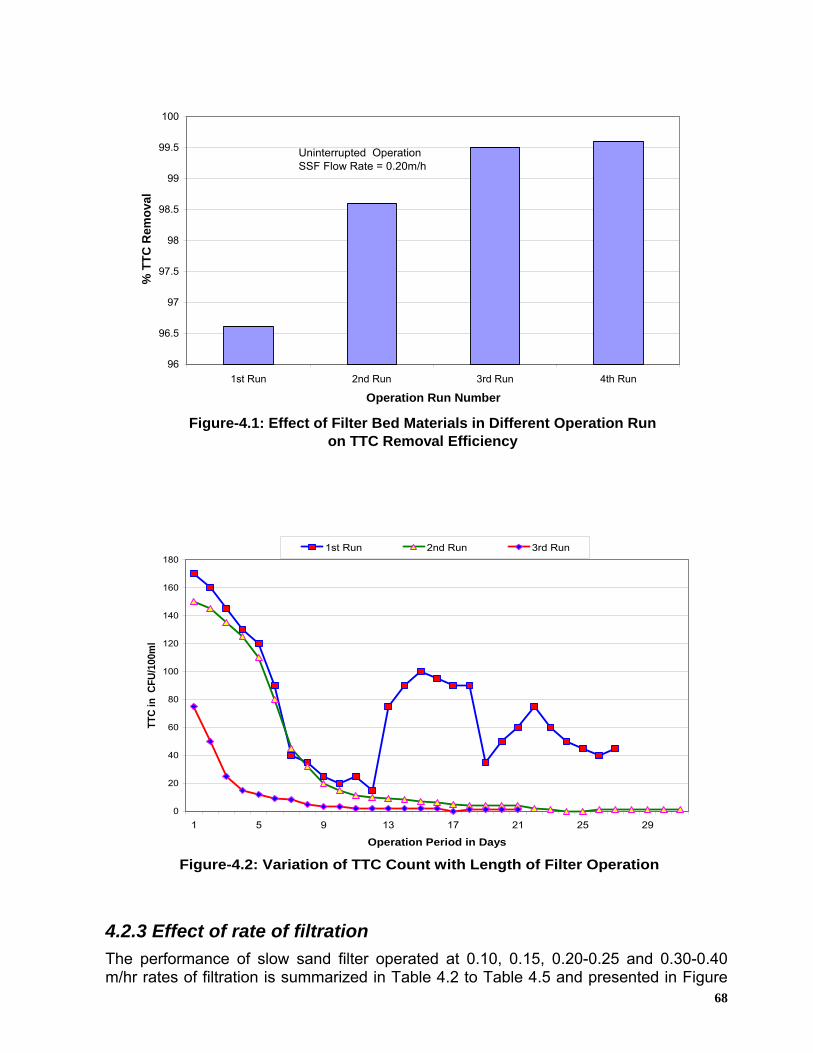
Figure-4.1: Effect of Filter Bed Materials in Different Operation Run on TTC Removal Efficiency
96
96.5
97
97.5
98
98.5
99
99.5
100
1st Run 2nd Run 3rd Run 4th Run
Operation Run Number
% T
TC R
emov
al
Uninterrupted OperationSSF Flow Rate = 0.20m/h
Figure-4.2: Variation of TTC Count with Length of Filter Operation
0
20
40
60
80
100
120
140
160
180
1 5 9 13 17 21 25 29
Operation Period in Days
TTC
in C
FU/1
00m
l
1st Run 2nd Run 3rd Run
4.2.3 Effect of rate of filtration The performance of slow sand filter operated at 0.10, 0.15, 0.20-0.25 and 0.30-0.40 m/hr rates of filtration is summarized in Table 4.2 to Table 4.5 and presented in Figure 68

4.3. It was observed that the filter operated at 0.1m/h delivered water free from E. coli in all the 14 samples tested during one week period of operation after ripening of bed, and only a single TTC colony was detected in one sample during that period under uninterrupted flow condition.
Figure-4.3: Effect of Rate of Filtration on Microbial Removal Efficiency
88
90
92
94
96
98
100
0.1 0.15 0.20-0.25 0.30-0.40
Rate of filtration ( in m/h)
% R
emov
al
Thermotolerant Coliform Escherichia Coli Coliphages Clostridium Perfringens
Uninterrupted Flow Condition
When the filter was operated at a filtration rate of 0.15m/h, the filter produced a filtrate that contained detectable E. coli and TTC and average densities of both the organisms were only 1 and average removal efficiency was 99.8 percent for both the cases. During the 4th run when the filter was operated at a filtration rate of 0.20 - 0.25m/h, average densities of E. coli and TTC in the filtrate were 1 and 2 respectively and average removal efficiency was 99.6 percent for both the cases. However, coliphages appeared only in one sample out of 20 samples tested during that period and average densities of coliphages and Clostridium Perfringens were less than 1. It was observed that the micro-organisms removal followed an inverse trend with regard to rate of filtration of water. Figure 4.4 indicates that rate of decrease of performance was quite significant beyond 0.20-0.25m/h filtration rate particularly for coliphages.
69

Figure-4.4: Variation of Different Types of Microbial Removal Efficiency under Various Filtration Rate
88
90
92
94
96
98
100
Thermotolerant Coliform Escherichia Coli Coliphages Clostridium Perfringens
Type of Microorganisms
% R
emov
al
0.1 m/h 0.15 m/h 0.20-0.25 m/h 0.30-0.40 m/h
Table 4.2: Role of filtration rate on microbial quality of slow sand filter effluent [Thermotolerant Coliform(TTC) under uninterrupted flow condition]
Effluent Concentration (CFU/100 ml) Experimental Run # (Rate of SSF
Filtration)
Influent Avg. Concentration (CFU/100 ml)
Min Median Mean Max Average Percent Removal
4th Run (0.10 m/h) 410 0 0 < 1 1 99.97
4th Run (0.15 m/h) 650 0 1 1 2 99.8
3rd Run (0.20-0.25
m/h)
480 0 2 3 8 99.5
4th Run (0.20-0.25
m/h)
570 0 1 2 6 99.6
4th Run (0.30 m/h) 500 3 6 5 7 99.0
4th Run (0.40 m/h) 485 4 6 6 7 98.8
Table 4.3: Role of filtration rate on microbial quality of slow sand filter effluent [Escherichia coli (E. coli) under uninterrupted flow condition]
Effluent Concentration (CFU/100 ml) Experimental Run # (Rate of SSF
Filtration)
Influent Avg. Concentration (CFU/100 ml)
Min Median Mean Max Average Percent Removal
4th Run (0.10 m/h) 350 0 0 0 0 100
4th Run (0.15 m/h) 480 0 1 1 2 99.8
4th Run (0.20-0.25
m/h)
250 0 1 1 2 99.6
70

4th Run (0.30 m/h) 320 2 4 4 5 98.7
4th Run (0.40 m/h) 200 3 5 5 6 97.5
Table 4.4: Role of filtration rate on microbial quality of slow sand filter effluent [Coliphages under Uninterrupted Flow Condition]
Effluent Concentration (PFU/100 ml) Experimental Run # (Rate of SSF
Filtration)
Influent Avg. Concentration (PFU/100 ml)
Min Median Mean Max Average Percent
Removal 2nd Run (0.20 m/h) 47 0 0 2 20 95.7
3rd & 4th Run (0.20 - 0.25 m/h)
22 0 0 < 1 5 99.1
4th Run (0.30 - 0.40
m/h)
38 0 < 3 4 15 89.5
Table 4.5: Role of filtration fate on microbial quality of slow sand filter effluent [Clostridium Perfringens under Uninterrupted Flow Condition]
Effluent Concentration (CFU/100 ml) Experimental Run # (Rate of SSF
Filtration)
Influent Avg. Concentration (CFU/100 ml)
Min Median Mean Max Average Percent Removal
2nd Run (0.20 m/h) 85 0 1 < 2 8 98.0
3rd & 4th Run (0.20 - 0.25 m/h)
37 0 0 < 1 2 99.2
4th Run (0.30 - 0.40 m/h)
58 0 0 < 1 3 99.0
Summary For a maximum filtration rate of ≤ 0.1m/h, an acceptable level of microbial quality of water may be obtained. However, at a filtration rate up to 0.15 m/h TTC and E. coli may appear occasionally. While this degree of microbial quality may be considered acceptable for small community water supplies, as a safety precaution, terminal disinfection of filtered water may be provided. Beyond 0.20-0.25 m/h filtration rate microbial quality deteriorate significantly. Other investigators also recommended a filtration rate close to 0.2 m/h8.
4.2.4 Effect of intermittent operation of flow The results of microbiological tests under interrupted flow conditions are presented in Table 4.6 to 4.9 and also shown in Figure 4.5. It was observed that the filter operated at 0.1m/h, delivered water that contained E coli unlike uninterrupted operation condition. Average concentration of E. coli and TTC densities were 1 and 3 respectively. When the filter was operated at a filtration rate of 0.15m/h the filter produced a filtrate where average concentration of E. coli and TTC densities were 3 and 4 respectively. It was clearly observed that when the filter was operated without interruption, a filtrate of consistently satisfactory quality was obtained. However, when switched over to intermittent operation, a definite deterioration in microbiological quality was noticed. The impairment did not occur soon after starting the filter, but after a period of time which
71
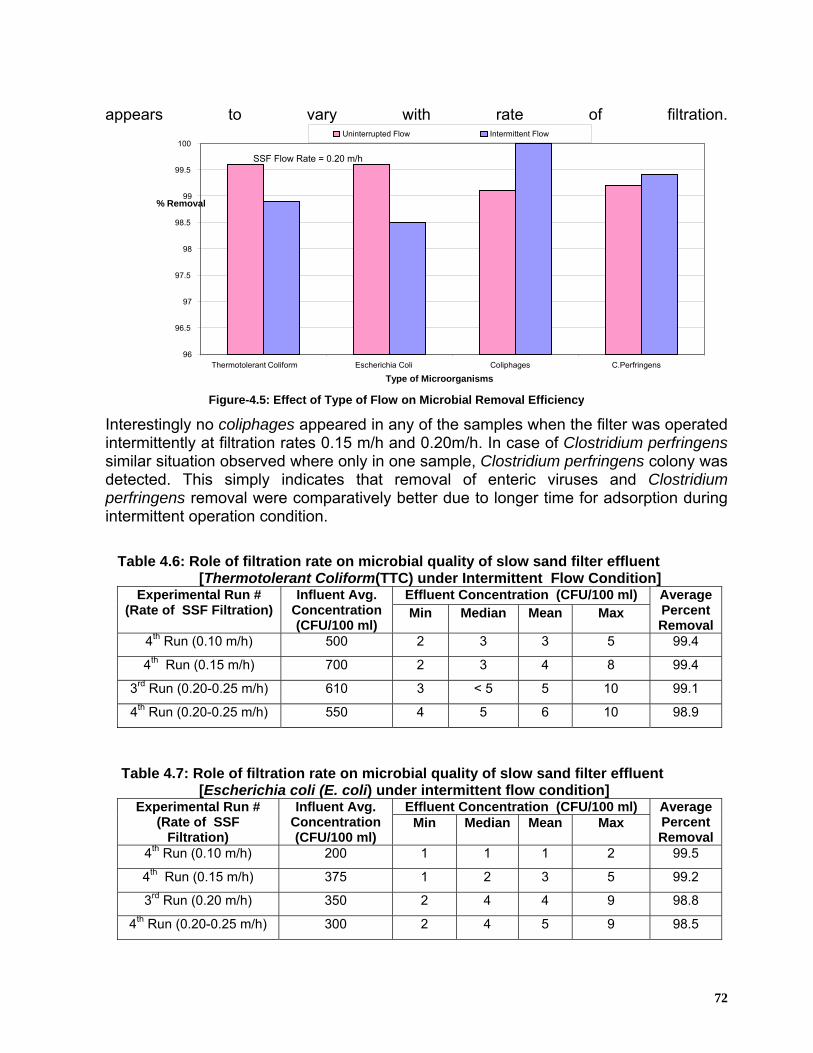
appears to vary with rate of filtration.
Interestingly no coliphages appeared in any of the samples when the filter was operated intermittently at filtration rates 0.15 m/h and 0.20m/h. In case of Clostridium perfringens similar situation observed where only in one sample, Clostridium perfringens colony was detected. This simply indicates that removal of enteric viruses and Clostridium perfringens removal were comparatively better due to longer time for adsorption during intermittent operation condition.
Table 4.6: Role of filtration rate on microbial quality of slow sand filter effluent [Thermotolerant Coliform(TTC) under Intermittent Flow Condition]
Effluent Concentration (CFU/100 ml) Experimental Run # (Rate of SSF Filtration)
Influent Avg. Concentration (CFU/100 ml)
Min Median Mean Max Average Percent Removal
4th Run (0.10 m/h) 500 2 3 3 5 99.4
4th Run (0.15 m/h) 700 2 3 4 8 99.4
3rd Run (0.20-0.25 m/h) 610 3 < 5 5 10 99.1
4th Run (0.20-0.25 m/h) 550 4 5 6 10 98.9
Table 4.7: Role of filtration rate on microbial quality of slow sand filter effluent [Escherichia coli (E. coli) under intermittent flow condition]
Effluent Concentration (CFU/100 ml) Experimental Run # (Rate of SSF
Filtration)
Influent Avg. Concentration (CFU/100 ml)
Min Median Mean Max Average Percent Removal
4th Run (0.10 m/h) 200 1 1 1 2 99.5
4th Run (0.15 m/h) 375 1 2 3 5 99.2
3rd Run (0.20 m/h) 350 2 4 4 9 98.8
4th Run (0.20-0.25 m/h) 300 2 4 5 9 98.5
lowIntermittent FlowUninterrupted F100
SSF Flow Rate = 0.20 m/h99.5
96
96.5
97
97.5
98
98.5
99mov
Thermotolerant Coliform oli
icroorganism
e% R al
Type of MColiphages
sEscherichia C C.Perfringens
Figure-4.5: Effect of Type of Flow on Microbial Removal Efficiency
72

73

Table 4.8: Role of filtration rate on microbial quality of slow sand filter effluent [Coliphages under intermittent flow condition]
Effluent Concentration (PFU/100 ml) Experimental Run # (Rate of SSF
Filtration)
Influent Avg. Concentration (PFU/100 ml)
Min Median Mean Max Average Percent Removal
4th Run (0.15 m/h) 38 0 0 0 0 100
3rd & 4th Run (0.20 - 0.25 m/h)
16 0 0 0 0 100
Table 4.9: Role of filtration rate on microbial quality of slow sand filter effluent [Clostridium perfringens under intermittent flow condition]
Effluent Concentration (CFU/100 ml) Experimental Run # (Rate of SSF
Filtration)
Influent Avg. Concentration(CFU/100 ml)
Min Median Mean Max Average Percent Removal
4th Run (0.15 m/h) 54 0 0 < 1 1 99.8
3rd & 4th Run (0.20 - 0.25 m/h)
17 0 0 < 1 1 99.4
Summary In a filter operated without interruption, a filtrate of consistently satisfactory quality was obtained. However, when switched over to intermittent operation, a definite deterioration in microbiological quality was noticed13. To obtain a better removal performance uninterrupted flow condition should be maintained.
4.2.5 Effect of Shading on Filter Bed Only in the 1st experimental run, the filter top was kept unshaded. The raw water was very polluted and as result there was heavy growth of algae on the surface. In some places of the bed thick layers of algal mats developed and after some days gradual sloughing of these mats occurred due to decay of underlying layer. The grey spots in the Plates 4.1 and Plate 4.2 indicate the algal growth and sloughed places on sand bed. Sloughing of thick mats left behind weak spots without having any Schmutzdecke on sand bed and microbial quality became very unpredictable as shown in the Figure 4.2. The overall microbial removal performance in the 1st run, therefore, was not satisfactory. The influence of shading on filter performance was, therefore, investigated covering the filter top with black polythene paper during the subsequent three experimental runs. As a consequence the above mentioned situation did not arise and microbial removal performance was comparatively better. Summary It may be concluded that shading of filters helps reduce the algal activity in the filters but does not affect the filter performance. Filter bed should be kept covered to avoid the unnecessary growth of algae on slow sand filter bed.
74

Plate-4.1: Growth of Algae on Filter Sand Bed
Plate-4.2: Sloughing of Algal mass from the Filter Sand Bed
75
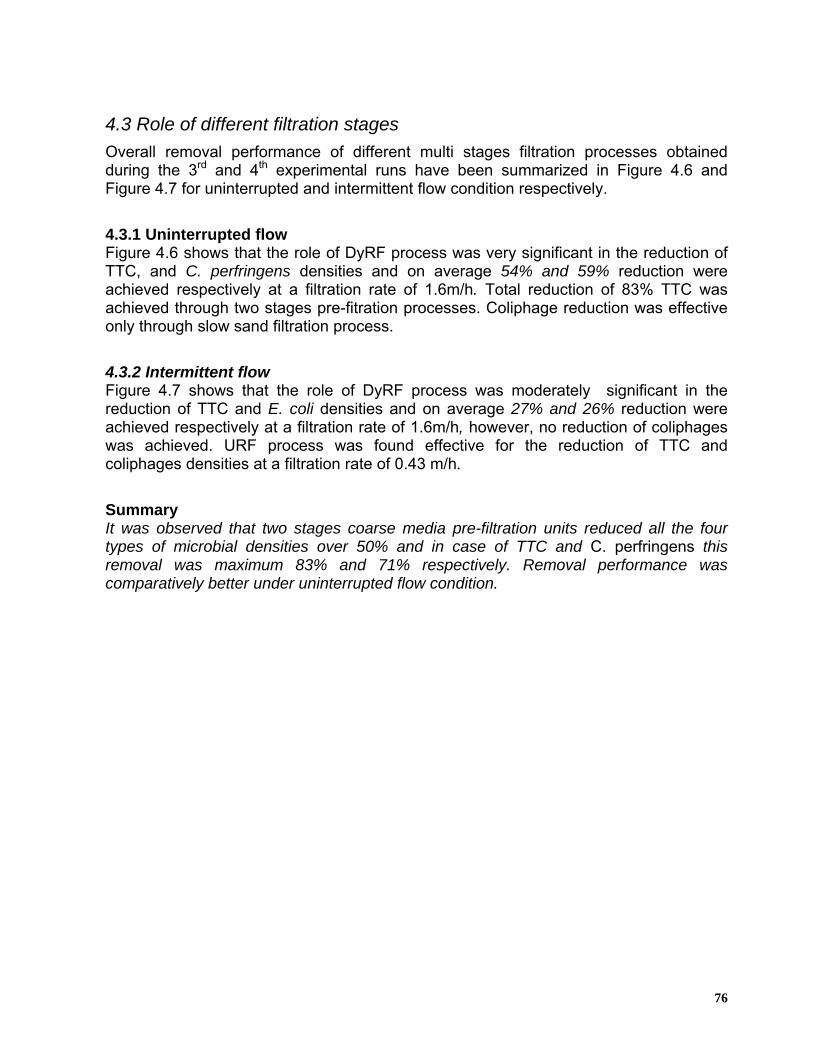
4.3 Role of different filtration stages Overall removal performance of different multi stages filtration processes obtained during the 3rd and 4th experimental runs have been summarized in Figure 4.6 and Figure 4.7 for uninterrupted and intermittent flow condition respectively.
4.3.1 Uninterrupted flow Figure 4.6 shows that the role of DyRF process was very significant in the reduction of TTC, and C. perfringens densities and on average 54% and 59% reduction were achieved respectively at a filtration rate of 1.6m/h. Total reduction of 83% TTC was achieved through two stages pre-fitration processes. Coliphage reduction was effective only through slow sand filtration process.
4.3.2 Intermittent flow Figure 4.7 shows that the role of DyRF process was moderately significant in the reduction of TTC and E. coli densities and on average 27% and 26% reduction were achieved respectively at a filtration rate of 1.6m/h, however, no reduction of coliphages was achieved. URF process was found effective for the reduction of TTC and coliphages densities at a filtration rate of 0.43 m/h.
Summary It was observed that two stages coarse media pre-filtration units reduced all the four types of microbial densities over 50% and in case of TTC and C. perfringens this removal was maximum 83% and 71% respectively. Removal performance was comparatively better under uninterrupted flow condition.
76

Thermotolerant Coliform
Dynamic RoughFilter54%
Residual0.4%Slow Sand
Filter16.6%
Up-flow Roughing Filter29%
Clostridium Perfringens
Dynamic Roughing Filter59%
Residual0.8%
Slow Sand Filter32.2%
Up-flow Roughing Filter8%
Coliphages
Dynamic Roughing Filter38%
Residual0.9%
Slow Sand Filter49.1%
Up-flow roughingFilter12%
Figure 4.6: Microbial removal performance in different multi-stage filtration processes [Uninterrupted Flow , 3rd & 4th Run, Rate of Filtration: DyRF = 1.6 m/h, URF = 0.43 m/h and SSF = 0.20 m/h]
77

78

Thermotolerant Coliform
Dynamic Roughing Filter27%
Residual1.3%
Slow Sand Filter16.7%
Up-flow Roughing Filter45%
Escherichia Coli
Dynamic Roughing Filter26%
Residual2%
Slow Sand Filter35%
Up-flow Roughing Filter37%
Clostridium Perfringens
Dynamic Roughing Filter44%
Residual0.6%
Slow Sand Filter28.4%
Up-flow Roughing Filter27%
Coliphages
Dynamic Roughing Filter0%
Residual0%
Slow Sand Filter46%
Up-flow roughing Filter54%
Figure-4.7: Microbial removal performance at different multi-stage filtration processes [Intermittent Flow , 3rd & 4th Run, Rate of Filtration: DyRF = 1.6 m/h, URF = 0.43 m/h and SSF = 0.20 m/h]
79
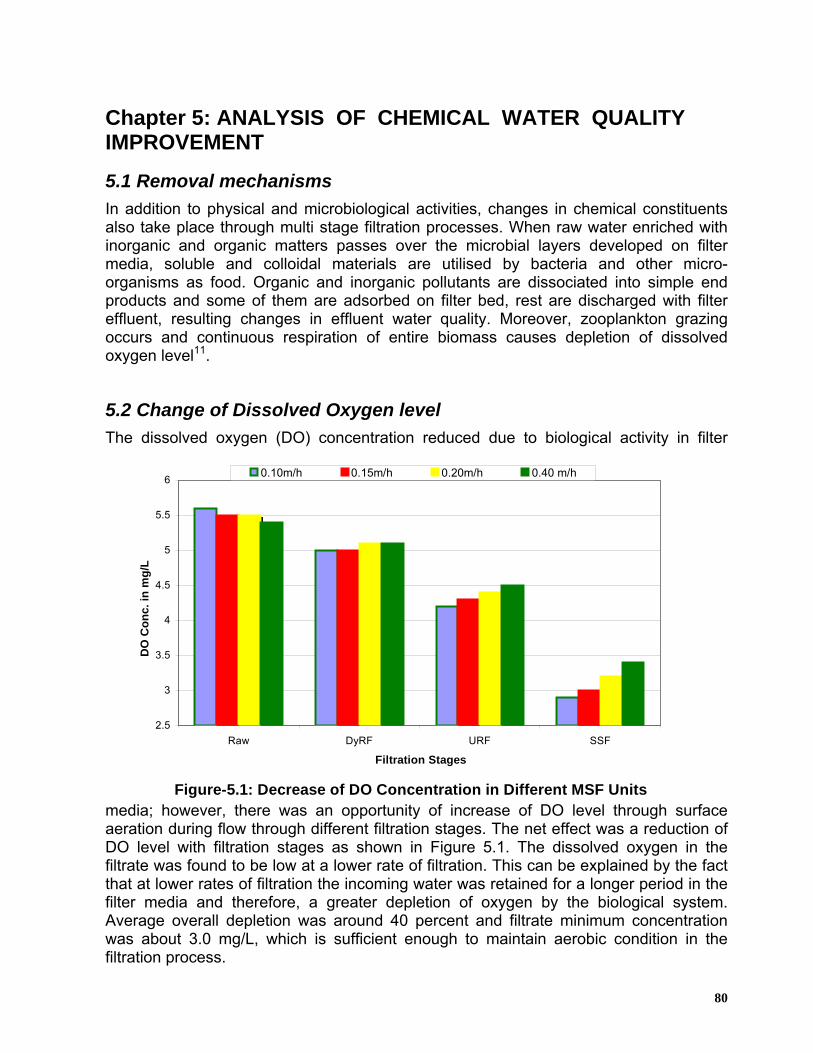
Chapter 5: ANALYSIS OF CHEMICAL WATER QUALITY IMPROVEMENT
5.1 Removal mechanisms In addition to physical and microbiological activities, changes in chemical constituents also take place through multi stage filtration processes. When raw water enriched with inorganic and organic matters passes over the microbial layers developed on filter media, soluble and colloidal materials are utilised by bacteria and other micro-organisms as food. Organic and inorganic pollutants are dissociated into simple end products and some of them are adsorbed on filter bed, rest are discharged with filter effluent, resulting changes in effluent water quality. Moreover, zooplankton grazing occurs and continuous respiration of entire biomass causes depletion of dissolved oxygen level11.
5.2 Change of Dissolved Oxygen level The dissolved oxygen (DO) concentration reduced due to biological activity in filter
media; however, there was an opportunity of increase of DO level through surface aeration during flow through different filtration stages. The net effect was a reduction of DO level with filtration stages as shown in Figure 5.1. The dissolved oxygen in the filtrate was found to be low at a lower rate of filtration. This can be explained by the fact that at lower rates of filtration the incoming water was retained for a longer period in the filter media and therefore, a greater depletion of oxygen by the biological system. Average overall depletion was around 40 percent and filtrate minimum concentration was about 3.0 mg/L, which is sufficient enough to maintain aerobic condition in the filtration process.
Figure-5.1: Decrease of DO Concentration in Different MSF Units
2.5
3
3.5
4
4.5
5
5.5
6
Raw DyRF URF SSF
Filtration Stages
DO
Con
c. in
mg/
L
0.10m/h 0.15m/h 0.20m/h 0.40 m/h
80

5.3 Reduction of Organic Pollutants The organic pollution in raw water estimated as oxygen consumed from Potassium Permanganate (KMnO4), varied from about 5.3mg/L to 8.0 mg/L. Due to multistage filtration, the average reduction in Permanganate Value (KMnO4) was about 60, 58, 55, 50 and 46 percent respectively at 0.10, 0.15, 0.20, 0.30 and 0.40 m/h filtration rates. Figure 5.2 indicates that there was no significant difference in organic removal with regard to rate of filtration.
Figure 5.2: Decrease of organic matter (KMnO4 Value) w ith rate of filtration
0
10
20
30
40
50
60
70
0.10m/h 0.15m/h 0.20m/h 0.30m/h 0.40m/h
Rate of SSF Filtration
% D
ecre
ase
of K
MnO
4 Va
lue
Average Raw W ater KMnO4 Value= 7.2 mg/L
5.4 Reduction of ammonia concentration
As depicted from Figure 5.3, average concentration of ammonia in raw water was around 0.5 mg/L and complete removal of ammonia was achieved through multi stage filtration processes. Like organic pollutant reduction, this reduction happened due to biological activity in filter media, i.e. biological oxidation of ammonia by nitrifying bacteria (Nitosomonas and Nitrobacter).
81

Figure 5.3: Reduction of ammonia concentration in different MSFs
0
10
20
30
40
50
60
70
80
90
100
DyRF URF SSF
Filtration Stages
% R
educ
tion
of A
mm
onia
Con
c.
1st Run 2ndRun 3rd Run
Avg. Raw W ater Concentration = 0.50 mg/L
5.5 Variation of pH values Biochemical reaction in filter media caused a decrease of pH value at the initial stage of the experimental runs, however, at the later part of the experimental runs this change was not very significant as can be seen from Figure-5.4. Because of the fact that the
raw water pH values of the first three experimental runs were slightly higher due to more uptake of carbon-dioxide through algal photosynthesis process during day light period.
Figure 5.4: Decrease of pH value in different MSFs
7.1
7.2
7.3
7.4
7.5
7.6
7.7
7.8
7.9
8
8.1
Raw DyRF URF SSF
Filtration Stages
pH v
alue
1st Run 2nd Run 3rd Run 4th Run
82

Decrease of pH resulted due to formation of carbon-dioxide as an end product of biological oxidation process.
5.6 Variation of Electric Conductivity value Biochemical reaction in filter media caused ionization of organic compounds resulting in an increase of total dissolved ions. Some portion of these ions adsorbed on filter media and a fraction escaped with effluent water resulting a net increase of electric conductivity at the later part of the experimental run. However, this change was not very significant as can be seen from Figure 5.5.
Figure-5.5: Increase of Electric Conductivity in Different MSFs
0
5
10
15
20
25
DyRF URF SSF
Filtration Stage
% In
crea
se o
f EC
1st Run 2nd Run 3rd Run
Summary Reduction of dissolved oxygen level inversely related to the flow rate of water, and on an average 40% reduction was observed during nominal flow rates maintained in the experimental runs. The same effect was also identified in other studies8. Average reduction of organic matters around 50% was achieved and this removal is approximately independent of rate of flow. Other studies on organic content removal through MSF observed the same fact14. During the filtration process there was slight decrease of pH value and increase of electric conductivity. Slight reduction of pH value during multistage filtration was also observed by other investigators14.
83

Chapter 6 OVER VIEW AND DESIGN PARAMETERS FOR MSF UNITS
6.1 Design parameters of MSF Units The key parameters for a multi stage filtration system design are the type and number of prefiltration stage, media size, filtration rate and raw water particle size and concentration, however, other parameters like method of filter operation, filter bed cleaning frequency and exposure condition of filter bed are also important. Improvement of physical, chemical and microbial quality of water through different units of multi stage filter have been summarized in the following section to develop the design parameters. 6.1.1 Maximum range of raw water quality (particle size) and number of filtration units
• Performance of two stage prefiltration units was found to be very effective for the removal of turbidity and on an average total 83% turbidity removal was achieved, however, removal of color was found around 34% only.
• It was also observed that two stages coarse media pre-filtration units reduced all
the four types of microbial densities over 50% and in case of TTC and C. perfringens this removal was maximum 83% and 71% respectively.
• During the filtration process there was slight decrease of pH value and increase of electric conductivity.
• In general, most existing Slow Sand Filter plants successfully treat surface water
having turbidity of less than 10 NTU which is recommended for an upper limits in designing new facilities.
• It is also recommended that influent turbidity to SSF should not exceed 30-40
NTU, to avoid frequent clogging of sand bed and to increase the length of run between cleaning.
Therefore, an intermediate influent turbidity value around 20 NTU may be proposed for SSF. To maintain this maximum proposed influent turbidity value, two stage prefiltration processes (DyRF and URF) should be adopted if the raw water turbidity level remains between 60 and 150 NTU. In case of raw water turbidity level greater than 150 NTU pre-settling should be included, however, if the raw water level remains below 60 NTU, DyRF step may be omitted. 6.1.2 Characteristics of filter bed materials
• Coarse media pre-filtration steps are effective only for the reduction of turbidity, while SSF is effective for the reduction of colour value and microbial densities.
• Coarse media size range and depth of bed in DyRF and URF are more important
parameter rather than SSF media size range for the reduction of turbidity.
84

• Filter sand size range is important for the reduction of colour concentration and microbial densities.
Filter bed materials used during the 4th experimental run may be selected for the design which is shown in the Figure 6.1.
6.1.3 Permissible range of filtration rate • To maintain slow sand filter influent turbidity value within 20 NTU and Color value
within 25 Pt.Co.Unit, a filtration rate below 0.20-0.25m/h may be considered acceptable.
• For a maximum filtration rate of ≤ 0.1m/h, an acceptable level of microbial quality
of water may be obtained. However, at a filtration rate up to 0.15 m/h TTC and E. coli may appear occasionally.
• It was observed that the micro-organisms removal performance follows an
inverse trend with regard to rate of filtration of water.
• Reduction of Dissolved oxygen level inversely related to the flow rate of water, and on an average 40% reduction was observed during nominal flow rates maintained in the experimental runs.
• Average reduction of organic matters around 50% was achieved and this
removal is approximately independent of rate of filtration.
Since microbial quality improvement is the most important objective of surface water treatment a SSF flow rate around 0.1 m/h may be chosen.
85

Depth: Top 100 – 150 mm, Size Range : 4.75 – 6.30 mm
Depth: Bottom 200 – 250 mm, Size Range : 12.5 – 25.0 mm
Depth: Middle 200 – 250 mm, Size Range : 6.3 – 12.5 mm
Down-flow Dynamic Roughing Filter Bed Characteristics
Depth: Middle 350 – 400 mm, Size Range : 9.5 – 12.5 mm
Depth: Bottom 100 – 150 mm, Size Range : 12.5 – 25.0 mm
Depth: Top 350 – 400 mm, Size Range : 6.3 – 9.5 mm
Up-flow Dynamic Roughing Filter Bed Characteristics
Sand Depth: 600 – 700 mm, Size Range: 0.15 to 1.1 mm, FM: 1.8-2.0 U: 2.14 –2.16, D10 : 0.20-0.22 mm
Under-drainage Depth: 150 – 200 mm, Size Range : 4.75 - 6.3 mm, 9.5 - 12.5 mm, 18.0 - 25.0 mm
Slow Sand Filter Bed Characteristics
Figure 6.1: Preferred filter bed materials for multi-stage filtration units
86

6.1.4 Method of filter operation • Method of filter operation did not affect the turbidity removal performance. • Colour removal performance reduced slightly during intermittent operation. • However, TTC and E. coli removal performance was seriously affected during the
intermittent flow condition. Therefore, to obtain a better removal performance uninterrupted flow condition should be maintained. 6.1.5 Permissible head loss and length of run between cleaning
• For a Slow sand filtration (SSF) rate of 0.20 m/h, maximum predicted head loss within 6-8 weeks operation period is around 40 cm.
• For an Up-flow coarse media filtration(URF) rate of 0.43 m/h, maximum predicted
head loss within 6-8 weeks operation period is around 10 cm. • For a Down-flow coarse media filtration (DyRF) rate of 1.6 m/h, maximum
predicted head loss within 6-8 weeks operation period is around 2 cm.
• About 7-10 days are required for initial ripening of the “Schmutzdecke” on filter sand.
Therefore, provision of total height of water level about 60 cm (10 cm Initial water depth + 40 cm head loss + 10 cm freeboard) should be kept over sand bed. Twin bed filter chambers may be used in place of singe bed and cleaning may be performed alternatively after 7 to 10 days interval to allow reasonable time for the initial ripening. 6.1.6 Exposure condition of filter bed
• Exposure of filter bed increased the algal activity on filter surface, however, the effect on physical quality was not very significant.
• Growth of algae seriously affected the microbial removal performance
The filter bed should be kept covered to avoid the unnecessary growth of algae particularly on slow sand filter bed. The physical, microbial and chemical performances of multistage filter units in the Laboratory and the effects of above design parameters have been summarized in the Table 6.2 to determine the design criteria of multistage filter units in the field.
87

6.2 Cleaning and maintenance of MSF units 6.2.1 Roughing filter units The Following procedures have been practiced in the field and found very effective for cleaning and maintenance of coarse filter media bed without removing them7. Both the dynamic and Up-flow Roughing filter chamber bottoms are provided with washout valves. Depending on raw water turbidity level once in every 6-8 weeks period, by simply opening the washout valves, the deposited particles are drained out through hydrostatic pressure of water. It may be necessary to make more than one flush to remove major portion of deposited particles, however, removal of all particles are not desired. Complete removal and washing of coarse media (khoa) would be necessary only after 5 to 6 months of operation. 6.2.2 Slow sand filter chambers One of the two Slow Sand Filter beds may be cleaned alternatively after every 6-8 weeks period using an alternative method of cleaning known as “harrowing”12 where the sand top is raked gently for 4–5 minutes by a comb harrow (250 mm width x 150 mm height with 50 mm long teeth connected with wooden handle), which penetrates 2-3 cm into the sand bed and detaches particles debris. The debris is then washed away by a continuous flow of water across the top of the sand bed by closing the filtrate outlet pipe and opening the waste water over-flow pipe valve placed just at the top level of the sand bed. Water is pumped again to repeat the same procedure 2 to 3 times. After cleaning of filter bed, the filtrate outlet pipe valve is kept closed for at least one week period and the bottom wash out valve is kept slightly open to allow very slow flow of water across the sand bed for the growth of biological layer on sand surface. Complete removal of filter sand, washing and replacing may be necessary after every 5 to 6 months period of operation.
Table 6.1: Schedule of cleaning of multi-stage filter units
Chamber /Unit Frequency of Cleaning Method of Cleaning
Dynamic Roughing Filter
Once in every 6-8 weeks without removing Khoa
Simply opening the bottom wash out valves and flushing out 2-3 times.
Up-Flow Roughing Filter
Once in every 6-8 weeks without removing Khoa
Simply opening the bottom wash out valves and flushing out 2-3 times.
Slow Sand Filter Bed
Alternatively one bed after every 6 –8 weeks period.
Scraping top 2- 3 cm sand bed by wooden scraper and opening waste water overflow pipe.
6.3 Conclusions and recommendations
• Two stage pre-filtration units was found to be very effective for the removal of turbidity and reduction of TTC and C. perfringens densities. On an average total 83%, 83% and 71% turbidity, TTC and C. perfringens removal was achieved respectively, however, removal of colour was found around 34% only.
88

• In case of raw water turbidity level greater than 150 NTU pre-settling arrangement should be made and if the raw water level remains within 60 to 150 both DyRF and URF units will be required, however turbidity value below 60 NTU, DyRF step may be omitted.
• Microorganisms removal performance followed an inverse trend with regard to
rate of filtration of water, therefore, to obtain the maximum removal performance without disinfection process, filtration rate should be kept around 0.10 m/h.
• Due to the type of flow condition microbial quality of water affected more than the
physical quality of water. To obtain a better microbial removal performance uninterrupted flow condition should be maintained.
• Microbial activity in filter bed caused a reduction of DO concentration around
40%, however, resulted a decrease of 50% organic content.
• The filter sand bed should be cleaned after every 6 to 8 week interval, however, twin bed filter chambers should be used in place of singe bed and cleaning may be performed alternatively after 7 to10 days interval.
• Filter bed materials have significant effect on water quality improvement
performance and should be kept covered to avoid the unnecessary growth of algae particularly on slow sand filter bed.
• It is recommended that to verify the laboratory test results, few pilot plants in the
field level should be constructed and monitored for finalization of design criteria and to estimate the construction cost.
89

Table-6.2: Determination of design criteria on the basis of water quality improvement performance of MSF Units. Water Quality Parameters Design
parameters Filter Stage Physical Quality Microbial Quality Chemical
Quality
Proposed Design Criteria
DyRF Depth:125+225+225=575 mm(# 4-…∀) / (…∀-⏐∀) / (⏐ ∀-1∀)
Depth:125+225+225=575 mm(# 4-…∀) / (…∀-⏐∀) / (⏐ ∀-1∀)
Depth: 500 to 750 mm ( 3 layers)(# 4-…∀) / (…∀-⏐∀) / (⏐ ∀-1∀)
URF Depth:375+375+100= 850 mm(…∀-⅜∀) / (⅜∀-⏐∀) / (⏐∀-1∀)
Depth:375+375+100= 850 mm(…∀-⅜∀) / (⅜∀-⏐∀) / (⏐∀-1∀)
Depth: 800 - 950 mm (3 Layer) (…∀-⅜∀) / (⅜∀-⏐∀) / (⏐∀-1∀)
Media Sizes and
Gradation
SSF D:600 mm,FM=1.8-2.0, D10=0.20-0.22
Range:0.15-1.1 mm, U= 2.10-2.15
D:600 mm, FM=1.8-2.0, D10=0.20-0.22
Range:0.15-1.1 mm, U= 2.10-2.15
Not Significant
D: 600 – 700 mm, FM=1.8-2.0, D10=0.20-0.22
Range:0.15-1.1 mm, U= 2.14-2.16
DyRF 1.60 - 2.00 m/h 0.80 - 1.20 m/h 1.60 - 2.00 m/h 0.80 - 1.20 m/h URF 0.43 - 0.54 m/h 0.22 - 0.33 m/h 0.43 - 0.54 m/h 0.22 - 0.33 m/h
Filtration Rate
SSF 0.20 - 0.25 m/h 0.10 - 0.15 m/h 0.20 - 0.25 m/h 0.10 - 0.15 m/h DyRF Turbidity: >75NTU and
<150NTU, Color : > 40 and < 60 Pt.Co.Unit
TTC: < 500 CFU/100ml
URF Turbidity: 40 to 60 NTU Color : 30- 35 Pt.Co.Unit
-
Influent Water Quality
SSF Turbidity: < 20NTU Color : < 25 Pt.Co.Unit
-
KMnO4 value < 10mg/L,
DO > 6.0 mg/L, pH value> 7.5
Raw Water Quality: Turbidity: >75NTU and <150NTU, Color : > 40 and < 50 Pt.Co.Unit
TTC: < 500 CFU/100ml, KMnO4 value < 10mg/L
DO > 5-6 mg/L
Type of Flow Condition
Intermittent
Uninterrupted
-
Uninterrupted
Safe Operation Period
6- 8 weeks 6- 8 weeks
-
6- 8 weeks
Exposure Condition
of Bed
Not Significant
Shaded
- Shaded
90

REFERENCES
1. "Water Quality and Treatment", 4th Edition, American Water Works Association, 1996. 2. "Water Filtration Technologies for Developing Countries", ENSIC, AIT, Bangkok, 1983 3. "Horizontal Flow Roughing Filter: An Appropriate Pretreatment for Slow Sand Filters in Developing Countries”, IRCWD- News, No. 20, August, 1984. 4. “Guidelines for Drinking Water Quality”, World Health Organization, Geneva, 2004. 5. Schulz,C.R., and Okun, D.A., "Surface Water Treatment in Developing Countries", 1984 6. Ahmed, F. “A Report on the Evaluation of Performance of the Modified PSFs with Roughing Filtration System”, BUET-UNICEF-DPHE Research Project, 2004. 7. Ahmed, F. “A Report on the Evaluation of Performance of the New Design PSFs (BUET Multistage Filters)”, BUET-UNICEF-DPHE Research Project, 2005. 8. Paramasivam, R., Sundaresan,B.B.,“Slow Sand Filters for Rural Water Supplies in Developing Countries”, Indian Journal of Environmental Health, NEERI, India, 1978. 9. Abernethy, R., “Multistage Filtration for North Haven, Maine”, Environmental Science & Engineering, 2004. 10. Gerado, G.C., Jorge, L.M., Alberto,G.C., “Multistage Filtration Technology” 11. Wheeler,D., “The Microbiological Benefits of Gravel Prefiltration”, Water & Waste Water Treatment. 12. Shawn,A.C., “Sustainable Drinking Water Treatment for Small Communities Using Multistage Slow Sand Filtration”, M.Sc Thesis, Waterloo, Canada, 2005. 13. Paramasivam, R., Joshi, N.S., Kelkar, P.S. and Dhage, S.S.,“Effect of Intermittent Operation of Slow Sand Filters on Filtered Water Quality”, Indian Journal of Environmental Health, NEERI,India,1980.
91

14. Joshi, N.S., Paramasivam, R., Kelkar, P.S. and Dhage, S.S.,“Water Quality Changes During Slow Sand Filtration”, Indian Journal of Environmental Health,NEERI,India,1982. 15. Joshi, N.S., Paramasivam, R., Kelkar, P.S. and Dhage, S.S.,“Performance Evaluation of Slow Sand Filter with Pretreatment by Infiltration Gallery”, Indian Journal of Environmental Health, NEERI, India, 1985. 16. Rao, R.R., Reddy, R.C., Rao, K.G. and Kelkar, P.S., “Assessment of Slow Sand Filtration System for Rural Water Supply Schemes” Indian Journal of Environmental Health, NEERI, India, 2003. 17. Mc.Ghee, T.J. “Water Supply and Sewerage”, McGraw-Hill Inc. 6th Edition, 1991.
92