Optimising Local Water Resources and … Local Water Resources and Availability in Urban and...
34
Optimising Local Water Resources and Availability in Urban and Peri-urban Chennai S.Janakarajan MIDS, Chennai 600 020 janak@mids ac in janak@mids.ac.in Presentation made in the Workshop on Anil Agarwal Dialogues: Excreta Does Matter Organized by Centre for Science and Environment, New Delhi 4-5, March 2013
-
Upload
nguyenngoc -
Category
Documents
-
view
214 -
download
0
Transcript of Optimising Local Water Resources and … Local Water Resources and Availability in Urban and...
Optimising Local Water Resources and Availability in Urban and Peri-urban Chennai
S.JanakarajanMIDS, Chennai 600 020
janak@mids ac [email protected]
Presentation made in the Workshop on Anil Agarwal Dialogues: Excreta Does MatterOrganized by g y
Centre for Science and Environment, New Delhi4-5, March 2013
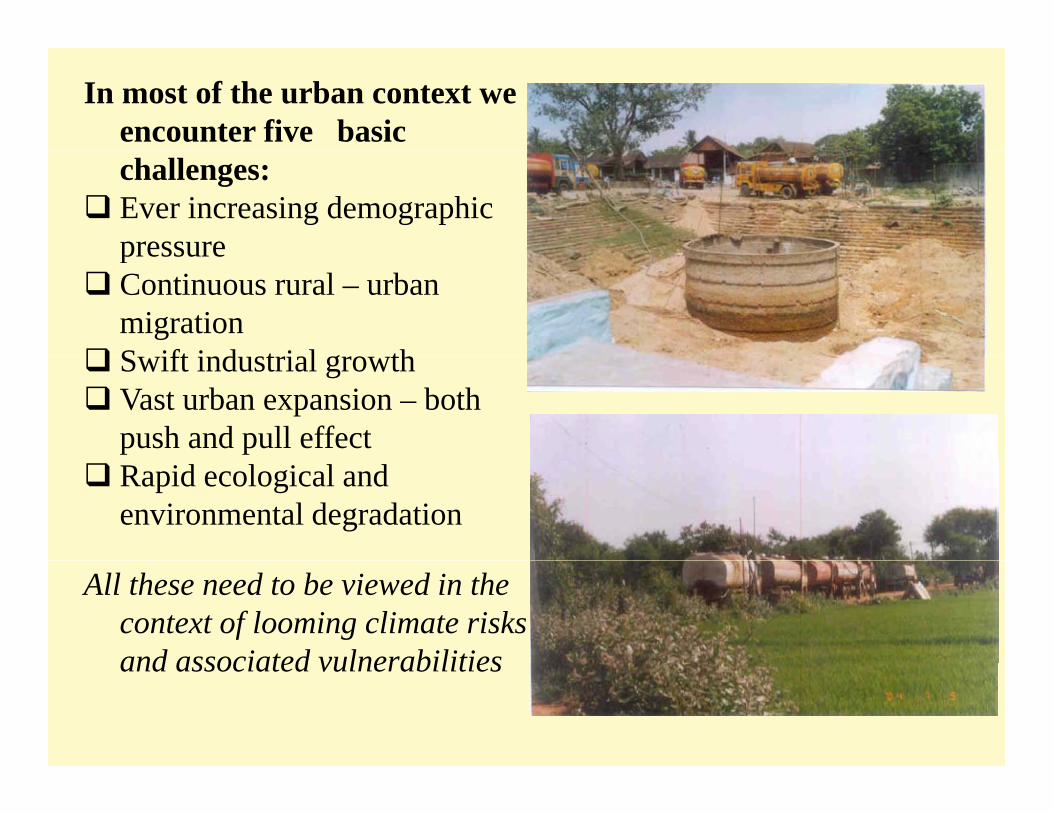
In most of the urban context we encounter five basic challenges:Ever increasing demographic pressurepressure Continuous rural – urban migration S ift i d t i l thSwift industrial growth Vast urban expansion – both push and pull effectRapid ecological and environmental degradation
All these need to be viewed in the context of looming climate risks and associated vulnerabilitiesand associated vulnerabilities

Consequences or emerging problems are,
Scarcity of land for urban useScarcity of land for urban useDrinking water scarcity - Inadequate, inequitable, unsafe and irregular supplyLack access to sanitationHuge flooding, water stagnation and lack of adequate storm water drains g g, g qDegradation of coastal ecology and seawater intrusionLack of land for housingMushrooming of slums - Unsanitary living conditions in slums, open drainage
systems and lack of access to toiletsUnhealthy solid waste management – including sewage and bio-medical wastesTransport / traffic congestion and declining per capita road space
Resulting in Pollution of air, water and land and overall secular decline in quality of life in both urban and peri-urban areas, restricted livelihood options and rising health concerns
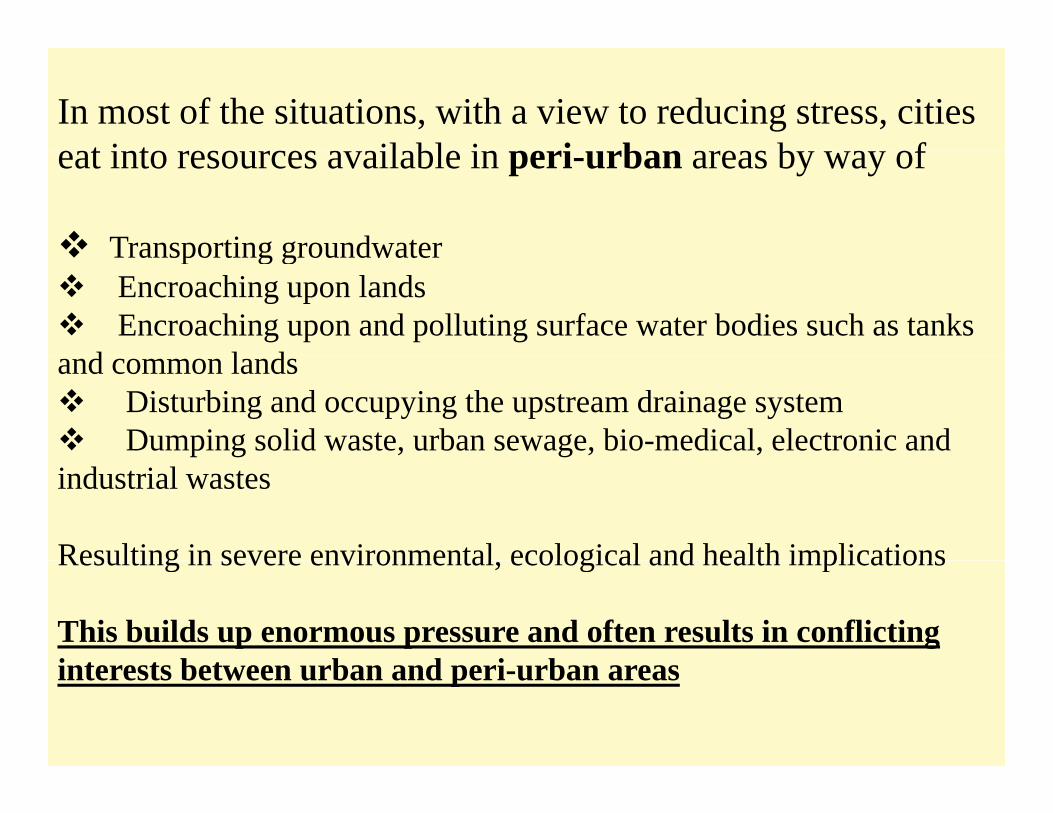
In most of the situations, with a view to reducing stress, cities t i t il bl i i b b feat into resources available in peri-urban areas by way of
Transporting groundwaterTransporting groundwater Encroaching upon lands Encroaching upon and polluting surface water bodies such as tanks
d l dand common landsDisturbing and occupying the upstream drainage systemDumping solid waste, urban sewage, bio-medical, electronic and
industrial wastes
Resulting in severe environmental ecological and health implicationsResulting in severe environmental, ecological and health implications
This builds up enormous pressure and often results in conflicting i t t b t b d i binterests between urban and peri-urban areas
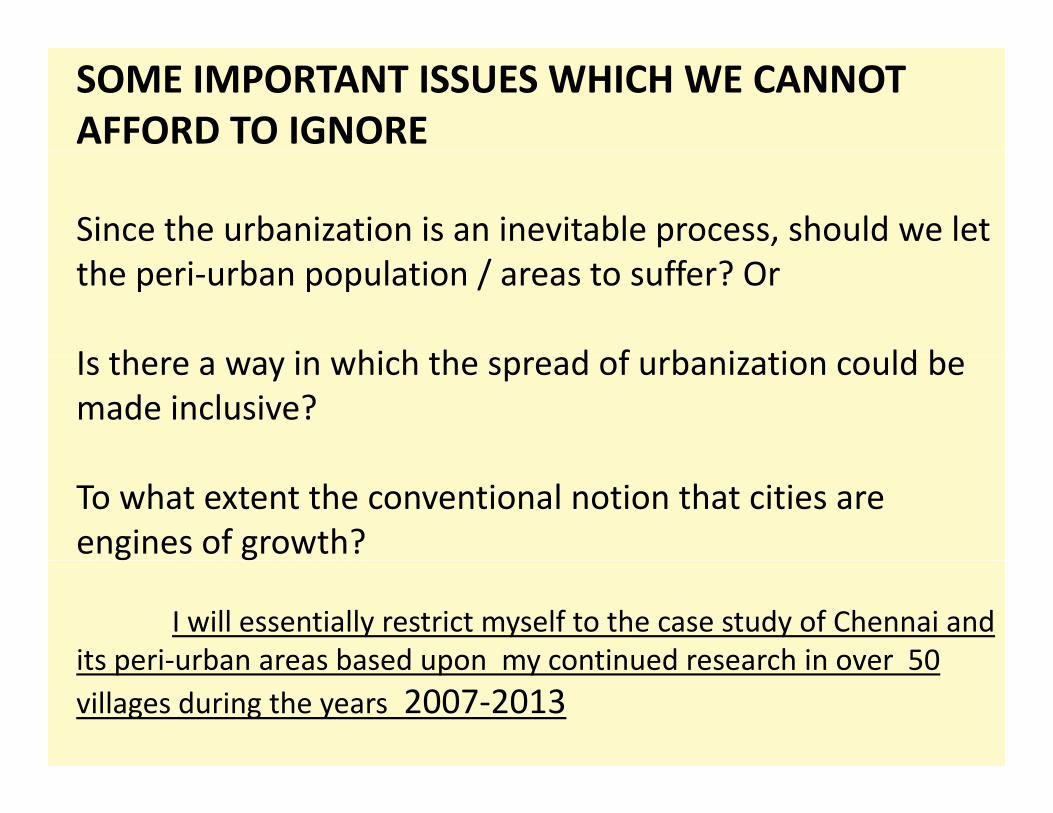
SOME IMPORTANT ISSUES WHICH WE CANNOT AFFORD TO IGNORE
Since the urbanization is an inevitable process, should we let the peri‐urban population / areas to suffer? Or
I th i hi h th d f b i ti ld bIs there a way in which the spread of urbanization could be made inclusive?
To what extent the conventional notion that cities are engines of growth?
I will essentially restrict myself to the case study of Chennai and its peri‐urban areas based upon my continued research in over 50its peri urban areas based upon my continued research in over 50 villages during the years 2007‐2013


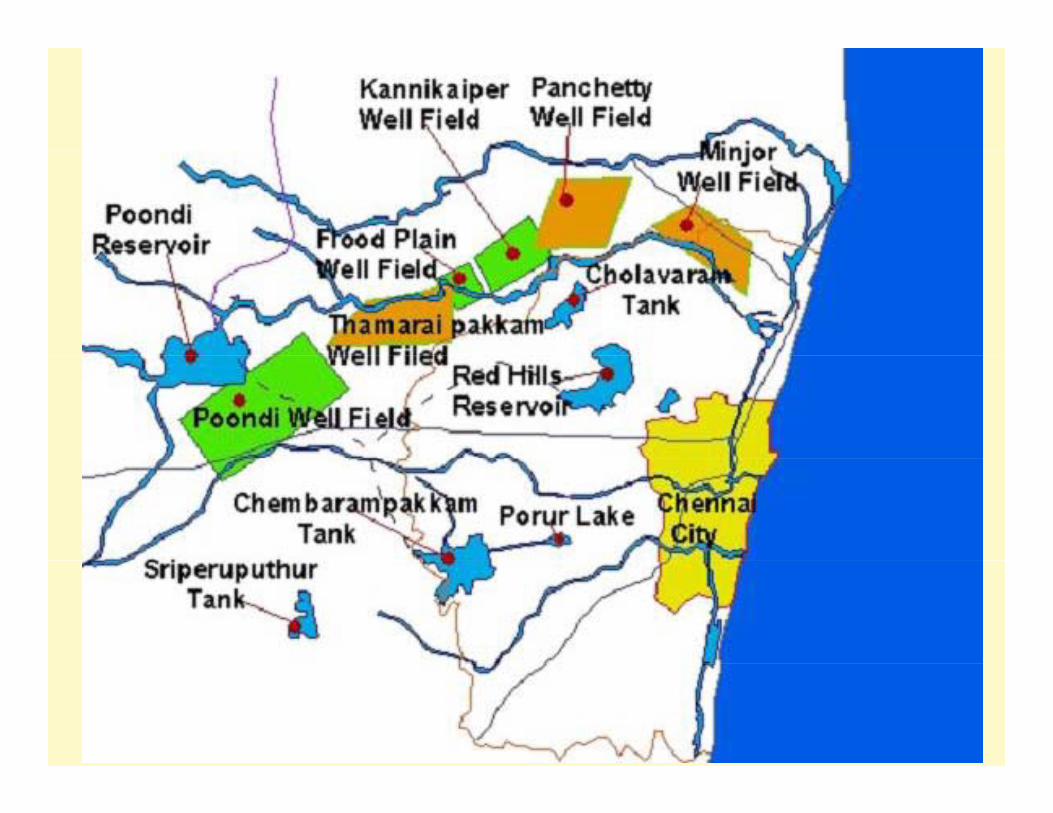
CHENNAICHENNAI-- WATER SOURCES AVAILABILITY WATER SOURCES AVAILABILITY
Sl.No. Name of Source Safe Yield in MLD
1. Poondi – Cholavaram – Red Hills lake system (includingdiversion of flood flow from Araniyar to Korataliyar) 227
2. Ground water from Northern well fields 683. Southern Coastal Aquifer 54. Local sources in AUA & DUA 32
Sub Total (A) 332
5 Krishna Water I Stage 4006 Krishna Water II Stage 530g7 New Veeranam (CWSAP –I) 1808 CWSAP – II (Proposed) 209 Sea Water Desalination 100
Sub Total (B) 1230Sub Total (B) 1230Grand Total (A) + (B) 1562
Projected Demand (2021)Projected Demand (2021) 1763 1763
Source: CMWSSBSource: CMWSSB

Chennai Chennai -- Water DemandWater Demand
Area Water Demand (MLD)
2006 2011 2021
Chennai City 861* 924 1012y 861 924 1012
Industries 100 150 250
Adjacent Urbanised 249 281 344Adjacent Urbanised Areas (AUA)
249 281 344
Distant Urbanised Areas (DUA)
113 126 157Areas (DUA)
Total 13261326 14811481 17631763* Water requirement was worked out @ 140 lpcd for a population of 6.15 Millions
Source: CMWSSB

Water supplied to Chennai CityWater supplied to Chennai City
Quantity of water supplied to City
00
700
4 .05
600.
0
500
600
mld
.23
6.65
29.3
5
06 23.3
223
9.6
243.
1124
2.87
7.66
3.05 35
.24
238.
8125
6.74
30.9
725
2.74
35.2
2 297.
1329
6.01 34
8.18
380.
0441
014
292.
23
363
300
400
antit
y in
m
202. 21
6 2216
1.61
114.
9419
8.0
22 2 2 221
721
314
0.05
2 2
144.
4915
4.18
149.
0315
3.19
2 3
112.
222
200.
155.
14
140.
54 205
100
200Qua
0
1971
1973
1975
1977
1979
1981
1983
1985
1987
1989
1991
1993
1995
1997
1999
2001
2003
2005
YearYear
City Supply in mldSource: CMWSSB
900
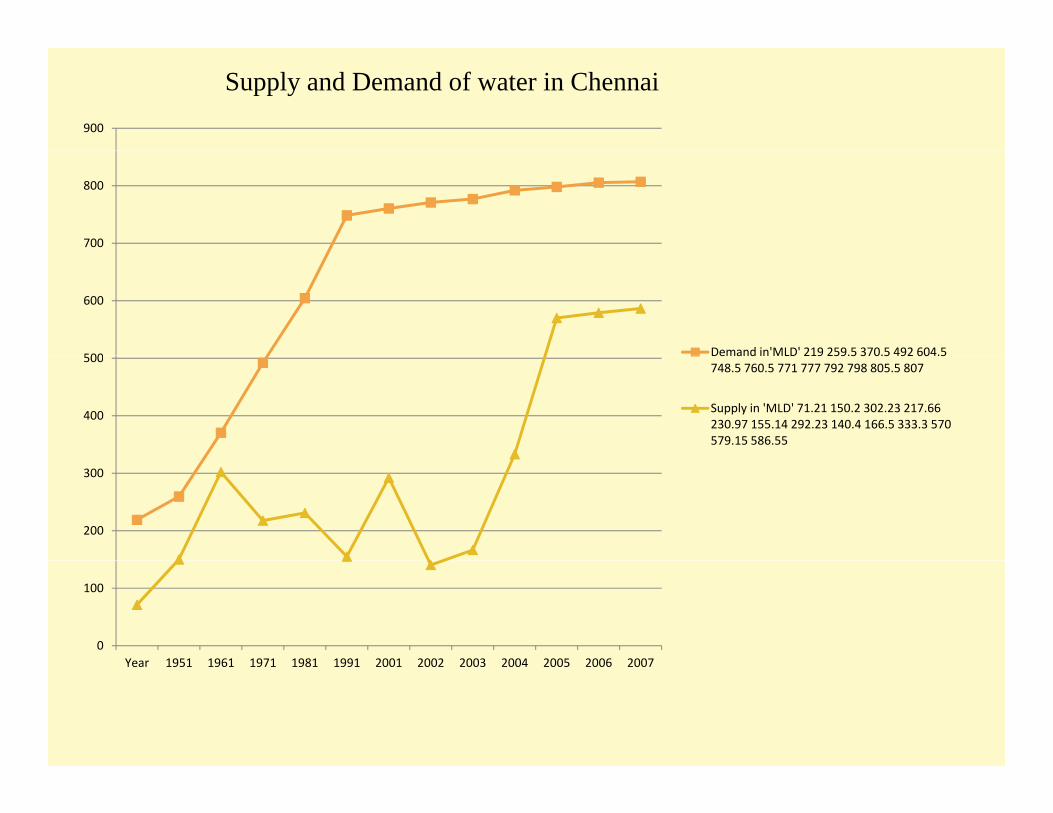
Supply and Demand of water in Chennai
700
800
500
600
Demand in'MLD' 219 259.5 370.5 492 604.5
400
500 Demand in MLD 219 259.5 370.5 492 604.5 748.5 760.5 771 777 792 798 805.5 807
Supply in 'MLD' 71.21 150.2 302.23 217.66 230.97 155.14 292.23 140.4 166.5 333.3 570 579.15 586.55
200
300
0
100
Year 1951 1961 1971 1981 1991 2001 2002 2003 2004 2005 2006 2007Year 1951 1961 1971 1981 1991 2001 2002 2003 2004 2005 2006 2007

CHENNAI WATER
Per capita water supply to the Chennai city’s population is still the lowest (76 lpcd)Per capita water supply to the Chennai city s population is still the lowest (76 lpcd) compared all big cities in India; that too not assured at all months for all sections of population
G b d l d d d i i iGap between and supply and demand is increasing
How the gap is met in Chennai?
Piped water supply accounts for about less than a fifth of the demand in Chennai
Informal and unregulated water market which brings water from peri-uran areas into ChennaiChennai
Own wells at one’s own source (about 60% of total needs of a hoisehold) - There are 4, 20,000 wells with a density of 2400 wells per sq.km as on 2005 (State Ground and Surface Water Resources Data Centre , WRO, PWD, GOTN, Taramani, Chennai:113, March 2005).
Bottled water – there are over 500 water companies around Chennai
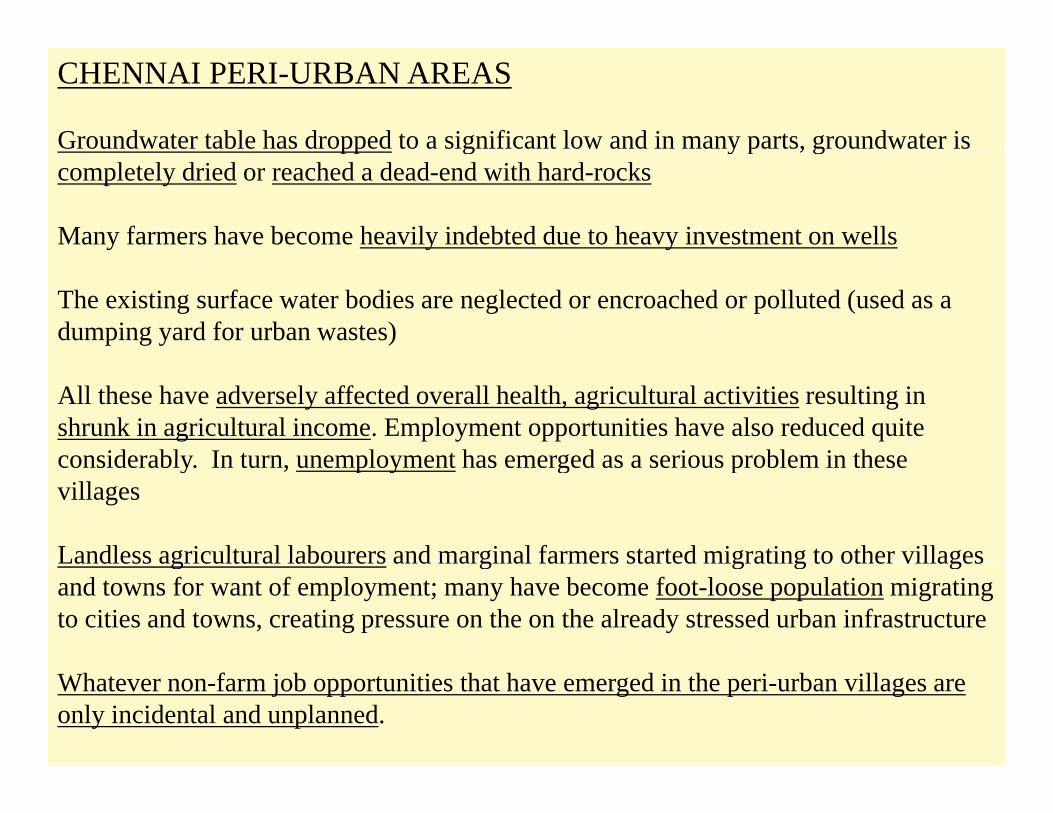
CHENNAI PERI-URBAN AREAS
Groundwater table has dropped to a significant low and in many parts, groundwater is pp g y p , gcompletely dried or reached a dead-end with hard-rocks
Many farmers have become heavily indebted due to heavy investment on wells
The existing surface water bodies are neglected or encroached or polluted (used as a dumping yard for urban wastes)
All these have adversely affected overall health, agricultural activities resulting in shrunk in agricultural income. Employment opportunities have also reduced quite considerably In turn unemployment has emerged as a serious problem in theseconsiderably. In turn, unemployment has emerged as a serious problem in these villages
Landless agricultural labourers and marginal farmers started migrating to other villagesLandless agricultural labourers and marginal farmers started migrating to other villages and towns for want of employment; many have become foot-loose population migrating to cities and towns, creating pressure on the on the already stressed urban infrastructure
Whatever non-farm job opportunities that have emerged in the peri-urban villages are only incidental and unplanned.

Water being pumped from a huge pump (collection point) g p p pfor distribution in the city
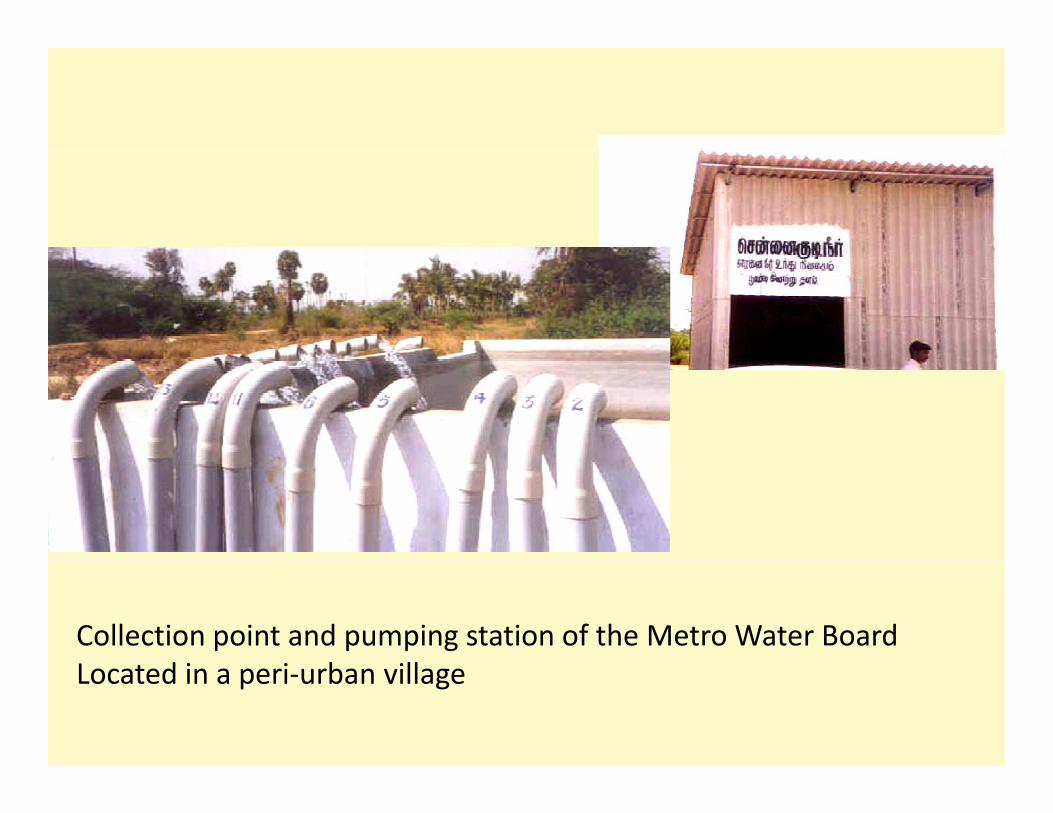
Collection point and pumping station of the Metro Water Boardd i i b illLocated in a peri‐urban village
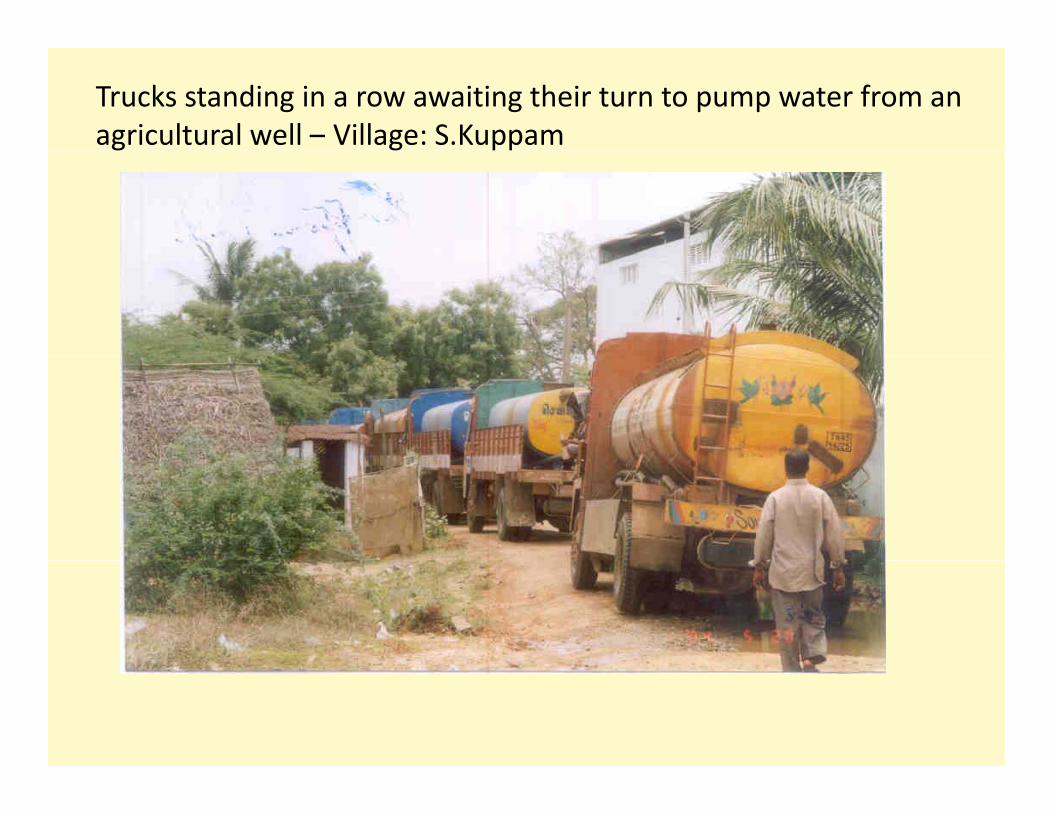
Trucks standing in a row awaiting their turn to pump water from an agricultural well – Village: S.Kuppamg g pp

Water being pumped from agricultural wells Village: Sennerkuppamg pp

Some pertinent questions arep q
Since the urbanization is an inevitable process, should we let the peri-urban population / areas to suffer? Orurban population / areas to suffer? Or
Is there a way in which the spread of urbanization could be used for the b d d f b h h l ibest use and advantage of both the populations?

Climate Risk AlertDamages due to major climate induced disasters in megacities, in particular in South Asia could run to several billion dollarsin particular in South Asia could run to several billion dollars mainly because of reasons such as • High density of population of up to 30,000 per sq km• High urban poverty, High concentration of slums with dreadfully poor drinking water, sanitation, health care facilities
Cl l th th t f li t i d d di t i iti• Clearly the threat of climate induced disasters, in mega cities will complicate all poverty alleviation and welfare measures of governments;governments; • Will have very serious health implications on urban poor due to lack of access to safe drinking water sanitationg

What does all these convey?
A bad urban planning coupled with poor governance can be disastrous to ecology andgovernance can be disastrous to ecology and environment, which eventually put enormous pressure on the present as well as futurepressure on the present as well as future generations
A mere promulgation of laws will guarantee nothing if policy implementation and monitoringnothing if policy implementation and monitoring mechanisms are weak

Policy options• There is an urgent need to look into the peri-urban issue from the angle of single eco-
d f i d i i d l l fsystem and as a part of an integrated socio-economic developmental process of an economy. • A fragmented approach would only bring about rural-urban and peri-urban – urban divide more intense conflicts besides contributing to destruction of ecologydivide, more intense conflicts, besides contributing to destruction of ecology, environment and livelihood options in the rural and peri-urban areas• Surface and groundwater bodies and land use should be an essential and integral part of the urban planningof the urban planning• The solutions to water crisis are quite closely associated with integrated view of water governance and sustainable development • In the particular context of climate change threat, there is an urgent need to view p g , gfloods and droughts in an integrated manner – taking care of flood would mean taking care of drought and the vice-versa• Water management should mean not only freshwater management but also “used water management”- It is high time for the Indian hydro-crazy to imprint this concept in their vocabulary • This calls for long-term perspective, commitment, participatory planning and
d b d b d t hi f SHARED LEARFNING EXERCISESgovernance and a broad based partnership for SHARED LEARFNING EXERCISES from grass-roots onwards and a sustained dialogue among all key stakeholders
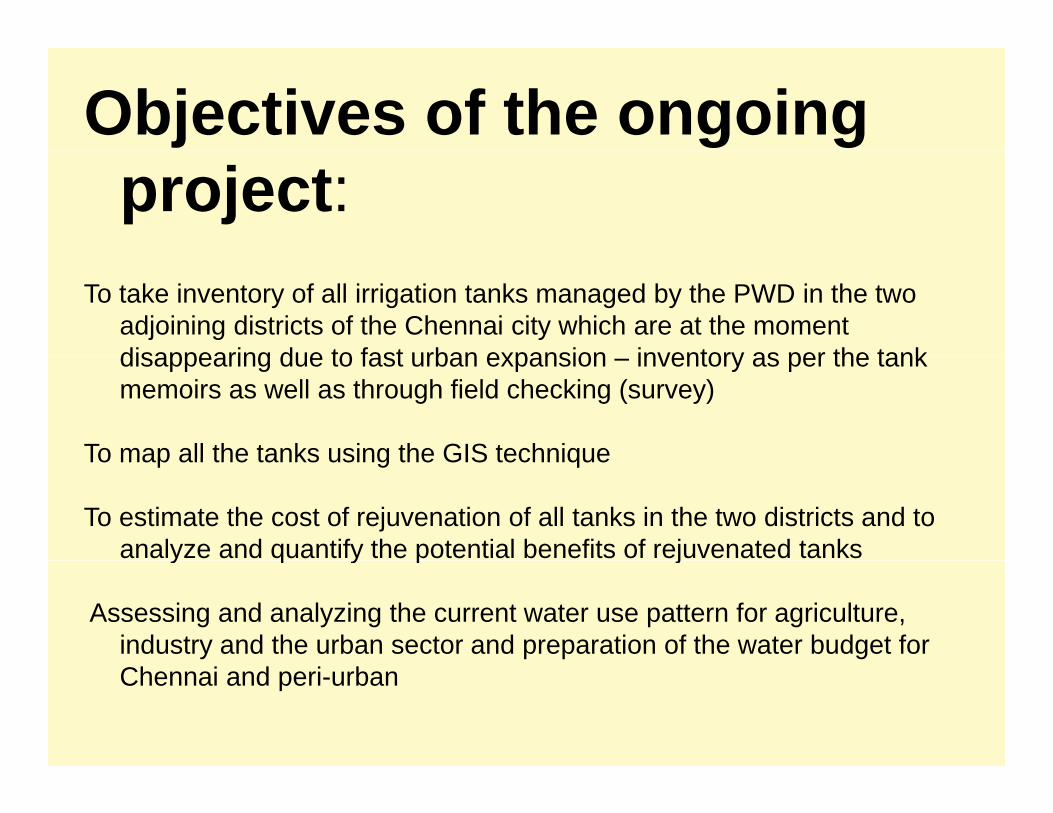
Objectives of the ongoing project:
To take inventory of all irrigation tanks managed by the PWD in the two adjoining districts of the Chennai city which are at the moment disappearing due to fast urban expansion inventory as per the tankdisappearing due to fast urban expansion – inventory as per the tank memoirs as well as through field checking (survey)
To map all the tanks using the GIS techniqueTo map all the tanks using the GIS technique
To estimate the cost of rejuvenation of all tanks in the two districts and to analyze and quantify the potential benefits of rejuvenated tanksy q y p j
Assessing and analyzing the current water use pattern for agriculture, industry and the urban sector and preparation of the water budget for Chennai and peri-urban
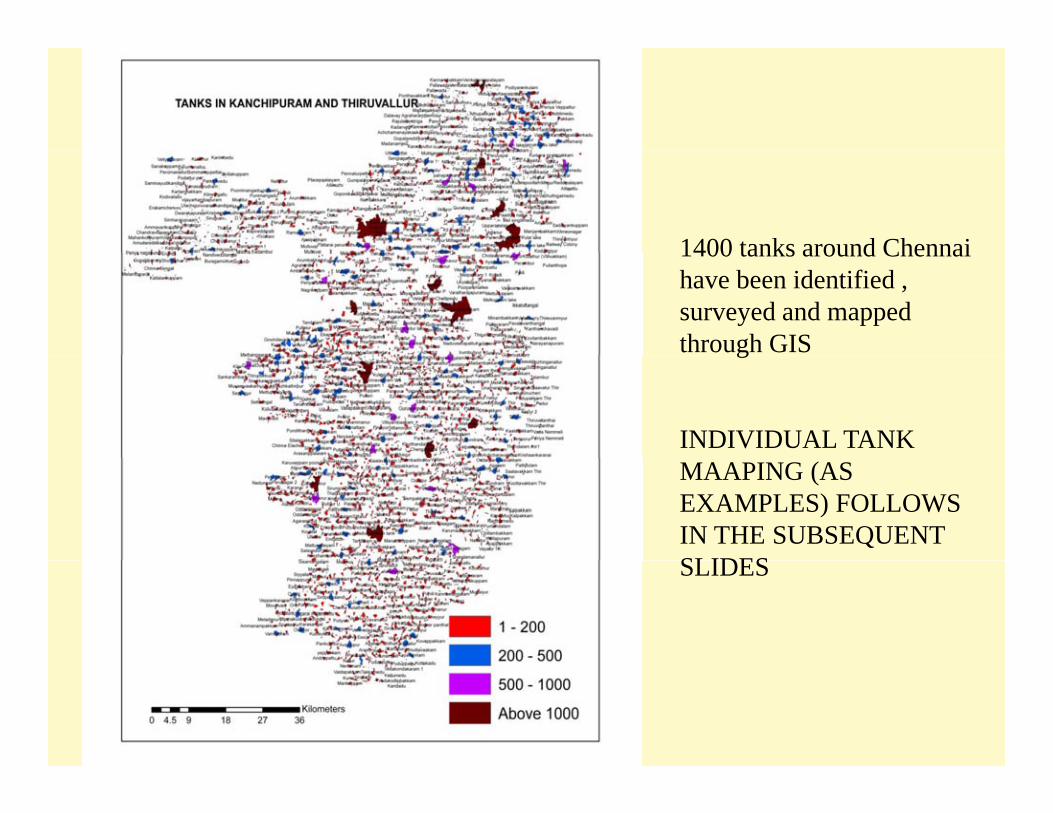
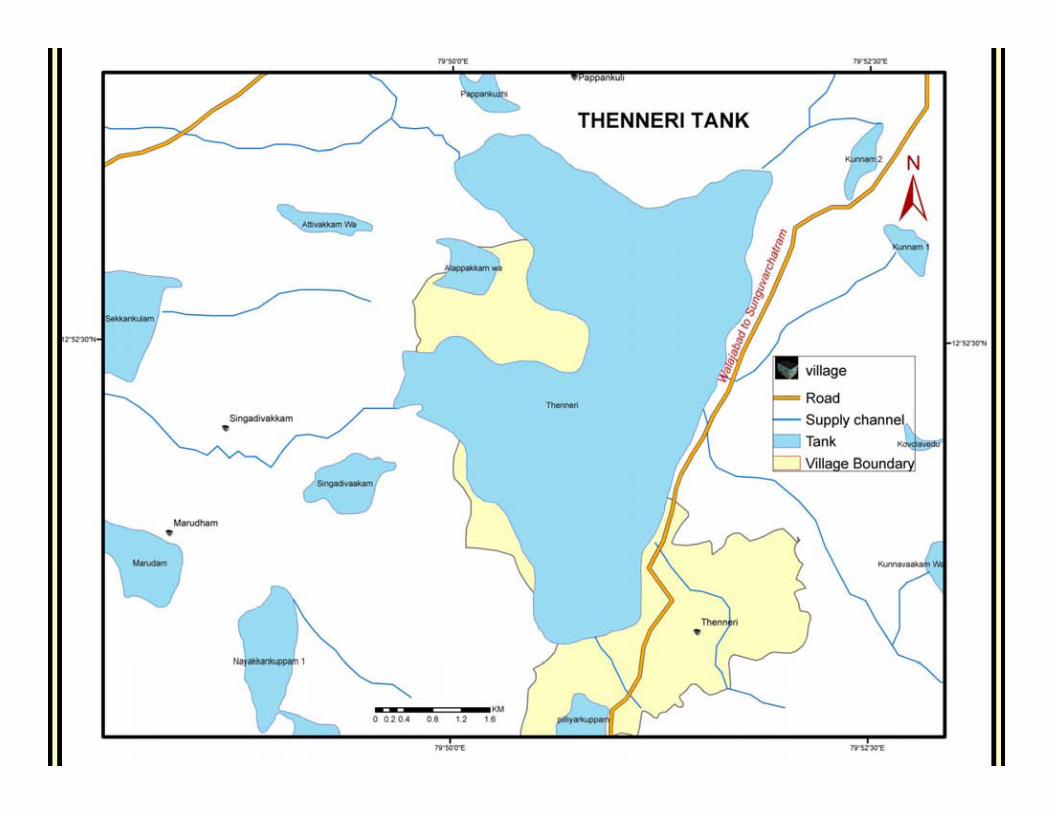
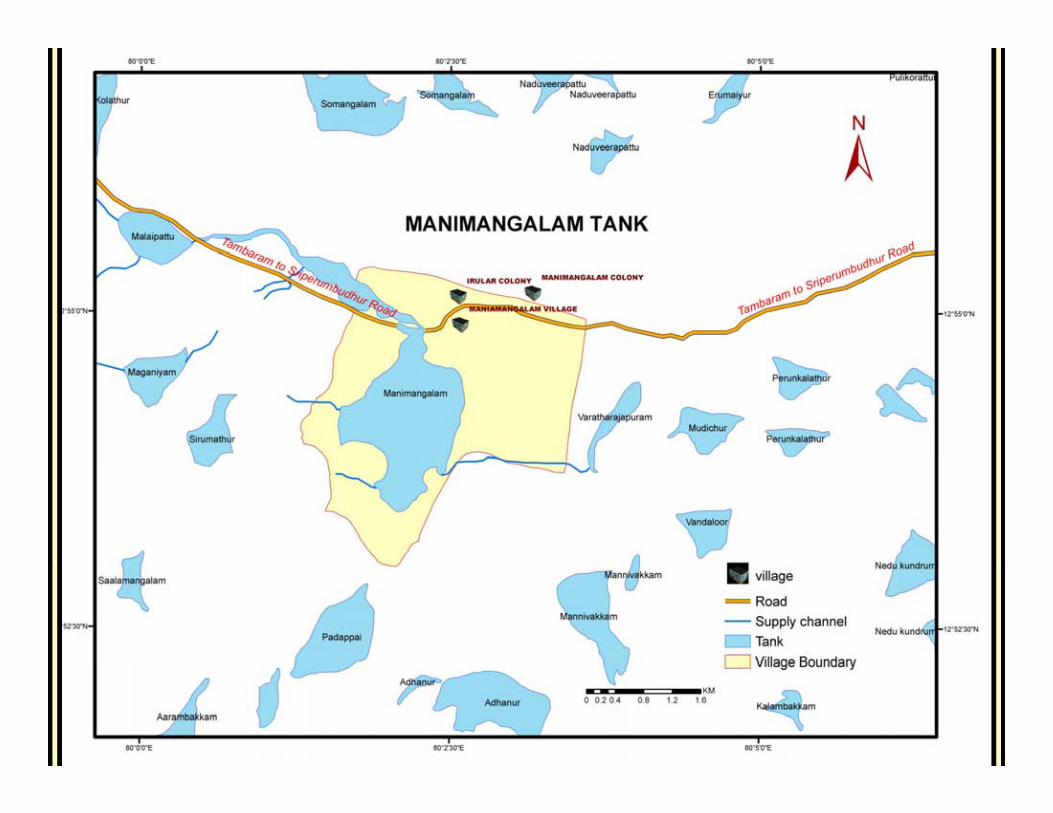
1400 tanks around Chennai1400 tanks around Chennai have been identified , surveyed and mapped through GISg
INDIVIDUAL TANK MAAPING (AS EXAMPLES) FOLLOWS IN THE SUBSEQUENT SLIDESSLIDES


The project results clearly indicate that the locally available water is quite substantial and ecologically sustainable and cost effective.
A win-win situation where urban and peri-urban areas can co-exist while at the same time local ecology can becan co-exist while at the same time local ecology can be preserved

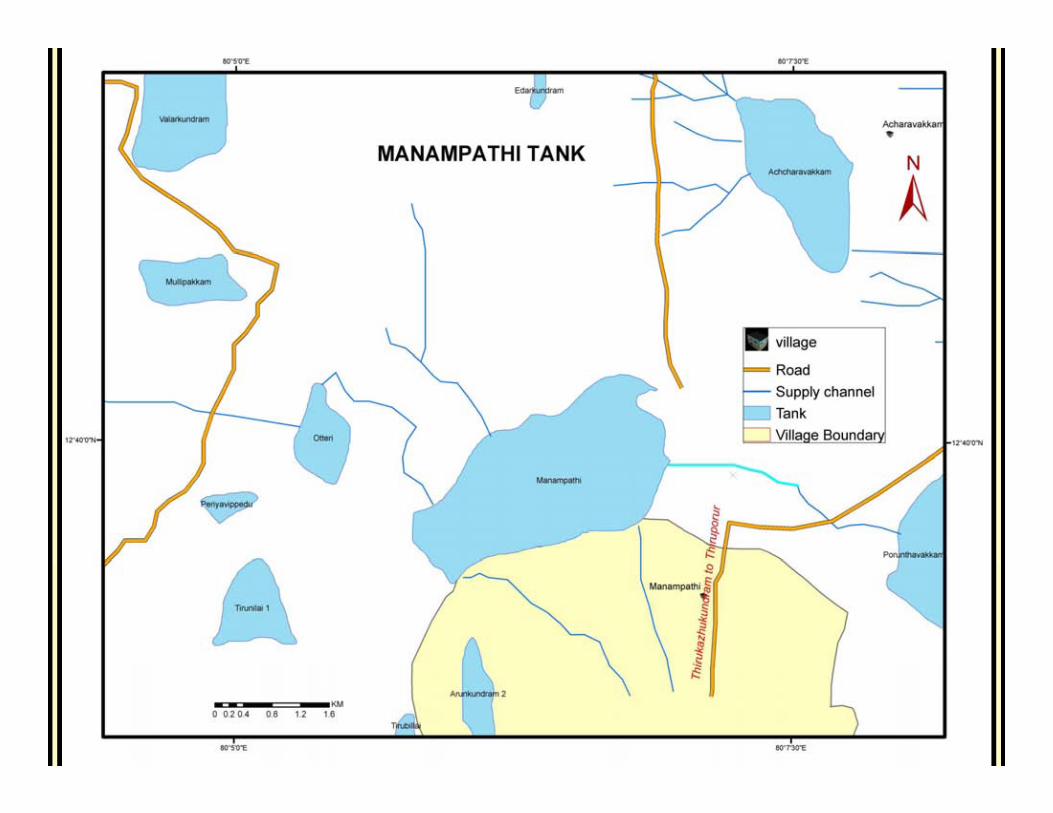
Manamathi Tank: Location - Tiruporur –Tirukalukuntram Main Road – 30 KM from Chennai - Next to Amur village – 1091 acres command area – Tiruporur Irrigation Section – Tiruporur g p

Sirudhavur Tank: Location - Tiruporur –Sirudhavur Tank: Location Tiruporur Tirulalukuntram Main Road – Tiruporur to Sirudhavur –6kms – Tiruporur Irrigation Section - 1027acres command areaarea

Kondangi Tank: Location – Tiruporur – Chengelpattu MainKondangi Tank: Location – Tiruporur – Chengelpattu Main Road – 1592 acres command area – Tiruporur Irrigation Section – Guduvancheri 14kms
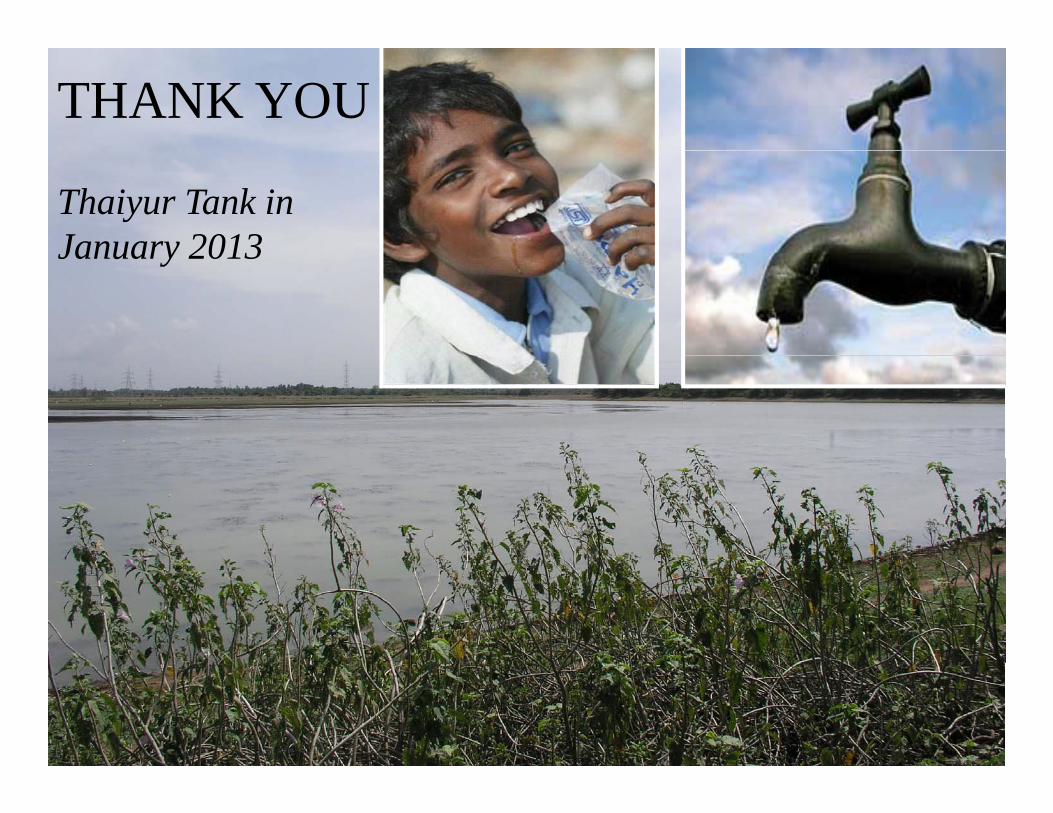
THANK YOU Thaiyur Tank: Location - On the OMR – After THANK YOUKelambakkam – 3kms inside village – 1079 acres Command area - Non-system tank - Tiruporur Irrigation Section Thaiyur Tank in
January 2013January 2013