Optimisation of CT radiation dose in PET/CT imaging … of CT dose in PET-CT... · All images were...
34
Optimisation of CT radiation dose in PET/CT imaging using mA modulation and iterative reconstruction Elaine Woods a , Jim O’Doherty a , Lucy Pike a , Ian Honey b , Sally Barrington a , Gary Cook a , Teresa Szyszko- Walls a and Paul Schleyer a a. Division of Imaging Sciences and Biomedical Engineering, King’s College London, King’s Health Partners, St. Thomas’ Hospital, London, United Kingdom b. Department of Medical Physics, Guy’s and St Thomas’ NHS Foundation Trust, Guy’s Hospital, London, United Kingdom CTUG Meeting 16 th October 2014
Transcript of Optimisation of CT radiation dose in PET/CT imaging … of CT dose in PET-CT... · All images were...

Optimisation of CT radiation dose in PET/CT imaging
using mA modulation and iterative reconstruction
Elaine Woods a, Jim O’Doherty a, Lucy Pike a, Ian Honey b, Sally Barrington a, Gary Cook a, Teresa Szyszko-
Walls a and Paul Schleyer a
a. Division of Imaging Sciences and Biomedical Engineering, King’s College London, King’s Health Partners, St. Thomas’ Hospital, London,
United Kingdom
b. Department of Medical Physics, Guy’s and St Thomas’ NHS Foundation Trust, Guy’s Hospital, London, United Kingdom
CTUG Meeting
16th October 2014
Introduction
CT in PET-CT
• Patients administered with tracer compound labelled with positron emitting radionuclide i.e. 18F-FDG
• Uptake period of 90 minutes in holding bay • Patient has half-body CT scan (<1 minute)
followed by half-body PET imaging (3 min/bed position ~ 21 minutes)
Dispensing PET tracer Patient Administration and Uptake PET-CT Scanning
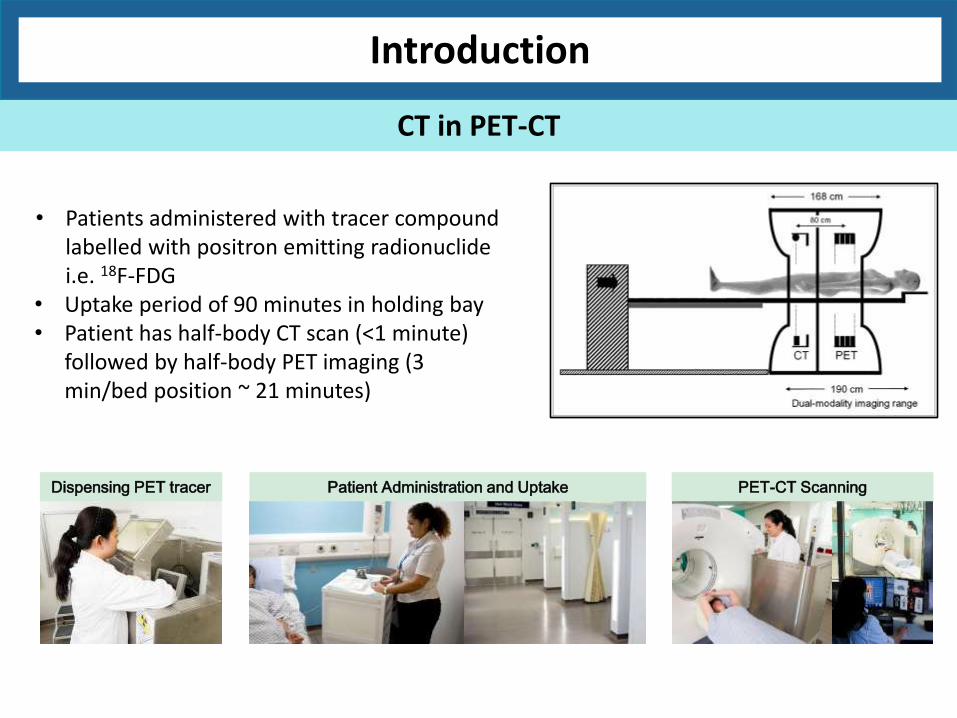
CT Radiation dose = 7mSv PET Radiation dose for 350MBq 18F-FDG= 7mSv
Introduction
CT in PET-CT
CT PET-CT PET
CT Protocol
mA 115
Rotation Speed 0.5s
Pitch 1.375
Collimation 16 x 2.5mm
CTDIvol 5.2mGy
PET Protocol
ARSAC Diagnostic Reference Level (DRL) 18F-FDG
400MBq
Effective Dose 400MBq 18F-FDG
8mSv
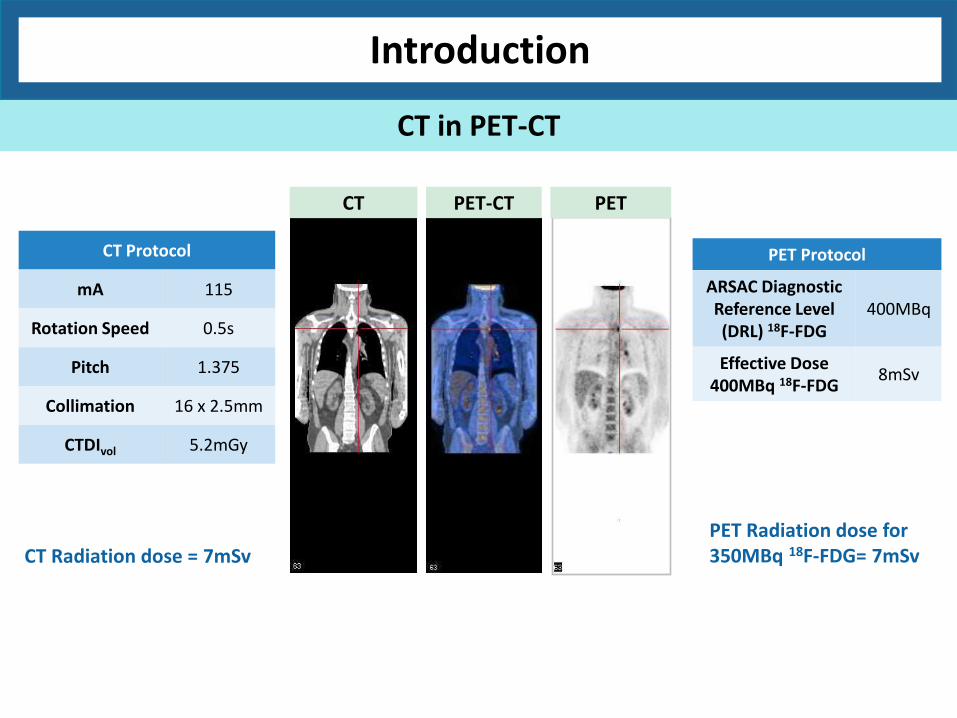
• PET Imaging Centre at St. Thomas’ Hospital moved to new area in hospital in Oct 2013
• 2 x GE Discovery 710 PET-CT scanners (Optima 660 CT component)
• New scanners have mA modulation and statistical iterative reconstruction
• For optimisation of PET and CT protocols, institutional ethical approval obtained to perform patient local views on new scanners with patients receiving no additional radiation dose;
Introduction
Aims
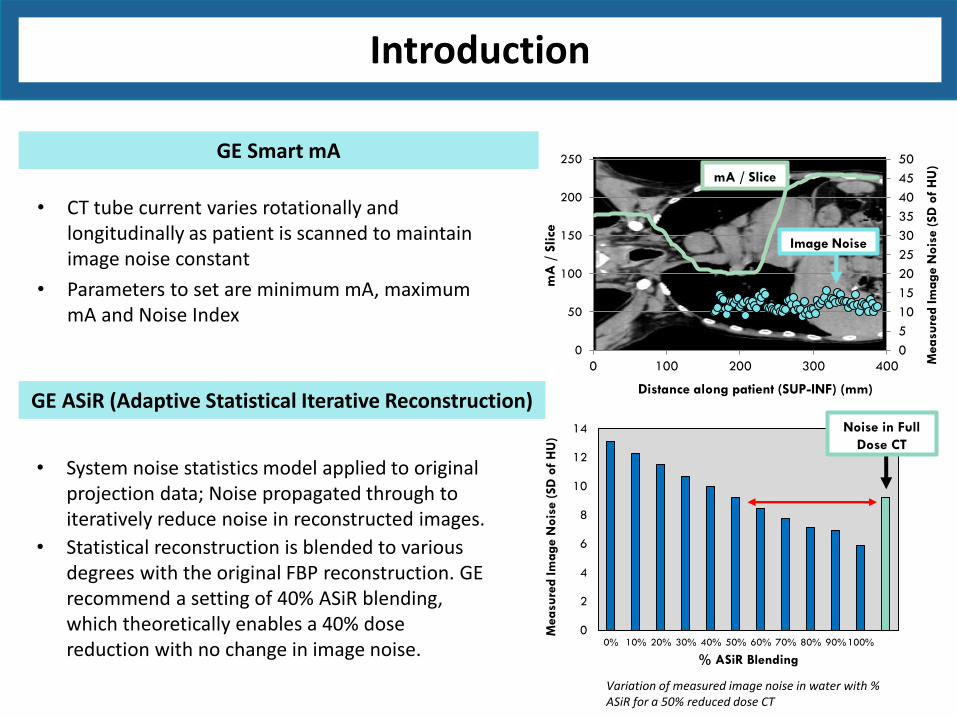
Variation of measured image noise in water with % ASiR for a 50% reduced dose CT
0
2
4
6
8
10
12
14
0% 10% 20% 30% 40% 50% 60% 70% 80% 90%100%
Measu
red Im
ag
e N
ois
e (
SD
of
HU
)
% ASiR Blending
Noise in Full
Dose CT
• System noise statistics model applied to original projection data; Noise propagated through to iteratively reduce noise in reconstructed images.
• Statistical reconstruction is blended to various degrees with the original FBP reconstruction. GE recommend a setting of 40% ASiR blending, which theoretically enables a 40% dose reduction with no change in image noise.
• CT tube current varies rotationally and longitudinally as patient is scanned to maintain image noise constant
• Parameters to set are minimum mA, maximum mA and Noise Index
0
5
10
15
20
25
30
35
40
45
50
0
50
100
150
200
250
0 100 200 300 400 Measu
red Im
ag
e N
ois
e (
SD
of
HU
)
mA
/ S
lice
Distance along patient (SUP-INF) (mm)
mA / Slice
Image Noise
GE Smart mA
GE ASiR (Adaptive Statistical Iterative Reconstruction)
Introduction
A: Local view CT scans to determine optimum Noise Index (NI) Patient local views (N=13) were scanned with the NI set to obtain a CTDIvol value 50% that of the current protocol. All images were reconstructed using 40% ASiR.
Methodology
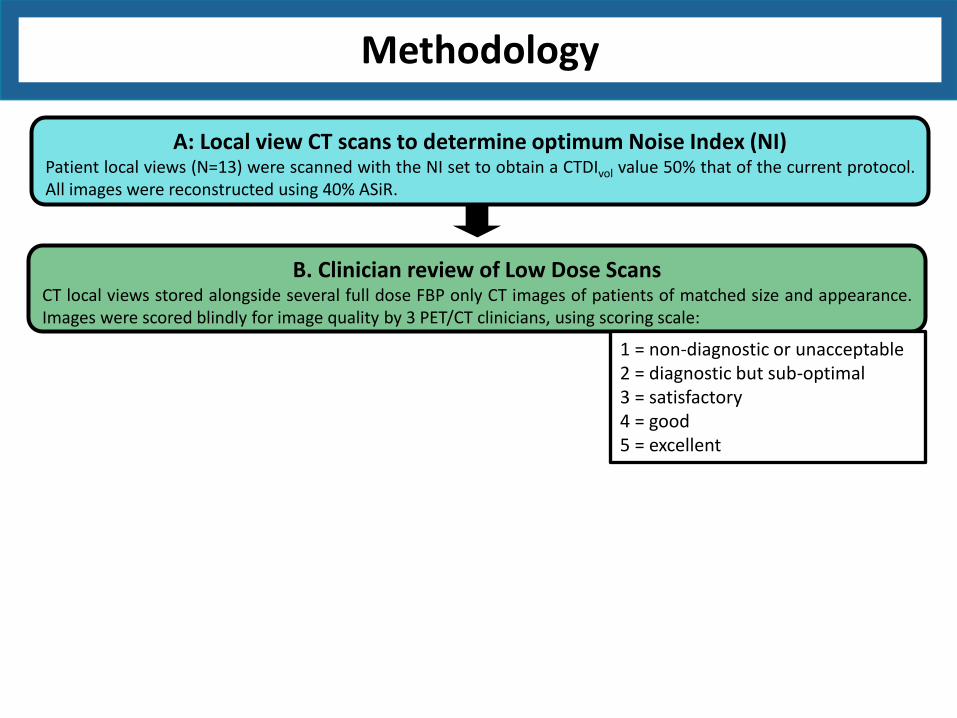
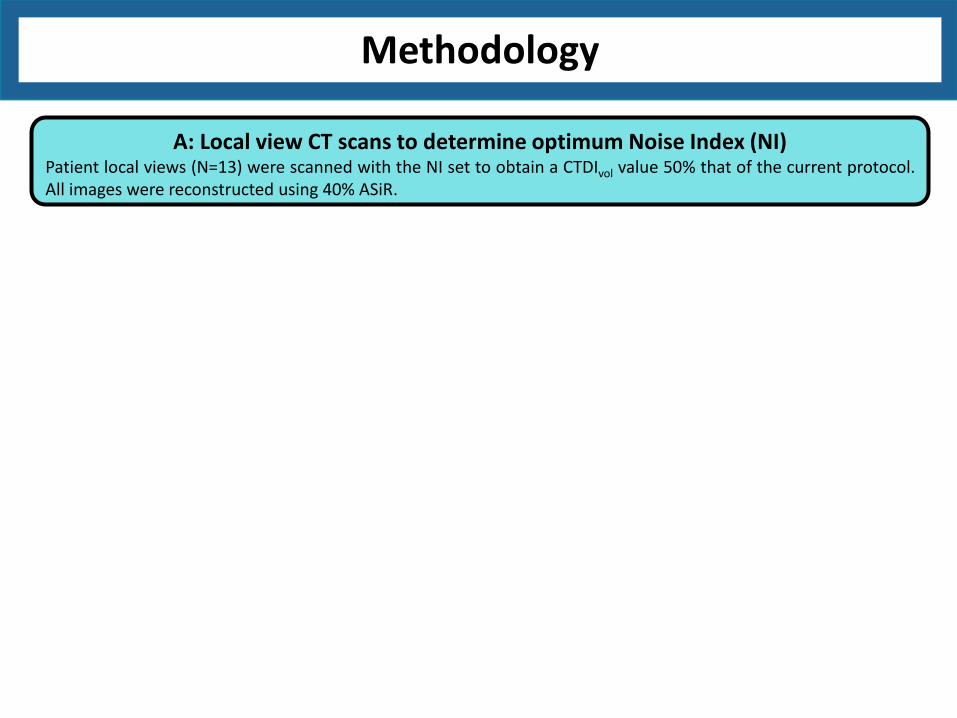
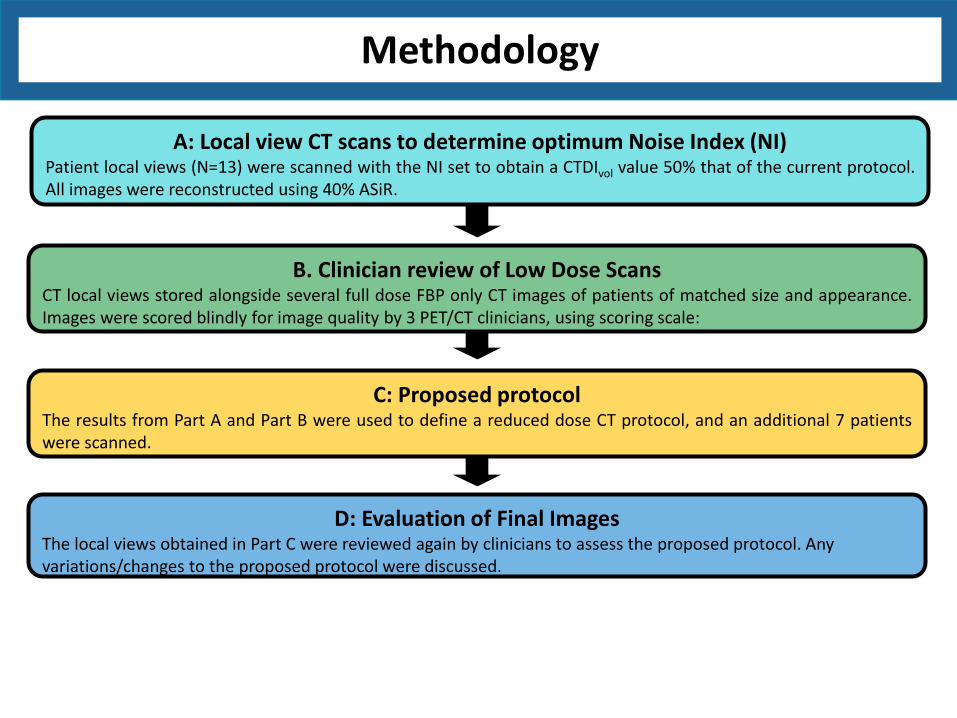
A: Local view CT scans to determine optimum Noise Index (NI) Patient local views (N=13) were scanned with the NI set to obtain a CTDIvol value 50% that of the current protocol. All images were reconstructed using 40% ASiR.
B. Clinician review of Low Dose Scans CT local views stored alongside several full dose FBP only CT images of patients of matched size and appearance. Images were scored blindly for image quality by 3 PET/CT clinicians, using scoring scale:
Methodology
1 = non-diagnostic or unacceptable 2 = diagnostic but sub-optimal 3 = satisfactory 4 = good 5 = excellent
A: Local view CT scans to determine optimum Noise Index (NI) Patient local views (N=13) were scanned with the NI set to obtain a CTDIvol value 50% that of the current protocol. All images were reconstructed using 40% ASiR.
B. Clinician review of Low Dose Scans CT local views stored alongside several full dose FBP only CT images of patients of matched size and appearance. Images were scored blindly for image quality by 3 PET/CT clinicians, using scoring scale:
C: Proposed protocol The results from Part A and Part B were used to define a reduced dose CT protocol, and an additional 7 patients were scanned.
Methodology
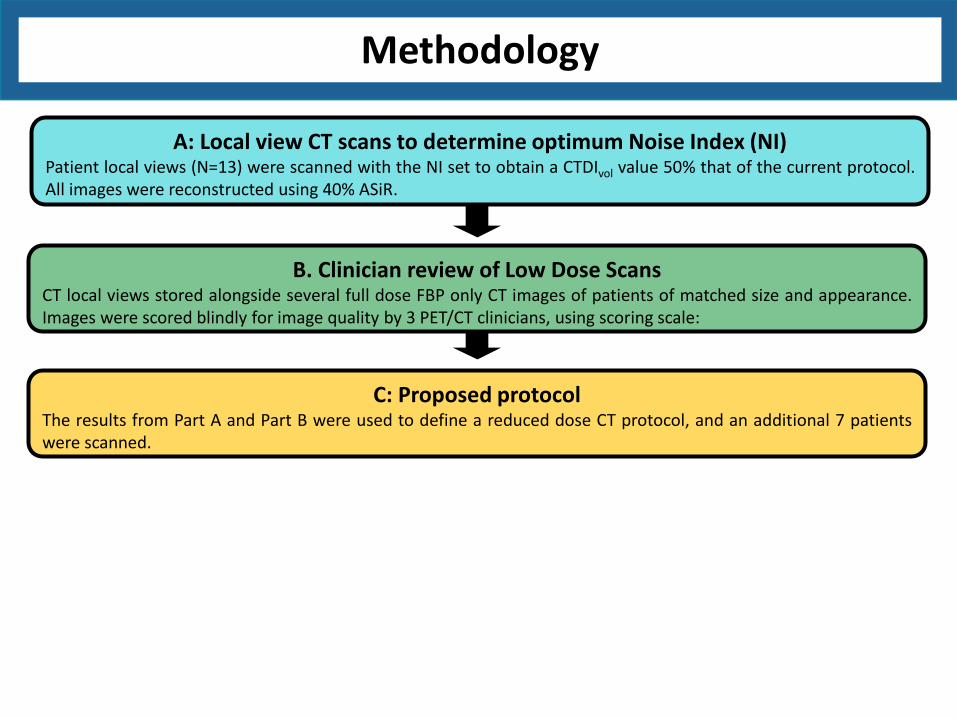
A: Local view CT scans to determine optimum Noise Index (NI) Patient local views (N=13) were scanned with the NI set to obtain a CTDIvol value 50% that of the current protocol. All images were reconstructed using 40% ASiR.
B. Clinician review of Low Dose Scans CT local views stored alongside several full dose FBP only CT images of patients of matched size and appearance. Images were scored blindly for image quality by 3 PET/CT clinicians, using scoring scale:
C: Proposed protocol The results from Part A and Part B were used to define a reduced dose CT protocol, and an additional 7 patients were scanned.
D: Evaluation of Final Images The local views obtained in Part C were reviewed again by clinicians to assess the proposed protocol. Any variations/changes to the proposed protocol were discussed.
Methodology
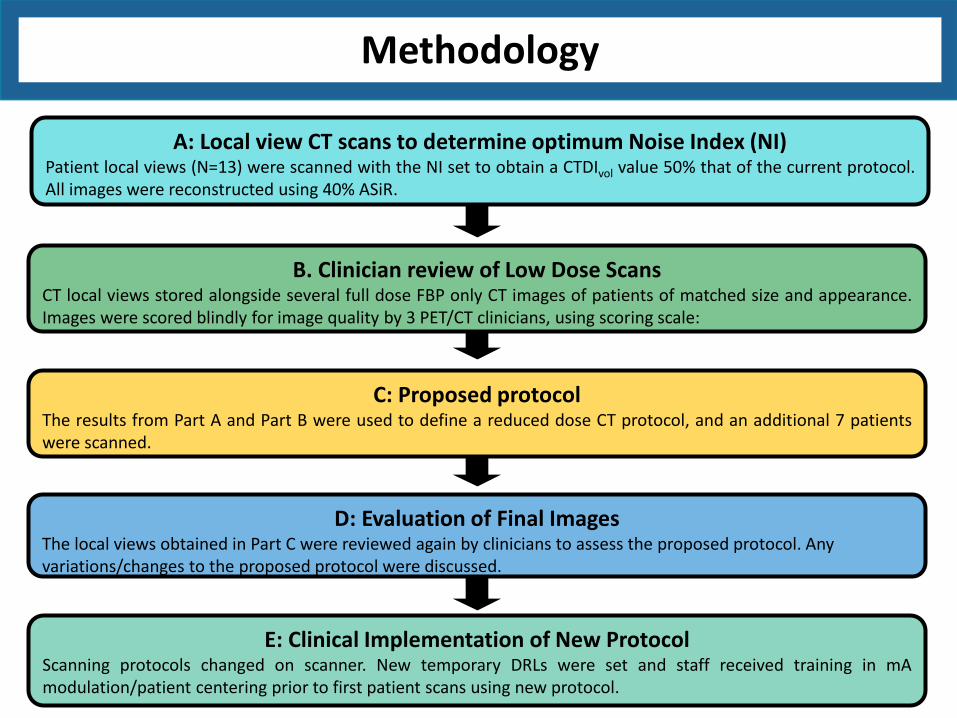
A: Local view CT scans to determine optimum Noise Index (NI) Patient local views (N=13) were scanned with the NI set to obtain a CTDIvol value 50% that of the current protocol. All images were reconstructed using 40% ASiR.
E: Clinical Implementation of New Protocol Scanning protocols changed on scanner. New temporary DRLs were set and staff received training in mA modulation/patient centering prior to first patient scans using new protocol.
B. Clinician review of Low Dose Scans CT local views stored alongside several full dose FBP only CT images of patients of matched size and appearance. Images were scored blindly for image quality by 3 PET/CT clinicians, using scoring scale:
C: Proposed protocol The results from Part A and Part B were used to define a reduced dose CT protocol, and an additional 7 patients were scanned.
D: Evaluation of Final Images The local views obtained in Part C were reviewed again by clinicians to assess the proposed protocol. Any variations/changes to the proposed protocol were discussed.
Methodology
Clinician A Clinician B Clinician C
Head and Neck 1 4 3 3
Head and Neck 2 4 3 4
Chest 1 4 4 5
Chest 2 5 4 3
Chest 3 3 3 2
Chest 4 3 2 3
Abdo 1 5 4 4
Abdo 2 4 3 3
Pelvis 1 4 3 2
Pelvis 2 5 3 3
Pelvis 3 4 2 3
Pelvis 4 4 3 4
Scoring Scale
1 Non-diagnostic or unacceptable
2 Diagnostic but sub-optimal
3 Satisfactory
4 Good
5 Excellent
Results
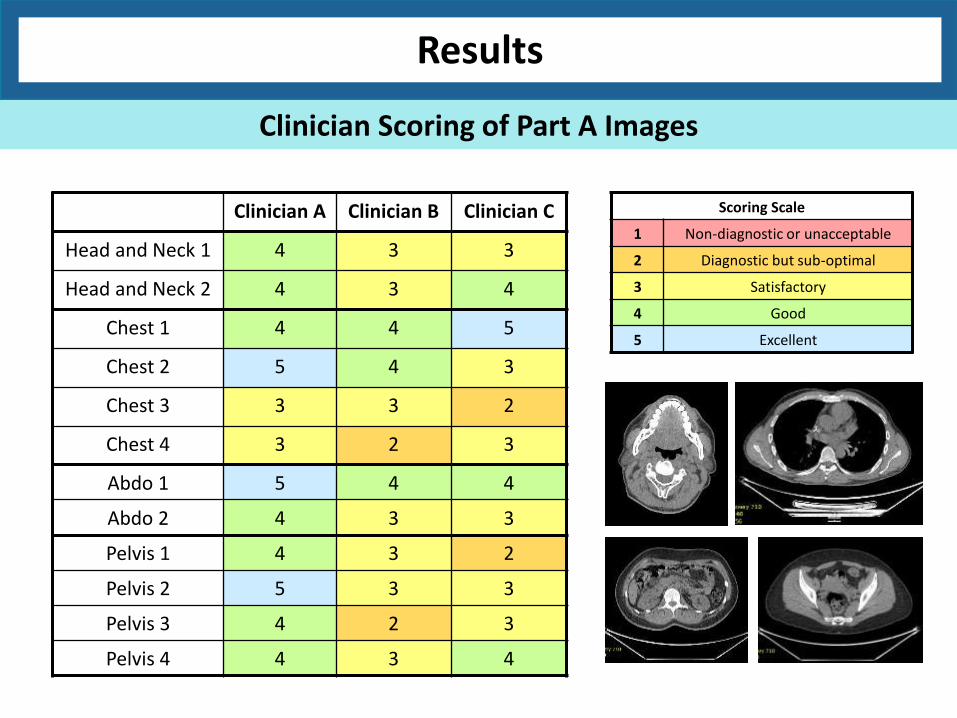
Clinician Scoring of Part A Images
Clinician A Clinician B Clinician C
Head and Neck 1 4 3 3
Head and Neck 2 4 3 4
Chest 1 4 4 5
Chest 2 5 4 3
Chest 3 3 3 2
Chest 4 3 2 3
Abdo 1 5 4 4
Abdo 2 4 3 3
Pelvis 1 4 3 2
Pelvis 2 5 3 3
Pelvis 3 4 2 3
Pelvis 4 4 3 4
Scoring Scale
1 Non-diagnostic or unacceptable
2 Diagnostic but sub-optimal
3 Satisfactory
4 Good
5 Excellent
Results
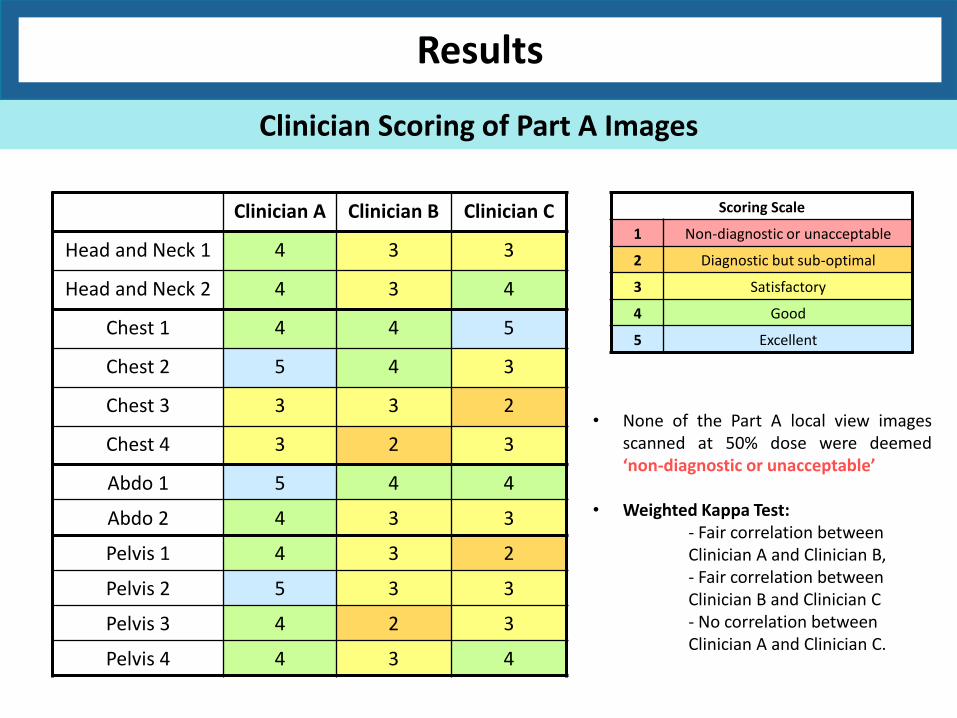
Clinician Scoring of Part A Images
• None of the Part A local view images scanned at 50% dose were deemed ‘non-diagnostic or unacceptable’
• Weighted Kappa Test: - Fair correlation between Clinician A and Clinician B, - Fair correlation between Clinician B and Clinician C - No correlation between Clinician A and Clinician C.

Clinician A Clinician B Clinician C
Head and Neck 1 4 3 3
Head and Neck 2 4 3 4
Chest 1 4 4 5
Chest 2 5 4 3
Chest 3 3 3 2
Chest 4 3 2 3
Abdo 1 5 4 4
Abdo 2 4 3 3
Pelvis 1 4 3 2
Pelvis 2 5 3 3
Pelvis 3 4 2 3
Pelvis 4 4 3 4
Scoring Scale
1 Non-diagnostic or unacceptable
2 Diagnostic but sub-optimal
3 Satisfactory
4 Good
5 Excellent
Results
Clinician Scoring of Part A Images
• Diagnostic but sub-optimal: patients scanned with arms down, pacemaker artefacts, large patients
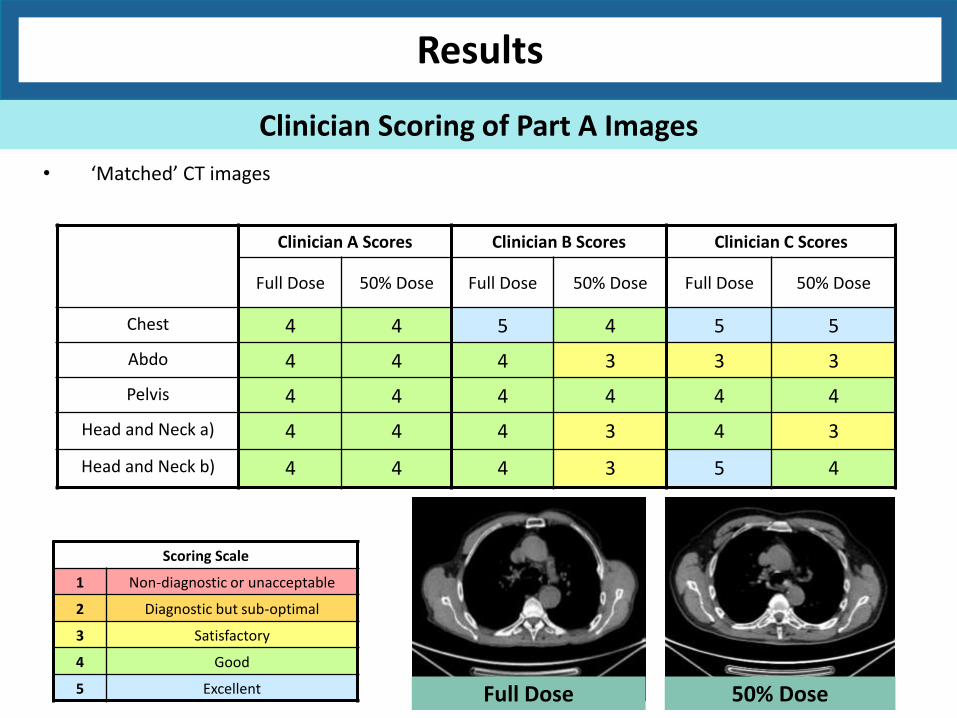
Clinician A Scores Clinician B Scores Clinician C Scores
Full Dose 50% Dose Full Dose 50% Dose Full Dose 50% Dose
Chest 4 4 5 4 5 5
Abdo 4 4 4 3 3 3
Pelvis 4 4 4 4 4 4
Head and Neck a) 4 4 4 3 4 3
Head and Neck b) 4 4 4 3 5 4
• ‘Matched’ CT images
Scoring Scale
1 Non-diagnostic or unacceptable
2 Diagnostic but sub-optimal
3 Satisfactory
4 Good
5 Excellent Full Dose 50% Dose
Results
Clinician Scoring of Part A Images

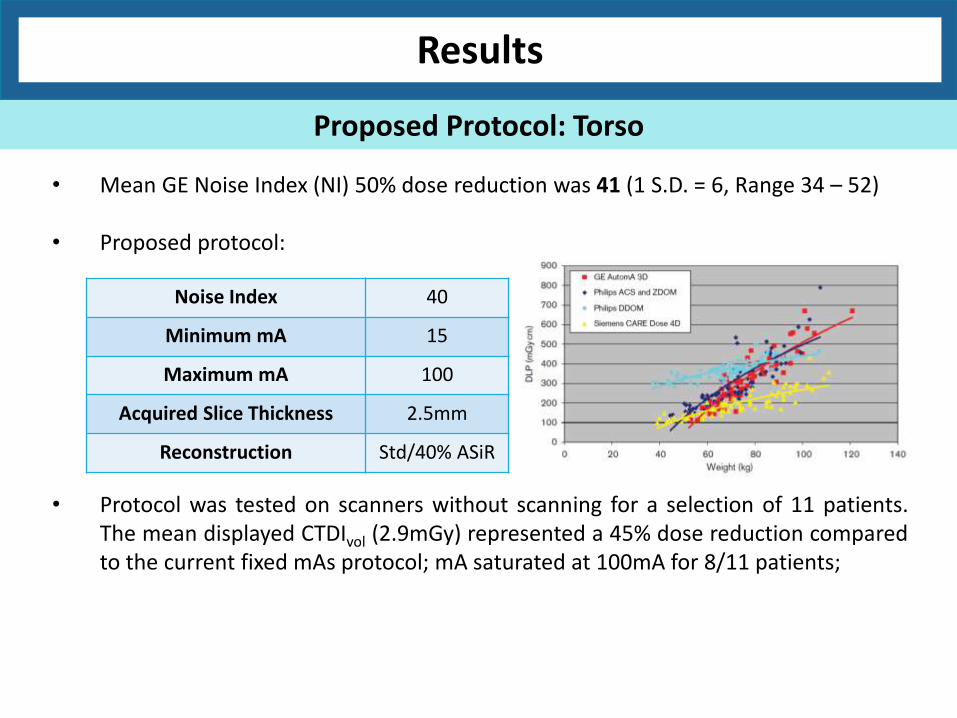
• Mean GE Noise Index (NI) 50% dose reduction was 41 (1 S.D. = 6, Range 34 – 52) • Proposed protocol:
Results
Proposed Protocol: Torso
Noise Index 40
Minimum mA 15
Maximum mA 100
Acquired Slice Thickness 2.5mm
Reconstruction Std/40% ASiR
G Iball and D Tout, Computed Tomography Automated Exposure Control Techniques in 18F-FDG Oncology PET-CT Scanning, Nuc Med Comm 2014, Vol 35 No 4
• Mean GE Noise Index (NI) 50% dose reduction was 41 (1 S.D. = 6, Range 34 – 52) • Proposed protocol:
Results
Proposed Protocol: Torso
Noise Index 40
Minimum mA 15
Maximum mA 100
Acquired Slice Thickness 2.5mm
Reconstruction Std/40% ASiR
• Protocol was tested on scanners without scanning for a selection of 11 patients. The mean displayed CTDIvol (2.9mGy) represented a 45% dose reduction compared to the current fixed mAs protocol; mA saturated at 100mA for 8/11 patients;
• For remaining 4 torso local view patients, small patients (<50kg) were scanned.
• In evaluation of the final images, clinicians were satisfied with the image quality and therefore one protocol used for all patient sizes.

Results
Proposed Protocol: Head and Neck
• Head and neck region represents a challenge to mA modulation.
Full Dose 50% Dose
• In clinician review of the final images, it was concluded that the mA modulation ASiR protocol would not be implemented for these scans.
• As 2/3 clinicians scored the reduced dose head and neck image quality down in the initial images, in second group of scans the Noise Index and minimum mA were varied to improve image quality.
0
10
20
30
40
50
60
50 100 150 200 250 300 350 400 450 500 550 600
Freq
uen
cy
DLP (mGycm)
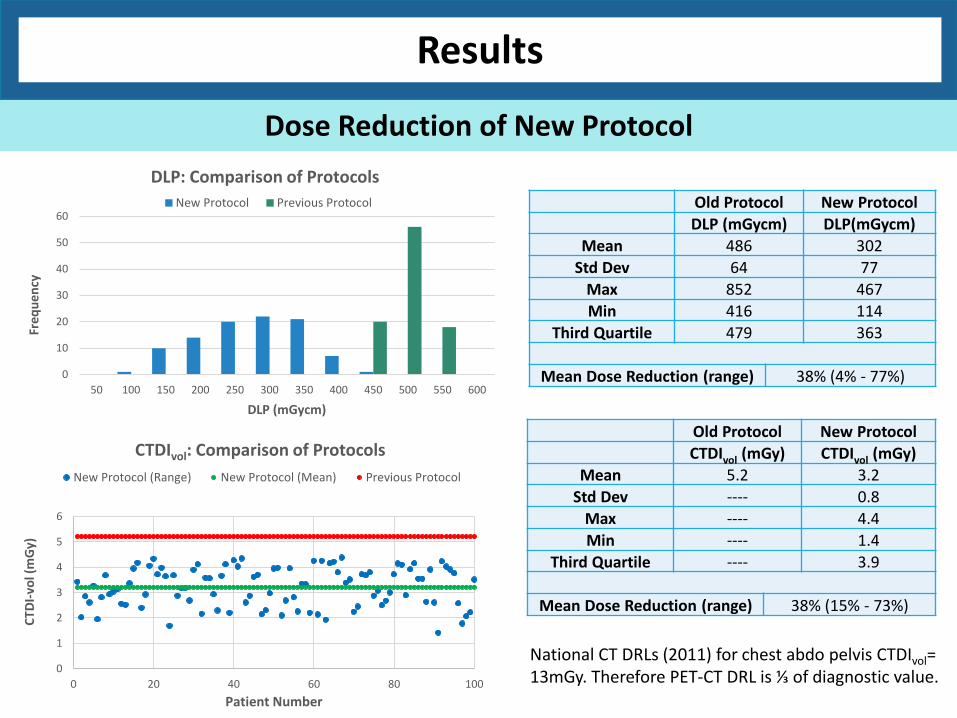
DLP: Comparison of Protocols
New Protocol Previous Protocol
National CT DRLs (2011) for chest abdo pelvis CTDIvol= 13mGy. Therefore PET-CT DRL is ⅓ of diagnostic value.
Old Protocol New Protocol
DLP (mGycm) DLP(mGycm)
Mean 486 302
Std Dev 64 77
Max 852 467
Min 416 114
Third Quartile 479 363
Mean Dose Reduction (range) 38% (4% - 77%)
Old Protocol New Protocol
CTDIvol (mGy) CTDIvol (mGy)
Mean 5.2 3.2
Std Dev ---- 0.8
Max ---- 4.4
Min ---- 1.4
Third Quartile ---- 3.9
Mean Dose Reduction (range) 38% (15% - 73%)
Results
Dose Reduction of New Protocol
0
1
2
3
4
5
6
0 20 40 60 80 100
CTD
I-vo
l (m
Gy)
Patient Number
CTDIvol: Comparison of Protocols
New Protocol (Range) New Protocol (Mean) Previous Protocol

• Dose received by a patient from a CT scan is dependent on both patient size and scanner radiation output. CTDIvol provides information regarding only the scanner output so does not estimate radiation dose.
• US task group 204 developed conversion factors that can be applied to displayed CTDIvol to allow estimation of radiation dose for various size patients.
y = 3.7055e-0.037x
0
0.5
1
1.5
2
2.5
3
0 10 20 30 40 50
Co
nve
rsio
n F
acto
r
Effective Diameter (cm)
SSDE Conversion Factor F vs Patient Effective Diameter
Size Specific Dose Estimate (SSDE) = CTDIvol x F
Results
Dose Reduction of New Protocol

Results
Dose Reduction of New Protocol
𝐷𝑤 = 21
1000𝐶𝑇(𝑥, 𝑦)𝑅𝑂𝐼 + 1
𝐴𝑅𝑂𝐼𝜋
• Dose received by a patient from a CT scan is dependent on both patient size and scanner radiation output. CTDIvol provides information regarding only the scanner output so does not estimate radiation dose.
• US task group 204 developed conversion factors that can be applied to displayed CTDIvol to allow estimation of radiation dose for various size patients
Size Specific Dose Estimate (SSDE) = CTDIvol x F

Results
Dose Reduction of New Protocol
TG204
TG220
0.0
1.0
2.0
3.0
4.0
5.0
6.0
7.0
8.0
9.0
20.0 25.0 30.0 35.0 40.0
SSDE (mSv)
Patient Effective Diameter (cm)
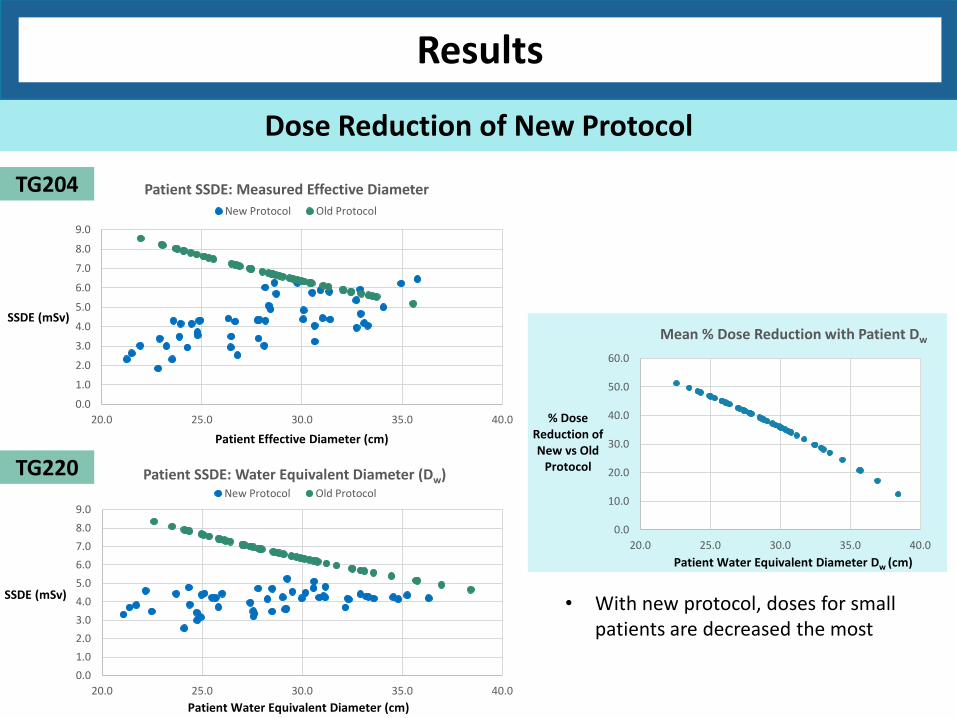
Patient SSDE: Measured Effective Diameter
New Protocol Old Protocol
0.0
1.0
2.0
3.0
4.0
5.0
6.0
7.0
8.0
9.0
20.0 25.0 30.0 35.0 40.0
SSDE (mSv)
Patient Water Equivalent Diameter (cm)
Patient SSDE: Water Equivalent Diameter (Dw) New Protocol Old Protocol
0.0
1.0
2.0
3.0
4.0
5.0
6.0
7.0
8.0
9.0
20.0 25.0 30.0 35.0 40.0
SSDE (mSv)
Patient Effective Diameter (cm)
Patient SSDE: Measured Effective Diameter
New Protocol Old Protocol
0.0
1.0
2.0
3.0
4.0
5.0
6.0
7.0
8.0
9.0
20.0 25.0 30.0 35.0 40.0
SSDE (mSv)
Patient Water Equivalent Diameter (cm)
Patient SSDE: Water Equivalent Diameter (Dw) New Protocol Old Protocol
Results
Dose Reduction of New Protocol
TG204
TG220
0.0
10.0
20.0
30.0
40.0
50.0
60.0
20.0 25.0 30.0 35.0 40.0
% Dose Reduction of New vs Old
Protocol
Patient Water Equivalent Diameter Dw (cm)
Mean % Dose Reduction with Patient Dw
• With new protocol, doses for small patients are decreased the most
0
5
10
15
20
25
30
35
40
45
20.0 25.0 30.0 35.0 40.0
Imag
e N
ois
e (
SD)
Patient Water Equivalent Diameter
Image Noise (Chest)
New Protocol
Old Protocol
0
5
10
15
20
25
30
35
40
45
20.0 25.0 30.0 35.0 40.0Im
age
No
ise
(SD
)
Patient Water Equivalent Diameter (cm)
Image Noise (Abdo)
New Protocol
Old Protocol
Results
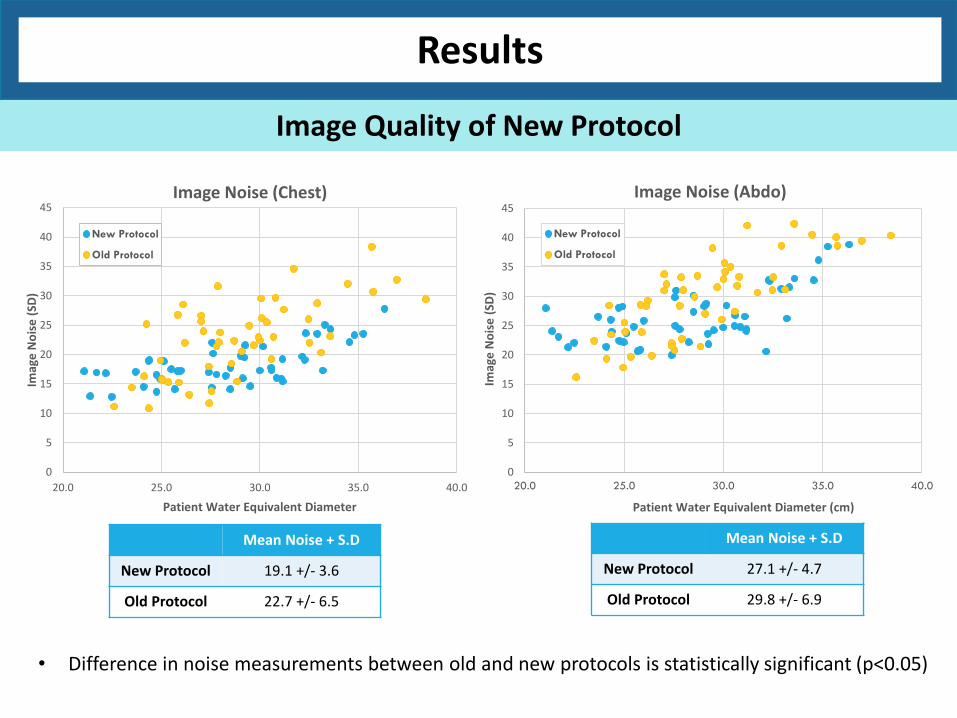
Image Quality of New Protocol
• Difference in noise measurements between old and new protocols is statistically significant (p<0.05)
Mean Noise + S.D
New Protocol 19.1 +/- 3.6
Old Protocol 22.7 +/- 6.5
Mean Noise + S.D
New Protocol 27.1 +/- 4.7
Old Protocol 29.8 +/- 6.9

Patient Dose Mean DLP (1 S.D.) Mean CTDIvol (1 S.D.)
Patient Arms Up
Patient Arms Down
Patient Arms Up
Patient Arms Down
Old Protocol 487 (65) 486 (65) 5.2 (0.0) 5.2 (0.0)
New Protocol 296 (79) 307 (76) 3.1 (0.8) 3.3 (0.7)
Results
Protocol for arms up/arms down
• Difference in dose metrics for arms up/arms down is not statistically significant (p=0.477 (DLP) /0.463 (CTDIvol))
Results
Phase 2: Head and Neck Local Views

Results
Phase 2: Head and Neck Local Views
• An additional 5 patients had reduced dose head and neck local views (mA = 70, 40% ASiR reconstruction)
Clinician 2 Clinician 3
Full Dose (FBP)
40% Dose + 40% ASiR
Full Dose (FBP)
40% Dose + 40% ASiR
Head and Neck 1 4 4 5 5
Head and Neck 2 4 3 3 4
Head and Neck 3 3 3 5 4
Head and Neck 4 4 3 5 4
Head and Neck 5 4 4 4 3
• Images scored by clinicians
Scoring Scale
1 Non-diagnostic or unacceptable
2 Diagnostic but sub-optimal
3 Satisfactory
4 Good
5 Excellent

Discussion
How do CT doses compare with other PET-CT Sites? How do CT doses compare with other PET-CT Sites?
G Iball and D Tout, Computed Tomography Automated Exposure Control Techniques in 18F-FDG Oncology PET-CT Scanning, Nuc Med Comm 2014, Vol 35 No 4
Mean DLP (mGycm)
Mean Image Noise (HU)
Slice Thickness (mm)
St Thomas’ PET Centre 302 27.1 2.5
Manchester/Leeds PET-CT 1 (GE) 306 22.4 3.75
Manchester/Leeds PET-CT 2 (Siemens) 197 42.1 4
Manchester/Leeds PET-CT 3 (Philips) 385 15.2 4
Manchester/Leeds PET-CT 4 (Philips) 296 19.7 4

Discussion
How do CT doses compare with other PET-CT Sites?
Mean DLP (mGycm)
Mean Image Noise (HU)
Slice Thickness (mm)
St Thomas’ PET Centre 302 27.1 2.5
Manchester/Leeds PET-CT 1 (GE) 306 22.4 3.75
Manchester/Leeds PET-CT 2 (Siemens) 197 42.1 4
Manchester/Leeds PET-CT 3 (Philips) 385 15.2 4
Manchester/Leeds PET-CT 4 (Philips) 296 19.7 4
G Iball and D Tout, Computed Tomography Automated Exposure Control Techniques in 18F-FDG Oncology PET-CT Scanning, Nuc Med Comm 2014, Vol 35 No 4
mAs Activity Concentration (Bq/ml)
10 5767
15 5769
20 5769
25 5759
30 5762
35 5763
40 5763
CT for PET Attenuation Correction?

Conclusions
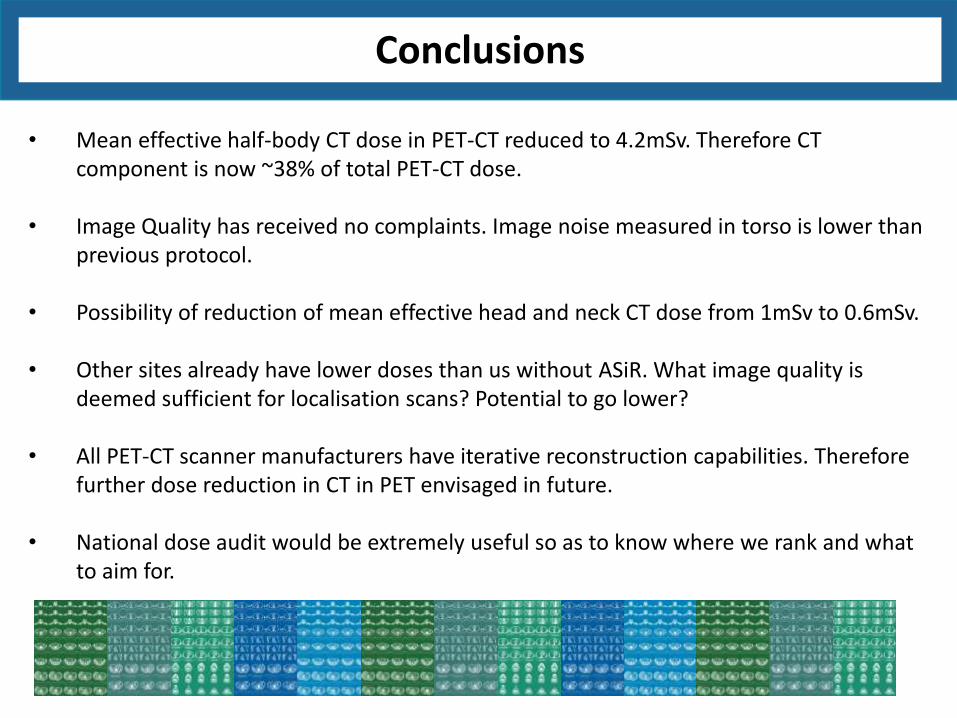
• Mean effective half-body CT dose in PET-CT reduced to 4.2mSv. Therefore CT component is now ~38% of total PET-CT dose.
• Image Quality has received no complaints. Image noise measured in torso is lower than previous protocol.
• Possibility of reduction of mean effective head and neck CT dose from 1mSv to 0.6mSv.
Conclusions
• Mean effective half-body CT dose in PET-CT reduced to 4.2mSv. Therefore CT component is now ~38% of total PET-CT dose.
• Image Quality has received no complaints. Image noise measured in torso is lower than previous protocol.
• Possibility of reduction of mean effective head and neck CT dose from 1mSv to 0.6mSv. • Other sites already have lower doses than us without ASiR. What image quality is
deemed sufficient for localisation scans? Potential to go lower?
• All PET-CT scanner manufacturers have iterative reconstruction capabilities. Therefore further dose reduction in CT in PET envisaged in future.
• National dose audit would be extremely useful so as to know where we rank and what
to aim for.
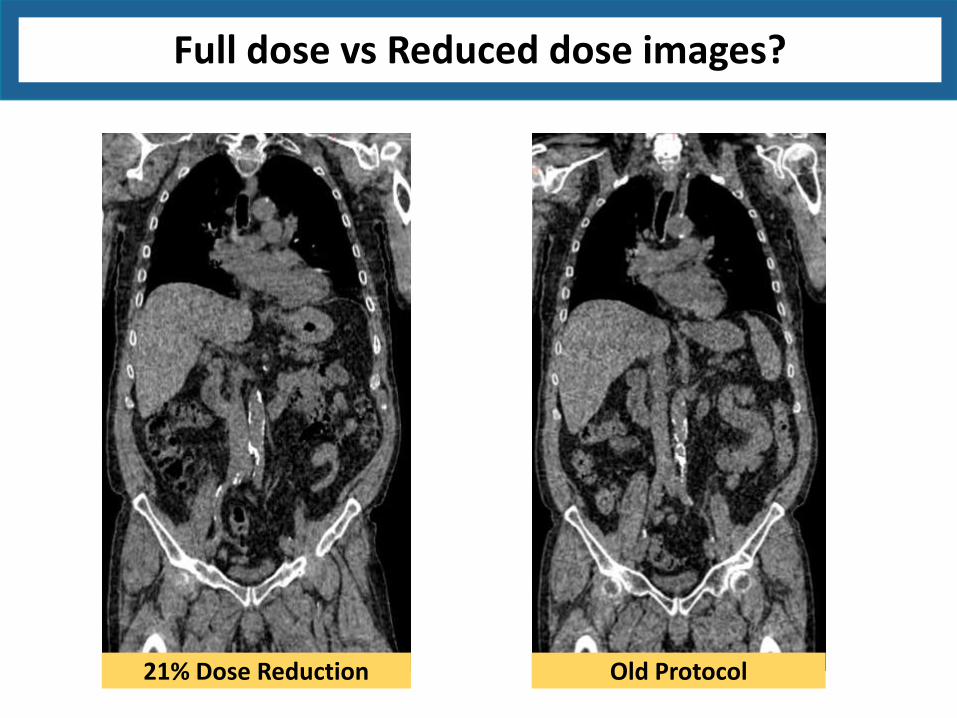
Full dose vs Reduced dose images?
Old Protocol 21% Dose Reduction
Full dose vs Reduced dose images?
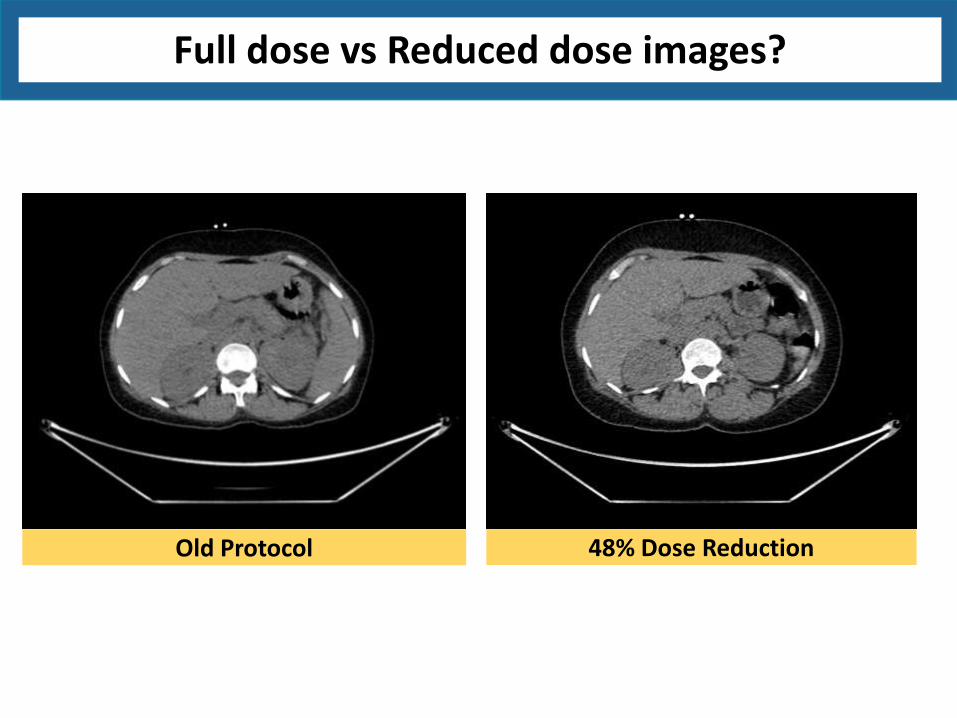
Old Protocol 48% Dose Reduction
Full dose vs Reduced dose images?
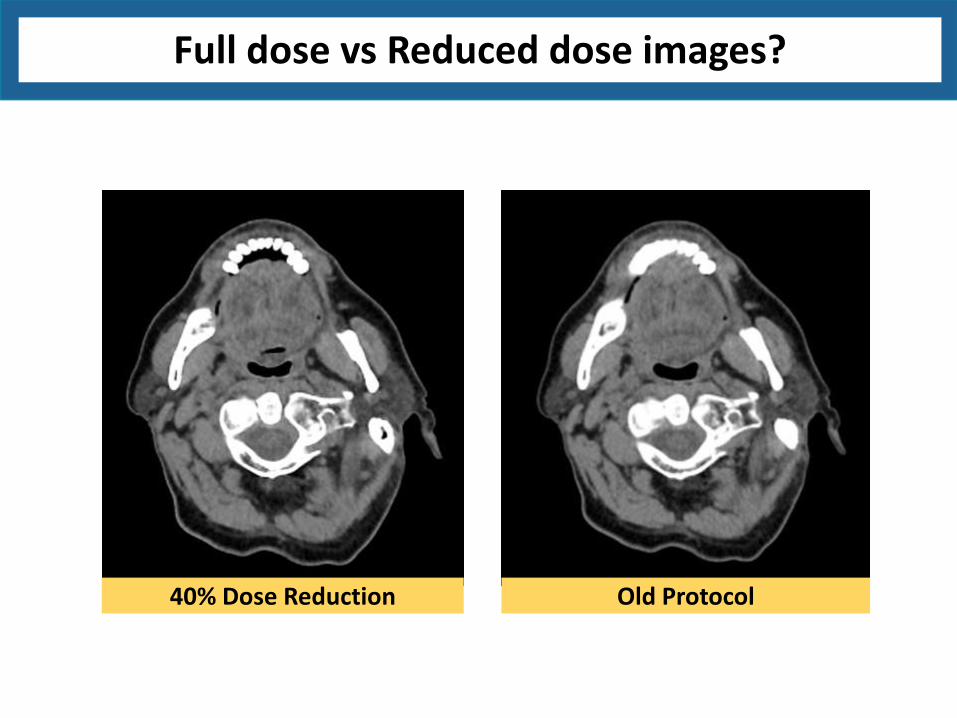
40% Dose Reduction Old Protocol