Optimisation of biological conversion of miscanthus into...
62
Optimisation of biological conversion of miscanthus into bioethanol or biogas – effects of harvest time, genotype, pretreatment and sampling Susanne Frydendal Nielsen PhD thesis, June 2016 Department of Agroecology AU Foulum Faculty of Science and Technology Aarhus University
-
Upload
phungnguyet -
Category
Documents
-
view
217 -
download
0
Transcript of Optimisation of biological conversion of miscanthus into...

Optimisation of biological conversion of miscanthus into
bioethanol or biogas
– effects of harvest time, genotype, pretreatment and sampling
Susanne Frydendal Nielsen
PhD thesis, June 2016
Department of Agroecology
AU Foulum
Faculty of Science and Technology
Aarhus University

i
Preface
The present PhD entitled “Optimisation of biological conversion of miscanthus into bioethanol
or biogas – effects of harvest time, genotype, pretreatment and sampling” was submitted in
part of the requirements to obtain the degree of Doctor of Philosophy (PhD) at Aarhus
University. The PhD study was scheduled for four years and was carried out from July 1st 2012
to June 30th 2016.
The PhD project was part of the BIORESOURCE project funded by Innovation Fund Denmark
and which was a collaboration among Aarhus University, University of Copenhagen, Energy
Bioscience Institute at University of Illinois, DONG energy, HedeDanmark, Novozymes and
Vitroform.
This thesis, which is based on three manuscripts, first introduces motivation and aims of the
project, followed by a section, which introduces the topics and methods included in this thesis.
For methodologies and studies not covered in the manuscripts, that is ensiling and sampling,
the section will also include a small recap of the results found within the study. The third
section contains a general discussion and reflections of three topics not covered in the
supporting manuscripts, the question on choosing between biogas and bioethanol,
representative sampling and storage. Subsequently, the novel findings and conclusions are
listed and the future perspectives can be found in the end.

ii
Acknowledgements
This work would not have been possible without contribution and support from several
competent people.
I wish to express my gratitude to my supervisors, especially my main supervisor René Gislum
for numerous skype meetings, valuable discussions, a catching enthusiastic drive and for
helping me navigating in the academic world, it has been invaluable. My co-supervisors also
deserves appreciation; Uffe Jørgensen for introducing me to exciting world of miscanthus and
Claus Felby for help on various biomass conversion related questions.
Moreover, I would like to thank Maibritt Hjorth on help with biogas and extrusions, but also
for encouraging pep talks, Vincenzo Cacciatore, Radziah Wahid and René Mortensen for good
company and collaboration at the biogas plant, Britt Amby Malthesen and Janni Ankerstjerne
for technical help while measuring methane, Simon Kristensen and Mogens Møller for helping
out when high school students and I was visiting and to all at the biogas plant at Department
of Engineering for welcoming and including me in the group.
I think with gratitude of the splendid company I had at Foulumgaard while fractionating
miscanthus – a special thanks goes to Helle Baadsgaard Sørensen, Holger Bak, Inger Lund
Balthzersen and Jens B. Kjeldsen at Foulumgaard, but also to the others stopping by now and
then. During the experiments on ensiling biomass I had great company and help from Erik
Fløjgaard Kristensen. An indispensable help handling the robot Marvin and the analyses at
University of Copenhagen was performed by Heng Zhang and Britta Skov.
Through four years I have had the pleasure of excellent company during the lunches, with
Lena, Marianne, Ellen, Sophie, Uffe and Lasse has provided an interdisciplinary society where
almost everything has been discussed, thank you all. A couple of the lunch buddies had the
kindness to help by proofreading this thesis – a special appreciation goes to Marianne
Johansen and Lena Hinrichsen!
The friends and colleagues within Department of Agroecology and the Section of Water and
Climate have provided a fruitful working atmosphere with interest in my work and equally
important joyful breaks between the studies, thank you all.
I have been blessed with a curious and supporting family and friends joining me in joyful
moments in the escapes to the “real world” and last a sincere appreciation goes to my husband
Thomas for giving me strong support and encouragement through ups and downs.
Thank you.
iii
Table of Contents
Preface ......................................................................................................................................... i
Acknowledgements .................................................................................................................... ii
Summary in English ................................................................................................................... v
Summary in Danish................................................................................................................... vi
List of supporting publications ................................................................................................ vii
Additional manuscript and presentations .............................................................................. viii
Abbreviations and terms ........................................................................................................... ix
List of tables ............................................................................................................................... x
List of figures ............................................................................................................................. xi
1 Introduction ......................................................................................................................... 1
1.1 Motivation .................................................................................................................... 1
1.2 Project aim and hypothesis ......................................................................................... 4
2 Suitability of miscanthus for biological conversion ............................................................ 5
2.1 Miscanthus .................................................................................................................. 5
2.1.1 Morphology .............................................................................................................. 6
2.1.2 Experimental site ................................................................................................. 8
2.1.3 Harvest, plant sampling and fractionation .......................................................... 8
2.2 Biorefining and bioethanol .........................................................................................12
2.2.1 Biorefining process ..............................................................................................12
2.2.2 High-throughput pretreatments and enzymatic hydrolysis method ..................16
2.2.3 Calculations .........................................................................................................16
2.2.4 Experiments on enzyme dosage .......................................................................... 17
2.3 Biogas .........................................................................................................................19
2.3.1 Mechanical pretreatment – extruder and roller-mill .........................................19
2.4 Sampling .................................................................................................................... 23
2.4.1 Replication experiment ...................................................................................... 25
2.5 Ensiling ...................................................................................................................... 28

iv
2.5.1 Ensiling experiment ........................................................................................... 28
2.5.2 Water extraction of compounds produced by ensiling ...................................... 28
2.5.3 High-throughput pretreatments and hydrolysis method .................................. 29
2.5.4 Findings from the ensiling procedure ................................................................ 29
2.6 Spectral analysis ........................................................................................................ 32
2.6.1 NIR, mid-IR and chemometrics ......................................................................... 32
2.6.2 Instrumentation ................................................................................................. 33
2.6.3 Predicting the methane potentials by NIR ......................................................... 34
3 General discussion ............................................................................................................ 37
3.1 Conversion of miscanthus into energy carriers ......................................................... 37
3.2 Sampling procedure .................................................................................................. 39
3.3 Ensiling miscanthus for storage .................................................................................41
4 Conclusion and novel findings .......................................................................................... 43
5 Future perspectives ........................................................................................................... 44
6 Manuscripts ...................................................................................................................... 45
6.1 Manuscript 1: Seasonal dynamics and genotype differences of enzymatically
accessible sugars from Miscanthus ...................................................................................... 45
6.2 Manuscript 2: The effect of harvest time, dry matter content and mechanical
pretreatments on anaerobic digestion and enzymatic hydrolysis of Miscanthus ................ 45
6.3 Manuscript 3: Comparing methods for characterising the digestibility of Miscanthus
in bioethanol or biogas processing ....................................................................................... 45
7 References ......................................................................................................................... 46

v
Summary in English
Miscanthus (Miscanthus spp.) is a promising energy crop, which can contribute to fulfil the
demand of increasing the part of energy from renewable energy sources. The biological
convertibility of miscanthus into energy carrier is of interest, as the high yield of the plant not
directly can be used as fuel or electricity.
In this PhD project the use of miscanthus as feedstock for biogas and bioethanol production
was studied. The impact of harvest time and genotype on the biological convertibility to
fermentable sugars and methane as well as the ensiling ability was examined. Additionally, the
impact of mechanical pretreatment of the biomass with extruder or roller-mill prior to
methane production was studied. In the quantification of fermentable sugars, samples
equalling 0.00000027% of the biomass was analysed. This request a representative sampling
procedure to obtain reliable results, and the sampling strategy was thus tested and discussed.
The quantity of fermentable sugars was not correlated to the methane production because of
the harsh pretreatment prior to the measure of fermentable sugars with ability to access similar
proportions of glucose and xylose despite of physiological differences due to maturity and
harvest time, however, the genotypes did vary in accessibility of the sugars. Contrary, harvest
time influenced methane yield, with most methane obtained from the green miscanthus.
The methane yield was increased by mechanical pretreatment that reduced the particle size of
miscanthus. Generally, the increase was highest from extrusion, but dry, rewetted and roller-
milled biomass obtained similar increase as the dry extruded biomass.
The relative sampling variation was high, in some cases over the recommended threshold of
20%, however, the variation of the standard sample was also high, 13-19%, though being
collected from a homogenous sample. The large analytical variations suggests not only the
primary sampling procedure gives rise to the high relative sampling variation.
The high dry matter loss from autumn to winter are of high importance to both biogas and
bioethanol production. By storing the miscanthus anaerobically, the results indicate that
ensiling could facilitate storage of dry matter by which the field losses are avoided.
The present findings indicate miscanthus could be a future resource for renewable energy
carriers, but the best harvest time depends on the choice of energy carrier. In order to solve the
future challenges of producing energy from renewable resources miscanthus may be a piece to
the puzzle, but it will also request a strategic approach to how all the renewable energy sources
are combined best in order to benefit from all rather than a competition among them.

vi
Summary in Danish
Elefantgræs (Miscanthus spp.) er en lovende energiafgrøde, som kan medvirke til at opfylde
kravene om øget andel af energi fra vedvarende energikilder. Den biologiske omsættelighed af
elefantgræs til energibærer er interessant, da plantens høje udbytte ikke direkte kan bruges
som brændstof eller elektricitet.
I dette Ph.d. projekt blev brugen af elefantgræs som råmateriale til produktion af biogas og
bioethanol undersøgt. Betydningen af høsttidspunkt og genotype for den biologiske
omsættelighed til fermenterbare sukre og metan, samt potentialet for lagring ved ensilering.
Ligeledes blev effekten af mekanisk forbehandling af biomassen med ekstruder og valse forud
for metanproduktion studeret. Ved kvantificeringen af fermenterbare sukre blev prøver
svarende til 0,00000027% af biomassen analyseret. Det kræver derfor repræsentativ
prøveudtagning for at opnå pålidelige resultater, hvorfor prøveudtagningen ligeledes blev
undersøgt og diskuteret.
Kvantiteten af fermenterbare sukre var ikke korreleret til metanproduktionen, grundet den
hårde forbehandling forud for måling af de fermenterbare sukre som tilgængeligjorde samme
andel af glukose og xylose uafhængigt af høsttid og modenhed, der var dog variation imellem
de undersøgte genotyper. For metan forholder det sig anderledes, hvor udbyttet var højest fra
den grønne elefantgræs.
Metanudbyttet blev øget ved mekanisk forbehandling, der mindskede partikelstørrelsen af
biomassen. Den største effekt sås generelt ved ekstrudering, men ved at væde den tørreste
biomasse opnåede valsning et merudbytte tilsvarende den, der blev opnået ved ekstrudering
af den tørre biomasse.
Den relative prøveudtagningsvariation var høj og i nogle tilfælde over den anbefalede tærskel
på 20%. Der var dog også stor variation på standardprøverne (13-19%) som ellers forventes at
blive taget fra en homogen prøve. Dette indikerer, at ikke kun den primære prøvetagning er
skyld i den store variation.
Ved udsættelse af høsten fra efterår til vinter falder udbyttet af biomasse, hvilket er af
afgørende betydning for produktionen af biogas og bioethanol. Resultaterne indikerede, at
ensilering af elefantgræs kunne være en lagringsmulighed, hvorved tabet af biomasse fra
efterårshøsten kan mindskes.
Energiproduktion fra elefantgræs har potentiale, men det optimale høsttidspunkt afhænger af,
hvilken energibærer, der produceres. Elefantgræs vil i fremtiden kunne bidrage til en fremtid
med højere andel af vedvarende energikilder, men det vil også kræve en strategi, der
kombinerer og drager fordel af de mange forskellige vedvarende energikilder, der findes.
vii
List of supporting publications
Manuscript 1: S. Frydendal-Nielsen, U. Jørgensen, C. Felby, R. Gislum. Seasonal dynamics
and genotype differences of enzymatically accessible sugars from miscanthus. Submitted to
Biomass and Bioenergy.
Manuscript 2: S. Frydendal-Nielsen, M. Hjorth, S. Baby, C. Felby, U. Jørgensen, R. Gislum.
The effect of harvest time, dry matter content and mechanical pretreatments on anaerobic
digestion and enzymatic hydrolysis of miscanthus. Submitted to Bioresource and Technology.
Manuscript 3: S. Frydendal-Nielsen, U. Jørgensen, M. Hjorth, C. Felby, R. Gislum, (2016)
Comparing methods for measuring the digestibility of miscanthus in bioethanol or biogas
processing. Global Change Biology Bioenergy. DOI: 10.1111/gcbb.12377
viii
Additional manuscript and presentations
In addition to above mentioned supporting manuscripts, results from the PhD project have
been presented in a journal and at conferences both orally and as posters, all posters and oral
presentations have been done by me.
R.Wahid, S Frydendal-Nielsen, V.M. Hernandez, A.J. Ward, R. Gislum, U. Jørgensen, H.B.
Møller. (2015). Methane production potential from Miscanthus sp.: Effect of harvesting time,
genotypes and plant fractions. Biosystems Engineering, 133, 71-80. doi:
10.1016/j.biosystemseng.2015.03.005
S. Frydendal-Nielsen, U. Jørgensen, M. Hjorth, C. Felby, R. Gislum, (2015) Comparing
methods for characterising the biodegradability of miscanthus. International Conference on
Perennial biomass crops for a resource-constrained world in Hohenheim, Germany.
Oral presentaion.
M. Hjorth, V. Cacciatore, S. Frydendal-Nielsen, R. Wahid, R. Mortensen. (2015) Extrusion
methodology for biogas and bioethanol pretreatment of lignocellulosic biomasses. 11th
International Conference on Renewable Resources & Biorefineries , York, United Kingdom.
Oral presentation.
S. Frydendal-Nielsen, R. Wahid, U. Jørgensen, H.B Møller, C. Felby, R Gislum. (2015).
Assessing biogas potentials of energy crops using near infrared reflectance (NIR) spectroscopy.
17th International Conference on Near Infrared Spectroscopy, Foz do Iguazu, Brasilien.
Poster.
S. Frydendal-Nielsen, U. Jørgensen, C. Felby, R. Gislum. (2014) Does harvest time
influence the enzymatic accessibility of sugars in miscanthus? Conference on Energy and
Environment for the Future, Copenhagen, Denmark.
Poster.
S. Frydendal-Nielsen, U. Jørgensen, C. Felby, R. Gislum. (2013) Temporal changes of
enzymatic accessible sugars in the cell walls in three varieties of Miscanthus. European
Biomass Conference and Exhibition, Copenhagen, Denmark.
Poster.

ix
Abbreviations and terms
DNS 3,5 dinitrosalicylic acid assay
FPU Filter paper units
HPLC High-performance liquid chromatography
IR Infrared
MIR Mid-infrared
Miscanthus Miscanthus spp.
MPA Meta-phosphoric acid
NIR Near-infrared
NIST The standard sample supplied by the National
Institute of Standards and Technology
PC Principal components
PCA Principal components analysis
PLSR Partial least squares regression
R2 Coefficient of determination
RMSEC Root mean error of calibration
RMSECV Root mean error of cross validation
RMSEP Root mean error of prediction
RSV Relative Sampling Variability
SEP Standard error of prediction
VFA Volatile fatty acids
Vis-NIR Visible near-infrared

x
List of tables
Table 1. Correlation coefficient (R2) and slopes between glucose and xylose content of the
entire stem and all stem fractions and leaves of all three genotypes. ............................. 11
Table 2. Relative sampling variation (RSV) of xylan and glucan of leaf and stem fractions of
three genotypes (M. x giganteus, M. sacchariflorus and M. sinensis). n indicates the
number of samples analysed. ......................................................................................... 27
Table 3. Mean, minimum and maximum of glucan and xylan percent calculated per plate and
the relative sampling variation (RSV) is calculated over 25 plates. ............................... 27
Table 4. Dry matter (DM) content in biomass before and after ensiling and pH in extract after
ensiling in three miscanthus genotypes.......................................................................... 30
Table 5. Ethanol, methane and energy yields from miscanthus harvested in autumn or winter.
Wheat and maize silage are included for reference. Standard deviations are given in
brackets. .......................................................................................................................... 38
xi
List of figures
Figure 1. Schematic picture of miscanthus with tiller, flower, node, internode, rhizome and
leaf consisting of blade and sheath. .................................................................................. 7
Figure 2. Growth of M. sinensis (a) and M. x giganteus (b). The tillers of M. sinensis originate
from a crown, whereas the tillers of M. x giganteus are randomly distributed. ............... 8
Figure 3. Relationship of the enzymatically accessible glucose content of middle stem fraction
representing the stem in Manuscript 1 to the entire stem. Data is for the three genotypes
and each dot represents a block from the field experiment. .......................................... 10
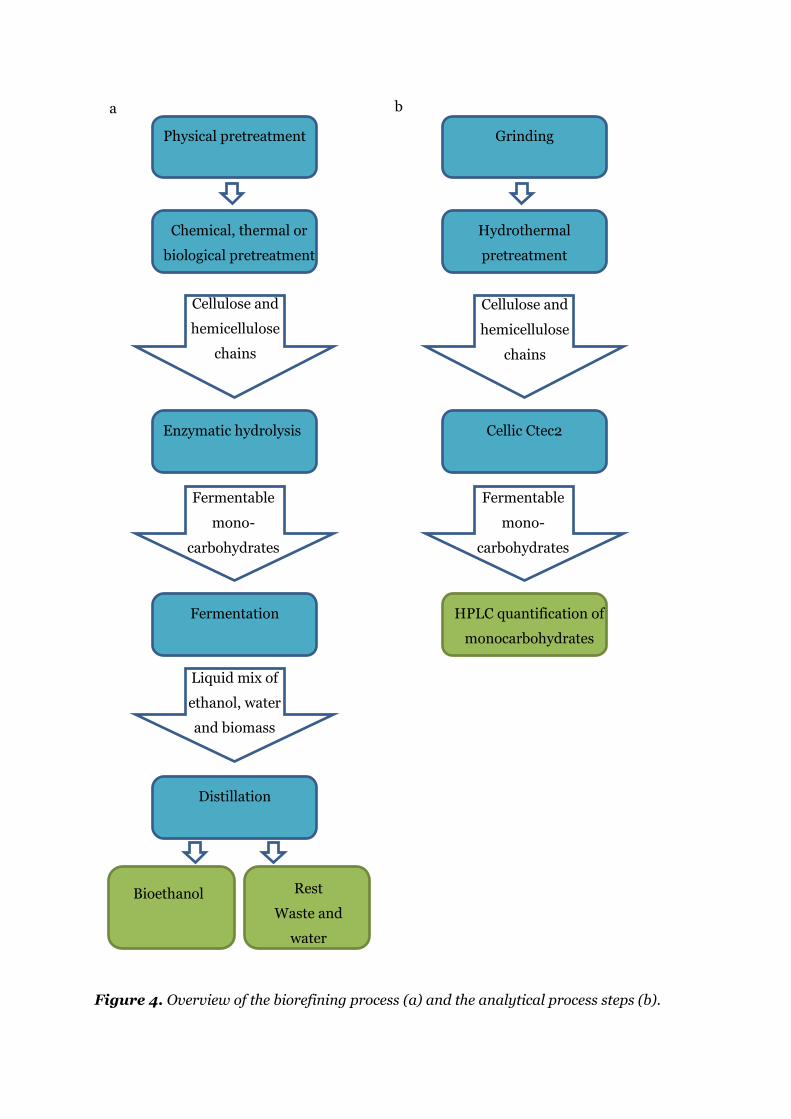
Figure 4. Overview of the biorefining process (a) and the analytical process steps (b). ........ 13
Figure 5. Illustration of how β-glucosidase, exoglucanase and endoglucanase hydrolyses
cellulose into cellobiose and glucose. Adapted from de Souza (2013). ...........................14
Figure 6. Hydrolysed glucose (blue) and xylose (green) from leaves (a) and stem (b) of M. x
giganteus (gig), M. sacchariflorus (sac) and M. sinensis (sin) at harvest number 1, 5 or 8
using 10 FPU (filled bars) or 30 FPU (hatched bars). The error bars indicate the standard
deviation on the analysis. ............................................................................................... 18
Figure 7. Not extruded biomass (left) and extruded biomass (right). ....................................21
Figure 8. The kneading zone of the extruder. The arrows indicate the movement of the
biomass. The reverse kneading is on the right. ...............................................................21
Figure 9. Miscanthus x giganteus harvested in April after shredding (a), roller-milling (b) and
extrusion (c). ................................................................................................................... 22
Figure 10. Overview of constituents to the global estimation error. The figure adapted from
Petersen et al. (2005). ..................................................................................................... 25
Figure 11. Ethanol, lactic acid, acetic acid and butyric acid from three Miscanthus genotypes
(M. giganteus (gig), M. sacchariflorus (sac), M. sinensis (sin)) harvested either in
September or in January. Standard bars indicate the standard deviation...................... 31
Figure 12. PCA of Jerusalem artichoke, beets, M. x giganteus (gig), hemp, maize and M.
sinensis (sin). .................................................................................................................. 36

1
1 Introduction
Denmark has committed itself to obtain 35% of the consumed energy from renewable sources
by 2020 and 100% in 2050 (Danish Energy Agency, 2012). Consequently, the need for
renewable energy is going to increase before 2020 and a large part of this energy is expected
to originate from biomass, collectively termed bioenergy. In 2014 the renewable energy sources
accounted for 28.5% of Denmark’s energy consumption and 68% of the renewable energy
originated from biomass resources (Danish Energy Agency, 2014). The aims of increasing
biomass production demand sound considerations about selection of energy carrier,
conversion strategies, changes in the current energy grids and transportation and storage of
resources and energy carriers (Lund & Mathiesen, 2009; Mathiesen et al., 2011). There is no
simple answer to these challenges when changing to a renewable energy supply. Concurrent to
an increased use of biomass for energy there is a growing world population, which at the same
time needs more food. This calls for a combined food-energy production. The answer will
involve improved utilisation of the available resources; bioenergy must be applied in
combination with e.g. hydropower, wind and solar energy. The bioenergy should include a
wisely considered mixture of biofuels, biogas and combustion, and utilise crop residues, waste
from food production and dedicated energy crops. Perennial crops can reduce the nitrate
leaching if substituting annual crops such as cereals (Pugesgaard et al., 2015). Use of high
yielding crops for renewable energy has potential for future energy production if combined
with efficient conversion technologies.
1.1 Motivation
Implementing and improving the use of bioenergy can be done in several ways; one is to use
the biomass as feedstock for biorefining (Parajuli et al., 2015). The public perception of
biorefining is often associated with production of ethanol, however, biorefining is much more
than that. The part ‘bio’ refers to biomass being the feedstock, and ‘refining’ is a process
transforming the feedstock to better or other products. The term has been defined as
“Biorefinery is the sustainable processing of biomass into a spectrum of marketable products
(food, feed, materials, chemicals) and energy (fuels, power, heat)” (International Energy
Agency, 2009). Though various definition can be found the common focus is that various
products are produced from biomass (Parajuli et al., 2015). Traditionally, crops with high water
soluble sugar content were fermented to ethanol. Later, the process was improved to utilise
starch by addition of enzymes prior to the fermentation to hydrolyse the starch chains into
fermentable monosaccharides (Schubert, 2006). Further improvements came with
introduction of pretreatments enabling conversion of the recalcitrant lignocellulosic biomass
to energy. It requires a pretreatment (hydrothermal or chemical) to open the crystalline
structures comprising the lignocellulosic biomass in order to have the chains of carbohydrates

2
accessible to enzymes (Himmel et al., 2007). Biomass can also be used for anaerobic digestion,
a well-established technology in developed (Berglund & Börjesson, 2006) and developing parts
of the world (Katuwal & Bohara, 2009). A mixture of inoculum and biomass (substrate) kept
at anaerobic conditions will promote growth of microbes able to degrade the biomass and
produce CO2 and methane. Mechanical pretreatment of the biomass has proven to increase the
methane potential of different substrates (Hjorth et al., 2011).
Miscanthus (Miscanthus spp.) is a C4 plant with high radiation and water use efficiency (Beale
& Long, 1995; Beale et al., 1996; Beale et al., 1999). Beale and Long (1995) found the C4
photosynthesis of M. x giganteus to be active in the climate of United Kingdom a climate cooler
than C4 plants normally benefit from. Many perennial crops benefit from a longer growing
season by having a higher yield potential than the annual crops due to earlier germination and
later senescence. Dohleman and Long (2009) found a 61% higher biomass production in M. x
giganteus compared to maize (Zea Mays) in Illinois, United States of America, due to a longer
photosynthetic period in miscanthus compared to maize. Most arable crops like cereals are
senescing relatively early in the summer (Hay & Porter, 2006), which is inefficient as a major
part of the seasonal radiation in Denmark is in July and August (Sørensen & Nistrup
Jørgensen, 2010). M. x giganteus on the other hand stays photosynthetic active until flowering
(rare in northern Europe) or the autumn frost kills the green leaves (Clifton-Brown et al.,
2001). The long growing season, the dense network of roots, low nutrient input demands and
being perennial are some of the reasons why miscanthus has a low nutrient leaching (Boehmel
et al., 2008). Compared to switchgrass (Panicum virgatum) and maize, miscanthus has a
lower greenhouse gas emission because of high yields, low nitrogen input requirements and
carbon sequestration (Davis et al., 2010).
Normal practice is to harvest miscanthus in the late winter or early spring with low moisture
content when being used for combustion. The dry matter yield of miscanthus is reduced by
0.36% for each day the harvest is postponed from the first day with frost below -2°C (Clifton-
Brown et al., 2004). The lignin and cellulose contents increase, and the hemicellulose content
decreases between November and April (Hodgson et al., 2010). The moisture content does not
matter when feedstock has to be used for conversion into ethanol (Hayes & Hayes, 2009) and
an earlier harvest of miscanthus when used for biorefining is of interest as the shoots are less
lignified and consequently the carbohydrates are easier available to the fermenting
microorganisms. At the same time, yield losses due to senescence of the leaves may be reduced,
which increase the total ethanol yield per hectare. However, wet and green biomass is difficult
to store due to respiration inducing dry matter loss (Wilkinson et al., 2003), though storage
might be necessary in situations where the processing plant cannot receive it directly from
harvest. Ensiling is a common storage method for forages, such as grass, clover and maize,
which are stored anaerobically at low dry matter contents (35-50%) to preserve the feed for

3
later use (Van Soest, 1994). Similar anaerobic storage has been found possible for M x
giganteus harvested in December (Kristensen, 2001) and harvested in September if lactic acid
bacterias were added (Whittaker et al., 2016) and might thus be possible for other genotypes
too.
The quality of miscanthus for bioethanol and biogas production depends on how accessible the
biomass is to enzymes (bioethanol) or enzymes and microbes (biogas). To measure the quality,
wet chemical analyses are needed, analyses that are laborious and time consuming. A study
using near infrared (NIR) spectroscopy to evaluate sugar content in miscanthus was
conducted (Hayes, 2012), however, the study predicted the compositional content of sugars.
In a compositional study, the aim is to know the entire content of constituents such as sugars,
lignin and ash and further a pretreatment harsher than what normally is conducted as
pretreatment in biorefining are used. In lignocellulosic biomass a proportion (dependent on
the applied biorefining pretreatment and technique) of the sugars will not be available to
fermentation due to lignification (Hayes & Hayes, 2009), and it would be of high interest to
predict the amount of enzymatically accessible sugars i.e. the quality for biorefining.
In 2015 only 67 ha with miscanthus were grown in Denmark (Danish AgriFish Agency, 2015)
mainly for thatching purposes (Kjeldsen et al., 1999). One challenge facing miscanthus is that
farmers are required to occupy land for a long period when growing miscanthus as it is a
perennial crop, and farmers are not guaranteed a market for the produced miscanthus.
Miscanthus could be feedstock for biorefineries, however, no biorefineries are currently
established in Denmark. Maabjerg Energy Concept includes a biorefining plant, but it is still
not decided whether it will be build or not. The Energy Concept forecasts to consume 300,000t
straw, necessitating transport up to 100 km from the plant (Maabjerg Energy Center, 2016).
Replacing some of the straw with another lignocellulosic biomass, such as miscanthus, having
higher yields per ha than straw and grown at fields close to the biorefinery could facilitates
decreased costs to transportation and allows a bigger proportion of straw to remain at the field
and incorporated in the soil. Improving carbon sequestration facilitates not only carbon
storage, but also organic material able to interact with mineral soil particles improving soil
fertility and friability of the agricultural fields (Schjønning et al., 2009). However, it is, difficult
to promote bioenergy crops when there is no commercial potential yet. Another potential use
of lignocellulosic biomass is for production of biogas, where biomass is added to the process to
increase the biogas production. Miscanthus could be implemented as a substrate in the already
established biogas productions in Denmark, if the methane yields are satisfying. Studies have
shown that mechanical pretreatment can improve methane yields of other biomass types
(Hjorth et al., 2011; Menardo et al., 2015; Wahid et al., 2015b) and therefore mechanical
pretreatment are expected to improve the methane potential of miscanthus too.

4
1.2 Project aim and hypothesis
The overall aim of the project was to maximise qualitative yields of miscanthus for biological
bioethanol and biogas production. The main parameters are the digestibility of the
lignocellulosic biomass and the capacity for producing fermentable sugars or methane.
The main hypothesis is that the performance of miscanthus for biochemical energy
applications can be improved by careful selection of harvest time, genotype and pretreatment.
This hypothesis was tested by studying:
o The influence of harvest time upon the quantity of fermentable sugars (Manuscript 1)
and the methane production (Manuscript 2).
o Genotypic variation of fermentable sugars for three genotypes during two growing
seasons and for 23 genotypes at one harvest time (Manuscript 1).
o The effect of mechanical pretreatment for methane production (Manuscript 2).
o The coherence between quantified amount of fermentable sugars and methane
production (Manuscript 3)
o The effect of variation due to sampling procedure relative to the variation in the
analytical procedure (Section 2.4 and 0 in this thesis).
o Suitability of miscanthus for ensiling (Section 0 and 3.3 in this thesis).
o The performance of NIR prediction to estimate the methane or fermentable sugar
yields (Section 0 in this thesis).

5
2 Suitability of miscanthus for biological conversion
2.1 Miscanthus
Miscanthus (Miscanthus spp.) is a perennial grass native to the south-eastern Asia through
China, Japan to Polynesia, few species originates from Africa (Scally et al., 2001) and Russia
(Jiao et al., 2016). Particularly one genotype, the triploid M. x giganteus has received great
interest since Aksel Olsen brought it to Denmark in 1935 from Japan for horticultural purposes
(Linde-Laursen, 1993). M. x giganteus is a hybrid of the diploid M. sinensis and the tetraploid
M. sacchariflorus and has since it arrived in Denmark been spread throughout Europe and the
United States of America (Głowacka et al., 2015). Miscanthus is a C4 photosynthetic crop, that
assimilate CO2 into a four carbon structure that is transported from the mesophyll cells to the
bundle sheath cells where the Calvin Benson cycle occurs (Taiz & Zeiger, 2010). It allows the
plant to be photosynthetic active even with low stomatal conductance. Miscanthus grows well
in Denmark even though it is adapted to warmer climates. A field study with 15 genotypes was
covering the latitude from Portugal to Denmark revealed a large genotypic difference with
regard to winter survival (Clifton-Brown et al., 2001). Those genotypes that survived the winter
were able to grow and develop satisfactorily under the climatic conditions in the country. The
genotypes that had difficulties in Denmark were the four genotypes of M. x giganteus (93-
100% of the plants died) and M. sacchariflorus (50-70% of the plants died). Among the ten M.
sinensis genotypes planted, two genotypes in Sweden and one in Denmark experienced 50-
60% death of the plants (Clifton-Brown et al., 2001). Miscanthus needs time to establish and
it is evident that the plants grew better in the southern than in the northern regions of Europe.
In the third growing season, all fifteen genotypes were flowering in Portugal whereas only eight
of the genotypes in Denmark flowered. Similarly, the maximum autumn yield achieved in
Portugal was 41 t dry matter per ha while only 20 t dry matter per ha were harvested in
Denmark.
A long-term field study of two miscanthus genotypes in Denmark showed that yields peaked
after 7 to 8 years of growth. The yields were determined at both autumn and winter harvest,
with autumn harvest having the highest yields and up to 42% reduction by harvesting in winter
(Larsen et al., 2014). The winter yield is always lower than the autumn yield due to senescence
and wind damage of leaves and stems. Additionally, reduction in dry matter yield occurs due
to translocation of nutrients (it should however preferably have finished prior to autumn
harvest, see next section), and due to mineral leaching from senesced plants during autumn
and especially winter precipitation (Jørgensen, 1997). Leaching of nitrogen from miscanthus
fields are generally low and comparable to extensive grassland. Application above 75 kg N/ha
to miscanthus on fertile soils has limited effect on dry matter yields (Larsen et al., 2014) and 0
to 60 kg N/ha results in low nitrogen leaching, that increased when 120 kg N/ha was applied
6
(Christian & Riche, 1998). Commercial fields with miscanthus have recently been established
in the United Kingdom (Jørgensen, 2011).
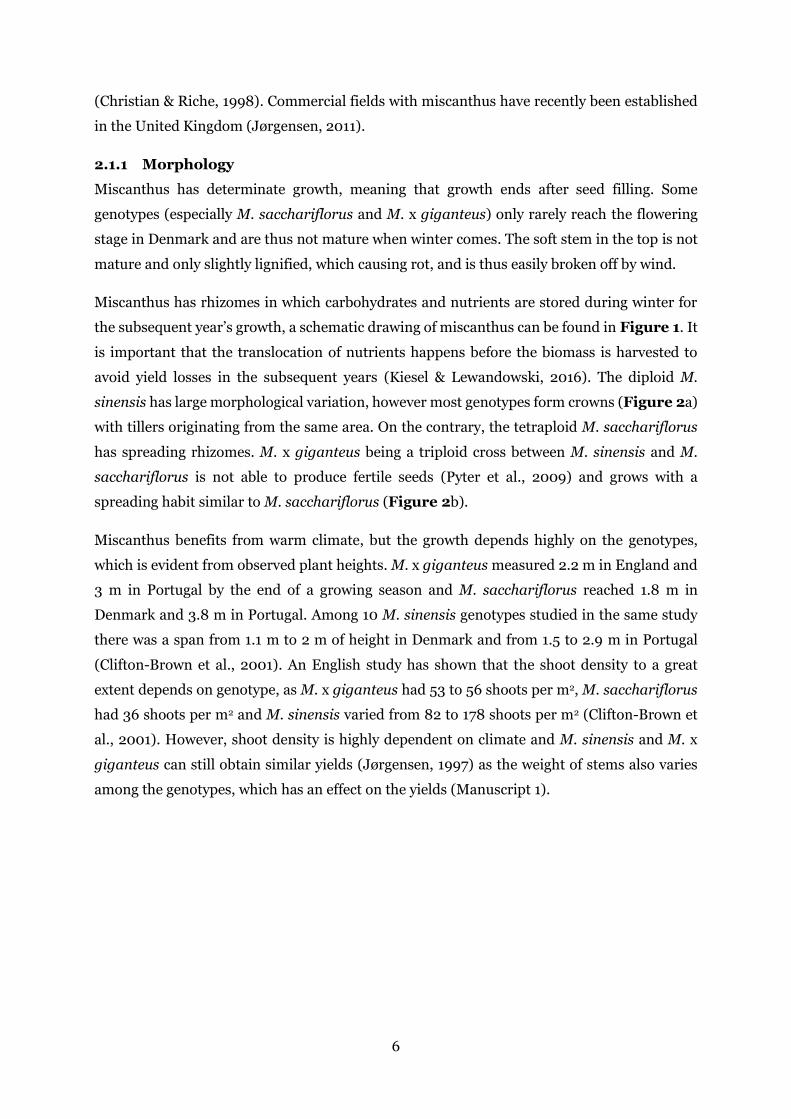
2.1.1 Morphology
Miscanthus has determinate growth, meaning that growth ends after seed filling. Some
genotypes (especially M. sacchariflorus and M. x giganteus) only rarely reach the flowering
stage in Denmark and are thus not mature when winter comes. The soft stem in the top is not
mature and only slightly lignified, which causing rot, and is thus easily broken off by wind.
Miscanthus has rhizomes in which carbohydrates and nutrients are stored during winter for
the subsequent year’s growth, a schematic drawing of miscanthus can be found in Figure 1. It
is important that the translocation of nutrients happens before the biomass is harvested to
avoid yield losses in the subsequent years (Kiesel & Lewandowski, 2016). The diploid M.
sinensis has large morphological variation, however most genotypes form crowns (Figure 2a)
with tillers originating from the same area. On the contrary, the tetraploid M. sacchariflorus
has spreading rhizomes. M. x giganteus being a triploid cross between M. sinensis and M.
sacchariflorus is not able to produce fertile seeds (Pyter et al., 2009) and grows with a
spreading habit similar to M. sacchariflorus (Figure 2b).
Miscanthus benefits from warm climate, but the growth depends highly on the genotypes,
which is evident from observed plant heights. M. x giganteus measured 2.2 m in England and
3 m in Portugal by the end of a growing season and M. sacchariflorus reached 1.8 m in
Denmark and 3.8 m in Portugal. Among 10 M. sinensis genotypes studied in the same study
there was a span from 1.1 m to 2 m of height in Denmark and from 1.5 to 2.9 m in Portugal
(Clifton-Brown et al., 2001). An English study has shown that the shoot density to a great
extent depends on genotype, as M. x giganteus had 53 to 56 shoots per m2, M. sacchariflorus
had 36 shoots per m2 and M. sinensis varied from 82 to 178 shoots per m2 (Clifton-Brown et
al., 2001). However, shoot density is highly dependent on climate and M. sinensis and M. x
giganteus can still obtain similar yields (Jørgensen, 1997) as the weight of stems also varies
among the genotypes, which has an effect on the yields (Manuscript 1).

7
Figure 1. Schematic picture of miscanthus with tiller, flower, node, internode, rhizome and
leaf consisting of blade and sheath.

8
Figure 2. Growth of M. sinensis (a) and M. x giganteus (b). The tillers of M. sinensis
originate from a crown, whereas the tillers of M. x giganteus are randomly distributed.
2.1.2 Experimental site
The miscanthus field experiments were conducted at Research Centre Foulum, Denmark
(56.49N, 9.55E). The fields were established in 1993 (Manuscript 1), 1996 (Manuscript 2 and
Manuscript 3) and 1997 (Manuscript 1) as part of three independent experiments, and thus not
planned for mutual comparison. Though the experimental fields are approximately 20 years
old, the plants develop new annual shoots.
The enzymatically accessible sugar content did not differ between M. x giganteus from two
different field experiments even though they differ four years in age (Manuscript 1). The change
in composition over 20 years has not been studied but is expected to be negligible since new
tillers are produced every year. The field experiments included genotypes of the species: M. x
giganteus, M. sinensis, M. sacchariflorus and M. tinctorius. M. x giganteus is included in all
manuscripts whereas the latter four are compared in Manuscript 1.
2.1.3 Harvest, plant sampling and fractionation
Twenty-three genotypes of the five species in field experiments with 14 genotypes grown in
three replicates and 9 genotypes grown without replicates were tested for enzymatically
accessible sugar content in Manuscript 1. Moreover three genotypes (M. x giganteus, M.
sacchariflorus and M. sinensis) were studied during two harvest seasons. In the first season
nine harvests were conducted from 28 August 2012 to 8 April 2013, the following year only five
sampling were carried out between 6 August 2013 and 21 January 2014. The plots were visually
divided into six squares, avoiding the outer plants where development and growth of the plants
were affected by higher radiation, wind and other abiotic conditions. From each square 1/6 of
the total number of necessary tillers were collected, harvested 10 cm above soil surface. This
(a) (b)
9
sampling formed a composite sample (see Section 2.4) by pooling the individual tillers
collected throughout the plot into one sample aiming to cover the expected variation within
the plot. The total number of harvested tillers varied between genotypes since a certain
quantity (min. 200 g) of internodes (defined in Figure 1), representing the stem, and leaves
were needed, and the tillers of M. sinensis were significantly thinner and lighter than M. x
giganteus and M. sacchariflorus (Manuscript 1). Additionally, the weight of the stems were
decreasing through the season resulting in 10-18 tillers were needed from M. x giganteus and
M. sacchariflorus, whereas 30-100 tillers of M. sinensis were necessary to obtain sufficient
amount of biomass to the study of harvest time trends and for a methane study conducted in
cooperation with Radziah Wahid (Wahid et al., 2015a).
Large samples (up to 900g dry matter) were taken throughout the autumn and winter season,
but only 0.027g dry matter was analysed for biorefining quality. It was thus important to
ensure that samples for chemical analysis represented the whole plot and genotype. The
chemical composition of the plants vary between leaves, nodes and internodes (Hayes, 2013).
Additionally, the chemical composition are dependent on whether the samples are from lower,
middle or top meter of the stem (Hayes, 2013). As the height and size of the tillers varied
between genotypes and harvest times, the balance point of the stem was used as a
representative sample of the entire stem to have consistent samples from each sampling,
avoiding errors caused by analysing top stem at one sampling and analysing bottom stem in
the subsequent sampling. The balance point was found by balancing the stem over a point and
the internode with the balance point as well as the four adjacent internodes, two at each side,
constitute the sample. All leaves from the entire tiller, including blades and sheaths, were
pooled, chopped and a subsample was extracted by coning and quartering. Leaf and internode
sample was ground by a cutting mill with a 6mm square-holed mesh (Retsch SM2000) and a
subsample for analyses was taken using a riffle splitter with 10 chutes (Pfeuffer Gmbh,
Kitzingen, Germany). For further details, see Manuscript 1.
2.1.3.1 Is the stem sample representative to the total stem?
The five internodes around the balance point were analysed as a representative sample for the
entire stem in Manuscript 1. To assess how this stem fraction relates to the entire stem a study
was conducted in the three genotypes studied in the harvest time study (Manuscript 1) at the
harvest in February 2014, when sampling for the replication experiment was done (described
in Section 2.4.1). One sample from each block-genotype combination was split into nodes and
internodes from top, bottom and centre part of the stem and all leaves, each part were analysed
separately (internodes from the centre part of the stem and the leaves are the two fractions
normally analysed). These extra analyses allowed estimation of glucose and xylose values from
the entire stem enabling correlation of values from the middle part of the stem to the entire
stem.

10
Figure 3 shows the relationship between glucose content of middle part of the stem and the
entire stem for the three genotypes. The slope and R2 across the block-genotypes were 0.8 and
0.41, respectively. The relationship was not better when evaluating the genotypes individually.
These relationships were not perfect, but neither were the relationship between the remaining
stem fractions and the entire stem (Table 1). The best correlation was from the rest stem (that
is all stem, not included in the centre part of the stem). It is, however, also by far the biggest
proportion of the stem (Table 1), and containing biomass from top and bottom and thus
expected to cover the variation of the stem best.
In summary, miscanthus is a promising dedicated energy crop, which could have potential for
biogas and bioethanol production and by harvesting earlier than the winter harvest usually
used for combustion. By harvesting miscanthus in autumn, the yield will be higher but storage
methods avoiding respiration should also be considered. The sampling procedure used in the
present study analysed leaves and stem (represented by the balance part of the stem)
separately, to study trends in both organs and improve the sampling representativeness.
Figure 3. Relationship of the enzymatically accessible glucose content of middle stem
fraction representing the stem in Manuscript 1 to the entire stem. Data is for the three
genotypes and each dot represents a block from the field experiment.
0
5
10
15
20
25
30
0 5 10 15 20 25 30
En
zym
ati
call
y a
cces
sib
leg
luco
se(%
of
bio
ma
ss)
in t
he
enti
re s
tem
Enzymatically accessible glucose (% of biomass) in the middle stem fraction
M. x giganteus M. sacchariflorus M. sinensis

11
Table 1. Correlation coefficient (R2) and slopes between glucose and xylose content of the entire stem and all stem fractions and leaves of all three
genotypes.
Glucose Xylose Part of entire stem (%)
R2 Slope R2 Slope Mean Standard deviation
Stema (internodes mid) 0.64 0.53 0.84 0.91 36.8 2.5
Internodes bottom 0.90 1.50 0.91 1.28 10.5 1.7
Internodes top 0.46 0.57 0.41 0.52 11.3 1.8
Nodes bottom 0.87 1.31 0.96 1.41 8.2 1.3
Nodes mid 0.73 0.78 0.42 0.27 2.0 1.4
Nodes top 0.72 1.08 0.54 0.71 31.1 3.5
All remaining stem 0.97 1.23 0.96 1.06 68.9 3.5
Leaves 0.07 0.06 0.50 0.42 73.3 25.6
a The stem fraction with the balance centre used to represent the entire stem in Manuscript 1.
12
2.2 Biorefining and bioethanol
Ethanol has been produced from crops with high sugar contents for hundreds of years and is
usually defined as ‘bioethanol’. The technique of producing bioethanol is continuously being
improved by implementing first starch containing crops and later lignocellulosic crops as
feedstocks (Schubert, 2006). The convertibility of biomass into energy carriers such as
bioethanol vary between plant species (Somerville et al., 2010) and plant organs (Hayes, 2013;
Zhang et al., 2014) but also the maturity stage of the plant has an effect on the convertibility
(Hayes, 2013). Leaves are generally easier to convert than stems (Zhang et al., 2014) and
immature plant fractions are easier to convert than mature plant fractions (Hayes, 2013). The
relative content of cellulose to hemicellulose and the lignin content influence the optimum
bioethanol technology. The preferred pretreatment method depends on the interest in
cellulose, hemicellulose or lignin.
2.2.1 Biorefining process
Lignocellulosic biomass is a complex recalcitrant combination of aromatic polymer lignin and
two carbohydrate polymers; cellulose (containing carbohydrates with six carbon atoms
(hexose)) and hemicellulose (containing carbohydrates with five carbon atoms (pentose)). To
convert the recalcitrant lignocellulosic biomass into bioethanol several steps are necessary
(Figure 4a). The particle size of the biomass is reduced by physical pretreatment to enable
handling of the biomass in the process. Subsequently, the biomass is pretreated chemically,
biological or physically to break the crystalline structures (more on pretreatments in Section
2.2.1.1). Hereafter the solution contains swollen biomass in which the long cellulose and
hemicellulose strands are present. Enzymes are added to obtain fermentable
monocarbohydrates. These enzymes serve to cleave the cellulose strands, done by addition of
a mixture of beta glucosidases, endo- and exoglucanases. The exo- and endoglucanases are able
to cut glucan chains from the ends and within the chain, respectively, resulting in cellobiose
(two linked glucose molecules) whereas the β-glucosidase cleaves the β-1,4 glucosidic bond
between the two glucose molecules in cellobiose resulting in two fermentable
monocarbohydrates (Figure 5). Hemicellulose is more branched than cellulose, but can also
be hydrolysed into monocarbohydrates by enzymes (Hayes, 2009). The monocarbohydrates
are fermented by yeast to ethanol. Traditionally, a specific yeast able to ferment only hexoses
was used, but new yeasts able to ferment pentose have been found, whereby the total ethanol
yield can be increased (Young et al., 2010). The mixture of water, biomass residues and
bioethanol are distilled and the bioethanol are purified.
13
Physical pretreatment
Chemical, thermal or
biological pretreatment
Enzymatic hydrolysis
Fermentation
Distillation
Cellulose and
hemicellulose
chains
Fermentable
mono-
carbohydrates
Liquid mix of
ethanol, water
and biomass
Rest
Waste and
water
Bioethanol
a
Grinding
Hydrothermal
pretreatment
Cellic Ctec2
HPLC quantification of
monocarbohydrates
Cellulose and
hemicellulose
chains
Fermentable
mono-
carbohydrates
b
Figure 4. Overview of the biorefining process (a) and the analytical process steps (b).

14
Figure 5. Illustration of how β-glucosidase, exoglucanase and endoglucanase hydrolyses
cellulose into cellobiose and glucose. Adapted from de Souza (2013).
2.2.1.1 Pretreatment of biomass
Pretreatment is an important part of the biorefining of lignocellulosic biomass as it increases
the biodegradability and thereby facilitates an increased hydrolysis, but still a bottle neck for
commercial biorefining (Kurian et al., 2013). The ideal pretreatment should ensure separation
of the wanted products, e.g. cellulose and hemicellulose, prevent sugar loss, not produce
inhibitors and be cost-effective (Mosier et al., 2005; Kurian et al., 2013), and it is a step in the
process limiting the outcome of the downstream processes. Different pretreatment methods
including chemical, biological and physical can be used.
Chemical pretreatments include the use of acids, alkalines or solvents. They all acts to reduce
the cellulose crystallinity hydrolyse the hemicellulose and modify the lignin. The acid
solubilises the hemicellulose and lignin, and a concentrated acid will facilitate cellulose to be
hydrolysed. Products like furfural, hydroxyl-methyl-furfural, aldehydes and phenolics are
inhibiting the enzymatic hydrolysis and fermentation and will necessitate a removal prior to
15
the subsequent process steps (Mosier et al., 2005; Kurian et al., 2013).
Alkaline pretreatment makes the biomass swollen and breaks ester and glycosidic bonds, and
the lignin ends up being solubilised, redistributed and condensed, occasionally on the cellulose
causing an unwanted modification of the cellulose. Lime is an alkaline chemical being used for
pretreatment, benefits of using lime is the possible recovery by CO2. Using dilute alkaline
pretreatments allows hemicellulose to be isolated from lignocellulose. The alkaline
pretreatments has a longer process time (hours or days) than the acidic pretreatments (Mosier
et al., 2005; Kurian et al., 2013). Organosolv pretreatments use solvents with or without
catalysts (various acids can be applied) and are used as deligninfying agent and are promising
by being very selective and effective. However, the high cost of solvent and possible inhibitors
produced due to the catalysts are disadvantageously (Mosier et al., 2005; Kurian et al., 2013).
The biological pretreatment utilises bacteria and fungi to degrade the specific components. The
process is time consuming (10 to 14 days) and takes up much space, and the microorganisms
consume some biomass for their growth. Therefore, the process is considered not to be
favourable for commercial use (Mosier et al., 2005; Kurian et al., 2013).
Physical pretreatments includes mechanical and thermal pretreatments. Examples of
mechanical pretreatments are described in Section 2.3.1 and Manuscript 2. The thermal
pretreatments are done in combination with water and the effect of the heating depends on the
temperature. Liquid hot water processes use temperatures of 150-180°C to solubilize the
hemicellulose and subsequent lignin. It can end up degrading the monomeric sugars to
aldehydes and risk producing furfural potentially inhibiting the microbial fermentation. The
solubilisation of lignin might produce phenolic compounds that are toxic to yeast, bacteria and
fungi (Mosier et al., 2005; Kurian et al., 2013). By keeping the pH between 4 to 7 the production
of monomeric sugars are limited and thereby minimizing the production of inhibitory products
produced by degrading cellulose (Hendriks & Zeeman, 2009). Steam explosion utilises
temperatures up to 240°C for few minutes, the steam inside the reactor builds up a pressure
and the explosion comes from the rapid pressure release. The purpose is, as for liquid hot
water, to solubilise the hemicellulose and avoiding the productions of inhibitors (Mosier et al.,
2005; Hendriks & Zeeman, 2009). The severity of the pretreatments depends on the
temperature and duration of the pretreatment (Overend & Chornet, 1987).
Besides the examples mentioned here additionally pretreatments exists in which the above-
mentioned are being combined e.g. combining liquid hot water and acids or alkaline.

16
2.2.2 High-throughput pretreatments and enzymatic hydrolysis method
A high-throughput setup for analysing the enzymatic accessibility of cellulose has been set up
at University of Copenhagen, Department of Geosciences and Natural Resource Management
to screen various types of biomass for convertibility into sugars. The measured outcome is
sugars, which potentially are fermentable into bioethanol or are used as precursor for
chemicals in the downstream process. In this thesis, the sugars are considered as precursor for
bioethanol, well aware that other products could also be produced.
A schematic overview of the analytical process related to the general biorefining process
described in Section 2.2.1, are shown in Figure 4. The analytical setup includes a robot
(Labman Automation Ltd. at Stokesley, North Yorkshire, UK) able to grind and dispense 0.027
g biomass into 96-well aluminium plates. Subsequently, liquid buffer are added manually to
the plates, which are then heated to 190°C for 10 min and cooled down. This pretreatment is
mimicking a liquid hot water pretreatment. All samples are analysed in triplicates. Next step
is addition of 20 filter paper units (FPU) Cellic Ctec2, Cellic Ctec2 is a cellulase and
hemicellulase complex (Novozymes, n.d.). The activity measure FPU measures the activity of
cellulase only, but higher cellulase activity will also result in higher hemicellulase activity. The
hydrolysis ran for 72 h at 50°C after which the samples are centrifuged and filtrated and the
sugar content of the filtrate is quantified by HPLC. The samples were analysed in triplicates,
and all triplicates were analysed at the same plate. In addition, blank samples containing no
biomass are analysed and the background glucose and xylose content from the enzymes is
quantified. A more detailed description of the method can be found in Manuscript 1 and
Manuscript 3.
2.2.3 Calculations
The measured glucose and xylose were converted to glucan by a factor (0.889 and 0.869,
respectively (Zhang, 2014)) accounting for the water molecules released when the
monosaccharides are linked to form polysaccharides and calculated as proportion of the
biomass hydrolysed. The background glucose and xylose content from the enzymes were
subtracted from the samples. Hundreds miscanthus samples from the studies of harvest time,
genotypes and sampling were analysed over two years. To account for variations in especially
pretreatment and hydrolysis a standard wheat straw (referred to as NIST) was included in all
plates (NIST, 2016). Accordingly, all samples were corrected by calculating the glucose or
xylose content relative to the relationship between NIST of the measured plate and the average
of all NIST measurements. Finally, the average of the triplicates were used for calculations of
percentage of glucan and xylan per dry matter biomass on weight basis.
This procedure was used in Manuscript 1 to compare different genotypes and different
maturity stages of miscanthus and in Manuscript 3, where the method was compared to 3,5

17
dinitrosalicylic acid assay measurements and biogas batch test to study the digestibility and
convertibility of miscanthus.
2.2.4 Experiments on enzyme dosage
Previous experiments on wheat straw use an enzyme loading of 10 FPU (Lindedam et al.,
2010). However, a small-scale pre-experiment was necessary to determine the enzyme loading
suitable for miscanthus samples. Miscanthus leaves and stem samples of M. x giganteus, M.
sacchariflorus and M. sinensis from August 29th 2012 (harvest 1), November 13th 2012 (harvest
5) and February 14th 2013 (harvest 8) were analysed using 10 and 30 FPU Cellic Ctec2,
respectively (Figure 6). The study confirmed that additional addition of enzymes increased
the quantity of hydrolysed glucose, whereas additional enzymes were not able to increase the
quantity of xylose. The findings advocate for increasing the enzyme loading from 10 FPU.
Another study found 20 FPU to be optimal to screen differences among wheat genotypes
(Lindedam et al., 2014) and 20 FPU has been the enzyme loading used in this study.
In summary, biorefining is a technique in which biomass is degraded into a range of products,
in this PhD project biorefining is considered in relation to degradation into sugar molecules
that can be fermented into bioethanol. The degradation of lignocellulosic biomass is dependent
on an effective pretreatment followed by enzymatic hydrolysis. The analytical method used in
the present thesis includes a hydrothermal pretreatment and 20 FPU Cellic Ctec2 for
enzymatic hydrolysis. The method to quantifying the degradation measures the sugars made
available by pretreatment and enzymatic hydrolysis. The sugars would be fermented to
bioethanol in a biorefinery (or other carbon containing products). The sugars have been used
as measure to evaluate the applicability of various miscanthus samples for biorefining, since
the conversion from sugar to bioethanol is dependent on the technology used in the
downstream processes and is not expected to be influenced by the origin of the biomass.

18
Figure 6. Hydrolysed glucose (blue) and xylose (green) from leaves (a) and stem (b) of M. x
giganteus (gig), M. sacchariflorus (sac) and M. sinensis (sin) at harvest number 1, 5 or 8
using 10 FPU (filled bars) or 30 FPU (hatched bars). The error bars indicate the standard
deviation on the analysis.
0
10
20
30
40
50
60H
yd
roly
sed
su
ga
r %
of
lea
fa
10 FPU Glucose 30 FPU Glucose
10 FPU Xylose 30 FPU Xylose
0
10
20
30
40
50
60
1 1 1 5 5 5 8 8 8
gig sac sin gig sac sin gig sac sin
Hy
dro
lyse
d s
ug
ar
% o
f st
em
b

19
2.3 Biogas
Biogas production is a common name for the anaerobic digestion of organic material into
methane and carbon dioxide (CO2). The quality of miscanthus for anaerobic digestion was
evaluated to explore the expectable methane yields. This was done through biogas batch tests,
enzymatic hydrolysis and 3,5 dinitrosalicylic acid assay (DNS). The biogas batch test uses 1-l
bottles to mimic a small biogas reactor. Inoculum from a biogas plant was mixed with the
biomass sample of interest and the bottle was flushed with N2 to remove O2 for obtaining
anaerobic conditions that allow growth of wanted microorganisms. The produced biogas (a
mixture of CO2 and methane) are measured frequently (12 times over 91 days) simultaneous
with gas chromatographic determination of methane to CO2 ratio. Normally, the production
starts with a lag phase in which the inoculum adapts to the new substrate (biomass), followed
by a rapid incline and at the end the production levels out due to depletion of substrate. The
method is further described in Manuscript 2 and Manuscript 3 and the kinetics of the methane
production are examined in Manuscript 2.
Parallel to the biogas batch test the DNS method was used. In the DNS are the biomass
hydrolysed by enzymes after which the sugar ends are coloured by 3,5 dinitrosalicylic acid. The
3,5 dinitrosalicylic acid reacts with reducing sugar end and is heated a yellow colour develops.
A spectrophotometer was used to measure the absorbance at 538.5nm and subsequently the
sugar concentration was calculated using a standard curve. For further details on the method,
consult Manuscript 2 and Manuscript 3.
The two methods, DNS and biogas batch test, differ in several ways. The biogas batch test uses
a mixture of enzymes and microorganisms present in the inoculum to degrade the biomass.
The exact content of the inoculum are normally unknown and develops continuously by
adaption to the present conditions and substrates. Moreover, the methane production are
measured during a long period often up to 100 days. Contrary, DNS uses known enzymes to
facilitate the degradation of biomass and the measured outcome is the reducing sugar ends
being available after hydrolysis of the sugar chains particularly found in cellulose and
hemicellulose. The reducing sugar ends are coloured by 3,5 dinitrosalicylic acid after 72h
enzymatic hydrolysis. Further details on the method are described in Manuscript 2 and
Manuscript 3. Similarities and differences between the two methods are elaborated in
Manuscript 3.
2.3.1 Mechanical pretreatment – extruder and roller-mill
The overall aim of methane production is to degrade biomass in an anaerobic environment to
produce methane and CO2, this degradation is done by microorganisms. The methane can be
burned in combined heat and power plants producing heat and power and to obtain the highest
possible methane yield, the microorganisms need sufficient access to the carbohydrate

20
structures and other nutrients in the biomass. Lignocellulosic biomass is recalcitrant and often
in the form of large biomass particles, by which only a small proportion is accessible to the
microorganisms. One way to increase this accessibility is to decrease the particle size (Lamsal
et al., 2010). Extrusion is efficient in increasing the methane yields of wheat straw, deep litter
(Hjorth et al., 2011; Wahid et al., 2015b), grass (Hjorth et al., 2011) and mixtures of rice-,
maize- and triticale silage (Menardo et al., 2015) as well as easing the mixing of the biomass
into liquid (Figure 7).
In this study, the effect of mechanical pretreatment upon the methane yield from miscanthus
is included. Extrusion of the biomass consumes energy, but a study found the amount of energy
gained by extrusion was higher than the amount of energy consumed (Hjorth et al., 2011).The
extruder setup used in Manuscript 2 and Manuscript 3 had two co-rotating twin screws and
had a kneading zone of 340 mm ending with a reverse kneading. These kneading elements
kneaded the miscanthus and at the reverse kneading-element the miscanthus were forced to
change direction (Figure 8) causing a build-up of miscanthus. As a result the miscanthus
became more compact and thereby increasing effect by increased friction (Chen et al., 2010).
Roller-milling is a physical pretreatment, normally used to grind grains to livestock feed, where
the counter-rotating drums crush the grains and the feed utilisation increases due to increased
surface area of the grain (Pettersson & Martinsson, 1994). The mechanically simpler setup of
a roller-mill is expected to be less energy consuming than extrusion and roller-milling was
tested as part of this work in the present experiment as an alternative to extrusion for methane
production. The two mechanical pretreatments was used after an initial shredding with a 4 cm
sieve with the purpose of reducing the particle size to <4cm and ease the handling of the
biomass within the extruder and roller-mill. A visual examination of the biomass (Figure 9)
after shredding and additional roller-milling or extrusion, respectively, reveals a physical
difference of the biomass and the effect on methane production is further described and
discussed in Manuscript 2.
In summary, biogas batch tests are useful to screen biomass, but have to be followed up by
tests in bigger reactors with continuous flow to test a biomass before implementation at full
scale. Mechanical pretreatments are useful to increase the surface area and thereby the
methane production. The hypothesis that extrusion is more severe than roller-milling is
evident from a visual examination (Figure 9) where extruded biomass is almost powdered
(Figure 9c) compared to roller-milled biomass having longer particles present (Figure 9b).
The discussion of the results are elaborated in Manuscript 2 and Section 3.1.

21
Figure 7. Not extruded biomass (left) and extruded biomass (right).
Figure 8. The kneading zone of the extruder. The arrows indicate the movement of the
biomass. The reverse kneading is on the right.

22
Figure 9. Miscanthus x giganteus harvested in April after shredding (a), roller-milling (b)
and extrusion (c).
(a)
(b)
(c)
23
2.4 Sampling
Correct sampling of heterogeneous materials as miscanthus crops with a height of 3 metres is
difficult. Gy (1998) found that the total sampling error could account for 10-100, sometimes
up to 1000, times the analytical error. Despite the fact that sampling can impose a large error
in the results it is often neglected in field experimental studies. Yield of miscanthus was 10-18
t fresh matter/ha in the present study while only 0.027 g was taken to chemical analysis, which
equals 0.00000016%-0.00000027% of the total biomass. The obtained from the chemical
analysis could form basis for an upscaling, calculation, extrapolation and prediction of the
number of hectares necessary to achieve enough biomass to be self-sufficient with energy in
Denmark. In that situation, a sampling error of even 10 times would be crucial. As an example,
1000 ha of miscanthus yielding 15 t dry matter/ha with a content of glucan at 10% would
produce 1,500 t glucan. If the measured glucan content instead is 10% higher, 1,650 t glucan
are obtained, and the difference of 150 t glucan equals theoretically to 85 t ethanol (based on
conversions as reported by Hayes and Hayes (2009) and Zhang (2014)).
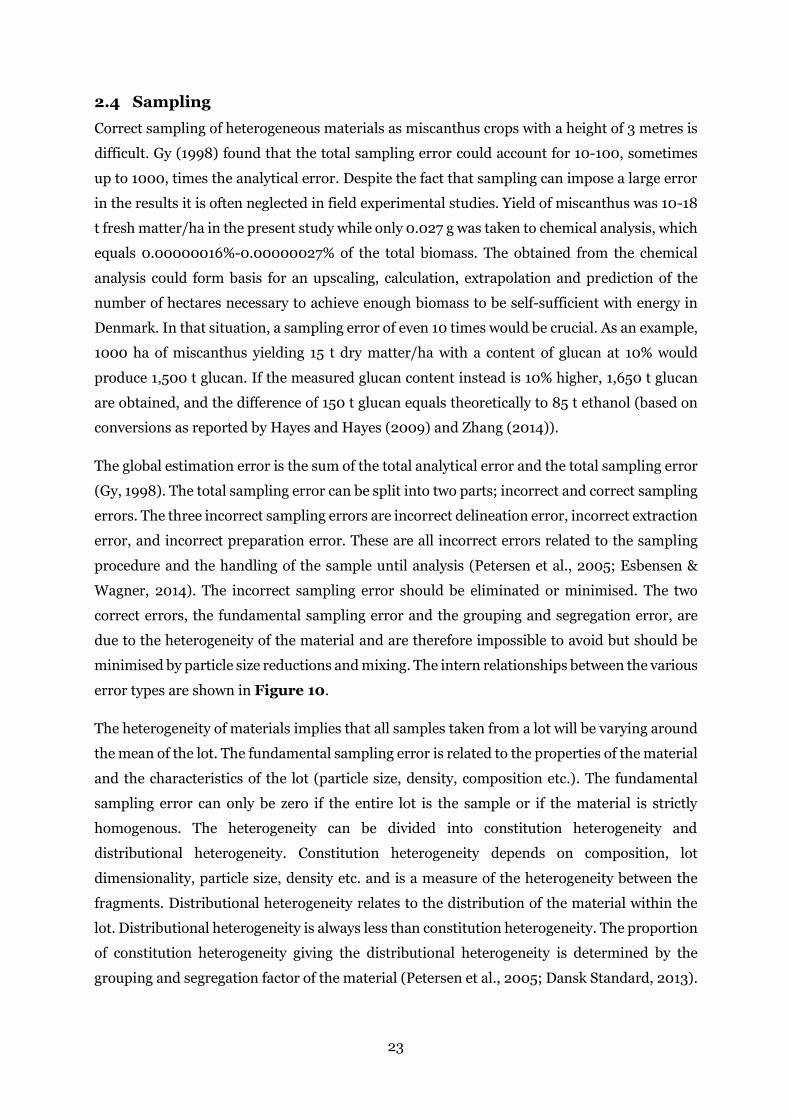
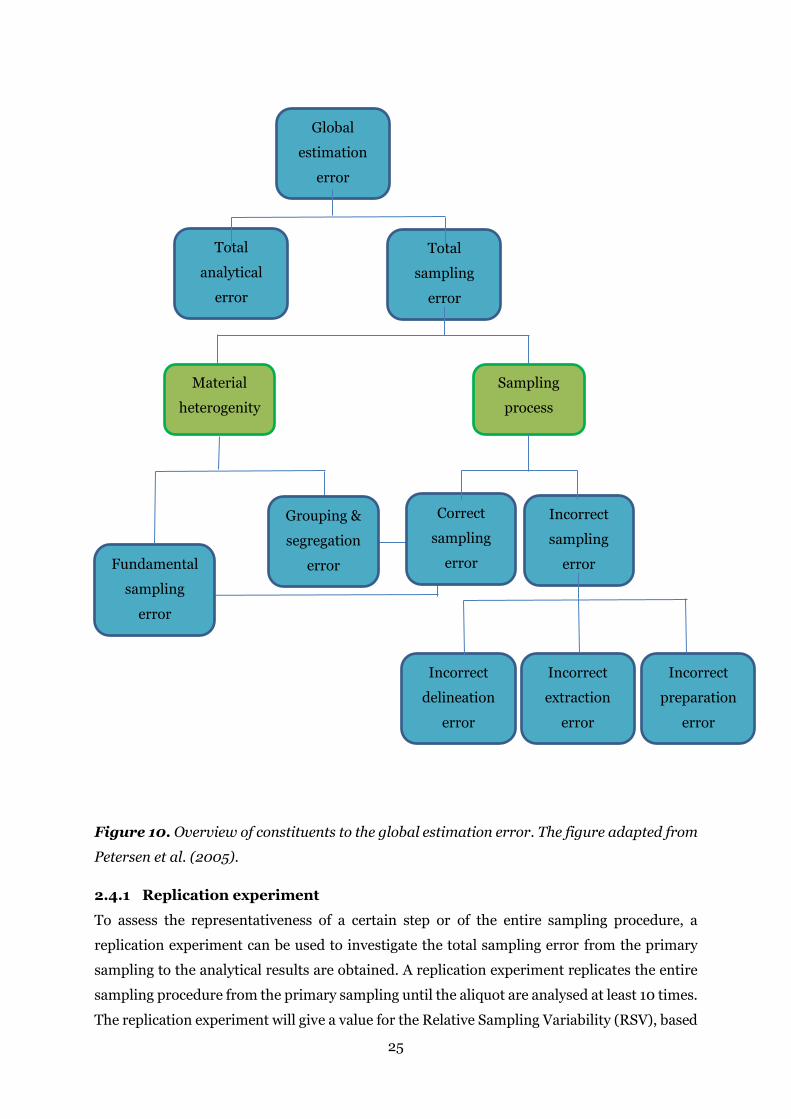
The global estimation error is the sum of the total analytical error and the total sampling error
(Gy, 1998). The total sampling error can be split into two parts; incorrect and correct sampling
errors. The three incorrect sampling errors are incorrect delineation error, incorrect extraction
error, and incorrect preparation error. These are all incorrect errors related to the sampling
procedure and the handling of the sample until analysis (Petersen et al., 2005; Esbensen &
Wagner, 2014). The incorrect sampling error should be eliminated or minimised. The two
correct errors, the fundamental sampling error and the grouping and segregation error, are
due to the heterogeneity of the material and are therefore impossible to avoid but should be
minimised by particle size reductions and mixing. The intern relationships between the various
error types are shown in Figure 10.
The heterogeneity of materials implies that all samples taken from a lot will be varying around
the mean of the lot. The fundamental sampling error is related to the properties of the material
and the characteristics of the lot (particle size, density, composition etc.). The fundamental
sampling error can only be zero if the entire lot is the sample or if the material is strictly
homogenous. The heterogeneity can be divided into constitution heterogeneity and
distributional heterogeneity. Constitution heterogeneity depends on composition, lot
dimensionality, particle size, density etc. and is a measure of the heterogeneity between the
fragments. Distributional heterogeneity relates to the distribution of the material within the
lot. Distributional heterogeneity is always less than constitution heterogeneity. The proportion
of constitution heterogeneity giving the distributional heterogeneity is determined by the
grouping and segregation factor of the material (Petersen et al., 2005; Dansk Standard, 2013).

24
In order to avoid the unwanted incorrect sampling errors and to minimise the correct sampling
errors, the governing principles and sampling unit operations have to be considered (Petersen
et al., 2005; Dansk Standard, 2013). It means that
1) The fundamental sampling principle must be obeyed, that is:
All potential increments must have same (but not zero) probability and practical possibility for
ending up as the physically extracted sample or increment (Dansk Standard, 2013). Moreover,
all material not being a potential increment must have zero probability of ending up in the
extracted increment or sample.
2) The primary sampling and the subsequent mass reduction are bias free and that the four
practical sampling unit operations in general are followed.
The four practical sampling unit operations are 1) Composite sampling, that is, collect several
increments added together forming a primary sample, 2) Comminution when necessary in
order to decrease the grouping and segregation error, 3) Mixing in order to homogenize prior
to all sampling, 4) Always perform mass reductions in a representative way. Going from a big
primary sample to the aliquot, the sampling unit operations are preferably done several times
(Petersen et al., 2005; Dansk Standard, 2013). One way to meet the sampling unit operations
is to use a riffle splitter, a piece of equipment able to perform mass reduction in a
representative way by composite sampling (Petersen et al., 2004).
25
Figure 10. Overview of constituents to the global estimation error. The figure adapted from
Petersen et al. (2005).
2.4.1 Replication experiment
To assess the representativeness of a certain step or of the entire sampling procedure, a
replication experiment can be used to investigate the total sampling error from the primary
sampling to the analytical results are obtained. A replication experiment replicates the entire
sampling procedure from the primary sampling until the aliquot are analysed at least 10 times.
The replication experiment will give a value for the Relative Sampling Variability (RSV), based
Grouping &
segregation
error Fundamental
sampling
error
Global
estimation
error
Total
analytical
error
Total
sampling
error
Sampling
process
Incorrect
sampling
error
Correct
sampling
error
Material
heterogenity
Incorrect
delineation
error
Incorrect
extraction
error
Incorrect
preparation
error

26
on the standard deviation (Std) of the ten replicated results and the grand average of all the
replications (xaverage), see equation 1. A threshold for the accepted level of the RSV must be set
before the replication experiment is done (Dansk Standard, 2013), in this study the
recommended threshold of 20% has been used as guideline.
𝑅𝑆𝑉% = (𝑆𝑡𝑑
𝑋𝑎𝑣𝑒𝑟𝑎𝑔𝑒) ∗ 100 Equation 1
This approach was used to evaluate the sampling procedure in the harvest time study. The
three genotypes examined in the harvest time study were used for the replication experiment.
Normally, each genotype is sampled in triplicate, one sample from each block, however, for the
replication experiment more replications are needed. Thus, the sampling did consist of four
samplings from each genotype-block combination, resulting in total 12 replications of the
sampling, covering both sampling and field (block) variation. The NIST samples of the 25
plates analysed throughout this PhD project were used to assess the analytical variation of the
high-throughput pretreatment and hydrolysis setup.
2.4.1.1 Relative sampling variation of the sampling procedure
The RSV of the replication experiment varied from 6 to 36% for glucan and 6 to 38% for xylan
among the three genotypes for leaf and stem fraction separately. The highest RSV was on M. x
giganteus stems, for which only 9 samples were analysed, since three samples were lost
between sampling and analysis. The RSV of M. x giganteus was in all cases above 24% and the
xylan measurements of M. sacchariflorus leaves exceed 20% (Table 2). The lower RSV of M.
sinensis compared to M. x giganteus was expected as the composite sample of M. sinensis
consisted of 30 tillers, whereas only 15 tillers make up the composite sample of M. x giganteus.
However, that argumentation would also cause M. sacchariflorus to have high RSV, which is
only the case for the xylan content in the leaves.
RSV was also calculated on the 25 NIST samples, (Table 3). Generally, the results on the NIST
samples demonstrate quite big variations. The amount of, glucan and xylan enzymatically
hydrolysed from the biomass was in the 12-34% and 13-23%, respectively. The National
Institute of Standards reports the glucan content of the NIST standard to be 33.6% and xylan
content to be 19.3% (NIST, 2016).
In summary, the sampling procedure can have a large impact on the representativeness of the
obtained results. The present study found large variation was present within the entire
sampling-to-result process but also in the analytical step itself. The impact of the sampling
procedure is discussed in Section 0.

27
Table 2. Relative sampling variation (RSV) of xylan and glucan of leaf and stem fractions
of three genotypes (M. x giganteus, M. sacchariflorus and M. sinensis). n indicates the
number of samples analysed.
RSV (%)
Fraction n Glucan Xylan
M. x giganteus Leaf 12 24.9 26.8
Stem 9 35.8 37.4
M. sacchariflorus Leaf 12 11.0 21.9
Stem 12 9.3 10.0
M. sinensis Leaf 12 14.5 18.6
Stem 12 6.4 6.1
Table 3. Mean, minimum and maximum of glucan and xylan percent calculated per plate
and the relative sampling variation (RSV) is calculated over 25 plates.
Glucan Xylan
No. of plates 25 25
Mean (% of biomass) 24.0 18.1
Min (% of biomass) 12.4 12.7
Max (% of biomass) 34.4 23.3
RSV (%) 18.9 13.4

28
2.5 Ensiling
Ensiling of biomass has proven a useful way to conserve green biomass such as forages to
preserve feed to livestock during winter. The ensiling process is anaerobic and utilises the
moisture and sugar present in the biomass. Anaerobic conditions promote growth of lactic acid
bacteria, which ferments water-soluble carbohydrates to lactic acid with a decreased pH as the
result (McDonald et al., 2002). Lowering the pH inhibits the growth of unwanted
enterobacteria and clostridia. The clostridia appear in the biomass because of contamination
with soil and are able to degrade glucose or lactic acid to butyric acid and CO2 or degrade amino
acids to acids and ammonia. The enterobacteria are producing acetic acid and CO2. Produced
gasses will be lost when the silage pile is opened and causing an energy loss (McDonald et al.,
2002). Dry matter losses up to 51% equal to 18% energy loss have been experienced for
clostridia fermentation (McDonald et al., 1991b). In situations where the content of water
soluble carbohydrates is too low to ensure fast growth of lactic acid bacteria, the decrease of
pH will be to slow to prevent the growth of unwanted fungi and bacteria and cause unwanted
microbial fermentation (McDonald et al., 2002).
2.5.1 Ensiling experiment
An ensiling experiment using vacuum bags was set up to investigate if ensiling could be used
as a method to store miscanthus for later use and whether the ensiling process served as a
pretreatment and increased the sugar yields from the three biomass types.
Miscanthus (M. x giganteus, M. sacchariflorus and M. sinensis) were ensiled in winter 2012-
2013. All crops were manually harvested in September and in January, and were cut to 1-5 cm
pieces using a Laborhacksler (Baumann Saatzuchtbedarf, Germany). The biomass was
thoroughly mixed and a sample of approximately 1 kg was vacuum packed. The effect of
enzymes was studied by adding two types of enzymes separately in the winter harvest. The first
enzyme (NS22016) is a cellulase with xylanase activity and the second enzyme (NS22086) is a
pectinase with hemicellulase and cellulase activity. Both enzymes were supplied by Novozymes
A/S. The enzymes were added by mixing 500 mg enzyme per kg protein in fresh matter into
50 ml water, which was sprayed into the bag while shaking the bag with the biomass. The
ensiling were done using vacuum bags as described by Dehghani et al. (2012). The bags were
stored for 90 days at room temperature after which the ensiling process was stopped by
freezing (-18°C). Weight of biomass and bag in total was measured before and after the 90 days
of ensiling.
2.5.2 Water extraction of compounds produced by ensiling
A water extraction was carried out as described by Nielsen et al. (2007) to investigate the
ensiling process. Silage (100g) and demineralised water (1000g) were blended in a Waring
blender (Waring 24CB10; Waring Commercial, New Hartford, CT) two times of 30 sec. A

29
subsample was subtracted into a 100 ml centrifugation tube and the pH was measured using a
pH-meter. Subsequently, the tube was centrifuged (2300×g at 10°C for 20 min) using RPM
3200 (Hettich Rotixa 50RS) and 8 ml extract was mixed with 2 ml meta-phosphoric acid
(MPA) another sample without MPA was extracted and both were frozen (-18°C) until the
samples were analysed. Ethanol, propanol, 2-butanol, ethyl acetate and propyl acetate content
was determined in samples without MPA using headspace GC-MS as described by Kristensen
et al. (2010). Ammonia N was measured using a Cobas Mira auto-analyser (Triolab A/S,
Brøndby, Denmark) with a kit based on glutamate dehydrogenase (AM 1015; Randox
Laboratories Ltd, Crumlin, United Kingdom). Glucose and L-lactate were determined in
samples with MPA using an YSI 7100 MBS Biochemistry analyser (YSI Incorporated Yellow
springs, OH). The volatile fatty acids (VFA) were analysed by gas chromatography as
described by Kristensen et al. (1996).
Additionally, the dry matter content of the biomass was measured at 40°C for 72h when
opening the bags. Parallel to fresh ensiled samples the dried samples were also extracted to
determine losses during the drying process.
2.5.3 High-throughput pretreatments and hydrolysis method
The dried samples were analysed in the high-throughput pretreatment and hydrolysis setup.
The quantification of the hydrolysed sugars using HPLC was, however, not easy and created
some problems. The problems were probably due to the VFA sticking to the HPLC column,
which means that there was an overlap in VFA peaks between samples causing interruption of
the analysis of following samples. The effect of the ensiling process as a pretreatment to
biorefining is thus still unknown.
2.5.4 Findings from the ensiling procedure
Acids were produced in all miscanthus genotypes and mainly in the biomass harvested in
September. The content of butyric acid was high in M. sinensis and M. x giganteus while M.
sacchariflorus had a high lactic acid content. In well-fermented silage, the lactic acid content
is expected to be high, to ensure a low pH limiting growth of unwanted microorganisms and
degradation of the biomass. A low pH inhibits the growth of clostridia reducing the content of
butyric acid, while a high butyric acid content in silage indicates comprehensive fermentation
by clostridia. A high content of butyric acid indicates large production of CO2 and ammonia as
well. To have growth of clostridia (producing butyric acids) the moisture content needs to be
relatively high, whereas lactic acid bacteria (producing lactic acids) are tolerant to lower
moisture contents. The optimum pH and moisture content interact, additionally, the
temperature affects the development of fermenting microorganisms (McDonald et al., 1991a).
The lactic acid bacteria need water-soluble sugar as substrate for their fermentation. Autumn
harvested miscanthus had the lowest dry matter contents (Table 4) and must be expected to

30
contain some water soluble sugar as the biomass was green and thus photosynthetic active at
harvest and explained why only autumn harvested miscanthus produced acids. The standard
deviations of the acids are high for M. sacchariflorus harvested in autumn and of butyric acid
from M. x giganteus harvested in January (Figure 11). From the data, it is evident that these
variations were related to field variation, as two of the three replications had high lactic acid
and low butyric acid content, while it was oppositely for the third replication (data not shown).
For all January harvests an additional factor was added; addition of enzymes to study if it
would improve the ensiling process. The enzymes were added to degrade cellulose to
monomeric sugars but did not have any effect. Even though no effect of the enzymes was found
(data not shown) these can be considered as triplication of the ensiling process, since it used
the same biomass. This triplication of the ensiling process of the January harvest supports that
the field variation caused the variation between location in the field (blocks) and not errors
during the ensiling process. The same is probably the case for the M. x giganteus harvested in
autumn, but cannot be determined based on the available data.
In summary, ensiling is a promising method to store fresh biomass and the method is well
known for forages. The ensiling of miscanthus was tested using a vacuum bag experiment,
where two harvest times was tested and for the driest harvest, the effect of adding cellulase and
pectinase was examined. The ensiling was, however, unsuccessful probably due to low
moisture and water-soluble carbohydrate contents. The results are discussed in Section 3.3.
Table 4. Dry matter (DM) content in biomass before and after ensiling and pH in extract
after ensiling in three miscanthus genotypes.
Genotype Month DM% at harvest DM% after ensiling pH in extract
M. x giganteus September 31.3 29.7 4.86
January 43.8 43.5 4.37
M. sacchariflorus September 34.6 34.5 4.27
January 57.2 58.4 4.01
M. sinensis September 30.0 29.4 4.78
January 71.6 71.1 4.96

31
Figure 11. Ethanol, lactic acid, acetic acid and butyric acid from three Miscanthus genotypes
(M. giganteus (gig), M. sacchariflorus (sac), M. sinensis (sin)) harvested either in September
or in January. Standard bars indicate the standard deviation.
-20
0
20
40
60
80
100
120
September January September January September January
Gig Sac Sin
Miscanthus
g/k
g D
MEthanol Lactic acid Acetic acid Butyric acid

32
2.6 Spectral analysis
Visible near infrared (Vis-NIR) and mid-infrared (MIR) reflectance spectroscopy has been
used in agriculture research for years, as a robust method providing quantitative and
qualitative information (Hayes, 2012; Kandel et al., 2013). NIR and MIR spectroscopy has
proven to be accurate at a low cost and doing non-destructive measurements with limited
sample preparation. NIR methods have also been developed to monitor biogas processes by
online applications (Holm-Nielsen et al., 2008), which opens up for utilising the method online
in other bioenergy processes. The application of NIR spectroscopy on miscanthus to predict
the overall content of sugars, lignin, ash and extractives has earlier been studied (Hayes, 2012).
The aim of this study is to predict the content of sugars made accessible by the hydrothermal
pretreatment and enzymatic hydrolysis with NIR spectroscopy.
Light has different intensities, frequencies and wavelength. NIR and infrared (IR)
spectroscopy can be used to measure all organic and many inorganic constituents of biomass,
based on the C-H, N-H and O-H bonds. The vibration of molecules depends on the structure
of the molecule, and the vibration can be bending and stretching in plane and out of the plane.
When a sample are radiated, the molecules will absorb the light if the energy of the radiation
is equal to the energy of the vibration of the molecules (Osborne, 2000).
2.6.1 NIR, mid-IR and chemometrics
IR and NIR spectroscopy are based on the measurement of absorbance (A) or transmittance
(T) as a function of wavenumber (�̅�). A(�̅�) and T(�̅�) are dependent on the frequency-dependent
absorptivity coefficient (a), the path length (b) and the concentration (c) of an absorbing
analyte, as described by the Bouguer-Beer-Lambert law (Griffiths, 2002).
𝐴(�̅�) = −𝑙𝑜𝑔10𝑇(�̅�) = 𝑎(�̅�) ∗ 𝑏 ∗ 𝑐 Equation 2
This means that the absorbance can be related to the concentrations of some chemical
constituents in the biomass. MIR spectra has clear peaks and these peaks are repeated as first,
second and third overtones in the NIR region and as combination bands.
Spectra from NIR and MIR spectroscopy can be used to predict measured variables (chemical
constituents, e.g. from the high-throughput pretreatment and enzymatic hydrolysis method or
biogas batch test). Chemometrics is used to build models on the whole spectrum or just on
parts of the spectrum obtained to predict the variables of interest. The individual variables in
the spectra are generally strongly correlated. Chemometrics, is used to extract information on
the wavelengths providing information relevant to predict and/or determine quantitative and
qualitative properties of a certain compound in the sample. An exploratory method are used to
identify the areas in the spectra describing most variation of the samples, these areas are
known as principal components (PC) and the method is known as principal components

33
analysis (PCA). PCA can be used for compression and classification of the data and reduce
dimensionalities of the data by identifying the principal components. The first PC will always
cover most variation and information. The structure of PCA are described by Hotelling (1933)
and Wold et al. (1987).
The data are normally preprocessed prior to analysis to avoid misinterpretation due to
scattering and unintended external effects. Mean-centring is a commonly used preprocessing,
there an overall reference spectrum is calculated by subtracting the average of all x-data from
each single x-data. If this is not done, the first PC will describe the mean instead. Additional
preprocesses used in the thesis are multiplicative scatter correction and Savitzky-Golay
polynomial derivative as described by Rinnan et al. (2009).
Further, chemometrics is used to model and predict properties of samples. The PCA uses only
the spectra, but the spectra can be combined with measured chemical or physical response
variables (y-data). Partial least squares regression (PLSR) is a commonly used multivariate
regression method. The method decomposes the spectral data guided by the variation in y-data
(Gislum et al., 2009) and obtains factors similar to the PCs of PCA. Scores and loadings are
obtained, similar to PCA, but as both x and y data are transformed, also scores and loading are
produced for x and y data.
To evaluate the model and to avoid over or under fitting, calibration and validation are
important concepts. Performance of models can be evaluated by cross validation, test-set
validation or both. The models were evaluated using the coefficient of determination(R2), the
root mean error of calibration (RMSEC), cross validation (RMSECV) and prediction (RMSEP),
respectively, the standard error of prediction (SEP) and the bias. The latter three are related as
follows (Esbensen, 2002):
𝑅𝑀𝑆𝐸𝑃2 ≈ 𝑆𝐸𝑃2 + 𝑏𝑖𝑎𝑠2 Equation 3
2.6.2 Instrumentation
The samples were subdivided using a riffle splitter (see Section 2.4) and ground using a cyclone
mill (FOSS Cyclotec ™ 1093, Denmark) with a 0.8 mm (MIR and Vis-NIR) or 1 mm sieve (NIR)
prior to the NIR and MIR measurements. Data management and chemometrics was done in
MATLAB using the PLS toolbox (Eigenvector, Washington, United States of America).
MIR
The samples were measured using a Fourier transform IR MB3000 spectrometer from ABB
(Q-interline, Roskilde, Denmark) with attenuated total reflectance accessory at a 16 cm-1
resolution in absorbance mode. The equipment measured each sample 64 times and the

34
provided outcome was an average of these scans. The spectrum is measured in the range from
2,500-25,000 nm.
Vis-NIR
The samples were measured in duplicates using a FOSS NIRS DS2500. A cup with a diameter
of 7 cm was used and the biomass was poured into the cup to avoid subsequent disturbance,
layer formation or other unintended biases. The instrument has a spectral range of 400-2500
nm and measures every 0.5 nm, giving total 4200 measurement. Measurements at seven
points in the sample are made and averaged.
NIR
Spectra were also obtained from a QFA-Flex 400 FT-NIR instrument (Q-interline, Roskilde,
Denmark) with a rotating vial device. The vial (a 20ml glass vial) rotates (3 rounds per minute)
while 64 sub-scans are measured through a window at 510 mm2. Subsequently, the 64 scans
are averaged. The spectrum is measured at every 2 nm in the range from 1100 to 2498 nm. The
spectra were reported as log (1/R).
2.6.3 Predicting the methane potentials by NIR
Fifty-three samples from above and below ground biomass of beet and Jerusalem artichoke,
above ground biomass of hemp, maize, M. sinensis and M. x giganteus (the latter two split in
leaf and stem), and biomass from 1-3 harvest during autumn were included in a study
performed to predict methane yields by NIR spectroscopy. Methane yield was measured on
miscanthus samples in 2013, whereas the methane yield of the other samples was measured in
2008. Spectra were obtained in the 400-2500 nm region by Vis-NIR instrument and cross
validation was done with venetian blinds.
The visual part of the spectra was able to group the biomass types relatively well (
Figure 12. PCA of Jerusalem artichoke, beets, M. x giganteus (gig), hemp, maize and M.
sinensis (sin).
). A PLSR model was built over the range from 1100-2500 nm using multiplicative scatter
correction preprocessing and was able to predict methane yields with a R2 of 0.66 for the cross
validation and a RMSECV of 62.8. Using iPLSR (PLSR applied to intervals of spectra) a R2 for
the cross validation and a RMSECV of 0.71 and 53.0, respectively, were obtained indicating the
areas in the spectra of importance to be 1500-1524 nm, 1800-1824 nm and 2375-2399 nm.
These intervals are related to proteins, cellulose and lipids (Workman & Weyer, 2007), all
energy sources to methane-producing microorganisms. A R2 and a RMSECV of 0.53 and 21.6,
respectively, were obtained in a study on methane yields of reed canary grass (Kandel et al.,

35
2013). The study by Kandel et al. (2013) included only one crop, whereby the variation in the
y-data is decreasing challenging the modelling. The inclusion of six crops and ten crop:fraction
combinations in the present study provided larger variations in y-data, and the venetian blinds
cross validation included various crop:fraction combinations in both calibration and validation
dataset. This will improve the performance of the model. The model performance depends on
the developed model. The present model is predicting experimental results from a method
known to be difficult to get precise values from, moreover were the samples analysed in two
runs with different inoculum, a fact that is known to cause even further variation in the results.
The difference between NIR and the biogas batch test can make it difficult to predict methane
yield, as NIR detects signals from chemical constituents, whereas the biogas batch test
measures the methane actually produced from the structures available to the microorganisms.
In real life situations, not all structures will be available due to the physiology of the plants and
the complex and tight structures such as lignin and crystalline cellulose.
In summary, NIR and MIR spectroscopy in combination with chemometrics has been used to
develop PLSR models to predict methane yields. A study was also conducted aiming to predict
the enzymatically accessible glucose and xylose (data not shown). Predictions are challenging
because only proportions of the organic substances present in the biomass are degraded to
methane or hydrolysed to glucose or xylose. Moreover, the variation on the analytical methods
is associated with variation (see Section 2.4.1.1) and a prediction with an accuracy better than
the accuracy of the data the model is based on is not possible.
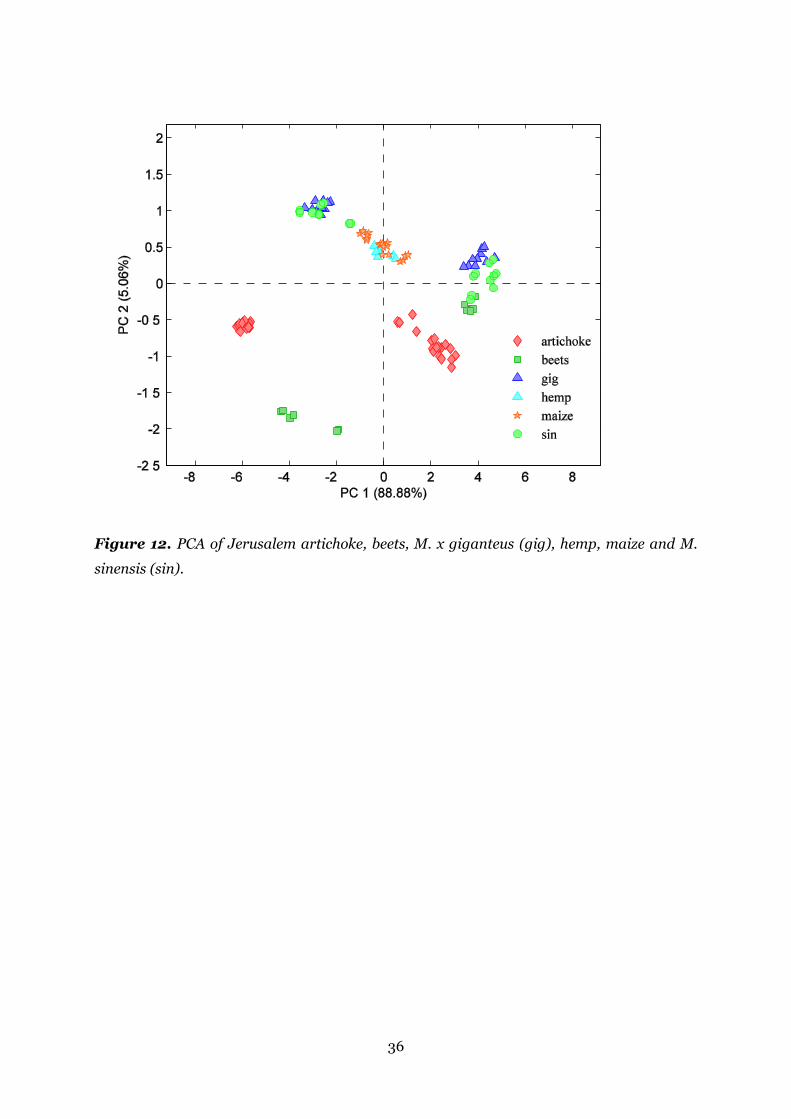
36
Figure 12. PCA of Jerusalem artichoke, beets, M. x giganteus (gig), hemp, maize and M.
sinensis (sin).

37
3 General discussion
Miscanthus was studied with various aims; results on harvest time and implication on
fermentable sugar and methane yield are reported in Manuscript 1 and Manuscript 2.
Moreover are similarities and differences between analytical methods reported in Manuscript
3. Differences between genotypes were included in Manuscript 1, and effect of mechanical
pretreatment prior to methane production was studied and discussed in Manuscript 2. Using
NIR to predict methane production and yield of fermentable sugars is challenging because not
all lignocellulose is converted into methane or fermentable sugars. All these topics are
interesting and highly relevant to discuss, however I have focused my discussion on the
following three topics:
- Comparison of miscanthus convertibility into biogas and bioethanol
- The sampling procedure in the harvest time study
- The possibility for ensiling miscanthus to facilitate storage
3.1 Conversion of miscanthus into energy carriers
The degradability of biomass depends on harvest time and the conversion process in question,
and both important when choosing the most suitable energy carrier. Comparing bioethanol
and methane, the two energy carriers considered in this PhD, are, however, not straight
forward because the first is a storable liquid fuel and the second is a storable gaseous fuel.
The results in Manuscript 1 and Manuscript 2 emphasise that the degradability of biomass
depends on the harvest time, and is, in terms of energy carrier yield per tonne of biomass, most
sensitive to harvest time in the case of methane production. From late August until November,
the methane yield of M. x giganteus and M. sinensis did only decrease slightly (Wahid et al.,
2015a), but delaying harvest from September to December decreased the methane yields
significantly (Manuscript 2 and Table 5). Moreover are the dry matter yield decreased from
October and onwards (Manuscript 1) and affects both methane and bioethanol yields.
Estimation of the obtained energy output from miscanthus in autumn (late August to late
September) was similar whether converted to ethanol or methane (Table 5). The energy in
ethanol yield from M. x giganteus decreased when postponing the harvest. When extruded,
winter harvested M. x giganteus achieved methane yields similar to green miscanthus (autumn
harvest) without extrusion. The methane yield from M. x giganteus was competitive with
ethanol yields of M. sacchariflorus. The energy yields per kg dry matter in ethanol produced
from miscanthus was slightly lower than the estimated yield from a wheat cultivar (Lindedam
et al., 2012), the reported values in Table 5 are based on the cultivar included in the before
mentioned study with most glucan and xylan, other cultivars are thus containing less glucan

38
and xylan. Moreover, the dry matter yield of wheat is not reported in the study by Lindedam et
al. (2012) but must be expected to be lower in wheat compared to miscanthus.
The values estimated in Table 5 are based on a conversion of glucose and xylose to ethanol at
100%. However, this is only possible to obtain theoretically, but the main bottleneck will be
the pretreatment. A 90-95% conversion of hydrolysed sugars from cellulose to bioethanol is
reported by Hayes and Hayes (2009). Therefore, the final energy yield is expected to be slightly
lower than the values reported in Table 5, but similarly lower for all biomass types. Extrusion
of green miscanthus achieved energy yields higher than all the included biomass types in Table
5. Comparing methane yields of miscanthus and maize silage showed that extruded autumn
harvested miscanthus was competitive (Table 5), but the energy consumption of the extruder
is not deducted, which must be taken into account. Studies has however shown the energy gain
by extruding straw is larger than the energy used for extrusion (Hjorth et al., 2011). Miscanthus
yield reduction of 42% by postponing the harvest from autumn to spring on fertile soils in
Denmark has been recorded (Larsen et al., 2014). Adding the dry matter yield reduction to the
energy yield reduction caused by postponing the harvest, highlights the importance of wise
decisions determining when to harvest and how to utilise the miscanthus. Autumn harvest will
generally produce most energy compared to winter or spring harvest but will demand direct
delivery to the processing plant or stable storage.
Methane and ethanol are two different energy carriers, which differ not only in conversion
technique but also in application. Biogas plants are commercialised and located in many
regions of the world. On the other hand, biorefining plants using lignocellulosic crops as
feedstocks are less widespread. The lack of biorefineries to consume miscanthus is
disadvantageous for the implementation of miscanthus as a crop for biorefining. Methane is in
Denmark used for combined heat and power, whereas ethanol is used as fuel that can
substitute fossil fuels, e.g. for transportation. As a liquid and storable fuel, ethanol is
advantageous and provides a resource that is not directly available from hydro, solar or wind
power.
Table 5. Ethanol, methane and energy yields from miscanthus harvested in autumn or
winter. Wheat and maize silage are included for reference. Standard deviations are given in
brackets.
Genotype Harvest time Ethanolab
kg/t
dry matter
Methanec
kg/t
dry matter
Energyd
MJ/t
dry matter
M. x giganteus Autumn 179 (12.0) 5.33 (0.36)

39
M. sacchariflorus Autumn 202 (7.0) 6.01 (0.21)
M. sinensis Autumn 177 (10.7) 5.27 (0.32)
M. x giganteus Winter 127 (22.7) 3.79 (0.67)
M. sacchariflorus Winter 167 (19.3) 4.95 (0.57)
M. sinensis Winter 175 (2.0) 5.22 (0.06)
M x giganteus Autumn 106 (6.2) 5.90 (0.34)
M x giganteus extruded Autumn 175 (8.6) 9.72 (0.48)
M x giganteus Winter 84 (4.0) 4.65 (0.22)
M x giganteus extruded Winter 106 (4.0) 5.91 (0.22)
Wheate Autumn 215 6.39
Maize silagef Autumn 142 7.87
a Estimated based on theoretical yield of 51.11g ethanol per 100g glucose or xylose and that
100% of the theoretical yield is obtained in the fermentation and distillation.
b Manuscript 1
c Manuscript 2
d Calculated on the enthalpy of ethanol and biogas
e Lindedam et al. (2012)
f Moset et al. (2015)
3.2 Sampling procedure
The relative sampling variation was analysed to enlighten the importance of representative
sampling when dealing with heterogeneous biomass and to assess the sampling procedure in
the experiment. Generally, a RSV below 20% is wanted (Dansk Standard, 2013). Individually,
the level of RSV can be decided dependent on the sampling purpose, preferably before the
replication experiment is conducted.
It was not expected, that the high-throughput pretreatment and enzymatic hydrolysis method
can access all glucan and xylan of the biomass. The sugar yields of the NIST samples were high,
however, in some cases the high-throughput pretreatment and hydrolysis setup seemed to
access more glucan and xylan than supposed to be present in the sample. The RSV of the NIST
samples was large (19 and 13% for glucan and xylan, respectively) although the content present
in the samples was supposed to be similar at all runs. This suggests that a relatively large
proportion of the RSV on the sampling and analysis procedure is due to variation within the
analytical process and not only due to the primary sampling process and the subsequent
subsampling.
In conclusion, the sampling variation was high, especially in M. x giganteus. For M.
sacchariflorus and M. sinensis the RSV of the sampling procedure was in most cases lower

40
than that of the NIST samples. It seems that the dispensing of the samples should be further
investigated and improved prior to further attempts towards an improved primary sampling.
Biomass was ground in 20 ml vials with five steel balls and triplicates were dispensed and
analysed for all miscanthus samples. The dispensing happened right after two times 30 sec of
grinding by shaking and a subsequent hard shake to mix the sample. It can be assumed that
the dispensed miscanthus samples were not biased to same extent as the dispensed NIST
samples. The NIST sample was used for several plates, which may have introduced a bias as
the finest particles may have been dispensed out of the hole in the vial first, whereas the coarser
particles may be dispensed into later plates.
The aim of sampling is to cover the variation of the population from which the samples are
extracted and that this variation is the only variation covered in the results, which is the
fundamental sampling principle. However, based on the present replication study, the
conclusion will be that the sampling process and inherent variation were studied, and further
improvements could be done to decrease the variation. The correlation obtained, when using
the balance part of the stem as a representative of the entire stem, was low, however, using any
other part of the stem did not improve the correlation to the sugar availability of the entire
stem. The sugar content in the stem is known to vary from top to bottom and between nodes
and internodes (Hayes, 2013), by which the use of a sub-part of the stem seems a good option
at least until the analytical variation has been decreased.
The primary biomass sampling is often neglected in favour of increasing the precision of the
analytical measurements. However, the analytical variation is normally low relatively to the
sampling error (Gy, 1998) and constitutes only a minor proportion of the total variation
(Figure 10). Results obtained by scientist (and others) are used to estimate, extrapolate and
predict developments and the robustness of the results is important, or alternatively
knowledge about the robustness. If the sampling procedure has been analysed, the sampling
variation can be described, but if not, the sampling variation is simply unknown. For
comparison two examples for determining dry matter content in a field are described. One
approach could be to harvest only one stem from the field and the dry matter content is then
measured with ten replicates. The results will give a robust knowledge about the single stem
presumably with a small variation; however, it is not necessarily a good estimate of the dry
matter content in the field. A different approach would be to harvest ten (or more) stems
throughout the field and measure the dry matter content of those with one measurement of
each. The variation would increase, but the mean would be a better estimate of the dry matter
content of the entire field. In addition, the knowledge on this variation would provide an
important, comprehensive and more exact knowledge about the dry matter content in the field.
This example could also be on mineral content in wood, yields in fields, lignin in biomass, etc.
Therefore, when extrapolating it is important to recognise the variation of the results to know

41
the predictions that the results can support. Neglecting the sampling procedure or not
considering the variation introduced by the sampling does not remove the variation, but make
the variation unknown and uncontrolled.
3.3 Ensiling miscanthus for storage
The ensiling of miscanthus did not progress as expected. However, the experiment provided
useful knowledge for future storage experiments.
Only two samples developed the expected lactic acid and there was no effect of adding cellulase
or pectinase. A study by Whittaker et al. (2016) found that M. x giganteus harvested in
September (dry matter content 36%) could only be successfully ensiled using either hetero- or
homo-fermentative additives. When ensiled without additives the ensiled biomass had an
unwanted microbial activity and a dry matter loss of 4% and low lactic acid production, and
addition of lactic acid bacteria improved the ensiling process and decreased the dry matter loss
(Whittaker et al., 2016). An experiment with airtight storage of M. x giganteus harvested in
December (dry matter content 53-54%) incurred dry matter losses of 1-5% (Kristensen, 2001),
whether an fermentation producing lactic acids occurred was not studied. Generally, the plants
used in the present study had too low moisture and water-soluble sugar content present in the
above ground biomass to ensure an effective ensiling. An earlier harvest of greener biomass
would probably have provided biomass with more moisture and higher water-soluble sugar
content. The reason that the minerals and carbohydrates vanish from the above ground
biomass are that the rhizomes store the carbohydrates during winter to ensure next year’s
biomass yield (Kiesel & Lewandowski, 2016). By harvesting early the subsequent year’s growth
can be compromised and the harvest must thus be postponed till after sufficient carbohydrates
and nutrients are stored in the rhizomes to secure the following year’s growth, probably till
after September under German climatic conditions. Postponing the harvest reduces sugar and
moisture content in the biomass and in order to secure successful ensiling of the biomass
findings by Whittaker et al. (2016) suggests addition of lactic acid bacteria. The study by
Kristensen (2001) and the present study indicate that anaerobic storage without additives
might be possible without successful fermentation as expected by ensiling but still providing a
storage with low dry matter losses. It is still unknown how ensiling or anaerobic storage affects
the conversion of sugars to bioethanol due to problems in analysing the biodegradability of the
ensiled biomass samples. The effect of hydrothermal pretreatment and efficiency of enzymatic
hydrolysis of grasses (festulolium and Italian ryegrass) are improved by ensiling (Ambye-
Jensen et al., 2014). Harvest time did not affect the sugar yields (Manuscript 1), and if no
substantial losses of biomass occur due to unwanted microbial fermentation, it suggests that
ensiling miscanthus can be an option to store the relatively wet biomass. Dry matter losses of
1-5% by anaerobic storage (Kristensen, 2001; Whittaker et al., 2016) are small relative to
loosing 42% dry matter in the field when postponing the harvest and anaerobic storage seems

42
a promising storage method if no significant reduction in the energy yields is caused by the
anaerobic ensiling. The anaerobic storage will facilitate storage of miscanthus harvested at the
time when the yield is highest and after the plant has stored sufficient amounts of
carbohydrates and nutrients in the rhizomes. Efficient storage will enable delivery of
miscanthus to biorefining plants beyond the normal harvest season.
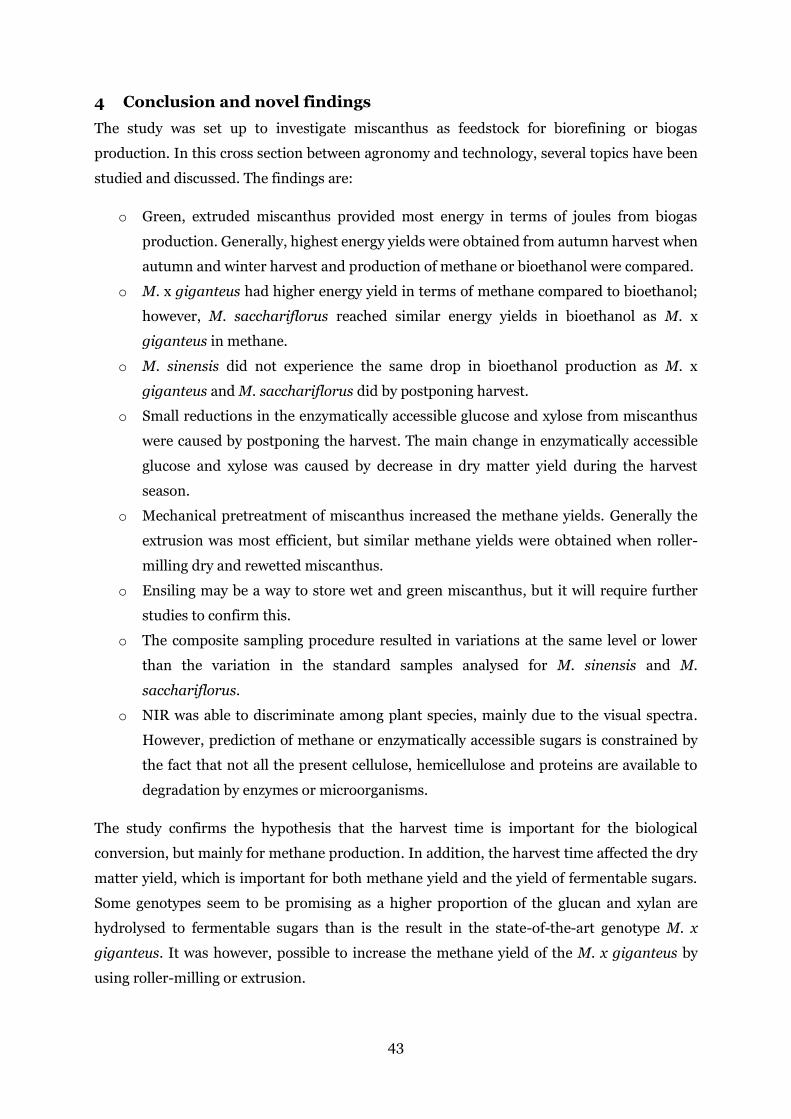
43
4 Conclusion and novel findings
The study was set up to investigate miscanthus as feedstock for biorefining or biogas
production. In this cross section between agronomy and technology, several topics have been
studied and discussed. The findings are:
o Green, extruded miscanthus provided most energy in terms of joules from biogas
production. Generally, highest energy yields were obtained from autumn harvest when
autumn and winter harvest and production of methane or bioethanol were compared.
o M. x giganteus had higher energy yield in terms of methane compared to bioethanol;
however, M. sacchariflorus reached similar energy yields in bioethanol as M. x
giganteus in methane.
o M. sinensis did not experience the same drop in bioethanol production as M. x
giganteus and M. sacchariflorus did by postponing harvest.
o Small reductions in the enzymatically accessible glucose and xylose from miscanthus
were caused by postponing the harvest. The main change in enzymatically accessible
glucose and xylose was caused by decrease in dry matter yield during the harvest
season.
o Mechanical pretreatment of miscanthus increased the methane yields. Generally the
extrusion was most efficient, but similar methane yields were obtained when roller-
milling dry and rewetted miscanthus.
o Ensiling may be a way to store wet and green miscanthus, but it will require further
studies to confirm this.
o The composite sampling procedure resulted in variations at the same level or lower
than the variation in the standard samples analysed for M. sinensis and M.
sacchariflorus.
o NIR was able to discriminate among plant species, mainly due to the visual spectra.
However, prediction of methane or enzymatically accessible sugars is constrained by
the fact that not all the present cellulose, hemicellulose and proteins are available to
degradation by enzymes or microorganisms.
The study confirms the hypothesis that the harvest time is important for the biological
conversion, but mainly for methane production. In addition, the harvest time affected the dry
matter yield, which is important for both methane yield and the yield of fermentable sugars.
Some genotypes seem to be promising as a higher proportion of the glucan and xylan are
hydrolysed to fermentable sugars than is the result in the state-of-the-art genotype M. x
giganteus. It was however, possible to increase the methane yield of the M. x giganteus by
using roller-milling or extrusion.

44
5 Future perspectives
Several aspects have been raised, and the major findings are listed in the conclusion. To point
out some of the future perspectives the choice between biogas and bioethanol and the sampling
challenges are chosen.
An obvious question after this study of miscanthus is whether miscanthus should be grown for
energy – and for which energy carrier should it be?
The answer to the question is probably not an “either or”, but a matter of benefitting from both
biogas and bioethanol conversion techniques broadening the array of opportunities. Both
biogas and bioethanol can be produced from miscanthus, and the final choice of output
depends on several factors such as conversion efficiency, distance from miscanthus field to
conversion plant, price and consumption of current bioenergy output, but also other crops
should be considered. Therefore, it seems demanding to compare and evaluate different
methods, but also to decide how the future renewable energy landscape should be. It is big
questions and demands a political strategy on the renewable energy technologies, not only
biomass, also alternatives such as hydro, solar and wind power. Such a strategy will determine
to which extent biomass should be part of the renewable energy resource, but also where
processing plants should be built, which most likely necessitates new grids.
The sampling procedure has huge impact on the results obtained though it occasionally seems
neglected. The impact of correct sampling with minimised sampling errors is valuable by
minimising the variations and allowing more consistent and reliable results. The correct
sampling are yet laborious but valuable by providing trustworthy data forming the basis for
findings, extrapolations and possibly political decisions on how to proceed and answer the
question for instance when deciding the future’s renewable energy strategy.

45
6 Manuscripts
6.1 Manuscript 1: Seasonal dynamics and genotype differences of
enzymatically accessible sugars from Miscanthus
6.2 Manuscript 2: The effect of harvest time, dry matter content and
mechanical pretreatments on anaerobic digestion and enzymatic
hydrolysis of Miscanthus
6.3 Manuscript 3: Comparing methods for characterising the
digestibility of Miscanthus in bioethanol or biogas processing

46
7 References
Ambye-Jensen, M., Johansen, K.S., Didion, T., Kadar, Z., Meyer, A.S. 2014. Ensiling and hydrothermal pretreatment of grass: consequences for enzymatic biomass conversion and total monosaccharide yields. Biotechnology for Biofuels, 7(95), 1-12.
Beale, C.V., Bint, D.A., Long, S.P. 1996. Leaf photosynthesis in the C-4-grass Miscanthus x giganteus, growing in the cool temperate climate of southern England. Journal of Experimental Botany, 47(295), 267-273.
Beale, C.V., Long, S.P. 1995. Can Perennial C-4 grasses attain high efficiencies of radiant energy-conversion in cool climates. Plant Cell and Environment, 18(6), 641-650.
Beale, C.V., Morison, J.I.L., Long, S.P. 1999. Water use efficiency of C-4 perennial grasses in a temperate climate. Agricultural and Forest Meteorology, 96(1-3), 103-115.
Berglund, M., Börjesson, P. 2006. Assessment of energy performance in the life-cycle of biogas production. Biomass & Bioenergy, 30(3), 254-266.
Boehmel, C., Lewandowski, I., Claupein, W. 2008. Comparing annual and perennial energy cropping systems with different management intensities. Agricultural Systems, 96(1-3), 224-236.
Chen, F.L., Wei, Y.M., Zhang, B., Ojokoh, A.O. 2010. System parameters and product properties response of soybean protein extruded at wide moisture range. Journal of Food Engineering, 96(2), 208-213.
Christian, D.G., Riche, A.B. 1998. Nitrate leaching losses under Miscanthus grass planted on a silty clay loam soil. 14(3), 131-135.
Clifton-Brown, J.C., Lewandowski, I., Andersson, B., Basch, G., Christian, D.G., Kjeldsen, J.B., Jørgensen, U., Mortensen, J.V., Riche, A.B., Schwarz, K.-U., Tayebi, K., Teixeira, F. 2001. Performance Of 15 Genotypes At Five Sites In Europe. Agron. J., 93(5), 1013-1019.
Clifton-Brown, J.C., Stampfl, P.F., Jones, M.B. 2004. Miscanthus biomass production for energy in Europe and its potential contribution to decreasing fossil fuel carbon emissions. Global Change Biology, 10(4), 509-518.
Danish AgriFish Agency. 2015. Opgørelse af statistik fra ansøgningsrunden om direkte arealstøtte 2015 Retrieved from http://naturerhverv.dk/fileadmin/user_upload/NaturErhverv/Filer/Tilskud/Arealtilskud/Direkte_stoette_-_grundbetaling_mm/2015/Afgroeder_2015.pdf on April 28 2016
Danish Energy Agency. 2012. Accelerating green energy towards 2020 - The Danish Energy Agreement of March 2012, (Ed.) E.a.B. Ministry of Climate, Denmark. http://www.ens.dk/sites/ens.dk/files/dokumenter/publikationer/downloads/accelerating_green_energy_towards_2020.pdf.
Danish Energy Agency. 2014. Energy Statistics 2014, (Ed.) Danish Ministry of Energy Utilities and Climate. Copenhagen, Denmark, pp. 60.
Dansk Standard. 2013. DS 3077 - Representative sampling - Horizontal standard. Copenhagen, Denmark.
Davis, S.C., Parton, W.J., Dohleman, F.G., Smith, C.M., Grosso, S.d., Kent, A.D., DeLucia, E.H. 2010. Comparative biogeochemical cycles of bioenergy crops reveal nitrogen-fixation and low greenhouse gas emissions in a Miscanthus * giganteus agro-ecosystem. Ecosystems, 13(1), 144-156.
de Souza, W.R. 2013. Microbial Degradation of Lignocellulosic Biomass, Sustainable Degradation of Lignocellulosic Biomass - Techniques, Applications and Commercialization. InTech.
Dehghani, M.R., Weisbjerg, M.R., Hvelplund, T., Kristensen, N.B. 2012. Effect of enzyme addition to forage at ensiling on silage chemical composition and NDF degradation characteristics. Livestock Science, 150(1–3), 51-58.
Dohleman, F.G., Long, S.P. 2009. More Productive Than Maize in the Midwest: How Does Miscanthus Do It? Plant Physiology, 150(4), 2104-2115.
Esbensen, K.H. 2002. Multivariate Data Analysis – in Practice: Miscellaneous Issues. 5 ed. in: Multivariate data analysis - in practice : an introduction to multivariate data analysis and

47
experimental design, (Eds.) K.H. Esbensen, D. Guyot, F. Westad, L.P. Houmøller, CAMO ASA. Oslo, pp. 598.
Esbensen, K.H., Wagner, C. 2014. Theory of sampling (TOS) versus measurement uncertainty (MU) – A call for integration. Trends in Analytical Chemistry, 57, 93-106.
Gislum, R., Deleuran, L.C., Boelt, B. 2009. Predicting seed yield in perennial ryegrass using repeated canopy reflectance measurements and PLSR. Acta Agricultura Scandinavica. Section B, Plant Soil Science, 59(5), 414-423.
Głowacka, K., Clark, L.V., Adhikari, S., Peng, J., Stewart, J.R., Nishiwaki, A., Yamada, T., Jørgensen, U., Hodkinson, T.R., Gifford, J., Juvik, J.A., Sacks, E.J. 2015. Genetic variation in Miscanthus × giganteus and the importance of estimating genetic distance thresholds for differentiating clones. GCB Bioenergy, 7(2), 386-404.
Griffiths, P.R. 2002. Introduction to vibrational spectroscopy. in: Handbook of Vibrational Spectroscopy, (Eds.) J.M. Chalmers, P.R. Griffiths, John Wiley & Sons Ltd. Chichester, UK, pp. 33-43.
Gy, P.M. 1998. Sampling for analytical purposes. Wiley, Chichester, UK. Hay, R.K.M., Porter, J.R. 2006. The physiology of crop yield. Blackwell Publishing, Oxford. Hayes, D.J. 2009. An examination of biorefining processes, catalysts and challenges. Catalysis Today,
145(1-2), 138-151. Hayes, D.J., Hayes, M.H.B. 2009. The role that lignocellulosic feedstocks and various biorefining
technologies can play in meeting Ireland's biofuel targets. Biofuels Bioproducts & Biorefining, 3(5), 500-520.
Hayes, D.J.M. 2012. Development of near infrared spectroscopy models for the quantitative prediction of the lignocellulosic components of wet Miscanthus samples. Bioresource Technology, 119, 393-405.
Hayes, D.J.M. 2013. Mass and compositional changes, relevant to biorefining, in Miscanthus x giganteus plants over the harvest window. Bioresource Technology, 142, 591-602.
Hendriks, A.T.W.M., Zeeman, G. 2009. Pretreatments to enhance the digestibility of lignocellulosic biomass. Bioresource Technology, 100(1), 10-18.
Himmel, M.E., Ding, S.-Y., Johnson, D.K., Adney, W.S., Nimlos, M.R., Brady, J.W., Foust, T.D. 2007. Biomass recalcitrance: Engineering plants and enzymes for biofuels production. Science, 315(5813), 804-807.
Hjorth, M., Granitz, K., Adamsen, A.P.S., Møller, H.B. 2011. Extrusion as a pretreatment to increase biogas production. Bioresource Technology, 102(8), 4989-4994.
Hodgson, E.M., Fahmi, R., Yates, N., Barraclough, T., Shield, I., Allison, G., Bridgwater, A.V., Donnison, I.S. 2010. Miscanthus as a feedstock for fast-pyrolysis: Does agronomic treatment affect quality? Bioresource Technology, 101(15), 6185-6191.
Holm-Nielsen, J.B., Lomborg, C.J., Oleskowicz-Popiel, P., Esbensen, K.H. 2008. On-line near infrared monitoring of glycerol-boosted anaerobic digestion processes: Evaluation of process analytical technologies. Biotechnology and Bioengineering, 99(2), 302-313.
Hotelling, H. 1933. Analysis of a complex of statistical variables into principal components. Journal of Educational Psychology, 24, 417-441.
International Energy Agency. 2009. IEA Bioenergy Task 42 Biorefinery, (Eds.) E.d. Jong, H. Langeveld, R.v. Ree, IEA Bioenergy. The Netherlands, pp. 28.
Jiao, X., Kørup, K., Andersen, M.N., Sacks, E.J., Zhu, X.-G., Lærke, P.E., Jørgensen, U. 2016. Can miscanthus C4 photosynthesis compete with festulolium C3 photosynthesis in a temperate climate? GCB Bioenergy, 10.1111/gcbb.12342, n/a-n/a.
Jørgensen, U. 2011. Benefits versus risks of growing biofuel crops: the case of Miscanthus. Current Opinion in Environmental Sustainability, 3(1-2), 24-30.
Jørgensen, U. 1997. Genotypic variation in dry matter accumulation and content of N, K and Cl in Miscanthus in Denmark. Biomass and Bioenergy, 12(3), 155-169.

48
Kandel, T.P., Gislum, R., Jørgensen, U., Lærke, P.E. 2013. Prediction of biogas yield and its kinetics in reed canary grass using near infrared reflectance spectroscopy and chemometrics. Bioresource Technology, 146, 282-287.
Katuwal, H., Bohara, A.K. 2009. Biogas: A promising renewable technology and its impact on rural households in Nepal. Renewable & Sustainable Energy Reviews, 13(9), 2668-2674.
Kiesel, A., Lewandowski, I. 2016. Miscanthus as biogas substrate - Cutting tolerance and potential for anaerobic digestion. Global Change Biology Bioenergy, 10.1111/gcbb.12330.
Kjeldsen, J.B., Jørgensen, U., Kristensen, E.F. 1999. Miscanthus for thatching - Danish: Elefantgraes til taekkeformal. Danish Agricultural Research.
Kristensen, E.F. 2001. Teknik til høst af miscanthus (elefantgræs) - Equipment for harvesting miscanthus. Ministeriet for Fødevarer, Landbrug og Fiskeri, Danmarks JordbrugsForskning, Forskningscenter Foulum, Tjele.
Kristensen, N.B., Danfær, A., Tetens, V., Agergaard, N. 1996. Portal recovery of intraruminally infused short-chain fatty acids in sheep. Acta Agriculturae Scandinavica Section a-Animal Science, 46(1), 26-38.
Kristensen, N.B., Sloth, K.H., Hojberg, O., Spliid, N.H., Jensen, C., Thøgersen, R. 2010. Effects of microbial inoculants on corn silage fermentation, microbial contents, aerobic stability, and milk production under field conditions. Journal of Dairy Science, 93(8), 3764-3774.
Kurian, J.K., Nair, G.R., Hussain, A., Raghavan, G.S.V. 2013. Feedstocks, logistics and pre-treatment processes for sustainable lignocellulosic biorefineries: A comprehensive review. Renewable & Sustainable Energy Reviews, 25, 205-219.
Lamsal, B., Yoo, J., Brijwani, K., Alavi, S. 2010. Extrusion as a thermo-mechanical pre-treatment for lignocellulosic ethanol. Biomass & Bioenergy, 34(12), 1703-1710.
Larsen, S.U., Jørgensen, U., Kjeldsen, J.B., Lærke, P.E. 2014. Long-Term Miscanthus Yields Influenced by Location, Genotype, Row Distance, Fertilization and Harvest Season. BioEnergy Research, 7(2), 620-635.
Linde-Laursen, I. 1993. Cytogenetic Analysis of Miscanthus‘Giganteus’, an Interspecific Hybrid. Hereditas, 119(3), 297-300.
Lindedam, J., Andersen, S.B., DeMartini, J., Bruun, S., Jørgensen, H., Felby, C., Magid, J., Yang, B., Wyman, C.E. 2012. Cultivar variation and selection potential relevant to the production of cellulosic ethanol from wheat straw. Biomass & Bioenergy, 37, 221-228.
Lindedam, J., Bruun, S., Jørgensen, H., Decker, S.R., Turner, G.B., DeMartini, J.D., Wyman, C.E., Felby, C. 2014. Evaluation of high throughput screening methods in picking up differences between cultivars of lignocellulosic biomass for ethanol production. Biomass and Bioenergy, 66, 261-267.
Lindedam, J., Bruun, S., Jørgensen, H., Felby, C., Magid, J. 2010. Cellulosic ethanol: interactions between cultivar and enzyme loading in wheat straw processing. Biotechnology for Biofuels, 3(25), 1-10.
Lund, H., Mathiesen, B.V. 2009. Energy system analysis of 100% renewable energy systems-The case of Denmark in years 2030 and 2050. Energy, 34(5), 524-531.
Maabjerg Energy Center. 2016. Abundance of raw material Retrieved from http://www.maabjergenergycenter.dk/fakta-om-mec/input-output/ on May 20 2016
Mathiesen, B.V., Lund, H., Karlsson, K. 2011. 100% Renewable energy systems, climate mitigation and economic growth. Applied Energy, 88(2), 488-501.
McDonald, P., Edwards, R.A., Greenhalgh, J.F., Morgan, C.A. 2002. Animal nutrition. Pearson Education, Harlow, United Kingdom.
McDonald, P., Henderson, A.R., Heron, S.J.E. 1991a. Introduction. 2 ed. in: The biochemistry of silage, Chalcombe Publications. Marlow, pp. 9-18.
McDonald, P., Henderson, A.R., Heron, S.J.E. 1991b. Losses during ensilage. 2 ed. in: The biochemistry of silage, Chalcombe Publications. Marlow, pp. 237-249.
49
Menardo, S., Cacciatore, V., Balsari, P. 2015. Batch and continuous biogas production arising from feed varying in rice straw volumes following pre-treatment with extrusion. Bioresource Technology, 180, 154-161.
Moset, V., Al-zohairi, N., Møller, H.B. 2015. The impact of inoculum source, inoculum to substrate ratio and sample preservation on methane potential from different substrates. Biomass and Bioenergy, 83, 474-482.
Mosier, N., Wyman, C., Dale, B., Elander, R., Lee, Y.Y., Holtzapple, M., Ladisch, M. 2005. Features of promising technologies for pretreatment of lignocellulosic biomass. Bioresource Technology, 96(6), 673-686.
Nielsen, T.S., Kristensen, N.B., Weisbjerg, M.R. 2007. Effect of harvest time on fermentation profiles of maize ensiled in laboratory silos and determination of drying losses at 60 degrees C. Acta Agriculturae Scandinavica Section a-Animal Science, 57(1), 30-37.
NIST. 2016. RM 8494 - Wheat Straw Whole Biomass Feedstock Retrieved from https://www-s.nist.gov/srmors/view_detail.cfm?srm=8494 on March 17 2016
Novozymes. n.d. Cellulosic ethanol Novozymes Cellic® CTec2 and HTec2 -Enzymes for hydrolysis of lignocellulosic Retrieved from http://bioenergy.novozymes.com/en/cellulosic-ethanol/CellicCTec3/Documents/AS_2010-01668-03.pdf on June 20 2016
Osborne, B.G. 2000. Near-infrared Spectroscopy in Food Analysis. in: Encyclopedia of analytical chemistry: applications, theory and instrumentation, (Ed.) R.A. Meyers, Wiley & Sons Ltd. Chichester, UK.
Overend, R.P., Chornet, E. 1987. Fractionation of Lignocellulosics by Steam-Aqueous Pretreatments. Philosophical Transactions of the Royal Society a-Mathematical Physical and Engineering Sciences, 321(1561), 523-536.
Parajuli, R., Dalgaard, T., Jørgensen, U., Adamsen, A.P.S., Knudsen, M.T., Birkved, M., Gylling, M., Schjørring, J.K. 2015. Biorefining in the prevailing energy and materials crisis: a review of sustainable pathways for biorefinery value chains and sustainability assessment methodologies. Renewable and Sustainable Energy Reviews, 43, 244-263.
Petersen, L., Dahl, C.K., Esbensen, K.H. 2004. Representative mass reduction in sampling - a critical survey of techniques and hardware. Chemometrics and Intelligent Laboratory Systems, 74(1), 95-114.
Petersen, L., Minkkinen, P., Esbensen, K.H. 2005. Representative sampling for reliable data analysis: Theory of Sampling. Chemometrics and Intelligent Laboratory Systems, 77(1-2), 261-277.
Pettersson, T., Martinsson, K.A. 1994. Digestibility of whole or rolled ensiled barley grain fed to heifers or lactating cows. Swedish Journal of Agricultural Research, 24(3), 109-113.
Pugesgaard, S., Schelde, K., Larsen, S.U., Lærke, P.E., Jørgensen, U. 2015. Comparing annual and perennial crops for bioenergy production - influence on nitrate leaching and energy balance. Global Change Biology Bioenergy, 7(5), 1136-1149.
Pyter, R., Heaton, E., Dohleman, F., Voigt, T., Long, S. 2009. Agronomic Experiences with Miscanthus x giganteus in Illinois, USA. in: Biofuels: Methods and Protocols, (Ed.) J.R. Mielenz, Vol. 581, pp. 41-52.
Rinnan, Å., Berg, F.v.d., Engelsen, S.B. 2009. Review of the most common pre-processing techniques for near-infrared spectra. TrAC Trends in Analytical Chemistry, 28(10), 1201-1222.
Scally, L., Hodkinson, T., Jones, M.B. 2001. Origins and Taxonomy of Miscanthus. 1 ed. in: Miscanthus for Energy and Fibre, (Eds.) M.B. Jones, M. Walsh, James & James (Science Publisher) Ltd. London, UK, pp. 1-9.
Schjønning, P., Heckrath, G., Tolstrup Christensen, B. 2009. Threats to soil quality in Denmark : a review of existing knowledge in the context of the EU soil thematic strategy. Aarhus University. Faculty of Agricultural Science., Tjele.
Schubert, C. 2006. Can biofuels finally take center stage? Nature Biotechnology, 24(7), 777-784. Somerville, C., Youngs, H., Taylor, C., Davis, S.C., Long, S.P. 2010. Feedstocks for Lignocellulosic Biofuels.
Science, 329(5993), 790-792.

50
Sørensen, B., Nistrup Jørgensen, L. 2010. Grøn viden: vejret i vækståret: september 2009 - august 2010 (The climate in the growing season September 2009-August 2010). Grøn viden Markbrug, 335.
Taiz, L., Zeiger, E. 2010. Plant physiology. Sinauer Associates, Sunderland, Mass. Van Soest, P.J. 1994. Nutritional ecology of the ruminant. 2 ed. Comstock Publishing Associates, Ithaca,
N.Y. Wahid, R., Frydendal-Nielsen, S., Hernandez, V.M., Ward, A.J., Gislum, R., Jørgensen, U., Møller, H.B.
2015a. Methane production potential from Miscanthus sp.: Effect of harvesting time, genotypes and plant fractions. Biosystems Engineering, 133, 71-80.
Wahid, R., Hjorth, M., Kristensen, S., Møller, H.B. 2015b. Extrusion as Pretreatment for Boosting Methane Production: Effect of Screw Configurations. Energy & Fuels, 29(7), 4030-4037.
Whittaker, C., Hunt, J., Misselbrook, T., Shield, I. 2016. How well does Miscanthus ensile for use in an anaerobic digestion plant? Biomass and Bioenergy, 88, 24-34.
Wilkinson, J.M., Bolsen, K.K., Lin, C.J. 2003. History of Silage. in: Silage Science and Technology, (Eds.) D.R. Buxton, R.E. Muck, J.H. Harrison, 10.2134/agronmonogr42.c1, American Society of Agronomy, Crop Science Society of America, Soil Science Society of America. Madison, WI, pp. 1-30.
Wold, S., Esbensen, K., Geladi, P. 1987. Proceedings of the Multivariate Statistical Workshop for Geologists and GeochemistsPrincipal component analysis. Chemometrics and Intelligent Laboratory Systems, 2(1), 37-52.
Workman, J.J., Weyer, L. 2007. Spectra–Structure Correlations for Near Infrared. in: Practical Guide and Spectral Atlas for Interpretive Near-Infrared Spectroscopy,, (Eds.) J.J. Workman, L. Weyer, pp. 239-264.
Young, E., Lee, S.-M., Alper, H. 2010. Optimizing pentose utilization in yeast: the need for novel tools and approaches. Biotechnology for Biofuels, 3(1), 1-12.
Zhang, H. 2014. Biomass Deconstruction and Recalcitrance - A Study on the Anatomical Fractions of Wheat Straw Biomass and a Novel High Throughput Screening Platform for Thermochemical Pretreatment and Enzymatic Degradation of Lignocellulosic Biomass. Department of Geosciences and Natural Resource Management, Faculty of Science, University of Copenhagen.
Zhang, H., Fangel, J.U., Willats, W.G.T., Selig, M.J., Lindedam, J., Jørgensen, H., Felby, C. 2014. Assessment of leaf/stem ratio in wheat straw feedstock and impact on enzymatic conversion. Global Change Biology Bioenergy, 6(1), 90-96.