OPTIMAL FILL FACTOR OF SLOT WITH RESPECT OF USED ...
68
BRNO UNIVERSITY OF TECHNOLOGY FACULTY OF ELECTRICAL ENGINEERING AND COMMUNICATION DEPARTMENT OF POWER ELECTRICAL AND ELECTRONIC ENGINEERING OPTIMAL FILL FACTOR OF SLOT WITH RESPECT OF USED INSULATION OF MOTOR AND DUTY MASTER’S THESIS AUTHOR Bc. Josef Samek BRNO 2016
Transcript of OPTIMAL FILL FACTOR OF SLOT WITH RESPECT OF USED ...
BRNO UNIVERSITY OF TECHNOLOGY
FACULTY OF ELECTRICAL ENGINEERING AND COMMUNICATION
DEPARTMENT OF POWER ELECTRICAL AND ELECTRONIC
ENGINEERING
OPTIMAL FILL FACTOR OF SLOT WITH
RESPECT OF USED INSULATION OF
MOTOR AND DUTY
MASTER’S THESIS
AUTHOR Bc. Josef Samek
BRNO 2016

BRNO UNIVERSITY OF TECHNOLOGY
VYSOKÉ UČENÍ TECHNICKÉ V BRNĚ
FACULTY OF ELECTRICAL ENGINEERING AND COMMUNICATION
FAKULTA ELEKTROTECHNIKY A KOMUNIKAČNÍCH TECHNOLOGIÍ
DEPARTMENT OF POWER ELECTRICAL AND ELECTRONIC ENGINEERING
ÚSTAV VÝKONOVÉ ELEKTROTECHNIKY A ELEKTRONIKY
OPTIMAL FILL FACTOR OF SLOT WITH RESPECT OF USED INSULATION OF MOTOR AND DUTY
OPTIMÁLNÍ PLNĚNÍ DRÁŽKY S OHLEDEM NA POUŽITOU IZOLACI MOTORU A PRACOVNÍHO ZATÍŽENÍ
MASTER'S THESIS
DIPLOMOVÁ PRÁCE
AUTHOR
AUTOR PRÁCE
Bc. Josef Samek
SUPERVISOR
VEDOUCÍ PRÁCE
Ing. Rostislav Huzlík, Ph.D.
BRNO 2016


Abstract
Thesis deals with random wound stator - conductors’ distribution in stator slot and its
influence on proximity effect (non-uniformity of current distribution) in conductors near air gap.
Also circulating currents between parallel strands of winding are assumed, same as influence of
rotor permanent magnets magnetic field. Conductor level thermal simulation is conducted
according to used insulation system of machine and current distribution. Chapter 1 – 3 deals with
theory, subchapter 4.3 investigates thermal properties of used materials for thermal simulations
and chapters 4 and 5 presents work itself – simulation of given machine (current distribution in
conductors) in Ansys Maxwell and thermal simulation in FEMM and Ansys 16.0.

Keywords
Random wound winding, insulation system, circulating currents, proximity effect, skin effect,
finite element method, thermal properties of materials, thermal analysis of PMSM, winding hot
spots, heat transfer, Ansys, Maxwell, FEMM, conductor level thermal analysis, conductor level
simulation, PMSM machine heat loss distribution.

Bibliografická citace
SAMEK, J. Optimal fill factor of slot with respect of used insulation of motor and duty. Brno
University of Technology, Faculty of Electrical Engineering and Communication, 2016. 67 pages.
Supervisor Ing. Rostislav Huzlík, Ph.D.
Prohlášení
Prohlašuji, že svou diplomovou práci na téma „Optimal fill factor of slot with respect of used
insulation of motor and duty“ jsem vypracoval samostatně pod vedením vedoucího diplomové
práce a s použitím odborné literatury a dalších informačních zdrojů, které jsou všechny citovány
v práci a uvedeny v seznamu literatury na konci práce.
Jako autor uvedené diplomové práce dále prohlašuji, že v souvislosti s vytvořením této
diplomové práce jsem neporušil autorská práva třetích osob, zejména jsem nezasáhl nedovoleným
způsobem do cizích autorských práv osobnostních a jsem si plně vědom následků porušení
ustanovení § 11 a následujících autorského zákona č. 121/2000 Sb., včetně možných
trestněprávních důsledků vyplývajících z ustanovení § 152 trestního zákona č. 140/1961 Sb.
V Brně dne …………………………… Podpis autora ………………………………..
Acknowledgements
“If you want to find the secrets of the universe, think in terms of energy, frequency and
vibration.” Nikola Tesla
First lines of acknowledgement belongs to my supervisor Ing. Rostislav Huzlík, Ph.D. from
Brno University of Technology, I am very grateful for all his patience, problem solving ideas,
sharing of his skills in FEM modeling programs and all the time spent with me during our personal
consultations in Brno and also skype consultations.
I am also very grateful to Ing. Jiří Kurfürst, Ph.D. for cooperation with industry and finding
some time for me always, when I needed. For all support during work and also idea of creation of
this task - assignment. During process of working on the thesis, I have learnt a lot.
I have to express gratitude to prof. Ingo Hahn from FAU Erlangen - Nürnberg for accepting
me to one semester of studies in the university, for providing the material background and support,
for consultation time, his patience and willingness to listen.
Next gratitude lines are heading to Ing. Christoph Hittinger for his time, he spent with me
during our consultations in Erlangen. Your ability of deep thinking and passion for understanding
of the electro-technical problems was very inspiring. Good luck with your dissertation.
I would like to express many thanks to KAAD organization – Pavel Blažek, Markéta
Šmalcová, Alwin Becker, Dorit Raderschatt, Marianne Wend, Markus Leimbach, and Mechthild
Habermann. Thank you all students from all around the world attending KAAD Jahresakademie
2016 and KAAD Katholikentag Leipzig 2016. Also many thanks to organizers of these events.
I would like express gratitude to KAAD for financial support.
Praise to my classmates in Brno – for support during winter semester especially to Ladislav
Karásek and Roman Juchelka. Many thanks to my new friends in Germany first of all to Rahel for
warm welcome and acceptance and also for patience during my beginning with the German
language.
Many, many, many thanks to my Mum, Dad, brother and whole family. First of all for
financial support during my studies. I also received generous support from kitchens of my mum
and grandmothers during studies. It was delicious, thank you. I am also very much grateful to my
brother and dad for encouragement and engagement in the thesis. Your perspective above the
thesis, ideas, willingness to understand, and your support was the most important essence during
completion during last days before deadline.
I would like also to thank YOU, you who are reading the acknowledgement lines till the end.
I am particularly grateful for the assistance and lessons given by God during thesis elaboration.
Thank you all!
Namaste.
In Bystřice nad Pernštejnem, 08.08.2016 Signed by Author ……………………………
DEPARTMENT OF POWER ELECTRICAL AND ELECTRONIC
ENGINEERING
Faculty of Electrical Engineering and Communication
Brno University of Technology
8
CONTENT
1 INTRODUCTION AND STATE OF ART ........................................................................................... 14
1.1 INTRODUCTION ................................................................................................................................ 14
1.2 STATE OF ART .................................................................................................................................. 14
2 INSULATION.......................................................................................................................................... 15
2.1 INSULATION IN RANDOM-WOUND STATORS ................................................................................... 15
2.1.1 BASECOATS AND OVERCOATS OF COPPER WIRE ..................................................................... 16
2.1.2 IMPREGNATING RESIN ............................................................................................................. 16
2.1.3 GROUND WALL INSULATION ................................................................................................... 17
2.2 QUALITY OF INSULATION ................................................................................................................ 17
2.2.1 INSULATION THERMAL CLASSES ............................................................................................. 18
2.2.2 DIMENSIONING OF INSULATION .............................................................................................. 18
2.3 PREMATURE BREAKDOWN OF INSULATION .................................................................................... 19
2.3.1 THERMAL STRESS .................................................................................................................... 20
3 CURRENT IMBALANCE ..................................................................................................................... 21
3.1 SKIN EFFECT ..................................................................................................................................... 21
3.2 PROXIMITY EFFECT ......................................................................................................................... 23
3.2.1 PARALLEL STRANDS AND PROXIMITY EFFECT ........................................................................ 25
3.3 PERMANENT MAGNET - WINDING EDDY CURRENTS ....................................................................... 27
3.4 CIRCULATING CURRENTS IN PMSM ............................................................................................... 29
4 THERMAL MECHANICS .................................................................................................................... 30
4.1 HEAT AND TEMPERATURE............................................................................................................... 30
4.1.1 TEMPERATURE SCALES ........................................................................................................... 31
4.1.2 FOURIER’S LAW ...................................................................................................................... 31
4.1.3 THERMAL CONDUCTIVITY ...................................................................................................... 32
4.1.4 SPECIFIC HEAT CAPACITY ...................................................................................................... 32
4.1.5 TEMPERATURE COEFFICIENT OF RESISTANCE ........................................................................ 33
4.2 HEAT TRANSFER .............................................................................................................................. 33
4.2.1 CONDUCTION .......................................................................................................................... 33
4.2.2 CONVECTION .......................................................................................................................... 34
4.2.3 RADIATION .............................................................................................................................. 34
4.3 THERMAL PROPERTIES OF MATERIALS FOR SIMULATIONS .......................................................... 35
4.3.1 COPPER ................................................................................................................................... 35
4.3.2 SHEETS, MAGNETS .................................................................................................................. 35
4.3.3 GROUND-WALL INSULATION .................................................................................................. 35
4.3.4 COPPER WIRE COATING ........................................................................................................... 36
4.3.5 IMPREGNATING RESIN ............................................................................................................. 36
5 ELECTRO-MAGNETIC SIMULATIONS .......................................................................................... 37
5.1 ANSYS MAXWELL – CURRENT SIMULATION - NOMINAL POWER .............................................. 37
5.1.1 PARAMETRIC MODEL .............................................................................................................. 37

DEPARTMENT OF POWER ELECTRICAL AND ELECTRONIC
ENGINEERING
Faculty of Electrical Engineering and Communication
Brno University of Technology
9
5.1.2 SETUP OF WINDING ................................................................................................................. 38
5.1.3 IMPORTING GEOMETRY ........................................................................................................... 39
5.1.4 CURRENT DISTRIBUTION IN MODELS ...................................................................................... 42
5.2 ANSYS MAXWELL – CURRENT SIMULATION – OPEN CIRCUIT (OC) ........................................ 46
5.3 FEMM – CURRENT SIMULATION ................................................................................................... 48
6 THERMAL SIMULATIONS ................................................................................................................. 49
6.1 ANSYS WORKBENCH – THERMAL STEADY STATE ........................................................................ 49
6.2 FEMM - THERMAL SIMULATION – NOMINAL POWER .................................................................. 49
6.2.1 ANALYTICAL INPUT ................................................................................................................ 49
6.2.2 MAXWELL INPUT .................................................................................................................... 52
6.3 FEMM – SELECTED CONDUCTOR – NOMINAL POWER ................................................................. 54
7 FUTURE WORK .................................................................................................................................... 56
8 CONCLUSION ........................................................................................................................................ 57
BIBLIOGRAPHY ...................................................................................................................................... 59
ATTACHMENTS ....................................................................................................................................... 62

DEPARTMENT OF POWER ELECTRICAL AND ELECTRONIC
ENGINEERING
Faculty of Electrical Engineering and Communication
Brno University of Technology
10
LIST OF FIGURES
Figure 1. 1 Insulation components of random wound stator [6] ................................................... 15
Figure 2. 1 X-Y plane of conductor with skin effect [18] ............................................................... 21
Figure 2. 2 Cause of skin effect[19] ............................................................................................... 22
Figure 2. 3 Homogenous conducotor at xyz plane with current density vector Jz illustrated[17] 23
Figure 2. 4 Proximity effect at two nearby conductors[21] ........................................................... 24
Figure 2. 5 Proximity effect at conductors inside stator slot and slot leakage flux lines[11] ....... 24
Figure 2. 6 Winding styles for a concentrated fractional pitch winding [3] ................................. 26
Figure 2. 7 Radial magnetic flux created by rotor magnets[15] ................................................... 27
Figure 2. 8 Circulation of magnetic flux in motor winding (short-circuit, 6000rpm) [22] ........... 28
Figure 2. 9 Leading and trailing edge of coil ................................................................................ 28
Figure 2. 10 Basic schema of circulating current origin ............................................................... 29
Figure 3. 1 Illustration of Fourier’s Law [28] ............................................................................... 31
Figure 4. 1 Parametric model of machine scripted in Visual Basic Script .................................... 37
Figure 4. 2 Winding inside stator slot including wire coating insulation ...................................... 38
Figure 4. 3 Distribution of conductors inside stator slot ............................................................... 39
Figure 4. 4 A - Hybrid magnetic circuit type, B – Full magnetic circuit ....................................... 40
Figure 4. 5 Flux density inside machine including flux lines ......................................................... 41
Figure 4. 6 Winding Induced voltage – A whole graph, B – detail of parallel strands difference 41
Figure 4. 7 Ohmic Loss in phase U in maximum current of phase ................................................ 42
Figure 4. 8 Current density Jz – type 1 – Tangential arrangement of conductors ........................ 43
Figure 4. 9 Current density Jz – type 2 – Random arrangement of conductors ............................ 43
Figure 4. 10 Current density Jz – type 3 – Radial arrangement of conductors ............................. 43
Figure 4. 11 Points in conductor with greatest proximity effect .................................................... 44
Figure 4. 12 Transient current distribution in conductor – one period ......................................... 45
Figure 4. 13 Flux lines and current density Jz in simulation time 195 ms .................................... 45
Figure 4. 14 External circuit schematics used for OC model ........................................................ 46
Figure 4. 15 Tangential arrangement of conductors – Circulating currents OC .......................... 46
Figure 4. 16 Random arrangement of conductors – Circulating currents OC .............................. 47
Figure 4. 17 Radial arrangement of conductors – Circulating currents OC ................................. 47
Figure 4. 18 FEMM model of machine .......................................................................................... 48
Figure 4. 19 FEMM – detail stator slot ......................................................................................... 48
DEPARTMENT OF POWER ELECTRICAL AND ELECTRONIC
ENGINEERING
Faculty of Electrical Engineering and Communication
Brno University of Technology
11
Figure 4. 20 Mesh of thermal model .............................................................................................. 50
Figure 4. 21 Temperature result of thermal simulation ................................................................. 50
Figure 4. 22 Tangential temperature distribution across line between point 1 and 5 (Figure 4.21)
................................................................................................................................................ 51
Figure 4. 23 A - Core losses in stator, stator sheet labeling and wire labeling for export, ........... 52
Figure 4. 24 Graph of core losses in Maxwell for transference to FEMM .................................... 52
Figure 4. 25 Temperature result of thermal simulation ................................................................. 53
Figure 4. 26 Tangential temperature distribution across line inside winding ............................... 54
Figure 4. 27 A – Line to display Ohmic-losses in Maxwell, B – complete model in FEMM ......... 54
Figure 4. 28 Displayed Ohmic losses along line crossing conductor in Figure 4. 27 - A ............. 55
Figure 4. 29 A – Model of single conductor in Ansys 16.0, B – Resulting temperatures .............. 55
Figure 4. 30 Machine wound with 7 parallel strands .................................................................... 56
LIST OF TABLES
Table 1- Thermal classes of insulating materials [5] .................................................................... 18
Table 2 Transient FEM Results for the Winding Schemes in Figure 2. 6 [3] ................................ 26
Table 3 Comparison of stator sheets designs ................................................................................. 40
Table 4 Total Ohmic loss comparison across models .................................................................... 44
Table 5 Computed and calculated temperature drops across ground-wall insulation .................. 51
Table 6 Computed and calculated temperature drops across ground-wall insulation .................. 53
Table 7 Conductor with greatest proximity effect occurrence - summary ..................................... 57

DEPARTMENT OF POWER ELECTRICAL AND ELECTRONIC
ENGINEERING
Faculty of Electrical Engineering and Communication
Brno University of Technology
12
LIST OF SYMBOLS AND ABBREVIATIONS
𝑞𝑥⃗⃗⃗⃗ - vector of heat flux [W∙m-2]
𝑃∆ - represents amount of heat generated inside machine [W]
𝑅∆ - change in resistance due to change of temperature [Ω]
𝑇 ∆ - difference of temperatures [K]
𝜗∆ - represents temperature drop [°C]
𝐵𝑛 - peak value of flux density [T]
𝑃𝑒 – proximity effect losses in conductor [𝑊 ∙ 𝑚−1]
𝑅0 - resistance in at the beginning temperature [Ω]
𝑅𝜗 - is thermal resistance [K∙W-1]
𝑇0 - temperature of distant surrounding or initial temperature [K]
𝛼𝑇 - temperature coefficient of resistance [K-1]
𝛼𝑐 - heat transfer coefficient [W∙m-2∙K-1]
𝛼𝑛𝑐 - heat transfer coefficient for natural cooling [W∙m-2∙K-1)]
𝛼𝑟 - represents radiative heat transfer coefficient [W∙m-2∙K-1)]
𝜌𝑐 - resistivity of conductor [Ω∙m]
𝜔 - angular velocity of flux density [rad∙s-1]
∆𝑃 - is heat flow [W]
AC – alternating current
CD – creeping discharge
CTI – comparative tracking index
dT/dx - temperature gradient in the direction of x axis heat flow [K∙m-1]
DVC – dynamic capacitor voltage control
e - Euler’s number [-]
FEM – finite element method
GVPI – global vacuum pressure impregnation
Jz – Current density inside conductor [A∙m-2]
l - thickness of material [m]
p.u. – proportional units
PD – partial discharge
PE – proximity effect
PWM – pulse width modulation
DEPARTMENT OF POWER ELECTRICAL AND ELECTRONIC
ENGINEERING
Faculty of Electrical Engineering and Communication
Brno University of Technology
13
PMSM – permanent magnet synchronous machine
RPDIV - repetitive partial discharge inception voltage
rpm – revolutions per minute
S - surface of material [m2]
T – temperature [K]
t – time [s]
THD – total harmonic distortion
THD – total harmonic distortion
ε - emissivity of material [-]
𝐴 - assumed area of machine [m2]
𝑄 – heat [J]
𝑐 - specific heat capacity [J∙kg-1∙K-1]
𝑑 – diameter [m]
𝑚 – weight [kg]
𝜆 - thermal conductivity of the material [W∙m-1∙K-1]
𝜎 = 5.6703 ∙ 10−8 - Stephan-Boltzmann constant [W∙m-2∙K-4]

DEPARTMENT OF POWER ELECTRICAL AND ELECTRONIC
ENGINEERING
Faculty of Electrical Engineering and Communication
Brno University of Technology
14
1 INTRODUCTION AND STATE OF ART
1.1 Introduction
At the beginning there was a vision of Nikola Tesla and after work an electric machine was
invented. Motors are included in almost all human products and saves time and energy of ordinary
people. But sometimes it happens, that motor burns out without any reasonable explanation earlier
that its lifetime was expected. There is enormous number of possibilities how it may happen.
1.2 State of Art
The thesis will be investigating one of those hypotheses - current distribution in stator slot. For
almost every thermal calculation the current density in cross section of stator is considered to be
uniform. But in fact there are occurring some phenomena that make the current distribution non-
uniform.
Well known effects like proximity effect, skin-effect, circulating currents in PMSM [1] and
slot depth of stator can significantly affect the current distribution. These phenomena are normally
taken into account in design of large machines and high speed machines[2], [3]. But no one has
considered a connection with failure in ordinary electric motors. Especially low speed motors with
high number of poles at stator that are designed without gearbox. These motors are fed by currents
of higher frequencies also.
High local current density in conductor placed at top of stator slot could lead to local
overheating. It may lead to exceeding the permitted temperature of wire insulation and following
premature ageing of insulation [4]. Of course premature ageing is very dependent on used
materials [5].
Confirmation of this hypothesis would change design process of electric motors and increased
reliability and lifetime of designed machines.

DEPARTMENT OF POWER ELECTRICAL AND ELECTRONIC
ENGINEERING
Faculty of Electrical Engineering and Communication
Brno University of Technology
15
2 INSULATION Insulation materials are used for electrical separation of parts in machine on different electric
potential. In general we have gas insulations, liquid insulations and solid insulations. Commonly
used in low voltage machines are solid insulations [4].
Solid insulators inside a machine are improving mechanical properties and provide protection
of winding against ambient stress. They are also conducting heat away from copper wires to the
surrounding of winding.
Ideal insulator has zero conductivity or in other words its resistance is approaching the limit
of infinity. Real insulators are always slightly conductive. It makes them impermanent and creates
way for degradation of material. All kinds of stresses are described in details in chapter 2.3. Special
attention should be given to partial discharge (PD) phenomenon and also creeping discharge
phenomenon (CD). PD started to be widely investigated also in low voltage machines as a result
of PWM usage [6].
2.1 Insulation in random-wound stators
Figure 1. 1 Insulation components of random wound stator [6]
The insulation systems around the market for random-wound machines are usually very
similar. The insulation system consists of basic parts – as illustrated in Figure 1. 1.
Where
a. points at interphase insulation
b. points at ground-wall insulation
c. points at turn insulation or in other words strand insulation
And numbers represents following voltages:
1 = phase – phase voltage
2 = phase – ground voltage
3 = inter-turn voltage

DEPARTMENT OF POWER ELECTRICAL AND ELECTRONIC
ENGINEERING
Faculty of Electrical Engineering and Communication
Brno University of Technology
16
Main features of these parts will be described in subchapters. Although every company uses
similar parts and materials, the manufacturing process is slightly different in every company
according to the coiling and insertion of winding to stator slots.
2.1.1 Basecoats and overcoats of copper wire
Commonly used shape of conductor in random wound stators is round copper wire. Around
the wire we bond one or more layers of insulation material. The first layer attached to the copper
is basecoat. The other layers are called overcoats. Enameled copper wire can have even more than
four layers of insulation depending on intended use [7]. But on wires usually used nowadays in the
industry we can find only one or two layers.
Insulation materials are offered in many variations of polyurethane, polyester, polyester-imide
and polyimide. Commonly used variants are polyamide-imide insulation resistant to temperatures
up to 220 °C, without overcoat and polyester basecoat with polyamide-imide overcoat resistant up
to 200°C [4]. For higher temperatures reaching 240 °C is possible to use aromatic polyimide coat.
The thickness of insulation is usually between 0.01 mm and 0.1 mm according to the wire diameter
and insulation material.
New insulations were introduced due to occurrence of PD in low voltage machines fed by
PWM inverters. Technology used in large machines was implemented into enamels of copper
wires. Coats are now enriched with nanoparticles of mica or metal oxides [4]. This enrichment
rapidly increases PD resistance of organic insulations. The nanoparticles are usually applied to the
top overcoat layer of insulation. On a market we can find these wires under the name – corona
resistant or PD resistant.
2.1.2 Impregnating resin
Impregnating liquids like polyesters or epoxy resins are used for impregnation of winding.
There are several reasons for their usage. At first impregnation holds all copper wires tight together
and creates strong binding of wires, ground insulation and stator core. So winding can withstand
electromagnetic forces. Also abrasion due to vibrations is eliminated.
Second reason for varnishing is elimination of air gaps (bubbles) between insulation of copper
wires. An air bubbles between two copper wires are changing distribution of electrical field based
on different permittivity of air and impregnating resin. Partial discharges may occur inside the air
bubble due to usage of PWM inverter. This phenomenon is closely described in [4]. Low voltage
machines that are operated without PWM have lower requirements for quality of impregnation.
Other positive effects of impregnation are thermal properties. Varnish supports heat transfer from
copper wires to the stator core.
Common application of impregnation is simple drying (pre-heating) and then dipping of the
entire stator in bath. Whole stator is immersed inside pool with epoxy resin or varnish and then
moved to drying chamber for curing.
For elimination of air bubbles inside impregnation of winding, some companies uses advanced
impregnation techniques like global vacuum pressure impregnation (GVPI)[4][5]. This technology
is more expensive due to vacuum technology and has also higher requirements on low viscosity of
polyesters or epoxy resins. During this method stator is vacuum dried and then flooded with low

DEPARTMENT OF POWER ELECTRICAL AND ELECTRONIC
ENGINEERING
Faculty of Electrical Engineering and Communication
Brno University of Technology
17
viscosity polyester. These resins are solvent-less to prevent creation of bubbles as a result of solvent
evaporation. Resin is pressurized by inert gas to flood every possible gap. Finally the stator is
placed to ordinary “oven” to cure and dry the resin [4].
2.1.3 Ground wall insulation
The ground wall insulation is inserted into stator slot before insertion of winding. Phase
insulation is thinner than ground wall insulation but is being made from the same materials. Phase
insulation is used to separate coils of different phases inside one stator slot.
Mostly used phase to phase and ground wall insulations are “papers” made from synthetic –
plastic - materials. These papers are usually made of two or three layers of material. According to
required insulation thermal class, different materials and their combinations are used. Thickness of
insulation papers is between 0.1 mm and 0.5 mm [5] depending on required dielectric strength.
Dominant patent owner at this field of chemical manufacturing and polymer processing is
American company DuPont®. They are owner of patents for commonly used ground wall
insulation materials like Dacron™ - polyester fiber, Mylar™ - polyethylene terephthalate films,
Nomex™ - meta-aramid material and Kapton™ - polyimide film.
According to [4] new trend at form wound machines is reduction of ground wall thermal
impedance. Hopefully this trend may also find its way to the design of low voltage random wound
machines. More about ground-wall insulation thermal properties in chapter 4.3.3.
2.2 Quality of insulation
Nowadays customers are expecting high reliability and lifetime of purchased machines and
also low price of machines. But these are unnatural antithesis. The expected insulation lifetime
before rewinding of a machine is between 20 and 40 years for standard industrial use. This
unwritten standard has been created in past [4], before PWM inverter fed machines has appeared
on the market. On the other hand we may expect lifetime of insulation in traction applications just
longer than 5 years [4]. Sometimes failures and burnouts may occur even in shorter period of time.
In past insulations were dimensioned to prevent premature ageing of insulation with large
safety margins. Also current density used to be chosen lower than at present. That led to lower
temperatures in machines and very slow degradation of insulations. As a proof of this statement,
we can find even these days some large machines from the first half of the 1900s still
operating [4].
Due to material development and design progressions we reduced used amount of insulation.
New materials have better thermal and also electrical properties. These days we obtain better
insulation characteristics from thinner insulations. Also the lifetime of insulation in grid powered
machines has increased.
Usage of PWM inverters caused different type of stress to the insulation. As a result of this
trend applied stresses to the insulation, like thermal and electrical, were increased. So nowadays
we have perfect insulation materials, but under serious amount of stress. And this leads in some
cases to premature failure of a machine [8].

DEPARTMENT OF POWER ELECTRICAL AND ELECTRONIC
ENGINEERING
Faculty of Electrical Engineering and Communication
Brno University of Technology
18
2.2.1 Insulation thermal classes
Basic classification of insulations is possible to make according to maximal allowed operating
temperature. In the past for every thermal class there was specific letter of alphabet and maximum
allowed hot spot temperature. This method of labeling ended at H thermal class insulation. Ever
since we use just temperature for intended class, e.g. “Class 220” [4].
Overview of thermal classes used these days, we can find in Table 1. Commonly used thermal
classes are F and H, where F class is used at the majority of machines because of the price. H class
is less common but is used also these days. Higher thermal classes are used only for special
applications. The most important information is hot spot allowed temperature which may occur at
some spots on winding due to current imbalance.
Table 1- Thermal classes of insulating materials [5]
2.2.2 Dimensioning of insulation
List of stresses the insulation is exposed during lifetime and dimensioning for the stress is
called insulation coordination [5].
According to [4] inter-turn insulation is supposed to endure phase to phase voltage. Its
maximum value is usually 690 V. Stators designed for higher voltage than 250 V are equipped with
ground wall insulation and also insulation separating coils of different phases. We have to also
mention that ground wall and inter-phase insulation has lower requirements for thermal properties
than coats of copper wire. On the other hand slot insulation must have perfect mechanical resistance
because of contact with sharp edges of stator sheets during manufacturing process. We should also
count with bubbles in impregnation of winding, while dimensioning the insulation of machine. But
no specified advices were given.
After inspection of catalogs of manufacturers there are no doubts that dielectric strength is far
behind requirements of [4] Ground-wall insulations from Nomex™, Kapton™ or their combination
are able to withstand voltage greater than 6 kV. This dielectric strength was read from the thinnest
insulation. Also copper wire manufacturers guarantee breakdown voltage about 4.5 kV.
DEPARTMENT OF POWER ELECTRICAL AND ELECTRONIC
ENGINEERING
Faculty of Electrical Engineering and Communication
Brno University of Technology
19
Inspecting another source [8] brings exact advices given for dimensioning changes of
insulation for PWM inverter fed machines. Author speaks that dimensioning is suppressing side
effects of switch-on voltage peaks (dV/dt) created by inverters. New inverters generation with soft
switching mode are emphasized. The exact design changes are:
Insulation reinforcement or application of corona resistant insulation
Insulation reinforcement of first winding coil – respecting of voltage distribution
through winding coils
Application of non-conducting bandages
Application of semiconducting impregnation resins – reduction of creeping and
glowing discharges
Winding wound with higher number of parallel strands – reduction of proximity effect
Cited paragraph below from [7] page 10, exactly grasps whole dimensioning of insulation:
“A key point to make is that motors which were originally designed and manufactured to
operate on sinewave 60 Hz power, are subjected to a significantly reduced dielectric life, when
PWM voltage is applied: that is, a motor operating on sinewave power has a longer winding life
expectancy than an identical motor operating on a PWM supply, if all the other stresses are
constant.”
2.3 Premature breakdown of insulation
Breakdown of insulation is complex problem where many factors should be taken into account.
The breakdown its self is time dependent process of long degradation of insulation material. There
are some places in every winding, where the amount of stress of exact type is higher than in the
rest parts of winding.
The developers of PWM inverters are due to efficiency race reducing switching time and losses
of power transistors. This leads to the rise of dV/dt during switching time and leads to rise of the
stress applied to the insulation.
According to [7] there are several basic mechanism associated with degradation of insulation
and premature failure of machine:
Partial discharge activities due to voltage overshoots
Dielectric heating
Growth of material micro cavities due to high frequency stress at power frequency
dimensioned insulation
Space charge accumulation in the enamel of copper wire due to high leading edge
voltage (dV/dt) and switching frequency

DEPARTMENT OF POWER ELECTRICAL AND ELECTRONIC
ENGINEERING
Faculty of Electrical Engineering and Communication
Brno University of Technology
20
2.3.1 Thermal stress
Greatest thermal stress source inside of a machine are copper wires. Heat causes slow
degradation of insulation materials due to oxidation, pyrolysis and evaporation of molecular
substances [8]. While PWM inverter is used there will occur additional heat sources like partial
discharge, creeping discharge and dielectric losses.
Dielectric losses inside insulation come from changes of electric field. Dielectric losses energy
is converted to heat and causes another heat source at the machine. According to [6] at conventional
frequency dielectric losses are very minor. However if we use PWM inverter, the applied frequency
increases.
Dielectric losses are increasing with square of frequency [8]. Not only switching frequency of
inverter causes dielectric heating, but also voltage over-shots which are carried by far higher
frequency of the impulses and their resonance effect [9]. Consequences are at first faster
degradation - aging of insulation. And creation of another heat source inside machine that causes
rising temperature of winding compared with grid powered machine. This claim supports also [10].

DEPARTMENT OF POWER ELECTRICAL AND ELECTRONIC
ENGINEERING
Faculty of Electrical Engineering and Communication
Brno University of Technology
21
3 CURRENT IMBALANCE Current imbalance occurs in stator coils for many reasons. In the past it was usually taken
under consideration only in large machines (e.g. hydro-generators). Since application of inverters
and high speed motors, the knowledge about large machines started to be applied in low voltage
machines.
Current imbalance in stator is usually considered with high-speed machines [3], [11]–[13], [2],
[14]–[16], where high frequency of AC current creates a current displacement in conductor and
also affects nearby conductors. These effects may lead to creation of local hot-spots at winding.
We sometimes also use currents of higher frequencies in high torque machines with high number
of poles. This brings us very power-full torque and good rpm but may also lead to creation of hot-
spots.
In this chapter there will be examined all possible known effects that are influencing imbalance
of current - in one single conductor, in parallel strands of coil and between coils of stator winding.
3.1 Skin effect
An alternating current creates non-uniform distribution of current density in cross section of
conductor. The current has tendency to concentrate near the surface of conductor. With rising depth
of conductor, the current density is lowering. If the frequency of AC is very high, the current occurs
only in a very thin layer above the surface of conductor. This phenomenon is known as skin effect.
If we originate from Maxwell’s equations, it is possible to analyze the phenomena and describe
in analytical formulas same as in [17] at chapter 20. For simplicity there will be the phenomena
only in words described and final equations described.
Figure 2. 1 X-Y plane of conductor with skin effect [18]
At first we assume homogenous round conductor same as in Figure 2. 1 in x-y plane. On z axis
we can find current density vector J [A∙m-2], which is on Figure 2. 1 represented by colors: black
– maximum current density and white – minimum current density. There is also drawn skin depth
– δ. This term will be explained a few paragraphs lower.

DEPARTMENT OF POWER ELECTRICAL AND ELECTRONIC
ENGINEERING
Faculty of Electrical Engineering and Communication
Brno University of Technology
22
Figure 2. 2 Cause of skin effect[19]
According to Ampere’s law alternating current I creates alternating magnetic field H around
the conductor and also inside the conductor. When the intensity of AC changes the magnetic field
also changes. According to Faraday’s law the change of magnetic field will create counter-
electromotive force represented by eddy-currents Iw. Eddy currents are counter-reacting the main
current I, as we can see in the Figure 2. 2. This leads to current density displacement, exactly to
shifting of current from the center of conductor to the surface.
As mentioned in [17], after expression of Maxwell’s equations, we obtain analytical expression
(3.1 – 1) for the size of current density vector - J at any point of conductor.
𝐽 = 𝐽𝑆 ∙ 𝑒−𝑑𝛿 (3.1 – 1)
Where
d [m] is depth of the conductor
Jz [A∙m-2] is the size of current density vector at the surface of conductor
δ [m] is skin depth or depth penetration
e [-] is Euler’s number
Skin depth δ [m] is defined as depth where Js drops to 1/e (ca. 0.37) of its value. According to
[20] page 160, we assume that copper wires are good conductors, so we can use following analytical
formula (3.1 – 2) for skin depth calculation.
𝛿 = √2
𝜔𝜎𝜇 (3.1 – 2)
Where
ω [rad∙s-1] is angular frequency
σ [S∙m-1] is conductivity of conductor
μ [H∙m-1] is the multiple of vacuum permeability and relative permeability of material
DEPARTMENT OF POWER ELECTRICAL AND ELECTRONIC
ENGINEERING
Faculty of Electrical Engineering and Communication
Brno University of Technology
23
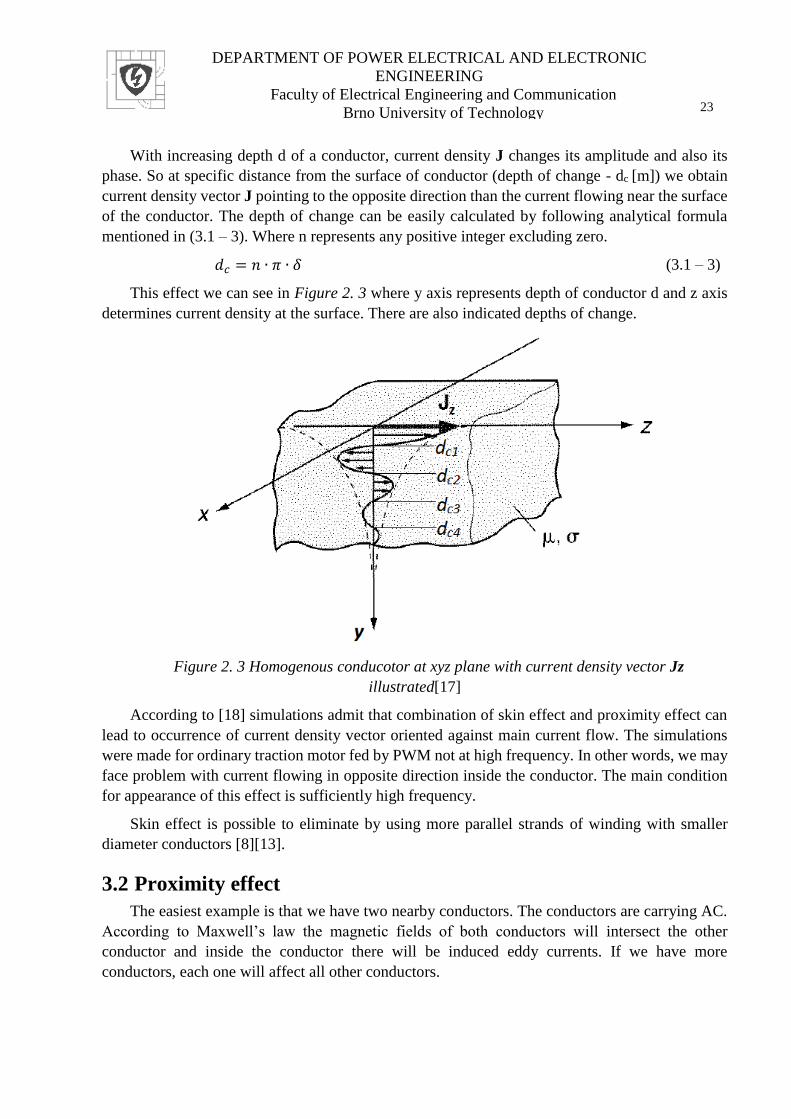
With increasing depth d of a conductor, current density J changes its amplitude and also its
phase. So at specific distance from the surface of conductor (depth of change - dc [m]) we obtain
current density vector J pointing to the opposite direction than the current flowing near the surface
of the conductor. The depth of change can be easily calculated by following analytical formula
mentioned in (3.1 – 3). Where n represents any positive integer excluding zero.
𝑑𝑐 = 𝑛 ∙ 𝜋 ∙ 𝛿 (3.1 – 3)
This effect we can see in Figure 2. 3 where y axis represents depth of conductor d and z axis
determines current density at the surface. There are also indicated depths of change.
Figure 2. 3 Homogenous conducotor at xyz plane with current density vector Jz
illustrated[17]
According to [18] simulations admit that combination of skin effect and proximity effect can
lead to occurrence of current density vector oriented against main current flow. The simulations
were made for ordinary traction motor fed by PWM not at high frequency. In other words, we may
face problem with current flowing in opposite direction inside the conductor. The main condition
for appearance of this effect is sufficiently high frequency.
Skin effect is possible to eliminate by using more parallel strands of winding with smaller
diameter conductors [8][13].
3.2 Proximity effect
The easiest example is that we have two nearby conductors. The conductors are carrying AC.
According to Maxwell’s law the magnetic fields of both conductors will intersect the other
conductor and inside the conductor there will be induced eddy currents. If we have more
conductors, each one will affect all other conductors.
DEPARTMENT OF POWER ELECTRICAL AND ELECTRONIC
ENGINEERING
Faculty of Electrical Engineering and Communication
Brno University of Technology
24
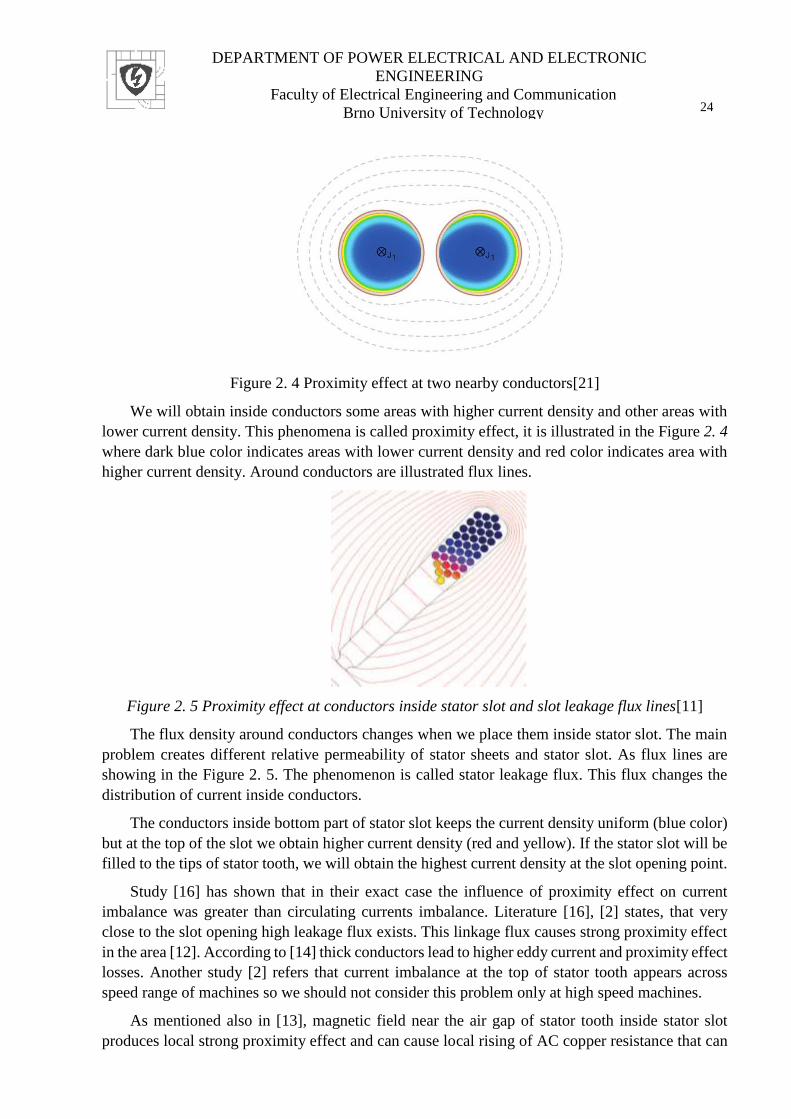
Figure 2. 4 Proximity effect at two nearby conductors[21]
We will obtain inside conductors some areas with higher current density and other areas with
lower current density. This phenomena is called proximity effect, it is illustrated in the Figure 2. 4
where dark blue color indicates areas with lower current density and red color indicates area with
higher current density. Around conductors are illustrated flux lines.
Figure 2. 5 Proximity effect at conductors inside stator slot and slot leakage flux lines[11]
The flux density around conductors changes when we place them inside stator slot. The main
problem creates different relative permeability of stator sheets and stator slot. As flux lines are
showing in the Figure 2. 5. The phenomenon is called stator leakage flux. This flux changes the
distribution of current inside conductors.
The conductors inside bottom part of stator slot keeps the current density uniform (blue color)
but at the top of the slot we obtain higher current density (red and yellow). If the stator slot will be
filled to the tips of stator tooth, we will obtain the highest current density at the slot opening point.
Study [16] has shown that in their exact case the influence of proximity effect on current
imbalance was greater than circulating currents imbalance. Literature [16], [2] states, that very
close to the slot opening high leakage flux exists. This linkage flux causes strong proximity effect
in the area [12]. According to [14] thick conductors lead to higher eddy current and proximity effect
losses. Another study [2] refers that current imbalance at the top of stator tooth appears across
speed range of machines so we should not consider this problem only at high speed machines.
As mentioned also in [13], magnetic field near the air gap of stator tooth inside stator slot
produces local strong proximity effect and can cause local rising of AC copper resistance that can

DEPARTMENT OF POWER ELECTRICAL AND ELECTRONIC
ENGINEERING
Faculty of Electrical Engineering and Communication
Brno University of Technology
25
lead to serious current displacement in the conductor and increased generation of heat. This effect
leads to creation of hot spots on winding [3], [2][25]. These areas should never exceed maximal
hot spot allowed temperature listed in chapter 2.2.1, Table 1. This could lead to premature aging
of insulation and its breakdown. But this is only one of many phenomenon that may lead to
premature breakdown.
In [12] there was suggested analytical formula for calculation of proximity effect losses (see
equation (3.2– 1). But in this formula there is not assumed reverse redistribution effect on the field
distribution.
𝑃𝑒 =𝜋 ∙ 𝑑4 ∙ 𝜔2 ∙ 𝐵𝑛
2
128 ∙ 𝜌𝑐 (3.2– 1)
Where d[m] is diameter of conductor, 𝜌𝑐[Ω∙m] is resistivity of conductor, Bn [T]and ω [rad∙s-
1] are peak value and angular velocity of flux density. So in general the formula of proximity effect
Pe[W∙m-1] says that proximity effect losses depends on copper area, frequency of electrical current
and flux density inside stator slot [18].
Literature [13] states, that proximity effect can be mitigated by transposing conductor strands.
In conclusion it is also mentioned that proximity losses are higher in active length of conductors
than in end winding. Different arrangement of conductors in stator slot and changes in space
between conductors can change current distribution inside the stator slot. It will lead to minimizing
the skin effect and proximity effect.
Another source [16] advises different techniques for proximity effect reduction:
lower PWM current frequency
change of stator tooth-tip shape
partial slot filling
design of winding with litz-wire (twisted wire)
Best literature to get into proximity effect problem in top part of winding is [18], where are
very clear results, what proximity effect does. Work includes also thermal simulation, authors
aimed for hot-spot areas on winding.
3.2.1 Parallel strands and proximity effect
Position of conductors inside every slot is very important to distribution of current. There were
conducted many studies [21] - [27] comparing different winding setup for high speed machines.
Due to high frequency of current almost every author compares AC to DC resistivity of wires. The
resistivity changes due to proximity effect near stator slot tooth tips.
Different arrangement of conductors inside slot plays a role [3] same as every different
winding arrangement of parallel strands in hand and turns of coils [2]. According to following
Figure 2. 6 and Table 2, there was conducted FEM analysis of current distribution. Measurement
of currents on real machine shown, that differences 10% are smaller. In summary of model authors
states, that field flux can be ignored due to great role of inductance and in consequence of small
field flux influence, there are no significant circulating currents.
DEPARTMENT OF POWER ELECTRICAL AND ELECTRONIC
ENGINEERING
Faculty of Electrical Engineering and Communication
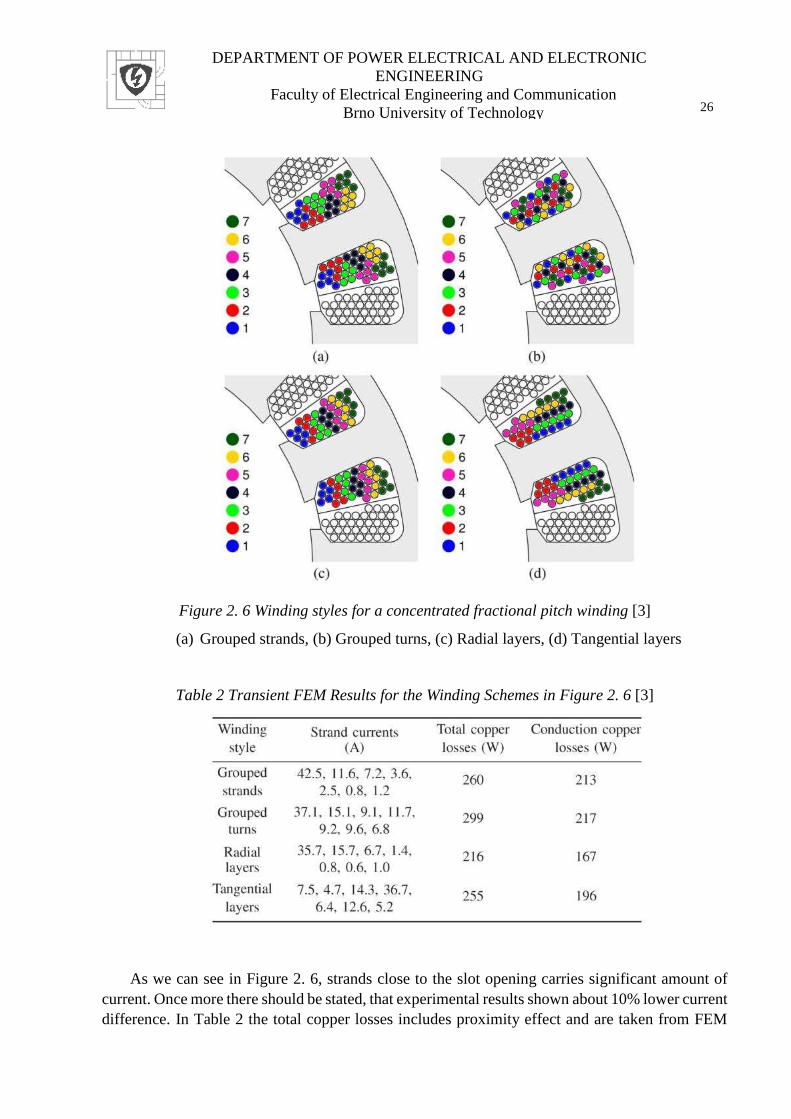
Brno University of Technology
26
Figure 2. 6 Winding styles for a concentrated fractional pitch winding [3]
(a) Grouped strands, (b) Grouped turns, (c) Radial layers, (d) Tangential layers
Table 2 Transient FEM Results for the Winding Schemes in Figure 2. 6 [3]
As we can see in Figure 2. 6, strands close to the slot opening carries significant amount of
current. Once more there should be stated, that experimental results shown about 10% lower current
difference. In Table 2 the total copper losses includes proximity effect and are taken from FEM
DEPARTMENT OF POWER ELECTRICAL AND ELECTRONIC
ENGINEERING
Faculty of Electrical Engineering and Communication
Brno University of Technology
27
program. Conduction copper losses are calculated from resistances and currents. Authors speaks
about possibility of creation of hot-spots on winding, but no thermal analysis was conducted.
So arrangement of conductors inside slot will have an influence on current distribution and
consequently to distribution of temperature inside stator slot. There should be pointed, that number
of parallel strands also has an effect.
3.3 Permanent magnet - winding eddy currents
While using closed slot design as we can see in Figure 2. 5 or Figure 2. 6, we obtain some
leakage flux through stator slot due to closing angle of slot and also slot tooth tips. On the other
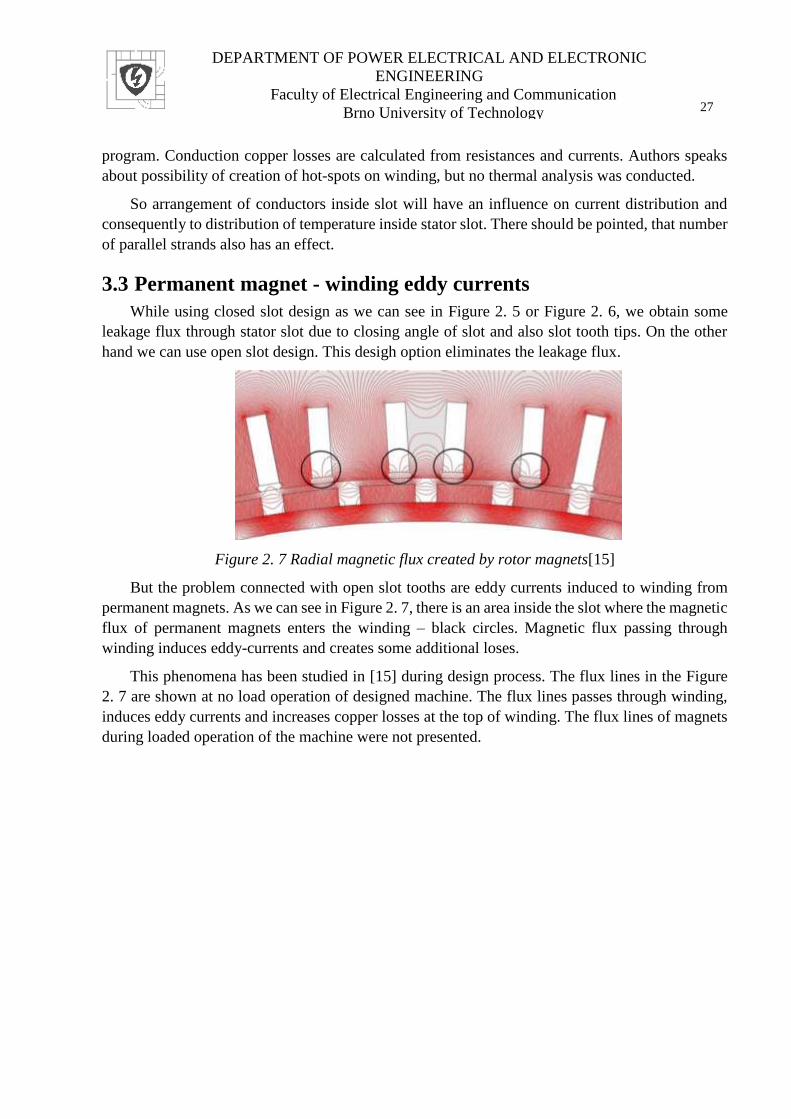
hand we can use open slot design. This desigh option eliminates the leakage flux.
Figure 2. 7 Radial magnetic flux created by rotor magnets[15]
But the problem connected with open slot tooths are eddy currents induced to winding from
permanent magnets. As we can see in Figure 2. 7, there is an area inside the slot where the magnetic
flux of permanent magnets enters the winding – black circles. Magnetic flux passing through
winding induces eddy-currents and creates some additional loses.
This phenomena has been studied in [15] during design process. The flux lines in the Figure
2. 7 are shown at no load operation of designed machine. The flux lines passes through winding,
induces eddy currents and increases copper losses at the top of winding. The flux lines of magnets
during loaded operation of the machine were not presented.
DEPARTMENT OF POWER ELECTRICAL AND ELECTRONIC
ENGINEERING
Faculty of Electrical Engineering and Communication
Brno University of Technology
28
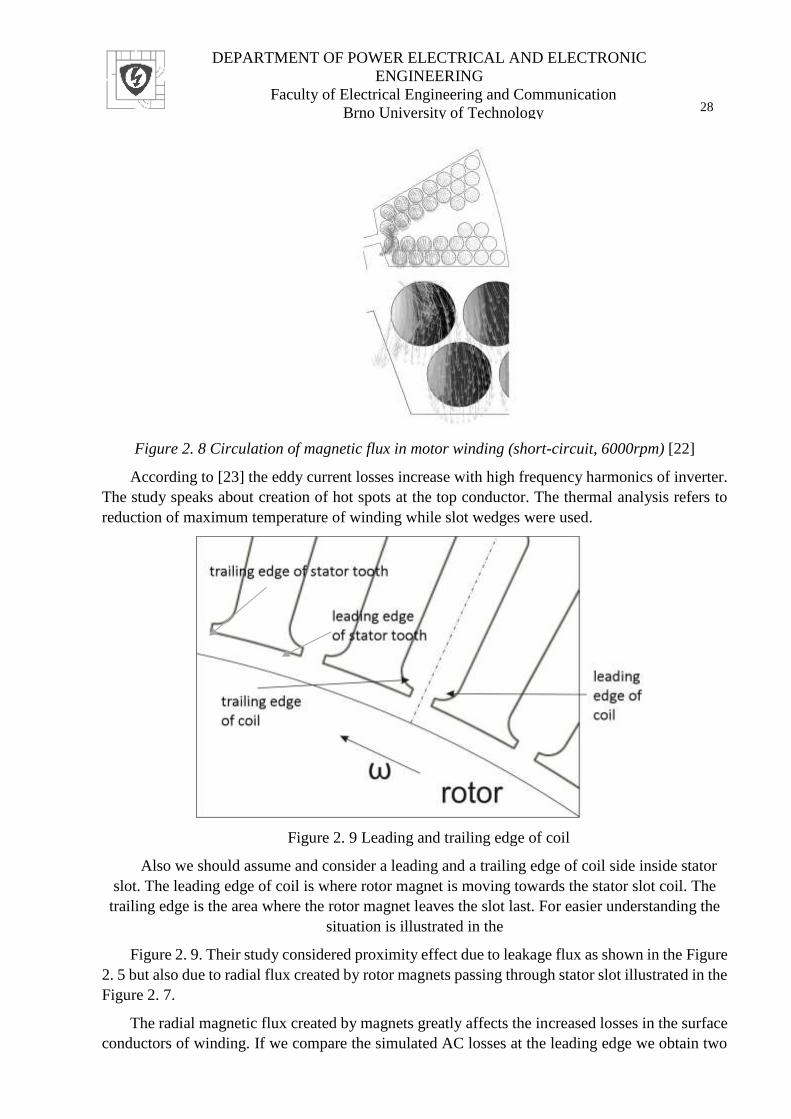
Figure 2. 8 Circulation of magnetic flux in motor winding (short-circuit, 6000rpm) [22]
According to [23] the eddy current losses increase with high frequency harmonics of inverter.
The study speaks about creation of hot spots at the top conductor. The thermal analysis refers to
reduction of maximum temperature of winding while slot wedges were used.
Figure 2. 9 Leading and trailing edge of coil
Also we should assume and consider a leading and a trailing edge of coil side inside stator
slot. The leading edge of coil is where rotor magnet is moving towards the stator slot coil. The
trailing edge is the area where the rotor magnet leaves the slot last. For easier understanding the
situation is illustrated in the
Figure 2. 9. Their study considered proximity effect due to leakage flux as shown in the Figure
2. 5 but also due to radial flux created by rotor magnets passing through stator slot illustrated in the
Figure 2. 7.
The radial magnetic flux created by magnets greatly affects the increased losses in the surface
conductors of winding. If we compare the simulated AC losses at the leading edge we obtain two
DEPARTMENT OF POWER ELECTRICAL AND ELECTRONIC
ENGINEERING
Faculty of Electrical Engineering and Communication
Brno University of Technology
29
times bigger losses than at the trailing edge of slot opening. According to the authors [22] this
higher ac losses can produce localized hot spots leading to the failure. The current imbalance of
the leading and trailing edge due to rotor motion were also investigated at [15] so the problem of
leading and trailing edge occurs at closed stator slot and also at open stator slot.
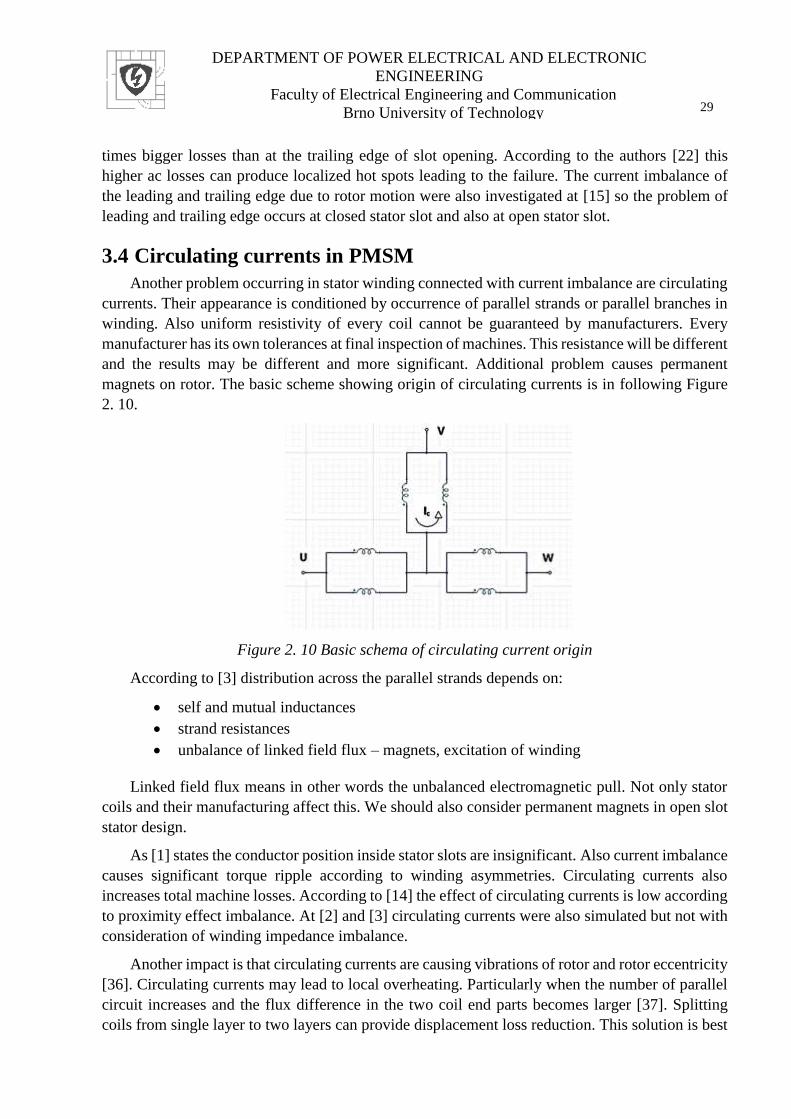
3.4 Circulating currents in PMSM
Another problem occurring in stator winding connected with current imbalance are circulating
currents. Their appearance is conditioned by occurrence of parallel strands or parallel branches in
winding. Also uniform resistivity of every coil cannot be guaranteed by manufacturers. Every
manufacturer has its own tolerances at final inspection of machines. This resistance will be different
and the results may be different and more significant. Additional problem causes permanent
magnets on rotor. The basic scheme showing origin of circulating currents is in following Figure
2. 10.
Figure 2. 10 Basic schema of circulating current origin
According to [3] distribution across the parallel strands depends on:
self and mutual inductances
strand resistances
unbalance of linked field flux – magnets, excitation of winding
Linked field flux means in other words the unbalanced electromagnetic pull. Not only stator
coils and their manufacturing affect this. We should also consider permanent magnets in open slot
stator design.
As [1] states the conductor position inside stator slots are insignificant. Also current imbalance
causes significant torque ripple according to winding asymmetries. Circulating currents also
increases total machine losses. According to [14] the effect of circulating currents is low according
to proximity effect imbalance. At [2] and [3] circulating currents were also simulated but not with
consideration of winding impedance imbalance.
Another impact is that circulating currents are causing vibrations of rotor and rotor eccentricity
[36]. Circulating currents may lead to local overheating. Particularly when the number of parallel
circuit increases and the flux difference in the two coil end parts becomes larger [37]. Splitting
coils from single layer to two layers can provide displacement loss reduction. This solution is best
DEPARTMENT OF POWER ELECTRICAL AND ELECTRONIC
ENGINEERING
Faculty of Electrical Engineering and Communication
Brno University of Technology
30
of calculated options. Using of two layer winding increases efficiency and decreases current
displacement losses [26].
4 THERMAL MECHANICS There are two basic areas of thermal mechanics - thermodynamics and thermokinetics.
Thermodynamics observes phenomenon of heat and work and a result of interaction between
a system and its surrounding. In thermodynamics we assume steady states at the beginning and end
of a thermal event. Thermodynamics works on basis of temperature gradient and temperature
balance of system and its surrounding. Every system in nature tries to reach its lowest possible
potential.
Thermokinetics is dealing with the heat transfers its self. Under this paragraph, there are three
basic mechanisms of heat transfer. This mechanisms will be discussed individually in subchapter
4.1.2.
Conduction
Convection
Radiation
This physics tools will be used in simplified form after acceptance of some restrictive
conditions for evaluation of temperature inside winding. This conditions will be listed by every
analytical calculation or simulation of the machine. Chapter 4 and subchapters deals only with basic
theory.
4.1 Heat and Temperature
There are two basic physics quantities – heat and temperature - that should be explained at the
beginning. Heat or in other words thermal energy is inner energy of an object. This energy is total
kinetic energy of random motion of all atomic particles inside the object.
𝑄 = 𝑚 ∙ 𝑐 ∙ 𝑇 ∆ (4.1-1)
In equation (4.1-1) letter 𝑄 indicates quantity of heat inside an object. Basic unit of heat
quantity is Joule [J], 𝑚 [kg] describes mass of the object, 𝑇 ∆ [K] is difference of temperatures
before heat income or outcome and 𝑐 [J∙kg-1∙K-1] is specific heat capacity [27].
From electro-technical point of view, we can calculate heat as a “Joule heating” created by
current flowing through an electric conductor. This heat is produced by interactions of moving
electrons of electric current with static electron shells of atoms. It leads to generation of heat inside
every conductor. This heat can be calculated by following formula (4.1-2) called Joule’s law.[28]
𝑄 = 𝑅 ∙ 𝐼2 ∙ 𝑡 (4.1-2)
The other basis physics quantity is temperature. Temperature informs us about absolute
thermal state of a mass. If we measure a temperature, it is measured the average kinetics energy of
particles inside the mass. When temperature of an object rises, the object receives energy from the
surroundings. This phenomena is called heating. Opposite effect is called cooling, the object
decreases its temperature and emits the energy to the surroundings.

DEPARTMENT OF POWER ELECTRICAL AND ELECTRONIC
ENGINEERING
Faculty of Electrical Engineering and Communication
Brno University of Technology
31
Temperature is labeled by letter T and the basic unit is 1 Kelvin [K]. The lowest possible
temperature is 0 K. This temperature is absolute zero point. We cannot reach this temperature, but
it is possible to get very close to this temperature point. According to [29], there are no physical
laws that would limit the upper possible temperature.
In 3 dimensional coordinate system, the temperature is function of position and time, as we
can see in the equation (4.1-3). This thermal field can be time dependent or time independent –
stationary considering the variation of temperature in time.
𝑇 = 𝑓(𝑥, 𝑦, 𝑧, 𝑡) (4.1-3)
4.1.1 Temperature scales
Celsius scale
Commonly used temperature scale was created by Andrea Celsius in 1742. It was derived by
two points of water. Temperature for freeze of water was set to 0 °C and temperature for boiling of
water was set to 100°C. The scale was divided to 100 parts.
Nowadays the Celsius scale is derived in the same way. 0°C is defined as a point created by
mixture of chemically pure ice and water at a pressure of 101 325 Pa. 100°C is defined as mixture
of chemically pure water and saturated stream at a pressure of 101 325 Pa [28]. Conversion of
temperature between scales is given in equation (4.1-4).
𝑇[°𝐶] = 𝑇[𝐾] − 273,15 (4.1-4)
Kelvin scale
William Thomson created Kelvin scale. The name of this scale is derived from his rise to the
nobility - Lord Kelvin. First point of this scale is 0 K. This point represents the lowest defined
temperature. The second point is triple point of water that represents 273,16 [27][29]. Parts of
Kelvin and Celsius scales are the same so 1 °C = 1 K.
4.1.2 Fourier’s Law
The basic law of heat conduction was established by Fourier in 1822. The law states, that “the
heat flux resulting from thermal conduction is proportional to the magnitude of the temperature
gradient and opposite to it in sign” [30].
Figure 3. 1 Illustration of Fourier’s Law [28]
DEPARTMENT OF POWER ELECTRICAL AND ELECTRONIC
ENGINEERING
Faculty of Electrical Engineering and Communication
Brno University of Technology
32
When this law is expressed by equation (4.1-5) below. For better understanding of basic
thermal problem setting and analysis see Figure 3. 1.
𝑞𝑥⃗⃗⃗⃗ = −𝜆 ∙𝑑𝑇
𝑑𝑥
(4.1-5)
Where 𝑞𝑥⃗⃗⃗⃗ is vector of heat flux [W∙m-2] in positive x direction, 𝜆 represents thermal
conductivity of the material [W∙m-1∙K-1] and dT/dx is temperature gradient in the direction of heat
flow [K∙m-1].
Fourier’s equation is valid for gas, solid and liquid materials. According to this law we can
also establish thermal conductivity 𝜆 of a material. This law calculates with no internal heat
generation of material and assumes linear temperature gradient inside material and steady state
thermal conduction.
4.1.3 Thermal Conductivity
Thermal conductivity represents ability of a material to conduct heat. This ability is evaluated
in term of Fourier’s Law. As mentioned above in equation (4.1.2-1) it is denoted by 𝜆 and common
units are [W∙m-1∙K-1]. This parameter of a material depend on temperature, pressure and
homogeneity of the material.
In [28] chapter 4.2 there was conducted FEM Steady State Thermal simulation of copper plate
on elementary example – same as in Figure 3. 1 with ΔT from 20 to 140 K. First simulation was
conducted with constant copper thermal conductivity and second simulation was conducted with
temperature-dependent thermal conductivity coefficient. The difference ΔQ between simulations
was 0.01%. In conclusion of chapter author stathes, that for copper winding inside a machine it is
pointless to use temperature-dependent thermal conductivity coefficient, because mistake of
simulation method can be much larger.
4.1.4 Specific Heat Capacity
Specific heat capacity is property of matter. This physical quantity says, how much heat we
have to add to an object of weight 1 kg from specific material, to rise its temperature for 1 K, as
mentioned in equation (4.1-6) where m represents mass of matter [kg]. For marking the specific
heat capacity we use symbol c and commonly used units are [J∙kg-1∙K-1].
𝑐 =𝑄
𝑚 ∙ 𝑇∆
(4.1-6)
The heat is stored in vibration of molecules. It depends on the inner structure of material and
degrees of freedom of atoms its structure. The other way of heat storage is in motion of whole
molecules inside matter.
There should be also mentioned, that specific heat capacity is temperature dependent. But
according to [28] another small simulation experiment, there is negligible influence on thermal
simulation of the machine also.

DEPARTMENT OF POWER ELECTRICAL AND ELECTRONIC
ENGINEERING
Faculty of Electrical Engineering and Communication
Brno University of Technology
33
4.1.5 Temperature Coefficient of Resistance
Its symbol is Greek letter 𝛼𝑇 [K-1] and temperature coefficient of resistance is usually assumed
to be constant for specific temperature range. Usually is this coefficient standardized to temperature
of 20 °C [31]. Coefficient is derived in equation (4.1-7) for calculation of resistance change due to
temperature change of a material.
𝛼𝑇 =
𝑅∆
𝑅0 ∙ 𝑇∆
(4.1-7)
Where 𝑅∆ means change in resistance due to change of temperature 𝑇∆
, 𝑅0 indicates resistance
at the beginning temperature. Modified equation will be used for evaluation of resistivity of
chopper wire inside winding.
Commonly used value for temperature coefficient of resistance for copper 20°C is
0.0039 [K-1]. Literature [32] uses value 0.003862 [K-1].
4.2 Heat Transfer
There are several ways of heat transfer from winding to the surroundings. In future simulations
and calculations we will neglect some heat transfer paths of machine. Conduction of heat through
shaft will be neglected. We will assume stationary heat source, so we can avoid time difficult
transient analysis. Also according to the type of simulation we will neglect end windings and just
simulate stator slot. Another assumption is perfect symmetry of machine and heat transfer only in
radial direction.
Cooling is mostly done by conduction through stator parts and then by radiation and
convection to surrounding area in machines with natural cooling system. We have also machines
with active cooling system, mostly is used inner or outer air ventilation [33]. But we can also have
water cooling inside of machine.
4.2.1 Conduction
From physical point of view, conduction is propagation of vibrations from one atom to another.
During conduction the atoms only change its vibration but stay in their original position. This type
of heat transfer is common for solid materials.
Conduction is important inside stator. Due to conduction heat permeates from winding through
insulation to stator slot sheets and then heads out of the machine. For conduction literature [33]
gives us some basic equations for easy understanding.
For temperature drop 𝜗∆ evaluation in homogenous material we can use:
𝜗 =∆ ∆𝑃 ∙ 𝑅𝜗 =
∆𝑃 ∙ 𝑙
𝜆 ∙ 𝑆
(4.2-1)
Where
∆𝑃 = ∫𝑞 ∙ 𝑑𝑆
𝑆
= ∫−𝜆 ∙ 𝑔𝑟𝑎𝑑𝑇 ∙ 𝑑𝑆
𝑆
(4.2-2)
DEPARTMENT OF POWER ELECTRICAL AND ELECTRONIC
ENGINEERING
Faculty of Electrical Engineering and Communication
Brno University of Technology
34
Equation (4.2-1) represents basic thermal equation, where 𝜗∆ [°C] represents temperature drop,
𝑅𝜗 [K∙W-1] is thermal resistance and ∆𝑃 [W] is heat flow. The thermal resistance can be further
calculated from l [m] thickness of material, S [m2] surface of material and 𝜆 [W∙m-1∙K-1] thermal
conductivity of material.
In (4.2-2) we further describe heat flow as function of heat 𝑞 [W∙m-2] flowing through bounded
surface of material, where heat can be expressed from equation (4.1-5).
4.2.2 Convection
Convection is caused by motion of atoms from their original position to another position. This
means that the matter must have inside free atoms. During convection the heat is transferred with
flow of substance – liquid or gas.
In steady state we can use equation (4.2-3) for evaluation of convection:
𝑃 = 𝛼𝑐 ∙ 𝐴∆ ∙ ∆𝑇 (4.2-3)
Where 𝑃∆ [W] represents amount of heat generated inside assumed area 𝐴 [m2] of machine
and 𝛼𝑐[W∙m-2∙K-1] heat transfer coefficient. Evaluation of heat transfer coefficient is quite
challenging problem.
According to the origin of flow, there are two types of convection. First one is natural
convection. Created in natural way close to any hot surface. There are factors influencing this
convection like shape of the object and temperature of the object. According to literature [33] we
can assume heat transfer coefficient for natural convection stated in equation (4.2-4), where 𝛼𝑛𝑐
[W∙m-2∙K-1] is heat transfer coefficient for natural cooling.
𝛼𝑛𝑐 = 6.5 + 0.05 ∙ ∆𝑇 (4.2-4)
Forced convection or in other words heat advection is provided by an object that moves with
the fluid. Usually a fan or pump is used. This increases heat exchange a lot. For example fluid
radiator systems are sometimes used. Forced convection is far more efficient than natural
convection.
4.2.3 Radiation
If we speak about thermal radiation, we speak about electromagnetic radiation of specific wave
length. Thermal radiation wave lengths are between 0.1 μm and 100 μm. This range also includes
visible light spectrum between 0.4 and 0.8 μm [28]. So most of thermal radiation happens in
infrared electromagnetic spectrum.
Every object with higher temperature than 0 K radiates electromagnetic energy to its
surrounding and also accepts radiated electromagnetic energy from other objects. This energy is
radiated and accepted through surface of the object and defined by Stephan-Boltzmann law.
Following equation does not assume back-reflected waves from the surface of machine.
𝑃 = 𝜎 ∙ 휀 ∙ 𝐴 ∙ (𝑇04
∆ − 𝑇4) (4.2-5)

DEPARTMENT OF POWER ELECTRICAL AND ELECTRONIC
ENGINEERING
Faculty of Electrical Engineering and Communication
Brno University of Technology
35
Where 𝜎 = 5.6703 ∙ 10−8 [W∙m-2∙K-4] represents Stephan-Boltzmann constant, T [K] is
temperature of surface of the object and 𝑇0 [K] is temperature of distant surrounding and 𝐴 [m2] is
surface of considered machine that radiates electromagnetic waves.
Emissivity ε [-] is a number between 0 and 1, where 1 is emissivity of ideal black surface at
the given temperature. Closely the Black body radiation is described by Stefan-Boltzmann law.
Emissivity of every other material is smaller than emissivity of the ideal black surface. For 0 we
assume ideally white surface that emits no thermal radiation. Emissivity gives us information about
effectiveness of emitting energy in form of radiation form an object.
Emissivity is changing not only with material, the most important is surface finish. For
example emissivity of aluminum foil is 0.03 compared with anodized aluminum 0.9 makes a model
example [34]. Another example is polished copper – 0.04 and rough copper 0.91. Black paint has
emissivity around 0.9 [34].
Objects with lower emissivity than 0.2 are difficult to measure with infrared thermometer
because of their high reflectivity [29].
For practical purpose we usually use following equation:
𝑃 = 𝛼𝑟 ∙ 𝐴∆ ∙ 𝑇∆
(4.2-6)
Where 𝛼𝑟 [W∙m-2∙K-1] represents radiative heat transfer coefficient.
4.3 Thermal properties of materials for simulations
According to given insulation system of the simulated machine H = 180°C (for more see
chapter 2.2.1) were found the closest material properties.
4.3.1 Copper
According to [35], thermal conductivity of copper is listed for 380 [W∙m-1∙K-1] but there was
no specified temperature .
Source [36] gave us better answer. According to this study for thermal fusion related materials,
for 450 [K] is given thermal conductivity 389.93 [W∙m-1∙K-1] and specific heat capacity
403 [J∙kg-1∙K-1].
4.3.2 Sheets, Magnets
According to isovac® data sheet for M470-50A stator and rotor sheets, their material has
thermal conductivity 33 [W∙m-1∙K-1].
For permanent magnets N38UH on rotor was found thermal conductivity 7.6 [W∙m-1∙K-1] at
company list Arnold Magnetic Technologies. Both materials suits to range given in [5].
4.3.3 Ground-wall insulation
Ground-wall insulation thermal conductivity is simple to evaluate. According to this article
[37] there are two main variables. First is of course type of material and the second one is density
of the material. According to the experiment due to change of ground-wall insulation from
Nomex® N_410 with thermal conductivity 0.139 [W∙m-1∙K-1] to ArPaxX with thermal conductivity
0.25 [W∙m-1∙K-1], there was increased current in winding and also torque by 5% due to better
DEPARTMENT OF POWER ELECTRICAL AND ELECTRONIC
ENGINEERING
Faculty of Electrical Engineering and Communication
Brno University of Technology
36
thermal properties of insulation [37]. In result the temperatures in winding of machines with both
insulations were the same.
Also article [38] reports great improvements of efficiency + 0.7% due to improvement of
thermal conductivity of ground-wall insulation. There were also copper loss reduction, winding
temperature reduction and iron loss reduction. This effect was obvious on thermal conductivity
improvement from 0.16 to 0.308 [W∙m-1∙K-1].
DuPont™ also produces polyimide film ground-wall insulation with better thermal
conductivity. Their product [39] has thermal conductivity 0.46 [W∙m-1∙K-1].
So usage of same material with higher density brings us better thermal conductivity. This
supports also [40], where different thicknesses of the same material have different thermal
conductivities. For our machine according to [40] and insulation thickness was linearly
approximated thermal conductivity 0.164 [W∙m-1∙K-1].
4.3.4 Copper wire coating
Copper wire coating used in machine consists of two layers. As basecoat there is used theic
polyester and as overcoat there is layer of polyamide imide. Thermal class of copper wire is 200.
Due to very small thickness of copper wire coating we will assume only one layer of coating
with worst thermal properties. It is very difficult to obtain precise data for polyamide imide, where
many different literature sources defines thermal conductivity between 0.1 – 0.3 [W∙m-1∙K-1].
Higher density of theic-polyester indicates better thermal conductivity, so we will assume only
copper wire coating consisted from polyamide imide.
Small thickness of coating wire and information provided in, there was chosen thermal
conductivity 0.17 [W∙m-1∙K-1].
4.3.5 Impregnating resin
For impregnation of machine is used Voltatex® resin consisting of unsaturated polyester
imide. Thermal conductivity according to technical list is 0.23 [W∙m-1∙K-1] and temperature index
of resin is 220°C.
In technical list there was not given specific heat capacity of the material. According to [41]
polyimide heat capacity for temperature 177 °C is 2000 [J∙kg-1∙K-1]. Another source [42] measured
1651 [J∙kg-1∙K-1] at temperature 175 °C for a bit different material.
Novel approach to problem of thermal conductivity of impregnating resins has brought idea of
enrichment with nanoparticles. If we enrich impregnating resin with nanoparticles the thermal
conductivity rises. For example literature [43] states thermal conductivity of resins up to
5 [W∙m-1∙K-1]. That is 20 times more than standard used one resin has. Article [44] states, that
without Nano fillers the thermal conductivity is up to 0,3 [W∙m-1∙K-1]. Another approach is usage
of silicone resins, they resistance to thermal aging is excellent, but they have low thermal
conductivity – around 0.2 [W∙m-1∙K-1].

DEPARTMENT OF POWER ELECTRICAL AND ELECTRONIC
ENGINEERING
Faculty of Electrical Engineering and Communication
Brno University of Technology
37
5 ELECTRO-MAGNETIC SIMULATIONS Technical documentation of simulated machine was provided by manufacturer. For protection
of their know-how, model type and design sheets of existing machine, the results of electrical part
in Maxwell – like induced voltage or torque are multiplied by random constant. Percentage
comparison with manufacturer’s data sheet is not changed. Current, losses and thermal analysis
results were not changed. Temperatures of winding from type testing of machine were not provided
by manufacturer.
There should be presented two different models built in FEM processing programs. In Ansys
Maxwell there are build models of whole machine including all possible losses. On the other hand
there was also build simple model in FEMM for verification of results and comparison of these
two FEM processing programs.
Both models are built in 2D modelers with setting of model depth equal with stator packet
length. According to coil pitch is equal to 1, in every simulation and analytical calculation are
neglected end windings. For simulations was chosen temperature 165 °C in winding for calculation
of copper resistance according to Table 1 and designed insulation class.
5.1 Ansys MAXWELL – Current Simulation - Nominal power
5.1.1 Parametric model
According to literature search – chapter 3.3 about permanent magnet winding eddy-currents,
it was decided to build parametric model of machine for future optimization of stator tooth tip
height due to these eddy currents. Documents about parametrization of machine are in Attachment
A.
Figure 4. 1 Parametric model of machine scripted in Visual Basic Script
According to the parametrization of model there was build a ∙.vbs – Visual Basic Script for
Ansys Maxwell for building a parametrical model. In Figure 4. 1, we can see final model of chosen
machine including ground-wall insulation.

DEPARTMENT OF POWER ELECTRICAL AND ELECTRONIC
ENGINEERING
Faculty of Electrical Engineering and Communication
Brno University of Technology
38
Figure 4. 2 Winding inside stator slot including wire coating insulation
According to diameter of conductors there was build a parametric model that allowed us to
change spacing between conductors, diameter of wire and also position of whole winding inside
stator slot. Copper wire illustrated in Figure 4. 2 has two color – red and blue. This means the coils
are wound from two parallel strands (bifilar winding). Coating of copper wires and ground-wall
insulation was suppressed in electro-magnetic models to reduce solution time.
5.1.2 Setup of winding
In random wound machine it is very difficult to simulate distribution of conductors. It is given
by manufacturing process. Conductors are wound on winding machine, after that they are being
manipulated and transported for inserting to stator slots. During this process the conductors of coil
are moving freely in the bound. Due to this random motion of conductor in bound during
manufacturing process it is impossible to find any sequence for distribution of them in stator slot.
We simulated three possible cases. In compare with Figure 2. 6 simulated machine has only two
parallel strands in winding. So we should expect smaller proximity effect and circulating currents.
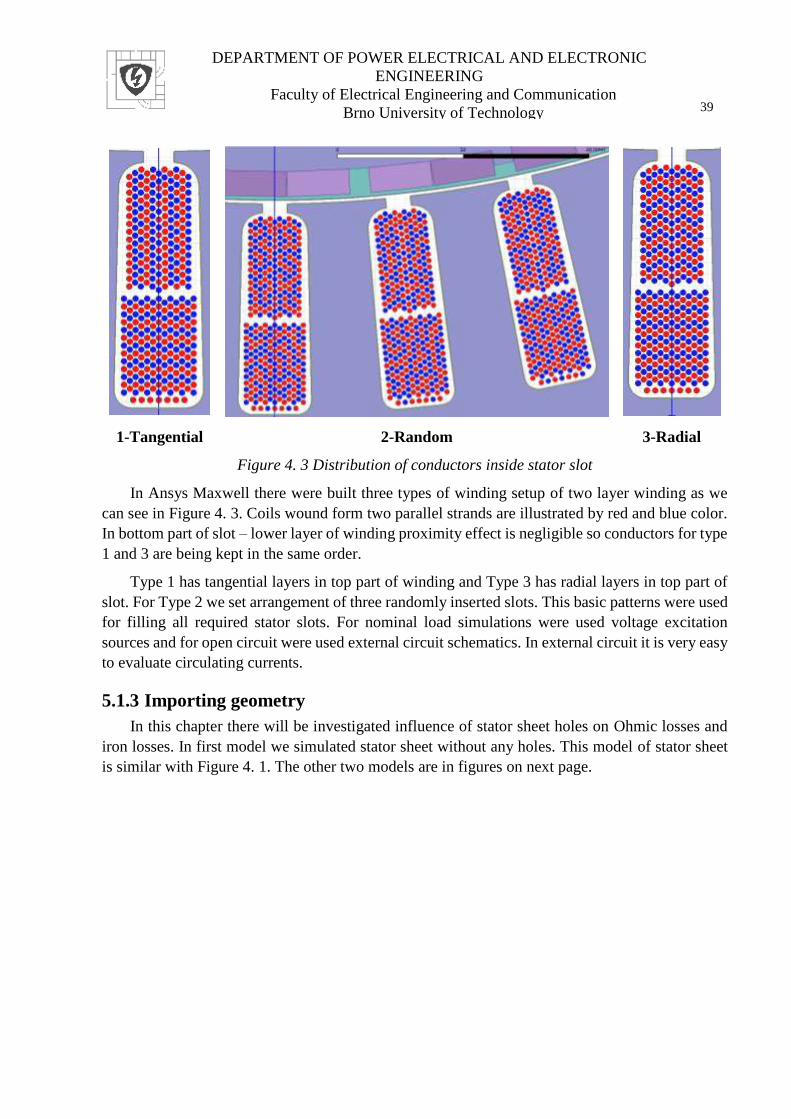
DEPARTMENT OF POWER ELECTRICAL AND ELECTRONIC
ENGINEERING
Faculty of Electrical Engineering and Communication
Brno University of Technology
39
1-Tangential 2-Random 3-Radial
Figure 4. 3 Distribution of conductors inside stator slot
In Ansys Maxwell there were built three types of winding setup of two layer winding as we
can see in Figure 4. 3. Coils wound form two parallel strands are illustrated by red and blue color.
In bottom part of slot – lower layer of winding proximity effect is negligible so conductors for type
1 and 3 are being kept in the same order.
Type 1 has tangential layers in top part of winding and Type 3 has radial layers in top part of
slot. For Type 2 we set arrangement of three randomly inserted slots. This basic patterns were used
for filling all required stator slots. For nominal load simulations were used voltage excitation
sources and for open circuit were used external circuit schematics. In external circuit it is very easy
to evaluate circulating currents.
5.1.3 Importing geometry
In this chapter there will be investigated influence of stator sheet holes on Ohmic losses and
iron losses. In first model we simulated stator sheet without any holes. This model of stator sheet
is similar with Figure 4. 1. The other two models are in figures on next page.

DEPARTMENT OF POWER ELECTRICAL AND ELECTRONIC
ENGINEERING
Faculty of Electrical Engineering and Communication
Brno University of Technology
40
A B
Figure 4. 4 A - Hybrid magnetic circuit type, B – Full magnetic circuit
In Figure 4. 4 A and B there are two types of holes in stator sheet. The problem with setting
of holes to model was different symmetry of water cooling system (triangular rounded holes) and
symmetry of electrical circuit.
In hybrid magnetic model there is one more round hole due to symmetry of electric model, but
the position of water cooling responds almost real machine. On the other hand in full magnetic
model there is whole pattern of stator holes, but it repeats more often than in real stator.
The results from Ohmic loss, core loss and current distribution in worst conductor were
compared. The results of core losses are listed in following Table 3 influence of magnetic circuit
changes was so small, that there was no influence on current distribution or Ohmic losses. Current
distribution in worst conductor will be closely described in chapter 5.1.4. Jz in worst conductor
was measured as maximum reached value.
In view of the fact that we want to verify possibility of creation of hot spots, it was chosen
Hybrid magnetic circuit type - the type of model with greatest RMS value of current in leading
edge of coil.
Table 3 Comparison of stator sheets designs
Core loss [W]
Without holes 400
Hybrid circuit 402
Full magnetic circuit 407
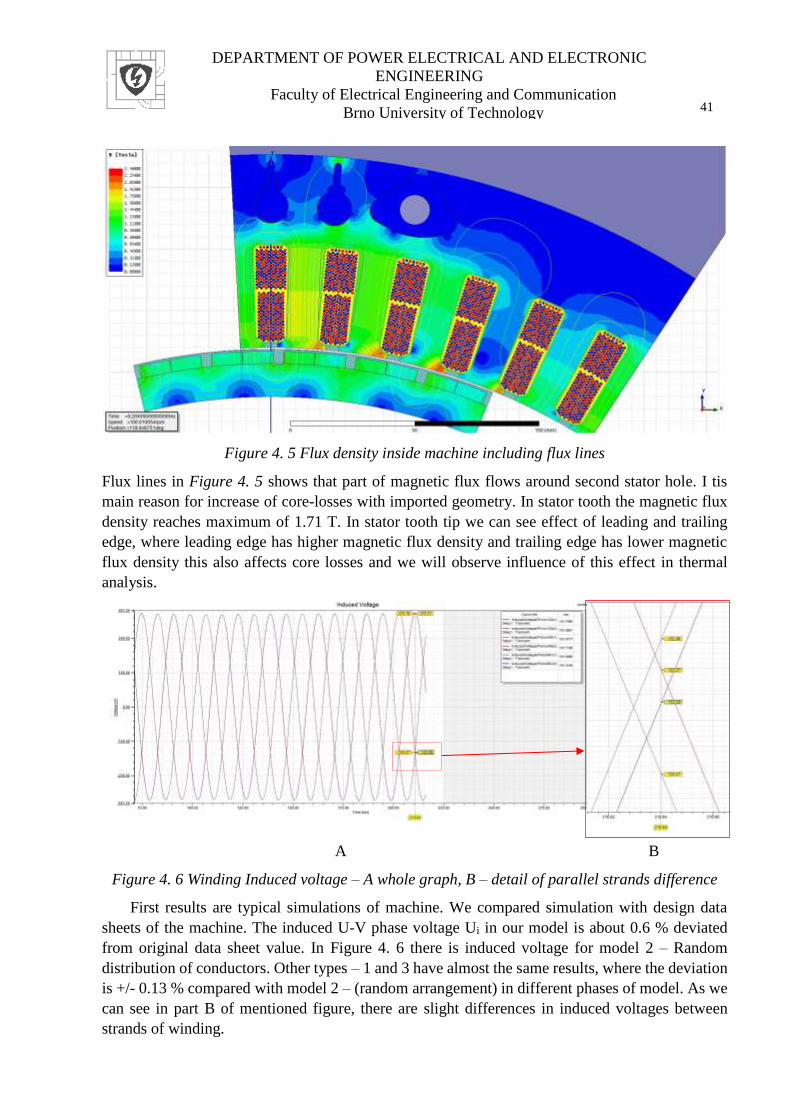
DEPARTMENT OF POWER ELECTRICAL AND ELECTRONIC
ENGINEERING
Faculty of Electrical Engineering and Communication
Brno University of Technology
41
Figure 4. 5 Flux density inside machine including flux lines
Flux lines in Figure 4. 5 shows that part of magnetic flux flows around second stator hole. I tis
main reason for increase of core-losses with imported geometry. In stator tooth the magnetic flux
density reaches maximum of 1.71 T. In stator tooth tip we can see effect of leading and trailing
edge, where leading edge has higher magnetic flux density and trailing edge has lower magnetic
flux density this also affects core losses and we will observe influence of this effect in thermal
analysis.
A B
Figure 4. 6 Winding Induced voltage – A whole graph, B – detail of parallel strands difference
First results are typical simulations of machine. We compared simulation with design data
sheets of the machine. The induced U-V phase voltage Ui in our model is about 0.6 % deviated
from original data sheet value. In Figure 4. 6 there is induced voltage for model 2 – Random
distribution of conductors. Other types – 1 and 3 have almost the same results, where the deviation
is +/- 0.13 % compared with model 2 – (random arrangement) in different phases of model. As we
can see in part B of mentioned figure, there are slight differences in induced voltages between
strands of winding.
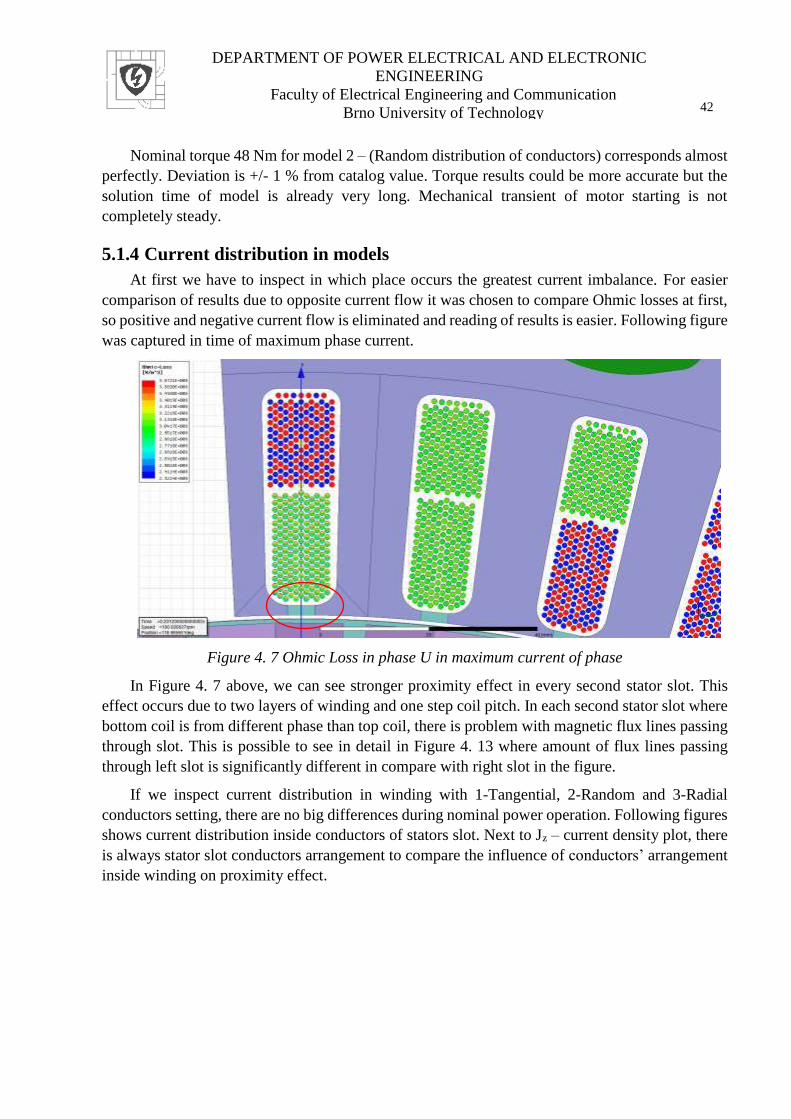
DEPARTMENT OF POWER ELECTRICAL AND ELECTRONIC
ENGINEERING
Faculty of Electrical Engineering and Communication
Brno University of Technology
42
Nominal torque 48 Nm for model 2 – (Random distribution of conductors) corresponds almost
perfectly. Deviation is +/- 1 % from catalog value. Torque results could be more accurate but the
solution time of model is already very long. Mechanical transient of motor starting is not
completely steady.
5.1.4 Current distribution in models
At first we have to inspect in which place occurs the greatest current imbalance. For easier
comparison of results due to opposite current flow it was chosen to compare Ohmic losses at first,
so positive and negative current flow is eliminated and reading of results is easier. Following figure
was captured in time of maximum phase current.
Figure 4. 7 Ohmic Loss in phase U in maximum current of phase
In Figure 4. 7 above, we can see stronger proximity effect in every second stator slot. This
effect occurs due to two layers of winding and one step coil pitch. In each second stator slot where
bottom coil is from different phase than top coil, there is problem with magnetic flux lines passing
through slot. This is possible to see in detail in Figure 4. 13 where amount of flux lines passing
through left slot is significantly different in compare with right slot in the figure.
If we inspect current distribution in winding with 1-Tangential, 2-Random and 3-Radial
conductors setting, there are no big differences during nominal power operation. Following figures
shows current distribution inside conductors of stators slot. Next to Jz – current density plot, there
is always stator slot conductors arrangement to compare the influence of conductors’ arrangement
inside winding on proximity effect.
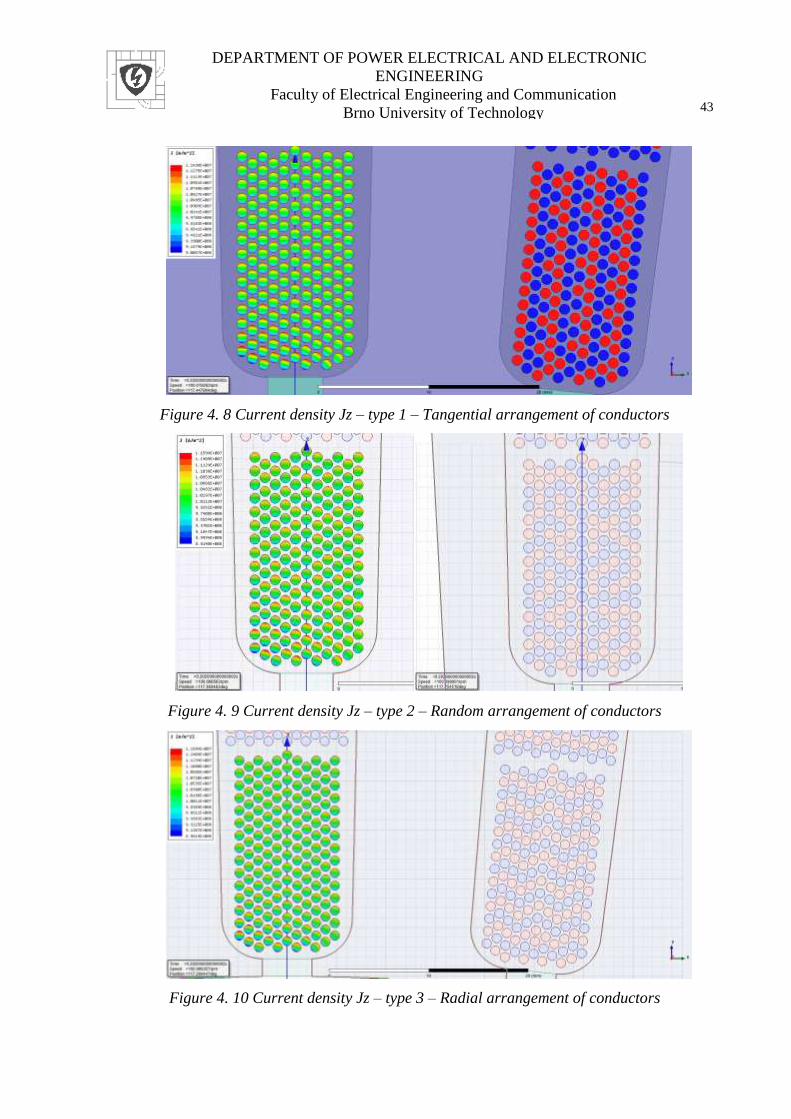
DEPARTMENT OF POWER ELECTRICAL AND ELECTRONIC
ENGINEERING
Faculty of Electrical Engineering and Communication
Brno University of Technology
43
Figure 4. 8 Current density Jz – type 1 – Tangential arrangement of conductors
Figure 4. 9 Current density Jz – type 2 – Random arrangement of conductors
Figure 4. 10 Current density Jz – type 3 – Radial arrangement of conductors

DEPARTMENT OF POWER ELECTRICAL AND ELECTRONIC
ENGINEERING
Faculty of Electrical Engineering and Communication
Brno University of Technology
44
On first sight there are no significant differences between arrangements of conductors in
Figures 4. 8 – 4. 10. After closer inspection of conductors’ arrangement there are obvious patterns
in proximity-effect of parallel strands. Different arrangement creates slightly different proximity
effect in trailing edge of coil.
In following Table 4 are listed Ohmic losses in winding including proximity effect. Model
types 2 and 3 are corresponding but in model 1 the losses are lower. This could be caused by smaller
proximity effect in parallel strands due to tangential arrangement of conductors.
Table 4 Total Ohmic loss comparison across models
Arrangement of conductors Ohmic loss [W]
Type 1 - Tangential 7147
Type 2 - Random 7357
Type 3 - Radial 7356
Figure 4. 11 Points in conductor with greatest proximity effect
For deeper investigation it was chosen the random arrangement of conductors. Inside
conductor were inserted points 1 – 3 to observe current distribution over time. The points are drawn
in Figure 4. 11. From point illustrated above were exported transient waveforms of current density.
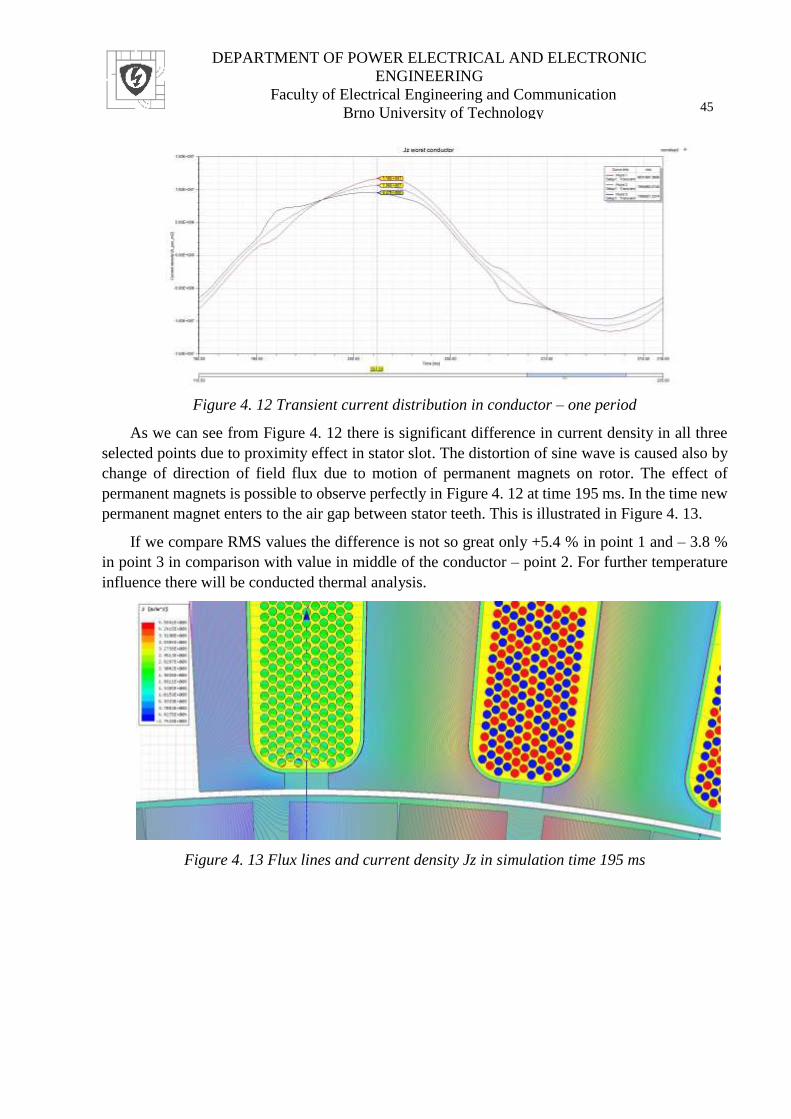
DEPARTMENT OF POWER ELECTRICAL AND ELECTRONIC
ENGINEERING
Faculty of Electrical Engineering and Communication
Brno University of Technology
45
Figure 4. 12 Transient current distribution in conductor – one period
As we can see from Figure 4. 12 there is significant difference in current density in all three
selected points due to proximity effect in stator slot. The distortion of sine wave is caused also by
change of direction of field flux due to motion of permanent magnets on rotor. The effect of
permanent magnets is possible to observe perfectly in Figure 4. 12 at time 195 ms. In the time new
permanent magnet enters to the air gap between stator teeth. This is illustrated in Figure 4. 13.
If we compare RMS values the difference is not so great only +5.4 % in point 1 and – 3.8 %
in point 3 in comparison with value in middle of the conductor – point 2. For further temperature
influence there will be conducted thermal analysis.
Figure 4. 13 Flux lines and current density Jz in simulation time 195 ms
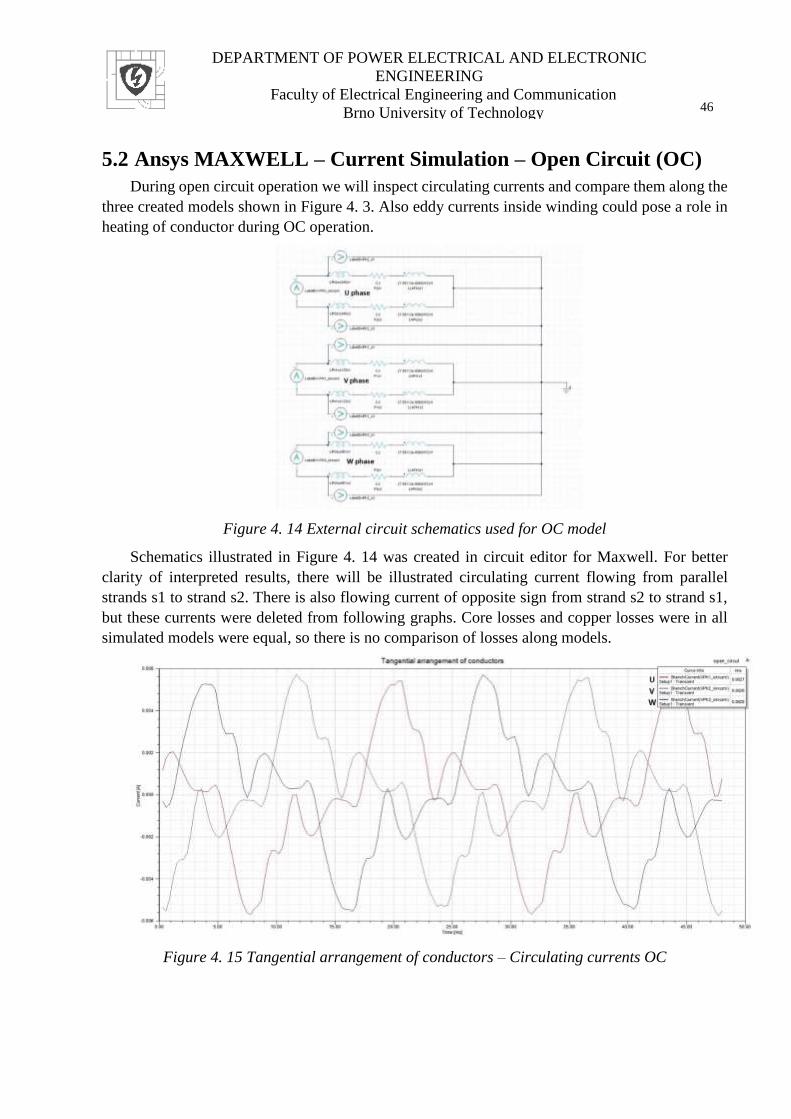
DEPARTMENT OF POWER ELECTRICAL AND ELECTRONIC
ENGINEERING
Faculty of Electrical Engineering and Communication
Brno University of Technology
46
5.2 Ansys MAXWELL – Current Simulation – Open Circuit (OC)
During open circuit operation we will inspect circulating currents and compare them along the
three created models shown in Figure 4. 3. Also eddy currents inside winding could pose a role in
heating of conductor during OC operation.
Figure 4. 14 External circuit schematics used for OC model
Schematics illustrated in Figure 4. 14 was created in circuit editor for Maxwell. For better
clarity of interpreted results, there will be illustrated circulating current flowing from parallel
strands s1 to strand s2. There is also flowing current of opposite sign from strand s2 to strand s1,
but these currents were deleted from following graphs. Core losses and copper losses were in all
simulated models were equal, so there is no comparison of losses along models.
Figure 4. 15 Tangential arrangement of conductors – Circulating currents OC

DEPARTMENT OF POWER ELECTRICAL AND ELECTRONIC
ENGINEERING
Faculty of Electrical Engineering and Communication
Brno University of Technology
47
Figure 4. 16 Random arrangement of conductors – Circulating currents OC
Figure 4. 17 Radial arrangement of conductors – Circulating currents OC
As we can see from Figures 4.16 – 4.18 conductor arrangement poses a big role in waveform
shape of circulating currents between strands but RMS of the current is so small, that it makes no
effect to Joule’s heating in chosen machine. It should be mentioned, that we have only two parallel
strands and according to Table 2. With more parallel strand the current could significantly rise.
This results support statement in [14], that circulating currents poses small problem according to
proximity effect in winding. On the other hand simulation neglected [1] statement, that position of
conductors inside slot is insignifficant. Their statement will be right only, if we have no parallel
strands in winding. Due to symmetry and complexity of model of machine we were able to simulate
only strands circulating currents, but no branches circulating currents were simulated.

DEPARTMENT OF POWER ELECTRICAL AND ELECTRONIC
ENGINEERING
Faculty of Electrical Engineering and Communication
Brno University of Technology
48
5.3 FEMM – Current Simulation
In freeware FEMM was also built parametric model of the same machine as in Ansys®
Maxwell to compare the results of simulation. Parametric setting was programmed in Lua Script.
For LUA commands were used sources [45], [46]. Then the script was lunched in FEMM. We used
same parametric model for both machines – parametrization dimensions are in Attachment A.
Figure 4. 18 FEMM model of machine
Figure 4. 19 FEMM – detail stator slot
As we can see in Figure 4. 18 and Figure 4. 19 the model is really complex. Every slot was
filled with 340 conductors and winding was excited in nominal power operation, where in first
phase there is no current and second and third phases are excited by equal current with opposite
direction of flow. Precision of mesh was then reduced by settings of model from above 600 000
nodes to 293 000 nodes. This was supposed to reduce solution time. During 5 day of computation
on server it was impossible to obtain first approximation of model. Due to this, the model was
assumed as unsolvable and for FEMM thermal simulation were used data from Ansys Maxwell,
where simulation matches quite properly with catalogue data.
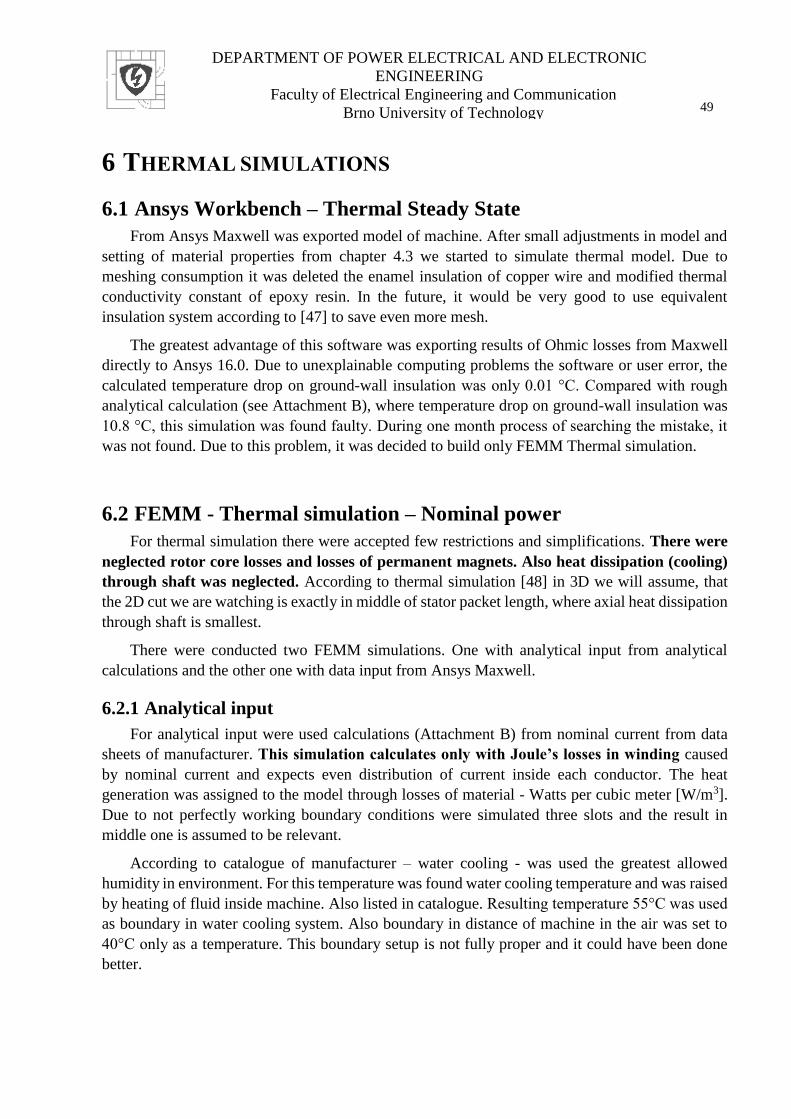
DEPARTMENT OF POWER ELECTRICAL AND ELECTRONIC
ENGINEERING
Faculty of Electrical Engineering and Communication
Brno University of Technology
49
6 THERMAL SIMULATIONS
6.1 Ansys Workbench – Thermal Steady State
From Ansys Maxwell was exported model of machine. After small adjustments in model and
setting of material properties from chapter 4.3 we started to simulate thermal model. Due to
meshing consumption it was deleted the enamel insulation of copper wire and modified thermal
conductivity constant of epoxy resin. In the future, it would be very good to use equivalent
insulation system according to [47] to save even more mesh.
The greatest advantage of this software was exporting results of Ohmic losses from Maxwell
directly to Ansys 16.0. Due to unexplainable computing problems the software or user error, the
calculated temperature drop on ground-wall insulation was only 0.01 °C. Compared with rough
analytical calculation (see Attachment B), where temperature drop on ground-wall insulation was
10.8 °C, this simulation was found faulty. During one month process of searching the mistake, it
was not found. Due to this problem, it was decided to build only FEMM Thermal simulation.
6.2 FEMM - Thermal simulation – Nominal power
For thermal simulation there were accepted few restrictions and simplifications. There were
neglected rotor core losses and losses of permanent magnets. Also heat dissipation (cooling)
through shaft was neglected. According to thermal simulation [48] in 3D we will assume, that
the 2D cut we are watching is exactly in middle of stator packet length, where axial heat dissipation
through shaft is smallest.
There were conducted two FEMM simulations. One with analytical input from analytical
calculations and the other one with data input from Ansys Maxwell.
6.2.1 Analytical input
For analytical input were used calculations (Attachment B) from nominal current from data
sheets of manufacturer. This simulation calculates only with Joule’s losses in winding caused
by nominal current and expects even distribution of current inside each conductor. The heat
generation was assigned to the model through losses of material - Watts per cubic meter [W/m3].
Due to not perfectly working boundary conditions were simulated three slots and the result in
middle one is assumed to be relevant.
According to catalogue of manufacturer – water cooling - was used the greatest allowed
humidity in environment. For this temperature was found water cooling temperature and was raised
by heating of fluid inside machine. Also listed in catalogue. Resulting temperature 55°C was used
as boundary in water cooling system. Also boundary in distance of machine in the air was set to
40°C only as a temperature. This boundary setup is not fully proper and it could have been done
better.
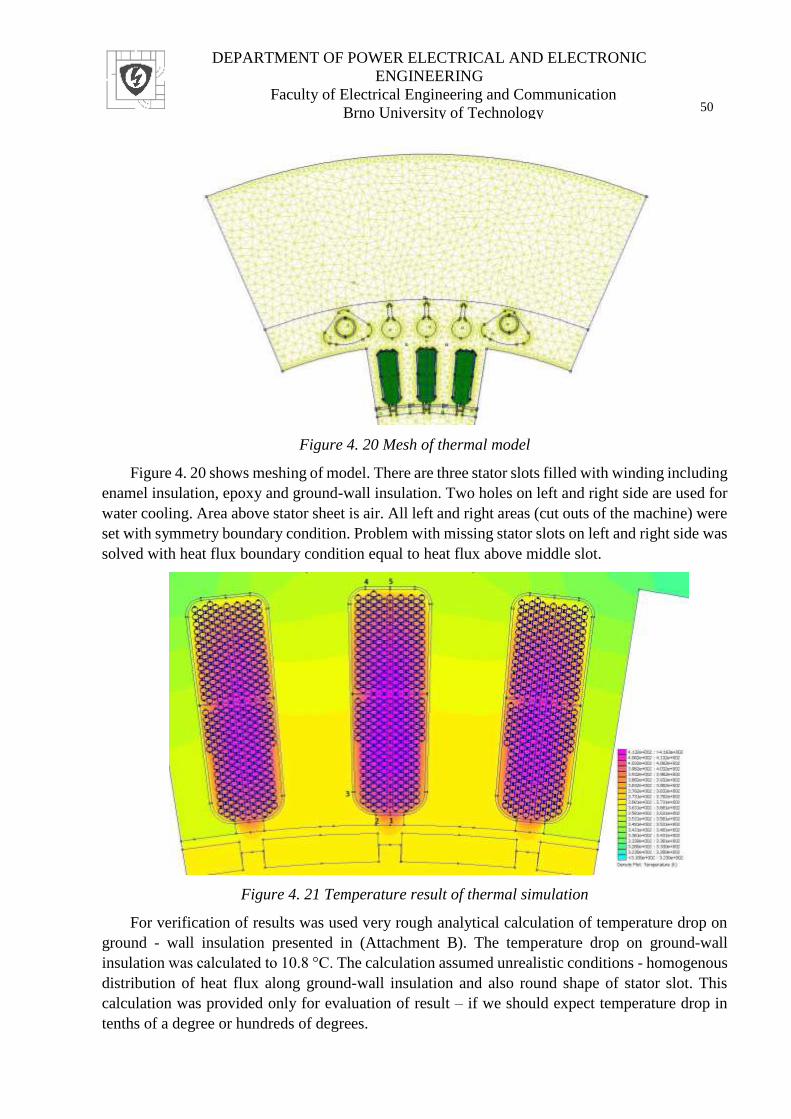
DEPARTMENT OF POWER ELECTRICAL AND ELECTRONIC
ENGINEERING
Faculty of Electrical Engineering and Communication
Brno University of Technology
50
Figure 4. 20 Mesh of thermal model
Figure 4. 20 shows meshing of model. There are three stator slots filled with winding including
enamel insulation, epoxy and ground-wall insulation. Two holes on left and right side are used for
water cooling. Area above stator sheet is air. All left and right areas (cut outs of the machine) were
set with symmetry boundary condition. Problem with missing stator slots on left and right side was
solved with heat flux boundary condition equal to heat flux above middle slot.
Figure 4. 21 Temperature result of thermal simulation
For verification of results was used very rough analytical calculation of temperature drop on
ground - wall insulation presented in (Attachment B). The temperature drop on ground-wall
insulation was calculated to 10.8 °C. The calculation assumed unrealistic conditions - homogenous
distribution of heat flux along ground-wall insulation and also round shape of stator slot. This
calculation was provided only for evaluation of result – if we should expect temperature drop in
tenths of a degree or hundreds of degrees.

DEPARTMENT OF POWER ELECTRICAL AND ELECTRONIC
ENGINEERING
Faculty of Electrical Engineering and Communication
Brno University of Technology
51
In Figure 4. 21 are points 1-5 where temperature drop was computed along the perpendicular.
The measured temperature drops are shown in following Table 5.
Table 5 Computed and calculated temperature drops across ground-wall insulation
Point 1 2 3 4 5 Analytical
calculation
Temperature
drop [K]
1.23 15.37 9.06 8.2 10.36 10.8
As we can see in this table and also in Figure 4. 21, the temperature drop in point 1 is really
small. This is caused by simulation, where FEMM takes the air as steady matter and not as flowing
substance. Normally the temperature drop would be greater in point 1.
Figure 4. 22 Tangential temperature distribution across line between point 1 and 5 (Figure 4.21)
Figure 4. 22 shows temperature along red line in middle slot in Figure 4. 21. Axis x length
begins at the point1 and ends in the point 5. Horizontal temperature flats represents conductors,
other temperature drops are on ground-wall insulation, in epoxy-resin, on inter-phase insulation
and enamel of wire. The temperature drops are illustrated in the figure above. The enamel
temperature drop is not possible to see due to small thickness of enamel. Maximum temperature
inside winding according to FEMM is 419 K (145.85 °C).
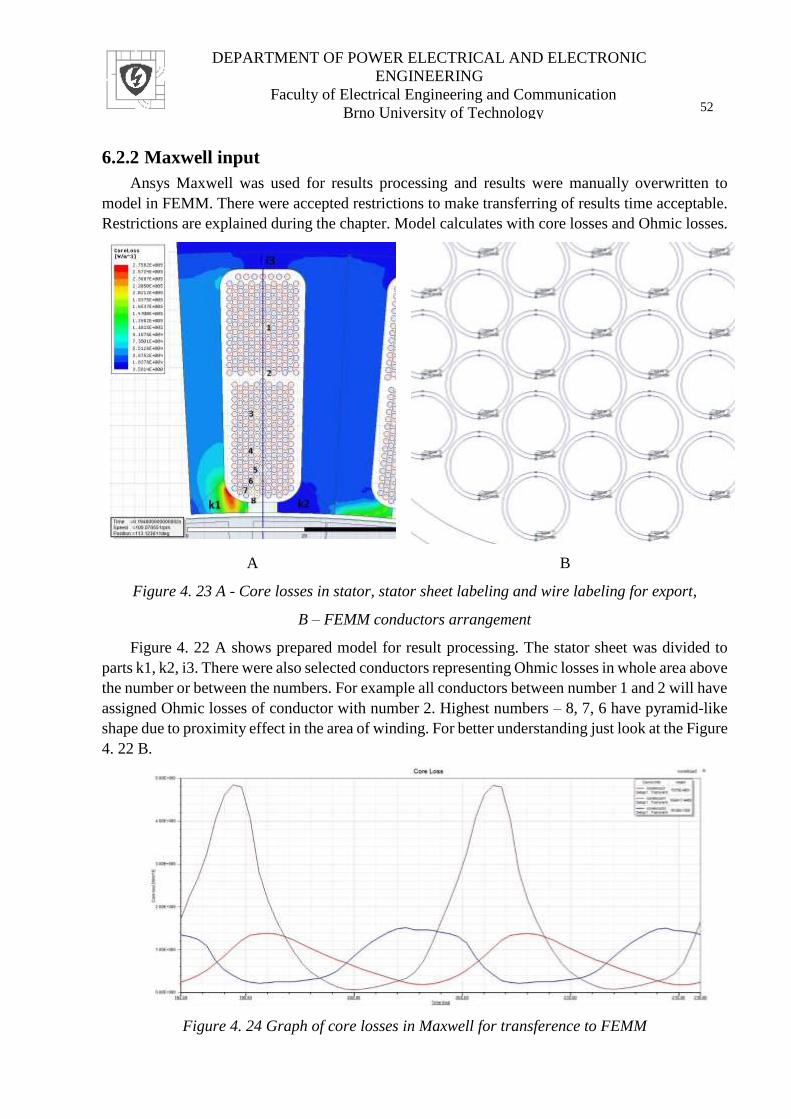
DEPARTMENT OF POWER ELECTRICAL AND ELECTRONIC
ENGINEERING
Faculty of Electrical Engineering and Communication
Brno University of Technology
52
6.2.2 Maxwell input
Ansys Maxwell was used for results processing and results were manually overwritten to
model in FEMM. There were accepted restrictions to make transferring of results time acceptable.
Restrictions are explained during the chapter. Model calculates with core losses and Ohmic losses.
A B
Figure 4. 23 A - Core losses in stator, stator sheet labeling and wire labeling for export,
B – FEMM conductors arrangement
Figure 4. 22 A shows prepared model for result processing. The stator sheet was divided to
parts k1, k2, i3. There were also selected conductors representing Ohmic losses in whole area above
the number or between the numbers. For example all conductors between number 1 and 2 will have
assigned Ohmic losses of conductor with number 2. Highest numbers – 8, 7, 6 have pyramid-like
shape due to proximity effect in the area of winding. For better understanding just look at the Figure
4. 22 B.
Figure 4. 24 Graph of core losses in Maxwell for transference to FEMM

DEPARTMENT OF POWER ELECTRICAL AND ELECTRONIC
ENGINEERING
Faculty of Electrical Engineering and Communication
Brno University of Technology
53
Core losses in model were integrated through surface and divided by given surface to obtain
losses in Watts per cubic meter [W∙m-3]. Result for each time step of simulation was printed to
graph in Figure 4. 24. There is possible to see huge difference between core-losses in leading and
trailing edge of stator tooth. In top right corner there is computed mean value of each curve. This
mean value of core-losses was used in FEMM simulation for heat generation inside material.
In the same way it was done for conductors with numbers 1-8 marked with yellow color in
Figure 4. 22 A, but the difference in Ohmic losses after integration is not so significant. Losses in
conductor with number 8 are only 0.6% higher compared with reference conductor number 3.
Conductors with numbers 1 and 2 are form different phase of winding with different strand current.
Figure 4. 25 Temperature result of thermal simulation
Figure 4. 25 compared to analytical simulation result in Figure 4. 21 has lower temperatures
in winding. This is caused by strand current in Maxwell model, where strand RMS current moves
between 5.29 and 5.35 A according to chosen phase and strand of winding. For thermal simulation
was chosen the strand with highest current 5.35 A. In analytical calculation in Table 6 was used
strand current 5.35 A.
Table 6 Computed and calculated temperature drops across ground-wall insulation
Point 1 2 3 4 5 Analytical
calculation
Temperature
drop [K]
1.1 13.34 7.86 7.08 8.99 9.7
Including core-losses in thermal model and also lower Ohmic losses reduced temperature drop
on ground-wall insulation. Greater deviation from analytical calculation is caused also by core-
losses in model. We have to also assume, that temperature drop in point 1 will be greater and in
point 2 will be smaller due to air movement in the air gap of machine. So simulation completely
does not correspond with real machine.

DEPARTMENT OF POWER ELECTRICAL AND ELECTRONIC
ENGINEERING
Faculty of Electrical Engineering and Communication
Brno University of Technology
54
Figure 4. 26 Tangential temperature distribution across line inside winding
Reading of Figure 4. 26 is same as reading of Figure 4. 22. The curves have the same shape,
only this figure above has lower temperatures. Maximum temperature inside winding according to
FEMM and this graph is 412.8 K (139.65 °C). Temperature difference between hottest points of
simulations (analytical vs Maxwell) is 6.2 K.
6.3 FEMM – Selected conductor – Nominal power
Electric time constant and thermal time constant (tau) have a different time range. Due to this
we could assume, that temperature inside conductor will not be distributed equally. On the other
hand chopper is perfect thermal conductor, so heat conduction in copper itself could spread Ohmic
losses equally. This thermal simulation will give us answer.
A B
Figure 4. 27 A – Line to display Ohmic-losses in Maxwell, B – complete model in FEMM

DEPARTMENT OF POWER ELECTRICAL AND ELECTRONIC
ENGINEERING
Faculty of Electrical Engineering and Communication
Brno University of Technology
55
It was decided to cut one conductor apart and simulate temperature difference inside one
conductor. Integration along surface was impossible due to overlapping of layers in Maxwell and
setting of number of turns of coil for the sliced conductor. So we put a straight line crossing through
conductor as we can see in Figure 4. 27 A, where mean value was calculated on each curve in
different time on restricted length corresponding with length of conductor slice. Mean values for
10 curves in Figure 4. 28 each for different time of period were then manually averaged to resulting
Ohmic loss value listed in Figure 4. 29 A on left side.
Figure 4. 28 Displayed Ohmic losses along line crossing conductor in Figure 4. 27 - A
Model in FEMM gave us temperature drop 0.01 K as we can see in Figure 4. 27 – B.
Temperature drop was computed between beginning of red line and end of red line. Averaged
temperature across the conductor is 391.5 K (118.35 °C).
A B
Figure 4. 29 A – Model of single conductor in Ansys 16.0, B – Resulting temperatures
From FEMM model were taken averaged heat flux [W∙m-2] boundary values to Ansys 16.0
model. The values are averaged along curve of enamel insulation each 45°. Resulting heat flux
inflowing to model has blue dots in Figure 4. 29 A, outflowing heat flux has slight yellow line.
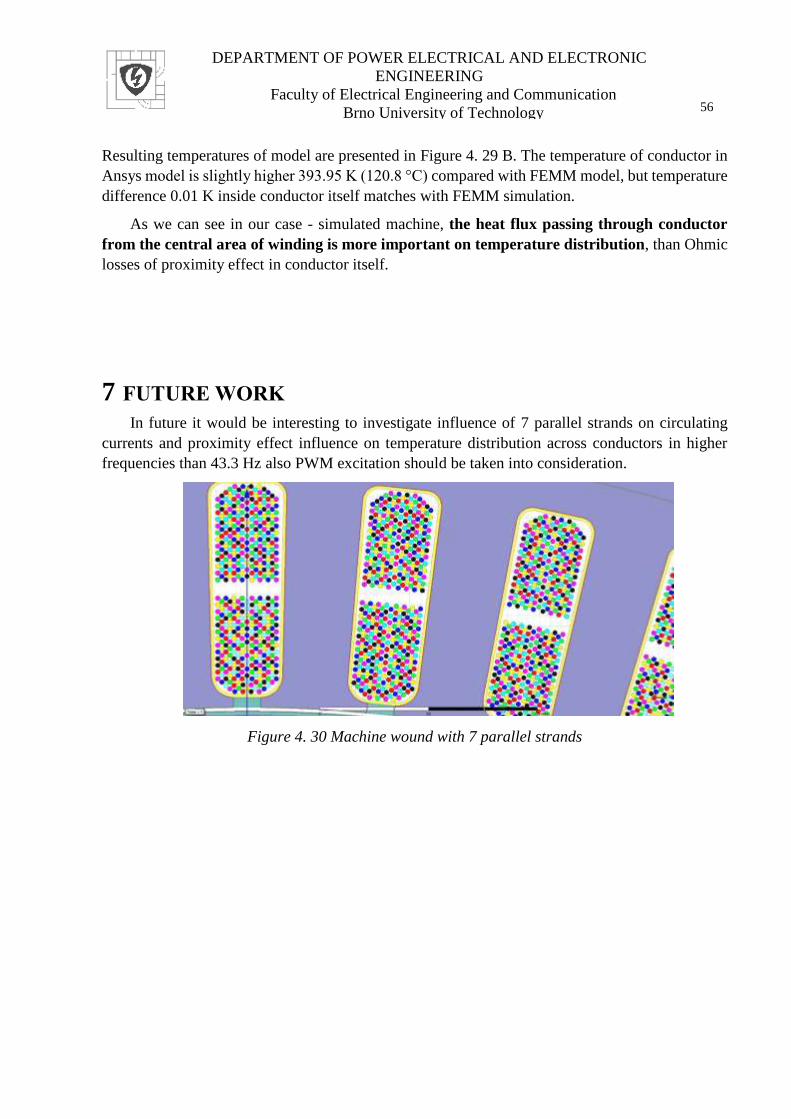
DEPARTMENT OF POWER ELECTRICAL AND ELECTRONIC
ENGINEERING
Faculty of Electrical Engineering and Communication
Brno University of Technology
56
Resulting temperatures of model are presented in Figure 4. 29 B. The temperature of conductor in
Ansys model is slightly higher 393.95 K (120.8 °C) compared with FEMM model, but temperature
difference 0.01 K inside conductor itself matches with FEMM simulation.
As we can see in our case - simulated machine, the heat flux passing through conductor
from the central area of winding is more important on temperature distribution, than Ohmic
losses of proximity effect in conductor itself.
7 FUTURE WORK In future it would be interesting to investigate influence of 7 parallel strands on circulating
currents and proximity effect influence on temperature distribution across conductors in higher
frequencies than 43.3 Hz also PWM excitation should be taken into consideration.
Figure 4. 30 Machine wound with 7 parallel strands
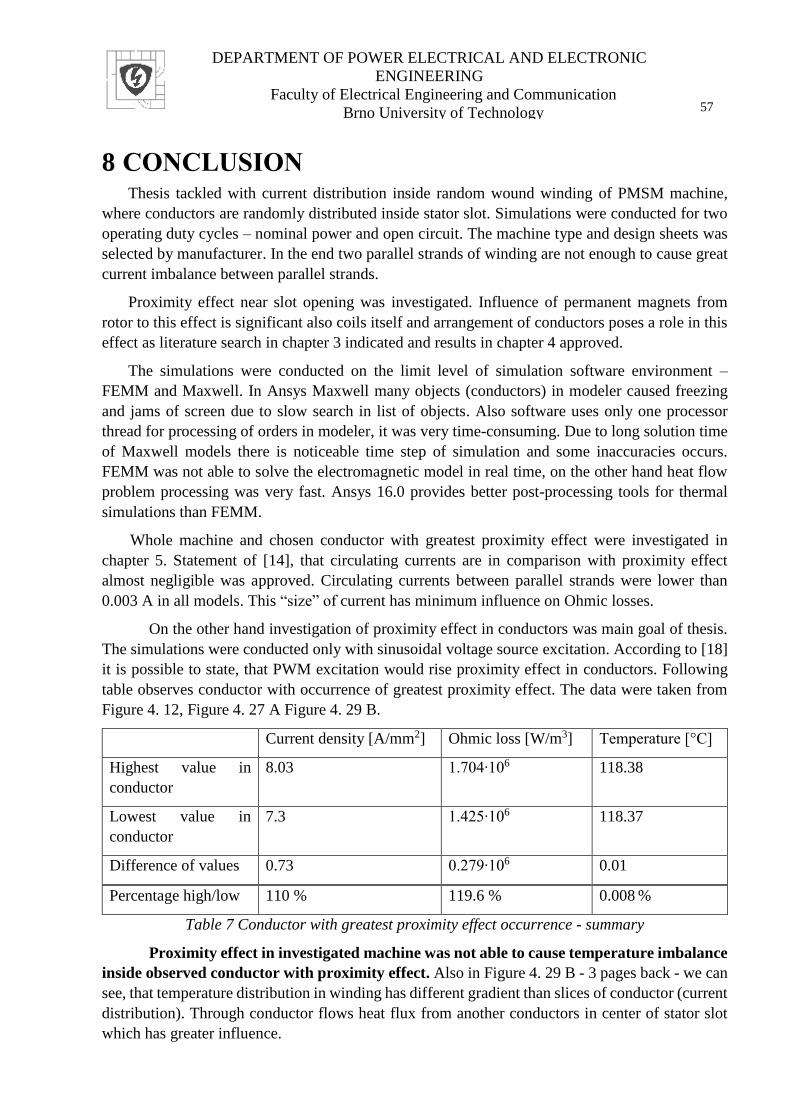
DEPARTMENT OF POWER ELECTRICAL AND ELECTRONIC
ENGINEERING
Faculty of Electrical Engineering and Communication
Brno University of Technology
57
8 CONCLUSION Thesis tackled with current distribution inside random wound winding of PMSM machine,
where conductors are randomly distributed inside stator slot. Simulations were conducted for two
operating duty cycles – nominal power and open circuit. The machine type and design sheets was
selected by manufacturer. In the end two parallel strands of winding are not enough to cause great
current imbalance between parallel strands.
Proximity effect near slot opening was investigated. Influence of permanent magnets from
rotor to this effect is significant also coils itself and arrangement of conductors poses a role in this
effect as literature search in chapter 3 indicated and results in chapter 4 approved.
The simulations were conducted on the limit level of simulation software environment –
FEMM and Maxwell. In Ansys Maxwell many objects (conductors) in modeler caused freezing
and jams of screen due to slow search in list of objects. Also software uses only one processor
thread for processing of orders in modeler, it was very time-consuming. Due to long solution time
of Maxwell models there is noticeable time step of simulation and some inaccuracies occurs.
FEMM was not able to solve the electromagnetic model in real time, on the other hand heat flow
problem processing was very fast. Ansys 16.0 provides better post-processing tools for thermal
simulations than FEMM.
Whole machine and chosen conductor with greatest proximity effect were investigated in
chapter 5. Statement of [14], that circulating currents are in comparison with proximity effect
almost negligible was approved. Circulating currents between parallel strands were lower than
0.003 A in all models. This “size” of current has minimum influence on Ohmic losses.
On the other hand investigation of proximity effect in conductors was main goal of thesis.
The simulations were conducted only with sinusoidal voltage source excitation. According to [18]
it is possible to state, that PWM excitation would rise proximity effect in conductors. Following
table observes conductor with occurrence of greatest proximity effect. The data were taken from
Figure 4. 12, Figure 4. 27 A Figure 4. 29 B.
Current density [A/mm2] Ohmic loss [W/m3] Temperature [°C]
Highest value in
conductor
8.03 1.704∙106 118.38
Lowest value in
conductor
7.3 1.425∙106 118.37
Difference of values 0.73 0.279∙106 0.01
Percentage high/low 110 % 119.6 % 0.008 %
Table 7 Conductor with greatest proximity effect occurrence - summary
Proximity effect in investigated machine was not able to cause temperature imbalance
inside observed conductor with proximity effect. Also in Figure 4. 29 B - 3 pages back - we can
see, that temperature distribution in winding has different gradient than slices of conductor (current
distribution). Through conductor flows heat flux from another conductors in center of stator slot
which has greater influence.
DEPARTMENT OF POWER ELECTRICAL AND ELECTRONIC
ENGINEERING
Faculty of Electrical Engineering and Communication
Brno University of Technology
58
Each machine should be evaluated individually due to different excitation frequency and
largeness of proximity effect. With higher frequency the phenomena of proximity effect will be
more significant.
Thesis brings us insight, that without thermal analysis it is impossible to evaluate possibility
of creation of hot-spots in winding, because copper is very good heat conductor. So all articles
[2][11][12][14] discussing possibility of creation of hot-spots on conductors of winding due to
proximity effect may be or may not be right.
Same as [14] concluded it has to be said, that only conductor level thermal simulations can
confirm or disprove creation of hot-spots in winding. In our case (simulated machine) creation of
hot-spots was disproved.

DEPARTMENT OF POWER ELECTRICAL AND ELECTRONIC
ENGINEERING
Faculty of Electrical Engineering and Communication
Brno University of Technology
59
BIBLIOGRAPHY [1] M. S. Islam, S. Mir, and T. Sebastian, “Paralleling the stator coils in permanent magnet
machines,” IEEE Int. Conf. Electr. Mach. Drives, 2005., pp. 1479–1486, 2005.
[2] M. Popescu and D. G. Dorrell, “Proximity Losses in the Windings of High Speed Brushless
Permanent Magnet AC Motors With Single Tooth Windings and Parallel Paths,” Magn.
IEEE Trans., vol. 49, no. 7, pp. 3913–3916, 2013.
[3] M. Van Der Geest, S. Member, H. Polinder, S. Member, J. a Ferreira, and D. Zeilstra,
“Current Sharing Analysis of Parallel Strands in Low-Voltage High-Speed Machines,” vol.
61, no. 6, pp. 3064–3070, 2014.
[4] G. Stone, I. Culbert, E. Boulter, and H. Dhirani, Electrical Insulation for Rotating Machines,
no. 2. 2014.
[5] J. Pyrhonen, T. Jokinen, and V. Hrabovcová, Design of Rotating Electrical Machines. 2014.
[6] G. C. Stone, I. M. Culbert, and B. a Lloyd, “Stator Insulation Problems Associated With
Low,” Ieee Trans. Ind. Electron., pp. 187–192, 2007.
[7] S. U. Haq, “A Study on Insulation Problems in Drive Fed Medium Voltage Induction
Motors,” 2007.
[8] P. Bernat, “Negativní vlivy měničů frekvence na asynchronní motor,” Technická univerzita
Ostrava, Fakulta elektrotechniky a informatiky, 2006.
[9] W. Yin, “Failure mechanism of winding insulations in inverter-fed motors,” IEEE Electr.
Insul. Mag., vol. 13, no. 6, pp. 18–23, 1997.
[10] B. Sonerud, T. Bengtsson, J. Blennow, and S. Gubanski, “Dielectric heating in insulating
materials subjected to voltage waveforms with high harmonic content,” IEEE Trans.
Dielectr. Electr. Insul., vol. 16, no. 4, pp. 926–933, 2009.
[11] H. M. Hämäläinen, J. J. Pyrhönen, and J. Puranen, “Minimizing skineffect in random wound
high speed machine stator,” no. 2, pp. 752–757, 2009.
[12] S. Iwasaki, R. P. Deodhar, Y. Liu, A. Pride, Z. Q. Zhu, and J. J. Bremner, “Influence of
PWM on the proximity loss in permanent-magnet brushless AC machines,” IEEE Trans.
Ind. Appl., vol. 45, no. 4, pp. 1359–1367, 2009.
[13] A. Młot, M. Korkosz, P. Grodzki, and M. Łukaniszyn, “Analysis of the proximity and skin
effects on copper loss in a stator core,” Arch. Electr. Eng., vol. 63, no. 2, pp. 211–225, 2014.
[14] M. Popescu and D. G. Dorrell, “Skin effect and proximity losses in high speed brushless
permanent magnet motors,” 2013 IEEE Energy Convers. Congr. Expo. ECCE 2013, pp.
3520–3527, 2013.
[15] A. Tessarolo, F. Agnolet, F. Luise, and M. Mezzarobba, “Use of time-harmonic finite-
element analysis to compute stator winding eddy-current losses due to rotor motion in
surface permanent-magnet machines,” IEEE Trans. Energy Convers., vol. 27, no. 3, pp.
670–679, 2012.
[16] M. van der Geest, H. Polinder, J. a. Ferreira, and D. Zeilstra, “Stator winding proximity loss
reduction techniques in high speed electrical machines,” 2013 Int. Electr. Mach. Drives
Conf., pp. 340–346, 2013.

DEPARTMENT OF POWER ELECTRICAL AND ELECTRONIC
ENGINEERING
Faculty of Electrical Engineering and Communication
Brno University of Technology
60
[17] P. Zoya and D. Branko, Introductory electromagnetics. .
[18] R. Huaytia, “Skin and proximity effect analysis of traction motor,” Royal Institute of
Technology, School of Electrical Engineering, 2012.
[19] “Skin effect,” Wikipedia: the free encyclopedia, 2001. [Online]. Available:
https://en.wikipedia.org/wiki/Skin_effect. [Accessed: 31-Aug-2015].
[20] E. Jordan and K. Balmain, Electromagnetic waves and radiating systems. 1968.
[21] “Elektrisola,” 2015. [Online]. Available: http://www.elektrisola.com/hf-litz-
wire/terminology-basics/technical-basics-and-calculation.html.
[22] S. Krawczyk, S. Wiak, and X. M. Lopez-Fernandez, “Electromagnetic Fields in
Mechatronics, Electrical and Electronic Engineering: Proceedings of ISEF’05,” in Studies
in Applied Electromagnetics and Mechanics, IOS Press, 2006, p. 556.
[23] M. J. Islam, H. V. Khang, a. K. Repo, and a. Arkkio, “Eddy-current loss and temperature
rise in the form-wound stator winding of an inverter-fed cage induction motor,” IEEE Trans.
Magn., vol. 46, no. 8, pp. 3413–3416, 2010.
[24] E. Maruyama, A. Nakahara, A. Takahashi, and K. Miyata, “Circulating current in parallel
connected stator windings due to rotor eccentricity in permanent magnet motors,” 2013
IEEE Energy Convers. Congr. Expo. ECCE 2013, pp. 2850–2855, 2013.
[25] a Tenhunen, “Finite-Element Calculation of Unbalanced Magnetic Pull and Circulating
Current Between Parallel Windings in Induction Motor With Non-Uniform Eccentric
Rotor,” no. June, pp. 19–24, 2001.
[26] F. Endert, T. Heidrich, U. Schwalbe, T. Szalai, and S. D. Ivanov, “Effects of current
displacement in a PMSM traction drive with single turn coils,” 2013.
[27] D. Halliday, R. Resnick, and J. Walker, “Mechanika - Termodynamika,” in Fyzika,
VUTIUM, 2000.
[28] Z. Makki, “OPTIMIZATION OF COOLING SYNCHRONOUS MACHINE,” Brno
University of Technology, 2016.
[29] M. Janda, “Heat Optimization of Electric Machines,” Brno University of Technology, 2008.
[30] T. W. Davies, “Fourier’s Law.” [Online]. Available:
http://www.thermopedia.com/content/781/.
[31] “Temperature Coefficient of Resistance.” [Online]. Available: http://www.radio-
electronics.com/info/formulae/resistance/resistance-temperature-coefficient.php.
[32] D. Giancoli, “25. Electric Currents and Resistance,” in Physics for Scientists and Engineers
with Modern Physics, New Jersey, 1984.
[33] S. Keppert, Projektováni elekctrikcých strojů, 1st ed. Ostrava, 1990.
[34] “Emissivity,” Wikipedia, the free encyclopedia. [Online]. Available:
https://en.wikipedia.org/wiki/Emissivity.
[35] I. P. Kopylov and P. Voženílek, Stavba elektrických strojů. Praha: Nakladatelství technické
literatury, 1988.
[36] J. P. Karditsas and M. J. Baptiste, “PURE COPPER,” Thermal and Structural Properties of

DEPARTMENT OF POWER ELECTRICAL AND ELECTRONIC
ENGINEERING
Faculty of Electrical Engineering and Communication
Brno University of Technology
61
Fusion related Materials. [Online]. Available: http://www-
ferp.ucsd.edu/LIB/PROPS/PANOS/cu.html.
[37] H. Sa, W. M. Hosny, S. J. Dodds, and D. A. Staton, “Influence of wall insulation material
in BPM synchronous servomotor,” Proc. Univ. Power Eng. Conf., 2013.
[38] Z. Wang, B. Wu, D. Xu, and N. Zargari, “Dynamic Capacitor Voltage Control of High
Power Current Source Converter Fed PMSM Drives for LC Resonance Suppression,” pp.
792–797.
[39] “DuPont TM Kapton ® MT,” 2014.
[40] “DuPont TM Nomex ® Paper Type 410,” 2013.
[41] S. Diaham, D. Mary, and D. Malec, “Thermal Breakdown Modeling in Polyimide Films by
Solving the Heat Balance Equation,” pp. 975–978, 2013.
[42] “Specific Heat Capacity Measurements Using DSC I -,” 1981.
[43] W. Tong, Mechanical Design of Electric Motors. 2014.
[44] F. Lin, G. S. Bhatia, and J. D. Ford, “Thermal conductivities of powder-filled epoxy resins,”
J. Appl. Polym. Sci., vol. 49, no. 11, pp. 1901–1908, 1993.
[45] D. Meeker, “Finite element method magnetics,” 2015.
[46] I. Hahn, “Einführung in FEMM,” Erlangen, 2016.
[47] A. Boglietti, E. C. Member, M. Cossale, S. Member, M. Popescu, D. Staton, S. Vaschetto,
and I. I. I. Ntroduction, “Equivalent Thermal Conductivity Determination of Winding
Insulation System by Fast Experimental Approach,” pp. 1215–1220, 2015.
[48] D. G. Nair, “Coupled Analytical and 3D Numerical Thermal Analysis of a TEFC Induction
Motor,” pp. 3–8, 2015.

DEPARTMENT OF POWER ELECTRICAL AND ELECTRONIC
ENGINEERING
Faculty of Electrical Engineering and Communication
Brno University of Technology
62
ATTACHMENTS
ATTACHMENT A – Chosen Parametric Dimensions of Machine
List of parametric dimensions:
d_sb – slot bottom diameter [mm] di_s – stator inner diameter [mm] di_sh – shaft inner diameter [mm] dm_rs1 – stator slot circle center pitch 1 [mm] dm_rs2 – stator slot circle center pitch 2 [mm] do_r – rotor outer diameter (do_r = do_rm + 2 ∙ h_mg) [mm] do_rs – rotor outer diameter of sheet [mm] do_rm – rotor outer diameter under magnet [mm] do_s – stator outer diameter [mm] fi – angle of stator slot tooth slope (in view of [0,0]) [deg] h_mg – magnet height [mm] h_sbot- slot bottom height [mm] h_shead – slot head height [mm] h_so – slot opening height [mm] i_th – thickness of ground-wall insulation [mm] r_s1 – slot corner radius 1 [mm] r_s2 – slot corner radius 2 [mm] rfi – angle of one polygon part [deg] w_mg – permanen magnet width [mm] w_so - slot opening width [mm]
Stator slot
S0! - [0; di_s∙0,996/2] S1! - [-w_so/2; di_s∙0,996/2] S2 - [-w_so/2; di_s/2+h_so] S3 - [-dm_rs1/2-(rs_1∙cos(pi/4)); di_s/2+h_shead-(r_s1∙sin(pi/4))] S4 - [-dm_rs1/2-(r_s1∙cos(fi)); di_s/2+h_shead-(r_s1∙sin(fi))] S5 - [-dm_rs2/2-(r_s2∙cos(fi)); di_s/2+h_sbot-(r_s2∙sin(fi))] S6 - [-dm_rs2/2-(rs_2∙cos(pi/4)); di_s/2+h_sbot+(r_s2∙sin(pi/4))] S7 - [-dm_rs2/2; d_sb/2] S8 - [0; d_sb/2] S9 - [-dm_rs1/2; di_s/2+h_shead] S10 - [-dm_rs1/2; di_s/2+h_shead] ! = dimension is gained by coefficient due to proper function of cutting tool of object in Ansys Maxwell.
Stator insulation
Si1 - [-w_so/2; di_s/2+h_so+i_th] Si2 - [-dm_rs1/2-(rs_1∙cos(pi/4))+i_th∙sin(pi/4); di_s/2+h_shead-(r_s1∙sin(pi/4))+i_th∙sin(pi/4)] Si3 - [-dm_rs1/2-(r_s1∙cos(fi))+i_th; di_s/2+h_shead-(r_s1∙sin(fi))] Si4 - [-dm_rs2/2-(r_s2∙cos(fi))+i_th; di_s/2+h_sbot-(r_s2∙sin(fi))] Si5 - [-dm_rs2/2-(rs_2∙cos(pi/4))+i_th; di_s/2+h_sbot+(r_s2∙sin(pi/4))] Si6 - [-dm_rs2/2; d_sb/2-i_th] Si7 - [0; d_sb/2-i_th]
Rotor
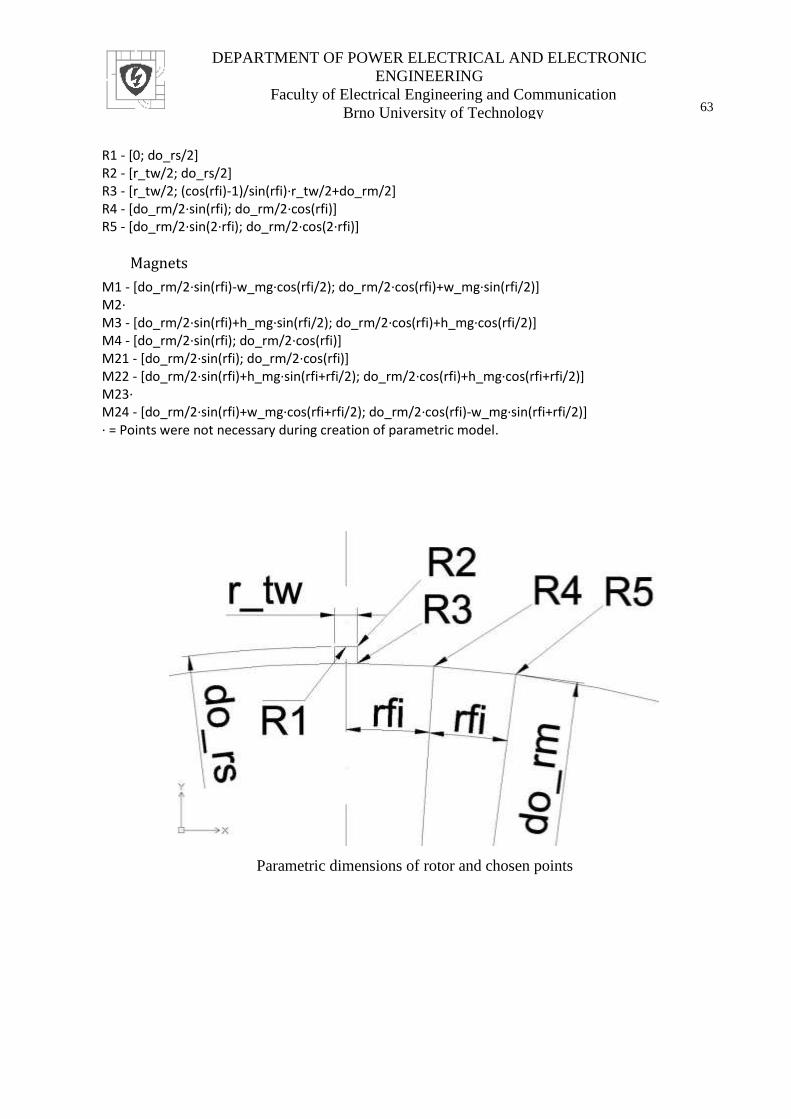
DEPARTMENT OF POWER ELECTRICAL AND ELECTRONIC
ENGINEERING
Faculty of Electrical Engineering and Communication
Brno University of Technology
63
R1 - [0; do_rs/2] R2 - [r_tw/2; do_rs/2] R3 - [r_tw/2; (cos(rfi)-1)/sin(rfi)∙r_tw/2+do_rm/2] R4 - [do_rm/2∙sin(rfi); do_rm/2∙cos(rfi)] R5 - [do_rm/2∙sin(2∙rfi); do_rm/2∙cos(2∙rfi)]
Magnets
M1 - [do_rm/2∙sin(rfi)-w_mg∙cos(rfi/2); do_rm/2∙cos(rfi)+w_mg∙sin(rfi/2)] M2∙ M3 - [do_rm/2∙sin(rfi)+h_mg∙sin(rfi/2); do_rm/2∙cos(rfi)+h_mg∙cos(rfi/2)] M4 - [do_rm/2∙sin(rfi); do_rm/2∙cos(rfi)] M21 - [do_rm/2∙sin(rfi); do_rm/2∙cos(rfi)] M22 - [do_rm/2∙sin(rfi)+h_mg∙sin(rfi+rfi/2); do_rm/2∙cos(rfi)+h_mg∙cos(rfi+rfi/2)] M23∙ M24 - [do_rm/2∙sin(rfi)+w_mg∙cos(rfi+rfi/2); do_rm/2∙cos(rfi)-w_mg∙sin(rfi+rfi/2)] ∙ = Points were not necessary during creation of parametric model.
Parametric dimensions of rotor and chosen points
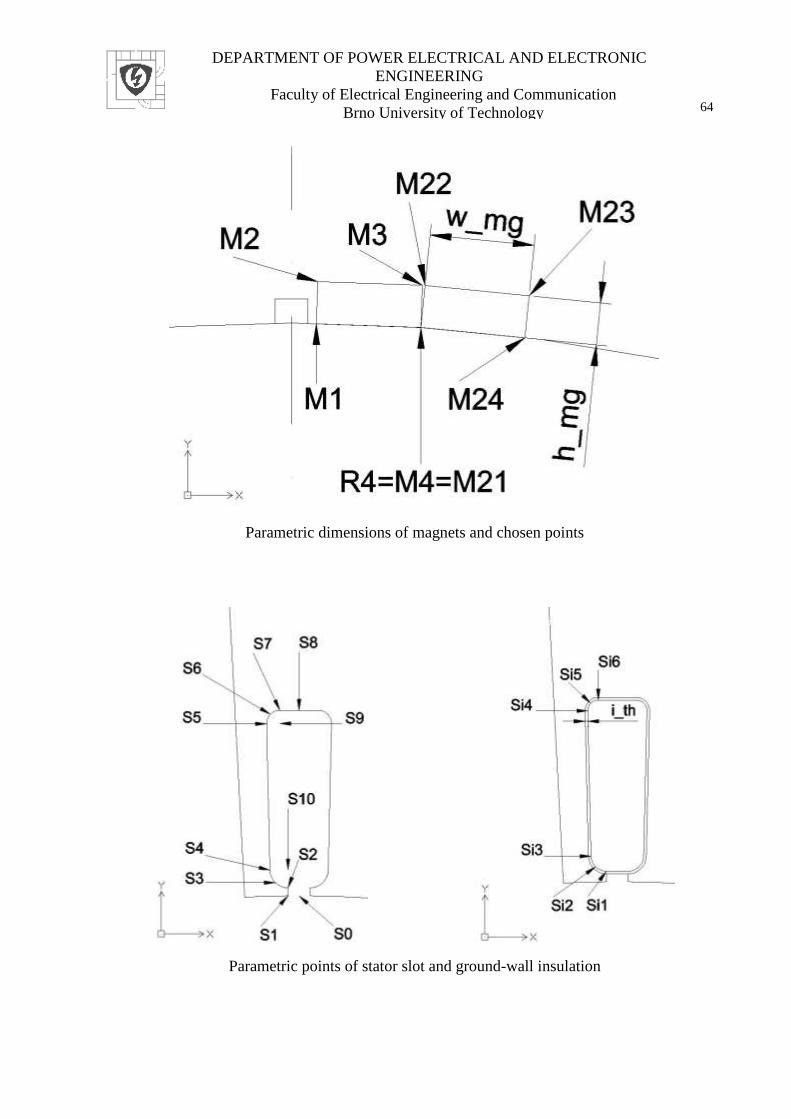
DEPARTMENT OF POWER ELECTRICAL AND ELECTRONIC
ENGINEERING
Faculty of Electrical Engineering and Communication
Brno University of Technology
64
Parametric dimensions of magnets and chosen points
Parametric points of stator slot and ground-wall insulation
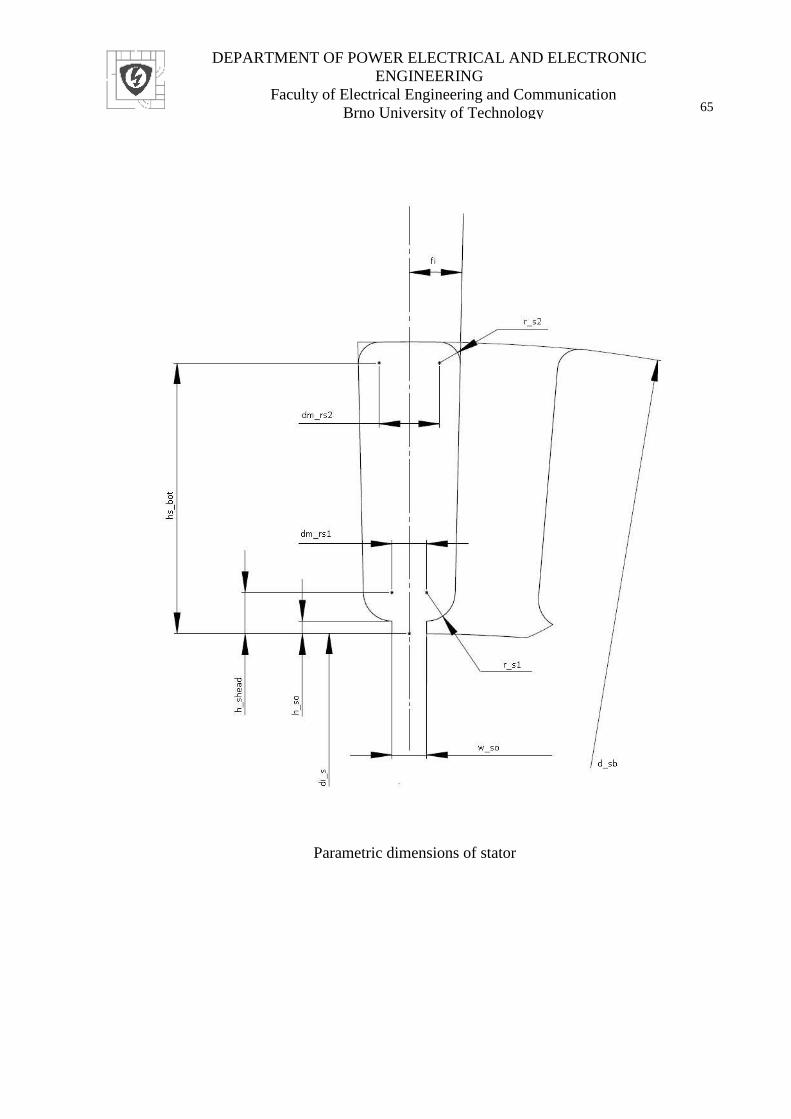
DEPARTMENT OF POWER ELECTRICAL AND ELECTRONIC
ENGINEERING
Faculty of Electrical Engineering and Communication
Brno University of Technology
65
Parametric dimensions of stator

DEPARTMENT OF POWER ELECTRICAL AND ELECTRONIC
ENGINEERING
Faculty of Electrical Engineering and Communication
Brno University of Technology
66
ATTACHMENT B – Analytical Calculations
Analytical Calculation of Conductor DC losses
In = 111 A nominal load current, Y winding, 10 parallel coils, each coil wound from 2 parallel
strands, thermal class insulation H = °180 °C (Permited average winding temperature = 165 °C,
see Table 1 in thesis)
x = 0.306 m – length of stator slot, d = 0.95 mm diameter of Cu wire (SCu = 0.70882 mm2)
ρ20°C = 1.72∙10-8 Ω∙m, αCu = 0.003862 K-1
Current in one parallel strand (one conductor)
𝐼1𝑐 = 𝐼𝑛
𝑝𝑎𝑟. 𝑐𝑜𝑖𝑙𝑠 ∙ 𝑠𝑡𝑟𝑎𝑛𝑑𝑠=
111
10 ∙ 2= 5.55 𝐴
Electrical resistivity of copper for 165°C
𝜌 165 °𝐶 = 𝜌20°𝐶 ∙ (1 + 𝛼 ∙ 𝑇) = 1.72 ∙ 10−8 ∆ ∙ (1 + 0.003862 ∙ (165 − 20))
= 2.6832 ∙ 10−8 𝛺 ∙ 𝑚
Electric resistence
𝑅𝐷𝐶 =𝜌 180 °𝐶 ∙ 𝑥
𝑆𝑐𝑢[𝑚2]=
2.6832 ∙ 10−8 ∙ 0.306
0.70882 ∙ 10−6= 11.583 𝑚𝛺
Joule heating in one conductor
𝑃𝑐𝑢 𝐷𝐶 =∆ 𝑅𝐷𝐶 ∙ 𝐼1𝑐
2 = 0.011583 ∙ 5.552 = 0.3568 𝑊
Heating per cubic metre for FEMM model
𝑄 = 𝑃𝑐𝑢 𝐷𝐶∆
𝑥 ∙ 𝑆𝑐𝑢[𝑚2]=
0.3568
0.306 ∙ 070882 ∙ 10−6= 1.645 ∙ 106 𝑊/𝑚3
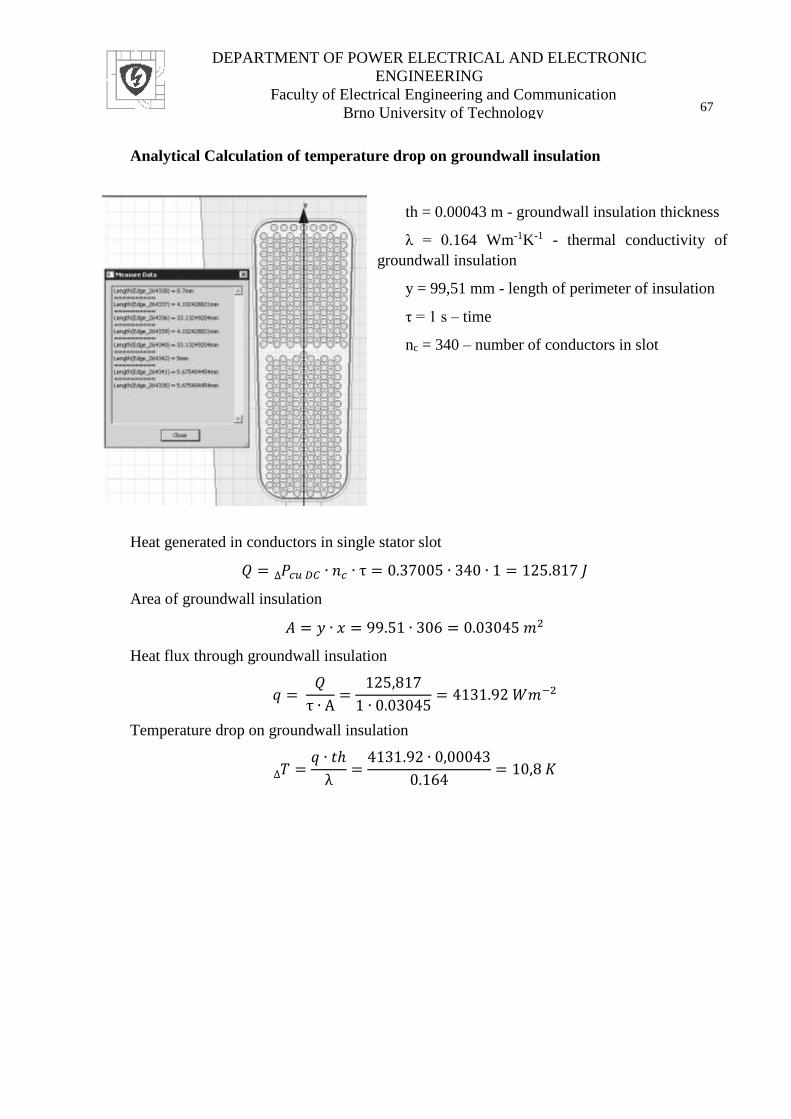
DEPARTMENT OF POWER ELECTRICAL AND ELECTRONIC
ENGINEERING
Faculty of Electrical Engineering and Communication
Brno University of Technology
67
Analytical Calculation of temperature drop on groundwall insulation
th = 0.00043 m - groundwall insulation thickness
λ = 0.164 Wm-1K-1 - thermal conductivity of
groundwall insulation
y = 99,51 mm - length of perimeter of insulation
τ = 1 s – time
nc = 340 – number of conductors in slot
Heat generated in conductors in single stator slot
𝑄 = 𝑃𝑐𝑢 𝐷𝐶 ∙ 𝑛𝑐 ∙ τ∆ = 0.37005 ∙ 340 ∙ 1 = 125.817 𝐽
Area of groundwall insulation
𝐴 = 𝑦 ∙ 𝑥 = 99.51 ∙ 306 = 0.03045 𝑚2
Heat flux through groundwall insulation
𝑞 = 𝑄
τ ∙ A=
125,817
1 ∙ 0.03045= 4131.92 𝑊𝑚−2
Temperature drop on groundwall insulation
𝑇∆ =
𝑞 ∙ 𝑡ℎ
λ=
4131.92 ∙ 0,00043
0.164= 10,8 𝐾