Optically active heterostructures of graphene and ultrathin MoS2
20
Author's Accepted Manuscript Optically active heterostructures of graphene and ultrathin MoS 2 Kallol Roy, Medini Padmanabhan, Srijit Goswa- mi, T. Phanindra Sai, Sanjeev Kaushal, Arindam Ghosh PII: S0038-1098(13)00440-7 DOI: http://dx.doi.org/10.1016/j.ssc.2013.09.021 Reference: SSC12165 To appear in: Solid State Communications Received date: 26 June 2013 Revised date: 17 September 2013 Accepted date: 19 September 2013 Cite this article as: Kallol Roy, Medini Padmanabhan, Srijit Goswami, T. Phanindra Sai, Sanjeev Kaushal, Arindam Ghosh, Optically active hetero- structures of graphene and ultrathin MoS 2 , Solid State Communications, http://dx. doi.org/10.1016/j.ssc.2013.09.021 This is a PDF file of an unedited manuscript that has been accepted for publication. As a service to our customers we are providing this early version of the manuscript. The manuscript will undergo copyediting, typesetting, and review of the resulting galley proof before it is published in its final citable form. Please note that during the production process errors may be discovered which could affect the content, and all legal disclaimers that apply to the journal pertain. www.elsevier.com/locate/ssc
Transcript of Optically active heterostructures of graphene and ultrathin MoS2

Author's Accepted Manuscript
Optically active heterostructures of grapheneand ultrathin MoS2
Kallol Roy, Medini Padmanabhan, Srijit Goswa-mi, T. Phanindra Sai, Sanjeev Kaushal, ArindamGhosh
PII: S0038-1098(13)00440-7DOI: http://dx.doi.org/10.1016/j.ssc.2013.09.021Reference: SSC12165
To appear in: Solid State Communications
Received date: 26 June 2013Revised date: 17 September 2013Accepted date: 19 September 2013
Cite this article as: Kallol Roy, Medini Padmanabhan, Srijit Goswami, T.Phanindra Sai, Sanjeev Kaushal, Arindam Ghosh, Optically active hetero-structures of graphene and ultrathin MoS2, Solid State Communications, http://dx.doi.org/10.1016/j.ssc.2013.09.021
This is a PDF file of an unedited manuscript that has been accepted forpublication. As a service to our customers we are providing this early version ofthe manuscript. The manuscript will undergo copyediting, typesetting, andreview of the resulting galley proof before it is published in its final citable form.Please note that during the production process errors may be discovered whichcould affect the content, and all legal disclaimers that apply to the journalpertain.
www.elsevier.com/locate/ssc

Optically active heterostructures of graphene and ultrathin MoS2
Kallol Roy1, Medini Padmanabhan1, Srijit Goswami1∗, T.
Phanindra Sai1, Sanjeev Kaushal2, and Arindam Ghosh1
1Department of Physics, Indian Institute of Science, Bangalore 560012, India and
2Tokyo Electron Ltd., Akasaka Biz Tower,
3-1 Akasaka 5-Chome, Minato-ku, Tokyo 107-6325, Japan
Abstract
Here we present the fabrication and characterisation of a new class of hybrid devices where the
constituents are graphene and ultrathin molybdenum di-sulphide (MoS2). This device is one of the
simplest member of a family of hybrids where the desirable electrical characteristics of graphene
such as high mobility are combined with optical activity of semiconductors. We find that in the
presence of an optically active substrate, considerable photoconductivity is induced in graphene
which is persistent up to a time scale of at least several hours. This photo induced memory can
be erased by the application of a suitable gate voltage pulse. This memory operation is stable for
many cycles. We present a theoretical model based on localized states in MoS2 which explains the
data.
Keywords:
A. Graphene;
A. Molybdenum disulfide;
D. Photoconductivity;
C. Heterostructure.
∗ Current address: Kavli Institute of Nanoscience, Delft University of Technology, P.O. Box 5046, 2600 GA
Delft, The Netherlands.
1

I. INTRODUCTION
Graphene is arguably the most researched layered material in the world today. The re-
sounding success of graphene[1, 2] builds on its extremely high bipolar carrier mobility[3],
band-structure dependent transport noise[4–7], as well as non-conventional information re-
sources such as valleys[8]. Recently this has led researchers to expand their interests to
explore possibility of ‘graphene analogues’ in the field of layered materials. For example,
MoS2 with its optical sensitivity [9–11], and BN with its low trap density and high dielectric
constant are being currently investigated for device applications[12, 13]. Combining two
or more of such layered materials can give rise to interesting heterostructures where the
desirable qualities of individual components can be combined to achieve novel device archi-
tectures. In this paper, we review our recent work on hybrid devices where the constituents
are graphene and ultrathin MoS2. We find that a considerable photoconductivity is induced
in graphene in the presence of MoS2 and that the photoconductivity is persistent. We exploit
this property of the system to demonstrate a memory device which has an optical ‘read’ and
electrical ‘write’ feature.
When combined with its superior electrical properties [5, 14], the optical properties of
graphene such as strong coupling to light over wide range of wavelengths [15, 16] and fast
recombination lifetimes [17, 18] make it a prominent candidate for optoelectronic devices.
Ultra-fast photodetectors [19] have been demonstrated in graphene where the photocurrent
is generated at a metal contact or a p− n junction. Two mechanisms, photovoltaic [20, 21]
and photothermal [22–24], have been proposed to explain the generation of this photocur-
rent. However, an improvement in photoconductivity by many orders of magnitude has been
achieved recently by combining graphene with other light absorbing materials such as quan-
tum dots [25] and chromophores [26], which indicates that exotic optoelectronic response
could be engineered in graphene based hybrids with an appropriate choice of complementary
materials.
Molybdenum disulphide (MoS2) is intrinsically responsive to light, owing to its bandgap
which increases from about 1.2 eV (indirect) in bulk/multilayer MoS2 to 1.9 eV (direct) for
a single molecular layer [27]. Along with luminescence [28] and negative photoconductiv-
ity [29], two dimensional (2D) sheets of MoS2 display desirable field-effect properties such
as high on-off ratio and gain which are promising for device applications. While this makes
2

MoS2 electronically analogous to graphene, the nature of electronic states in MoS2 was
found to be strongly localized [11], in sharp contrast to graphene, where charge carriers are
inherently protected against localization. Consequently a 2D graphene-MoS2 hybrid emu-
lates numerous doped semiconductor heterostructures and superlattices that display exotic
optoelectronic effects, in particular, persistent photoconductivity (PPC).
II. DESIGN OF GRAPHENE/MOS2 HYBRIDS
In fig. 1(a), we show a schematic of the transfer procedure by which a single-layer
graphene flake is transferred onto a few-layer MoS2 flake. This procedure is similar to
the one outlined in ref. [30]. Graphene is first exfoliated onto a glass slide covered with a
transparent tape and a polymer layer. Separately, MoS2 is transferred to a Si/SiO2 substrate
by standard mechanical exfoliation. The two are aligned under a microscope and brought
into contact at an elevated temperature (∼ 100 C), which results in the transfer of graphene
onto MoS2.
Once transferred onto MoS2, graphene is etched into a desired shape by oxygen plasma.
Contacts are drawn using standard e-beam lithography and metallization is done with Ti/Au
(15 nm/45 nm) or Cr/Au (15 nm/45 nm). Measurements are done on graphene using a
standard four-probe lock-in technique at a temperature of ∼ 100 C. Commercial white
LED is used here as the light source. A schematic of the device is shown in fig. 1(b).
Raman spectrum of graphene on MoS2 is shown in fig. 1(c) along with a single lorentzian
fit [31].
III. CONTROL DEVICES
We first present data from two control devices which clearly show that the hybrid archi-
tecture is necessary for the observation of non-trivial optoelectronic phenomena. In figure
2(a) we present data from a graphene flake exfoliated on Si/SiO2 substrate. The figure
shows the four-probe resistance (R) as a function of gate voltage. Characteristic features of
graphene including a Dirac point (VD) close to Vg = 0 are observed. Note that both elec-
tron and hole dopings are achieved in our device on either side of VD. A scanning electron
micrograph (SEM) of the device is shown in the inset.
3

The response of this device to white light (red vertical lines) and gate (blue vertical
lines) pulses are shown in fig. 2(b). Note that there is no detectable response to the light
pulse. This is expected since pristine graphene has a very short carrier recombination lifetime
[17, 18] which results in negligible photoconductivity. Transient resistance-spikes in response
to the gate pulses have been removed for clarity.
To illustrate the transistor-like behavior of MoS2, we present the variation of two-point
conductance (G = ISD/VSD, the ratio of source-drain current to voltage) of MoS2 with Vg
in fig. 2(c). This data is taken in a separate device with Au contacts on an MoS2 flake of
comparable thickness with VSD = 0.1 V. Natural MoS2 is known to be a nominally n-type
material. Recent studies in thin MoS2 flakes show that the electrical transport in these
systems is dominated by the presence of localized states induced by the disorder potential
due to the underlying SiO2 [11]. For Vg < Vt the Fermi level (EF ) of the system lies in the
conduction band tail which results in very low conductivity. As Vg is raised above Vt, EF is
pushed towards the extended states thereby causing conductivity to increase.
The response of the bare MoS2 device to light and gate pulses is shown in fig. 2(d).
Given that the bandgap of bulk MoS2 is 1.3 eV [9], we expect the device to exhibit photo-
conductivity [32]. We see that for Vg>∼ Vt this is indeed true, whereas for Vg
<∼ Vt there is
no detectable response to light. To understand this gate dependence of photoconductivity,
we recall that for Vg < Vt, EF lies deep within the localized states which results in very
low conductivity. Although illumination with white light results in raising the quasi-Fermi
level of electrons, it is presumably still stuck within the localized states. Thus, the free
electron carrier concentration in the conduction band is negligible even when the sample is
illuminated. Therefore, no appreciable conductivity change occurs in our device for Vg < Vt.
However, as Vg is raised to higher values, EF is pushed closer to the conduction band edge
which consists of extended states. A slight increase in the quasi Fermi level (as a result of
illumination) is now detectable as a conductivity change. Again, in fig. 2(d), the transient
spikes in response to the pulsing of Vg have been removed for clarity.
IV. INDUCED PHOTOCONDUCTIVITY IN GRAPHENE/MOS2 HYBRID
Figure 3(a) shows the four-probe resistance (R) of graphene on MoS2 as a function of
gate voltage (Vg). In the absence of light (black line) left side of the Dirac point shows
4

the usual R − Vg characteristics of graphene where as on the right side the effect of gate
voltage becomes insignificant after some threshold value. This asymmetric response can be
explained by considering the fact that MoS2 is known to act as a transistor [10, 11] itself. As
Vg is swept from very negative to very positive voltages, the nature of MoS2 changes from
dielectric to near-metallic. The value of Vg beyond which the underlying MoS2 transistor
turns ‘on’ is denoted as Vt. Thus for Vg >> Vt, the metallic nature of MoS2 effectively
screens Vg thereby causing the R− Vg curve of the overlying graphene to saturate beyond a
certain value. The R−Vg curve in presence of light is shown by the solid red line in fig. 3(a).
Note that there is a pronounced effect only on the negative side of the Dirac curve where
an increase in resistance is observed in the presence of light. It can be inferred that some
of the photo-generated carriers created inside MoS2 are transferred to graphene at negative
gate biases.
The gate voltage dependence of photoconductivity is further elucidated in fig. 3(b) where
we show the change in resistance of the sample as a function of time. White light is peri-
odically turned on and off as indicated by the vertical lines. Data is reported as the ratio
of the resistance-change caused by illumination (∆R1) to the average value (Rmid). We
notice that appreciable photoconductivity is seen in the device only for Vg < Vt. In this
regime, MoS2 acts like a dielectric, thereby sustaining a large in-built electric field. When
light is signed on this device, electron hole pairs (EHP) which are generated inside MoS2
are swept in opposite directions by this field. The direction of the electric field is such that
electrons are transferred to graphene and the holes are swept to the MoS2/SiO2 interface.
The addition of electrons to the already hole-doped graphene results in an increase in re-
sistance of graphene as seen in our experiments. When Vg > Vt, MoS2 has a significant
metallic character which results in negligible electric field in the bulk of MoS2. When EHPs
are generated as a result of illumination, a significant percentage of them recombine within
the bulk before being transferred to graphene. We postulate that this is the reason for
diminished photoconductivity for Vg > Vt. The difference in the band bending inside MoS2
which causes the asymmetry in the photoresponse of the system is schematically shown in
the inset of fig. 3(a). Since the graphene work function (∼ 4.5 eV ) is lower than the MoS2
work function (∼ 5 eV ) we neglect the formation of Schottky barrier between graphene and
MoS2 interface. Electric filed inside MoS2 because of gate electric field determines the charge
transfer mechanism.
5

V. PERSISTENT PHOTOCONDUCTIVITY
We would like to point out that the data shown in fig. 3(b) does not include the response
of the system when light is turned on for the very first time. This is shown in fig. 4. Note
that the initial dark resistance of the system (Ri) is ∼ 0.93 kΩ. When light is turned on for
the first time, the resistance of the system increases rapidly and saturates to a value given
by Rl. Subsequent actions of turning light on an off results in a photoresponse similar to
the one shown in fig. 3(b). However, note that, the system does not return to the initial
dark state even after a long time. We denote this persistent state as Rp. Note that ∆R1
as defined in fig. 3(b) refers to Rl −Rp. This persistent photoconductivity (PPC) is indeed
present in our samples over a wide range of gate voltages and is observed to be stable for
several hours. In the subsequent sections, we demonstrate a memory/switching device which
exploits the PPC in our system.
VI. MEMORY EFFECT
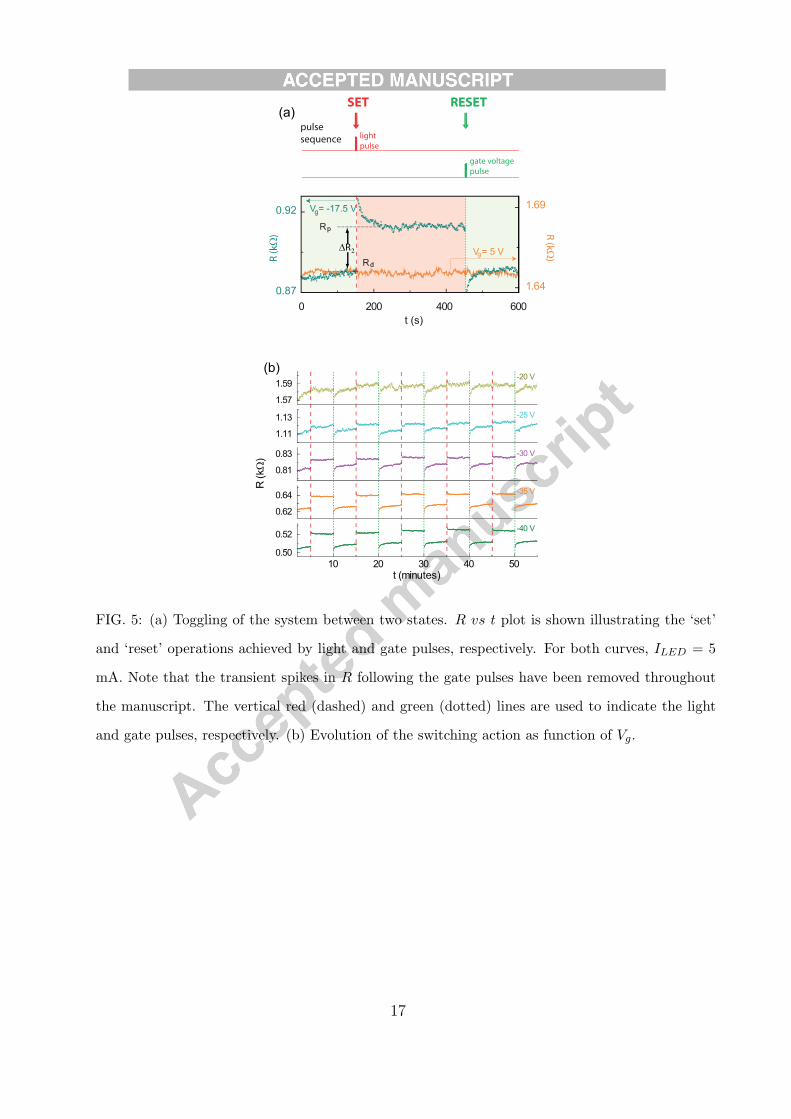
In fig. 5(a), we illustrate the persistent photoconductivity (PPC) and an associated
switching action in our device in greater details. We plot resistance as a function of time at
a fixed gate voltage of -17.5 V. The application of a light pulse causes the resistance to spike.
The value to which the resistance settles down is different from the initial value indicating
the PPC in our system. The original state can however be recovered by the application of a
gate pulse as shown (in this case, ∆V = 20V ). The resulting pulse sequence can be repeated
many times recovering the persistent state resistance with 95% accuracy. The quantity ∆R2
is defined as the difference between these two states as shown in the figure. The logical
operations which result in the toggling of the system between two resistance states are illus-
trated in fig. 5(a). Note that this effect is clearly observable only for gate voltages Vg ≪ Vt.
At Vg > Vt, the system does not respond to a light pulse.
In order to further elucidate the gate voltage dependence of the switching action, we
show data taken at various Vg in fig. 5(b). In all the cases light pulse width, intensity, gate
pulse width and gate pulse height have been kept constant. Note that the effect is almost
nonexistent for Vg >-20 V.
Similar experiments have been repeated with various light intensities (corresponding to
6

different currents through the LED as shown in fig. 6(a)) and the results are summarized in
fig. 6(b) where ∆R2/R is plotted as a function of Vg. We make the following observations: 1)
at a given Vg, ∆R2/R increases with increasing light intensity and saturates after a certain
threshold, and 2) for a given light intensity ∆R2/R increases with increasing magnitude of
Vg. Thus, we show that the response of the device can be controlled by Vg and the intensity
of light.
In fig. 6(c) we show the effect of the magnitude of the gate pulse. Here, we attempt to
retrieve the dark state of the system by gate pulses of varying magnitude as indicated in the
figure. We find that initially a greater Vg pulse results in a better retrieval, although after a
threshold (in this case ∆V = 20 V), the recovery is no longer sensitive to the pulse height.
Another factor which determines the magnitude of ∆R2 is the duration of the light pulse as
illustrated in fig. 6(d). The longer the duration of the light pulse, the greater is the value
of ∆R2.
VII. THEORETICAL MODELING
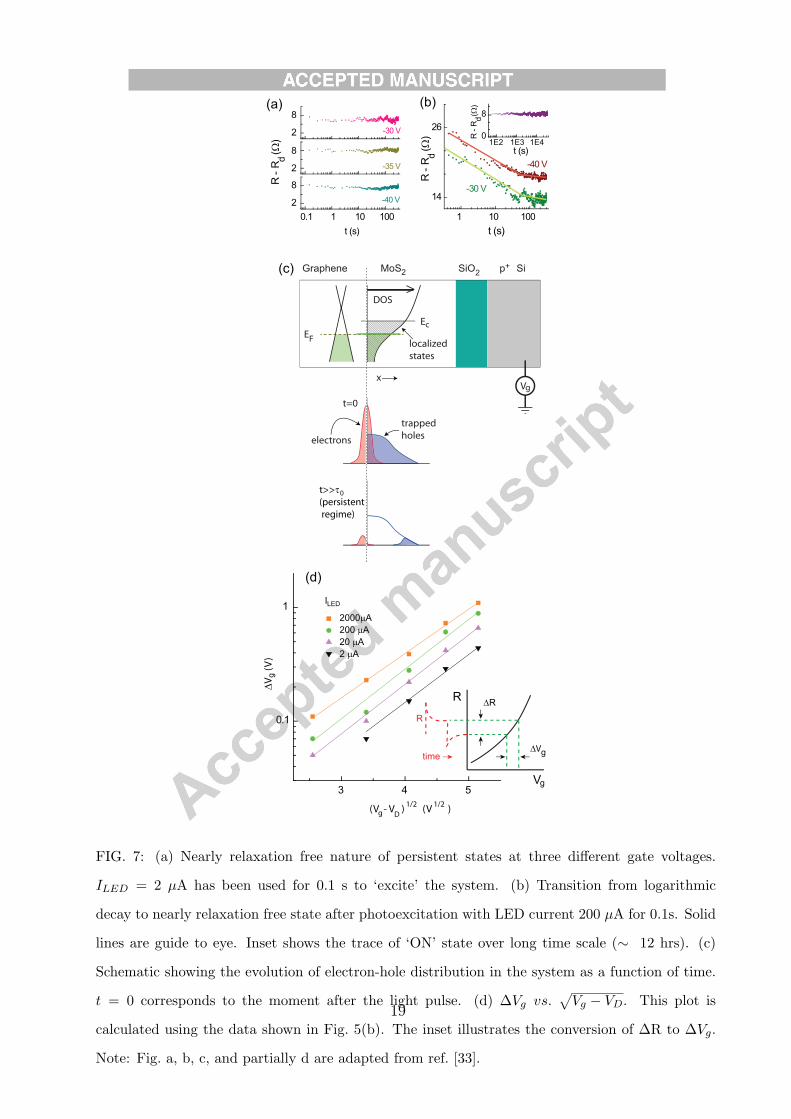
A key feature of the switching cycles in Fig. 5a is the absence of a time-dependent
decay in the photoconductivity in the persistent state, particularly at low photo-illumination
intensity. In Fig. 7a we have plotted the photoconductivity in the persistent state in one of
the cycles after a low-intensity pulse (ILED = 2 µA) for three different Vg. The PPC shows
no decay with time over three decades irrespective of Vg, remaining essentially constant even
when we monitored it over more than 10 hours (inset of Fig. 7b, here ILED = 5 µA and
Vg = −40V have been used). At higher ILED (>∼ 50 µA), we do observe a logarithmic decay
at times <∼ 50 s, although at long times photoconductivity becomes nearly time-independent
again. This is illustrated in Fig. 7b with PPC relaxation for ILED = 200 µA pulses.
The near-absence of time decay of the persistent state suggests a strong potential barrier
that prohibits recombination of electron and holes created on photo-illumination. To under-
stand this we note that the majority carriers (electrons) in natural MoS2 flakes are strongly
localized [11], and display Mott-type variable range hopping transport when Vg is reduced to
the conduction threshold Vt. Thus our graphene-MoS2 hybrid behaves as a heterojunction
of a doped conducting system (graphene) and a semiconductor (MoS2) where the carriers
are localized, and trapped in potential wells that separate them from the conducting re-
7

gion [34]. Vt represents the gate voltage at which the Fermi energy (EF ) approaches the
mobility edge (Ec). Following ref. [34], the logarithmic decay in PPC can be explained with
simple theoretical model.
Consider a graphene sheet lying on a MoS2 substrate of thickness d. Time t = 0 denotes
the moment when photoexcitation is turned off. The photogenerated carriers are swept by
the electric field due to the applied gate voltage so that the electrons are transferred to
graphene and the holes remain trapped in the MoS2 substrate. We assume a uniform vol-
ume density of trapped holes in the substrate given by Z. The instantaneous photo-electron
density in graphene at time t is denoted by n(t). For t > 0, electron-hole recombination
occurs. The electron-hole pairs which are spatially close recombine quickly while the farther
ones recombine slowly leading to persistent photoconductivity. This is schematically indi-
cated in fig. 7(c). Strong localization in MoS2 makes recombination via quantum tunneling
or thermal activation virtually ineffective, and the equilibrium is restored only by lifting EF
to EC , which provides the “erasing” mechanism of the PPC as R reverts to its dark-state
resistance.
We follow the theoretical treatment given by Queisser et al. [34] where the authors trans-
late the spatial separation shown in fig. 7(c) into a time dependence, but generalize their
analysis to include the effect of gate voltage. Our microscopic model relies on the fact that
the excess number of electrons left behind in graphene at the Fermi energy EF is necessarily
equal to the number of trapped holes in MoS2 at EF . This is proportional to the joint prob-
ability of two events: (1) quantum tunneling mediated electron-hole recombination, which
results in the time dependent probability density p(x, t) of finding a trapped hole at distance
x inside MoS2 from the MoS2/graphene interface, and time t, and second, (2) probability
of thermal excitation of a hole from the hole-doped graphene to MoS2. The latter involves
excitation across the energy barrier ∆E = −Ec−(−EF ) = EF −Ec, where the signs account
for the excitation of a hole state, and Ec represents the mobility edge.
The recombination rate of holes is given by a space-dependent recombination lifetime as:
dp(x, t)
dt=
−p(x, t)
τ0 exp(2x/ξ). (1)
Here τ0 represents the time constant for no spatial separation and ξ is a length scale of the
order of the effective Bohr radius in MoS2 due to strong localization. Integrating, we get
p(x, t) = p(x, 0) exp[−(t/τ0) exp(−2x/ξ)]. (2)
8

Thus, the net excess electron density in graphene can be expressed as,
n(t) = A exp [−∆E/kBT ]∫ d
0p(x, t)dx
= A exp [(Ec − EF )/kBT ]
×∫ d
0p(x, 0) exp[−(t/τ0) exp(−2x/ξ)]dx. (3)
where A is a gate voltage and time-independent normalization constant.
We now adapt the sharp-front approximation given by Queisser et al. [34] valid for t >> τ0
which states that at a given t, all traps located before a particular distance xs are assumed to
be neutralized. xs is defined by assuming that all carriers with lifetime t+τ0 have recombined
at time t. That is, τ0 exp(2xs/ξ) = t+ τ0, which gives:
xs(t) = (ξ/2)ln(t/τ0) for t >> τ0. (4)
The integral in eqn. (3) can be simplified as:
n(t) = A exp [(Ec − EF )/kBT ]∫ d
xs
p(x, 0)dx
= A exp [(Ec − EF )/kBT ]∫ d
xs
p(x, 0)dx
= ZA(d− xs) exp [(Ec − EF )/kBT ]
= AZd(1− (xs/d)) exp [(Ec − EF )/kBT ].
here we assume that p(x, 0) is a box distribution with height Z and width d. The expression
for n(t) thus becomes, with a constant prefactor Z0 = AZ,
n(t) = Z0d f(t) exp[(EC − EF )/kBT ] (5)
where f(t) = 1− (ξ/2d) ln(t/τ0).
Thus, the time dependence of the decay of photogenerated electron density, and hence
that of the resistance (given that the change is resistance due to illumination is much smaller
than that absolute value of resistance) is given by:
R(t) = RA −RBln(t/τ0), (6)
where RA and RB are time independent constants.
9

It is important to note that for higher LED intensity values f(t) deviates from logarithmic
nature at large time and becomes nearly time independent (Fig. 7b). Such a nearly decay
free ‘ON’ state is observed also when the intensity of LED pulse is low (Fig 7a). The ‘sharp
front’ approximation is likely to break down at very long time and for weak illumination,
as the distribution of trapped holes possibly becomes inhomogeneous. This can be viewed
as formation of discrete hole pockets in MoS2, so that p(x, 0) ∼ δ(x − d), where d is the
distance from the interface. In such a limit, n(t) ∼ exp(−t/τ), where τ = τ0 exp(2d/ξ).
Since τ0 ∼ 10−9 sec, if we take d ∼ 10 nm (the order of MoS2 thickness) and ξ ∼ 0.5 nm
(Bohr radius) we find τ ∼ 108 s, which indicates that lifetime of ‘ON’ state could exceed
2− 5 years!
At a given time t >> τ0, the remnant photo-electron density in graphene, denoted by
∆ng, is given by
∆ng = no exp(−EF/kBT ). (7)
Here no is a slowly varying function of t, assumed to be constant over experimental
timescales. Note that this expression captures the gate voltage dependence of ∆ng. For
hole-doped graphene,
EF = −hvFkF = −hvF√πng
= −hvF√(π/e)Ceff |Vg − VD| (8)
where vF and kF are the Fermi velocity and wave vector in graphene, ng is the total electron
density in graphene, and Ceff is the effective capacitance of the system.
To compare with our data, we define a quantity ∆Vg = (e/Ceff )∆ng. Thus, we have
∆Vg = VC exp(β√|Vg − VD|) (9)
where VC and β are constants and are independent of Vg.
In fig. 7(d), we plot ∆Vg vs.√|Vg − VD| for various light intensities which shows good
agreement with our model. Experimentally, we get β ≈ 1.1 which indicates that Ceff is
about a factor of ∼ 5 smaller than the bare capacitance of 285 nm SiO2 that we used as
gate dielectric. This can be readily attributed to the quantum capacitance of the MoS2
film which acts as a ‘leaky’ capacitor. Note that, if we consider this modified value of the
capacitance, we find that the mobility of graphene in our sample is ∼ 12, 000 cm2V−1s−1
which is higher than that typically obtained for exfoliated graphene on bare SiO2 substrates.
10

VIII. CONCLUSION
In conclusion, we fabricate graphene - MoS2 hybrid devices by transferring micron-sized
flakes of single-layer-graphene onto micron-sized flakes of few-layer-MoS2. We observed
induced photoconductivity in graphene which is found to be persistent on a time scale of
hours. The persistent state can be reverted back to the original dark state by the application
of a voltage pulse on the underlying backgate. We illustrate an optical-write, electrical-read
device based in the above properties. We also present a theoretical model based on localized
electronic states in MoS2 which quantitatively explains our data.
IX. ACKNOWLEDGEMENT
We are grateful to Prof. Raghavan, Materials Research Center, IISc for providing us
with CVD graphene which was used in a later part of this study. We thank Department of
Science & Technology and Tokyo Electron Limited for financial support.
[1] Geim, N. K. S., A. K. The rise of graphene. Nat. Mater. 6, 183 – 191 (2007).
[2] Geim, A. K. Graphene: Status and prospects 324, 1530–1534 (2009).
[3] Bolotin, K. I. et al. Ultrahigh electron mobility in suspended graphene. Solid State Commu-
nications 146, 351–355 (2008). URL www.scopus.com. Cited By (since 1996):1347.
[4] Pal, A. N. & Ghosh, A. Resistance noise in electrically biased bilayer graphene. Phys. Rev.
Lett. 102, 126805 (2009).
[5] Pal, A. N. & Ghosh, A. Ultralow noise field-effect transistor from multilayer graphene. Applied
Physics Letters 95, 082105 (2009).
[6] Pal, A. N. et al. Microscopic mechanism of 1/f noise in graphene: Role of energy band
dispersion. ACS Nano 5, 2075–2081 (2011).
[7] Pal, A. N., Bol, A. A. & Ghosh, A. Large low-frequency resistance noise in chemical vapor
deposited graphene. Appl. Phys. Lett. 97, 133504 (2010).
[8] Pal, A. N., Kochat, V. & Ghosh, A. Direct observation of valley hybridization and universal
symmetry of graphene with mesoscopic conductance fluctuations. Phys. Rev. Lett. 109, 196601
(2012).
11

[9] Mak, K. F., Lee, C., Hone, J., Shan, J. & Heinz, T. F. Atomically thin MoS2: A new direct-gap
semiconductor. Phys. Rev. Lett. 105, 136805 (2010).
[10] Radisavljevic, B., Radenovic, A., Brivio, J., Giacometti, V. & Kis, A. Single-layer MoS2
transistors. Nature Nanotech. 6, 147150 (2011).
[11] Ghatak, S., Pal, A. N. & Ghosh, A. Nature of electronic states in atomically thin MoS2
field-effect transistors. ACS Nano 5, 7707–7712 (2011).
[12] Jin, C., Lin, F., Suenaga, K. & Iijima, S. Fabrication of a freestanding boron nitride single
layer and its defect assignments. Phys. Rev. Lett. 102, 195505 (2009).
[13] Dean., C. et al. Boron nitride substrates for high-quality graphene electronics. Nature Nan-
otech. 5, 722–726 (2010).
[14] Das Sarma, S., Adam, S., Hwang, E. H. & Rossi, E. Electronic transport in two-dimensional
graphene. Rev. Mod. Phys. 83, 407–470 (2011).
[15] Dawlaty, J. M. et al. Measurement of the optical absorption spectra of epitaxial graphene
from terahertz to visible. Appl. Phys. Lett. 93, 131905 (2008).
[16] Nair, R. R. et al. Fine structure constant defines visual transparency of graphene. Science
320, 1308 (2008).
[17] George, P. A. et al. Ultrafast optical-pump terahertz-probe spectroscopy of the carrier relax-
ation and recombination dynamics in epitaxial graphene. Nano Lett. 8, 4248–4251 (2008).
[18] Urich, A., Unterrainer, K. & Mueller, T. Intrinsic response time of graphene photodetectors.
Nano Lett. 11, 2804–2808 (2011).
[19] Xia, F., Mueller, T., Lin, Y.-m., Valdes-Garcia, A. & Avouris, P. Ultrafast graphene photode-
tector. Nature Nanotech. 4, 839–843 (2009).
[20] Xia, F. et al. Photocurrent imaging and efficient photon detection in a graphene transistor.
Nano Lett. 9, 1039–1044 (2009).
[21] Ghosh, S., Sarker, B. K., Chunder, A., Zhai, L. & Khondaker, S. I. Position dependent
photodetector from large area reduced graphene oxide thin films. Appl. Phys. Lett. 96, 163109
(2010).
[22] Xu, X., Gabor, N. M., Alden, J. S., van der Zande, A. M. & McEuen, P. L. Photo-
thermoelectric effect at a graphene interface junction. Nano Lett. 10, 562–566 (2010).
[23] Song, J. C. W., Rudner, M. S., Marcus, C. M. & Levitov, L. S. Hot carrier transport and
photocurrent response in graphene. Nano Lett. 11, 4688–4692 (2011).
12

[24] Gabor, N. M. et al. Hot carrier-assisted intrinsic photoresponse in graphene. Science 334,
648–652 (2011).
[25] Konstantatos, G. et al. Hybrid graphene-quantum dot phototransistors with ultrahigh gain.
Nature Nanotech. 7, 363–368 (2012).
[26] Kim, M., Safron, N. S., Huang, C., Arnold, M. S. & Gopalan, P. Light-driven reversible
modulation of doping in graphene. Nano Lett. 12, 182–187 (2012).
[27] Mak, K. F., Lee, C., Hone, J., Shan, J. & Heinz, T. F. Atomically thin MoS2: A new direct-gap
semiconductor. Phys. Rev. Lett. 105, 136805 (2010).
[28] Splendiani, A. et al. Emerging photoluminescence in monolayer MoS2. Nano Lett. 10, 1271–
1275 (2010).
[29] Serpi, A. Negative photoconductivity in MoS2. Phys. Stat. Sol. (a) 133, K73–K77 (1992).
[30] Zomer, P. J., Dash, S. P., Tombros, N. & van Wees, B. J. A transfer technique for high
mobility graphene devices on commercially available hexagonal boron nitride. Appl. Phys.
Lett. 99, 232104 (2011).
[31] Ferrari, A. C. et al. Raman spectrum of graphene and graphene layers. Phys. Rev. Lett. 97,
187401 (2006).
[32] Lopez-Sanchez, O., Lembke, D., Kayci, M., Radenovic, A. & Kis, A. Ultrasensitive photode-
tectors based on monolayer MoS2. Nat Nano (2013).
[33] Roy, K. et al. Multifunctional graphene-MoS2 hybrid for colossal photoresponsivity and
relaxation-free opto-electronic memory. Under review .
[34] Queisser, H. J. & Theodorou, D. E. Decay kinetics of persistent photoconductivity in semi-
conductors. Phys. Rev. B 33, 4027–4033 (1986).
13

Si
SiO2 SiO2
Si
SiO2SiO2
Si
MoS2
SiO2
graphene
glass slidetransparent tape
polymer
Si
graphene
on SiO 2
graphene
on MoS2
I+ I-V+ V-
(c)
2630 2730
wavenumber (cm )-1
(b)
I
I
V
V
--
+
+
MoS2
grapheneSi substrate
(a)
cou
nts
(a
.u.)
FIG. 1: Device fabrication (a) Schematic of transfer process with corresponding optical images
(scale bars are of 10 µm length). The doted line in the third optical image indicates the outline of
graphene. (b) Schematic of the final device. (c) Raman spectrum of graphene on MoS2. Only the
2D peak is shown with the single lorentzian fit.
14

R (MΩ
)
R (kΩ
)
0.23
0.25
0.34
0.36
0.90
0.92
18
1.89
1.91
-10V
-30V
30V
10V
24 30
t (minutes)
6.40
7.20
1.80
2.00
4.80
5.60
50 1000.119
0.121
40V
30V
20V
-40V
-30V
0.129
0.132
0.145
0.149
-20V
t (s)
-60 -30 0 30 60
0
30
60
90
-30 -15 0 15 300
2
4
6
V (V) gR
(kΩ
)V (V) g
bare graphene bare MoS2
(a)
2 µm
(b)
(c)
(d)
G (
x 1
0 -
7 Ω
-1)
FIG. 2: Vg dependent (a) resistance of graphene on SiO2 and (c) conductance of MoS2 on SiO2.
Response of (b) single layer graphene on Si/SiO2 and (d) thin layer MoS2 on Si/SiO2 to light and
gate pulses at different gate voltages. The vertical red (dashed) and blue (dotted) lines in (b) and
(d) are used to indicate the light and gate pulses, respectively. Note that, a few points representing
the transient response to gate pulse have been removed for clarity.
15

0 6 12 18 24 30
-8
8
-8
8
-8
8
-8
8
-8
8
∆R
1 / R
mid
(%
)
time (minutes)
-30 V
-20 V
0 V
V = +10 V
-10 V
g
(b)(a)
-30 0
0.6
1.2
1.8
R
(kΩ
)
30Vg (V)
light
dark
V > V g tV < V g t
FIG. 3: (a) R−Vg curve for exfoliated single-layer graphene on MoS2. Inset: Band bending inside
MoS2 at two extreme gate voltages which results in different pathways for the optically generated
EHPs. (b) Response of the device to illumination by white light. The red (solid) lines represent
the moments in time when light is turned on. The green (dashed) lines correspond to light being
turned off.
0 600 1200 1800
0.95
1.00
1.05
R (
kΩ
)
t (s)
Ri
Rl
Rp
FIG. 4: Response of the system to light. Note that there are three levels for the resistance here. The
initial dark value (Ri), a value under continuous illumination (Rl) and an intermediate persistent
state which is attained when light is turned off (Rp).
16
t (s)
R (kΩ
)R (
kΩ
)
pulse
sequence
SET RESET
gate voltage
pulse
light
pulse
V = 5 V
1.64
1.69
0 200 400 600
0.87
0.92
g
V = -17.5 Vg
∆R
(a)
R p
R d
t (minutes)
R (
kΩ
)
10 20 30 40 500.50
0.52
-40 V
0.62
0.64 -35 V
0.81
0.83 -30 V
1.11
1.13 -25 V
1.57
1.59-20 V
(b)
2
FIG. 5: (a) Toggling of the system between two states. R vs t plot is shown illustrating the ‘set’
and ‘reset’ operations achieved by light and gate pulses, respectively. For both curves, ILED = 5
mA. Note that the transient spikes in R following the gate pulses have been removed throughout
the manuscript. The vertical red (dashed) and green (dotted) lines are used to indicate the light
and gate pulses, respectively. (b) Evolution of the switching action as function of Vg.
17

-40 -30 -20
1
3
5
V (V)
∆R
/R (%
)
R (
kΩ
) 2000µA
200 µA
20 µA
2 µA
t (minutes)
4 12 20
0.50
0.53
0.56
2000µA200 µA
20 µA2 µA
(c)
d
ILEDILED
V = -40 Vg
g
0 1000 2000 3000
0.84
0.86
0.88
R (kΩ
)
t (s)
0 400 800
0.6
0.7
0.8
R (kΩ
)
(a) (b)
(d)
2
t (s)
∆V = 5 V
10 V
20 V 30 V
Rp
Rd
R l
∆R
∆R
2
1
FIG. 6: (a) Switching action for four different light intensities at a given Vg (b) Percentage change
in resistance as a function of Vg for various illumination intensities. The values of current flowing
through the illumination LED are indicated. (c) Effect of the gate pulse height on the dark state
recovery. (b) Effect of the width of the light pulse on the switching effect.
18
E
E
DOS
Graphene MoS
t>>τ
(persistent
regime)
t=0
trapped
holeselectrons
localized
states
SiO p Si22
+
Vg
c
F
x
(c)
0
(V - V ) (V )g D
1/2 1/2
∆V
(V
)g
(d)
3 4 5
0.1
12000µA
200 µA
20 µA
2 µA
I LED
Vg
∆R
time∆Vg
R
R
1 10 100
14
26
1E2 1E3 1E40
8
-30 V
t (s)
-40 V
t (s)
R -
R (Ω
) d
R -
R ( Ω
) d
(a) (b)
0.1 1 10 100
2
8
2
8
2
8
-40 V
t (s)
-35 V
-30 V
R -
R (Ω
) d
FIG. 7: (a) Nearly relaxation free nature of persistent states at three different gate voltages.
ILED = 2 µA has been used for 0.1 s to ‘excite’ the system. (b) Transition from logarithmic
decay to nearly relaxation free state after photoexcitation with LED current 200 µA for 0.1s. Solid
lines are guide to eye. Inset shows the trace of ‘ON’ state over long time scale (∼ 12 hrs). (c)
Schematic showing the evolution of electron-hole distribution in the system as a function of time.
t = 0 corresponds to the moment after the light pulse. (d) ∆Vg vs.√Vg − VD. This plot is
calculated using the data shown in Fig. 5(b). The inset illustrates the conversion of ∆R to ∆Vg.
Note: Fig. a, b, c, and partially d are adapted from ref. [33].
19