Optical Switching and Networking - Arizona State...
15
Contents lists available at ScienceDirect Optical Switching and Networking journal homepage: www.elsevier.com/locate/osn FiWi network throughput-delay modeling with traffic intensity control and local bandwidth allocation Po-Yen Chen, Martin Reisslein ⁎ School of Electrical, Computer, and Energy Engineering, Arizona State University, Tempe, AZ 85287-5706, United States ARTICLE INFO Keywords: Fiber-Wireless (FiWi) network Input traffic rate control M/M/1/K queue Node level design Poisson traffic Throughput-delay analysis ABSTRACT Fiber-Wireless (FiWi) networks typically combine an optical access network with a wireless access network so as to build on the respective strengths of the optical and wireless network technologies. Prior analytical throughput-delay studies of FiWi networks have typically considered heavy-loaded traffic models, i.e., constantly backlogged source nodes. In contrast, in this paper we present a more general comprehensive FiWi network throughput-delay analysis that encompasses Poisson (non-heavy) as well as heavy-loaded input traffic models. In addition, our analysis covers bandwidth assignments of wireless channels both at the hop distance level and at the node level, as well as a queuing model of dynamic bandwidth allocation in the optical access network. Our analysis provides insightful guidelines for setting the channel access probabilities for source traffic and relay traffic in FiWi networks. Our numerical evaluations demonstrate that prior studies which considered only heavy traffic loads gave misleading results for the delay performance of well-known access probability assignments. We correct and clarify these misleading results with our more general analysis for non- heavy traffic. 1. Introduction A Fiber-Wireless (FiWi) network typically provides a high-speed optical backhaul network for a wireless mesh network (WMN) [1–6]. The optical backhaul network of a FiWi network is usually based on a passive optical network (PON) [7–16], whereby distributed Optical Network Units (ONUs) serve as backhaul gateways for clusters of WMN nodes. A fundamental design challenge in FiWi networks is to assign the WMN channel access opportunities to the different WMN nodes so as to enable efficient forwarding of the WMN traffic towards the ONUs for transmission to the central Optical Line Terminal (OLT) of the PON. In particular, each WMN node m i needs to be assigned a probability p i for channel access, and a probability q i for forwarding relay traffic (rather than transmitting its own source traffic within a given channel access opportunity). As reviewed in Section 2, prior research, e.g., [17,18], has studied these probability assignments and the resulting FiWi network throughput-delay performance for heavy- loaded traffic where all nodes are constantly backlogged. The heavy- loaded traffic model simplifies analysis and is commonly considered in order to make complex network models analytically tractable. With the heavy-loaded traffic model, source queues are constantly backlogged and are able to transmit a packet whenever offered a transmission opportunity. This prior research found that expediting the forwarding of relay packets, i.e., setting very high forwarding probabilities q i , reduces mean packet delays. In contrast, we analyze the FiWi network for a non-heavy Poisson traffic model. This non-heavy traffic model enables us to consider the queueing delays at the original source nodes, which were ignored in the prior heavy-traffic model studies. We find that our more general FiWi network model accommodating non-heavy Poisson traffic and the source node queueing delays leads to fundamentally different conclusions about the forwarding probability setting. In contrast to the heavy-traffic studies, such as [17,18], we find that expediting the forwarding of relay packets does not reduce the mean packet delay. Instead, we introduce i () an input traffic control strategy as well as ii ( ) a novel channel access and forwarding probability design strategy based on the traffic characteristics at the individual nodes to effectively reduce the mean packet delay. This article is organized as follows. Section 2 reviews related FiWi network research. Section 3 presents the FiWi network model, includ- ing the non-heavy Poisson traffic model and the queuing structure in the FiWi network nodes. Section 4 gives the mathematical FiWi network throughput-delay analysis. Section 5 introduces the input traffic control strategy as well as the node based transmission and forwarding probability design. Section 6 presents numerical results based on the mathematical analysis and verifying simulations. Section 7 summarizes the conclusion of this FiWi network analysis study. https://doi.org/10.1016/j.osn.2017.11.001 Received 22 March 2017; Received in revised form 4 October 2017; Accepted 2 November 2017 ⁎ Corresponding author. E-mail addresses: [email protected] (P.-Y. Chen), [email protected] (M. Reisslein). Optical Switching and Networking 28 (2018) 8–22 Available online 03 November 2017 1573-4277/ © 2017 Elsevier B.V. All rights reserved. MARK
Transcript of Optical Switching and Networking - Arizona State...

Contents lists available at ScienceDirect
Optical Switching and Networking
journal homepage: www.elsevier.com/locate/osn
FiWi network throughput-delay modeling with traffic intensity control andlocal bandwidth allocation
Po-Yen Chen, Martin Reisslein⁎
School of Electrical, Computer, and Energy Engineering, Arizona State University, Tempe, AZ 85287-5706, United States
A R T I C L E I N F O
Keywords:Fiber-Wireless (FiWi) networkInput traffic rate controlM/M/1/K queueNode level designPoisson trafficThroughput-delay analysis
A B S T R A C T
Fiber-Wireless (FiWi) networks typically combine an optical access network with a wireless access network so asto build on the respective strengths of the optical and wireless network technologies. Prior analyticalthroughput-delay studies of FiWi networks have typically considered heavy-loaded traffic models, i.e.,constantly backlogged source nodes. In contrast, in this paper we present a more general comprehensiveFiWi network throughput-delay analysis that encompasses Poisson (non-heavy) as well as heavy-loaded inputtraffic models. In addition, our analysis covers bandwidth assignments of wireless channels both at the hopdistance level and at the node level, as well as a queuing model of dynamic bandwidth allocation in the opticalaccess network. Our analysis provides insightful guidelines for setting the channel access probabilities for sourcetraffic and relay traffic in FiWi networks. Our numerical evaluations demonstrate that prior studies whichconsidered only heavy traffic loads gave misleading results for the delay performance of well-known accessprobability assignments. We correct and clarify these misleading results with our more general analysis for non-heavy traffic.
1. Introduction
A Fiber-Wireless (FiWi) network typically provides a high-speedoptical backhaul network for a wireless mesh network (WMN) [1–6].The optical backhaul network of a FiWi network is usually based on apassive optical network (PON) [7–16], whereby distributed OpticalNetwork Units (ONUs) serve as backhaul gateways for clusters of WMNnodes. A fundamental design challenge in FiWi networks is to assignthe WMN channel access opportunities to the different WMN nodes soas to enable efficient forwarding of the WMN traffic towards the ONUsfor transmission to the central Optical Line Terminal (OLT) of thePON. In particular, each WMN node mi needs to be assigned aprobability pi for channel access, and a probability qi for forwardingrelay traffic (rather than transmitting its own source traffic within agiven channel access opportunity). As reviewed in Section 2, priorresearch, e.g., [17,18], has studied these probability assignments andthe resulting FiWi network throughput-delay performance for heavy-loaded traffic where all nodes are constantly backlogged. The heavy-loaded traffic model simplifies analysis and is commonly considered inorder to make complex network models analytically tractable. With theheavy-loaded traffic model, source queues are constantly backloggedand are able to transmit a packet whenever offered a transmissionopportunity. This prior research found that expediting the forwarding
of relay packets, i.e., setting very high forwarding probabilities qi,reduces mean packet delays.
In contrast, we analyze the FiWi network for a non-heavy Poissontraffic model. This non-heavy traffic model enables us to consider thequeueing delays at the original source nodes, which were ignored in theprior heavy-traffic model studies. We find that our more general FiWinetwork model accommodating non-heavy Poisson traffic and the sourcenode queueing delays leads to fundamentally different conclusions aboutthe forwarding probability setting. In contrast to the heavy-traffic studies,such as [17,18], we find that expediting the forwarding of relay packetsdoes not reduce the mean packet delay. Instead, we introduce i( ) an inputtraffic control strategy as well as ii( ) a novel channel access andforwarding probability design strategy based on the traffic characteristicsat the individual nodes to effectively reduce the mean packet delay.
This article is organized as follows. Section 2 reviews related FiWinetwork research. Section 3 presents the FiWi network model, includ-ing the non-heavy Poisson traffic model and the queuing structure inthe FiWi network nodes. Section 4 gives the mathematical FiWinetwork throughput-delay analysis. Section 5 introduces the inputtraffic control strategy as well as the node based transmission andforwarding probability design. Section 6 presents numerical resultsbased on the mathematical analysis and verifying simulations. Section7 summarizes the conclusion of this FiWi network analysis study.
https://doi.org/10.1016/j.osn.2017.11.001Received 22 March 2017; Received in revised form 4 October 2017; Accepted 2 November 2017
⁎ Corresponding author.E-mail addresses: [email protected] (P.-Y. Chen), [email protected] (M. Reisslein).
Optical Switching and Networking 28 (2018) 8–22
Available online 03 November 20171573-4277/ © 2017 Elsevier B.V. All rights reserved.
MARK
2. Related work
A seminal line of WMN research found that backhauling with wire-connected gateways, i.e., a hybrid two-tiered network structure con-sisting of wireless nodes and wired gateways, can increase the networkthroughput [19–22]. This line of research focused primarily onasymptotic analyses for a number of nodes growing to infinity andhas limited direct applicability for FiWi networks with a finite numberof nodes.
Another line of related research has developed queuing modelsfor specific aspects of WMNs. For instance, specific tree topologieshave been examined in [23,24]; whereas we consider arbitrarytopologies. An M D/ /1 queueing model for scheduling on individualWMN links has been developed by Naeini [25]. Chen et al. [26]modeled each WMN node as a single queue; whereas we model eachWMN node as a combination of two M M K/ /1/ queues so as todistinguish the queueing of locally generated source traffic and thequeueing of relay traffic. Pandey et al. [27] analyzed the impact of aspecific load balancing approach on the gateway nodes, which weremodeled with M M/ /1 queues. In contrast, we develop a morecomprehensive queueing model encompassing all the WMN nodesand gateways (ONUs).
Most prior analytical WMN and FiWi studies have considered theheavy-loaded traffic model, e.g., [17,18,28,29]. Relatively few ana-lytical studies that are complementary to our study have considerednon-heavy Poisson traffic. Bisnik and Abouzeid [30] have developeda queueing diffusion approximation model that considers randomwalk packet routing for non-heavy traffic. In contrast, we considerfixed routing along a prescribed path, e.g., the shortest path to thegateway. Wang et al. [31] have developed a game-theoretic model ofthe medium access control (MAC) protocol for non-heavy traffic thatoptimizes the transmission power level; the routing paths enabled bythe optimized transmission power could be considered in our FiWinetwork model.
FiWi network routing and scheduling mechanisms have beenproposed in [32–37]. FiWi network throughput-delay analyses thatare complementary to our study by focusing on specific MAC andquality of service mechanisms have been conducted in [38–44]. Studieson energy saving mechanisms and their impact on FiWi networkperformance have been presented in [45–51]. The present studycontributes an original fundamental FiWi network throughput-delayanalysis that accommodates non-heavy Poisson traffic. Our analysisprovides a basis for studying the interactions between clusters of WMNnodes and the PON backhaul.
3. FiWi network model
3.1. Network architecture
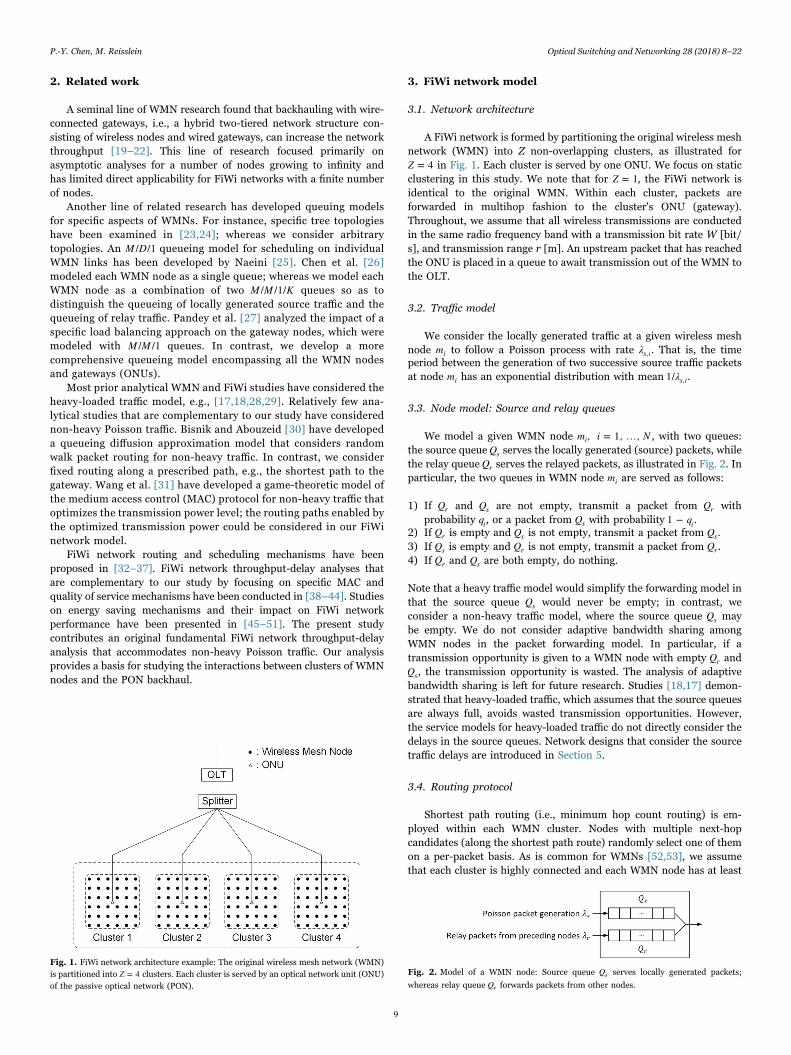
A FiWi network is formed by partitioning the original wireless meshnetwork (WMN) into Z non-overlapping clusters, as illustrated forZ = 4 in Fig. 1. Each cluster is served by one ONU. We focus on staticclustering in this study. We note that for Z = 1, the FiWi network isidentical to the original WMN. Within each cluster, packets areforwarded in multihop fashion to the cluster's ONU (gateway).Throughout, we assume that all wireless transmissions are conductedin the same radio frequency band with a transmission bit rate W [bit/s], and transmission range r [m]. An upstream packet that has reachedthe ONU is placed in a queue to await transmission out of the WMN tothe OLT.
3.2. Traffic model
We consider the locally generated traffic at a given wireless meshnode mi to follow a Poisson process with rate λs i, . That is, the timeperiod between the generation of two successive source traffic packetsat node mi has an exponential distribution with mean λ1/ s i, .
3.3. Node model: Source and relay queues
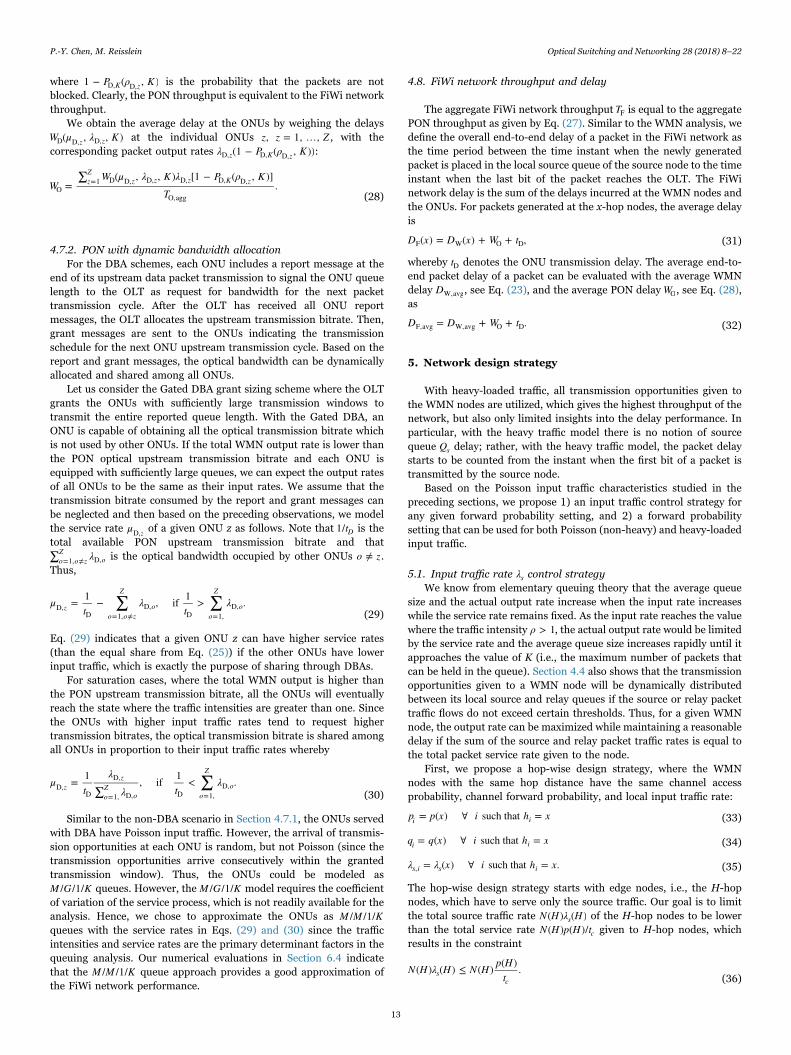
We model a given WMN node m i N, = 1, …,i , with two queues:the source queue Qs serves the locally generated (source) packets, whilethe relay queue Qr serves the relayed packets, as illustrated in Fig. 2. Inparticular, the two queues in WMN node mi are served as follows:
1) If Qr and Qs are not empty, transmit a packet from Qr withprobability qi, or a packet from Qs with probability q1 − i.
2) If Qr is empty and Qs is not empty, transmit a packet from Qs.3) If Qs is empty and Qr is not empty, transmit a packet from Qr .4) If Qr and Qs are both empty, do nothing.
Note that a heavy traffic model would simplify the forwarding model inthat the source queue Qs would never be empty; in contrast, weconsider a non-heavy traffic model, where the source queue Qs maybe empty. We do not consider adaptive bandwidth sharing amongWMN nodes in the packet forwarding model. In particular, if atransmission opportunity is given to a WMN node with empty Qr andQs, the transmission opportunity is wasted. The analysis of adaptivebandwidth sharing is left for future research. Studies [18,17] demon-strated that heavy-loaded traffic, which assumes that the source queuesare always full, avoids wasted transmission opportunities. However,the service models for heavy-loaded traffic do not directly consider thedelays in the source queues. Network designs that consider the sourcetraffic delays are introduced in Section 5.
3.4. Routing protocol
Shortest path routing (i.e., minimum hop count routing) is em-ployed within each WMN cluster. Nodes with multiple next-hopcandidates (along the shortest path route) randomly select one of themon a per-packet basis. As is common for WMNs [52,53], we assumethat each cluster is highly connected and each WMN node has at least
Fig. 1. FiWi network architecture example: The original wireless mesh network (WMN)is partitioned into Z = 4 clusters. Each cluster is served by an optical network unit (ONU)of the passive optical network (PON).
Fig. 2. Model of a WMN node: Source queue Qs serves locally generated packets;
whereas relay queue Qr forwards packets from other nodes.
P.-Y. Chen, M. Reisslein Optical Switching and Networking 28 (2018) 8–22
9

one path to its corresponding gateway (ONU). We define an x-hop nodeas a WMN node with hop distance x to its corresponding gateway.
3.5. Medium access control protocol
3.5.1. WMNWe consider a generic WMN MAC model [18], which characterizes
the WMN behavior through the probability pi of successful channelaccess. In particular, node mi obtains the transmission opportunity of agiven time slot (with duration tc, i.e., for a single packet transmission)of a time-division-multiplexing-access (TDMA) system with probabilitypi. Many factors influence the WMN channel access probability pi,including physical channel conditions and interference from neighbor-ing nodes as well as scheduling policies and MAC protocols [54]. Theset of probabilities pi characterizing a specific WMN can be obtainedthrough measurements. Generally, nodes mi with shorter hop distancesto the gateway should be assigned higher probabilities pi sincetransmission opportunities a node mi are consumed by both relayedand locally generated traffic, whereby nodes closer to the gatewaysexperience typically higher relay traffic loads. In this paper, we studythe effects of pi designs that are based on the hop distance as well asdesigns based on individual nodes.
3.5.2. PONWe suppose that all gateways (ONUs) are identical and provide
packet forwarding service to the OLT. The ONUs transmit the receivedpackets to the OLT with a direct optical transmission (i.e., with oneoptical transmission hop). The ONU packet transmissions are con-trolled through a MAC protocol executed by the central OLT, wherebytypically several packets are grouped together for an upstream trans-mission from an ONU to the OLT. We consider a constant transmissionbitrate scenario, where we model the ONUs as M D K/ /1/ queues, seeSection 4.7.1. We also consider a scenario with dynamic sharing of theoptical transmission bitrate among the ONUs through dynamic band-width allocation (DBA). For the DBA scenario, we approximately modelthe ONUs as M M K/ /1/ queues with different service rates, see Section4.7.2.
4. Throughput and delay analysis
This section presents the mathematical FiWi network analysis.First, we analyze the queuing at a given WMN node mi, followed by thederivation of the WMN delay and throughput. Based on the WMNresults, we evaluate the PON delay and throughput. We analyze theoverall FiWi network performance by combining the WMN and PONanalyses. The main analysis notations are summarized in Table 1.
4.1. Packet service rates at WMN node miConsider a TDMA system with time slot duration tc and channel
access probability pi for node mi in a given slot. Over a long timehorizon, the arrival of transmission opportunities at node mi can beapproximately modeled as a Poisson process with rate μ p t≈ /i i c [17,55].The arrival rate μi of transmission opportunities to node mi isequivalent to the service rate of packets at node mi, whereby theservice rate μi is shared by the local packet queue Qs and the relaypacket queue Qr .
As noted in Section 3.3, the relay packet queueQr can obtain a giventransmission opportunity that has been granted to node mi under twocircumstances: 1) The transmission opportunity is directly given to Qr ,and 2) the transmission opportunity is first given to the empty Qs andthen given back to Qr . Thus, the service rate of the relay packet queueQr is
μ μ q μ q P= + (1 − ) ,r i i i i i s i, 0, , (1)
where qi is the probability of the transmission opportunity being givendirectly to Qr , while P s i0, , is the probability of Qs of mi being empty
[which can be obtained as P ρ K( , )s iM,0 , from Eq. (57)] and q P(1 − )i s i0, , isthe probability of the transmission opportunity first being given to theempty Qs and then given back to Qr. Note that the arrival oftransmission opportunities to Qr is a Poisson process since the arrivalof transmission opportunities at Qr is a proportion of the originalPoisson process with rate μi. Similarly, we obtain the service rate of thelocal packet queue Qs as
μ μ q μ qP= (1 − ) + ,s i i i i i r i, 0, , (2)
where P r i0, , is the probability of Qr of mi being empty [obtained from Eq.(57)]. Similar to Qr , the arrival of transmission opportunities at Qs is aPoisson process.
Based on the service rates of Qr and Qs, we can further obtain theactual output rates of both queues:
σ μ P= (1 − )r i r i r i, , 0, , (3)
σ μ P= (1 − ).s i s i s i, , 0, , (4)
Table 1Summary of main notations.
Notation Definition
Network structuremi Wireless mesh node i i N, = 1, …,H Largest hop distance of the networkhi Hop distance from node mi to the gateway (ONU)
N x( ) Number of nodes with hop distance xSx S j h x j N= { : = for = 1, …, }x j
Set of indices of nodes with hop distance xRi R j m m= { : is a possible next hop ofi i j
j Nfor = 1, …, }= Set of indices of possibleprevious hops of mi
fj Number of possible next hops of node mj
Z Number of WMN clusters, indexed z z Z, = 1, …,Cz C j m z= { : is a 1-hop node in clusterz j
j Nfor = 1, …, }= Set of indices of 1-hopnodes of cluster z
tc TDMA time slot duration=packet transm. time [s]
Channel access and forwarding prob.pi Channel access prob. of wireless mesh node miqi Forwarding prob. of wireless mesh node mi
Packet traffic rates at node miμi μ p t= /i i c Poisson process arrival rate of
transmission opportunities at node miλs i, Source packet traffic generation rate
λr i, Relay packet traffic arrival rate
μs i, Source packet traffic service rate
μr i, Relay packet traffic service rate
μi Overall pkt. service rate, source + relay traffic
σs i, Source packet traffic output rate
σr i, Relay packet traffic output rate
ρs i, Source packet traffic intensity at node mi
ρr i, Relay packet traffic intensity at node mi
M M K/ /1/ relay packet queue Qr at WMN node miK Buffer capacity in packetsPb r i, , Blocking prob. of relay queue Qr at node miP r i0, , Probability of Qr being empty at mi
M M K/ /1/ source packet queue Qs at WMN node miK Buffer capacity in packetsPb s i, , Blocking prob. of source queue Qs at node miP s i0, , Probability of Qs being empty at mi
Throughput metricT x( )W Source packet traffic throughput of set of
x-hop WMN nodes
P.-Y. Chen, M. Reisslein Optical Switching and Networking 28 (2018) 8–22
10

The actual output rate of mi, denoted as σi, is the sum of the outputrates of its Qr and Qs. With (1), (2), and (3):
σ σ σ= +i r i s i, , (5)
μ P P= (1 − · ).i r i s i0, , 0, , (6)
Eq. (6) indicates that the transmission opportunities given to mi areonly wasted when both Qr and Qs are empty. This verifies theforwarding policy described in Section 3.3 and shows that the outputtraffic of node mi is a Poisson process.
4.2. Packet arrival rates at WMN Node miFirst we study the queuing behavior of the relay packet queue Qr at
WMN node mi, followed by the local source packet queue Qs at mi. Wedefine the set of possible preceding nodes of a given node mi asR j m m j N= { : is a possible next hop of , for = 1, …, }i i j . The consideredrouting protocol (see Section 3.4) lets a given node select the next-hop node along the shortest path randomly among the possible next-hop candidates on a per-packet basis. Thus, the next-hop candidatesequally share the outgoing traffic. In particular, let fj denote thenumber of next-hop candidates of a preceding node m j R, ∈j i andnote that σ f/j j is the input rate of relayed packets from the precedingnode mj to the relay packet queue Qr of the considered node mi. Hence,the relay packet arrival rate λr i, at node mi is
∑λσf
= .r ij R
j
j,
∈ i (7)
The Poisson process properties of the packet flows ensure that theincoming and outgoing packet processes at the relay queue Qr at mi arePoisson processes. The relay packet queueQr of WMN node mi can thusbe modeled as an M M K/ /1/ queue, with K denoting the buffer size inpackets. We define the relay packet traffic intensity of Qr at node mi as
ρλμ
= .r ir i
r i,
,
, (8)
For the local source packet traffic queue Qs of node mi, we considerPoisson traffic with rate λs i, . Specifically, the distribution of the timespan between two locally generated packets is exponentially distributedwith mean λ1/ s i, . Since the arrival of transmission opportunities at Qs isapproximately a Poisson Process, see Section 4.1, the local sourcequeue Qs of node mi can also be modeled as an M M K/ /1/ queue. Inparticular, for the arrival rate λs i, and service rate μs i, , we define thesource traffic intensity of Qs at mi as
ρλμ
= .s is i
s i,
,
, (9)
4.3. M M K/ /1/ Queue model for relay queue Qr and local queue QsAs explained in Section 4.2, the relay queue Qr and local source
queue Qs in a given WMN node mi can be modeled as M M K/ /1/ queues,which are briefly reviewed in the Appendix. For a fixed holding capacityof K packets, the mean waiting time W μ λ K( , , )M , see Eq. (59), is afunction of both the service rate μ and the arrival rate λ. On the otherhand, the probabilities of the queue being empty [PM,0, see Eq. (57)]and full [P KM, , see Eq. (56)] depend only on the traffic intensity ρ. Thus,the evaluation of the delay (average waiting time in the M M K/ /1/queue) in a given WMN node mi requires the packet arrival and servicerates at both Qr and Qs at WMN node mi, as derived in Section 4.2.
4.4. Dynamic bandwidth adjustment at WMN nodes
In this subsection, we show that the bandwidth given to a WMNnode mi is dynamically adjusted if the input traffic is properlycontrolled. This property will be used in the input traffic control designproposed in Section 5.1 and in the channel access probability pi designin Section 5.2. Let us consider the case that λ μ q<r i i i, , i.e., the incoming
relay traffic rate is lower than the relay packet service rate [withoutconsidering the transmission opportunities given back to Qr due to anempty Qs, see Eq. (1)], and study the service rate of the local queue Qs.With (1), (2), and (57), we obtain
μ μ q μ qP= (1 − ) +s i i i i i r i, 0, , (10)
⎛⎝⎜⎜
⎞⎠⎟⎟
μ q μ q
λμ q μ q P
λμ q μ q P
= (1 − ) +1 −
+ (1 − )
1 −+ (1 − )
i i i i
r i
i i i i s i
r i
i i i i s i
k
,
0, ,
,
0, ,
+1
(11)
⎛⎝⎜⎜
⎞⎠⎟⎟
μ q μ q
λμ q
λμ q
> (1 − ) +1 −
1 −i i i i
r i
i i
r i
i i
k
,
,+1
(12)
⎛⎝⎜⎜
⎞⎠⎟⎟μ q μ q
λμ q
> (1 − ) + 1 −i i i ir i
i i
,
(13)
μ λ= − .i r i, (14)
Thus, we have shown that if the incoming relay traffic rate λr i, is lowerthan the lowest relay packet service rate μ qi i, then the service rate μs i, ofthe local queue Qs adjusts automatically to the lower incoming relaytraffic rate and provides correspondingly higher service rate to thesource packets, i.e.,
μ μ λ λ μ q> − if < .s i i r i r i i i, , , (15)
The analogous argument for the case λ μ q< (1 − )s i i i, shows that
μ μ λ λ μ q> − if < (1 − ).r i i s i s i i i, , , (16)
4.5. WMN throughput
The preceding Sections IV-B – IV-C, studied the incoming andoutgoing packet traffic processes of a WMN node mi. In particular, weshowed that the relay packet queue Qr and the local source packetqueue Qs in a WMN node mi can be modeled as M M K/ /1/ queues. Anexact WMN analysis would require delay and throughput evaluationsfor all possible node-to-gateway paths for all WMN nodes. Such anexhaustive evaluation would become prohibitively complex for largeWMNs where long hop distances lead to many possible paths to thegateway. We pursue therefore an approximate, low-complexity evalua-tion of the WMN throughput in this section, followed by an approx-imate delay analysis in Section 4.6.
First, we evaluate the end-to-end WMN throughput. For the set ofx-hop WMN nodes, we define the local source packet traffic throughputT x( )W as the average number of packets generated by the x-hop WMNnodes that reach the gateways per unit time. Formally, T x( )W can beexpressed as the total source packet traffic output rate of the x-hopnodes multiplied by the probability of the packets not being blocked attheir local source nodes, nor at any of the intermediate relay nodes.Since the exhaustive evaluation of the blocking probabilities for allindividual paths is prohibitive, we pursue the following approximateevaluation of the average blocking probability of the paths for the x-hopnodes. For the nodes with hop distance x, we first evaluate the weightedaverage relay packet blocking probability on the wireless WMN path as
P xλ P ρ K
λ( ) =
∑ ( , )
∑,r b
i S r i K r i
i S r iW, ,
∈ , M, ,
∈ ,
x
x (17)
where S i h x i N= { : = for = 1, …, }x j is the set of x-hop nodes andP ρ K( , )K r iM, , is obtained from Eq. (56). Similarly, we obtain the weightedaverage source packet blocking probability on the wireless WMN pathfor the nodes with hop distance x as P x( )s bW, , by replacing the subscript
P.-Y. Chen, M. Reisslein Optical Switching and Networking 28 (2018) 8–22
11

r with the subscript s in Eq. (17).All packets generated at x-hop nodes, with x H= 1, 2, …, , have to
pass through their source node and x − 1 relay nodes without blockingto reach the gateway. The aggregate throughput of the x-hop nodes canthus be evaluated as the product of the source packet traffic input rateof the x-hop nodes and the non-blocking probability. In particular, wedefine the aggregate source packet traffic output rate of the x-hop nodesas the product of the source packet traffic input rate of the x-hop nodesand the probability of not being blocked at the source node:
∑ ∑σ x σ λ P x( ) = = [1 − ( )].si S
s ii S
s i s b,agg∈
,∈
, W, ,x x (18)
Nodes with x = 1 hop to the gateway cannot be blocked at a relay node,while nodes with x H= 2, 3, …, hops need to be relayed by x − 1 nodeswithout blocking to reach the gateway. Hence, the source packet trafficthroughput of x-hop nodes for x H= 1, 2, …, is
⎪
⎪⎧⎨⎩
T xσ x
σ x P h x H( ) =
(1), = 1
( ) ∏ [1 − ( )], = 2, …, .s
s hx
r bW
,agg
,agg =1−1
W, , (19)
Note that source traffic output rate σs i, and blocking probabilitiesP x( )s bW, , and P x( )r bW, , are functions of channel access probability piand forwarding probability qi; thus, the throughput depends on both piand qi, as numerically evaluated in Section 6. We obtain the aggregateWMN throughput by summing T x( )W over the hop distance x:
∑T T x= ( ).x
H
W,agg=1
W(20)
4.6. WMN delay
Based on the traffic rates at the individual wireless mesh nodes mievaluated in the preceding subsections, we derive in this subsection themean WMN delays by considering the individual heterogeneous trafficloads at the WMN nodes. We define the end-to-end WMN delay of anewly generated packet as the time period from the time instant whenthe packet is placed in the local queue of the source node to the timeinstant when the last bit of the packet reaches the gateway. For a packetgenerated at an x-hop node, the end-to-end delay consists of thequeuing delay at its source node, the queuing delays at the x − 1intermediate nodes that relay the packet, and the length of the x timeslots for the packet transmissions.
We approximate the average waiting time for the relayed packets inthe relay queue Qr of an x-hop node as
W xσ W μ λ K
σ( ) =
∑ ( , , )
∑,r
i S r i r i r i
i S r iW, ,avg
∈ , M , ,
∈ ,
x
x (21)
whereby the mean waiting time W μ λ K( , , )i iM is obtained from Eq. (59).Similarly, we obtain the average waiting time for the source packets inlocal queue Qs of an x-hop node W x( )sW, ,avg , which corresponds to Eq.(21) with subscript r replaced by subscript s.
Based on the average relay packet waiting time W x( )rW, ,avg and theaverage source packet waiting time W x( )sW, ,avg in a given WMN nodewith hop distance x, we evaluate the average end-to-end WMN delay asfollows. A node with a hop distance x = 1 transmits a source packet tothe gateway node when the transmission opportunity is granted to itsQs. With the delay measurement starting at the time instant when anewly generated packet is placed in the local source queue Qs, thesource packet traffic generated at 1-hop nodes experiences an end-to-end WMN delay corresponding to its queuing delay at the local sourcequeue Qs plus the transmission delay tc. Source packet traffic generatedat x-hop nodes with x H= 2, 3, …, , needs to be queued in the sourcequeue Qs and then transmitted x times and incurs the total queuewaiting time corresponding to the source node and the relay nodes thatare x1, 2, …, − 1 hops from the gateway. In summary,
⎧⎨⎪⎪
⎩⎪⎪
D x
t W x xxt W x
W h x H( ) =
+ ( ) if = 1+ ( )
+ ∑ ( ) if = 2, …, .
c s
c s
hx
r
W
W, ,avg
W, ,avg
=1−1
W, ,avg (22)
We evaluate the average WMN end-to-end delay DW,avg by aver-aging the delays of packets reaching the gateways. In particular, weweigh the delay D x( )W experienced by x-hop nodes by the correspond-ing source traffic output rate T x( )W of x-hop nodes:
DT x D xT
=∑ ( ) ( )
.xH
W,avg=1 W W
W,agg (23)
4.7. PON throughput-delay analysis
When a packet reaches a gateway, the packet is immediatelyforwarded to the ONU operating at the gateway. Each ONU operatesas a queue that transmits the queued packets to the OLT. All ONUsshare the same physical optical transmission bitrate and several packetscheduling techniques have been proposed to efficiently control thebandwidth sharing [56–59]. In this paper, we consider both a basicmodel without any specific scheduling policy and a model with a basicdynamic bandwidth allocation (DBA) policy.
4.7.1. PON with fixed service ratesFirst we study the scenario where no DBA is applied. We suppose
that the PON operates with TDMA such that each ONU can transmit itspackets during specific time slots. This model results in a deterministicONU service rate. Similar to the wireless TDMA network model, wedenote tD for the time slot duration needed to transmit a packet in thePON. We show that for this TDMA scenario, the ONUs can be modeledas M D K/ /1/ queues, which allow for the derivation of the overall FiWinetwork delay and throughput.
For modeling the ONUs, we initially consider the packet arrivalrates at the ONUs. Each ONU receives the packets directly from thecorresponding WMN gateway, i.e., an ONU and its co-located gatewayhave the same input packet traffic characteristics. Let g z Z, = 1, …,z ,denote the number of 1-hop nodes in cluster z. Analogously to thearguments in Section 4.2, the incoming packet process at each gatewayis a Poisson process since it consists of the superposition of severalPoisson processes. Therefore, the cluster z gateway receives the Poissonpacket arrival rate
∑λ σ= ,zj C
jD,∈ z (24)
whereCz denotes the set of indices of the 1-hop nodes in cluster z. Sinceall Z ONUs operate with the same fixed rate (due to the static equalsharing of the total PON upstream transmission bitrate), each indivi-dual ONU can be modeled as an M D K/ /1/ queue with service rate
μt Z
= 1 .zD,D (25)
The resulting ONU traffic intensity in cluster z is
ρ λ t Z= .z zD, D, D (26)
If a FiWi network serves both wireless users as well as wired users withdirect connections to an ONU, e.g., through fiber to the home (FTTH),the ONU traffic load (intensity) is the sum of traffic loads from wirelessand wired users.
We define the PON aggregate throughput TO,agg as the averagenumber of packets reaching the OLT per unit time. The aggregatethroughput TO,agg is the sum of the effective ONU output rates, i.e.,
∑T λ P ρ K= [1 − ( , )],z
Z
z K zO,agg=1
D, D, D,(27)
P.-Y. Chen, M. Reisslein Optical Switching and Networking 28 (2018) 8–22
12
where P ρ K1 − ( , )K zD, D, is the probability that the packets are notblocked. Clearly, the PON throughput is equivalent to the FiWi networkthroughput.
We obtain the average delay at the ONUs by weighing the delaysW μ λ K( , , )z zD D, D, at the individual ONUs z z Z, = 1, …, , with thecorresponding packet output rates λ P ρ K(1 − ( , ))z K zD, D, D, :
WW μ λ K λ P ρ K
T=
∑ ( , , ) [1 − ( , )].z
Zz z z K z
O=1 D D, D, D, D, D,
O,agg (28)
4.7.2. PON with dynamic bandwidth allocationFor the DBA schemes, each ONU includes a report message at the
end of its upstream data packet transmission to signal the ONU queuelength to the OLT as request for bandwidth for the next packettransmission cycle. After the OLT has received all ONU reportmessages, the OLT allocates the upstream transmission bitrate. Then,grant messages are sent to the ONUs indicating the transmissionschedule for the next ONU upstream transmission cycle. Based on thereport and grant messages, the optical bandwidth can be dynamicallyallocated and shared among all ONUs.
Let us consider the Gated DBA grant sizing scheme where the OLTgrants the ONUs with sufficiently large transmission windows totransmit the entire reported queue length. With the Gated DBA, anONU is capable of obtaining all the optical transmission bitrate whichis not used by other ONUs. If the total WMN output rate is lower thanthe PON optical upstream transmission bitrate and each ONU isequipped with sufficiently large queues, we can expect the output ratesof all ONUs to be the same as their input rates. We assume that thetransmission bitrate consumed by the report and grant messages canbe neglected and then based on the preceding observations, we modelthe service rate μ zD, of a given ONU z as follows. Note that t1/ D is thetotal available PON upstream transmission bitrate and that
λ∑o o zZ
o=1, ≠ D, is the optical bandwidth occupied by other ONUs o z≠ .Thus,
∑ ∑μt
λt
λ= 1 − , if 1 > .zo o z
Z
oo
Z
oD,D =1, ≠
D,D =1,
D,(29)
Eq. (29) indicates that a given ONU z can have higher service rates(than the equal share from Eq. (25)) if the other ONUs have lowerinput traffic, which is exactly the purpose of sharing through DBAs.
For saturation cases, where the total WMN output is higher thanthe PON upstream transmission bitrate, all the ONUs will eventuallyreach the state where the traffic intensities are greater than one. Sincethe ONUs with higher input traffic rates tend to request highertransmission bitrates, the optical transmission bitrate is shared amongall ONUs in proportion to their input traffic rates whereby
∑μt
λ
λ tλ= 1
∑, if 1 < .z
z
oZ
o o
Z
oD,D
D,
=1, D, D =1,D,
(30)
Similar to the non-DBA scenario in Section 4.7.1, the ONUs servedwith DBA have Poisson input traffic. However, the arrival of transmis-sion opportunities at each ONU is random, but not Poisson (since thetransmission opportunities arrive consecutively within the grantedtransmission window). Thus, the ONUs could be modeled asM G K/ /1/ queues. However, the M G K/ /1/ model requires the coefficientof variation of the service process, which is not readily available for theanalysis. Hence, we chose to approximate the ONUs as M M K/ /1/queues with the service rates in Eqs. (29) and (30) since the trafficintensities and service rates are the primary determinant factors in thequeuing analysis. Our numerical evaluations in Section 6.4 indicatethat the M M K/ /1/ queue approach provides a good approximation ofthe FiWi network performance.
4.8. FiWi network throughput and delay
The aggregate FiWi network throughput TF is equal to the aggregatePON throughput as given by Eq. (27). Similar to the WMN analysis, wedefine the overall end-to-end delay of a packet in the FiWi network asthe time period between the time instant when the newly generatedpacket is placed in the local source queue of the source node to the timeinstant when the last bit of the packet reaches the OLT. The FiWinetwork delay is the sum of the delays incurred at the WMN nodes andthe ONUs. For packets generated at the x-hop nodes, the average delayis
D x D x W t( ) = ( ) + + ,F W O D (31)
whereby tD denotes the ONU transmission delay. The average end-to-end packet delay of a packet can be evaluated with the average WMNdelay DW,avg, see Eq. (23), and the average PON delay WO, see Eq. (28),as
D D W t= + + .F,avg W,avg O D (32)
5. Network design strategy
With heavy-loaded traffic, all transmission opportunities given tothe WMN nodes are utilized, which gives the highest throughput of thenetwork, but also only limited insights into the delay performance. Inparticular, with the heavy traffic model there is no notion of sourcequeue Qs delay; rather, with the heavy traffic model, the packet delaystarts to be counted from the instant when the first bit of a packet istransmitted by the source node.
Based on the Poisson input traffic characteristics studied in thepreceding sections, we propose 1) an input traffic control strategy forany given forward probability setting, and 2) a forward probabilitysetting that can be used for both Poisson (non-heavy) and heavy-loadedinput traffic.
5.1. Input traffic rate λs control strategyWe know from elementary queuing theory that the average queue
size and the actual output rate increase when the input rate increaseswhile the service rate remains fixed. As the input rate reaches the valuewhere the traffic intensity ρ > 1, the actual output rate would be limitedby the service rate and the average queue size increases rapidly until itapproaches the value of K (i.e., the maximum number of packets thatcan be held in the queue). Section 4.4 also shows that the transmissionopportunities given to a WMN node will be dynamically distributedbetween its local source and relay queues if the source or relay packettraffic flows do not exceed certain thresholds. Thus, for a given WMNnode, the output rate can be maximized while maintaining a reasonabledelay if the sum of the source and relay packet traffic rates is equal tothe total packet service rate given to the node.
First, we propose a hop-wise design strategy, where the WMNnodes with the same hop distance have the same channel accessprobability, channel forward probability, and local input traffic rate:
p p x i h x= ( ) ∀ such that =i i (33)
q q x i h x= ( ) ∀ such that =i i (34)
λ λ x i h x= ( ) ∀ such that = .s i s i, (35)
The hop-wise design strategy starts with edge nodes, i.e., the H-hopnodes, which have to serve only the source traffic. Our goal is to limitthe total source traffic rate N H λ H( ) ( )s of the H-hop nodes to be lowerthan the total service rate N H p H t( ) ( )/ c given to H-hop nodes, whichresults in the constraint
N H λ H N H p Ht
( ) ( ) ≤ ( ) ( ) .sc (36)
P.-Y. Chen, M. Reisslein Optical Switching and Networking 28 (2018) 8–22
13

For the H − 1 hop nodes, the total service rate N H p H t( − 1) ( − 1)/ cis available for the source packets and the relay packets from the H-hopnodes. The goal is also to limit the aggregate traffic rate resulting fromthe source packet rate N H λ H( − 1) ( − 1)s of the H − 1-hop nodes plusthe relay traffic rate N H λ H( ) ( )s arriving form the H-hop nodes to belower than the total service rate given to H − 1-hop nodes, resulting inthe constraint
N H λ H N H λ H N H p Ht
( ) ( ) + ( − 1) ( − 1) ≤ ( − 1) ( − 1) .s sc (37)
Note that N H λ H( ) ( )s is indeed the maximum possible total relay trafficinput rate form the H-hop nodes, which is also restricted to themaximum value N H p H t( ) ( )/ c according to Eq. (36).
The analogous analysis can be applied to the following x-hop nodeswhere x H1 ≤ ≤ and we can formulate the linear program for max-imizing the aggregate input rate:
∑ N x λ xMaximize ( ) ( )x
H
s=1 (38)
∑ N x λ x N x p xt
x HSubject to ( ) ( ) ≤ ( ) ( ) , = 1, …, .i x
H
sc= (39)
By maximizing the aggregate input rate while not violating thetransmission bitrate restrictions, the linear program strives to max-imize the system throughput while not constantly overflowing thebuffers. If all WMN nodes have the same source traffic input rate, thesolution of the linear program is
⎡
⎣⎢⎢
⎤
⎦⎥⎥λ
p x t= min
( )/1 + ∑
.sx H
c
i xH N i
N x,opt
=1,…,= +1
( )( ) (40)
In a perfectly uniform network where all relay nodes have the samerelay traffic input rates, the linear program solution in Eq. (40)approaches the maximum system throughput.
5.2. Transmission opportunity p x( ) design at hop levelIn the preceding subsection we proposed a Poisson input traffic rate
control strategy for a hybrid WMN. We can observe that highertransmission opportunity probabilities p x( ) should be assigned to thenodes with lower hop distances since they have to provide relay servicefor more packets form the nodes with higher hop distances. Weproceed to develop a simple channel access probability setp x x H( ), = 1, …, , design inspired by the result obtained in Eq. (40).Let us consider a network where the total service rate N H p H t( ) ( )/ c atthe H-hop nodes is equal to the total source input rate N H λ H( ) ( )s at theH-hop nodes, i.e.,
N H p Ht
N H λ H( ) ( ) = ( ) ( ).c
s(41)
The H( − 1)-hop nodes have to provide a sufficient total service rateto relay the packets form the H-hop nodes and to send the sourcepackets of the H( − 1)-hop nodes. Noting that N H p H t( ) ( )/ c is the highestpossible relay packet input rate arriving at the H( − 1)-hop nodes, weobtain
N H p Ht
N H λ H N H p Ht
( − 1) ( − 1) = ( − 1) ( − 1) + ( ) ( ) .c
sc (42)
With the same logic we obtain the channel access probability designstrategy for all p x( ).
If we consider the case where all WMN nodes have the same localsource input traffic rate λs, we can further simplify Eq. (42) to
N H p Ht
N H N H p Ht
( − 1) ( − 1) = [ ( − 1) + ( )] ( ) ,c c (43)
and further obtain the design rule
p xN i
N xp H x H( ) =
∑ ( )( )
( ), = 1, …, .i xH=
(44)
Form the above derivations, we observe that the total channel accessprobability of the x-hop nodes grows as x decreases, which matches theresults obtained in [17,18].
We note that the special case (44) gives the same p x( ) values as Eq.(22) in [18]; however, our preceding derivation is more insightful andrequires fewer computations.
For the forwarding probability set q x x H( ), = 1, …, , our designstrategy is to give fair transmission bitrate shares to traffic flows formnodes with different hop distances. For a uniform networking scenariowhere all nodes have the same source input rate, we can simplycalculate the traffic amount in terms of node numbers, i.e.,
q xN i
N ix H( ) =
∑ ( )
∑ ( ), = 1, …, ,i x
H
i xH
= +1
= (45)
where N i∑ ( )i xH= +1 is the number of nodes with hop distance higher than
x. Note that the resulting q x( ) corresponds to the portion of relay trafficto the total input traffic.
5.3. Network design at node level
In the previous subsection, we introduced the network designstrategy at the hop distance level. In real practical network topologies,the hop-level design may degrade network performance since WMNnodes with the same hop distance may have different source input andrelay traffic input rates. Service rates lower than the input traffic rateswill lower throughout and increase delay. Hence, we propose thefollowing channel access pi and forwarding probability qi design basedon the traffic characteristics at individual nodes mi. The individual nodemi level design follows the same overall strategy as the hop-count leveldesign. That is, we equip each node mi with the same service rate as itstotal input traffic rate. For WMN node mi, the channel access prob-ability design is
∑pt
p
f tλ= + ,i
c j R
j
j ci
∈ i (46)
where p f t∑ /( )j R j j c∈ iis the highest relay traffic input rate. We note that
for the edge nodes with hop distance H, p λ t=i i c. For the forwardingprobability, our design gives a fair share of the transmission bitrate torelay traffic:
qλ
=∑
∑ +.i
j Rp
f t
j Rp
f t i
∈
∈
i
j
j c
i
j
j c (47)
In the next section, we will show that such a node level design canprovide better performance than hop distance level designs.
6. Numerical evaluation
6.1. Evaluation set-up
6.1.1. Settings for numerical evaluationsFor the numerical evaluations based on the throughput and delay
analysis in Section 4, we set the time slot lengths for both the WMNand PON parts to the time needed to transmit one packet. The relayqueues Qr and local source queues Qs are set to hold at most K = 64packets. We report the specific parameter settings that varied for eachof the evaluation scenarios in the captions of the result figures.
6.1.2. Simulation set-upWe based our discrete event simulation model on the OMNET++
simulation framework and implemented the specific WMN and PONpacket forwarding functions through custom code modules. The buffer
P.-Y. Chen, M. Reisslein Optical Switching and Networking 28 (2018) 8–22
14
size was set to K = 64 packets, whereby a standard Ethernet packet sizeof 1500 bytes was considered. Thus, the actual buffer size was 64·1500bytes. Throughout, we report the throughput in units of packets pertime slot. We note that the actual throughput in bytes/second is thethroughput in packets per time slot multiplied by the ratio of packetsize in byte to the time slot duration in seconds. We employed anindependent Poisson packet generation process for each source queue.
We employed the batch means method to obtain statistical con-fidence intervals. We ran 25 batches with 400,000 packets recorded foreach batch, plus a warm-up period with 400,000 packets, i.e., onewarm-up batch that was not counted for the estimation of theperformance metrics. Thus, 10,000,000 packets were recorded in totalfor a given simulation configuration. The resulting 98% confidenceintervals for all simulation results are less than 2% of the correspond-ing sample means and are too small to be visible in the plots.
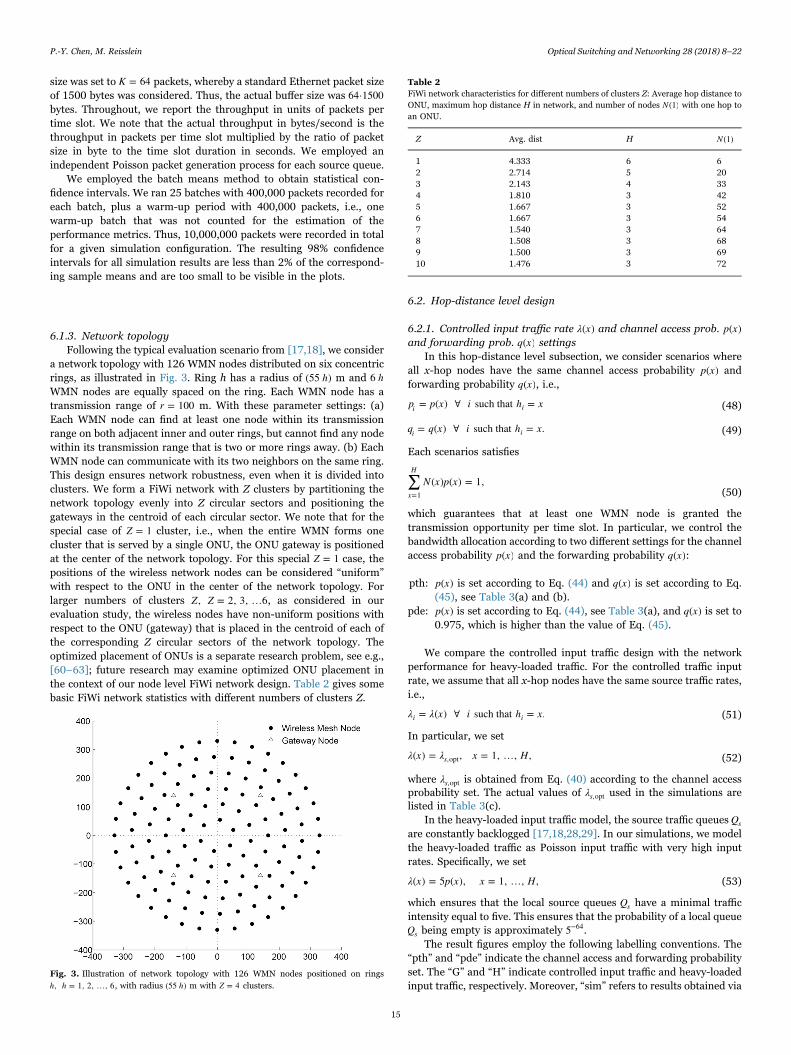
6.1.3. Network topologyFollowing the typical evaluation scenario from [17,18], we consider
a network topology with 126 WMN nodes distributed on six concentricrings, as illustrated in Fig. 3. Ring h has a radius of h(55 ) m and h6WMN nodes are equally spaced on the ring. Each WMN node has atransmission range of r = 100 m. With these parameter settings: (a)Each WMN node can find at least one node within its transmissionrange on both adjacent inner and outer rings, but cannot find any nodewithin its transmission range that is two or more rings away. (b) EachWMN node can communicate with its two neighbors on the same ring.This design ensures network robustness, even when it is divided intoclusters. We form a FiWi network with Z clusters by partitioning thenetwork topology evenly into Z circular sectors and positioning thegateways in the centroid of each circular sector. We note that for thespecial case of Z = 1 cluster, i.e., when the entire WMN forms onecluster that is served by a single ONU, the ONU gateway is positionedat the center of the network topology. For this special Z = 1 case, thepositions of the wireless network nodes can be considered “uniform”with respect to the ONU in the center of the network topology. Forlarger numbers of clusters Z Z, = 2, 3, …6, as considered in ourevaluation study, the wireless nodes have non-uniform positions withrespect to the ONU (gateway) that is placed in the centroid of each ofthe corresponding Z circular sectors of the network topology. Theoptimized placement of ONUs is a separate research problem, see e.g.,[60–63]; future research may examine optimized ONU placement inthe context of our node level FiWi network design. Table 2 gives somebasic FiWi network statistics with different numbers of clusters Z.
6.2. Hop-distance level design
6.2.1. Controlled input traffic rate λ x( ) and channel access prob. p x( )and forwarding prob. q x( ) settings
In this hop-distance level subsection, we consider scenarios whereall x-hop nodes have the same channel access probability p x( ) andforwarding probability q x( ), i.e.,
p p x i h x= ( ) ∀ such that =i i (48)
q q x i h x= ( ) ∀ such that = .i i (49)
Each scenarios satisfies
∑ N x p x( ) ( ) = 1,x
H
=1 (50)
which guarantees that at least one WMN node is granted thetransmission opportunity per time slot. In particular, we control thebandwidth allocation according to two different settings for the channelaccess probability p x( ) and the forwarding probability q x( ):
pth: p x( ) is set according to Eq. (44) and q x( ) is set according to Eq.(45), see Table 3(a) and (b).
pde: p x( ) is set according to Eq. (44), see Table 3(a), and q x( ) is set to0.975, which is higher than the value of Eq. (45).
We compare the controlled input traffic design with the networkperformance for heavy-loaded traffic. For the controlled traffic inputrate, we assume that all x-hop nodes have the same source traffic rates,i.e.,
λ λ x i h x= ( ) ∀ such that = .i i (51)
In particular, we set
λ x λ x H( ) = , = 1, …, ,s,opt (52)
where λs,opt is obtained from Eq. (40) according to the channel accessprobability set. The actual values of λs,opt used in the simulations arelisted in Table 3(c).
In the heavy-loaded input traffic model, the source traffic queues Qsare constantly backlogged [17,18,28,29]. In our simulations, we modelthe heavy-loaded traffic as Poisson input traffic with very high inputrates. Specifically, we set
λ x p x x H( ) = 5 ( ), = 1, …, , (53)
which ensures that the local source queues Qs have a minimal trafficintensity equal to five. This ensures that the probability of a local queueQs being empty is approximately 5−64.
The result figures employ the following labelling conventions. The“pth” and “pde” indicate the channel access and forwarding probabilityset. The “G” and “H” indicate controlled input traffic and heavy-loadedinput traffic, respectively. Moreover, “sim” refers to results obtained via
Fig. 3. Illustration of network topology with 126 WMN nodes positioned on ringsh h, = 1, 2, …, 6, with radius h(55 ) m with Z = 4 clusters.
Table 2FiWi network characteristics for different numbers of clusters Z: Average hop distance toONU, maximum hop distance H in network, and number of nodes N(1) with one hop toan ONU.
Z Avg. dist H N(1)
1 4.333 6 62 2.714 5 203 2.143 4 334 1.810 3 425 1.667 3 526 1.667 3 547 1.540 3 648 1.508 3 689 1.500 3 6910 1.476 3 72
P.-Y. Chen, M. Reisslein Optical Switching and Networking 28 (2018) 8–22
15

simulation and “the” indicates results obtained via theoretical analysispresented in Section 4. To examine the effects of the channel accessdesign on the overall FiWi network performance, we initially set thePON transmission bitrate to ten times the total WMN transmissionbitrate.
6.2.2. Results: Impact of controlled input trafficFig. 4 shows the mean throughput and delay of the pth and pde
settings for controlled and heavy-loaded input traffic. We note that theheavy-loaded traffic attains the maximum system throughput since the(essentially) constantly backlogged local source traffic queues ensurethat every channel access opportunity is utilized [18,17]. With heavy-loaded traffic, the utilization levels of the channel access opportunities(transmission resources) provided by the underlying network are high,i.e., the traffic intensities are high. We observe from Fig. 4 that for boththe pth and pde settings, the proposed controlled input traffic design(Section 5.1) achieves about 80% of the maximum system throughput(which is achieved with heavy-loaded traffic), while reducing the delayto half or less compared to the heavy-loaded traffic.
The throughput reduction is due to some missed transmissionopportunities, i.e., transmission opportunities that are assigned to anode but cannot be utilized since there is no relay traffic and no sourceinput traffic available for transmission. That is, with the input traffic
control, the utilization level of the network transmission resources islower than with the heavy-loaded traffic. The delay comparison inFig. 4 indicates that the input traffic control approximately halves themean packet delay compared to heavy-loaded traffic. This delayreduction is due to the somewhat lower traffic loads that result fromthe control of the input traffic such that each hop distance level canbetter (i.e., in a more timely manner) accommodate the relay trafficload arriving from the preceding hop level, see Eq. (39). In other words,the lower utilization levels of the network transmission resources, i.e.,the lower traffic intensities, with the input traffic control result in lowermean packet delays than with the heavy-loaded traffic.
6.2.3. Results: Impact of forwarding probabilities q x( )Prior heavy-load studies, e.g., [18,17], found that compared to the
pth setting, the pde setting can lower mean delays while achieving thesame system throughput. Note that heavy traffic studies, such as[18,17], typically considered only the queueing delays in the relayqueues (and not the queueing delay in the source nodes). We considerthe queueing delays in both source and relay nodes throughout thisstudy for both our controlled [G, see Eq. (52)] and heavy [H, see Eq.(53)] Poisson traffic. We observe from Fig. 4 that for the controlledtraffic load, the pth and pde settings result in essentially equivalentmean delays. This observation can be explained as follows. The
Table 3Channel access prob. p x( ) and forwarding prob. q x( ) as a function of hop distance x to gateway for pth setting as well as optimized controlled source input rate λs,opt for different numbersof clusters Z.
(a) Channel access prob.p x( ) from Eq. (44)
Z p(1) p(2) p(3) p(4) p(5) p(6)
1 0.0385 0.0183 0.0110 0.0069 0.0040 0.00182 0.0184 0.0091 0.0053 0.0036 0.0029 n/a3 0.0141 0.0068 0.0048 0.0037 n/a n/a4 0.0131 0.0056 0.0044 n/a n/a n/a5 0.0115 0.0055 0.0047 n/a n/a n/a6 0.0111 0.0057 0.0048 n/a n/a n/a7 0.0101 0.0057 0.0051 n/a n/a n/a8 0.0098 0.0059 0.0052 n/a n/a n/a9 0.0097 0.0059 0.0052 n/a n/a n/a10 0.0097 0.0058 0.0053 n/a n/a n/a
(b) Forwarding prob.q x( ) from Eq. (45)
Z q(1) q(2) q(3) q(4) q(5)
1 0.9523 0.9 0.8333 0.7333 0.54542 0.8413 0.6792 0.4444 0.1875 n/a3 0.7381 0.4516 0.2143 n/a n/a4 0.6667 0.2143 n/a n/a n/a5 0.5873 0.1351 n/a n/a n/a6 0.5714 0.1666 n/a n/a n/a7 0.4920 0.0967 n/a n/a n/a8 0.4603 0.1034 n/a n/a n/a9 0.4524 0.1052 n/a n/a n/a10 0.4285 0.1111 n/a n/a n/a
(c) λs,opt from Eq. (40)
Z pth and pde
1 0.00182 0.00293 0.00374 0.00435 0.00486 0.00487 0.00528 0.00539 0.005310 0.0054
P.-Y. Chen, M. Reisslein Optical Switching and Networking 28 (2018) 8–22
16

transmission opportunities at a WMN node are shared by its sourceand relay queues. Thus, allocating a transmission opportunity to onequeue introduces delay to the other queue. The pde setting stronglyprioritizes the relay queue. However, this relay queue prioritizationdelays service to the source queue. If only relay queue delays areconsidered, then the pde setting does result in delay reductions, asreported in heavy traffic studies, such as [18,17]. On the other hand,when considering the queueing delays in the source as well as the relayqueues, the pde setting does not reduce the mean delay since the delayreductions of the relay traffic are achieved at the expense of increasingthe source queue delays.
We note that the heavy traffic model has often been adopted inanalytical studies for ease of tractability. However, in practical net-works, traffic is usually non-heavy and the delays in the source nodesdo matter for the end-to-end delays experienced by applications. Wecaution therefore that the previously reported results obtained forheavy traffic may be misleading by indicating delay reductions for thepde setting compared to the pth setting. As demonstrated by our resultsin Fig. 4, the pde setting does in fact not reduce the practically relevantend-to-end mean delays for non-heavy traffic models. We also note thatfor practically relevant non-heavy traffic, there are some differences
between the pde and pth settings, in that pde improves the perfor-mance specifically for the nodes with higher hop distances, asexamined in Section 6.3.3.
6.3. Node level design
6.3.1. Channel access probability p x( ) and forwarding probabilityq x( ) settings
In this subsection, we study the system performance for the channelaccess probability p x( ) design at the level of individual nodes (seeSection 5.3), which allows each WMN node mi to have a differentchannel access probability pi and forwarding probability qi. Analogouslyto the hop distance design, we set
∑ p = 1.i
N
i=1 (54)
The values of pi and qi are designed according to Eqs. (46) and (47). Forλ λ=s i s, , we find that with
λh
= 1∑
,siN
i=1 (55)
Fig. 4. Mean FiWi network throughput and delay with hop distance level design (Sections 5.1 and 5.2) as a function of number of clusters Z for pth and pde settings with controlled (G)and heavy (H) loaded traffic. (For pth and pde settings, nodes with the same hop distance x have the same channel access probability p x( ) and forwarding probability q x( ) according to
Eqs. (48)–(50). Specifically, for the pth setting, p x( ) is obtained from Eq. (44) and listed in Table 3(a), q x( ) is obtained from Eq. (45) and listed in Table 3(b). For the pde setting, p x( ) isobtained from Eq. (44) and listed in Table 3(a), q x( ) = 0.975 fixed. For controlled traffic (G), all nodes (in both pth and pde) have the same source packet traffic input rate λ λ=i s,opt
obtained via Eq. (40) and listed in Table 3(c). For heavy-loaded traffic (H), λ x p x( ) = 5 ( )).
Fig. 5. FiWi network performance comparison of node level design (pop) and hop distance level design (pth). (For pop settings, each node can have different channel access probabilitypi obtained via Eq. (46) and forwarding probability qi obtained via Eq. (47). For controlled pop traffic (G), all nodes have the same source packet input rate λ λ=s i s, with λs given by Eq.
(55)).
P.-Y. Chen, M. Reisslein Optical Switching and Networking 28 (2018) 8–22
17

Eq. (54) is satisfied. We refer to this per-node level transmission/forwarding probability design as “pop”.
6.3.2. Results: Node level design vs. hop level designFig. 5 compares the pop node level design with the pth hop distance
level design for controlled input traffic. We observe from Fig. 5 that popachieves higher throughput and lower delay than pth. (We found inadditional evaluations that are not included here to avoid clutter thatpth with heavy traffic achieves the same throughput as pop withcontrolled input traffic.) The higher throughput and lower delay withthe pop design are due to the individualized per-node assignments ofthe channel access probability pi and forwarding probability qi accord-ing to the traffic characteristics at each individual node mi. This per-node assignment is computationally still very simple, see Eqs. (46) and(47), and relies on the sets Ri of preceding hop nodes, which are readilyavailable for static WMNs.
6.3.3. Results: Nodes with different hop distancesIn this subsection, we study the throughput and delay performance
experienced by nodes that have different hop distances from the ONU.Fig. 6 shows the average per-node throughput and delay experiencedby nodes that require between one and four hops to reach in ONU inFiWi networks with Z = 2 and 3 clusters. We observe from Fig. 6 thatpth has the most pronounced performance imbalance in that nodeswith short hop distances experience much higher per-node throughputand shorter average delays than nodes with higher hop distances; andthis imbalance worsens for the heavy-loaded input traffic. The pde
setting balances the performance somewhat better compared to pth;however, nodes with lower hop distances still tend to experience bothbetter throughput and delay performance. We further observe fromFig. 6 that the pop setting provides consistently fair per-node through-put to nodes at all hop distances and has the mildest delay imbalance.This fair pop performance with respect to the different hop distances tothe ONU is achieved through the individualized per-node channelaccess and forwarding probabilities based on the traffic characteristicsat each individual node mi. We acknowledge that the nodes with higherhop distances to the ONU tend to have higher delays, even with the popdesign, and this higher delay for higher hop distances is the generalnature of multi-hop networks that would be very difficult to completelyeliminate [64,18]. Overall, we conclude that for balanced FiWi systemperformance, the pop node level channel access probability andforwarding probability design (see Section 5.3) achieves relativelyconsistent and fair throughput-delay performance for the nodes atthe various hop distances from the ONUs.
6.4. Impact of PON DBA
Generally, in FiWi networks, the effects of the PON part becomemost noticeable when the WMN output rate approaches or evenexceeds the PON service rate [38,17,62,36]. In this subsection, weexamine the effects of the PON DBA in the context of the pth settingwith controlled input traffic. We set the PON service rate to half of theWMN rate, i.e., 0.5 (packet/time slot) is the maximum FiWi through-put. Fig. 7 shows the PON delay and throughput as a function of the
Fig. 6. Mean per node throughput and delay as a function of hop distance from the gateway (ONU). (The pth and pde scenarios follow the parameter settings summarized in the captionof Fig. 4, while pop-G follows the parameter settings as per the caption of Fig. 5. The pop-H scenario has source input traffic rate λ p= 5s i i, ).
P.-Y. Chen, M. Reisslein Optical Switching and Networking 28 (2018) 8–22
18
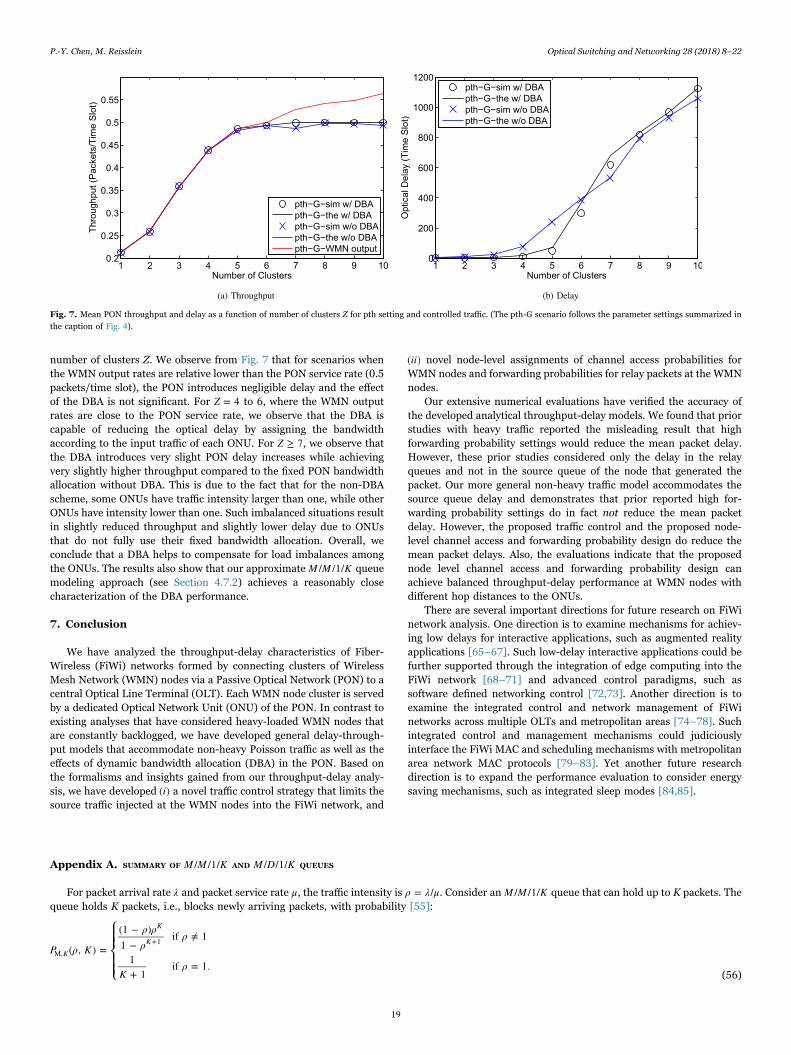
number of clusters Z. We observe from Fig. 7 that for scenarios whenthe WMN output rates are relative lower than the PON service rate (0.5packets/time slot), the PON introduces negligible delay and the effectof the DBA is not significant. For Z = 4 to 6, where the WMN outputrates are close to the PON service rate, we observe that the DBA iscapable of reducing the optical delay by assigning the bandwidthaccording to the input traffic of each ONU. For Z ≥ 7, we observe thatthe DBA introduces very slight PON delay increases while achievingvery slightly higher throughput compared to the fixed PON bandwidthallocation without DBA. This is due to the fact that for the non-DBAscheme, some ONUs have traffic intensity larger than one, while otherONUs have intensity lower than one. Such imbalanced situations resultin slightly reduced throughput and slightly lower delay due to ONUsthat do not fully use their fixed bandwidth allocation. Overall, weconclude that a DBA helps to compensate for load imbalances amongthe ONUs. The results also show that our approximate M M K/ /1/ queuemodeling approach (see Section 4.7.2) achieves a reasonably closecharacterization of the DBA performance.
7. Conclusion
We have analyzed the throughput-delay characteristics of Fiber-Wireless (FiWi) networks formed by connecting clusters of WirelessMesh Network (WMN) nodes via a Passive Optical Network (PON) to acentral Optical Line Terminal (OLT). Each WMN node cluster is servedby a dedicated Optical Network Unit (ONU) of the PON. In contrast toexisting analyses that have considered heavy-loaded WMN nodes thatare constantly backlogged, we have developed general delay-through-put models that accommodate non-heavy Poisson traffic as well as theeffects of dynamic bandwidth allocation (DBA) in the PON. Based onthe formalisms and insights gained from our throughput-delay analy-sis, we have developed i( ) a novel traffic control strategy that limits thesource traffic injected at the WMN nodes into the FiWi network, and
ii( ) novel node-level assignments of channel access probabilities forWMN nodes and forwarding probabilities for relay packets at the WMNnodes.
Our extensive numerical evaluations have verified the accuracy ofthe developed analytical throughput-delay models. We found that priorstudies with heavy traffic reported the misleading result that highforwarding probability settings would reduce the mean packet delay.However, these prior studies considered only the delay in the relayqueues and not in the source queue of the node that generated thepacket. Our more general non-heavy traffic model accommodates thesource queue delay and demonstrates that prior reported high for-warding probability settings do in fact not reduce the mean packetdelay. However, the proposed traffic control and the proposed node-level channel access and forwarding probability design do reduce themean packet delays. Also, the evaluations indicate that the proposednode level channel access and forwarding probability design canachieve balanced throughput-delay performance at WMN nodes withdifferent hop distances to the ONUs.
There are several important directions for future research on FiWinetwork analysis. One direction is to examine mechanisms for achiev-ing low delays for interactive applications, such as augmented realityapplications [65–67]. Such low-delay interactive applications could befurther supported through the integration of edge computing into theFiWi network [68–71] and advanced control paradigms, such assoftware defined networking control [72,73]. Another direction is toexamine the integrated control and network management of FiWinetworks across multiple OLTs and metropolitan areas [74–78]. Suchintegrated control and management mechanisms could judiciouslyinterface the FiWi MAC and scheduling mechanisms with metropolitanarea network MAC protocols [79–83]. Yet another future researchdirection is to expand the performance evaluation to consider energysaving mechanisms, such as integrated sleep modes [84,85].
Appendix A. SUMMARY OF M M K/ /1/ AND M D K/ /1/ QUEUES
For packet arrival rate λ and packet service rate μ, the traffic intensity is ρ λ μ= / . Consider an M M K/ /1/ queue that can hold up to K packets. Thequeue holds K packets, i.e., blocks newly arriving packets, with probability [55]:
⎧⎨⎪⎪
⎩⎪⎪
P ρ K
ρ ρρ
ρ
Kρ
( , ) =
(1 − )1 −
if ≠ 1
1+ 1
if = 1.K
K
KM,
+1
(56)
Fig. 7. Mean PON throughput and delay as a function of number of clusters Z for pth setting and controlled traffic. (The pth-G scenario follows the parameter settings summarized inthe caption of Fig. 4).
P.-Y. Chen, M. Reisslein Optical Switching and Networking 28 (2018) 8–22
19

The queue is empty with probability
⎧⎨⎪⎪
⎩⎪⎪
P ρ K
ρρ
ρ
Kρ
( , ) =
1 −1 −
if ≠ 1
1+ 1
if = 1.
K
M,0
+1
(57)
The average queue length is [55]:
⎧⎨⎪⎪
⎩⎪⎪
L ρ K
ρρ
ρ Kρρ
ρ
K KK
ρ( , ) = 1 −
− ( + 1)1 −
if ≠ 1
( − 1)2( + 1)
if = 1
K
K
M
+1
(58)
and the average waiting time is
W μ λ Kμ
L ρ Kλ P ρ K
( , , ) = 1 +( , )
[1 − ( , )].
KM
M
M, (59)
Denote P ρ K k K( , ), = 0, …,kD, , for the stationary state probabilities of holding k packets in an M D K/ /1/ queue. For k K0 ≤ ≤ − 1, the recursion[55]
∑P ρ K λa P ρ K λ a P ρ K( , ) = ( , ) + ( , ),k kj
k
k j jD, −1 D,0=1
− D,(60)
with a e ρ j= (1 − ∑ / !)n λ jn ρ j1=1
− , start at P = 1D,0 , and normalization with P ρ K∑ ( , ) = 1iK
i=0 D, gives the steady state probabilities. The blockingprobability, i.e., the Kth state probability, is
∑P ρ K ρP ρ K ρ P ρ K( , ) = ( , ) − (1 − ) ( , ).Kj
K
jD, D,0=1
−1
D,(61)
Alternatively, [86] gives an explicit formula for P ρ K( , )kD, , which can become computationally demanding for large K [87]. The average waiting timeof an M D K/ /1/ queue follows with Little's Law as
W μ λ Kμ
L ρ Kλ P ρ K
( , , ) = 1 +( , )
[1 − ( , )],
KD
D
D, (62)
where L ρ K kP ρ K( , ) = ∑ ( , )kK
kD =0 D, is the average M D K/ /1/ queue length.
References
[1] M.G. Bade, M. Toycan, S.D. Walker, Cost and energy efficient operation ofconverged, reconfigurable optical wireless networks, Opt. Switch. Netw. 18 (Part 1)(2015) 71–80.
[2] J. Coimbra, G. Schtz, N. Correia, A game-based algorithm for fair bandwidthallocation in Fibre-Wireless access networks, Opt. Switch. Netw. 10 (2) (2013)149–162.
[3] J. Liu, H. Guo, H. Nishiyama, H. Ujikawa, K. Suzuki, N. Kato, New perspectives onfuture smart FiWi networks: scalability, reliability, and energy efficiency, IEEECommun. Surv. Tutor. 18 (2) (2016) 1045–1072.
[4] Y. Liu, J. Wu, Y. Yu, Z. Ning, X. Wang, K. Zhao, Deployment of survivable fiber-wireless access for converged optical and data center networks, Opt. Switch. Netw.14 (Part 3) (2014) 226–232.
[5] R. Upadhyay, U.R. Bhatt, N. Chouhan, T. Sarsodia, Computation of various QoSparameters for FiWi access network, Procedia Comput. Sci. 78 (2016) 172–178.
[6] N. Zaker, B. Kantarci, M. Erol-Kantarci, H.T. Mouftah, Smart grid monitoring withservice differentiation via EPON and wireless sensor network convergence, Opt.Switch. Netw. 14 (August (Part 1)) (2014) 53–68.
[7] P. Bhaumik, A.S. Reaz, D. Murayama, K.-I. Suzuki, N. Yoshimoto, G. Kramer,B. Mukherjee, IPTV over EPON: synthetic traffic generation and performanceevaluation, Opt. Switch. Netw. 18 (Part 2) (2015) 180–190.
[8] A. Buttaboni, M.D. Andrade, M. Tornatore, A. Pattavina, Dynamic bandwidth andwavelength allocation with coexisting transceiver technology in WDM/TDM PONs,Opt. Switch. Netw. 21 (2016) 31–42.
[9] M.D. Andrade, A. Buttaboni, M. Tornatore, P. Boffi, P. Martelli, A. Pattavina,Optimization of long-reach TDM/WDM passive optical networks, Opt. Switch.Netw. 16 (2015) 36–45.
[10] S.M.F.S.F. Gillani, M.A. Khan, M.K. Shahid, Reach extendibility of passive opticalnetwork technologies, Opt. Switch. Netw. 18 (Part 3) (2015) 211–221.
[11] X. Gong, L. Guo, Y. Liu, Y. Zhou, H. Li, Optimization mechanisms in multi-dimensional and flexible PONs: challenging issues and possible solutions, Opt.Switch. Netw. 18 (Part 1) (2015) 120–134.
[12] A. Kanungoe, A. Mukhopadhyay, G. Das, R. Banerjee, R. Das, A new protectionscheme for a combined ring-star based hybrid WDM/TDM PON architecture, Opt.Switch. Netw. 18 (Part 2) (2015) 153–168.
[13] J.-R. Lai, W.-P. Chen, High utilization dynamic bandwidth allocation algorithmbased on sorting report messages with additive-polling thresholds in EPONs, Opt.
Switch. Netw. 18 (Part 1) (2015) 81–95.[14] M. Mahloo, J. Chen, L. Wosinska, PON versus AON: which is the best solution to
offload core network by peer-to-peer traffic localization, Opt. Switch. Netw. 15(2015) 1–9.
[15] M.P. McGarry, M. Reisslein, F. Aurzada, M. Scheutzow, Shortest propagation delay(SPD) first scheduling for EPONs with heterogeneous propagation delays, IEEE J.Sel. Areas Commun. 28 (6) (2010) 849–862.
[16] A. Mercian, M.P. McGarry, M. Reisslein, Offline and online multi-thread polling inlong-reach PONs: a critical evaluation, IEEE/OSA J. Lightw. Technol. 31 (12)(2013) 2018–2028.
[17] P.-Y. Chen, M. Reisslein, A simple analytical throughput-delay model for clusteredFiWi networks, Photon. Netw. Commun. 29 (February (1)) (2015) 78–95.
[18] T. Liu, W. Liao, Location-dependent throughput and delay in wireless meshnetworks, IEEE Trans. Veh. Technol. 57 (March (2)) (2008) 1188–1198.
[19] P. Li, C. Zhang, Y. Fang, Capacity and delay of hybrid wireless broadband accessnetworks, IEEE J. Sel. Areas Commun. 27 (February (2)) (2009) 117–125.
[20] D. Shila, Y. Cheng, T. Anjali, Throughput and delay analysis of hybrid wirelessnetworks with multi-hop uplinks, Proc. IEEE Info. (2011) 1476–1484.
[21] D. Wang, A.A. Abouzeid, Throughput and delay analysis for hybrid radio-frequencyand free-space-optical (RF/FSO) networks, Wirel. Netw. 17 (4) (2011) 877–892.
[22] A. Zemlianov, G. de Veciana, Capacity of ad hoc wireless networks with infra-structure support, IEEE J. Sel. Areas Commun. 23 (March (3)) (2005) 657–667.
[23] Y. Feng, X. Shen, Z. Gao, G. Dai, Queuing based traffic model for wireless meshnetworks, Proc. IEEE ICPADS (2009) 648–654.
[24] W. Liu, D. Zhao, G. Zhu, End-to-end delay and packet drop rate performance for awireless sensor network with a cluster-tree topology, Wirel. Commun. Mob. Comp.14 (May (7)) (2014) 729–744.
[25] V.S. Naeini, Performance analysis of WiMAX-based wireless mesh networks usingan M/D/1 queuing model, Int. J. Wirel. Mob. Comp. 7 (1) (2014) 35–47.
[26] Y. Chen, J. Chen, Y. Yang, Multi-hop delay performance in wireless mesh networks,Mob. Netw. Appl. 13 (1–2) (2008) 160–168.
[27] S. Pandey, V. Tambakad, G. Kadambi, Y. Vershinin, An analytic model for routeoptimization in load shared wireless mesh network, Proc. IEEE EMS (2013)543–548.
[28] W. Tu, C. Sreenan, Adaptive split transmission for video streams in wireless meshnetworks, Proc. IEEE WCNC (2008) 3122–3127.
[29] F.R. Vieira, J.F. de Rezende, V.C. Barbosa, S. Fdida, Scheduling links for heavytraffic on interfering routes in wireless mesh networks, Comput. Netw. 56 (5)(2012) 1584–1598.
P.-Y. Chen, M. Reisslein Optical Switching and Networking 28 (2018) 8–22
20

[30] N. Bisnik, A. Abouzeid, Queuing network models for delay analysis of multihopwireless ad hoc networks, Ad Hoc Netw. 7 (1) (2009) 79–97.
[31] F. Wang, O. Younis, M. Krunz, Throughput-oriented MAC for mobile ad hocnetworks: a game-theoretic approach, Ad Hoc Netw. 7 (1) (2009) 98–117.
[32] Y. Dashti, M. Reisslein, CluLoR: clustered localized routing for FiWi networks, J.Netw. 9 (4) (2014) 828–839.
[33] S. He, G. Shou, Y. Hu, Z. Guo, Performance of multipath in Fiber-Wireless (FiWi)access network with network virtualization, Proc. IEEE Milcom (2013) 928–932.
[34] M. Honda, H. Nishiyama, H. Nomura, T. Yada, H. Yamada, N. Kato, On theperformance of downstream traffic distribution scheme in fiber-wireless networks,Proc. IEEE WCNC (2011) 434–439.
[35] S. Li, J. Wang, C. Qiao, Y. Xu, Mitigating packet reordering in FiWi networks,IEEE/OSA J. Opt. Commun. Netw. 3 (February (2)) (2011) 134–144.
[36] J. Wang, K. Wu, S. Li, C. Qiao, Performance modeling and analysis of multi-pathrouting in integrated fiber-wireless networks, Proc. IEEE Info. (2010) 1–5.
[37] Z. Zheng, J. Wang, J. Wang, A study of network throughput gain in optical-wireless(FiWi) networks subject to peer-to-peer communications, Proc. IEEE ICC (2009)1–6.
[38] F. Aurzada, M. Levesque, M. Maier, M. Reisslein, FiWi access networks based onnext-generation PON and gigabit-class WLAN technologies: a capacity and delayanalysis, IEEE/ACM Trans. Netw. 22 (August (4)) (2014) 1176–1189.
[39] A. Dhaini, P.-H. Ho, X. Jiang, QoS control for guaranteed service bundles overFiber-Wireless (FiWi) broadband access networks, IEEE/OSA J. Lightw. Technol.29 (May (10)) (2011) 1500–1513.
[40] A.R. Dhaini, P.-H. Ho, X. Jiang, Performance analysis of QoS-aware layer-2 VPNsover fiber-wireless (FiWi) networks, Proc. IEEE Globecom (2010) 1–6.
[41] M. Fadlullah, H. Nishiyama, Y. Kawamoto, H. Ujikawa, K.-I. Suzuki, N. Yoshimoto,Cooperative QoS control scheme based on scheduling information in FiWi accessnetwork, IEEE Trans. Emerg. Top. Comput. 1 (December (2)) (2013) 375–383.
[42] Y. Lee, S. Choi, Y. Choi, End-to-end delay differentiation mechanism for integratedEPON-WiMAX networks, Photon. Netw. Commun. 27 (2) (2014) 73–79.
[43] B.P. Rimal, M. Maier, Mobile data offloading in FiWi enhanced LTE-A hetero-geneous networks, IEEE/OSA J. Opt. Commun. Netw. 9 (7) (2017) 601–615.
[44] J. Wang, K. Lu, J. Wang, C. Qiao, A joint network coding and device associationdesign for optimal local data exchange in fiber-wireless access network, IEEE/OSAJ. Lightw. Technol. 35 (11) (2017) 2046–2062.
[45] A. Barradas, N. Correia, J. Coimbra, G. Schutz, Load adaptive and fault tolerantframework for energy saving in fiber-wireless access networks, IEEE/OSA J. Opt.Commun. Netw. 5 (September (9)) (2013) 957–967.
[46] R.A. Butt, S.M. Idrus, K.N. Qureshi, P.M.A. Shah, N. Zulkifli, An energy efficientcyclic sleep control framework for ITU PONs, Opt. Switch. Netw. 27 (2018) 7–17.
[47] B. Kantarci, H. Mouftah, Energy efficiency in the extended- r each fiber-wirelessaccess networks, IEEE Netw. 26 (March (2)) (2012) 28–35.
[48] G.C. Sankaran, K.M. Sivalingam, ONU buffer reduction for power efficiency inpassive optical networks, Opt. Switch. Netw. 10 (4) (2013) 416–429.
[49] K. Togashi, H. Nishiyama, N. Kato, H. Ujikawa, K.-I. Suzuki, N. Yoshimoto, Crosslayer analysis on ONU energy consumption in smart FiWi networks, IEEE Wirel.Commun. Lett. 2 (December (6)) (2013) 695–698.
[50] R. Wang, A. Liang, D. Wu, D. Wu, Delay-aware adaptive sleep mechanism for greenwireless-optical broadband access networks, Opt. Fiber Technol. 36 (2017)271–280.
[51] R. Wang, A. Liang, C. Zhou, D. Wu, H. Zhang, QoS -aware energy-savingmechanism for hybrid optical-wireless broadband access networks, Photon. Netw.Commun. 34 (2) (2017) 170–180.
[52] I.F. Akyildiz, X. Wang, W. Wang, Wireless mesh networks: a survey, Comp. Netw.47 (4) (2005) 445–487.
[53] R. Bruno, M. Conti, E. Gregori, Mesh networks: commodity multihop ad hocnetworks, IEEE Commun. Mag. 43 (3) (2005) 123–131.
[54] G. Bianchi, Performance analysis of the IEEE 802.11 distributed coordinationfunction, IEEE J. Sel. Areas Commun. 18 (3) (2000) 535–547.
[55] D. Gross, C.M. Harris, Fundamentals of Queuing Theory, Wiley-Interscience, 1998.[56] A. Bontozoglou, K. Yang, K. Guild, A midterm DBA algorithm for quality of service
on aggregation layer EPON networks, Photon. Netw. Commun. 25 (2) (2013)120–134.
[57] M.P. McGarry, M. Reisslein, Investigation of the DBA algorithm design space forEPONs, J. Lightw. Technol. 30 (14) (2012) 2271–2280.
[58] C.-C. Sue, K.-C. Chuang, Y.-T. Wu, S.-J. Lin, C.-C. Liu, Active intra-ONU schedulingwith proportional guaranteed bandwidth in long-reach EPONs, Photon. Netw.Commun. 27 (3) (2014) 106–118.
[59] L. Zhou, H.-L. Wong, Y.-K. Yeo, X. Cheng, X. Shao, Z. Xu, Traffic scheduling inhybrid WDM-TDM PON with wavelength-reuse ONUs, Photon. Netw. Commun. 24(2) (2012) 151–159.
[60] U.R. Bhatt, N. Chouhan, R. Upadhyay, Hybrid algorithm: a cost efficient solutionfor ONU placement in Fiber-Wireless (FiWi) network, Opt. Fiber Technol. 22(2015) 76–83.
[61] U.R. Bhatt, N. Chouhan, R. Upadhyay, C. Agrawal, ONU placement in fiber-wireless(FiWi) access networks using teacher phase of Teaching Learning BasedOptimization (TLBO) algorithm, in: Proceedings IEEE International Conference onComputational Intelligence & Commun. Techn. (CICT), 2017, pp. 1–4.
[62] Y. Liu, Q. Song, B. Li, R. Ma, Load balanced optical network unit (ONU) placementin cost-efficient fiber-wireless (FiWi) access network, Opt.-Int. J. Light ElectronOpt. 124 (20) (2013) 4594–4601.
[63] P. Singh, S. Prakash, Optical network unit placement in fiber-wireless (FiWi) accessnetwork by Moth-Flame optimization algorithm, Opt. Fiber Technol. 36 (2017)403–411.
[64] V. Gambiroza, B. Sadeghi, E.W. Knightly, End-to-end performance and fairness inmultihop wireless backhaul networks, in: Proceedings ACM MobiCom, 2004, pp.287–301.
[65] T. Jiménez, N. Merayo, R.J. Durán, P. Fernández, I. De Miguel, J.C. Aguado,R.M. Lorenzo, E.J. J. Abril, A PID-based algorithm to guarantee QoS delayrequirements in LR-PONs, Opt. Switch. Netw. 14 (2014) 78–92.
[66] K. Kunert, M. Jonsson, A. Böhm, T. Nordström, Providing efficient support for real-time guarantees in a fibre-optic AWG-based network for embedded systems, Opt.Switch. Netw. 24 (2017) 47–56.
[67] A. Pašić, P. Babarczi, A. Kőrösi, Diversity coding-based survivable routing with QoSand differential delay bounds, Opt. Switch. Netw. 23 (2017) 118–128.
[68] X. Gong, L. Guo, G. Shen, G. Tian, Virtual network embedding for collaborativeedge computing in optical-wireless networks, IEE/OSA J. Lightw. Technol. 35 (18)(2017) 3980–3990.
[69] B.P. Rimal, D.P. Van, M. Maier, Cloudlet enhanced fiber-wireless access networksfor mobile-edge computing, IEEE Trans. Wirel. Commun. 16 (6) (2017)3601–3618.
[70] B.P. Rimal, D.P. Van, M. Maier, Mobile edge computing empowered fiber-wirelessaccess networks in the 5G era, IEEE Commun. Mag. 55 (2) (2017) 192–200.
[71] B.P. Rimal, D.P. Van, M. Maier, Mobile-edge computing vs. centralized cloudcomputing over a converged fiwi access network, IEEE Trans. Netw. Serv. Manag.14 (3) (2017) 498–513.
[72] N. Cvijetic, T. Wang, Systems challenges for SDN in fiber wireless networks, inFiber-Wireless Convergence in Next-Generation Communication Networks. Cham,Switzerland: Springer, 2017, pp. 189–209.
[73] A.S. Thyagaturu, A. Mercian, M.P. McGarry, M. Reisslein, W. Kellerer, Softwaredefined optical networks (SDONs): a comprehensive survey, IEEE Commun. Surv.Tutor. 18 (4) (2016) 2738–2786.
[74] R. Brenot, G. De Valicourt, Telecommunications network node linking a metro-politan area network with at least one access network, Jan. 3 2017, US Patent 9,537,597.
[75] X. Cao, I. Popescu, G. Chen, H. Guo, N. Yoshikane, T. Tsuritani, J. Wu, I. Morita,Optimal and dynamic virtual datacenter provisioning over metro-embeddeddatacenters with holistic SDN orchestration, Opt. Switch. Netw. 24 (2017) 1–11.
[76] Y. Hou, H. Li, Y. Liu, Y. Qiu, Y. Ji, OpenFlow-based adaptive adjustment of opticalpath resources in dynamic optical networks, Opt. Switch. Netw. 22 (2016)105–116.
[77] W. Xia, C. Gan, S. Ma, L. Xu, W. Xie, Multi-channel scheduling algorithm for multi-subsystem-based VPON in metro-access optical network, Opt. Switch. Netw. 21(2016) 58–66.
[78] Y. Zhang, C. Gan, K. Gou, J. Hua, GPON-and-EPON transmission based on multi-standard OLT management structure for VPON in metro-access optical network,Opt. Switch. Netw. 25 (2017) 24–32.
[79] A. Bianco, T. Bonald, D. Cuda, R.-M. Indre, Cost, power consumption andperformance evaluation of metro networks, IEEE/OSA J. Opt. Commun. Netw. 5(1) (2013) 81–91.
[80] M. Maier, M. Reisslein, A. Wolisz, A hybrid MAC protocol for a metro WDMnetwork using multiple free spectral ranges of an arrayed-waveguide grating,Comput. Netw. 41 (4) (2003) 407–433.
[81] M. Scheutzow, M. Maier, M. Reisslein, A. Wolisz, Wavelength reuse for efficientpacket-switched transport in an AWG-based metro WDM network, IEEE J. Lightw.Technol. 21 (6) (2003) 1435–1455.
[82] H.-S. Yang, M. Maier, M. Reisslein, W.M. Carlyle, A genetic algorithm-basedmethodology for optimizing multiservice convergence in a metro WDM network,IEEE/OSA J. Lightw. Technol. 21 (5) (2003) 1114–1133.
[83] A.X. Zheng, L. Zhang, V.W. Chan, Metropolitan area network architecture foroptical flow switching, IEEE/OSA J. Opt. Commun. Netw. 9 (6) (2017) 511–523.
[84] M. Bokhari, M. Sohail, J.K. Kasi, A.K. Kasi, Performance analysis of passive opticalnetworks with energy saving through the integrated sleep mode, Opt. Switch. Netw.21 (2016) 16–30.
[85] A. Dixit, B. Lannoo, D. Colle, M. Pickavet, P. Demeester, Energy efficient dynamicbandwidth allocation for Ethernet passive optical networks: overview, challenges,and solutions, Opt. Switch. Netw. 18 (Part 2) (2015) 169–179.
[86] O. Brun, J.-M. Garcia, Analytical solutions of finite capacity M/D/1 queues, J. Appl.Prob. 11 (2000) 1092–1098.
[87] H. Tijms, New and old results for the M/D/c queue, Int. J. Electron. Commun. 60(2) (2006) 125–130.
P.-Y. Chen, M. Reisslein Optical Switching and Networking 28 (2018) 8–22
21

Po-Yen Chen received the Ph.D. degree in electricalengineering from Arizona State University, Tempe, USA,in 2015. He currently works as an advanced productdevelopment researcher in Taiwan. His research interestsinclude performance analysis and modeling of wirelesscommunication systems and hybrid wireless mesh net-works.
Martin Reisslein is a Professor in the School ofElectrical, Computer, and Energy Engineering at ArizonaState University (ASU), Tempe, USA. He received the Ph.D.in systems engineering from the University ofPennsylvania, Philadelphia, PA, in 1998. He currentlyserves as Associate Editor for the IEEE Transactions onMobile Computing, the IEEE Transactions on Education,and IEEE Access as well as Computer Networks andOptical Switching and Networking. He is AssociateEditor-in-Chief for the IEEE Communications Surveys &Tutorials and chairs the steering committee of the IEEETransactions on Multimedia.
P.-Y. Chen, M. Reisslein Optical Switching and Networking 28 (2018) 8–22
22