
Optical microscopy and surface thermodynamics of … · Optical microscopy and surface...
6
Optical microscopy and surface thermodynamics of Janus emulsions F. A. Perrechil 1 , G. R. Leonardi 1 and S. E. Friberg 2 1 Institute of Environmental, Chemistry and Pharmaceuticals Sciences, Federal University of São Paulo, UNIFESP, Diadema, Brazil 2 Ugelstad Laboratory, NTNU, Trondheim, Norway The chapter provides optical microscopy of simple Janus emulsions, in which the drops contain two mutually immiscible oils in water to be distinguished from more complex systems such as triple Janus emulsions of the type silicone oil-in- vegetable oil-in-water-in-vegetable oil-in silicone oil, which have recently been found in a batch emulsification process. These emulsion images are analyzed with regards both to the local interfacial equilibrium of free drops, but also, and more importantly, the potential interaction with the solid surfaces of the microscope slide and the cover glass. Keywords: Janus emulsions; interfacial free energy equilibrium; Janus drop topology; spontaneous emulsification 1. Introduction Optical microscopy has had a limited application in emulsion science [1], because the images of most emulsions only show spherical drops, as shown in Fig. 1A, and the useful information is very limited indeed. Even, advanced microscopy; such as directly obtaining pictures of the destabilization of emulsions in a high speed centrifuge [2] provides information restricted to drop size changes during coalescence. As a contrast, optical microscopy of biological tissue yields an abundance of facts, because the inherent complexity of the structures makes the visible image extremely useful as exemplified by the image of skin layers in Fig. 1B. From a different perspective, emulsions are innately unstable and equilibrium thermodynamics has found virtually no application in their research, because, strictly speaking, the concept of “emulsion stability” is a misnomer, actually referring to the kinetics of the destabilization process. An early attempt [3] to introduce thermodynamics via the catastrophe theory [4], to describe inversion hysteresis, was met with severe objections [5,6], in spite of credible efforts [7]. Fig. 1 Optical microscopy images of (A) a simple emulsion and (B) a slice through pig skin layers; (S. b.) Stratum basale, (S. s.) Stratum spinosum, (S. g.) Stratum graulosum, (S. c.) Stratum corneum, (Ed) Epidermis and (D) Dermis. This situation was reversed, when the microfluidics method [8] was introduced and found extensive application in the emulsion area [9,10]. Now more complex multiple emulsions were prepared, including by high energy methods [11] and optical microscopy became a more useful investigative tool. So was particularly the case with Janus emulsions (Fig. 2) [10,12-14], for which optical microscopy offered essential information and, in addition, a major factor for the drop topology was found to rest with the local interfacial equilibrium at the contact line [10,12-15]. A B Microscopy: advances in scientific research and education (A. Méndez-Vilas, Ed.) __________________________________________________________________ 1037 © FORMATEX 2014
Transcript of Optical microscopy and surface thermodynamics of … · Optical microscopy and surface...

Optical microscopy and surface thermodynamics of Janus emulsions
F. A. Perrechil1, G. R. Leonardi1 and S. E. Friberg2 1 Institute of Environmental, Chemistry and Pharmaceuticals Sciences, Federal University of São Paulo, UNIFESP,
Diadema, Brazil 2 Ugelstad Laboratory, NTNU, Trondheim, Norway
The chapter provides optical microscopy of simple Janus emulsions, in which the drops contain two mutually immiscible oils in water to be distinguished from more complex systems such as triple Janus emulsions of the type silicone oil-in-vegetable oil-in-water-in-vegetable oil-in silicone oil, which have recently been found in a batch emulsification process. These emulsion images are analyzed with regards both to the local interfacial equilibrium of free drops, but also, and more importantly, the potential interaction with the solid surfaces of the microscope slide and the cover glass.
Keywords: Janus emulsions; interfacial free energy equilibrium; Janus drop topology; spontaneous emulsification
1. Introduction
Optical microscopy has had a limited application in emulsion science [1], because the images of most emulsions only show spherical drops, as shown in Fig. 1A, and the useful information is very limited indeed. Even, advanced microscopy; such as directly obtaining pictures of the destabilization of emulsions in a high speed centrifuge [2] provides information restricted to drop size changes during coalescence. As a contrast, optical microscopy of biological tissue yields an abundance of facts, because the inherent complexity of the structures makes the visible image extremely useful as exemplified by the image of skin layers in Fig. 1B. From a different perspective, emulsions are innately unstable and equilibrium thermodynamics has found virtually no application in their research, because, strictly speaking, the concept of “emulsion stability” is a misnomer, actually referring to the kinetics of the destabilization process. An early attempt [3] to introduce thermodynamics via the catastrophe theory [4], to describe inversion hysteresis, was met with severe objections [5,6], in spite of credible efforts [7].
Fig. 1 Optical microscopy images of (A) a simple emulsion and (B) a slice through pig skin layers; (S. b.) Stratum basale, (S. s.) Stratum spinosum, (S. g.) Stratum graulosum, (S. c.) Stratum corneum, (Ed) Epidermis and (D) Dermis. This situation was reversed, when the microfluidics method [8] was introduced and found extensive application in the emulsion area [9,10]. Now more complex multiple emulsions were prepared, including by high energy methods [11] and optical microscopy became a more useful investigative tool. So was particularly the case with Janus emulsions (Fig. 2) [10,12-14], for which optical microscopy offered essential information and, in addition, a major factor for the drop topology was found to rest with the local interfacial equilibrium at the contact line [10,12-15].
A B
Microscopy: advances in scientific research and education (A. Méndez-Vilas, Ed.)__________________________________________________________________
1037© FORMATEX 2014
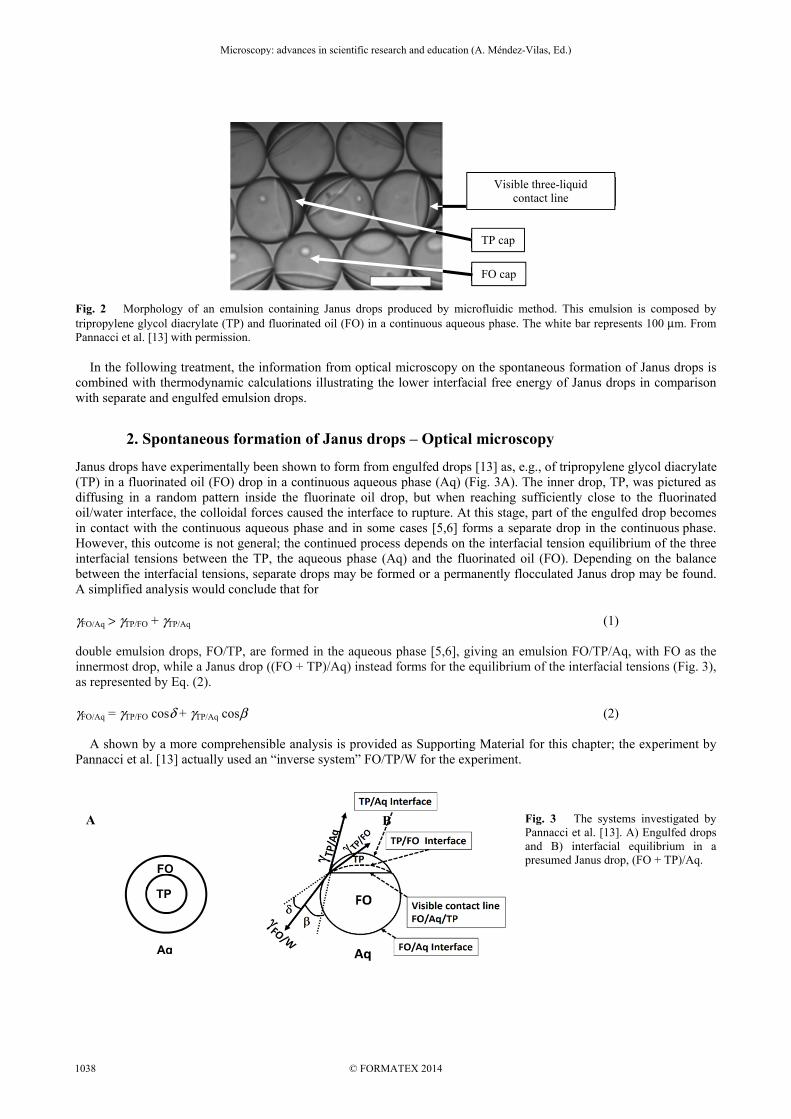
Fig. 2 Morphology of an emulsion containing Janus drops produced by microfluidic method. This emulsion is composed by tripropylene glycol diacrylate (TP) and fluorinated oil (FO) in a continuous aqueous phase. The white bar represents 100 μm. From Pannacci et al. [13] with permission. In the following treatment, the information from optical microscopy on the spontaneous formation of Janus drops is combined with thermodynamic calculations illustrating the lower interfacial free energy of Janus drops in comparison with separate and engulfed emulsion drops.
2. Spontaneous formation of Janus drops – Optical microscopy
Janus drops have experimentally been shown to form from engulfed drops [13] as, e.g., of tripropylene glycol diacrylate (TP) in a fluorinated oil (FO) drop in a continuous aqueous phase (Aq) (Fig. 3A). The inner drop, TP, was pictured as diffusing in a random pattern inside the fluorinate oil drop, but when reaching sufficiently close to the fluorinated oil/water interface, the colloidal forces caused the interface to rupture. At this stage, part of the engulfed drop becomes in contact with the continuous aqueous phase and in some cases [5,6] forms a separate drop in the continuous phase. However, this outcome is not general; the continued process depends on the interfacial tension equilibrium of the three interfacial tensions between the TP, the aqueous phase (Aq) and the fluorinated oil (FO). Depending on the balance between the interfacial tensions, separate drops may be formed or a permanently flocculated Janus drop may be found. A simplified analysis would conclude that for γFO/Aq > γTP/FO + γTP/Aq (1) double emulsion drops, FO/TP, are formed in the aqueous phase [5,6], giving an emulsion FO/TP/Aq, with FO as the innermost drop, while a Janus drop ((FO + TP)/Aq) instead forms for the equilibrium of the interfacial tensions (Fig. 3), as represented by Eq. (2). γFO/Aq = γTP/FO cosδ + γTP/Aq cosβ (2) A shown by a more comprehensible analysis is provided as Supporting Material for this chapter; the experiment by Pannacci et al. [13] actually used an “inverse system” FO/TP/W for the experiment.
Fig. 3 The systems investigated by Pannacci et al. [13]. A) Engulfed drops and B) interfacial equilibrium in a presumed Janus drop, (FO + TP)/Aq.
Visible three-liquid contact line
TP cap
FO cap
FO
TP
Aq
A B
Microscopy: advances in scientific research and education (A. Méndez-Vilas, Ed.)__________________________________________________________________
© FORMATEX 20141038
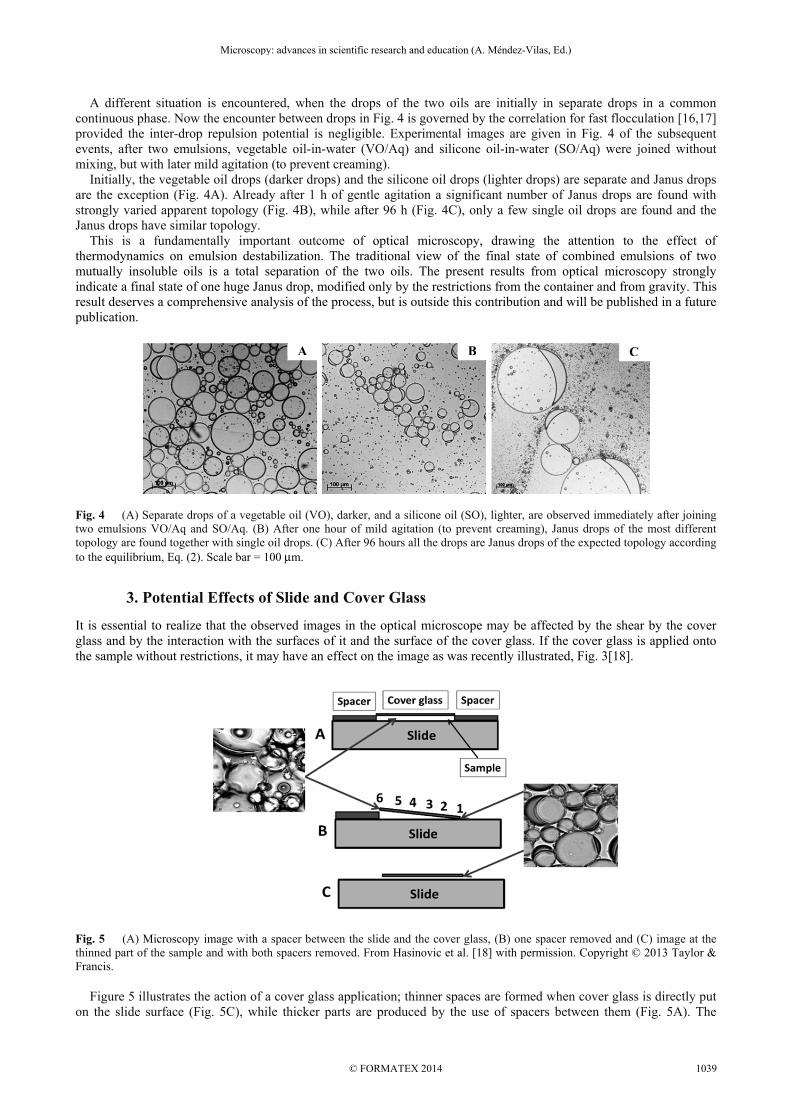
A different situation is encountered, when the drops of the two oils are initially in separate drops in a common continuous phase. Now the encounter between drops in Fig. 4 is governed by the correlation for fast flocculation [16,17] provided the inter-drop repulsion potential is negligible. Experimental images are given in Fig. 4 of the subsequent events, after two emulsions, vegetable oil-in-water (VO/Aq) and silicone oil-in-water (SO/Aq) were joined without mixing, but with later mild agitation (to prevent creaming). Initially, the vegetable oil drops (darker drops) and the silicone oil drops (lighter drops) are separate and Janus drops are the exception (Fig. 4A). Already after 1 h of gentle agitation a significant number of Janus drops are found with strongly varied apparent topology (Fig. 4B), while after 96 h (Fig. 4C), only a few single oil drops are found and the Janus drops have similar topology. This is a fundamentally important outcome of optical microscopy, drawing the attention to the effect of thermodynamics on emulsion destabilization. The traditional view of the final state of combined emulsions of two mutually insoluble oils is a total separation of the two oils. The present results from optical microscopy strongly indicate a final state of one huge Janus drop, modified only by the restrictions from the container and from gravity. This result deserves a comprehensive analysis of the process, but is outside this contribution and will be published in a future publication. Fig. 4 (A) Separate drops of a vegetable oil (VO), darker, and a silicone oil (SO), lighter, are observed immediately after joining two emulsions VO/Aq and SO/Aq. (B) After one hour of mild agitation (to prevent creaming), Janus drops of the most different topology are found together with single oil drops. (C) After 96 hours all the drops are Janus drops of the expected topology according to the equilibrium, Eq. (2). Scale bar = 100 μm.
3. Potential Effects of Slide and Cover Glass
It is essential to realize that the observed images in the optical microscope may be affected by the shear by the cover glass and by the interaction with the surfaces of it and the surface of the cover glass. If the cover glass is applied onto the sample without restrictions, it may have an effect on the image as was recently illustrated, Fig. 3[18].
Fig. 5 (A) Microscopy image with a spacer between the slide and the cover glass, (B) one spacer removed and (C) image at the thinned part of the sample and with both spacers removed. From Hasinovic et al. [18] with permission. Copyright © 2013 Taylor & Francis. Figure 5 illustrates the action of a cover glass application; thinner spaces are formed when cover glass is directly put on the slide surface (Fig. 5C), while thicker parts are produced by the use of spacers between them (Fig. 5A). The
A B C
Microscopy: advances in scientific research and education (A. Méndez-Vilas, Ed.)__________________________________________________________________
1039© FORMATEX 2014

thinner sample reveals more details of the individual drops, but the problems of a potential distortion of the image can occur. This distortion may be severe; as illustrated by the difference of images in Fig. 6, A and B.
Fig. 6 Images of a Janus emulsion (A) without cover glass and (B) with. Scale bar = 100 μm. The example in Fig. 6 distinctly shows the potential image distortion from a cover glass. In this case, the image of the actual drops (Fig. 6A), was completely distorted when the cover glass was added (Fig. 6B). It is useful to briefly mention a different example of a related occurrence, before relating them to the fundamentals of such phenomena. Figure 7 shows the image of a Janus emulsion of vegetable (grey) and silicon (white) oils with one drop of the former spread on the slide glass surface.
Fig. 7 An example of an emulsion drop having spread on the slide glass surface, giving a distorted image.
The phenomenon may at a first glance be interpreted as reflecting the balance of interfacial tensions.
Fig. 8 Equilibrium conditions for a vegetable oil drop in an aqueous emulsion adhering to the surface of a glass slide.
The profile of the vegetable oil drop on a slide glass surface (Fig. 8) may at first be interpreted as at equilibrium and Young’s law applied (Eq. (3)). γSG/AS - γVO/SG = γVO/AS cosα (3) The conclusion would be that the interfacial tension of the aqueous solution versus the glass surface would be greater than the tension between the vegetable oil and the glass surface. This is highly unlikely, considering the molecular structure of the three media and the reason for this unexpected result is instead found in a not uncommon mistake. The Young’s law assumes equilibrium at the contact line and although this is a realistic assumption for a three-liquid contact; hysteresis may be significant, when a solid surface is encountered.
A B
Microscopy: advances in scientific research and education (A. Méndez-Vilas, Ed.)__________________________________________________________________
© FORMATEX 20141040
Hence, the image in Fig. 7 should rather be referred to as an outcome of the press from the cover glass flattening the oil drop to an extent that a direct contact between the vegetable oil and the glass surface is forced. The subsequent relaxation of the pressure does not lead to a modification of the drop to equilibrium conditions because of hysteresis and the non-equilibrium state of the drop is observed as in Fig. 7. These distortions of the microscope image depend on the contact with the solid surfaces. In addition to this problem, the use of the images of a Janus drop to evaluate true angles at the contact line and with them the ratio between the interfacial tensions is impeded by the fact that the image reflects a vertical projection of the drops only and any orientation of the drop giving a curved contact line projection does not provide direct and useful information. Hence, the angle β becomes directly accessible, only if the orientation of the drop is such that the contact line is seen as a straight line in the image, as illustrated in Fig. 3. However, the true drop geometry may be calculated from images with different orientation, as will be shown in the next section.
3.1 Estimation of true geometry
The Janus drop microscopy in Figs. 2 and 4 draws attention to the potential to evaluate the interfacial equilibrium conditions from optical microscopy pictures, but, as mentioned, most of the drop images have an orientation, which will not project a straight contact line. However, essential information is actually even available from images, in which the visible contact line is curved. Fig. 9 provides the vital dimensions, which are necessary for such an evaluation.
Fig. 9 A drawing of a Janus drop in less than optimal orientation to find the true profiles.
Most microscopy images show only the contact line (visible contact line Fig. 2) and the oil/water interfaces (O1/W and O2/W), as shown in Fig. 4, but none of them equal to the features in Fig. 3. However, the profiles in question may be recalculated to the orientation in Fig. 3, using the following correlations. The crucial information is a/d (Fig. 9), which equals sinϕ [14,15], with ϕ the tilt angle from the Fig. 3 orientation of the drop. The value of c (Fig. 9) for an optimally oriented drop becomes c/cosϕ and, similarly, e becomes e/cosϕ. Redrawing the visible O2 cap with this value, enables the visualization of the correct O2/W interface and a measure of the angle β (Fig. 3). An example of such a correction is presented in Fig. 10.
3.2 Correlation to interfacial tensions
To extend the information to the interfacial tension numbers, the “Indicated O1/O2 interface”, Fig. 9 must also be observed or – at least - indicated. After calculating the corrected value of b, Fig. 9, the value of δ is arrived at as b/cosϕ and the ratios between the three interfacial tensions is available from [14,15]. cosβ = (1 + (γ2
O2/W/γ2O1/W) - (γ2
O1/O2/γ2O1/W))/(2γO2/W/γO1/W) (4)
Fig. 10 Optical microscopy photo of a Janus drop and thecorresponding reoriented image dotted white lines.
Microscopy: advances in scientific research and education (A. Méndez-Vilas, Ed.)__________________________________________________________________
1041© FORMATEX 2014

cosδ = (1 - (γ2O2/W/γ2
O1/W) + (γ2O1/O2/γ2
O1/W))/(2γO1/O2/γO1/W) (5) As an example may be mentioned a microphoto of a vegetable/silicone oil Janus drop, in which the angle β was found at 10.2° and δ at 29.5°. Solving Eq. (4) and (5) gave the results γO2/W/γO1/W = 0.78 and γO2/W/γO1/W = 0.27, which are realistic values. Assuming a credible value of γO1/W = 6 mN/m2, one obtains γO2/W = 4.2 mN/m2 and γO1/O2 = 1.6 mN/m2; both well within the ranges found experimentally.
4. Conclusions
Optical microscopy is an useful tool to study complex emulsions, such as those with Janus drops. Besides their morphology, the optical microscopy also may provide information about the balance of interfacial tensions. Nevertheless, prudence is necessary to achieve images without distortion. The distance between the microscope slide and the cover glass may significantly affect the images of emulsions, as well as the interaction of the drops with the glass surfaces. Thus, the conditions to obtain the images of Janus drops need to be carefully analyzed and the use of spacers or the treatment of the glass surfaces to modify their polarity considered.
References
[1] Sjöblom J. Emulsion and Emulsion Stability. 2nd ed. Boca Raton: CRC Press LLC; 2006. [2] Krebs T, Ershov D, Schroen CGPH, Boom RM. Coalescence and compression in centrifuged emulsions studied with in situ
optical microscopy. Soft Matter. 2013; 9: 4026-4035. [3] Dickinson E. Interpretation of Emulsion Phase Inversion as a Cusp Catastrophe. J Colloid Interface Sci. 1981; 84:284–287. [4] Thom R. Stabilite’ structurelle et morphoge’ne\se. London: Benjamin;1972. [5] Vaessen GEJ, Stein HN. The Application of Catastrophe Theory to Emulsion Phase Inversion. J Colloid Interface Sci. 1995;
176: 378-387. [6] Vaessen GEJ, Visschers M, Stein HN. Predicting Catastrophic Phase Inversion on the Basis of Droplet Coalescence Kinetics.
Langmuir. 1996; 12: 875-882. [7] Salager JL. Applications of Catastrophe Theory to Surfactant-Oil-Brine Equilibrated and Emulsified Systems. In: Mittal KL,
Bothorel P, editors. Surfactants in Solution. New York: Plenum Press; 1987. p. 439-448. [8] Nisisako T, Okushima S, Torii T. Controlled formulation of monodisperse double emulsions in a multiple-phase microfluidic
system. Soft Matter. 2005;1:23-27. [9] Chen CH, Abate AR, Lee, D, Terentjev EM, Weitz, DA. Microfluidic Assembly of Magnetic Hydrogel Particles with
Uniformly Anisotropic Structure. Adv Mater. 2009; 21: 3201-3204. [10] Guzowski J, Korczyk PM, Jakiela S, Garstecki P. The structure and stability of multiple micro-droplets. Soft Matter. 2012; 8:
7269-7278. [11] Hasinovic H, Friberg SE, Rong G. A one-step process to a Janus emulsion. J Colloid Interface Sci. 2011; 354: 424-426. [12] Adams LLA, Kodger TE, Kim SH, Shum HC, Franke T, Weitz DA. Single step emulsification for the generation of multi-
component double emulsions. Soft Matter. 2012; 8: 10719-10724. [13] Pannacci N, Bruus H, Bartolo D, Etchart I, Lockhart T, Hennequin Y, et al. Equilibrium and Nonequilibrium States in
Microfluidic Double Emulsions. Phys Rev Lett. 2008; 101: 164502. [14] Neeson MJ, Tabor RF, Grieser F, Dagastine RR, Chan DYC. Compound sessile drops. Soft Matter. 2012; 8: 11042-11050. [15] Friberg SE. Selective emulsion inversion in an equilibrium Janus drop. 1. Unlimited space. J Colloid Interface Sci. 2014; 416:
167-171. [16] Müller H. Die Theorie der Koagulation polydisperser Systeme. Kolloid-Z. 1926; 38: 1-2. [17] Overbeek JThG. Kinetics of flocculation. In: Kruyt HR, editor. Colloid Science vol. II. Amsterdam NL: Elsevier; 1952. p 297. [18] Hasinovic H, Boggs C, Friberg SE, Kovach I, Koetz J. Janus Emulsions from a One-Step Process; Optical Microscopy Images.
J Dispersion Sci Technol. 2014; 35:613-618.
Microscopy: advances in scientific research and education (A. Méndez-Vilas, Ed.)__________________________________________________________________
© FORMATEX 20141042


![Near-Field Optical Microscopy - Indico [Home]indico.ictp.it/event/a04179/session/16/contribution/11/material/0/0.pdf · Optical microscopy Electron microscopy' Near-field optical](https://static.fdocuments.us/doc/165x107/5ed73d31d37f9f58ca6a86bf/near-field-optical-microscopy-indico-home-optical-microscopy-electron-microscopy.jpg)


