Optical Imaging of Neural Structure and Physiology ...smirono/WahlFach/ImagingBookSlice.pdf ·...
28
3 Optical Imaging of Neural Structure and Physiology: Confocal Fluorescence Microscopy in Live Brain Slices Michael E. Dailey Department of Biological Sciences, University of Iowa, Iowa City, Iowa 52242 anatomical and physiological substrates. This necessitates a mapping of the organization and interconnection of popula- tions of neurons, but must also include an intimate under- standing of the physiological workings of the individual neural elements, both neurons and glia, since neural function ultimately depends on the organization of synaptic connec- tions at the cellular and subcellular levels (Shepherd, 1998). A major goal in neurobiology is to provide a detailed map of the anatomical connections between individual neurons and groups of neurons. This should include not only a “wiring diagram” of connections within and between brain regions, but also a qualitative and quantitative description of the subcellular distribution of synaptic contacts. Such a map certainly would prove useful for understanding neural cir- cuitry at a network level. But even an exhaustive map of neuronal synaptic connectivity is not sufficient for figuring out how the anatomy subserves neural function. Information about the physiological properties of the synaptic contacts (e.g., strength, sign, and number) and their consequences for neuronal targets is also needed. 49 I. Introduction II. Live Brain Slice Preparation and Culture III. Labeling Neuronal and Glial Cells in Brain Tissue Slices IV. Imaging Methodology V. Application: Mapping Neural Structure and Physiology in Developing Brain Slices VI. Conclusions and Future Prospects References ▼ ▼ Copyright © 2002 by Elsevier Science (USA) I. Introduction A. Mapping Neural Organization at the Cellular and Synaptic Levels Understanding brain function, both in the normal and in the diseased state, requires a thorough knowledge of the
-
Upload
trankhuong -
Category
Documents
-
view
215 -
download
0
Transcript of Optical Imaging of Neural Structure and Physiology ...smirono/WahlFach/ImagingBookSlice.pdf ·...
▼ ▼
3
Optical Imaging of NeuralStructure and Physiology:
Confocal Fluorescence Microscopy in Live Brain Slices
Michael E. Dailey
Department of Biological Sciences, University of Iowa, Iowa City, Iowa 52242
anatomical and physiological substrates. This necessitates amapping of the organization and interconnection of popula-tions of neurons, but must also include an intimate under-standing of the physiological workings of the individualneural elements, both neurons and glia, since neural functionultimately depends on the organization of synaptic connec-tions at the cellular and subcellular levels (Shepherd, 1998).
A major goal in neurobiology is to provide a detailed mapof the anatomical connections between individual neuronsand groups of neurons. This should include not only a“wiring diagram” of connections within and between brainregions, but also a qualitative and quantitative description ofthe subcellular distribution of synaptic contacts. Such a mapcertainly would prove useful for understanding neural cir-cuitry at a network level. But even an exhaustive map ofneuronal synaptic connectivity is not sufficient for figuringout how the anatomy subserves neural function. Informationabout the physiological properties of the synaptic contacts(e.g., strength, sign, and number) and their consequences forneuronal targets is also needed.
49
I. Introduction
II. Live Brain Slice Preparation and Culture
III. Labeling Neuronal and Glial Cells in BrainTissue Slices
IV. Imaging Methodology
V. Application: Mapping Neural Structure andPhysiology in Developing Brain Slices
VI. Conclusions and Future Prospects
References▼ ▼
Brain Mapping: The Methods, 2nd editionCopyright © 2002 by Elsevier Science (USA)
All rights reserved.
I. Introduction
A. Mapping Neural Organization at theCellular and Synaptic Levels
Understanding brain function, both in the normal and inthe diseased state, requires a thorough knowledge of the
BM2e-03(47-76) 24.05.02 16:16 Page 49

Even from an anatomical standpoint, a single static mapof connections may not accurately reflect neural connectiv-ity, especially during development and in diseased states inwhich physical connections may be changing. Such phe-nomena fall into the realm of modifiability, or plasticity, andthere is now a major effort to understand how structuralplasticity may subserve functional plasticity in the develop-ing, adult, and diseased brain. Neural organization can thusbe considered to be in a dynamic state, especially at thesubcellular level, and we are in essence challenged withmapping an actively changing terrain! Such considerationshighlight a need for time-resolved microanatomy as well asa conjoining of anatomical and physiological observationsat the network, cellular, and subcellular levels.
Given that neural organization is in a dynamic state, it isimportant not only to generate a functional map of the brain,but also to elucidate the principles and mechanisms govern-ing the development and plasticity of neural organization. It is anticipated that principles of neural organization will be elucidated by studying the process of construction ofnetwork connections during ontogeny. However, spatiotem-poral changes in neural organization are at their highestduring development, presenting developmental brain carto-graphers with a most challenging task.
B. The Problem: Cellular Diversity andComplexity of Neural Tissues
A major obstacle to mapping the anatomical substrates ofneural function is the complexity of neural organization.Axonal and dendritic processes of neurons have very elabo-rate shapes, and each cell type, by definition, has uniquemorphological and physiological characteristics. Moreover,even within a rather homogeneous population of cells, itseems likely that no two cells have exactly the same mor-phology and pattern of connectivity. In the central nervoussystem (CNS), axonal processes often take complex paths toreach target regions and, once there, can ramify profusely.Axonal branches can also innervate multiple target regions.Likewise, dendritic branches are typically highly branchedand can be recipient to tens of thousands of axonal synapticcontacts.
Over the past century, neuroanatomists have madetremendous strides toward mapping basic neuronal structureand connectivity, largely due to the extensive application ofthe Golgi technique (e.g., Ramón y Cajal, 1911). The Golgistain generates a dense reaction product within most or all of the intracellular volume of individual neurons, and sinceit labels only a small percentage of cells in any given tissuevolume, it provides a good method for examining thecomplex structure of individual neurons at the light micro-scope level. However, the Golgi technique is limited byunpredictable staining patterns such that the neuroanatomisthas little control over the number and type of cells labeled.
Furthermore, it is applicable only to postmortem tissue andis therefore of limited value for studies of a physiologicnature.
With the advent of techniques for injecting cells with atracer dye while making electrophysiological recordings, itbecame possible to determine in detail the anatomical fea-tures of neurons following physiological characterization.This was an important step in efforts to correlate cellularphysiology and morphology in brain tissue. Moreover, neu-ronal tracers such as horseradish peroxidase (HRP) affordthe collection of three-dimensional (3D) information on thestructure of neurons at both the light and the electron micro-scope (EM) level (e.g., Deitch et al., 1991). HRP can beinjected into tissue to label individual neurons or popula-tions of neurons, but it is visible in the light microscope onlyafter fixation and enzymatic reaction. Consequently, it is nota useful marker for assessing the structure of live cells.Fluorescent tracer dyes such as Lucifer yellow (LY), on theother hand, permit light and electron microscopic observa-tions and, by virtue of their fluorescence, are visible in livingcells. In the case of LY, staining for EM is accomplished byHRP immunohistochemistry using antibodies against the LY(Taghert et al., 1982; Holt, 1989). A number of studies haveused LY microinjection in conjunction with confocalimaging to examine the 3D structure of neurons in bothliving (Smith et al., 1991, 1994; Turner et al., 1991, 1993,1994) and fixed (Belichenko et al., 1992, 1994a,b;Belichenko and Dahlström, 1994a,b, 1995a,b; Trommald etal., 1995) brain tissues. However, two major drawbacks tousing LY are that it requires the tedious process of micro-injection into single cells and, for EM-level analysis, thecytoplasm of the labeled cell is obliterated by the immuno-histochemical reaction. Moreover, these methods of labelingdo not directly reveal synaptic contacts and they have notbeen shown to be useful for directly imaging changes incellular structure over time.
C. One Solution: Vital Fluorescent Labelingand 3D Confocal Imaging in Brain Slices
Much can be learned about the functional organization ofthe brain by correlating single-cell physiological analyseswith static images of cellular morphology. However, func-tional mapping dictates that we integrate the structural andphysiological features of individual cells into the largercontext of tissue organization. This can be facilitated bysimultaneously viewing the functional interrelationships andinteractions of many cells within organized networks. Livebrain slice preparations provide an outstanding opportunityto assess the dynamic structural and physiological featuresof cells, at high spatial resolution, within complex three-dimensional tissue environments.
In the past, it has been necessary to “reconstruct” neuralstructures and cellular relationships from the microscopic
50 II Surface-Based Data Acquisition
BM2e-03(47-76) 24.05.02 16:16 Page 50

examination of several adjacent, relatively thin tissue sec-tions. This is because conventional (both light and electron)microscopic techniques did not provide sufficiently highspatial resolution of cellular and subcellular structures inthick tissue specimens. Although it is still necessary in mostcases to section whole brain for microscopic examination,the development and application of modern confocalmicroscopy (White et al., 1987; Fine et al., 1988; Lichtman,1994; Dailey et al., 1999) and, more recently, multiphotonmicroscopy (Denk et al., 1990, 1994) have provided ameans to examine structures at high spatial resolution inmuch thicker (>100 µm) tissue slices. The advantagesafforded by confocal microscopy are derived from its abilityto collect optical sections of a thick tissue specimen whilerejecting light from out-of-focus components of the speci-men (Wilson, 1990; Pawley, 1995). These features havemade confocal imaging an indispensable tool for analysis ofneural organization at the subcellular, cellular, and tissuelevels of organization (Turner et al., 1996). Indeed, the con-focal microscope was initially conceived and developedwith the goal of elucidating the neural organization of thebrain (Minsky, 1961, 1988).
The successful application of modern optical techniquesto elucidate neural organization has depended on the avail-ability of suitable markers of cellular structure and physiol-ogy. Among the most widely used markers are the vitalfluorescent membrane dyes for labeling cell surfaces and thefluorescent Ca2+ indicator dyes. More recently, it has beenpossible to express fluorescent proteins or fusion proteins inneurons and glia in order to visualize specific cellular struc-tures such as synapses. This chapter discusses the use ofthese fluorescent probes and molecular markers in conjunc-tion with high-resolution optical imaging with the confocalmicroscope to examine the dynamic anatomy and physio-logy of live brain tissues. It concentrates on the applicationof these methods to study neural organization at a cellularand subcellular level in tissue slices from developingrodents. However, several of these methods are more widelyapplicable to studies of normal and diseased adult braintissues, both pre- and postmortem, as studies from othergroups have shown (see references for a sample).
II. Live Brain Slice Preparation and Culture
Live brain slice preparations have been used extensivelyto study fundamental physiological properties of neuronsand local neural circuits using both electrophysiological and optical approaches and, more recently, for examiningdynamic morphological features of neurons and glia. Theprimary advantages of tissue slice preparations are theirgreater optical and physiological accessibility over in vivoconditions (Pozzo-Miller et al., 1993) and the maintenance
of structural and functional integrity of intrinsic synapticconnections vis-à-vis dissociated cell culture preparations.The major disadvantages are: (1) possible structural andphysiological alterations (damage) to the tissues as a conse-quence of the isolation procedure; (2) loss of extrinsic neu-ronal connections such that the isolated tissues cease toexhibit normal functionality (i.e., the tissues are no longerintegrated in the larger scheme of brain function); and (3) afinite period of time before tissue rundown (generally, amaximum of several hours). These drawbacks notwithstand-ing, the significant advantage that in vitro brain slice pre-parations hold for optical accessibility has driven thedevelopment of slice imaging methodology. Consequently,progress on the development of sensitive fluorescent-lightmicroscopy, new fluorescent probes of cellular anatomy andphysiology, and inexpensive computing capabilities has pro-vided a powerful set of tools for investigating the organiza-tion and function of neural tissues. Moreover, good methodsare now available for maintaining healthy, live brain slicesin vitro for long periods of time. This section describesmethods currently used for preparing, maintaining, labeling,and imaging live slices of developing rodent brain.
Isolated tissues derived from immature animals generallyfare much better than adult tissues. In the case of the rathippocampus, tissues taken from animals older than about 1 week of age generally do not remain healthy for longerthan a few hours in vitro. It seems likely that this limitationis due, in part, to a developmental shift from anaerobic- toaerobic-based tissue metabolism. Moreover, developingbrain tissues seem to suffer less stress under the hypoxic andhypoglycemic conditions that may occur during the tissueisolation procedures. Indeed, if brain tissues are isolatedfrom developing animals, they can be maintained in vitro forlong periods of time (weeks to months), extending wellbeyond the corresponding time point from which tissues canbe maintained ex vivo when taken from older (>P7) animals.Consequently, many studies of live mammalian brain tissueshave employed slice cultures derived from immature brain(see Gähwiler et al., 1997).
There are two common methods for maintaining brainslices in vitro (Gähwiler et al., 1997). One method is basedon the so-called “roller tube” culture technique of Gähwiler(1984; Gähwiler et al., 1991). This technique provides a con-venient way of mounting tissue slices on glass coverslips forlabeling, long-term culturing, and optical imaging. Anotherslice culture method (Stoppini et al., 1991) in which slicesare grown on porous filter membranes also has proven to bevery suitable for long-term culture. Both culture methods(Fig. 1) involve rapidly removing the tissues of interest, thenslicing the tissues with a tissue chopper (Stoelting, Chicago,IL) or a Vibratome at a thickness of 300 to 500 µm. In thecase of roller tube cultures, the brain slices are then securedto alcohol-cleaned glass coverslips (11 × 22 mm) with amixture of chicken plasma (10 µl; Cocalico) and bovine
3 Optical Imaging of Neural Structure and Physiology 51
BM2e-03(47-76) 24.05.02 16:16 Page 51

thrombin (10 µl; Sigma, St. Louis, MO). Tissues are adher-ent within about 10 min, at which point the coverslips areplaced in a test tube with 1 ml of Hepes-buffered culturemedium containing 25% serum. The tubes are kept in a warmroom (36°C) and are rotated at 12 rph in a roller drum tiltedat 5° with respect to horizontal. This roller tube method pro-vides constant gentle rolling to aerate the tissue slices, andviable slices with an organotypic tissue organization can bemaintained in vitro for up to several weeks. However, theslices thin appreciably over time (down to about 100 µmthick within 1–2 weeks in vitro), and there can be a signi-ficant proliferation of glial cells (Dailey and Waite, 1999).The roller tube cultures are especially useful for high-resolu-tion microscopy since the slices are adherent to—and can
be viewed through—a stable glass coverslip (Terasaki andDailey, 1995; Dailey, 1999).
Slice cultures grown on filter membranes (Stoppini et al.,1991) provide a means for short- or long-term culturing ofbrain tissues without the need to physically rotate the tissuesor attach them to coverglasses. Tissue slices are prepared asdescribed above, then placed on cell culture inserts (Falcon3090 or 3102) containing polyethylene terephthalate, track-etched porous membranes (1 µm pore size). The inserts areplaced in six-well tissue culture plates, and culture medium(1 ml containing 50% MEM, 25% Hanks’ balanced saltsolution, 25% horse serum, 2 mM glutamine, and 0.044%NaHCO3) is added to each well. The filter cultures are main-tained in an incubator containing warmed (36°C), humidi-fied air (5% CO2). Translucent culture inserts are used tofacilitate periodic inspection of the cultured tissues under adissecting microscope.
Each tissue slice culture technique has its advantages anddisadvantages. In terms of culture preparation, the filter cul-tures require less effort because there is no need for lengthyprocessing of coverslips. Moreover, once the slices are situ-ated on the membranes, the tissues can be placed immedi-ately into the incubator without concern for whether theslices are firmly attached to the culture substratum. Someinvestigators report that tissues cultured by the filter mem-brane technique show reduced gliosis in comparison to thosecultured by the roller tube technique (del Rio et al., 1991),suggesting that long-term cultured brain tissues may farebetter on membranes. On the other hand, the roller tube cul-tures are more easily mounted for microscopic viewing,since the slices are securely attached directly to a piece ofglass that can serve as the microscope coverslip (Terasakiand Dailey, 1995). For live tissue imaging, a more compli-cated scheme is required for mounting tissues in a way thatpermits on-stage perfusion of solutions (Dailey, 1999).
III. Labeling Neuronal and Glial Cells in Brain Tissue Slices
A. Visualizing Neural Structure withFluorescent Membrane Dyes
To examine the structure of neurons in tissue slices, wehave used a family of long carbon-chain, carbocyanine dyes(see Table 1), which incorporate into and diffuse laterallywithin plasma membranes of neurons (Honig and Hume,1986; Honig, 1993) and other cells that come into contactwith the dye. The rapid and complete surface labeling isespecially useful for determining the morphology of cellssuch as neurons that have very long and elaborate branchingprocesses. Consequently, membrane dyes have found wide-spread use as markers of axonal projections (Baker andReese, 1993).
52 II Surface-Based Data Acquisition
Figure 1 Preparation of brain tissue slices and slice cultures. Livetissues are isolated from neonatal rat and are sliced at a thickness of300–400 µm using a manual tissue chopper. Tissue slices may be culturedby one of two methods (Gähwiler et al., 1997): roller tube (left column) orfilter membranes (right column). In the roller tube method, tissue slices aresecured to rectangular glass coverslips using a plasma/thrombin clot.Coverslips with attached slices are inserted into culture tubes with 1 ml ofHepes-buffered growth medium, and culture tubes are placed in a rollerdrum and rotated at 12 rph to aerate the tissue. In the filter membranemethod (Stoppini et al., 1991), slices are placed on porous filter membraneinserts in six-well plates and cultured in bicarbonate-buffered growthmedium in a CO2 incubator. In both instances, cultures are maintained at36°C, and growth media are exchanged two or three times a week.
BM2e-03(47-76) 24.05.02 16:16 Page 52

A useful property of these membrane dyes is that theycan label cells in both living and formaldehyde-fixed tissues.This is because formaldehyde fixation does not extensivelycross-link lipids, so that fluorescent lipids can intercalateinto the surface membrane and diffuse freely within theplane of the membrane. However, a form of DiI that isformaldehyde fixable is also available (Molecular Probes,Eugene, OR; Catalog No. D7000).
The diffusion rate of the most commonly used fluores-cent lipid, DiI, is reported to be 6 mm per day in living tissue(Product Sheet MP282; Molecular Probes). In live brainslices, adequate levels of staining can be achieved in neu-ronal processes over 1 mm away from the labeling sitewithin a few hours. We have successfully imaged both DiI-and DiO-labeled axons for several hours, but some workershave suggested that live cells labeled with DiO remainsomewhat healthier during imaging than those stained withDiI. Perhaps this is because DiI may stain living cells morestrongly than DiO (MP282; Molecular Probes).
Often it is most useful to label only a small percentage ofthe total number of cells within a tissue volume becauseeven the best optical microscopes are unable to resolve thedetails of fine axonal and dendritic processes when all thetissue elements are stained with the same dye. In certaincases it is desirable to label a select subset of cells. Forneural tissue, labeling a select population of cells can oftenbe accomplished simply by varying the location of the dye application. Cell bodies of projection neurons can beback-labeled by injecting a tracer into target regions.Alternatively, axonal projections can be labeled by applyingdye to the region of cell bodies, to dendrites, or along knownaxonal tracts. However, we have found that surface labelingwith the membrane dyes (e.g., DiO) seems to be moreefficient in the anterograde versus the retrograde directionalong axons in living tissue (Dailey and Smith, 1993). Thismay be related to axonal transport or membrane traffickingpatterns in neurons.
We have used several different methods for introducingmembrane dyes into tissue slices. One approach involvespressure injection of a solution of dye. A stock solution(~0.5%) of dye is made in N,N-dimethylformamide,dimethyl sulfoxide, or vegetable oil and is injected througha glass micropipette (2–3 µm tip diameter) using aPicospritzer (General Valve). Small, localized injections canbe made by presenting a series of brief pressure pulses (1 msduration, 80 psi) to the back of the pipette.
Another membrane dye-labeling method works very wellwith relatively thin (50–100 µm) tissue slices, such as thosecarried as roller tube cultures for longer than 1 week. Tolabel cells, the tip of a glass pipette is dipped into a saturatedsolution of DiI in ethanol, then inserted, and either removedafter a time or broken off within the tissue. The dye solutiondries onto the surface of the pipette, leaving a coating of dyecrystals that contacts and labels cell membranes wheninserted into the tissue. This method seems to produce label-ing of fewer but more brightly stained cells with less granu-lar background labeling of neighboring cells. Both theinjection and the crystal insertion labeling protocols, whenapplied to roller tube cultures, benefit from the fact that theplasma clot holds the tissue slice in place during the label-ing procedure.
There has been considerable interest in fluorescentmarkers whose excitation and emission spectra are in the redor near infrared. Although one potential drawback of thelonger wavelength red light (vis-à-vis blue or green light) isthat the spatial resolution is reduced somewhat, it isexpected that optical imaging in tissues will be improvedwith red dyes because: (1) there is less background auto-fluorescence from tissues at the longer wavelengths; (2) bio-logical tissues should diffract red light less, therebyimproving the collection of light for image formation; and(3) the red light is of lower energy than UV, blue, and greenlight and therefore should produce less photodynamicdamage (see later). There may not always be a dye available
3 Optical Imaging of Neural Structure and Physiology 53
Table 1 Common Fluorescent Membrane Dyes for Assessing Neuronal Structure and Mapping Axonal Projectionsa
Name Abbreviation Absmaxb(λ) EMmax
c(λ) Reference
DiIC18(3) DiI 550 nm 565 nm Honig and Hume (1986)
DiI∆9,12 C18(3) Fast DiI 549 nm 563 nm
DiOC18(3) DiO 484 nm 501 nm Honig and Hume (1986)
DiIC18(5) DiD 644 nm 663 nm Agmon et al. (1995)
4-Di-16-ASP DiA 491 nm 613 nm Mendelowitz et al. (1992)
aThese dyes are available from Molecular Probes, Inc. (Eugene, OR). Data are from Molecular Probes’ catalog andinformation sheets.
bAbsorption maximum.cEmission maximum.
BM2e-03(47-76) 24.05.02 16:16 Page 53

with suitable spectra, but in the case of the long-carbon-tailfluorescent membrane dyes, there is a longer-wavelengthversion of DiI, known as DiD, which has a five-carbonlinking bridge (see Table 1). The excitation/emissionmaxima of DiD are 644/663 nm (in methanol), compared to550/565 nm for the three-carbon bridge of the classic DiI(MP282; Molecular Probes). Thus, laser lines from theargon–krypton (647 nm) or helium–neon (633 nm) laserscan be used to excite DiD. A study by Agmon et al. (1995)indicated that DiD is, in fact, superior to DiI for examiningaxonal projections in brain slices by confocal microscopy.
A new and potentially powerful approach to obtainGolgi-like labeling of neuronal and glial cells with fluores-cent lipids has been described (Gan et al., 2000). This tech-nique, referred to as “DiOlistics,” is a modification of abiolistics approach to gene transfection (see later; Lo et al.,1994). Tiny gold or tungsten particles (0.4–1.7 µm) coatedwith one or more fluorescent lipid dyes (such as DiO, DiI, orDiD) are propelled into brain tissues using a “gene gun”(Bio-Rad, Hercules, CA). Cells whose surfaces are con-tacted by dye-coated particles become labeled. In the case ofneurons, the entire axonal and dendritic arbors, includingsynaptic spines, are labeled. The DiOlistics approach worksin both live and paraformaldehyde-fixed brain tissues,including postmortem tissues derived from human brain(Gan et al., 2000). In live tissues, cell labeling is very rapid,with complete labeling of complex dendritic arbors report-edly occurring within 5 min (apparent diffusion coefficient107 cm2/s). Labeling is severalfold slower in fixed tissues,consistent with many previous studies utilizing fluorescentlipophilic dyes. The number of labeled cells can be variedby altering parameters such as the density of particles in the“bullets,” the pressure and distance at which the tissues areshot, and the number of shots fired at the tissues. Using par-ticles coated with different combinations of various dyeswith different fluorescent spectra, it is possible to label anddistinguish many neurons within a small tissue region. Forexample, using combinations of three different lipophilicdyes, Gan et al. (2000) could distinguish individual cellslabeled in one of seven different spectral patterns. Usingthree-dimensional multichannel confocal fluorescenceimaging (see later), it is possible to identify processes fromsingle cells even in densely labeled portions of complexbrain tissues. This multicolor labeling methodology thusoffers a new approach to mapping the complex organizationand relationship of neuronal and glial cells in brain tissues.
Finally, it should be noted that fluorescent lipophilic dyesare useful for morphological studies of neural tissue at boththe light and the electron microscope level. This is becausethe fluorescence emission can convert (i.e., photoconvert)diaminobenzidine (DAB) to an oxidized, electron-densereaction product that is deposited locally near the fluorophore(Sandell and Masland, 1988). Thus, in the case of membranedyes that label the plasmalemma, one can produce a nice
outline of the cell surface that preserves the intracellularstructure of labeled cells. This method could prove to be veryuseful for determining the ultrastructural characteristics,including the synaptic connectivity, of specific populations ofneurons that have been selectively labeled with a fluorescentdye (e.g., von Bartheld et al., 1990; Gan et al., 1999).Moreover, because membrane dyes can be used as vitalstains, it is now possible to observe cells in the living statewith the light microscope and, subsequently, to examine thevery same cells in the electron microscope. This should facil-itate studies of neuronal structure and connectivity.
B. Immunofluorescent Labeling
Antibodies provide a very powerful means for labelingspecific populations of cells and subcellular structures inneural tissues, although their use is usually limited to fixedspecimens. Sometimes it is desirable to assess the 3D organ-ization of immunostained structures, and optical imaging ofimmunolabeled thick brain slices provides a relatively con-venient means for doing this, so long as the antibodies areable to penetrate the tissues adequately and clear optical sec-tions of sufficient resolution can be collected. Immunohisto-chemical staining of thick brain slices has been shown to befeasible, and confocal microscopy affords collection of the3D immunofluorescence data with high spatial resolution(e.g., Vincent et al., 1991; Welsh et al., 1991).
As an example, we have used antibodies against synapticproteins in acutely isolated and in cultured brain slices(Dailey et al., 1994; Qin et al., 2001). One such antibody,generated against the protein synapsin-I (syn-I), has beenshown to be specific to nerve terminals (DeCamilli et al.,1983a,b) where it is associated with small synaptic vesicles(Navone et al., 1984). Immunostaining of hippocampalslices (100–400 µm thick) with syn-I antiserum is per-formed after light fixation (2% formaldehyde for 10 min)and a rigorous extraction process (1% Triton X-100 for 24 to72 h) (Dailey et al., 1994). Penetration of the rather largeantibody proteins into the thick tissues appears to be a majorlimitation. Therefore, we (1) perform the membrane perme-abilization step on a rotating stage to provide constantmechanical agitation (~100 rpm) and (2) lengthen theprimary and secondary antibody incubation times to severalhours or overnight (4°C). This staining procedure provides asufficient immunofluorescent signal to image small synapticstructures as much as 50 to 100 µm deep into a brain slice.The availability of a wide spectrum of fluorescent probes aswell as confocal imaging systems with multiple laser linespermits double- and triple-label immunohistochemicalanalyses of brain tissues (Sergent, 1994; Wouterlood et al.,1998). As indicated earlier, the use of longer wavelengthfluorophores, such as Cy5 (650/667 nm) (AmershamPharmacia Biotech, Inc., Piscataway, NJ) or members of theAlexa Fluor series [Alexa Fluor-633 (632/647 nm), Alexa
54 II Surface-Based Data Acquisition
BM2e-03(47-76) 24.05.02 16:16 Page 54
Fluor-647 (650/668 nm), or Alexa Fluor-660 (663/690 nm),from Molecular Probes], may improve the detectablefluorescence signal from deeper portions of the specimen.
Immunohistochemical staining also may be combinedwith staining by fluorescent membrane dyes (Elberger andHonig, 1990). These methods even permit immunohisto-chemistry in combination with time-lapse observations oflive cells in brain slices. For example, O’Rourke et al.(1992) followed DiI-labeled migrating neuroblasts in slicesof developing cerebral cortex by time-lapse confocalmicroscopy and then fixed the slices and immunohisto-chemically stained the tissues with an antiserum to revealradial glial fibers. They first photoconverted the DiI to per-manently mark the labeled cells with a stable, electron-dense DAB reaction product and then permeabilized thetissues for antibody staining.
C. Gene Transfection and Expression of Fluorescent Proteins
We have seen that fluorescent membrane dyes provide ameans for assessing gross cellular morphology and thatimmunohistochemical methods afford more specific label-ing of synaptic structures in fixed preparations. However,the complexity of neural tissues often makes it difficult tomap the organization of synaptic structures in relation to cel-lular structure. One promising approach is to use moleculargenetic tools to label synaptic structures within individualcells or defined populations of cells. The exploitation of ajellyfish green fluorescent protein (GFP) as a reporter ofgene expression (Chalfie et al., 1994), and more recently asa marker of protein distribution in cells, has opened thepossibility of visualizing specific cell populations and cellu-lar structures in both living and fixed brain tissues. Indeed,GFP and related fluorescent proteins (Tsien, 1998; Tsien andPrasher, 1998) are increasingly being used to mark neuronsand glia in brain tissues (e.g., Lo et al., 1994; Moriyoshi et al., 1996; Zhuo et al., 1997; Vasquez et al., 1998; van denPol and Ghosh, 1998; Chamberlin et al., 1998.)
GFP expression in neurons and glia can be used in avariety of ways to facilitate mapping of brain anatomy andmicrostructure. Expression of soluble GFP fills the entireextent of neurons and glia, and this can be used to definecellular anatomy. Modification of the GFP to target itspecifically to the plasma membrane (Moriyoshi et al.,1996; Tamamaki et al., 2000) may facilitate lateral move-ment in long processes and thus provide even better resultsfor anatomical studies in neurons. Under control of cell-type- or region-specific regulatory genes, GFP can be usedas a reporter system to label specific neuronal or glial cellpopulations (e.g., Zhuo et al., 1997; Oliva et al., 2000;Spergel et al., 2001). Alternatively, GFP may be fused toproteins of interest containing specific cellular targetingsequences. For example, GFP fused to a synaptic protein
results in specific labeling of pre- or postsynaptic structuresin transfected neurons (e.g., Arnold and Clapham, 1999;Ahmari et al., 2000). This offers the exciting possibility ofmapping specific synaptic structures at the single-cell levelwithin brain tissues.
A variety of approaches have been used to introduceforeign genes such as GFP and GFP-fusion proteins into cellsand tissue slices in vitro. These include viral constructs forinfection (Vasquez et al., 1998) as well as nonviral transfec-tion methodologies such as particle-mediated biolistics (Loet al., 1994), liposome-mediated transfection (Murphy andMesser, 2001), and single-cell electroporation (Haas et al., 2001). For transfection experiments in brain slices(Marrs et al., 2001; Qin et al., 2001), we utilize the biolisticsapproach (Fig. 2) based on the methods of Lo et al. (1994).A Helios gene gun (Bio-Rad) is used following the manufac-turer’s instructions. Colloidal gold particles (1 µm diameter,8 mg) are combined with 0.05 M spermidine (100 µl;Sigma), 1 M CaCl2 (100 µl), and DNA (15–20 µg).Hippocampal slices are shot (2–3 mm, 70–80 psi) between 5and 10 days in culture and then quickly returned to the incu-bator. Slices are fixed (4% formaldehyde in culture medium,10 min, 4°C) 1–2 days later. In some cases, antibody stainingis performed on tissues following fixation.
D. Ca2+-Sensitive Fluorescent Probes forStudying Neuronal and Glial Physiology
There are now numerous probes for addressing questionsof cellular physiology (Mason, 1993; Yuste et al., 1999a).These include both fluorescent and nonfluorescent probes ofintracellular calcium, magnesium, protons, sodium, zinc, andseveral other physiologically important molecules. Some ofthese probes are ratiometric and provide estimates of absoluteconcentrations of the molecular species of interest.
The use of voltage-sensitive dyes has played an impor-tant role in mapping patterns of neural activity and in theorganization of synaptic connections in isolated tissue slices(e.g., Grinvald et al., 1988). However, fluorescent calcium-sensitive dyes (e.g., fura-2 and fluo-3) (Grynkiewicz et al.,1985; Minta et al., 1989) have been used more widely tostudy the physiological properties of neural and glial cells aswell as the physiological organization of developing andmature nervous system tissues. The fluorescent calciumprobes are especially useful because large changes in intra-cellular calcium are associated with neural electrical activity(Ross, 1989), and it is clear that intracellular calcium is animportant second messenger associated with a wide varietyof neuronal functions (Kennedy, 1989; Ghosh andGreenberg, 1995). An early study by Yuste et al. (1992)showed the power of Ca2+ imaging in isolated brain tissueslices for determining features of cellular communication inthe developing cerebral cortex. Several studies since haveutilized Ca2+ imaging in semi-intact brain tissues to study
3 Optical Imaging of Neural Structure and Physiology 55
BM2e-03(47-76) 24.05.02 16:16 Page 55

the development and organization of neural circuits in brain(Dailey and Smith, 1994; Guerineau et al., 1998) and retina(Wong et al., 1998).
In addition to neurons, astrocytes (Cornell-Bell et al.,1990; Dani et al., 1992) and other glial cells (Jahromi et al.,1992; Reist and Smith, 1992; Lev-Ram and Ellisman, 1995)in the nervous system also exhibit sizable intracellularfluctuations in calcium. Moreover, it is well documentedthat a variety of stimuli can induce waves of calcium activ-
ity within glial cell networks. Such trans-glial calciumsignals have been proposed to have important roles in long-range cellular signaling within the brain (Charles et al.,1991; Cornell-Bell and Finkbeiner, 1991; Smith, 1994;Charles, 1998). Thus, in generating a “map” of functionalnetworks within the brain, it will be important to considerthe organization of both neuronal and nonneuronal tissuecomponents.
There are a variety of ways of introducing the physiolo-gical probes into neural tissue slices. Perhaps the most reli-able is by direct intracellular injection. Microinjectionallows one to select individual cells of interest as well ascontrol the concentration of the intracellular dye. Thisapproach has been used successfully to image intracellularcalcium at high spatial and temporal resolution within neu-ronal cell bodies and processes as small as individual den-dritic spines (Tank et al., 1988; Müller and Connor, 1991;Guthrie et al., 1991; Svoboda et al., 1996; Yuste et al.,1999b). However, one may want to label a population ofidentified neurons, or specific axonal projections and synap-tic terminals, rather than single isolated cells. This can beachieved by localized superfusion (Regehr and Tank, 1991)or injection (O’Donovan et al., 1993) of dyes into axonaltracts, leading to uptake and anterograde and retrogradetransport of the dye. Such an approach is useful so long asthe axons are bundled or spatially confined and the dye canbe applied close to the site of interest since labeling islimited by intracellular diffusion.
Bulk loading of cells using membrane-permeant dyesprovides less specific, more widespread labeling ofneurons and glia in tissue slices. This approach makes useof dyes with acetoxymethyl (AM) groups linked tofluorophores by ester bonds. The AM–ester form of the dyeis membrane permeant until the ester bonds are cleaved byendogenous esterases within the cells (Tsien, 1981). Oncethe ester bonds are cleaved, the dye molecule is trappedwithin the cell where it becomes a useful indicator ofcellular physiology.
With regard to staining brain tissue, AM–ester loadingworks better on slices from embryonic tissues or in slicesthat have been maintained in culture for a period of time. Forexample, suitable fluo-3 AM loading of acutely prepared(<8-h-old) CNS tissue slices is difficult to achieve, but slicescultured for a week or two stain robustly. In fact, somesuccess is achieved even after 12 to 24 h in vitro (Dailey andSmith, 1994). It is unclear why staining is enhanced in thecultured slices, but one possibility is that the tissue “loosensup” somewhat. Others have also found extreme difficultystaining acute CNS tissue slices with AM–ester dyes whenthe tissue was taken from rats older than 10 days of age(Kudo et al., 1989; Yuste and Katz, 1991; O’Donovan et al.,1993). Adams et al. (1994) suggested that the penetration ofAM ester dyes into thick brain slices may be facilitated bycleaving some ester bonds prior to labeling.
56 II Surface-Based Data Acquisition
Figure 2 Fluorescent labeling of neurons and glia in brain tissues bygene gun-mediated particle bombardment (biolistics). Tiny (0.4–1.7 µm)gold or tungsten particles are coated either with fluorescent lipophilic dyes(e.g., DiI, DiO) or with plasmid DNA encoding GFP or GFP-fusion pro-teins. Particles carrying fluorescent dye or DNA are propelled into tissuesusing a blast of helium. In the case of dye labeling (“DiOlistics”; Gan et al.,2000), cells are labeled when contacted by dye-coated particles. Labelingof axonal and dendritic arbors is very rapid (~5 min) in live tissues due tothe diffusion of the lipophilic dye within the plane of the plasma membrane.Both living and fixed tissue preparations are amenable to DiOlistics label-ing. Particles carrying various combinations of fluorescent dyes can be usedto differentially label individual cells within tissues. For gene transfection(Lo et al., 1994), particles bearing DNA must penetrate the cell and cometo reside within or near the cell nucleus. Gene expression for 12 to 48 h isusually necessary to produce sufficient fluorescent signal. Particles bearingdifferent plasmids [e.g., encoding green (GFP) or red (DsRed) fluorescentproteins] can be used to differentially label cells. A transmitted light (dif-ferential interference contrast, DIC) image and fluorescence image (Fluor)of the same cell are shown 1 day after being shot with plasmid DNA encod-ing the GFP. Note the DNA-bearing gold particle (arrowhead in DICimage) located within the cell.
BM2e-03(47-76) 24.05.02 16:16 Page 56

IV. Imaging Methodology
A. Confocal Microscopy
The principle of confocal imaging is illustrated in Figure 3.A wide range of confocal imaging systems are now available.We used several different confocal imaging systems inmaking the observations described here, including three com-mercially available microscopes and a custom-built confocalmicroscope. The commercial confocals used were a Bio-RadMRC-500 (Bio-Rad), modified as described previously(Smith et al., 1990), a Noran Odyssey that was capable ofcollecting semiconfocal fluorescence images at video rate (30 frames/s), and a three-laser Leica TCS NT confocalsystem (Leica, Heidelberg, Germany). The custom-builtmicroscope was a relatively low-cost, optical-bench styleinverted microscope designed and built by Stephen Smith(Stanford University). For illumination, the microscope wasequipped with a 25-mW argon-ion laser (Ion LaserTechnology) and a 15-mW helium–neon laser (MWK Lasers).The laser beams were steered though a shutter, neutral density
filter wheel, and excitation filter wheel and onto a neutralbeam-splitting mirror that reflected 7% of the laser light to thespecimen. The filter wheels were operated by stepper motorscontrolled by the host computer. The neutral beam-splittingmirror, which substituted for the dichroic mirror that is typi-cally used in fluorescence microscopy, permitted single detec-tor imaging of different fluorophores without the need toremove or adjust the beam-splitting mirror. Light was detectedthrough an adjustable circular aperture in front of the detector,a gallium–arsenide photomultiplier tube. This microscope hada very high throughput and was thus well suited to long, time-lapse experiments. The microscope objective lenses we foundto be most useful for the custom-built microscope were a dry Nikon 20×/0.75 Fluor, a Zeiss Plan-Neofluor 25×/0.8(oil–water–glycerin), and an oil-immersion Olympus DApo40×/1.3 UV objective. For the Leica system, we used a20×/0.7 dry Plan Apo or a 63×/1.2 water Plan Apo (220 µmworking distance) lens.
B. Three-Dimensional Imaging
An important feature of the confocal microscope is itsability to collect three-dimensional information on the struc-ture of complex cells and cellular relationships at high spatialresolution (Lichtman, 1994). With regard to neural organiz-ation in the brain, the 3D information obtainable with theconfocal microscope is helping to map the relationship ofneurons within functional networks (Smith et al., 1991) andlocalize synaptic structures at both the light (Hosokawa et al., 1992, 1994; Belichenko and Dahlstrom, 1995b) andthe EM (Deitch et al., 1991) level of organization.
The question of how best to display the 3D image data ischallenging, and the problem is compounded when 3D dataare collected over time (generating 4D data sets; see later).For single time-point data sets, each of the individual opticalsections along the axial (z) dimension can be displayed sep-arately (e.g., Fig. 11A), or the axial stack of images can becombined to generate a pair of stereo images (e.g., Fig. 10).Stereo-pair images can be generated from any through-focusdata set simply by shifting each successive image in thestack a small amount (i.e., by 1 pixel) before combining theimages. For each of the stereo-pair image stacks, individualimages are shifted in the opposite direction (i.e., shifted leftfor one stereo-pair image and right for the other). Generallyit is best to recombine images using a maximum brightnessoperation (rather than a simple addition) to reduce thebuildup of background noise. The disadvantage of recom-bining the image stack (either for stereo or for nonstereoviewing) is that adjacent image plans may contain a smallamount of out-of-focus light from a given structure, andwhen images are recombined, this can reduce the sharpnessand contrast of the structure. This problem can be effec-tively defeated in the confocal microscope by stoppingdown the pinhole aperture in order to reject the maximum
3 Optical Imaging of Neural Structure and Physiology 57
Figure 3 The principle of laser scanning confocal fluorescence micro-scopy. Laser light for fluorescence excitation is focused by a microscopeobjective lens to a diffraction-limited spot within a thick tissue specimen,such as a brain slice. Fluorescence emission is collected by the same objec-tive lens and is directed via a dichroic or neutral beam-splitting mirror to aphotomultiplier tube (detector). Light (dashed line) from regions of thespecimen outside the confocal plane is rejected by the pinhole aperture infront of the detector (i.e., only light from a single, narrow focal plane isdetected).
BM2e-03(47-76) 24.05.02 16:16 Page 57

amount of out-of-focus light and reduce flare. However, thiswill substantially decrease the detected signal and is mostuseful under conditions under which phototoxicity is not aconcern and the illumination intensity can be turned up tocompensate for the loss of signal.
C. Dynamic Imaging in Live Brain Slices
We have applied confocal imaging technology in con-junction with vital fluorescent labeling to examine dynamicchanges in cellular structure and physiology in live brainslices. Some of the important considerations for live brainslice imaging are discussed next.
1. Maintaining Brain Slices on the Microscope Stage
Factors that seem to be critical for maintaining healthybrain slices on the microscope stage include temperature,pH, glucose levels, and oxygenation (Dailey, 1999). Slicephysiologists have long known that oxygen deprivation canhave severe effects on physiological properties such assynaptic activity, although CNS tissues from developingmammals seem to be fairly resistant to hypoxia (e.g.,Dunwiddie, 1981) and hypoglycemia (Crépel et al., 1992).
It is not always easy to assess the health of living tissueon the microscope stage, but in the case of dynamicprocesses such as cell division, migration, or axon exten-sion, one would expect that the cells perform these activitiesat rates near that expected based on other methods of deter-mination. Also, one should become suspicious if the rate ofactivity consistently declined or increased over time whenimaged. For example, exposure of fluorescently labeledaxons to high light levels can reduce the rate of extension orcause retraction. In contrast, high light levels can produce along-lasting increase in the frequency of Ca2+ spikes in fluo-3-labeled astrocytes in cultured brain slices. In many cases,there will not be a useful benchmark for determining photo-toxic effects, but consistent changes during imaging willserve to warn the concerned microscopist. It may be worthsacrificing a few well-labeled preparations to determine ifdifferent imaging protocols, such as lower light levels orlonger time intervals between images, will significantly alterthe biological activity under study.
The specific requirements for maintaining healthy tissuesduring imaging will dictate specimen chamber design(Dailey, 1999). Two important chamber considerations arewhether to superfuse the tissue with bathing medium andwhether to use an open or closed chamber. The closedchamber has the advantages of preventing evaporation duringlong experiments and stabilizing temperature fluctuations.We found that brain slices maintained in closed chambers(volume ~1 ml) with Hepes-buffered culture medium remainviable and vigorous for about 6 h, after which point thechamber medium acidifies and cell motility declines notice-ably. However, when the old chamber medium is exchanged
with new medium, the cells “jump to life” again. This crudemethod of periodic medium exchange has supported thecontinuous observation of DiI-labeled migrating neuroblastsin brain slices on the microscope stage for as long as 45 h(O’Rourke et al., 1992). However, when using this approach,one runs the risk of mechanically disturbing the chamber orinducing a temperature change and thereby causing a jump infocus.
Continuous superfusion provides a more reliable methodof medium exchange and introduction of experimentalreagents. A variety of perfusion chambers with either open or closed configurations are available (Warner Instruments,Inc., Hamden, CT). Sometimes it is necessary to design andconstruct very sophisticated temperature and fluid levelcontrol systems (e.g., Delbridge et al., 1990). Such chambersmay permit a very rapid exchange of media, which is oftennecessary for physiological experiments requiring a fastexchange of reagents. Programmable automated perfusionsystems that permit rapid switching between one of severalperfusion channels are available (Warner Instruments orAutoMate Scientific, Inc., Oakland, CA). Some experimentalconditions require only relatively simple, low-cost chambersand perfusion systems. We have used an inexpensive,custom-made perfusion system to continuously superfusetissue slices on the microscope stage for many hours (Fig. 4).The tissue can remain healthy for 20 h or more when per-fused (10 to 20 ml/h) with either the culture medium (Dailey
58 II Surface-Based Data Acquisition
Figure 4 Perfusion system for maintaining live brain slices on themicroscope stage. Perfusate (normal saline or growth medium) is deliveredat ~10 ml per hour by gravity to one port in the specimen chamber andremoved from another port by vacuum suction through a filter paper wick.The flow rate, which is monitored at the air trap, is controlled by constrict-ing the tubing on the delivery side. The specimen chamber and microscopestage area are heated to ~35°C using forced air. For details of the specimenchamber, see Terasaki and Dailey (1995).
BM2e-03(47-76) 24.05.02 16:16 Page 58

et al., 1994) or normal saline, both of which are bufferedwith 25 mM Hepes.
Specimen heating may be essential for some experiments,but this can induce an agonizing battle with focus stability (seelater) as the chamber and stage components heat up. A suffi-cient period of preheating can help alleviate some of theseproblems. A relatively simple heating device can be con-structed by modifying a hair dryer to blow warm air onto boththe chamber and the stage (Dailey, 1999). It is also importantto monitor the temperature of the perfusing medium very nearthe specimen. Low-cost microprocessor temperature con-trollers that reduce fluctuations in the heating/cooling cycleare available (Omega Engineering, Stamford, CT).
2. Depth of View
The goal of studies in tissue slices is to examine biologi-cal structure and physiology within a complex cellularenvironment that approximates that found in situ. In the caseof live brain slices, it is generally desirable to image as farfrom cut tissue surfaces as possible to avoid artifacts associ-ated with tissue damage. For example, the cut surfaces ofdeveloping brain tissues contain an abnormal cellulararrangement that includes a plethora of astrocytes andmicroglia, as well as a mat of growing neuronal processes.Although time-lapse imaging of these regions providesstriking footage of glial cell movements, proliferation, andphagocytosis (Smith et al., 1990; Dailey and Waite, 1999;Stence et al., 2001), one has to be cautious when drawingconclusions about the normalcy of these events in relation tomature, intact brain.
With oil-immersion lenses, useful fluorescence imagesseem to be limited to a depth of 50 to 75 µm or so into thetissue. When imaging deep (>50 µm) within tissue, spatialresolution can suffer from several factors, including (1) weakstaining of cells due to poor dye penetration; (2) light scatterby the tissue components; and (3) spherical aberration.
The first problem (weak staining) can be overcome if thedye is injected into the tissue with a minimum of disruption.Also, as noted previously, the loading of some dyes may beenhanced by culturing the tissue briefly. Conceivably, lightscatter by the tissue can be minimized by using longerwavelength dyes. Imaging at longer wavelengths may alsoreduce phototoxic effects since the light is of lower energy.Finally, the problem of spherical aberration, which is exac-erbated when imaging through various media with differingindices of refraction, is improved by using water-immersionobjective lenses (see Pawley, 1995). Fortunately, micro-scope manufacturers have been responsive to the need forwell-corrected water-immersion objective lenses with longworking distance and high numerical aperture.
3. Signal-to-Noise and Spatiotemporal Resolution
When imaging any dynamic biological events, there isgenerally a trade-off between the signal-to-noise ratio (Rs/n)
(which affects the spatial resolution) and the temporal reso-lution. The demands of high spatial resolution (high Rs/n)restrict temporal resolution. Rs/n is proportional to the totalnumber of photons collected. Thus, for scanning confocalimaging systems, higher Rs/n can be achieved by: (a) inten-sifying the fluorescence staining; (b) increasing the incidentillumination; (c) improving the collection efficiency of thesystem; or (d) increasing the absolute number of photonscollected by lengthening the dwell time on a single-pixel,line, or frame-by-frame basis.
A primary concern when imaging live, fluorescentlylabeled cells is the photon collection efficiency of the opticalsystem. This is especially critical when imaging dynamicprocesses, such as axon or dendrite extension, over longperiods of time. Too much light can quickly halt growth.Systems with a higher collection efficiency will afford lowerlight levels, thus permitting more frequent sampling orexperiments of longer duration before photodamage ensues.
A common means of improving the resolution is toaverage successive images, or frames. This can certainlyincrease the Rs/n, but if cell structure or physiology changesrapidly, frame averaging can “smear” the data in both thespatial and the temporal domains. It may be better toincrease pixel dwell time to improve Rs/n, although this canalso induce temporal distortion within single images suchthat the top and bottom portions of a scanned image arecollected several seconds apart (see later discussion).
It should be noted that Rs/n will also drop off as onefocuses into the thick tissue specimen. Consequently, it isgenerally necessary to increase the incident (excitation)light to maintain a comparable spatial resolution when col-lecting three-dimensional data from thick tissue specimenssuch as brain slices. This problem can be compounded byweaker staining of structures located in deep portions oftissues.
4. Focus Drift
The thin optical sections produced by the confocalmicroscope reduce out-of-focus flare and improve resolu-tion over standard wide-field optical imaging methods.However, with such a shallow depth of focus, even verysmall changes in the position of the microscope objectiverelative to the structures of interest within the specimen cancreate problems. This is particularly evident when imagingthin, tortuous structures such as axons or fine dendriticprocesses within live brain slices. A moving focal plane can,for example, give one the deceiving impression of axon ordendrite extension or retraction. This problem is com-pounded when imaging cells and cell processes that areactively moving within tissues.
One obvious approach is to image the cells in four dimen-sions (3D × time) (Fig. 5). Such “volume imaging” can keepstructures in view in the face of minor tissue or stage move-ments; it is also helpful for monitoring axonal and dendritic
3 Optical Imaging of Neural Structure and Physiology 59
BM2e-03(47-76) 24.05.02 16:16 Page 59
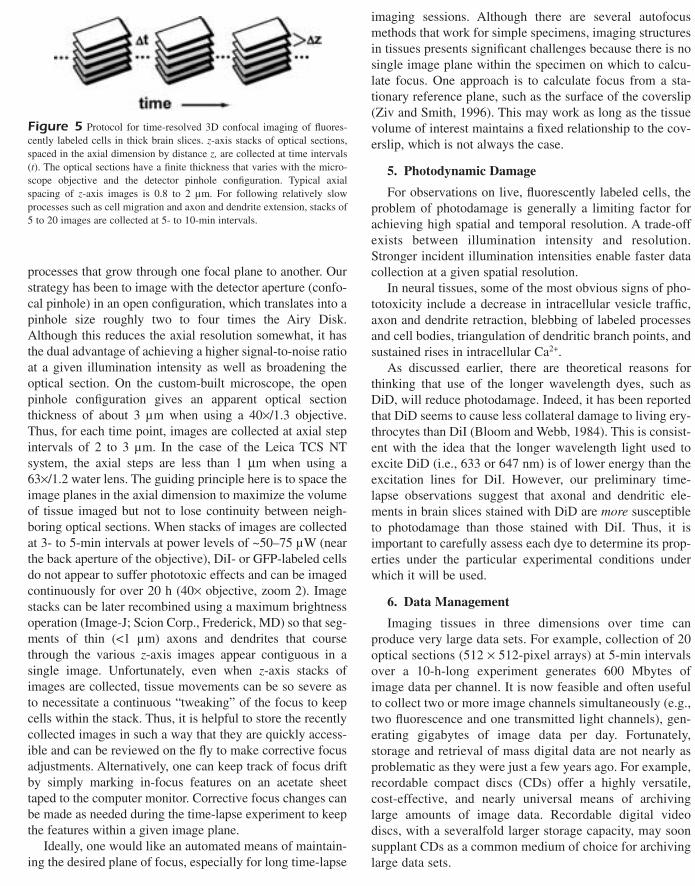
processes that grow through one focal plane to another. Ourstrategy has been to image with the detector aperture (confo-cal pinhole) in an open configuration, which translates into apinhole size roughly two to four times the Airy Disk.Although this reduces the axial resolution somewhat, it hasthe dual advantage of achieving a higher signal-to-noise ratioat a given illumination intensity as well as broadening theoptical section. On the custom-built microscope, the openpinhole configuration gives an apparent optical sectionthickness of about 3 µm when using a 40×/1.3 objective.Thus, for each time point, images are collected at axial stepintervals of 2 to 3 µm. In the case of the Leica TCS NTsystem, the axial steps are less than 1 µm when using a63×/1.2 water lens. The guiding principle here is to space theimage planes in the axial dimension to maximize the volumeof tissue imaged but not to lose continuity between neigh-boring optical sections. When stacks of images are collectedat 3- to 5-min intervals at power levels of ~50–75 µW (nearthe back aperture of the objective), DiI- or GFP-labeled cellsdo not appear to suffer phototoxic effects and can be imagedcontinuously for over 20 h (40× objective, zoom 2). Imagestacks can be later recombined using a maximum brightnessoperation (Image-J; Scion Corp., Frederick, MD) so that seg-ments of thin (<1 µm) axons and dendrites that coursethrough the various z-axis images appear contiguous in asingle image. Unfortunately, even when z-axis stacks ofimages are collected, tissue movements can be so severe asto necessitate a continuous “tweaking” of the focus to keepcells within the stack. Thus, it is helpful to store the recentlycollected images in such a way that they are quickly access-ible and can be reviewed on the fly to make corrective focusadjustments. Alternatively, one can keep track of focus driftby simply marking in-focus features on an acetate sheettaped to the computer monitor. Corrective focus changes canbe made as needed during the time-lapse experiment to keepthe features within a given image plane.
Ideally, one would like an automated means of maintain-ing the desired plane of focus, especially for long time-lapse
imaging sessions. Although there are several autofocusmethods that work for simple specimens, imaging structuresin tissues presents significant challenges because there is nosingle image plane within the specimen on which to calcu-late focus. One approach is to calculate focus from a sta-tionary reference plane, such as the surface of the coverslip(Ziv and Smith, 1996). This may work as long as the tissuevolume of interest maintains a fixed relationship to the cov-erslip, which is not always the case.
5. Photodynamic Damage
For observations on live, fluorescently labeled cells, theproblem of photodamage is generally a limiting factor forachieving high spatial and temporal resolution. A trade-offexists between illumination intensity and resolution.Stronger incident illumination intensities enable faster datacollection at a given spatial resolution.
In neural tissues, some of the most obvious signs of pho-totoxicity include a decrease in intracellular vesicle traffic,axon and dendrite retraction, blebbing of labeled processesand cell bodies, triangulation of dendritic branch points, andsustained rises in intracellular Ca2+.
As discussed earlier, there are theoretical reasons forthinking that use of the longer wavelength dyes, such asDiD, will reduce photodamage. Indeed, it has been reportedthat DiD seems to cause less collateral damage to living ery-throcytes than DiI (Bloom and Webb, 1984). This is consist-ent with the idea that the longer wavelength light used toexcite DiD (i.e., 633 or 647 nm) is of lower energy than theexcitation lines for DiI. However, our preliminary time-lapse observations suggest that axonal and dendritic ele-ments in brain slices stained with DiD are more susceptibleto photodamage than those stained with DiI. Thus, it isimportant to carefully assess each dye to determine its prop-erties under the particular experimental conditions underwhich it will be used.
6. Data Management
Imaging tissues in three dimensions over time canproduce very large data sets. For example, collection of 20optical sections (512 × 512-pixel arrays) at 5-min intervalsover a 10-h-long experiment generates 600 Mbytes ofimage data per channel. It is now feasible and often usefulto collect two or more image channels simultaneously (e.g.,two fluorescence and one transmitted light channels), gen-erating gigabytes of image data per day. Fortunately,storage and retrieval of mass digital data are not nearly asproblematic as they were just a few years ago. For example,recordable compact discs (CDs) offer a highly versatile,cost-effective, and nearly universal means of archivinglarge amounts of image data. Recordable digital videodiscs, with a severalfold larger storage capacity, may soonsupplant CDs as a common medium of choice for archivinglarge data sets.
60 II Surface-Based Data Acquisition
Figure 5 Protocol for time-resolved 3D confocal imaging of fluores-cently labeled cells in thick brain slices. z-axis stacks of optical sections,spaced in the axial dimension by distance z, are collected at time intervals(t). The optical sections have a finite thickness that varies with the micro-scope objective and the detector pinhole configuration. Typical axialspacing of z-axis images is 0.8 to 2 µm. For following relatively slowprocesses such as cell migration and axon and dendrite extension, stacks of5 to 20 images are collected at 5- to 10-min intervals.
BM2e-03(47-76) 24.05.02 16:16 Page 60

V. Application: Mapping NeuralStructure and Physiology in Developing
Brain Slices
We have applied the methods for fluorescence labelingand confocal imaging described earlier to study the organi-zation and development of neural systems in isolated brainslices. From an anatomical standpoint, this has includedthree-dimensional mapping of axonal and dendriticbranches, as well as synaptic structures. Dynamic structuralchanges associated with axonal and dendritic growth andsynapse formation are also being examined in order to elu-cidate principles of developmental plasticity. From a physi-ological standpoint, we have investigated patterns ofneuronal and glial activity in both acutely isolated andorganotypically cultured brain slices from developingrodents. These examples serve to demonstrate the spatialand temporal resolution available for mapping neural struc-ture and physiology in semi-intact mammalian brain tissues.
A. Organization and Growth of Axonal Fibers
As a model system, we have examined the organizationand development of the hippocampal mossy fiber system. Themossy fibers are the axons of dentate granule cells that synap-tically contact pyramidal neurons in area CA3 (Henze et al.,2000). The organization of the mossy fiber projection wasexamined by staining with vital fluorescent membrane dyes.Injection of DiI or DiO into the dentate gyrus of live hip-pocampal slices labels within a few hours the full extent of themossy fibers that project into area CA3. In slices taken frommature animals, one can see individual giant varicosities thatare spaced along the length of mossy fibers (Fig. 6). Thesevaricosities likely correspond to the giant presynaptic termi-nals that impinge on the CA3 pyramidal cell dendrites(Blackstad and Kjaerheim, 1961; Chicurel and Harris, 1992).
Confocal 3D reconstruction was used to examine thethree-dimensional organization and development of mossyfiber axons and their giant terminals. Individual fibers werefound to have serpentine pathways through the complextissue environment, and individual synaptic varicositiescould be clearly resolved (Fig. 7).
We next used time-lapse imaging to explore the dynam-ics of mossy fiber growth in developing hippocampal brainslices. Fibers in live tissue slices were labeled with DiI orDiO as described earlier, then imaged over a period ofseveral hours. Single-focal-plane images were collected at1- or 2-min intervals or, more frequently, stacks of five toseven images were collected at 5-min intervals. Based uponsuch 4D imaging movies, mossy fiber axons were found toextend within target regions at rates of about 10–30 µm/h(Dailey and Smith, 1993; Dailey et al., 1994). Growth wasoften saltatory, showing phases of rapid growth that were
interrupted by short quiescent periods, and axons reachingthe edge of the fiber bundle frequently went through severalrounds of retraction and redirection. In some cases, newbranches sprouted laterally from the shafts of axons (Fig. 8).
B. Structure and Development of Neuronal Dendrites
Most excitatory synaptic connections in the brain areformed on dendritic projections called spines. We usedfluorescence labeling and confocal imaging to address thedevelopment and dynamics of neuronal dendrite branchesand spines (Dailey and Smith, 1996). To examine dendritesof pyramidal neurons in slices, fluorescent membrane dye isinjected near the region of the basal dendrites (Fig. 9).
When dye is injected into slices taken from early post-natal rats, the elaborate organization of neuronal cell bodiesand dendritic arbors is revealed. The three-dimensionalorganization of dendrites is best appreciated in stereo-pairimages collected from a tissue volume at a relatively lowmagnification (Fig. 10). At higher magnification, confocalimages reveal the fine microstructure of dendrites. Dendriticbranches are studded with numerous filopodia and spine-like protrusions that extend into the surrounding tissue in all directions. These spiny protrusions are sites of synaptictermination by afferent axons.
Time-lapse imaging of fluorescently-labeled dendrites indeveloping tissue slices demonstrated that dendritic micro-structure is quite dynamic (Dailey and Smith, 1996; Marrs etal., 2001). Developing dendritic branches bear a combinationof fleeting filopodia-like protrusions and relatively stablespine-like structures (Fig. 11). Since dendritic spines typicallycorrespond to axonal synaptic input, the dynamic changes inspiny structures on developing dendrites may be a morpho-logical correlate of synaptic plasticity. Based on time-lapseimaging, there is now substantial evidence that dynamic den-dritic filopodia are precursors to more stable dendritic spines(Ziv and Smith, 1996; Friedman et al., 2000; Marrs et al.,2001). The extent to which dendritic spines and the synapticstructures associated with spines are dynamic in more maturetissues remains an open question (Okabe et al., 1999).
In the future it will be of interest to examine directly theinteraction and dynamic changes of pre- and postsynapticcomponents at identified sites of synaptic contact. This maybe facilitated in experiments in which axonal and dendriticprocesses are labeled with different dyes to facilitate theiridentification (Fig. 12).
C. Organization of Neural Synapses
Mapping neuronal connections would be simpler if therewere unique markers of the cells involved and of the synapticcontacts between each particular set of neurons. Some synap-tic systems in the CNS do, in fact, have unique structural
3 Optical Imaging of Neural Structure and Physiology 61
BM2e-03(47-76) 24.05.02 16:16 Page 61

features that facilitate their mapping. The mossy fibersynapses, for example, are characterized by giant (>2 µm)presynaptic terminals and large, complex postsynaptic spinesthat are readily identifiable even by light microscopy. Wehave examined the three-dimensional organization of mossyfiber terminals in brain slices using the antibody to syn-I,
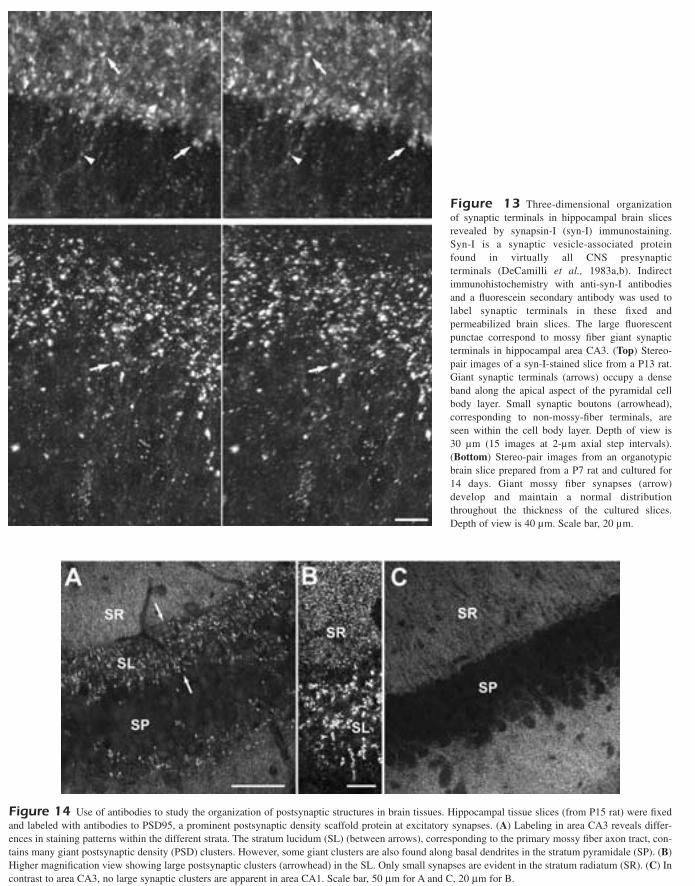
described earlier. Immunohistochemical staining of thicktissue slices isolated from formaldehyde-fixed rat brainreveals mossy fiber giant synaptic terminals (Fig. 13).
We also have used immunohistochemical techniques toassay the development and organization of mossy fibersynaptic contacts in brain slices cultured for 1–2 weeks
62 II Surface-Based Data Acquisition
Figure 6 DiI-labeled mossy fibers in a live brain slice prepared from a 3-week-old rat. (A) Low-magnification view showing site of dye injection (*) near the dentate gyrus, which is the location of the granulecell bodies and the source of the mossy fibers. Note the tight bundle of labeled mossy fibers (arrowhead) thatextend from the dentate gyrus into area CA3. Scale bar, 100 µm. (B) High-magnification view showing individ-ual fibers and varicosities. The large, en passant varicosities (arrow) correspond to giant mossy fiber synapticterminals. Scale bar, 25 µm.
BM2e-03(47-76) 24.05.02 16:16 Page 62

3 Optical Imaging of Neural Structure and Physiology 63
Figure 7 Three-dimensional organization of DiI-labeled mossy fibers in brain slices from developing rat. (A)Stereo-pair images of the mossy fiber bundle (arrow) in a slice from a P5 rat, at a time when the mossy fibers arejust growing out and forming synaptic contacts with CA3 pyramidal neurons. Depth of view is 30 µm. (B) Stereo-pair images of mossy fibers in a live slice prepared from a P12 rat. Note the tortuous course of individual axons(arrowhead) within the mossy fiber bundle. The giant en passant varicosities (arrows), corresponding to synapticterminals, can be seen along the length of the mossy fiber axons. Depth of view is 15 µm. Scale bar, 50 µm for A,10 µm for B.
BM2e-03(47-76) 24.05.02 16:17 Page 63

(Dailey et al., 1994). Three-dimensional imaging of syn-I-stained tissues revealed that the giant synapses maintain astereotypical distribution along the apical dendrites of CA3pyramidal neurons in cultured slices, although individualterminals appear slightly smaller and less complex than theirin vivo counterparts (Fig. 13).
Antibodies against postsynaptic proteins also have beendeveloped, and these permit studies of synaptic organiz-ation as well (Qin et al., 2001). For example, we have usedantibodies against a postsynaptic density protein, PSD95,which is a PDZ-domain scafold protein that serves toorganize and link neurotransmitter receptors to the postsy-naptic cytoskeleton (Cho et al., 1992; Kistner et al., 1993;Sheng and Sala, 2001). Immunohistochemistry using theanti-PSD95 antibody in hippocampal tissues highlightsregional differences in the organization and size of synap-
tic structures (Fig. 14). The large and complex postsynapticstructures at mossy fiber synapses are especially evident in the stratum lucidum, where mossy fiber axons normallycourse, but they are also evident at lower density in thepyramidal cell body layer. In contrast to area CA3,immunostaining in area CA1 shows only small, typicalpostsynaptic structures.
Although immunohistochemical staining can provideinformation on the size and density of synaptic structures inbrain tissues, they yield little information on the distributionof synaptic structures in relation to individual cells. Toaddress questions of synaptic organization on individualcells, we utilized gene gun transfection and expression of a GFP–PSD95 fusion protein (Qin et al., 2001). To labelpostsynaptic structures, we used a GW1 vector containingenhanced GFP fused in frame to the C-terminus of PSD95,
64 II Surface-Based Data Acquisition
Figure 8 Time-lapse confocal imaging of growth of mossy fiber axons within the target region. The mossy fibers (MF) were labeled by injection of DiIinto the dentate hilus. Note sprouting of a branchlet (open arrow) from the side of a mossy fiber axon (arrowheads) into the layer of pyramidal cell bodies(SP). The growing tip of another mossy fiber (filled arrow) can be seen to extend past the first fiber. These are extended-focus images composed of fiveoptical sections collected at 2.5-µm axial step intervals. The slice (same as shown in Fig. 7A) was acutely prepared from a P5 rat. Elapsed time is shown inminutes. Scale bar, 20 µm.
Figure 9 Vital staining of neuronal cell bodies and dendrites by injection of fluorescent membrane dye into isolated brainslices. (A) Transmitted light image showing organization of a live hippocampal slice (P3 rat). Black dots (arrow) in the stratumoriens of areas CA3 and CA1 correspond to sites where crystals of fluorescent dye were inserted. Dye inserted at these sites ispicked up by basal dendrites of pyramidal cells, labeling cell bodies and the entire extent of the dendritic arbor (see Fig. 10).DG, dentate gyrus. (B) Fluorescence image, corresponding to A, showing sites of fluorescent dye (DiD) labeling (arrows). Scalebar, 250 µm.
BM2e-03(47-76) 24.05.02 16:17 Page 64

3 Optical Imaging of Neural Structure and Physiology 65
Figure 11 Imaging dendritic spine dynamics in a live brain slice from developing rat. (A) Through-focus series of a portionof a DiD-labeled dendrite from a CA1 pyramidal neuron in a live brain slice (P5, 7 days in vitro). The optical section depth is indi-cated in micrometers. These images were collected with the confocal pinhole aperture in the fully open configuration to maximizethe signal detected. As a result, some out-of-focus flare is evident in the various optical sections. Scale bar, 25 µm. (B) Time-lapsesequence of same field as in A showing dynamics of dendritic spines. These are extended-focus images made by combining sixoptical sections collected at the depths indicated earlier. Note the shortening of a spine (arrowhead) and transient extension offilopodia-like protrusions (filled and open arrows). Such changes in dendritic structure may reflect plasticity in synaptic function.Time is shown in minutes.
Figure 10 Stereo-pair images showing DiD-labeled CA1 pyramidal neurons near a site of dye crystal insertion (*).Note 3D organization of labeled cell bodies and apical dendrites (arrowhead), which branch and course throughout thethickness of the brain slice. In one case, the axon (arrow) can be seen emerging from the pyramidal cell body. Depth ofview is 40 µm (20 images at 2-µm-step intervals). Slice is from a P6 rat and cultured for 5 days. Scale bar, 50 µm.
BM2e-03(47-76) 24.05.02 16:17 Page 65

under control of a human cytomegalovirus promoter (giftfrom D. Bredt, University of California at San Francisco).
Expression of the fusion protein, which targets normallyto synapses, labels all synaptic sites in the transfectedneurons. Confocal analysis and three-dimensional recon-struction of transfected tissues yield striking images ofsynaptic localization. Such data can reveal dramatic differ-ences in the organization of synapses, on neighboring cellsand even on different portions of the same cell, thus helpingto define unique synaptic domains and identify distinct neu-ronal cell types (Fig. 15).
Notably, cells expressing GFP and GFP-fusion proteinscan be examined in the living state, enabling studies on thedynamic formation and remodeling of synaptic structures(Okabe et al., 1999; Marrs et al., 2001). This generalapproach can be used to study other synaptic components,including signaling molecules (e.g., CaM kinase II) andneurotransmitter receptor subtypes (e.g., NMDA, AMPA,and metabotropic receptors). Moreover, it should be poss-
ible to express and distinguish more than one fluorescentprotein in a single cell, allowing for “whole-cell mapping”of functionally distinct types of synapses.
D. Intracellular Ca2+ Transients in Neurons and Glia
Brain mapping encompasses both structure and physio-logy. Mapping multicellular patterns of neural activity inbrain tissue at high spatial and temporal resolution continuesto be an important goal in neurobiology. One method that isproving useful is to image intracellular changes in calcium.Such changes are a consequence of electrical activity inneurons (Ross, 1989; Sinha and Saggau, 1999; Smetters et al., 1999), and glia also have been found to generate intra-cellular Ca2+ signals that reflect cellular physiology.
Changes in intracellular Ca2+ were assessed by imaging afluorescent, Ca2+-sensitive dye (fluo-3 or fluo-4). To imagemulticellular patterns of activity, it was necessary to use a
66 II Surface-Based Data Acquisition
Figure 12 Double labeling showing mossyfibers (red) and CA3 pyramidal neurons (green) in alive brain slice (P4, 1 day in vitro). Mossy fibers,which normally course within the stratum lucidum(SL), were labeled by injection of DiI into thedentate hilus. Pyramidal neurons, whose cell bodiesare located in the stratum pyramidale (SP), werelabeled by injection of DiO into the stratum oriensof area CA3. Such double-labeling experiments canreveal the interaction of axonal projections andtarget neurons. SR, stratum radiatum. Scale bar, 25 µm.
BM2e-03(47-76) 24.05.02 16:17 Page 66
3 Optical Imaging of Neural Structure and Physiology 67
Figure 13 Three-dimensional organization of synaptic terminals in hippocampal brain slicesrevealed by synapsin-I (syn-I) immunostaining.Syn-I is a synaptic vesicle-associated protein found in virtually all CNS presynaptic terminals (DeCamilli et al., 1983a,b). Indirectimmunohistochemistry with anti-syn-I antibodiesand a fluorescein secondary antibody was used tolabel synaptic terminals in these fixed andpermeabilized brain slices. The large fluorescentpunctae correspond to mossy fiber giant synapticterminals in hippocampal area CA3. (Top) Stereo-pair images of a syn-I-stained slice from a P13 rat.Giant synaptic terminals (arrows) occupy a denseband along the apical aspect of the pyramidal cellbody layer. Small synaptic boutons (arrowhead),corresponding to non-mossy-fiber terminals, areseen within the cell body layer. Depth of view is 30 µm (15 images at 2-µm axial step intervals).(Bottom) Stereo-pair images from an organotypicbrain slice prepared from a P7 rat and cultured for14 days. Giant mossy fiber synapses (arrow)develop and maintain a normal distributionthroughout the thickness of the cultured slices.Depth of view is 40 µm. Scale bar, 20 µm.
Figure 14 Use of antibodies to study the organization of postsynaptic structures in brain tissues. Hippocampal tissue slices (from P15 rat) were fixedand labeled with antibodies to PSD95, a prominent postsynaptic density scaffold protein at excitatory synapses. (A) Labeling in area CA3 reveals differ-ences in staining patterns within the different strata. The stratum lucidum (SL) (between arrows), corresponding to the primary mossy fiber axon tract, con-tains many giant postsynaptic density (PSD) clusters. However, some giant clusters are also found along basal dendrites in the stratum pyramidale (SP). (B)Higher magnification view showing large postsynaptic clusters (arrowhead) in the SL. Only small synapses are evident in the stratum radiatum (SR). (C) Incontrast to area CA3, no large synaptic clusters are apparent in area CA1. Scale bar, 50 µm for A and C, 20 µm for B.
BM2e-03(47-76) 24.05.02 16:17 Page 67

bulk loading procedure (using the membrane-permeant,AM–ester forms of dyes described earlier) so that most or allof the cells in the tissue slice were labeled. This method pro-vided suitable labeling of neurons and glia in live hippocam-
pal slices prepared from developing rat. Time-lapse imagingshowed that developing pyramidal neurons exhibit sponta-neous Ca2+ transients that reflect neural synaptic activity(Dailey and Smith, 1994). Although most pyramidal neurons
68 II Surface-Based Data Acquisition
Figure 15 GFP labeling of synapses in transfected neurons in a hippocampal slice. Using a gene gun, neurons were transfected with a plasmidvector encoding a GFP–PSD95 fusion protein to label postsynaptic densities (PSDs). For details, see Qin et al. (2001). (A) Five neurons were trans-fected in this field of view from area CA3. (B) Higher magnification, stereo image of the cells above showing small postsynaptic structures on sec-ondary dendrites in the SR and large postsynaptic structures on primary apical dendrites in the SL. The large PSD clusters (arrow) correspond tosynaptic contacts of the mossy fibers. Use red–green stereo glasses (available from the author) to view depth in the image. (C) Higher magnificationview of cells shown at lower right in A. Note the differences in morphology as well as patterns of GFP–PSD95 localization in these two adjacentneurons. The cell on the left (*) bears large GFP–PSD95 clusters (arrows) typical of mossy fiber synapses on a CA3 pyramidal neuron (cf. A and B).The cell on the right, which has a distinctive morphology with long, thick dendrites bearing few branches, is densely covered with small synapses butno large clusters. (D) Stereo image of cells shown in C. These images demonstrate the feasibility of mapping all morphological synaptic structures onindividual neurons, as well as distinguishing neurons on the basis of synaptic organization.
BM2e-03(47-76) 24.05.02 16:17 Page 68

appear to be independently active, occasionally there aresmall groups of synchronously-active neurons (Fig. 16). Suchpatterns of activity may reflect electrical coupling betweenneurons during development. The significance of these activ-
ity patterns remains unclear, although similar patterns ofactivity are found in the developing neocortex and are thoughtto help set up the organization of chemical synaptic contactsbetween groups of neurons (Yuste et al., 1992).
3 Optical Imaging of Neural Structure and Physiology 69
Figure 16 Patterns of spontaneous neural activity in brain slices from developing rat hippocampus.Neural activity is detected by a Ca2+-sensitive fluorescent dye, fluo-3. An increase in fluorescence inten-sity corresponds to a rise in intracellular Ca2+. Each image is a composite of three separate images takenat 12-s intervals and color coded such that different colored cells were active at different times. Bothfields (A and B) show activity of pyramidal neurons in area CA1 of hippocampal slices from a P3 rat.Very few glial cells are evident at this developmental stage. (A) Note the high level of spontaneous Ca2+
activity in pyramidal cell bodies and apical dendrites. Activity of adjacent neurons is largely nonsyn-chronous. (B) Small groups of synchronously active neurons (red cells at arrow) are occasionally seenat this stage of development. This pattern of activity is likely due to the coupling of pyramidal neuronsvia gap junctions. Coupling between neurons is known to occur during development but diminishes aschemical synaptic connections are established. Scale bar, 25 µm for A, 50 µm for B.
BM2e-03(47-76) 24.05.02 16:17 Page 69

A qualitatively different pattern of neuronal activity isfound when hippocampal slices are maintained in culture for several weeks. When slow-scanning confocal images arecollected, horizontal bands of high Ca2+ in neuropil and in
neuronal cell bodies are seen (Fig. 17). Such patterns ofneural activity probably reflect epileptiform-like activity,which is known from electrophysiological studies todevelop in these cultured slices (McBain et al., 1989).
70 II Surface-Based Data Acquisition
Figure 17 Patterns of spontaneous epileptiform activity in hippocampal slices detected by slow-scanning confocal imaging. (A) Composite image showingCa2+ activity at three different time points (encoded blue–green–red, respectively) collected at 7-s intervals. At two of the three time points, a burst of synchro-nized activity was evident in many neurons (green and red horizontal stripes). Such patterns of activity are indicative of synchronized bursting, which is knownfrom electrophysiological studies to occur in these brain slice cultures. The horizontal patterns are due to the slow scan rate (about 10 ms per horizontal line ofresolution in this case) relative to the rate of Ca2+ rise in the cells. Note the high level of fluorescence near the onset of activity (arrows) followed by a gradualdecline in fluorescence intensity as the scan collects data from portions of the field below. Scale bar, 25 µm. (B) Graphical display of spontaneous synchronizedCa2+ activity in neurons. Traces of fluorescence intensity over time are shown for eight neurons that were situated roughly in a horizontal line across the imagefield so that the time of sampling was identical for all these neurons. Images were collected at 7-s intervals. Initially, there was a low level of spontaneous activ-ity. At about the 9-min time point, the neurons started to exhibit synchronized Ca2+ activity (upward spikes) that persisted for many minutes.
BM2e-03(47-76) 24.05.02 16:18 Page 70

When the cultured brain slices are imaged at a higher timeresolution with a fast scanning confocal microscope, the timecourse of the fast neuronal Ca2+ transients associated withepileptiform activity is better resolved. A comparable patternof activity can be pharmacologically induced in culturedbrain slices perfused with GABAA-receptor antagonists,picrotoxin (100 µM) or gabazine (13 µM), which disinhibitbrain slices (Fig. 18). These images serve to demonstrate the trade-off between high spatial and temporal resolution in scanning confocal imaging (see earlier discussion).Collection of image data at high rates generally reduces thespatial resolution because many fewer photons are collectedat each point in space.
In addition to neuronal activity, imaging fluo-3-labeledbrain slices with the confocal microscope reveals patterns ofglial cell activity (Figs. 18C and 19). Previous studies revealedthat transcellular waves of activity can pass through gap junc-
tions connecting astrocytes (Cornell-Bell et al., 1990). Inbrain slices, the intracellular glial Ca2+ activity has been linkedto the local release of neurotransmitter during neural synapticactivity (Dani et al., 1992). These observations suggest adynamic, functional interplay between the neuronal and theglial networks in brain tissues (Smith, 1994; Charles, 1998;Araque et al., 2001; Bezzi and Volterra, 2001).
VI. Conclusions and Future Prospects
The development of novel fluorescent probes of cellularstructure and physiology (Mason, 1993; Tsien and Waggoner,1995) has had a profound impact on studies of brain structureand function at the network, cellular, and subcellular levels.Coupled with the technical advances in high-resolutionoptical imaging, fluorescent markers provide a valuable set of
3 Optical Imaging of Neural Structure and Physiology 71
Figure 18 Patterns of picrotoxin-induced epileptiform activity in hippocampal slices detected by fast-scanning confocal imaging of intracellularcalcium. The high time resolution was achieved using a confocal microscope (Noran Odyssey) that collects full-field images at video rate (30 Hz). (A) Asingle scan (nonaveraged) image showing the relatively low spatial resolution of fluo-3-labeled pyramidal neurons when imaged at high time resolution(compare with slow-scanned images in Figs. 16 and 17A). The slice is oriented such that the pyramidal cell body layer (SP) runs in a horizontal band acrossthe middle of the field. Numbered boxes indicate the location of some of the pyramidal cell bodies, which were more clearly evident in averaged images.SR, stratum radiatum. SO, stratum oriens. Scale bar, 20 µm. (B) Plots of fluorescence intensity over time for the five boxed regions, corresponding to fivepyramidal cell bodies, in A. Note how the high time resolution of the fast-scanning imaging reveals the repetitive, synchronized Ca2+ spikes in the neurons.(C) Plots of fluorescence intensity for a neuron (upper trace) and for four other nearby cells (not shown) that are most likely glia. Note the various patternsand slower time courses of Ca2+ transients in the nonneuronal cells that are resolved with the fast-scanning imaging.
BM2e-03(47-76) 24.05.02 16:18 Page 71
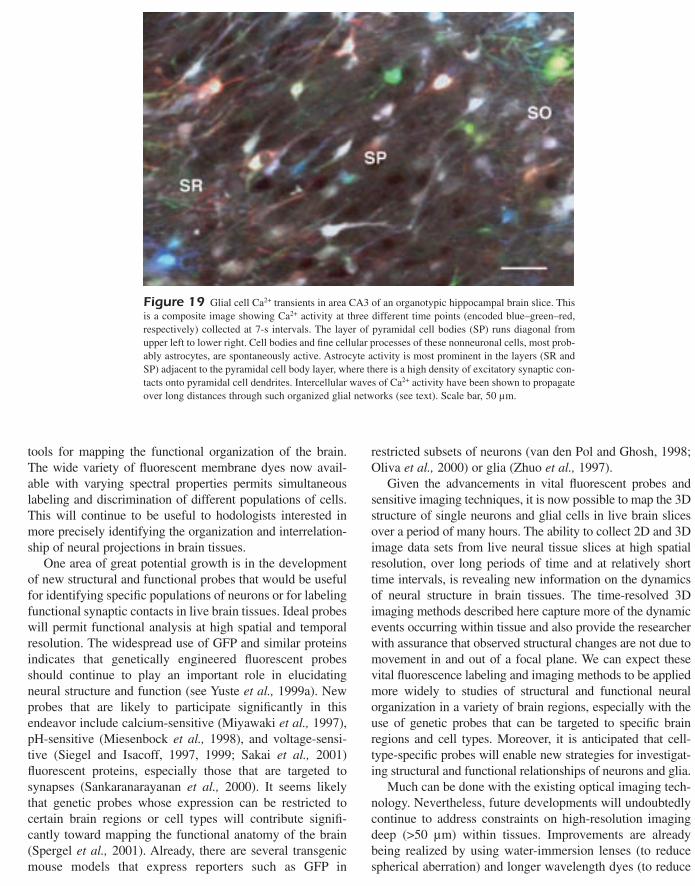
tools for mapping the functional organization of the brain.The wide variety of fluorescent membrane dyes now avail-able with varying spectral properties permits simultaneouslabeling and discrimination of different populations of cells.This will continue to be useful to hodologists interested inmore precisely identifying the organization and interrelation-ship of neural projections in brain tissues.
One area of great potential growth is in the developmentof new structural and functional probes that would be usefulfor identifying specific populations of neurons or for labelingfunctional synaptic contacts in live brain tissues. Ideal probeswill permit functional analysis at high spatial and temporalresolution. The widespread use of GFP and similar proteinsindicates that genetically engineered fluorescent probesshould continue to play an important role in elucidatingneural structure and function (see Yuste et al., 1999a). Newprobes that are likely to participate significantly in thisendeavor include calcium-sensitive (Miyawaki et al., 1997),pH-sensitive (Miesenbock et al., 1998), and voltage-sensi-tive (Siegel and Isacoff, 1997, 1999; Sakai et al., 2001)fluorescent proteins, especially those that are targeted tosynapses (Sankaranarayanan et al., 2000). It seems likelythat genetic probes whose expression can be restricted tocertain brain regions or cell types will contribute signifi-cantly toward mapping the functional anatomy of the brain(Spergel et al., 2001). Already, there are several transgenicmouse models that express reporters such as GFP in
restricted subsets of neurons (van den Pol and Ghosh, 1998;Oliva et al., 2000) or glia (Zhuo et al., 1997).
Given the advancements in vital fluorescent probes andsensitive imaging techniques, it is now possible to map the 3Dstructure of single neurons and glial cells in live brain slicesover a period of many hours. The ability to collect 2D and 3Dimage data sets from live neural tissue slices at high spatialresolution, over long periods of time and at relatively shorttime intervals, is revealing new information on the dynamicsof neural structure in brain tissues. The time-resolved 3Dimaging methods described here capture more of the dynamicevents occurring within tissue and also provide the researcherwith assurance that observed structural changes are not due tomovement in and out of a focal plane. We can expect thesevital fluorescence labeling and imaging methods to be appliedmore widely to studies of structural and functional neuralorganization in a variety of brain regions, especially with theuse of genetic probes that can be targeted to specific brainregions and cell types. Moreover, it is anticipated that cell-type-specific probes will enable new strategies for investigat-ing structural and functional relationships of neurons and glia.
Much can be done with the existing optical imaging tech-nology. Nevertheless, future developments will undoubtedlycontinue to address constraints on high-resolution imagingdeep (>50 µm) within tissues. Improvements are alreadybeing realized by using water-immersion lenses (to reducespherical aberration) and longer wavelength dyes (to reduce
72 II Surface-Based Data Acquisition
Figure 19 Glial cell Ca2+ transients in area CA3 of an organotypic hippocampal brain slice. Thisis a composite image showing Ca2+ activity at three different time points (encoded blue–green–red,respectively) collected at 7-s intervals. The layer of pyramidal cell bodies (SP) runs diagonal fromupper left to lower right. Cell bodies and fine cellular processes of these nonneuronal cells, most prob-ably astrocytes, are spontaneously active. Astrocyte activity is most prominent in the layers (SR andSP) adjacent to the pyramidal cell body layer, where there is a high density of excitatory synaptic con-tacts onto pyramidal cell dendrites. Intercellular waves of Ca2+ activity have been shown to propagateover long distances through such organized glial networks (see text). Scale bar, 50 µm.
BM2e-03(47-76) 24.05.02 16:18 Page 72

light scatter by the tissue and minimize phototoxic effects).Newer optical techniques such as multiphoton imaging(Denk et al., 1990, 1994) are being used more widely and aremaking significant contributions to mapping neural structureand function. Multiphoton imaging provides intrinsic three-dimensional resolution (Williams et al., 1994) whileconfining fluorescence excitation to a single narrow focalplane, thus reducing the risk of photodynamic damage. Withregard to imaging cellular and subcellular structure, multi-photon excitation yields a substantial improvement over con-ventional confocal for imaging fluorescently labeled cells atdeeper (100–500 µm) levels in live tissues (Mainen et al.,1999; Majewska et al., 2000).
Another very exciting optical technique that should greatlyfacilitate the mapping of functional neural organization inbrain slices is based on laser photostimulation (Farber andGrinvald, 1983). A modification of this technique (Callawayand Katz, 1993; Katz and Dalva, 1994) employs a scannedlaser beam to focally release a caged (photoactivatable) formof the excitatory neurotransmitter, glutamate, thus stimulatingnearby neurons. The development of new probes that can beuncaged with multiphoton excitation (Augustine, 2001;Matsuzaki et al., 2001) should enable higher resolutionstudies in more intact tissues. In conjunction with electro-physiological recordings or physiological imaging, thesemethods should continue to provide opportunities for high-resolution mapping of neural circuits in excised brain slices.
At present, most of the work at the cellular and subcellu-lar levels of resolution is being done in excised tissue slices.However, future work will continue to probe more of theoutstanding questions in intact, functioning preparations(e.g., Dirnagl et al., 1991; Them, 1993; Svoboda et al.,1999; Lendvai et al., 2000; Ilyin et al., 2001). At any rate, itis clear that neuroscientists have a repertoire of powerfuloptical tools for dissecting and mapping the functionalorganization of brain tissues.
Acknowledgments
Some of the work described herein was performed by the author in the lab-oratory of Dr. Stephen J. Smith (Stanford University). More recent work inthe author’s laboratory at the University of Iowa was supported by grantsfrom the NIH (NS37159) and Whitehall Foundation (98-6).
References
Adams, S., Bacskai, B., Deerinck, T., Ellisman, M., Heim, R., Lev-Ram, V.,Makings, L., and Tsien, R. (1994). Recent progress in imaging Ca2+ andother signals. In “Society for Neuroscience Short Course III Syllabus,”pp. 29–36. Soc. for Neurosci., Washington, DC.
Agmon, A., Yang, L. T., Jones, E. G., and O’Dowd, D. K. (1995).Topological precision in the thalamic projection to neonatal mousebarrel cortex. J. Neurosci. 15, 549–561.
Ahmari, S., Buchanan, J., and Smith, S. J. (2000). Assembly of presynap-tic active zones from cytoplasmic transport packets. Nat. Neurosci. 3,445–451.
Araque, A., Carmignoto, G., and Haydon, P. G. (2001). Dynamic signalingbetween astrocytes and neurons. Annu. Rev. Physiol. 63, 795–813.
Arnold, D. B., and Clapham, D. E. (1999). Molecular determinants for sub-cellular localization of PSD95 with an interacting K+ channel. Neuron23, 149–157.
Augustine, G. J. (2001). Illuminating the location of brain glutamate recep-tors. Nat. Neurosci. 4, 1051–1052.
Baker, G. E., and Reese, B. E. (1993). Using confocal laser scanningmicroscopy to investigate the organization and development of neuronalprojections labeled with DiI. Methods Cell Biol. 38, 325–344.
Belichenko, P. V., and Dahlström, A. (1994a). Dual channel confocal lasermicroscopy of Lucifer yellow-microinjected human brain cells com-bined with Texas red immunofluorescence. J. Neurosci. Methods 52,111–118.
Belichenko, P. V., and Dahlström, A. (1994b). Micro-mapping of the humanbrain: 3-dimensional imaging of immunofluorescence and dendriticmorphology using dual channel confocal laser scanning microscopy.Hum. Brain Mapp. 1, 185–195.
Belichenko, P. V., and Dahlström, A. (1995a). Studies on the 3-dimensionalarchitecture of dendritic spines and varicosities in human cortex by con-focal laser scanning microscopy and Lucifer yellow microinjections. J.Neurosci. Methods 57, 55–61.
Belichenko, P. V., and Dahlström, A. (1995b). Mapping of the human brainin normal and pathological situations: The single cell and fiber level,employing Lucifer yellow microinjection, carbocyanine dye tracing,immunofluorescence, and 3-D confocal laser scanning microscopyreconstruction. Neurosci. Protocols 50, 1–30.
Belichenko, P. V., Dahlström, A., and Sourander, P. (1992). The applicationof confocal microscopy for the study of neuronal organization in humancortical areas after Lucifer yellow microinjection. In “BiotechnologyApplications of Microinjection, Microscopic Imaging andFluorescence” (P. H. Bach, C. H. Reynolds, J. M. Clark, P. L. Poole, andJ. Mottley, eds.), pp. 29–36. Plenum, London.
Belichenko, P. V., Oldfors, A., Hagberg, B., and Dahlström, A. (1994a).Rett syndrome: 3-D confocal microscopy of cortical pyramidal den-drites and afferents. NeuroReport 5, 1509–1513.
Belichenko, P. V., Sourander, P., Malmgren, K., Nordborg, C., von Essen,C., Rydenhag, B., Lindstrom, S., Hedstrom, A., Uvebrant, P., andDahlström, A. (1994b). Dendritic morphology in epileptogenic cortexfrom TRPE patients, revealed by intracellular Lucifer yellow micro-injection and confocal laser scanning microscopy. Epilepsy Res. 18,233–247.
Bezzi, P., and Volterra, A. (2001). A neuron–glia signalling network in theactive brain. Curr. Opin. Neurobiol. 11, 387–394.
Blackstad, T. W., and Kjaerheim, A[o]. (1961). Special axo-dendriticsynapses in the hippocampal cortex: Electron and light microscopicstudies on the layer of mossy fibers. J. Comp. Neurol. 117, 133–157.
Bloom, J. A., and Webb, W. W. (1984). Photodamage to intact erythrocytemembranes at high laser intensities: Methods of assay and suppression.J. Histochem. Cytochem. 32, 608–616.
Callaway, E. M., and Katz, L. C. (1993). Photostimulation using caged glu-tamate reveals functional circuitry in living brain slices. Proc. Natl.Acad. Sci. USA 90, 7661–7665.
Chalfie, M., Tu, Y., Euskirchen, G., Ward, W. W., and Prasher, D. C. (1994).Green fluorescent protein as a marker for gene expression. Science 263,802–805.
Chamberlin, N. L., Du, B., de Lacalle S, and Saper, C. B. (1998).Recombinant adeno-associated virus vector: Use for transgene expres-sion and anterograde tract tracing in the CNS. Brain Res. 793, 169–175.
Charles, A. (1998). Intercellular calcium waves in glia. Glia 24, 39–49.Charles, A. C., Merrill, J. E., Dirksen, E. R., and Sanderson, M. J. (1991).
Intercellular signaling in glial cells: Calcium waves and oscillations inresponse to mechanical stimulation and glutamate. Neuron 6, 983–992.
Chicurel, M. E., and Harris, K. M. (1992). Three-dimensional analysis ofthe structure and composition of CA3 branched dendritic spines and
3 Optical Imaging of Neural Structure and Physiology 73
BM2e-03(47-76) 24.05.02 16:18 Page 73

their synaptic relationships with mossy fiber boutons in the rat hip-pocampus. J. Comp. Neurol. 325, 169–182.
Cho, K. O., Hunt, C. A., and Kennedy, M. B. (1992). The rat brain postsy-naptic density fraction contains a homolog of the Drosophila discs-largetumor suppressor protein. Neuron 9, 929–942.
Cornell-Bell, A. H., and Finkbeiner, S. M. (1991). Ca2+ waves in astrocytes.Cell Calcium 12, 185–204.
Cornell-Bell, A. H., Finkbeiner, S. M., Cooper, M. S., and Smith, S. J.(1990). Glutamate induces calcium waves in cultured astrocytes: Long-range glial signaling. Science 247, 470–473.
Crépel, V., Krnjevic, K., and Ben-Ari, Y. (1992). Developmental andregional differences in the vulnerability of rat hippocampal slices to lackof glucose. Neuroscience (New York) 47, 579–587.
Dailey, M. E. (1999). Maintaining live cells and tissue slices in the imagingsetup. In “Imaging Living Cells” (R. Yuste, F. Lanni, and A. Konnerth,eds.), pp. 10.1–10.7. Cold Spring Harbor Laboratory Press, New York.
Dailey, M. E., and Smith, S. J. (1993). Confocal imaging of mossy fibergrowth in live hippocampal slices. Jpn. J. Physiol. 43, S183–S192.
Dailey, M. E., and Smith, S. J. (1994). Spontaneous Ca2+ transients indeveloping hippocampal pyramidal cells. J. Neurobiol. 25, 243–251.
Dailey, M. E., and Smith, S. J. (1996). The dynamics of dendritic structurein developing hippocampal slices. J. Neurosci. 16, 2983–2994.
Dailey, M. E., and Waite, M. (1999). Confocal imaging of microglial celldynamics in hippocampal slice cultures. Methods 18, 222–230.
Dailey, M. E., Buchanan, J., Bergles, D. E., and Smith, S. J. (1994). Mossyfiber growth and synaptogenesis in rat hippocampal slices in vitro. J.Neurosci. 14, 1060–1078.
Dailey, M. E., Marrs, G., Satz, J., and Waite, M. (1999). Concepts inimaging and microscopy: Exploring biological structure and functionwith confocal microscopy. Biol. Bull. 197, 115–122.
Dani, J. W., Chernjavski, A., and Smith, S. J (1992). Neuronal activity trig-gers Ca waves in hippocampal astrocyte networks. Neuron 8:429–440.
DeCamilli, P., Cameron, R., and Greengard, P. (1983a). Synapsin I (ProteinI), a nerve terminal-specific phosphoprotein. I. Its general distribution insynapses of the central and peripheral nervous system demonstrated byimmunofluorescence in frozen and plastic sections. J. Cell Biol. 96,1337–1354.
DeCamilli, P., Harris, S. M., Huttner, W. B., and Greengard, P. (1983b).Synapsin I (Protein I), a nerve terminal-specific phosphoprotein. II. Itsspecific association with synaptic vesicles demonstrated by immunocy-tochemistry in agarose-embedded synaptosomes. J. Cell Biol. 96,1355–1373.
Deitch, J. S., Smith, K. L., Swann, J. W., and Turner, J. N. (1991).Ultrastructural investigation of neurons identified and localized using theconfocal scanning laser microscope. J. Electron Microsc. Tech. 18, 82–90.
Delbridge, L. M., Harris, P. J., Pringle, J. T., Dally, L. J., and Morgan, T. O.(1990). A superfusion bath for single-cell recording with high-precisionoptical depth control, temperature regulation, and rapid solution switch-ing. Pflügers Arch. 416, 94–97.
del Rio, J. A., Heimrich, B., Soriano, E., Schwegler, H., and Frotscher, M.(1991). Proliferation and differentiation of glial fibrillary acidic protein-immunoreactive glial cells in organotypic slice cultures of rat hip-pocampus. Neuroscience 43, 335–347.
Denk, W., Strickler, J. H., and Webb, W. W. (1990). Two-photon laser scan-ning fluorescence microscopy. Science 248, 73–76.
Denk, W., Delaney, K. R., Gelperin, A., Kleinfeld, D., Strowbridge, B. W.,Tank, D. W., and Yuste, R. (1994). Anatomical and functional imagingof neurons using 2-photon laser scanning microscopy. J. Neurosci.Methods 54, 151–162.
Dirnagl, U., Villringer, A., and Einhäupl, K. M. (1991). Imaging of intracel-lular pH in normal and ischemic rat brain neocortex using confocal laserscanning microscopy in vivo. J. Cereb. Blood Flow Metab. 11, S206.
Dunwiddie, T. V. (1981). Age-related differences in the in vitro rat hip-pocampus: Development of inhibition and the effects of hypoxia. Dev.Neurosci. 4, 165–175.
Elberger, A. J., and Honig, M. G. (1990). Double-labeling tissue containingthe carbocyanine dye, DiI, for immunocytochemistry. J. Histochem.Cytochem. 38, 735–739.
Farber, I. C., and Grinvald, A. (1983). Identification of presynaptic neuronsby laser photostimulation. Science 222, 1025–1027.
Fine, A., Amos, W. B., Durbin, R. M., and McNaughton, P. A. (1988).Confocal microscopy: Applications in neurobiology. Trends Neurosci.11, 346–351.
Friedman, H. V., Bresler, T., Garner, C. C., and Ziv, N. E. (2000). Assemblyof new individual excitatory synapses: Time course and temporal orderof synaptic molecule recruitment. Neuron 27, 57–69.
Gähwiler, B. H. (1984). Development of the hippocampus in vitro: Celltypes, synapses, and receptors. Neuroscience (New York) 11, 751–760.
Gähwiler, B. H., Thompson, S. M., Audinat, E., and Robertson, R. T. (1991).Organotypic slice cultures of neural tissue. In “Culturing Nerve Cells” (G.Banker and K. Goslin, eds.), pp. 379–411. MIT Press, Cambridge, MA.
Gähwiler, B. H., Capogna, M., Debanne, D., McKinney, R. A., andThompson, S. M. (1997). Organotypic slice cultures: A technique hascome of age. Trends Neurosci. 20, 471–477.
Gan, W.-B., Bishop, D., Turney, S. G., and Lichtman, J. W. (1999). Vitalimaging and ultrastructural analysis of individual axon terminals labeledby iontophoretic application of lipophilic dye. J. Neurosci. Methods 93,13–20.
Gan, W.-B., Grutzendler, J., Wong, W. T., Wong, R. O. L., and Lichtman, J.W. (2000). Multicolor “DiOlistic” labeling of the nervous system usinglipophilic dye combinations. Neuron 27, 219–225.
Ghosh, A., and Greenberg, M. E. (1995). Calcium signaling in neurons:Molecular mechanisms and cellular consequences. Science 268,239–247.
Grinvald, A., Frostig, R. D., Lieke, E., and Hildesheim, R. (1988). Opticalimaging of neuronal activity. Annu. Rev. Physiol. 68, 1285–1366.
Grynkiewicz, G., Poenie, M., and Tsien, R. Y. (1985). A new generation ofCa2+ indicators with greatly improved fluorescence properties. J. Biol.Chem. 260, 3440–3450.
Guerineau, N. C., Bonnefont, X., Stoeckel, L., and Mollard, P. (1998).Synchronized spontaneous Ca2+ transients in acute anterior pituitaryslices. J. Biol. Chem. 273, 10389–10395.
Guthrie, P. B., Segal, M., and Kater, S. B. (1991). Independent regulationof calcium revealed by imaging dendritic spines. Nature (London) 354,76–80.
Haas, K., Sin, W. C., Javaherian, A., Li, Z., and Cline, H. T. (2001). Single-cell electroporation for gene transfer in vivo. Neuron 29, 583–591.
Henze, D. A., Urban, N. N., and Barrionuevo, G. (2000). The multifarioushippocampal mossy fiber pathway: A review. Neuroscience 98,407–427.
Holt, C. E. (1989). A single-cell analysis of early retinal ganglion cell differ-entiation in Xenopus: From soma to axon tip. J. Neurosci. 9, 3123–3145.
Honig, M. G. (1993). DiI labelling. Neurosci. Protocols 50, 1–20.Honig, M. G., and Hume, R. I. (1986). Fluorescent carbocyanine dyes
allow living neurons of identified origin to be studied in long-term cul-tures. J. Cell Biol. 103, 171–187.
Hosokawa, T., Bliss, T. V., and Fine, A. (1992). Persistence of individualdendritic spines in living brain slices. NeuroReport 3, 477–480.
Hosokawa, T., Bliss, T. V., and Fine, A. (1994). Quantitative three-dimen-sional confocal microscopy of synaptic structures in living brain tissue.Microsc. Res. Tech. 29, 290–296.
Ilyin, S. E., Flynn, M. C., and Plata-Salaman, C. R. (2001). Fiber-opticmonitoring coupled with confocal microscopy for imaging gene expres-sion in vitro and in vivo. J. Neurosci. Methods 108, 91–96.
Jahromi, B. S., Robitaille, R., and Charlton, M. P. (1992). Transmitterrelease increases intracellular calcium in perisynaptic Schwann cells insitu. Neuron 8, 1069–1077.
Katz, L. C., and Dalva, M. B. (1994). Scanning laser photostimulation: Anew approach for analyzing brain circuits. J. Neurosci. Methods 54,205–218.
74 II Surface-Based Data Acquisition
BM2e-03(47-76) 24.05.02 16:18 Page 74
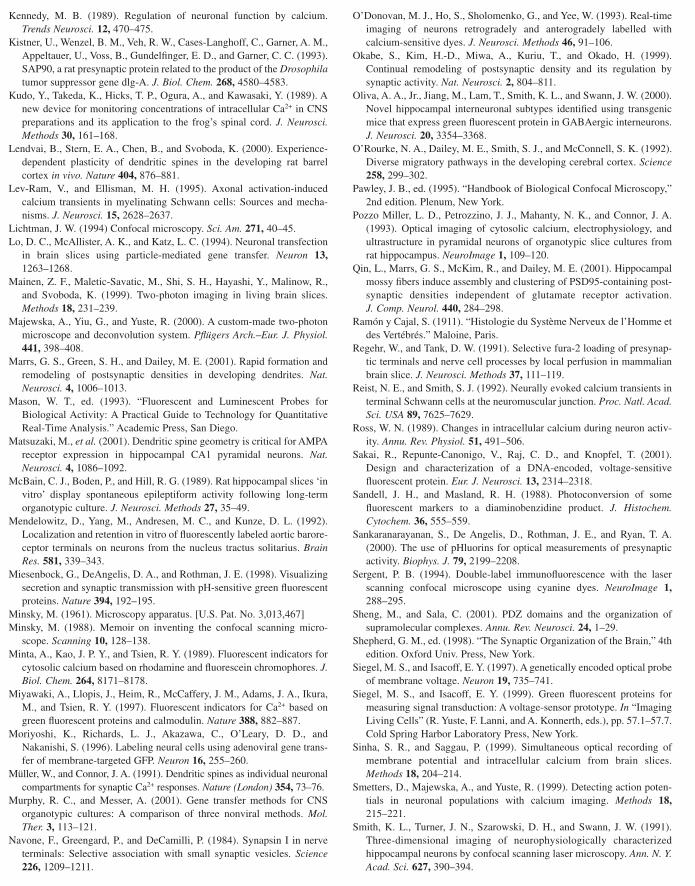
Kennedy, M. B. (1989). Regulation of neuronal function by calcium.Trends Neurosci. 12, 470–475.
Kistner, U., Wenzel, B. M., Veh, R. W., Cases-Langhoff, C., Garner, A. M.,Appeltauer, U., Voss, B., Gundelfinger, E. D., and Garner, C. C. (1993).SAP90, a rat presynaptic protein related to the product of the Drosophilatumor suppressor gene dlg-A. J. Biol. Chem. 268, 4580–4583.
Kudo, Y., Takeda, K., Hicks, T. P., Ogura, A., and Kawasaki, Y. (1989). Anew device for monitoring concentrations of intracellular Ca2+ in CNSpreparations and its application to the frog’s spinal cord. J. Neurosci.Methods 30, 161–168.
Lendvai, B., Stern, E. A., Chen, B., and Svoboda, K. (2000). Experience-dependent plasticity of dendritic spines in the developing rat barrelcortex in vivo. Nature 404, 876–881.
Lev-Ram, V., and Ellisman, M. H. (1995). Axonal activation-inducedcalcium transients in myelinating Schwann cells: Sources and mecha-nisms. J. Neurosci. 15, 2628–2637.
Lichtman, J. W. (1994) Confocal microscopy. Sci. Am. 271, 40–45.Lo, D. C., McAllister, A. K., and Katz, L. C. (1994). Neuronal transfection
in brain slices using particle-mediated gene transfer. Neuron 13,1263–1268.
Mainen, Z. F., Maletic-Savatic, M., Shi, S. H., Hayashi, Y., Malinow, R.,and Svoboda, K. (1999). Two-photon imaging in living brain slices.Methods 18, 231–239.
Majewska, A., Yiu, G., and Yuste, R. (2000). A custom-made two-photonmicroscope and deconvolution system. Pflügers Arch.–Eur. J. Physiol.441, 398–408.
Marrs, G. S., Green, S. H., and Dailey, M. E. (2001). Rapid formation andremodeling of postsynaptic densities in developing dendrites. Nat.Neurosci. 4, 1006–1013.
Mason, W. T., ed. (1993). “Fluorescent and Luminescent Probes forBiological Activity: A Practical Guide to Technology for QuantitativeReal-Time Analysis.” Academic Press, San Diego.
Matsuzaki, M., et al. (2001). Dendritic spine geometry is critical for AMPAreceptor expression in hippocampal CA1 pyramidal neurons. Nat.Neurosci. 4, 1086–1092.
McBain, C. J., Boden, P., and Hill, R. G. (1989). Rat hippocampal slices ‘invitro’ display spontaneous epileptiform activity following long-termorganotypic culture. J. Neurosci. Methods 27, 35–49.
Mendelowitz, D., Yang, M., Andresen, M. C., and Kunze, D. L. (1992).Localization and retention in vitro of fluorescently labeled aortic barore-ceptor terminals on neurons from the nucleus tractus solitarius. BrainRes. 581, 339–343.
Miesenbock, G., DeAngelis, D. A., and Rothman, J. E. (1998). Visualizingsecretion and synaptic transmission with pH-sensitive green fluorescentproteins. Nature 394, 192–195.
Minsky, M. (1961). Microscopy apparatus. [U.S. Pat. No. 3,013,467]Minsky, M. (1988). Memoir on inventing the confocal scanning micro-
scope. Scanning 10, 128–138.Minta, A., Kao, J. P. Y., and Tsien, R. Y. (1989). Fluorescent indicators for
cytosolic calcium based on rhodamine and fluorescein chromophores. J.Biol. Chem. 264, 8171–8178.
Miyawaki, A., Llopis, J., Heim, R., McCaffery, J. M., Adams, J. A., Ikura,M., and Tsien, R. Y. (1997). Fluorescent indicators for Ca2+ based ongreen fluorescent proteins and calmodulin. Nature 388, 882–887.
Moriyoshi, K., Richards, L. J., Akazawa, C., O’Leary, D. D., andNakanishi, S. (1996). Labeling neural cells using adenoviral gene trans-fer of membrane-targeted GFP. Neuron 16, 255–260.
Müller, W., and Connor, J. A. (1991). Dendritic spines as individual neuronalcompartments for synaptic Ca2+ responses. Nature (London) 354, 73–76.
Murphy, R. C., and Messer, A. (2001). Gene transfer methods for CNSorganotypic cultures: A comparison of three nonviral methods. Mol.Ther. 3, 113–121.
Navone, F., Greengard, P., and DeCamilli, P. (1984). Synapsin I in nerveterminals: Selective association with small synaptic vesicles. Science226, 1209–1211.
O’Donovan, M. J., Ho, S., Sholomenko, G., and Yee, W. (1993). Real-timeimaging of neurons retrogradely and anterogradely labelled withcalcium-sensitive dyes. J. Neurosci. Methods 46, 91–106.
Okabe, S., Kim, H.-D., Miwa, A., Kuriu, T., and Okado, H. (1999).Continual remodeling of postsynaptic density and its regulation bysynaptic activity. Nat. Neurosci. 2, 804–811.
Oliva, A. A., Jr., Jiang, M., Lam, T., Smith, K. L., and Swann, J. W. (2000).Novel hippocampal interneuronal subtypes identified using transgenicmice that express green fluorescent protein in GABAergic interneurons.J. Neurosci. 20, 3354–3368.
O’Rourke, N. A., Dailey, M. E., Smith, S. J., and McConnell, S. K. (1992).Diverse migratory pathways in the developing cerebral cortex. Science258, 299–302.
Pawley, J. B., ed. (1995). “Handbook of Biological Confocal Microscopy,”2nd edition. Plenum, New York.
Pozzo Miller, L. D., Petrozzino, J. J., Mahanty, N. K., and Connor, J. A.(1993). Optical imaging of cytosolic calcium, electrophysiology, andultrastructure in pyramidal neurons of organotypic slice cultures fromrat hippocampus. NeuroImage 1, 109–120.
Qin, L., Marrs, G. S., McKim, R., and Dailey, M. E. (2001). Hippocampalmossy fibers induce assembly and clustering of PSD95-containing post-synaptic densities independent of glutamate receptor activation. J. Comp. Neurol. 440, 284–298.
Ramón y Cajal, S. (1911). “Histologie du Système Nerveux de l’Homme etdes Vertébrés.” Maloine, Paris.
Regehr, W., and Tank, D. W. (1991). Selective fura-2 loading of presynap-tic terminals and nerve cell processes by local perfusion in mammalianbrain slice. J. Neurosci. Methods 37, 111–119.
Reist, N. E., and Smith, S. J. (1992). Neurally evoked calcium transients interminal Schwann cells at the neuromuscular junction. Proc. Natl. Acad.Sci. USA 89, 7625–7629.
Ross, W. N. (1989). Changes in intracellular calcium during neuron activ-ity. Annu. Rev. Physiol. 51, 491–506.
Sakai, R., Repunte-Canonigo, V., Raj, C. D., and Knopfel, T. (2001).Design and characterization of a DNA-encoded, voltage-sensitivefluorescent protein. Eur. J. Neurosci. 13, 2314–2318.
Sandell, J. H., and Masland, R. H. (1988). Photoconversion of somefluorescent markers to a diaminobenzidine product. J. Histochem.Cytochem. 36, 555–559.
Sankaranarayanan, S., De Angelis, D., Rothman, J. E., and Ryan, T. A.(2000). The use of pHluorins for optical measurements of presynapticactivity. Biophys. J. 79, 2199–2208.
Sergent, P. B. (1994). Double-label immunofluorescence with the laserscanning confocal microscope using cyanine dyes. NeuroImage 1,288–295.
Sheng, M., and Sala, C. (2001). PDZ domains and the organization ofsupramolecular complexes. Annu. Rev. Neurosci. 24, 1–29.
Shepherd, G. M., ed. (1998). “The Synaptic Organization of the Brain,” 4thedition. Oxford Univ. Press, New York.
Siegel, M. S., and Isacoff, E. Y. (1997). A genetically encoded optical probeof membrane voltage. Neuron 19, 735–741.
Siegel, M. S., and Isacoff, E. Y. (1999). Green fluorescent proteins formeasuring signal transduction: A voltage-sensor prototype. In “ImagingLiving Cells” (R. Yuste, F. Lanni, and A. Konnerth, eds.), pp. 57.1–57.7.Cold Spring Harbor Laboratory Press, New York.
Sinha, S. R., and Saggau, P. (1999). Simultaneous optical recording ofmembrane potential and intracellular calcium from brain slices.Methods 18, 204–214.
Smetters, D., Majewska, A., and Yuste, R. (1999). Detecting action poten-tials in neuronal populations with calcium imaging. Methods 18,215–221.
Smith, K. L., Turner, J. N., Szarowski, D. H., and Swann, J. W. (1991).Three-dimensional imaging of neurophysiologically characterizedhippocampal neurons by confocal scanning laser microscopy. Ann. N. Y.Acad. Sci. 627, 390–394.
3 Optical Imaging of Neural Structure and Physiology 75
BM2e-03(47-76) 24.05.02 16:18 Page 75
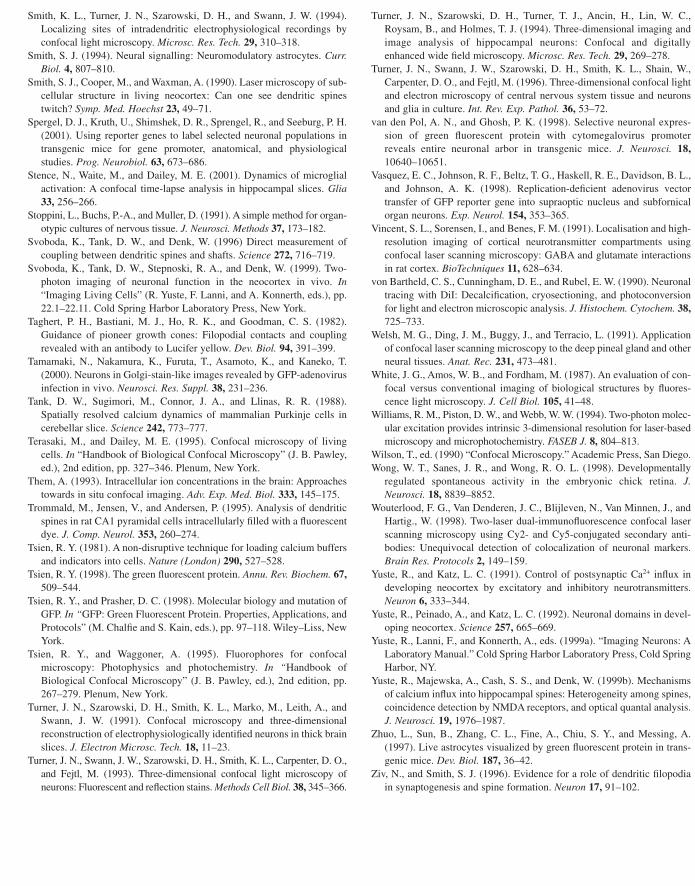
Smith, K. L., Turner, J. N., Szarowski, D. H., and Swann, J. W. (1994).Localizing sites of intradendritic electrophysiological recordings byconfocal light microscopy. Microsc. Res. Tech. 29, 310–318.
Smith, S. J. (1994). Neural signalling: Neuromodulatory astrocytes. Curr.Biol. 4, 807–810.
Smith, S. J., Cooper, M., and Waxman, A. (1990). Laser microscopy of sub-cellular structure in living neocortex: Can one see dendritic spinestwitch? Symp. Med. Hoechst 23, 49–71.
Spergel, D. J., Kruth, U., Shimshek, D. R., Sprengel, R., and Seeburg, P. H.(2001). Using reporter genes to label selected neuronal populations intransgenic mice for gene promoter, anatomical, and physiologicalstudies. Prog. Neurobiol. 63, 673–686.
Stence, N., Waite, M., and Dailey, M. E. (2001). Dynamics of microglialactivation: A confocal time-lapse analysis in hippocampal slices. Glia33, 256–266.
Stoppini, L., Buchs, P.-A., and Muller, D. (1991). A simple method for organ-otypic cultures of nervous tissue. J. Neurosci. Methods 37, 173–182.
Svoboda, K., Tank, D. W., and Denk, W. (1996) Direct measurement ofcoupling between dendritic spines and shafts. Science 272, 716–719.
Svoboda, K., Tank, D. W., Stepnoski, R. A., and Denk, W. (1999). Two-photon imaging of neuronal function in the neocortex in vivo. In“Imaging Living Cells” (R. Yuste, F. Lanni, and A. Konnerth, eds.), pp.22.1–22.11. Cold Spring Harbor Laboratory Press, New York.
Taghert, P. H., Bastiani, M. J., Ho, R. K., and Goodman, C. S. (1982).Guidance of pioneer growth cones: Filopodial contacts and couplingrevealed with an antibody to Lucifer yellow. Dev. Biol. 94, 391–399.
Tamamaki, N., Nakamura, K., Furuta, T., Asamoto, K., and Kaneko, T.(2000). Neurons in Golgi-stain-like images revealed by GFP-adenovirusinfection in vivo. Neurosci. Res. Suppl. 38, 231–236.
Tank, D. W., Sugimori, M., Connor, J. A., and Llinas, R. R. (1988).Spatially resolved calcium dynamics of mammalian Purkinje cells incerebellar slice. Science 242, 773–777.
Terasaki, M., and Dailey, M. E. (1995). Confocal microscopy of livingcells. In “Handbook of Biological Confocal Microscopy” (J. B. Pawley,ed.), 2nd edition, pp. 327–346. Plenum, New York.
Them, A. (1993). Intracellular ion concentrations in the brain: Approachestowards in situ confocal imaging. Adv. Exp. Med. Biol. 333, 145–175.
Trommald, M., Jensen, V., and Andersen, P. (1995). Analysis of dendriticspines in rat CA1 pyramidal cells intracellularly filled with a fluorescentdye. J. Comp. Neurol. 353, 260–274.
Tsien, R. Y. (1981). A non-disruptive technique for loading calcium buffersand indicators into cells. Nature (London) 290, 527–528.
Tsien, R. Y. (1998). The green fluorescent protein. Annu. Rev. Biochem. 67,509–544.
Tsien, R. Y., and Prasher, D. C. (1998). Molecular biology and mutation ofGFP. In “GFP: Green Fluorescent Protein. Properties, Applications, andProtocols” (M. Chalfie and S. Kain, eds.), pp. 97–118. Wiley–Liss, NewYork.
Tsien, R. Y., and Waggoner, A. (1995). Fluorophores for confocalmicroscopy: Photophysics and photochemistry. In “Handbook ofBiological Confocal Microscopy” (J. B. Pawley, ed.), 2nd edition, pp.267–279. Plenum, New York.
Turner, J. N., Szarowski, D. H., Smith, K. L., Marko, M., Leith, A., andSwann, J. W. (1991). Confocal microscopy and three-dimensionalreconstruction of electrophysiologically identified neurons in thick brainslices. J. Electron Microsc. Tech. 18, 11–23.
Turner, J. N., Swann, J. W., Szarowski, D. H., Smith, K. L., Carpenter, D. O.,and Fejtl, M. (1993). Three-dimensional confocal light microscopy ofneurons: Fluorescent and reflection stains. Methods Cell Biol. 38, 345–366.
Turner, J. N., Szarowski, D. H., Turner, T. J., Ancin, H., Lin, W. C.,Roysam, B., and Holmes, T. J. (1994). Three-dimensional imaging andimage analysis of hippocampal neurons: Confocal and digitallyenhanced wide field microscopy. Microsc. Res. Tech. 29, 269–278.
Turner, J. N., Swann, J. W., Szarowski, D. H., Smith, K. L., Shain, W.,Carpenter, D. O., and Fejtl, M. (1996). Three-dimensional confocal lightand electron microscopy of central nervous system tissue and neuronsand glia in culture. Int. Rev. Exp. Pathol. 36, 53–72.
van den Pol, A. N., and Ghosh, P. K. (1998). Selective neuronal expres-sion of green fluorescent protein with cytomegalovirus promoterreveals entire neuronal arbor in transgenic mice. J. Neurosci. 18,10640–10651.
Vasquez, E. C., Johnson, R. F., Beltz, T. G., Haskell, R. E., Davidson, B. L.,and Johnson, A. K. (1998). Replication-deficient adenovirus vectortransfer of GFP reporter gene into supraoptic nucleus and subfornicalorgan neurons. Exp. Neurol. 154, 353–365.
Vincent, S. L., Sorensen, I., and Benes, F. M. (1991). Localisation and high-resolution imaging of cortical neurotransmitter compartments usingconfocal laser scanning microscopy: GABA and glutamate interactionsin rat cortex. BioTechniques 11, 628–634.
von Bartheld, C. S., Cunningham, D. E., and Rubel, E. W. (1990). Neuronaltracing with DiI: Decalcification, cryosectioning, and photoconversionfor light and electron microscopic analysis. J. Histochem. Cytochem. 38,725–733.
Welsh, M. G., Ding, J. M., Buggy, J., and Terracio, L. (1991). Applicationof confocal laser scanning microscopy to the deep pineal gland and otherneural tissues. Anat. Rec. 231, 473–481.
White, J. G., Amos, W. B., and Fordham, M. (1987). An evaluation of con-focal versus conventional imaging of biological structures by fluores-cence light microscopy. J. Cell Biol. 105, 41–48.
Williams, R. M., Piston, D. W., and Webb, W. W. (1994). Two-photon molec-ular excitation provides intrinsic 3-dimensional resolution for laser-basedmicroscopy and microphotochemistry. FASEB J. 8, 804–813.
Wilson, T., ed. (1990) “Confocal Microscopy.” Academic Press, San Diego.Wong, W. T., Sanes, J. R., and Wong, R. O. L. (1998). Developmentally
regulated spontaneous activity in the embryonic chick retina. J.Neurosci. 18, 8839–8852.
Wouterlood, F. G., Van Denderen, J. C., Blijleven, N., Van Minnen, J., andHartig., W. (1998). Two-laser dual-immunofluorescence confocal laserscanning microscopy using Cy2- and Cy5-conjugated secondary anti-bodies: Unequivocal detection of colocalization of neuronal markers.Brain Res. Protocols 2, 149–159.
Yuste, R., and Katz, L. C. (1991). Control of postsynaptic Ca2+ influx indeveloping neocortex by excitatory and inhibitory neurotransmitters.Neuron 6, 333–344.
Yuste, R., Peinado, A., and Katz, L. C. (1992). Neuronal domains in devel-oping neocortex. Science 257, 665–669.
Yuste, R., Lanni, F., and Konnerth, A., eds. (1999a). “Imaging Neurons: ALaboratory Manual.” Cold Spring Harbor Laboratory Press, Cold SpringHarbor, NY.
Yuste, R., Majewska, A., Cash, S. S., and Denk, W. (1999b). Mechanismsof calcium influx into hippocampal spines: Heterogeneity among spines,coincidence detection by NMDA receptors, and optical quantal analysis.J. Neurosci. 19, 1976–1987.
Zhuo, L., Sun, B., Zhang, C. L., Fine, A., Chiu, S. Y., and Messing, A.(1997). Live astrocytes visualized by green fluorescent protein in trans-genic mice. Dev. Biol. 187, 36–42.
Ziv, N., and Smith, S. J. (1996). Evidence for a role of dendritic filopodiain synaptogenesis and spine formation. Neuron 17, 91–102.
76 II Surface-Based Data Acquisition
BM2e-03(47-76) 24.05.02 16:18 Page 76