Optical Coherence Tomography (OCT) The OCT in Retina...
21
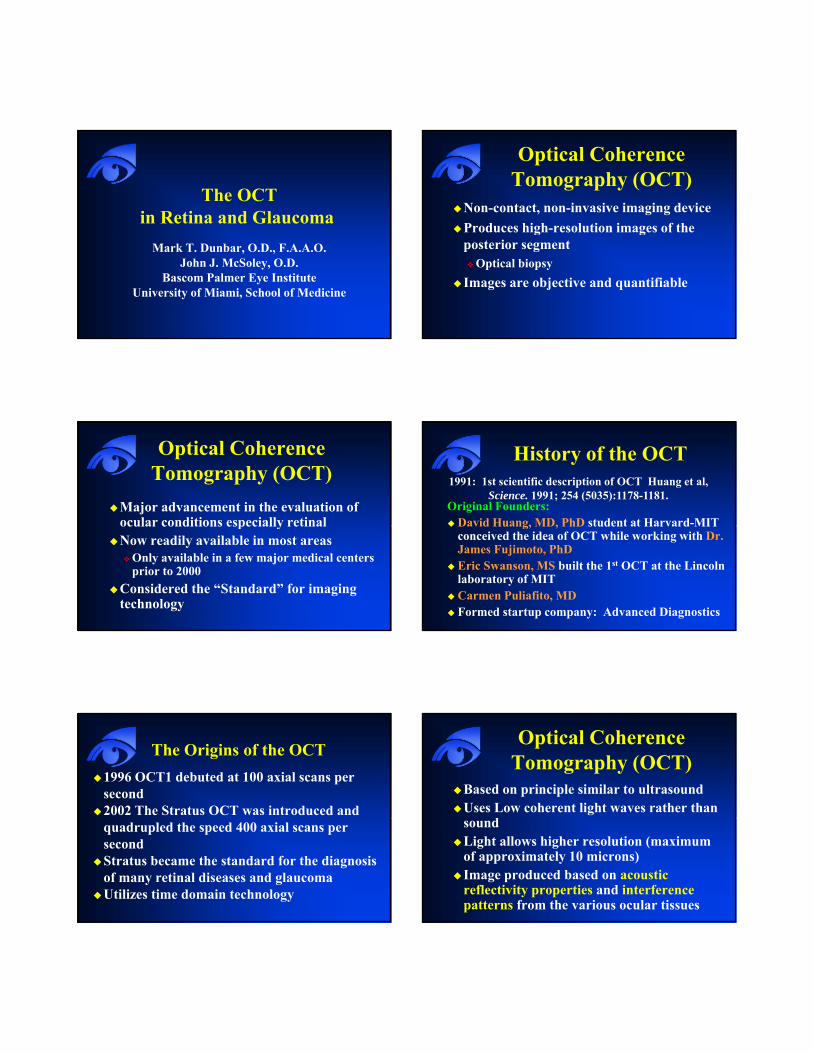
The OCT in Retina and Glaucoma Mark T. Dunbar, O.D., F.A.A.O. John J. McSoley, O.D. Bascom Palmer Eye Institute University of Miami, School of Medicine Optical Coherence Tomography (OCT) Non-contact, non-invasive imaging device Produces high-resolution images of the posterior segment Optical biopsy Images are objective and quantifiable Optical Coherence Tomography (OCT) Major advancement in the evaluation of ocular conditions especially retinal ocular conditions especially retinal Now readily available in most areas Only available in a few major medical centers prior to 2000 Considered the “Standard” for imaging technology History of the OCT Original Founders: David Huang, MD, PhD student at Harvard-MIT 1991: 1st scientific description of OCT Huang et al, Science. 1991; 254 (5035):1178-1181. David Huang, MD, PhD student at Harvard MIT conceived the idea of OCT while working with Dr. James Fujimoto, PhD Eric Swanson, MS built the 1 st OCT at the Lincoln laboratory of MIT Carmen Puliafito, MD Formed startup company: Advanced Diagnostics The Origins of the OCT 1996 OCT1 debuted at 100 axial scans per second 2002 The Stratus OCT was introduced and quadrupled the speed 400 axial scans per second Stratus became the standard for the diagnosis of many retinal diseases and glaucoma Utilizes time domain technology Optical Coherence Tomography (OCT) Based on principle similar to ultrasound Uses Low coherent light waves rather than sound Light allows higher resolution (maximum of approximately 10 microns) Image produced based on acoustic reflectivity properties and interference patterns from the various ocular tissues
Transcript of Optical Coherence Tomography (OCT) The OCT in Retina...
The OCT in Retina and Glaucoma
Mark T. Dunbar, O.D., F.A.A.O.John J. McSoley, O.D.
Bascom Palmer Eye InstituteUniversity of Miami, School of Medicine
Optical Coherence Tomography (OCT)
Non-contact, non-invasive imaging deviceProduces high-resolution images of the g gposterior segment
Optical biopsy Images are objective and quantifiable
Optical Coherence Tomography (OCT)
Major advancement in the evaluation of ocular conditions especially retinalocular conditions especially retinalNow readily available in most areas
Only available in a few major medical centers prior to 2000
Considered the “Standard” for imaging technology
History of the OCT
Original Founders:David Huang, MD, PhD student at Harvard-MIT
1991: 1st scientific description of OCT Huang et al, Science. 1991; 254 (5035):1178-1181.
David Huang, MD, PhD student at Harvard MIT conceived the idea of OCT while working with Dr. James Fujimoto, PhDEric Swanson, MS built the 1st OCT at the Lincoln laboratory of MITCarmen Puliafito, MDFormed startup company: Advanced Diagnostics
The Origins of the OCT1996 OCT1 debuted at 100 axial scans per second 2002 The Stratus OCT was introduced and quadrupled the speed 400 axial scans per secondStratus became the standard for the diagnosis of many retinal diseases and glaucomaUtilizes time domain technology
Optical Coherence Tomography (OCT)
Based on principle similar to ultrasoundUses Low coherent light waves rather than soundLight allows higher resolution (maximum of approximately 10 microns)Image produced based on acoustic reflectivity properties and interference patterns from the various ocular tissues
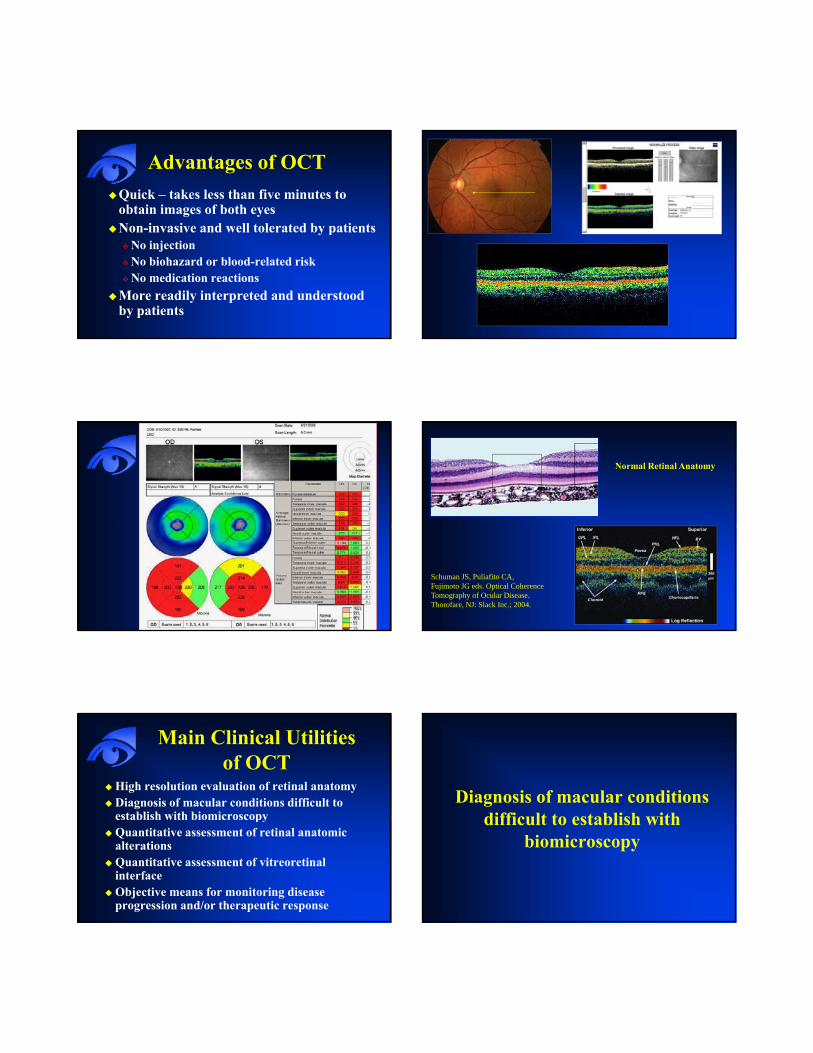
Advantages of OCTQuick – takes less than five minutes to obtain images of both eyesNon-invasive and well tolerated by patientsy p
No injection No biohazard or blood-related riskNo medication reactions
More readily interpreted and understood by patients
Normal Retinal Anatomy
Schuman JS, Puliafito CA, Fujimoto JG eds. Optical Coherence Tomography of Ocular Disease. Thorofare, NJ: Slack Inc.; 2004.
Main Clinical Utilities of OCT
High resolution evaluation of retinal anatomyDiagnosis of macular conditions difficult to establish with biomicroscopyestablish with biomicroscopyQuantitative assessment of retinal anatomic alterationsQuantitative assessment of vitreoretinal interfaceObjective means for monitoring disease progression and/or therapeutic response
Diagnosis of macular conditions difficult to establish withdifficult to establish with
biomicroscopy
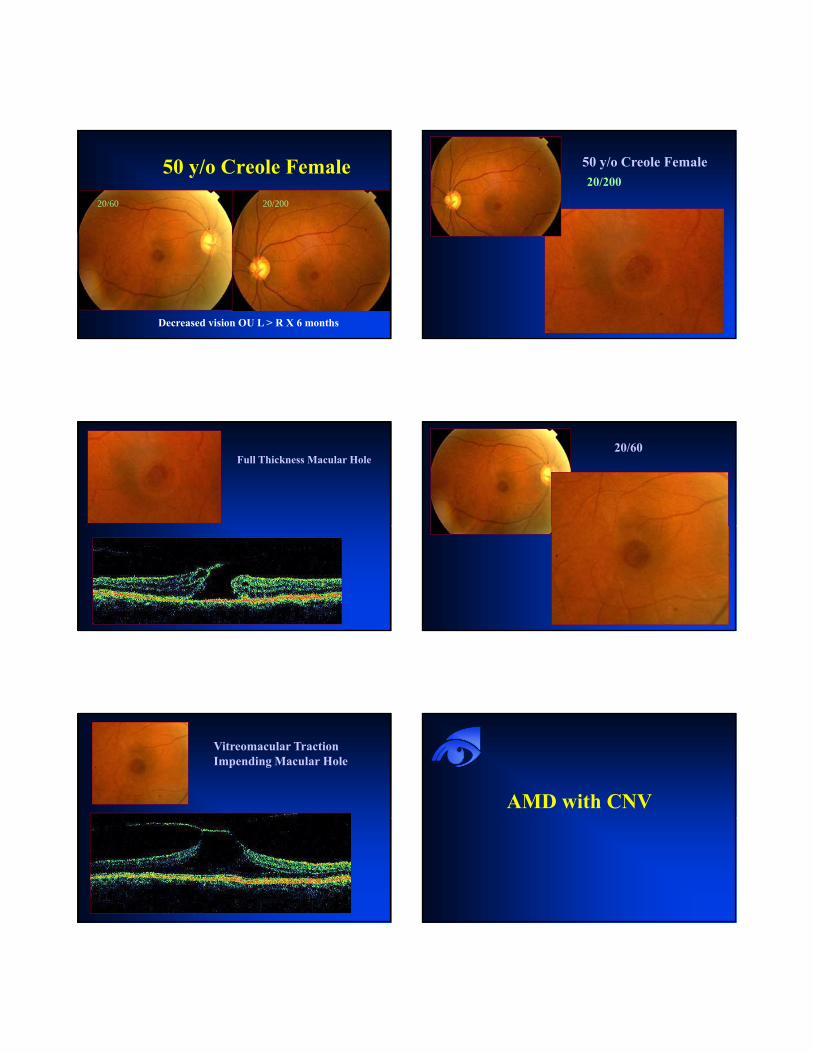
50 y/o Creole Female20/60 20/200
Decreased vision OU L > R X 6 months
50 y/o Creole Female20/200
Full Thickness Macular Hole20/60
Vitreomacular TractionImpending Macular Hole
AMD with CNV
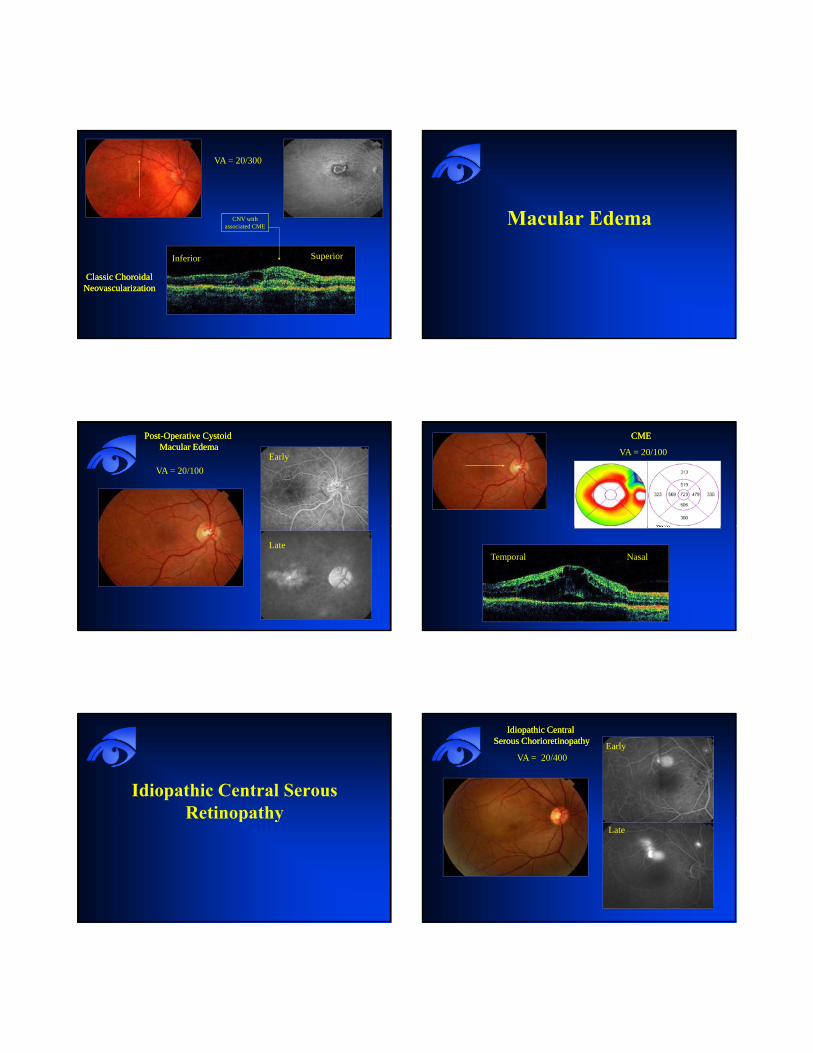
CNV with associated CME
VA = 20/300
Inferior Superior
Classic Choroidal Classic Choroidal NeovascularizationNeovascularization
Macular Edema
VA = 20/100
PostPost--Operative Cystoid Operative Cystoid Macular EdemaMacular Edema
Early
Late
CMECME
VA = 20/100
NasalTemporal
Idiopathic Central Serous RetinopathyRetinopathy
VA = 20/400
Idiopathic Central Idiopathic Central Serous ChorioretinopathySerous Chorioretinopathy Early
Late

VA = 20/400ICSC
Inferior Superior
Breakthroughs with OCT
It has redefined our understanding of the
Provided New Perspectives in the Understanding of Vitreoretinal Macular Disease
It has redefined our understanding of the pathogenesis of macular hole formation and Expanded the spectrum of vitreomacular traction
Idiopathic Macular HolesFemales 70%6th to 7th decadeNo predisposingNo predisposing factorsBlurred VAMetamorphopsiaDevelops from perifoveal vitreous detachment Macular Hole Formation (Arch Ophthalmol. 1999;117:744-
751)
Stages of Macular Holes

Stages of Macular Holes
I: Pseudocyst associated with traction0: Stage “0” macular hole
IA: Yellow spot or ring in maculaIB: Loss of foveal depression
II: Partial tear in the sensory retinaIII: Full thickness macular holeIV: Macular hole with PVD
Vitreomacular TractionOriginally described as a “syndrome”Incomplete or partial PVD at the ONResults in traction at the maculaResults in traction at the macula
Often in a “dumbbell” shaped configurationProduces macular edema – CMENecessitates pars plana vitrectomyRare Smiddy, Green, Michaels AJO, 1989
Vitreomacular Tractionin the Era of OCT
Not rare!A group of disorders caused by incomplete PVDLeads to persistent traction on the macula Produces in most cases CME and decreased visual acuityCan be idiopathicCan occur with ERM and macular hole
Optical Coherence Tomography (OCT)
Greatly enhances our ability to identify vitreomacular traction
R i h l fRepresents traction at the macula from incomplete PVDVMT is more common than previously suspected
Improved understanding of the pathogenesis of macular holesExcellent clinical tool for the evaluation and management of these conditions
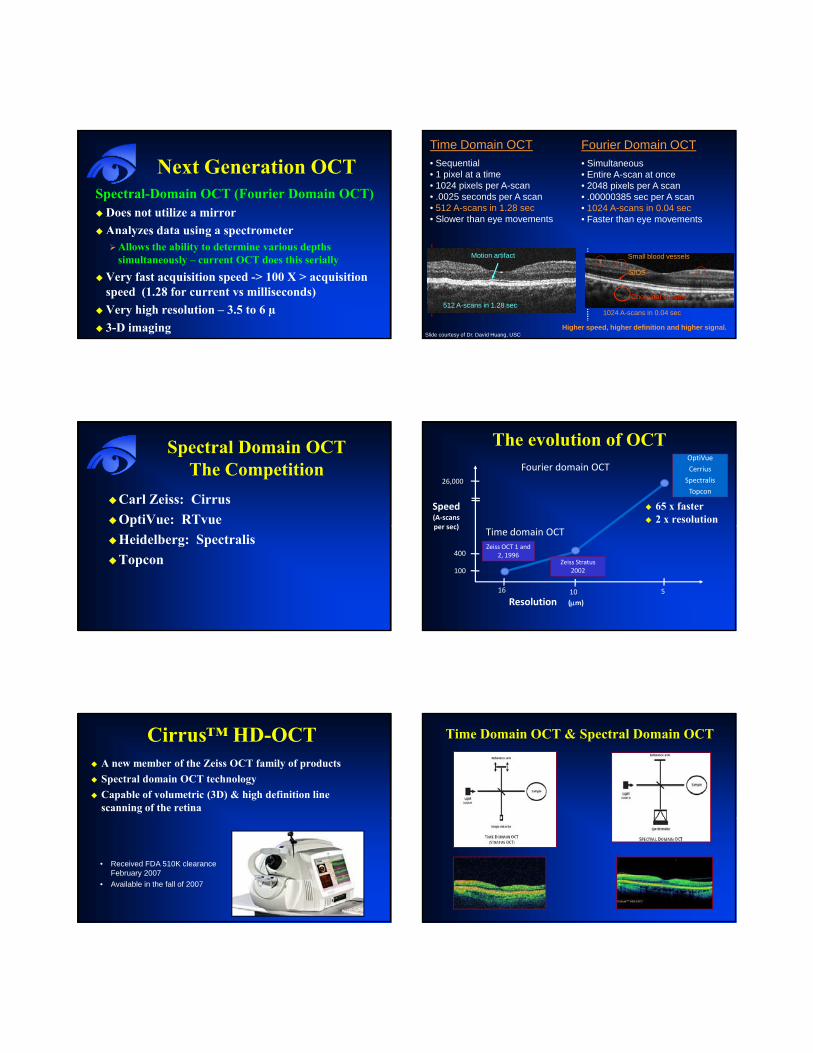
Next Generation OCTSpectral-Domain OCT (Fourier Domain OCT)
Does not utilize a mirror Analyzes data using a spectrometery es d us g spec o e e
Allows the ability to determine various depths simultaneously – current OCT does this serially
Very fast acquisition speed -> 100 X > acquisition speed (1.28 for current vs milliseconds)Very high resolution – 3.5 to 6 µ3-D imaging
Fourier Domain OCT• Simultaneous• Entire A-scan at once• 2048 pixels per A scan• .00000385 sec per A scan• 1024 A-scans in 0.04 sec• Faster than eye movements
Time Domain OCT• Sequential• 1 pixel at a time• 1024 pixels per A-scan• .0025 seconds per A scan• 512 A-scans in 1.28 sec• Slower than eye movements
512 A-scans in 1.28 sec
Motion artifact
Higher speed, higher definition and higher signal.
1024 A-scans in 0.04 sec
Small blood vessels
IS/OS
Choroidal vessels
Slide courtesy of Dr. David Huang, USC
Spectral Domain OCTThe Competition
Carl Zeiss: CirrusOptiVue: RTvuepHeidelberg: SpectralisTopcon
The evolution of OCT
65 x faster2 x resolution
OptiVue
Cerrius
Spectralis
Topcon26,000
Speed(A‐scansper sec)
Fourier domain OCT
Zeiss OCT 1 and 2, 1996
Zeiss Stratus 2002
400
100
16 10 5
per sec)
Resolution (μm)
Time domain OCT
Cirrus™ HD-OCTA new member of the Zeiss OCT family of products Spectral domain OCT technologyCapable of volumetric (3D) & high definition line scanning of the retina
• Received FDA 510K clearance February 2007
• Available in the fall of 2007
Time Domain OCT & Spectral Domain OCT
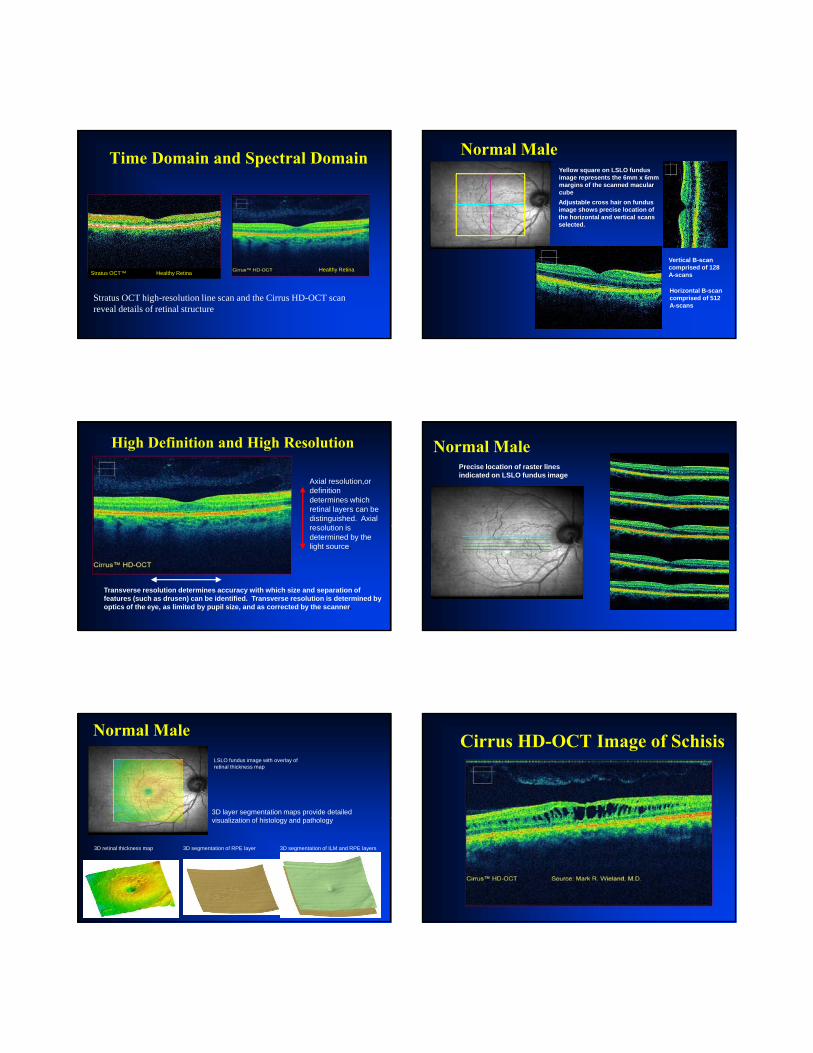
Time Domain and Spectral Domain
Stratus OCT™ Healthy Retina
Stratus OCT high-resolution line scan and the Cirrus HD-OCT scan reveal details of retinal structure
Healthy Retina
Normal MaleYellow square on LSLO fundus image represents the 6mm x 6mm margins of the scanned macular cubeAdjustable cross hair on fundus image shows precise location of the horizontal and vertical scans selected.
Vertical B-scan comprised of 128 A-scans
Horizontal B-scan comprised of 512 A-scans
High Definition and High Resolution
Axial resolution,or definition determines which retinal layers can be distinguished. Axial
l ti iresolution is determined by the light source.
Transverse resolution determines accuracy with which size and separation of features (such as drusen) can be identified. Transverse resolution is determined by optics of the eye, as limited by pupil size, and as corrected by the scanner.
Normal MalePrecise location of raster lines indicated on LSLO fundus image
Normal Male
3D layer segmentation maps provide detailed i li i f hi l d h l
LSLO fundus image with overlay of retinal thickness map
visualization of histology and pathology
3D segmentation of ILM and RPE layers3D segmentation of RPE layer3D retinal thickness map
Cirrus HD-OCT Image of Schisis
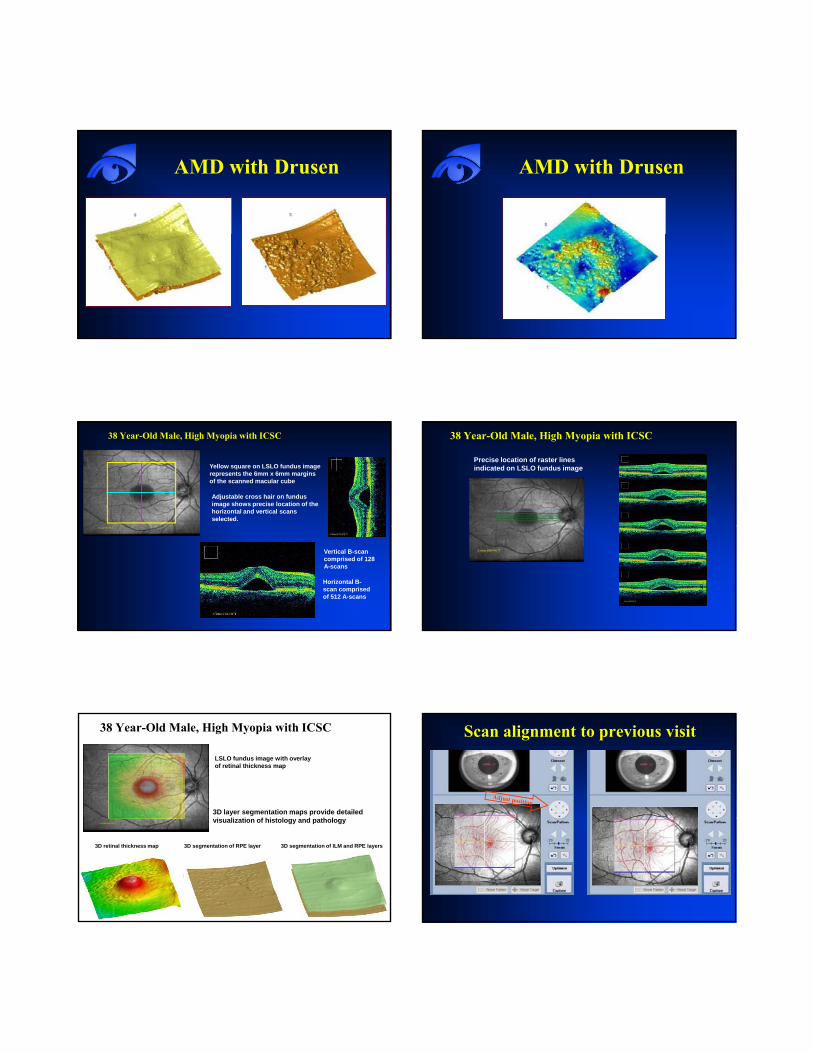
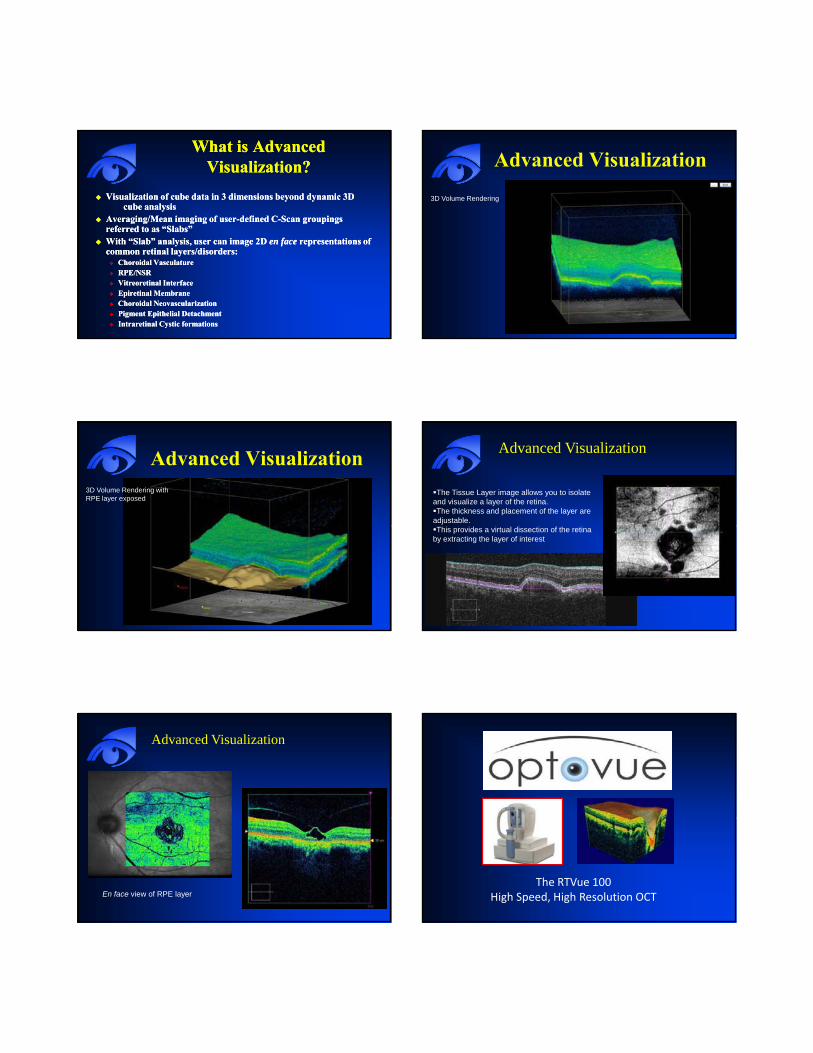
AMD with Drusen AMD with Drusen
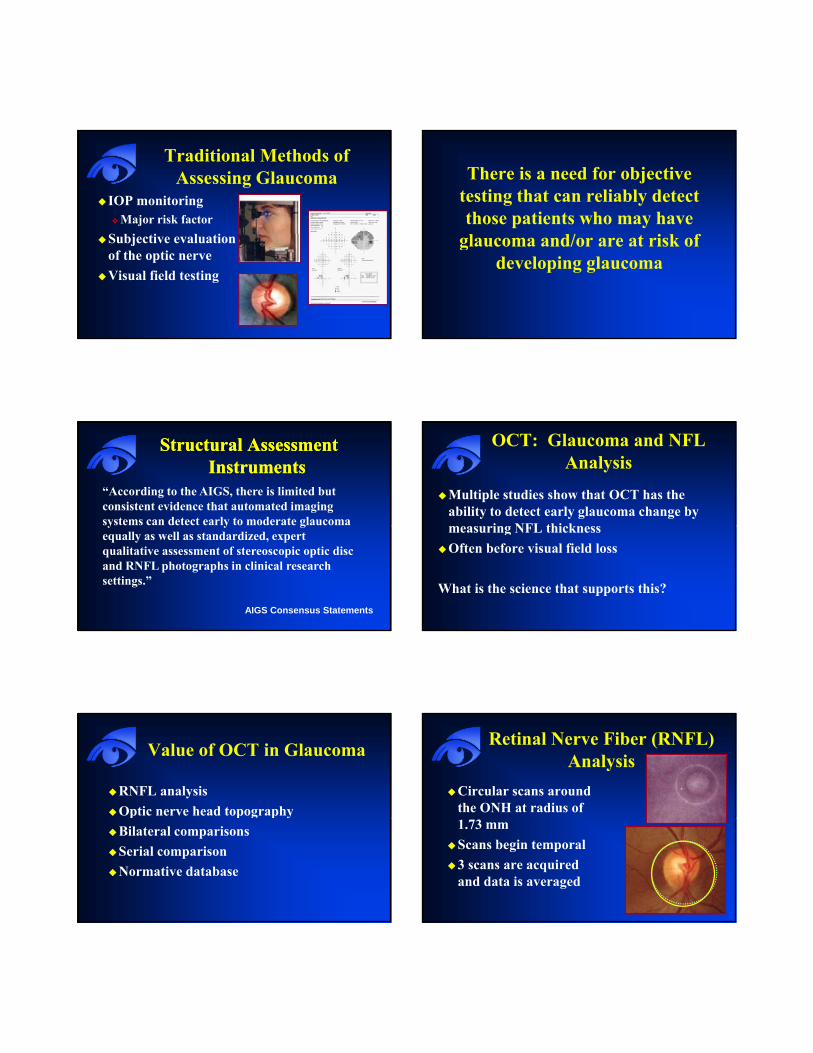
38 Year-Old Male, High Myopia with ICSC
Yellow square on LSLO fundus image represents the 6mm x 6mm margins of the scanned macular cube
Adjustable cross hair on fundus image shows precise location of the horizontal and vertical scans selected.
Vertical B-scan comprised of 128 A-scans
Horizontal B-scan comprised of 512 A-scans
Precise location of raster lines indicated on LSLO fundus image
38 Year-Old Male, High Myopia with ICSC
LSLO fundus image with overlay of retinal thickness map
3D layer segmentation maps provide detailed i li i f hi l d h l
38 Year-Old Male, High Myopia with ICSC
visualization of histology and pathology
3D segmentation of ILM and RPE layers3D segmentation of RPE layer3D retinal thickness map
Scan alignment to previous visit
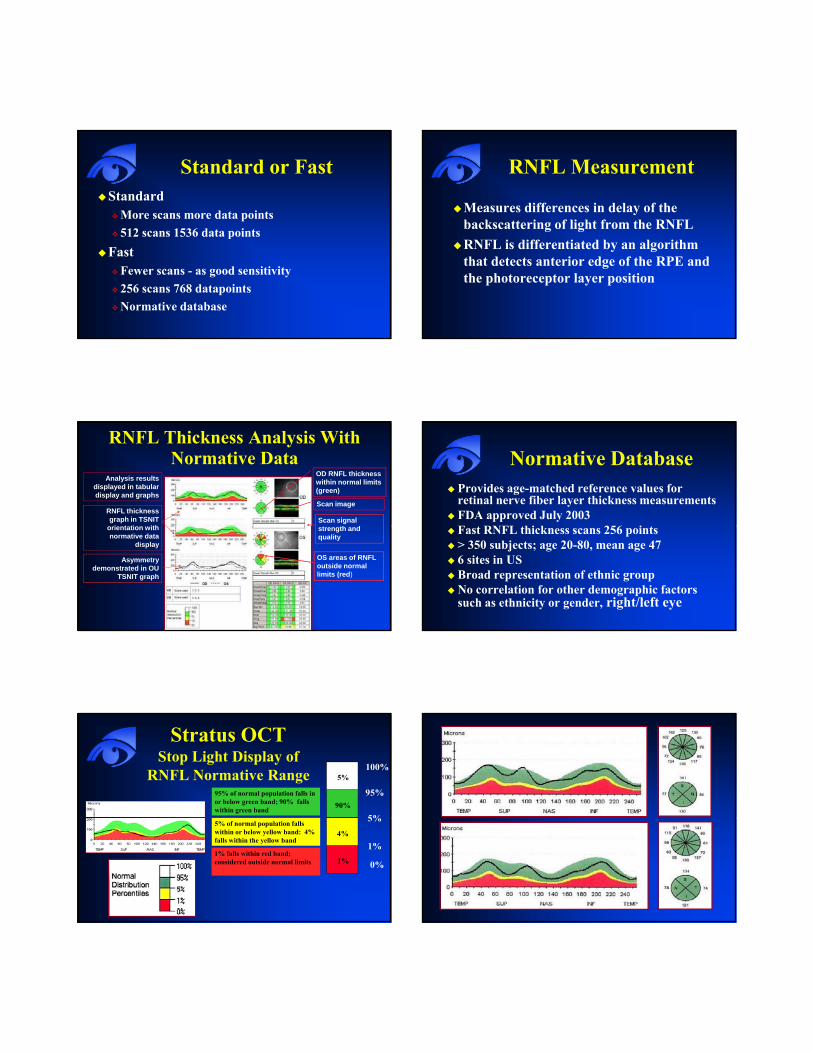
What is Advanced What is Advanced Visualization?Visualization?
Visualization of cube data in 3 dimensions beyond dynamic 3D Visualization of cube data in 3 dimensions beyond dynamic 3D cube analysiscube analysis
Averaging/Mean imaging of userAveraging/Mean imaging of user--defined Cdefined C--Scan groupings Scan groupings referred to as “Slabs”referred to as “Slabs”With “Slab” analysis, user can image 2D With “Slab” analysis, user can image 2D en faceen face representations of representations of common retinal layers/disorders:common retinal layers/disorders:
Choroidal VasculatureChoroidal VasculatureRPE/NSRRPE/NSRVitreoretinal InterfaceVitreoretinal InterfaceEpiretinal MembraneEpiretinal MembraneChoroidal NeovascularizationChoroidal NeovascularizationPigment Epithelial DetachmentPigment Epithelial DetachmentIntraretinal Cystic formationsIntraretinal Cystic formations
Advanced Visualization3D Volume Rendering
Advanced Visualization3D Volume Rendering with RPE layer exposed
Advanced Visualization
The Tissue Layer image allows you to isolate and visualize a layer of the retina. The thickness and placement of the layer are
adjustable. This provides a virtual dissection of the retina
by extracting the layer of interest
Advanced Visualization
En face view of RPE layer The RTVue 100
High Speed, High Resolution OCT

Fourier Domain OCT – RTVue 100•Optical Coherence Tomography provides cross sectional imaging of the retina
•Spectrometry and Fourier Domain th d ll hi h d d t tmethods allow high speed data capture
(26,000 A scans per second)
•Broad-band light source provides high depth resolution (5 microns)
High Speed allows 3-D scanning
B-scans provide high resolution detail Macula thickness map reveals edema
Cystoid Macula Edema
Courtesy: Michael Turano, CRAColumbia University.
Courtesy: Michael Turano, CRAColumbia University.
Classic CNV
horizontalhorizontal verticalvertical
Images courtesy of Dr. Tano, Osaka University

Spectralis™
HRA+OCT
The Fusion of Imaging TechnologiesThe Fusion of Imaging Technologies
SPECTRALIS TechnologyCombined confocal scanning laserophthalmoscope and spectral domain OCTBuilt on a fundus imaging platformBuilt on a fundus imaging platformCombines high resolution cSLO C-scan with high resolution SD-OCT B-scanScans with TruTrack™ Eye TrackingIncorporates Heidelberg Noise Reduction™
Eye Tracking using TruTrack®
Scan tracks with eyeScan does not follow eye
Eye Tracking Stops 3D Motion Artifact
Without Eye Tracker With Eye Tracker
Artificial ripples due to eye movements True anatomic structure
Topcon 3D-OCTNo glaucoma data base
OCT in Glaucoma
Traditional Methods of Assessing Glaucoma
IOP monitoringMajor risk factor
S bj ti l tiSubjective evaluation of the optic nerveVisual field testing
There is a need for objective testing that can reliably detect those patients who may have l d/ i k fglaucoma and/or are at risk of
developing glaucoma
Structural Assessment Structural Assessment InstrumentsInstruments
“According to the AIGS, there is limited but consistent evidence that automated imaging systems can detect early to moderate glaucoma y y gequally as well as standardized, expert qualitative assessment of stereoscopic optic disc and RNFL photographs in clinical research settings.”
AIGS Consensus Statements
OCT: Glaucoma and NFL Analysis
Multiple studies show that OCT has the ability to detect early glaucoma change by meas ring NFL thicknessmeasuring NFL thicknessOften before visual field loss
What is the science that supports this?
Value of OCT in Glaucoma
RNFL analysisOptic nerve head topographyp p g p yBilateral comparisons Serial comparisonNormative database
Retinal Nerve Fiber (RNFL) Analysis
Circular scans around the ONH at radius of 1.73 mmScans begin temporal3 scans are acquired and data is averaged
Standard or FastStandard
More scans more data points512 scans 1536 data points512 scans 1536 data points
Fast Fewer scans - as good sensitivity256 scans 768 datapointsNormative database
RNFL Measurement
Measures differences in delay of the backscattering of light from the RNFLRNFL is differentiated by an algorithm that detects anterior edge of the RPE and the photoreceptor layer position
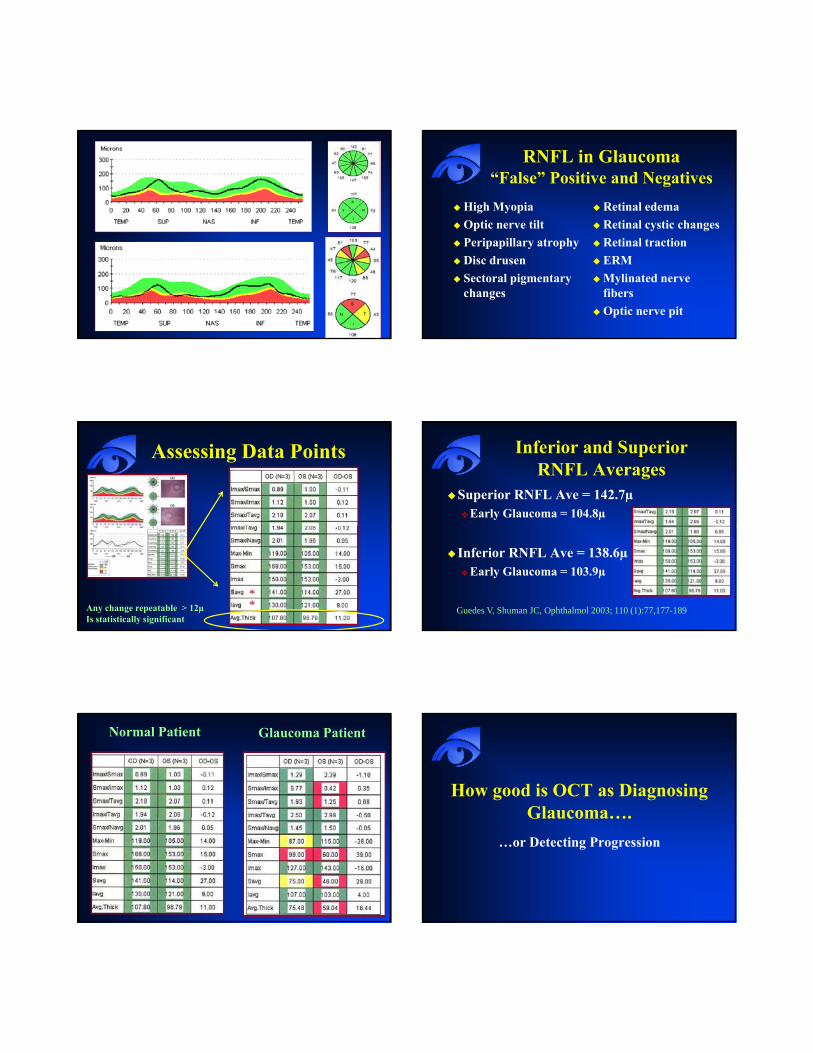
RNFL Thickness Analysis With Normative Data
Analysis results displayed in tabular display and graphs
OD RNFL thickness within normal limits (green)
RNFL thickness graph in TSNIT
i t ti ithScan signal
h d
Scan image
orientation with normative data
display
Asymmetry demonstrated in OU
TSNIT graph
strength and quality
OS areas of RNFLoutside normal limits (red)
Normative DatabaseProvides age-matched reference values for retinal nerve fiber layer thickness measurementsFDA approved July 2003F RNFL hi k 256 iFast RNFL thickness scans 256 points> 350 subjects; age 20-80, mean age 476 sites in USBroad representation of ethnic groupNo correlation for other demographic factors such as ethnicity or gender, right/left eye
Stratus OCT Stop Light Display of
RNFL Normative Range 100%
95%
5%90%
5%
95% of normal population falls in or below green band; 90% falls within green band
1%
0%
5%
1%
4%5% of normal population falls within or below yellow band: 4% falls within the yellow band
1% falls within red band; considered outside normal limits
RNFL in Glaucoma“False” Positive and Negatives
High MyopiaOptic nerve tilt
Retinal edemaRetinal cystic changes
Peripapillary atrophyDisc drusenSectoral pigmentary changes
Retinal tractionERMMylinated nerve fibersOptic nerve pit
Assessing Data Points
Any change repeatable > 12µIs statistically significant
**
Inferior and SuperiorRNFL Averages
Superior RNFL Ave = 142.7µEarly Glaucoma = 104.8µ
Inferior RNFL Ave = 138.6µEarly Glaucoma = 103.9µ
Guedes V, Shuman JC, Ophthalmol 2003; 110 (1):77,177-189
Normal Patient Glaucoma Patient
How good is OCT as Diagnosing Glaucoma….Glaucoma….
…or Detecting Progression
RNFL Sensitivity and Specificity of the OCT for Diagnosing Glaucoma
109 normal and 63 glaucoma subjects18 mild, 21 moderate, 24 severe (VF)
Budenz et al Ophthalmology. January 2005;112:3-9
Avg RNFL < 5% 84% sensitivity; 98% specificity1 or more quad <5% 89%, 95%1 or more clock hours <5% 89, 92%Inferior and superior sectors and quadrants better than others
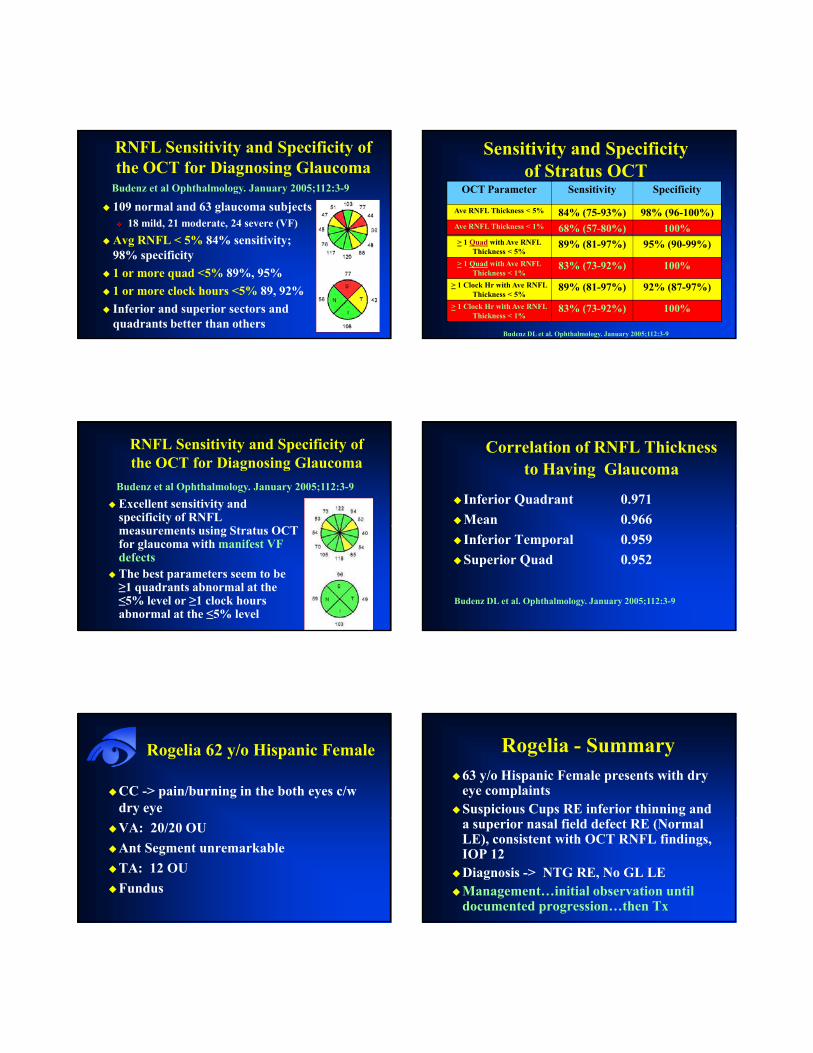
Sensitivity and Specificityof Stratus OCT
OCT Parameter Sensitivity Specificity
Ave RNFL Thickness < 5% 84% (75-93%) 98% (96-100%)Ave RNFL Thickness < 1% 68% (57-80%) 100%> 1 Quad with Ave RNFL
Thickness < 5%89% (81-97%) 95% (90-99%)
> 1 Quad with Ave RNFL Thickness < 1%
83% (73-92%) 100%
> 1 Clock Hr with Ave RNFL Thickness < 5%
89% (81-97%) 92% (87-97%)
> 1 Clock Hr with Ave RNFL Thickness < 1%
83% (73-92%) 100%
Budenz DL et al. Ophthalmology. January 2005;112:3-9
RNFL Sensitivity and Specificity of the OCT for Diagnosing Glaucoma
Excellent sensitivity and specificity of RNFL
Budenz et al Ophthalmology. January 2005;112:3-9
measurements using Stratus OCT for glaucoma with manifest VF defectsThe best parameters seem to be ≥1 quadrants abnormal at the ≤5% level or ≥1 clock hours abnormal at the ≤5% level
Correlation of RNFL Thickness to Having Glaucoma
Inferior Quadrant 0.971Mean 0.966Inferior Temporal 0.959Superior Quad 0.952
Budenz DL et al. Ophthalmology. January 2005;112:3-9
Rogelia 62 y/o Hispanic Female
CC -> pain/burning in the both eyes c/w dry eyeVA: 20/20 OUAnt Segment unremarkableTA: 12 OUFundus
Rogelia - Summary63 y/o Hispanic Female presents with dry eye complaintsSuspicious Cups RE inferior thinning and a superior nasal field defect RE (Normal LE), consistent with OCT RNFL findings, IOP 12Diagnosis -> NTG RE, No GL LEManagement…initial observation until documented progression…then Tx
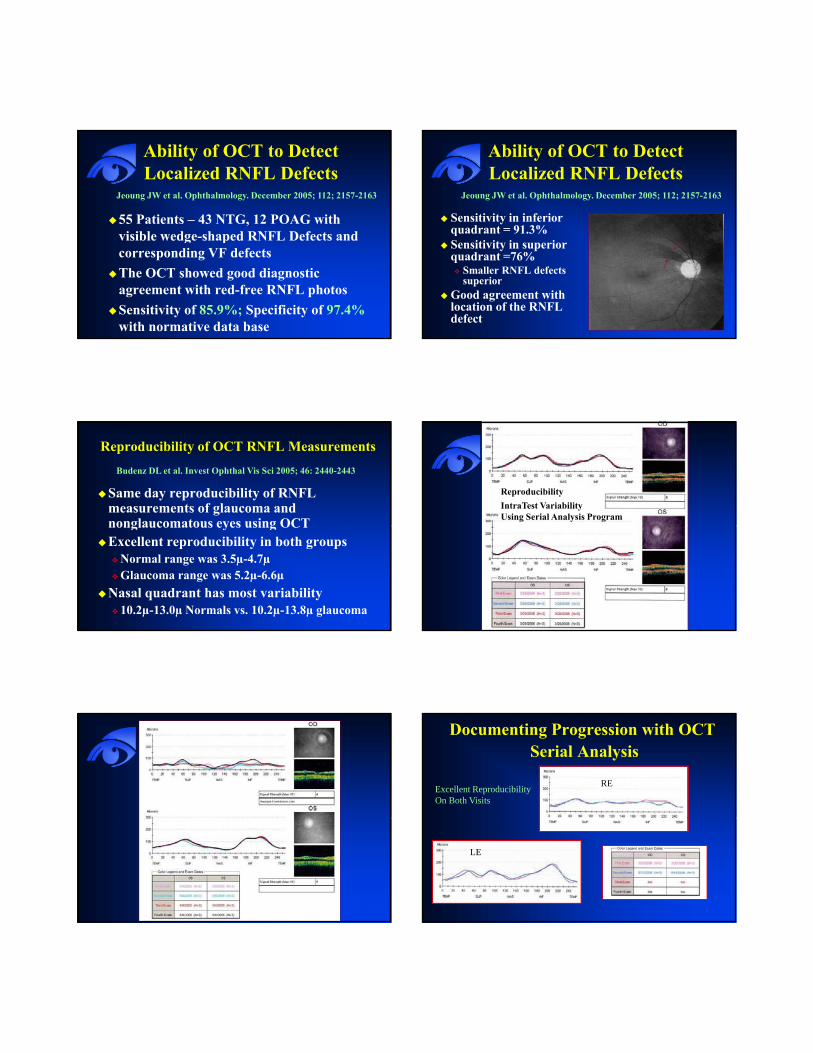
Ability of OCT to Detect Localized RNFL Defects
55 Patients – 43 NTG, 12 POAG with visible wedge shaped RNFL Defects and
Jeoung JW et al. Ophthalmology. December 2005; 112; 2157-2163
visible wedge-shaped RNFL Defects and corresponding VF defectsThe OCT showed good diagnostic agreement with red-free RNFL photos Sensitivity of 85.9%; Specificity of 97.4%with normative data base
Ability of OCT to Detect Localized RNFL Defects
Sensitivity in inferior quadrant = 91.3%
Jeoung JW et al. Ophthalmology. December 2005; 112; 2157-2163
qSensitivity in superior quadrant =76%
Smaller RNFL defects superior
Good agreement with location of the RNFL defect
Reproducibility of OCT RNFL Measurements
Same day reproducibility of RNFL measurements of glaucoma and nonglaucomatous eyes using OCT
Budenz DL et al. Invest Ophthal Vis Sci 2005; 46: 2440-2443
nonglaucomatous eyes using OCTExcellent reproducibility in both groups
Normal range was 3.5µ-4.7µGlaucoma range was 5.2µ-6.6µ
Nasal quadrant has most variability10.2µ-13.0µ Normals vs. 10.2µ-13.8µ glaucoma
IntraTest VariabilityUsing Serial Analysis Program
Reproducibility
Documenting Progression with OCTSerial Analysis
REExcellent ReproducibilityOn Both Visits
LE
Documenting Progression with OCTSerial Analysis
Sensitivity/Specificity Between Instruments
75 pts with glaucoma, 66 normals70% had early GL visual field loss
Medeiros FA et al. Arch of Ophthal 2004; 122:827
70% had early GL visual field lossNo Statistical difference b/w the 3 machines
Stratus OCT 0.92GDX 0.91HRT II 0.86
Agreement Between Instruments
OCT and GDX VCC: 89% agreementG CC 1%
Medeiros FA et al. Arch of Ophthal 2004; 122:827
GDX VCC HRT II: 81% agreementHRT II and OCT: 81% agreement
†HRT measures optic disc topography and provides indirect measurement of RNFL as a secondary
Cirrus™ HD-OCTSoftware Version 3.0
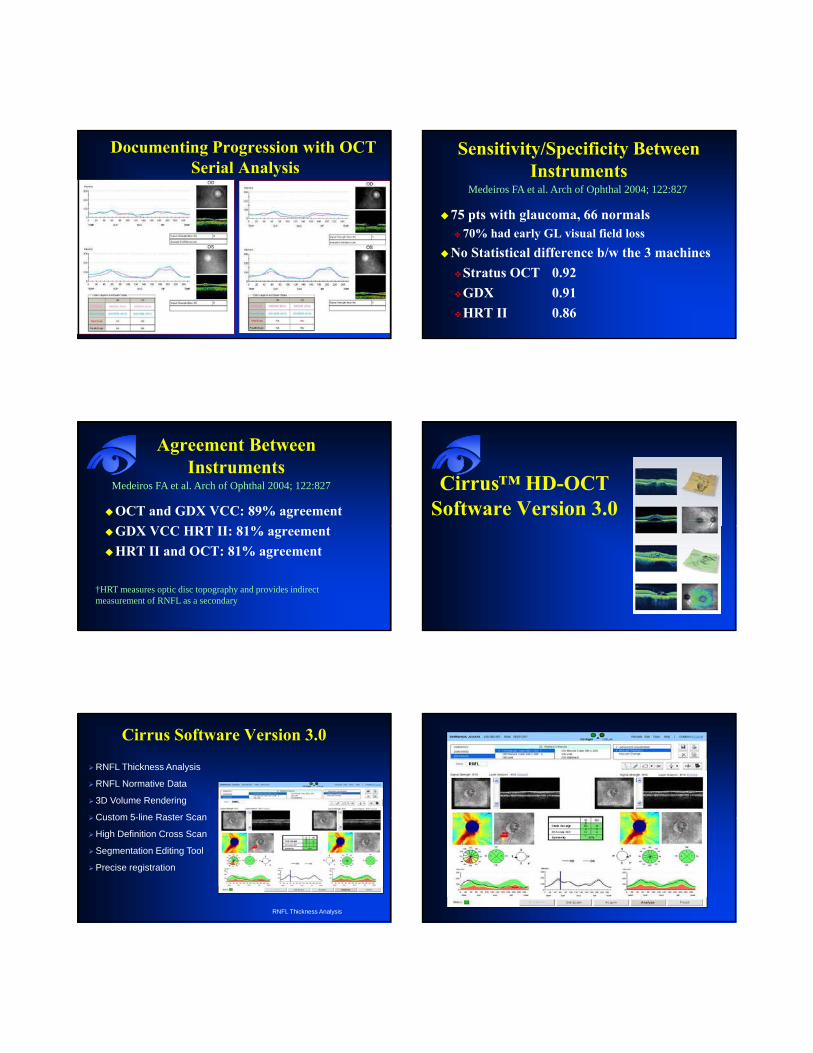
Cirrus Software Version 3.0
RNFL Thickness Analysis
RNFL Normative Data
3D Volume Rendering
Custom 5-line Raster ScanCustom 5-line Raster Scan
High Definition Cross Scan
Segmentation Editing Tool
Precise registration
RNFL Thickness Analysis

Glaucoma – RNFL Thickness AnalysisCenter of disc is automatically identified for precise registration and repeatabilityRNFL thickness display is of a 1.73mm radius circle around the discTSNIT graph is compared to normative database of about 300 patients
Glaucoma – RNFL Thickness AnalysisThe LSO fundus image is shown with an OCT fundus overlay. The red circle indicates the location of the RNFL TNSIT circle
The OCT image is a cross section of gthe TSNIT circle
RNFL thickness is displayed in graphic format and compared to normative data
Glaucoma – RNFL Thickness Analysis
The RNFL thickness map shows the patterns and thickness of the nerve fiber layer
The RNFL deviation map is overlaid on the OCT fundus image to illustrate precisely where RNFL thickness deviates from a normal range
Glaucoma – RNFL Thickness AnalysisAn OU analysis example (1)
Glaucoma – RNFL Thickness AnalysisAn OU analysis example (2)
Glaucoma Package gHeidelberg Spectralis

Basic Glaucoma - Circle Scan AnalysisSpectralis: Samples 1536 A-Scans vs. 256 with Cirrus and Stratus
Phase 1 Glaucoma Package
Posterior 30° Pole Analysis Posterior Pole Assessment
Full thicknessGrids correspond to VFHemisphere analysis
RTVue Glaucoma Package
Glaucoma Analysis with the RTVue: Nerve Head Map
Provides
• Cup Area• Rim Area• RNFL Map
16 sector analysis compares sector values to normative database and color codes result based on probability values (p values)
RNFL Map
TSNIT graph
Color shaded regions represent normative database ranges based on p‐values

Glaucoma Analysis with the RTVue: Nerve Head Map Parameters
RNFL Parameters Optic Disc Parameters
All parameters color‐coded based on comparison to normative database
The ganglion cell complex (ILM – IPL)Inner retinal layers provide complete Ganglion cell assessment:
• Nerve fiber layer (g‐cell axons)• Ganglion cell layer (g-cell body)• Inner plexiform layer (g-cell dendrites)Inner plexiform layer (g cell dendrites)
Images courtesy of Dr. Ou Tan, USC
Early Glaucoma
OS Normal
Borderline Sector results in Superior-temporal region
Ab l OS NormalAbnormal parameters
TSNIT dips below normal
TSNIT shows significant Asymmetry
GCC Analysis may detect damage before RNFL
GCC and RNFL analysis will be correlated, however GCC analysis may be more sensitive for detecting early damage
OCT Glaucoma SummaryOCT is able to accurately detected early glaucoma with good reliabilityAlso very good with already established
lglaucomaDetermining same day reliability is critical
Corroborate your findingsTo be to accurately utilize serial analysis in future scans
OCT is as good as other ON imaging devices
OCT Retina: Summary“New” technology allows for cross-sectional imaging of retina structuresAllows detailed imaging of retinal pathologyAllows detailed imaging of retinal pathologyRedefined our understanding of a number of disease processes The next generation of imaging - Spectral-Domain OCT is already here