Opportunity - Scotiabank€¦ · Financial Performance Actual vs. Target Earnings per share (EPS)...
141
Opportunity… 2005 ANNUAL REPORT
Transcript of Opportunity - Scotiabank€¦ · Financial Performance Actual vs. Target Earnings per share (EPS)...

Opportunity…
2 0 0 5 A N N U A L R E P O R T

means the world to us.

Financial Highlights
As at and for the years ended October 31 2005 2004 2003 2002(1) 2001
Operating results ($ millions)
Net interest income(2) (TEB(3)) 6,197 5,975 6,246 6,785 6,294Total revenue(2) (TEB(3)) 10,726 10,295 10,261 10,727 10,365Provision for credit losses 230 390 893 2,029 1,425Non-interest expenses 6,043 5,862 5,731 5,974 5,662Provision for income taxes(2) (TEB(3)) 1,173 1,060 1,055 862 1,099Net income(2) 3,209 2,908 2,422 1,708 2,077Net income available to common shareholders 3,184 2,892 2,406 1,692 2,061
Operating performanceBasic earnings per share(4) ($) 3.19 2.87 2.38 1.68 2.06Diluted earnings per share(4) ($) 3.15 2.82 2.34 1.65 2.02Return on equity (%) 20.9 19.9 17.6 13.0 17.3Productivity ratio(2) (%) (TEB(3)) 56.3 56.9 55.9 55.7 54.6Net interest margin on total average assets(2) (%) (TEB(3)) 2.00 2.10 2.16 2.29 2.32
Balance sheet information ($ millions)
Cash resources and securities 93,964 75,928 83,773 76,467 73,444Loans and acceptances 198,581 178,854 178,478 194,070 184,733Total assets 314,025 279,212 285,892 296,380 284,425Deposits 217,445 195,196 192,672 195,618 186,195Preferred shares(2) 600 300 300 300 300Common shareholders’ equity 15,482 14,685 13,814 13,502 12,833Assets under administration 171,392 156,800 161,974 144,433 153,110Assets under management 26,630 21,225 19,964 21,472 21,942
Capital measures (%)
Tier 1 capital ratio 11.1 11.5 10.8 9.9 9.3Total capital ratio 13.2 13.9 13.2 12.7 13.0Common equity to risk-weighted assets 9.7 9.9 9.2 8.6 8.1Tangible common equity to risk-weighted assets(5) 9.3 9.7 8.9 8.3 7.8Risk-weighted assets ($ millions) 162,799 150,549 154,523 165,417 164,755
Credit qualityNet impaired loans(6) ($ millions) 681 879 1,522 2,095 1,734General allowance for credit losses ($ millions) 1,330 1,375 1,475 1,475 1,475Net impaired loans as a % of loans and acceptances(6) 0.34 0.49 0.85 1.08 0.94Specific provision for credit losses as a % of average
loans and acceptances 0.14 0.27 0.48 1.05 0.68
Common share informationShare price(4) ($)
High 44.22 40.00 33.70 28.10 25.25Low 36.41 31.08 22.28 21.01 18.65Close 42.99 39.60 32.74 22.94 21.93
Shares outstanding(4) (millions)
Average – Basic 998 1,010 1,010 1,009 1,001Average – Diluted 1,012 1,026 1,026 1,026 1,018End of period 990 1,009 1,011 1,008 1,008
Dividends per share(4) ($) 1.32 1.10 0.84 0.73 0.62Dividend yield (%) 3.3 3.1 3.0 3.0 2.8Dividend payout ratio(7) (%) 41.4 38.4 35.3 43.2 30.1Market capitalization ($ millions) 42,568 39,937 33,085 23,129 22,091Book value per common share(4) ($) 15.64 14.56 13.67 13.39 12.74Market value to book value multiple 2.7 2.7 2.4 1.7 1.7Price to earnings multiple (trailing 4 quarters) 13.5 13.8 13.8 13.7 10.6
Other informationEmployees 46,631 43,928 43,986 44,633 46,804Branches and offices 1,959 1,871 1,850 1,847 2,005
(1) In 2002, the Bank incurred a charge of $540 million (after tax) on the disposal of Scotiabank Quilmes. This reduced earnings per share by $0.53 and return on equity by360 basis points.
(2) Comparative amounts have been retroactively restated for new CICA accounting requirements relating to the distinction between equity and liability instruments.(3) Taxable equivalent basis. Refer to the non-GAAP measures on page 33.(4) Amounts have been retroactively adjusted to reflect the stock dividend paid April 28, 2004, of one common share for each issued and outstanding common share. The
stock dividend had the same effect as a two-for-one stock split.(5) Represents common shareholders’ equity and non-controlling interest in the common equity of operating subsidiaries, less goodwill and intangible assets, as a percentage
of risk-weighted assets.(6) Net impaired loans are impaired loans less the specific allowance for credit losses.(7) Represents common dividends for the period as a percentage of the net income available to common shareholders for the period.

Financial Performance Actual vs. Target
Earnings per share (EPS)
Generate growth in earnings per common share of:EPS is the net income a company has generated per common share. It is calculated bydividing net income available to common shareholders by the average number of dilutedcommon shares outstanding.
Return on equity (ROE)
Earn a return on equity of:ROE measures how well the Bank is using common shareholders’ invested money. It is calculated by
dividing net income available to common shareholders by average common shareholders’ equity.
17-20% 20.9%
5-10% 11.7%
Productivity
Maintain a productivity ratio of:The productivity ratio measures the overall efficiency of the Bank. It expresses non-interest
expenses as a percentage of the sum of net interest income (on a taxable equivalent basis)
and other income. A lower ratio indicates better productivity.
Below
58% 56.3%
11.1%Tier 1 capital
Tier 1 Capital Ratio:The Tier 1 capital ratio is a measure of the Bank’s overall strength. It is calculated by dividing Tier
1 capital by risk-weighted assets.
Maintain strong
capital ratios
Target
2005
Performance
$1.320.50
1.00
$ 1.50
01 02 03 04 05
10-year CAGR(2)
23%
2005
12%
0
100
200
300
400
500
600
700
800
900
95 97 99 01 03 05
Total return to common shareholders(1)
Dividends per common share
$3.151.50
2.00
2.50
3.00
$3.50
01 02 03 04 05
20.9%
13
16
19
22%
01 02 03 04 05
Return on equity
Earnings per share (diluted)
ScotiabankS&P/TSX Banks Total Return IndexS&P/TSX Composite Total Return Index
(1) Share price appreciaton plusdividends reinvested, 1995=100
(2) Compound annual growth rate
Excluding charges related to Argentina
Excluding charges related to Argentina

North AmericaCanadaMexicoUnited States
Caribbean and Central AmericaAnguillaAntigua and BarbudaArubaBahamasBarbadosBelizeBritish Virgin IslandsCayman IslandsCosta RicaDominicaDominican RepublicEl SalvadorGrenada
GuyanaHaitiJamaicaNetherlands Antilles
(St. Maarten,Curaçao, Bonaire and St. Eustatius)
PanamaPuerto RicoSt. Kitts and NevisSt. LuciaSt. Vincent and the
GrenadinesTrinidad and TobagoTurks and CaicosU.S. Virgin Islands
South AmericaArgentinaBrazilChilePeruVenezuela
Europe and Middle EastDubaiEgyptIrelandUnited Kingdom
Asia/PacificChinaHong Kong SAR, PRCIndiaJapanKorea (Republic of)MalaysiaSingaporeTaiwanThailandVietnam
Scotiabank is pursuing today’s global opportunities as the most international of Canada’s major banks.
Global presence (including affiliates)

Table of ContentsInside Front Cover Performance Highlights
2 Message from the Chairman of the Board
3 Message from the President and CEO
6 Our Executive Team
8 Corporate Governance
9 Board of Directors
Report on Business Lines
10 Overview
12 Domestic Banking
18 International Banking
24 Scotia Capital
29 Employees
Management’s Discussion and Analysis
32 Overview
34 Group Financial Performance
43 Group Financial Condition
51 Business Lines
59 Risk Management
71 Controls and Accounting Policies
76 Supplementary Data
90 Glossary
Consolidated Financial Statements
92 Management’s Responsibility for Financial Information
92 Shareholders’ Auditors’ Report
93 Consolidated Balance Sheet
94 Consolidated Statement of Income
95 Consolidated Statement of Changes in Shareholders’ Equity
96 Consolidated Statement of Cash Flows
97 Notes to the Consolidated Financial Statements
134 Shareholder Information
Cover: High-potential markets, such as El Salvador, offeropportunities for Scotiabank to expand, while helpingcustomers – including Salvadorean coffee grower Dymas
Ernesto Funes Hartmann, seen here with hisgrandson, Sebastian – grow their businessesand become financially better off.Photo

Scotiabank’s strong financial results in 2005 reflect
the continuing success of our strategy of diversifying
geographically across three major business lines.
At the heart of this effort,
more than 50,000 employees
of the Scotiabank Group and our affiliates
are dedicated to serving customers
…in close to 50 countries
…on 5 continents
…in more than 80 languages.
Our goal is to be the best Canadian-based
international financial services company.

MESSAGE FROM THE CHAIRMAN OF THE BOARD
I’m pleased to once again report to you as Chairman of Scotiabank.
The Bank’s Board of Directors, now comprising 15 members,
provides guidance and supervision to ensure that Scotiabank
continues to be managed for the benefit of all its stakeholders in
Canada and around the world.
This Bank is founded on the principles of accountability, open-
ness and integrity. We believe that a strong governance structure
and culture across the entire organization provides us with an
opportunity to deliver value to all our stakeholders. We set the
bar high – our rigorous internal standards have been created to
meet international as well as Canadian requirements.
We work hard to ensure that our governance policies and
practices are regularly reviewed. The Board’s Corporate Governance
and Pension Committee, which is responsible for these reviews,
is made up entirely of outside directors – as it should be. It is also
responsible for Board membership nominations, orientation and
education, as well as developing an approach to corporate gover-
nance issues. This group developed a Corporate Governance policy
in 2002, and has enhanced and re-approved it each year since.
Scotiabank consistently maintains what are considered global
best practices for corporate governance, details of which can be
found in the Corporate Governance section of this report, the
Bank’s website, as well as the Proxy Circular. Related to this, in
November 2005, the Board of Directors adopted a new corporate
governance policy that requires majority voting for the election
of Bank directors. Directors receiving more votes withheld than
for their election will be required to tender their resignation.
After considering recommendations from the Corporate Governance
and Pension Committee, the Board will decide – within 90 days
of the annual meeting – whether or not to accept the resignation.
It is expected resignations will be accepted, unless there are
extenuating circumstances. The Board of Directors will announce
any such decisions via a press release. This important initiative
recognizes the role shareholders play in selecting Bank directors.
The Bank’s ongoing efforts to strengthen our governance
practices continue to be widely recognized. I am proud to report
that Scotiabank tied for first-place (up from 8th last year) in
Canadian Business magazine’s 2005 governance rankings, and
tied for second place (up from 5th last year) in The Globe and
Mail’s annual Board Games rankings.
During fiscal 2005, no new members were added to the Board.
Keith Goodrich, a director since 1990, did not stand for re-election
at the annual meeting in March 2005 due to mandatory retirement.
I would like to thank him on behalf of the Board, the Bank and
its shareholders for his years of dedicated service.
The Board oversaw several changes to the Bank’s senior execu-
tive management team during the year, ensuring that effective
leadership development and succession strategies remain in place.
The Board is supportive of the strategic direction of the Bank
– and remains confident that the senior executive management
team’s commitment to responsibly growing revenues, earnings and
our customer base will continue to generate strong results and
deliver value to all our stakeholders. As the theme of this report
suggests, Scotiabank clearly has tremendous opportunities to grow.
The Board of Directors, the senior executive management team
and the more than 50,000 employees of the Scotiabank Group and
its affiliates worldwide are committed to the Bank’s success – for
all its shareholders, for its customers, for its employees and for
the communities in which we do business. I would like to extend my
thanks to every single member of this global team, each of whom
has made an important contribution to the success of the whole
organization. The proof of their dedication is evident in the record
results we have achieved this year and discuss in this report.
Arthur R.A. Scace
Chairman of the Board
2 S c o t i a b a n k 2 0 0 5 A n n u a l R e p o r t
Arthur R.A. Scace
Opportunity means

MESSAGE FROM THE PRESIDENT AND CHIEF EXECUTIVE OFFICER
In 2005, we accomplished what we set out to do and more. It
was another record year, and we are proud to report that we
have, yet again, delivered solid, consistent financial results. And
we’re confident that we have a focused, strategic plan in place to
improve results again in 2006.
Report on 2005
The stronger our financial results, the better we are able to grow
and reward all of our stakeholders. This year, we exceeded our key
financial targets. Net income was a record $3,209 million, up $301
million or 10% over 2004. Earnings per share (diluted) were $3.15,
an increase of 11.7%, and return on equity was 20.9% versus 19.9%
last year. Our target was to maintain a productivity ratio below 58%,
which we accomplished with a ratio of 56.3%.
We also continued to reward our shareholders for their confi-
dence in our business. Our solid performance allowed us to
extend our strong record of growing dividends. During the last
10 years, the compound annual return to shareholders (share
price appreciation plus dividends reinvested) has averaged 23%.
Each of our three major business lines made a significant
contribution to our results in 2005. Domestic Banking generated
the largest share of the Bank’s net income at 42%. International
Banking contributed 27% and Scotia Capital 31%.
Results benefited from strong retail asset growth and improved
credit quality. Both impaired loans and provisions for credit losses
improved significantly, reflecting a number of important policy
and process changes implemented over the past two years, as well
as a generally favourable credit environment. At the same time,
these factors were partially offset by lower interest margins in
Canada and the negative impact of foreign currency translation.
Operational results
Our overriding priorities for 2005 were to build our customer base,
leverage our core strengths and optimize our use of capital.
Domestic Banking performed solidly this year. We experienced
tremendous growth in consumer lending, particularly mortgages,
thanks to innovative new products and a focus on customer reten-
tion and cross-selling. We also remained well focused on our core
strengths in retail credit management, online banking and call
centre service, database marketing and customer analytics, and
cost control. Perhaps most importantly, we maintained our high
levels of customer satisfaction and loyalty – the result of our
continuing emphasis on fulfilling our customers’ needs, with
excellent sales and service provided by our strong team of moti-
vated employees.
In International Banking, we continued to build our global
network with the acquisition of Banco de Comercio in El
Salvador for US$181 million. Scotiabank El Salvador is now the
country’s fourth-largest bank, with a consolidated market share
of 19%. Our Caribbean and Central American operations remained
S c o t i a b a n k 2 0 0 5 A n n u a l R e p o r t 3
At Scotiabank, we are driven by opportunity. Since our founding in 1832, we have always
searched for new ways to grow, across Canada and around the world – opportunities to
reward our shareholders, serve our customers better, provide our employees with rewarding
careers, and help our communities to prosper. All told, our focus on creating and seizing
opportunities has helped us become a highly successful company, by any measure.
Rick Waugh
the world to us.

MESSAGE FROM THE PRESIDENT AND CHIEF EXECUTIVE OFFICER
strong, and Scotiabank Inverlat in Mexico experienced continued
solid growth, particularly in mortgages, credit cards and automo-
tive finance.
Scotia Capital has substantially refocused its business, resulting
in improved client profitability and a more diverse mix of lend-
ing and non-lending services. The purchase of Waterous & Co., a
leading global energy advisory firm, led to the creation of an
exciting new force in the energy industry, Scotia Waterous.
It was an ideal opportunity to broaden our wholesale client base
and build our presence in this industry.
We established a Mexico Wholesale Banking unit by integrat-
ing Scotiabank Inverlat’s investment and
corporate banking unit with Scotia
Capital’s U.S. and Canadian operations.
We are evolving to become fully aligned
with our clients’ needs, wherever they
are in the NAFTA region.
We are in a strong position to continue
to grow our three main businesses in 2006
and beyond – each with unique potential.
Focus on 2006
In the year ahead, there are a number
of broad global trends that are shaping
the strategies we have developed to
maximize our future growth.
Trends and challenges
One such trend is globalization, particularly the growing impor-
tance of developing economies and the direction of trade flows.
A related trend is demographics – the aging of people in most
developed countries, including Canada and the United States,
alongside the increasing numbers of young people entering the
workforce in developing markets. As a result, these developing
economies are growing at a rapid rate, and the population’s need
for financial services is expanding – an opportunity for Scotiabank,
given our well-established presence in many of these markets.
There is also a greater focus on risk and governance issues
throughout the world. The combination of increased reporting
requirements and growing regulatory burdens is shaping how we
operate, and compels us to continue to develop worldclass
enterprise-wide compliance systems.
All of our business lines face growing competition. In Domestic
Banking, our competitors remain strong and customers’ expectations
are increasing. In International Banking, there is intense compe-
tition for our customers’ business, as well as for acquisitions in
almost every market: mergers and acquisitions in the rapidly
consolidating global banking industry more than doubled between
2002 and 2004. And Scotia Capital faces pricing pressure in
almost all the products we offer to institutional investor clients.
Priorities for success
Despite these challenges, we see significant opportunities for
your Bank in the years ahead. With these broad trends in mind,
we have developed a number of strategies to ensure our continued
strong performance and growth. Our long-term goal is to be the
best Canadian-based international financial services company.
Next year, and in the years to come, we expect to see ongoing
growth in earnings, as well as increas-
ing returns to shareholders.
In order to achieve those results, we
have identified three key priorities. The
first is sustainable revenue growth.
Driving revenue-based initiatives, both
in Canada and internationally, will be
necessary for us to achieve all our tar-
gets. The second priority is strategic
acquisitions. We’ve demonstrated over
the years that the potential for increased
growth from new operations is signifi-
cant. The third is effectively managing
and allocating our capital. As one of
the world’s best-capitalized financial
institutions, we have an impressive advantage here. We are well-
positioned to invest in growth and acquisitions – and that advan-
tage needs to be maximized.
Revenue growth
Our plan is to drive revenue growth aggressively across all our
businesses. Overall, we will focus on retaining and growing business
with existing customers and attracting new customers. We are
planning to put more emphasis on revenue-based initiatives rather
than cost-based ones, while maintaining our cost discipline.
Attracting new customers while deepening existing relationships
is also key, and we’ll do this by investing in technology (for products
and services) and in marketing.
In Canada, we will increase the number of households that do
business with us by committing more resources, more sales capacity,
and more branches with new hours and formats in a number of
high-growth areas across the country. For our small business
customers, we are leveraging our alliances with more than 20
small business groups and offering an enhanced set of solutions.
We see significant opportunity in the growing segment of
emerging affluent investors. To capture a greater share of the
4 S c o t i a b a n k 2 0 0 5 A n n u a l R e p o r t
In 2005, we
accomplished what we
set out to do and more. It
was another record year,
and we achieved all of
our targets.

MESSAGE FROM THE PRESIDENT AND CHIEF EXECUTIVE OFFICER
wealth management market, we plan to double the size of our
financial consultant sales force. In ScotiaMcLeod, we are also
targeting sales growth, as well as emphasizing high-performing
fee-based programs.
International Banking is a unique platform and a prime
source of growth, so it will receive a greater portion of our
resources over time for acquisitions, as well as for operational
support. Our goal is to achieve a minimum 10% share in the
markets in which we operate. We are also looking to use our
sales and service platform to deepen and retain customer rela-
tionships, particularly in markets where we already have strong
and well-established operations, and to
grow our insurance and wealth manage-
ment business by enhancing our high
net worth offering in select markets.
In Mexico, our key engine for growth
in International Banking, we are develop-
ing a specialized mortgage sales force
and expanding our branch network.
We are also placing a greater emphasis
on credit cards.
Scotia Capital’s focus will be on selling
more profitable lending products to our
core clients and additional products and
services to priority customers. In the
U.S., we will concentrate on deepening
relationships with current customers.
We have identified key industries where we will build global
expertise and product capabilities. We are also expecting to
generate significant returns over time from our new Mexico
Wholesale unit as it builds business across North America.
Acquisitions
Acquisitions are critical to revenue growth. Our focus will be on
acquisitions that will leverage our current strengths and networks.
We favour in-market acquisitions – that is, ones in countries where
we already do business. We look for value in markets that offer
above-average growth potential.
In 2006, our acquisitions focus will be on personal and com-
mercial banking in Central America, as well as Mexico, Peru and
Chile. Our intention is to be prepared and proactive. We are also
interested in building our global businesses in particular indus-
try sectors, as we did with Scotia Waterous. In Canada, we are
looking at in-fill acquisitions. Complementary businesses, such
as insurance and wealth management, will be another priority –
so long as they meet our financial and strategic criteria.
Strong capital management
Capital management is also a key priority and a key strength.
Our capital position gives us the ability to fund our growth prior-
ities and the flexibility to take advantage of new opportunities.
Scotiabank has the highest tangible common equity of its
Canadian peer group. Our challenge for next year is to optimize
the use of our capital and maximize the revenue from this key
strategic advantage.
We plan to increase our investment in areas such as techno-
logy, product development, new branches and alternate delivery
channels – all of which must and will have a direct impact on
revenue growth. We will use our capital
to support acquisitions, particularly in
International Banking. We will also con-
tinue to buy back shares to at least cover
dilution and any stock we may issue
for acquisitions. Most importantly, we
will continue to increase dividends to
our shareholders.
Leadership in social responsibility
As a successful multicultural organiza-
tion, we recognize our responsibility as
a corporate citizen in the communities
in which we do business, and we are
committed to being a leader in this
field. Scotiabank was involved in a number of worthy and innovative
initiatives in 2005, contributing more than $40 million in sponsor-
ships and donations to people and communities around the globe.
For example, both the Bank and its employees gave generously
to relief efforts following the December 2004 tsunami in southeast
Asia, and the devastation of hurricane Katrina in the southern
United States this fall.
Building on our experience in operating microlending programs
in Guyana and Jamaica, we are an active member of the Canadian
Steering Committee for the United Nations International Year of
Microfinance. The goal is to bring more inclusive financial oppor-
tunities to those who have no access to basic financial services –
and who represent more than half the global population.
We will continue to support our employees’ contributions to
their local communities, and ensure that Scotiabank remains a
great place to work and to build rewarding careers. The Scotiabank
Group team, with its philosophy of “One Team, One Goal,” remains
at the heart of our success. In this regard, we were very proud
to be recognized as a top employer in Canada, Jamaica and
Mexico this year.
S c o t i a b a n k 2 0 0 5 A n n u a l R e p o r t 5
We have identified three
key priorities for 2006:
sustainable revenue growth,
strategic acquisitions, and
effective management and
allocation of capital.

MESSAGE FROM THE PRESIDENT AND CHIEF EXECUTIVE OFFICER
Global goals
The breadth, depth and longevity of our international network
gives us a unique competitive advantage. Long known as
“Canada’s most international bank,” we are, in fact, becoming a
major international financial services organization based in
Canada. Our future is marked by almost unlimited opportunities.
This is a great bank. We have all the elements for ongoing suc-
cess of a powerfully successful global organization: a committed
team of more than 50,000 employees, a solid and long-term founda-
tion in our three core businesses, and a compelling strategic plan
for growth going forward. On the following page, you will see our
objectives for 2006. We have every confidence that Scotiabank
will continue to deliver great results for our shareholders, for our
customers, for our employees and for the communities we serve.
Rick Waugh
President and Chief Executive Officer
6 S c o t i a b a n k 2 0 0 5 A n n u a l R e p o r t
Our Executive Team
Albert E. WahbeExecutive Vice-President & Group Head, Global Transaction Banking
Deborah M. AlexanderExecutive Vice-President, General Counsel & Secretary
Stephen D. McDonaldCo-Chairman and Co-Chief Executive Officer, Scotia Capital,
and Head, Global Corporate and Investment Banking
Dieter W. JentschExecutive Vice-President, Commercial Banking
Sarabjit S. MarwahVice-Chairman & Chief Administrative Officer
Robert H. PitfieldExecutive Vice-President, International Banking
Peter C. CardinalExecutive Vice-President, Latin America
Wendy HannamExecutive Vice-President, Domestic Branch Banking
Brian J. PorterChief Risk Officer
(as of November 1, 2005)

MESSAGE FROM THE PRESIDENT AND CHIEF EXECUTIVE OFFICER
S c o t i a b a n k 2 0 0 5 A n n u a l R e p o r t 7
2 0 0 5 E X E C U T I V E O F F I C E R S
Alberta G. CefisExecutive Vice-President, Retail Lending Services
Chris J. HodgsonExecutive Vice-President, Wealth Management
Barry LuterChief Executive Officer, Scotiabank (Ireland) Ltd.
C. John SchumacherCo-Chairman and Co-Chief Executive Officer, Scotia Capital, and
Head, Global Capital Markets
Barbara MasonExecutive Vice-President, Marketing, Sales & Service
Tim P. HaywardExecutive Vice-President & Chief Administrative Officer,
International Banking
Robert L. BrooksSenior Executive Vice-President & Group Treasurer
Sylvia D. ChrominskaExecutive Vice-President, Human Resources &Public, Corporate and Government Affairs
Robert W. ChisholmVice-Chairman, Scotiabank, & President and CEO,Domestic Banking & Wealth Management
Luc A. VannesteExecutive Vice-President & Chief Financial Officer
Objectives – 2006
Financial• Return on equity of 18-22%• Diluted earnings per share growth of 5-10%• Long-term shareholder value through increases in dividends
and stock price appreciation
Customer• High levels of customer satisfaction and loyalty• Increase market share in primary markets
Operational• Productivity ratio of <58%• Sound ratings• Best practices in corporate governance and compliance processes• Sound capital ratios
People• High levels of employee satisfaction and engagement• Enhance diversity of workforce• Commitment to corporate social responsibility and strong
community involvement

CORPORATE GOVERNANCE
C o r p o r a t e G o v e r n a n c e
Board ofDirectors
Executive & RiskCommittee
Corporate Governance &Pension Committee
Human ResourcesCommittee
a p p o i n t a p p o i n t
ele
ctShareholders' AuditorsShareholders
Audit & ConductReview Committee
ap
po
int
ManagementGroup
ComplianceInternal
Audit
a p p o i n t
reportrep
ort
Scotiabank’s corporate governance structure
8 S c o t i a b a n k 2 0 0 5 A n n u a l R e p o r t
Accountability, openness and integrityWe strongly believe that our ongoing commitment and efforts to ensure a strong corporate governance structure and
culture across our organization help us deliver value to all our stakeholders.
*Available at www.scotiabank.com
Detailed information about supervision
of Scotiabank in Canada, the United
States, Mexico and other jurisdictions,
as well as its corporate governance
policies and practices, can be found in
the annual management proxy circular,
annual information form and on the
Bank’s website at www.scotiabank.com.
The Bank’s corporate governance practices
do not differ significantly from the NYSE
listed company corporate governance
standards.
Best practices in corporate governance in place at Scotiabank
The Board must assume stewardshipof the Bank.
The Board supervises the management of Scotiabank’s business and affairs, with the goal ofmaintaining the strength and integrity of the Bank.
The Bank must adopt and disclosecorporate governance guidelines.
The Bank developed a formal Corporate Governance Policy in 2002, which was subsequentlyenhanced and re-approved each year since. It is reviewed at least annually.
Directors must be elected by majorityvoting.
Directors receiving more votes withheld than for their election will be required to tendertheir resignation.
The Board should have a non-executivechairman or independent lead director.
Scotiabank’s Board is led by a non-executive chairman.
Board committees should be composedof outside directors, a majority of whomare unrelated.
All four of the Board’s committees meet independence guidelines in terms of composition.
The Bank must disclose the identity of thefinancial expert on the Audit Committee.
One or more members of the Audit and Conduct Review Committee meet the definition of a financialexpert. The Board has determined that Ronald A. Brenneman is the committee’s financial expert.
Non-management directors must meet atregularly scheduled executive sessionswithout management.
At each meeting of the Board and Board committees, time is specifically reserved forindependent discussion without management present.
An education program should beprovided for new directors.
An orientation and education program is in place for all new directors. They also receive aCorporate Governance Information book, which is updated annually and reissued to all directors.
The Bank must have a written code ofethics and conduct applicable to seniorfinancial officers and the CEO.
All directors, officers and employees of Scotiabank must acknowledge their adherence annually tothe Scotiabank Guidelines for Business Conduct*. Directors are also required to adhere to theDirectors’ Addendum to the Guidelines*.
Directors’ interests should be alignedwith those of shareholders.
Directors are expected to hold Bank common shares and/or Director Deferred Share Units with avalue not less than $300,000, a level that must be reached within five years.
✓
✓
✓
✓
✓
✓
✓
✓
✓
✓

Board of DirectorsArthur R.A. Scace, Q.C.Mr. Scace is Chairman of Scotiabank and is a corporate director. He has been a Scotiabankdirector since March 25, 1997, and Chairman since March 2, 2004. He currently sits onthe Human Resources (Chair) and the Executive and Risk Committees.
The Honourable Barbara J. McDougall, O.C.Mrs. McDougall is an advisor to Aird & Berlis LLP. A Scotiabank director since March 30, 1999,she currently sits on the Audit and Conduct Review and the Human Resources Committees.
Rick Waugh(1)
Mr. Waugh is President and Chief Executive Officer of Scotiabank. He was appointed aScotiabank director on March 25, 2003, and currently sits on the Executive and RiskCommittee. He is also a director of several of the Bank’s subsidiaries and affiliates.
Allan C. Shaw, C.M., LL.D.Mr. Shaw is non-executive Chairman of The Shaw Group Holding Limited. A Scotiabankdirector since September 30, 1986, he currently sits on the Executive and Risk and theCorporate Governance and Pension (Chair) Committees.
Gerald W. Schwartz(2)
Mr. Schwartz is Chairman and Chief Executive Officer of Onex Corporation. He has beena Scotiabank director since May 26, 1999, and currently sits on the Executive and RiskCommittee.
Barbara S. ThomasMs. Thomas is a corporate director. She has been a Scotiabank director since September28, 2004, and currently sits on the Audit and Conduct Review Committee.
2 0 0 5 B O A R D O F D I R E C TO R S
Ronald A. BrennemanMr. Brenneman is President and Chief Executive Officer of Petro-Canada. He has been aScotiabank director since March 28, 2000, and currently sits on the Audit and ConductReview and the Human Resources Committees.
Elizabeth Parr-Johnston, Ph.D.Dr. Parr-Johnston is President of Parr Johnston Economic and Policy Consultants. AScotiabank director since October 26, 1993, she currently sits on the Audit and ConductReview and the Corporate Governance and Pension Committees.
Paul D. SobeyMr. Sobey is President and Chief Executive Officer of Empire Company Limited. He hasbeen a Scotiabank director since August 31, 1999, and currently sits on the Audit andConduct Review and the Corporate Governance and Pension Committees.
John T. Mayberry(3)
Mr. Mayberry is the retired Chair of the Board and Chief Executive Officer of DofascoInc. He has been a Scotiabank director since March 29, 1994, and currently sits on theExecutive and Risk Committee (Chair).
N. Ashleigh EverettMs. Everett is President, Corporate Secretary and Director of Royal Canadian SecuritiesLimited. She has been a Scotiabank director since October 28, 1997, and currently sitson the Human Resources and the Corporate Governance and Pension Committees.
John C. Kerr, C.M., O.B.C., LL.D.Mr. Kerr is Chairman of Lignum Investments Ltd. He has been a Scotiabank directorsince March 30, 1999, and currently sits on the Human Resources and the CorporateGovernance and Pension Committees.
Laurent LemaireMr. Lemaire is Executive Vice-Chairman of the Board of Cascades Inc. He has been aScotiabank director since March 31, 1987, and currently sits on the Executive and Riskand the Human Resources Committees.
C.J. ChenMr. Chen is Counsel to Rajah & Tann. He has been a Scotiabank director since October30, 1990, and currently sits on the Corporate Governance and Pension Committee.
The Honourable Michael J.L. KirbySenator Kirby is a Member of the Senate of Canada. He has been a Scotiabank directorsince March 28, 2000, and currently sits on the Audit and Conduct Review (Chair) andthe Executive and Risk Committees.
Honorary Directors*Lloyd I. Barber, C.C.,S.O.M., LL.D., Ph.D.Regina Beach, Saskatchewan
Malcolm R. BaxterSaint John, New Brunswick
Bruce R. BirminghamOakville, Ontario
E. Kendall CorkHillsburgh, Ontario
Sir Graham DayHantsport, Nova Scotia
Peter C. Godsoe, O.C.Toronto, Ontario
M. Keith GoodrichLake Forest, Illinois, U.S.A.
The Honourable HenryN.R. JackmanToronto, Ontario
Pierre J. Jeanniot, O.C.Montreal, Quebec
John J. Jodrey,C.M., D.C.L.Hantsport, Nova Scotia
Gordon F. MacFarlane,O.B.C., LL.D.Surrey, British Columbia
Donald MaclarenOttawa, Ontario
Gerald J. MaierCalgary, Alberta
Malcolm H.D. McAlpineLondon, England
Ian McDougallLynbrook, New York
William S. McGregorEdmonton, Alberta
David E. Mitchell, O.C.Calgary, Alberta
David MortonWestmount, Quebec
Helen A. ParkerSidney, British Columbia
Paul J. PhoenixBurlington, Ontario
Robert L. Pierce, Q.C.Calgary, Alberta
David H. RaceToronto, Ontario
Cedric E. Ritchie, O.C.Toronto, Ontario
Thomas G. Rust,C.M., LL.D.Vancouver, British Columbia
Isadore Sharp, O.C.Toronto, Ontario
Marie Wilson, Q.C.Toronto, Ontario
*Honorary directors do notattend meetings of the Board.
(1) Non-independent (NYSE Rules & CSA Guidelines) and affiliated (Bank Act) – President and CEO(2) Non-independent (NYSE Rules & CSA Guidelines) – overall business relationship with the Bank(3) Non-independent (NYSE Rules & CSA Guidelines) – prior interlocking corporate relationship with a Bank executive S c o t i a b a n k 2 0 0 5 A n n u a l R e p o r t 9

DomesticBanking
p. 12
2005
InternationalBanking
Report on Business Lines
1 0 S c o t i a b a n k 2 0 0 5 A n n u a l R e p o r t
Scotia Capital
Scotiabank delivered solid, consistent financial results, largely because of the
diversified and sustainable earnings generated by our three strong business lines.
Thanks to a unique, integrated NAFTA wholesale banking platform,Sergio Alvarez de la Reguera of Mexico (left) and the Scotia Capitalteam are able to meet the needs of CEMEX and its CFO, Rodrigo Treviño.
p. 18
p. 24
Michael Babinec Jr., owner of Grohmann Knives, and Debbie Jardine,proprietor of the historic Consulate Inn, are satisfied personal andsmall business banking customers of the Pictou, Nova Scotia branch.
Our growing international operations include Scotiabank Inverlat inMexico, where we work hard to meet the needs of all our customers,including Viviana Corcuera.

Domestic Banking is the heart of our operations, providing a full range of banking and
investing services to more than 6.8 million customers across Canada. We serve our customers
face to face (in branches and through specialized mobile sales forces), by telephone and
over the Internet through a network of more than 20,000 people, 954 branches, 2,624
automated banking machines, three call centres and four dealer finance centres. Domestic
Banking includes three main business segments: Retail Banking provides mortgages, loans,
credit cards and day-to-day banking products and services to individuals and small businesses.
Wealth Management offers retail brokerage, mutual funds and private client services.
Commercial Banking delivers a full product suite to medium and large businesses.
Spanning more than 40 countries, International Banking includes Scotiabank’s retail
and commercial banking operations outside of Canada. Including subsidiaries and
affiliates, more than 22,000 employees worldwide provide a full range of financial
services to almost three million customers. International Banking is organized in three
geographic regions: Caribbean and Central America, Latin America and Asia Pacific.
With more than a century of international experience and our broad multinational
presence, our international scope is unmatched by our domestic competitors and
provides a unique growth platform for the future.
S c o t i a b a n k 2 0 0 5 A n n u a l R e p o r t 1 1
Scotia Capital is the wholesale banking business of the Scotiabank Group, providing
full-service coverage across the NAFTA region, as well as a niche focus in select
markets globally. Scotia Capital offers wholesale financial products to corporate,
government and institutional clients. It comprises two highly cohesive divisions:
Global Capital Markets and Global Corporate and Investment Banking.
2006 In 2006, a particular focus on sustainable revenue growth, acquisitions
and capital management will guide our priorities.
Domestic Banking
2005 Earnings$1,253 million
42%*
International Banking
2005 Earnings$800 million
27%*
Scotia Capital
2005 Earnings$915 million
31%*
*Excludes net income for the Other category, which incudes Group Treasury, other smaller operating segments and other corporate adjustments that are not allocated to an operating segment.

Opportunity isaround the corner.
1 2 S c o t i a b a n k 2 0 0 5 A n n u a l R e p o r t

REPORT ON BUSINESS L INES
P r o v i d i n g a b r o a d r a n g e o f b a n k i n g
p r o d u c t s a n d s e r v i c e s …
Domestic Banking – our Canadian consumer, small business, commercial and
wealth management operations – remains the solid foundation on which our
Bank was built. It continues to deliver strong financial results, high rankings in
customer service and market share gains in key products. We attribute this
success to our excellent sales and service execution and cost management
abilities, innovative borrowing and investing solutions, leadership in database
analytics and marketing, and a strong culture of teamwork among our employees.
This business continues to generate the largest share of Scotiabank’s net
income. Results included significant growth in Wealth Management, along with continued strong performances
in each of Retail, Small Business and Commercial Banking. Credit quality remained strong this year, with provision
for credit losses 14% lower than in 2004. Expenses were well controlled – only 2% higher than in 2004.
While the Canadian market is mature and fiercely competitive, we are confident many opportunities remain
that will allow us to grow our business further.
Main photo, page 12: Shannon Estabrooks of New Glasgow, Nova Scotia, says Scotiabank has been there for her “every step of the way” – from herfirst bank account and student loans to financing her first home and physiotherapy clinic.
Photo, above left: Sunsera Salons Ltd. has been a customer of the Westside branch in Saskatoon, Saskatchewan, since 1987. With Scotiabank’s help,owner Serafino Grosso has gradually expanded his business from one tanning salon to five top-rated, full-service day spas and circuit-training gyms,employing 57 people.
Photo, above right: Jane Skarpinsky, Manager, Small Business, and Victor Iula, Account Manager, Small Business, Westside, Saskatoon, Saskatchewan,have helped Sunsera Salons grow and expand, and also ensured its day-to-day banking needs are met.
S c o t i a b a n k 2 0 0 5 A n n u a l R e p o r t 1 3
DOMESTIC BANKING
Domestic Banking net income($ millions)
2003 2004 2005
1,059 1,1051,253

REPORT ON BUSINESS L INES
Scotiabank’s core purpose is to help our customers become financially better off by pro-
viding relevant solutions to their unique needs. Domestic Banking’s strategy for growth
is to expand this positive customer experience to increase our client base and drive revenue
growth. We will do this by continuing to build on our strengths in customer service and
execution, working with our business partners across the Scotiabank Group to maximize
best practices, referrals and cross-selling opportunities. We plan to expand our invest-
ments in new products, alternate sales and delivery channels, technology and marketing,
and to investigate new business opportunities and possible acquisitions. As always, we
will continue to develop and rely on our great team of people.
Retail and Small Business Banking’s focus is on growing business with mid-market
investors and small business clients, as well as building on our strengths in mortgages,
revolving credit and indirect lending. Wealth Management, an increasingly important
driver of Scotiabank’s growth, has opportunities to capture a greater share of current
clients’ business, while building a larger customer base. In Commercial Banking, we have
been working to redefine and refocus our business, with an emphasis on delivering cost-
effective and client-valued financial solutions.
In all of these areas, we will retain and grow the business we have with our current
customers, acquire new customers and focus on making strategic acquisitions to
expand our customer base.
2005 Achievements
Retail Banking recorded strong growth in 2005,
particularly in consumer lending. This year, we
opened our one millionth ScotiaLine line of
credit account, and experienced continued strong
demand for mortgages. And our mortgage reten-
tion rate is extremely high – more than 90% over
the past two years. Our Scotia Total EquityTM Plan
(STEP), an innovative borrowing plan that uses
home equity as collateral, continues to be an
enormous success, exceeding $54 billion in out-
standings. In fact, STEP customers are our most
satisfied, loyal and most profitable customers.
Our success in consumer lending can be seen in
the strength of our customers’ borrowing share of wallet, which shows how much of our
customers’ borrowing business we hold.
Customer satisfaction and loyalty have also continued to improve. We strengthened
and deepened our relationship with key retail segments by increasing the number of
products and services they hold with us. Through our Total View process that provides
our customers and the Bank with a holistic view of their financial holdings, we have
identified over $100 billion in financial holdings with our competitors. This information
provides us with a tremendous opportunity to help our customers consolidate their
financial needs within the Scotiabank Group.
O p p o r t u n i t y i s a r o u n d
t h e c o r n e r.
1 4 S c o t i a b a n k 2 0 0 5 A n n u a l R e p o r t
Scotiabank’s “Find the Money”approach to financialmanagement, combined withinnovative, customized financialsolutions, is helping customersbuild financial power they neverthought possible.
Thousands of Canadians have attended
free “Find the Money” seminars conducted
by best-selling author and financial advisor
David Bach on Scotiabank’s behalf. Bach’s
philosophy on wealth creation aligns
perfectly with our objective of helping
customers become financially better off.
Peer AverageScotiabank
Share of wallet – borrowing*
(% of dollars)
*Over a 12-month period to Sept. 2005
Source: Canadian Financial Monitor
48%
40%

DOMESTIC BANKING
Our “Find the Money” campaign, launched in fall 2004, also continues to be a great
success. As part of the campaign, thousands of Canadians have attended free seminars
conducted by David Bach, best-selling author and special financial advisor to Scotiabank,
to learn simple ways to “find the money” and then use it to invest or pay off debt.
In Wealth Management, we continue to achieve
double-digit growth in assets under administration
and management. Scotia Partners Portfolios, four
diversified portfolios of third-party mutual funds,
topped $1 billion in assets in April, with full year net
sales up 125% from last year. In June, we launched
the Scotia Vision Funds, eight diversified mutual funds
that automatically become more conservative over
time to meet clients’ goals and time horizons. We
also launched the Scotia Diversified Monthly Income
Fund, which provides investors with regular monthly
income and some capital appreciation. These new
products position us well for new growth in mutual
fund sales. In addition, we have launched an inno-
vative GIC solution, the Ultimate Laddered GIC, to help customers maximize their fixed
income returns. This product, together with our comprehensive suite of term deposits,
drove significant, industry-leading growth in our term deposit market share. Year over
year, our retail and small business deposit base grew $4.4 billion.
ScotiaMcLeod – our full-service brokerage – experienced tremendous growth, par-
ticularly in fee-based assets, which grew 34% in 2005. The advisor sales force now
stands at 829. Our longer-term goal is to increase this sales force to 1,000 over the next
few years.
ScotiaMcLeod Direct Investing increased its market share, customer satisfaction
and loyalty, a direct result of efforts to partner with the retail branch network, Scotia
Private Client Group and other areas of the Bank.
Within our Scotia Private Client Group, 86% of the longer-term mutual funds assets
managed by Scotia Cassels were ranked in the top two quartiles for one-year returns as
reported by Morningstar Canada, an independent fund research firm. For Scotiatrust,
revenue growth in Executor Assistance services increased 73% through strong collaboration
with the Retail Bank and ScotiaMcLeod. Our private client group received over $900 million
in referral business from Commercial Banking.
In Commercial Banking, this was a year of building. We are redefining and refocusing
our business to better deliver tailored customer solutions by segmenting our clients into
three distinct groups, based on the complexity of their needs. The goal is to match the
best and most appropriate banker to every client. As part of this new sales and service
delivery structure, we are creating a network of six business support centres that will
assist our relationship managers in providing efficient and consistently excellent service.
Employees are also being provided with new relationship and risk management tools.
This new structure will help drive revenue growth, strengthen client relationships, improve
S c o t i a b a n k 2 0 0 5 A n n u a l R e p o r t 1 5
A key part of this effort is a
financial plan. Clients with
a financial plan developed
by a Scotiabank Group advisor
are almost twice as loyal, and
place a greater share of their
business with us.
We are working toachieve primary advisorstatus with our wealthmanagement clients.
2004 20052003
2004 20052003
Wealth Managementassets under administration/management($ billions)
Administration
Management
88 97111
18 20 22

REPORT ON BUSINESS L INES
our share of their business, and support satisfac-
tion and teamwork across business lines.
We continue to co-ordinate our delivery chan-
nels to provide excellent and consistent service,
no matter how our customers choose to deal with
us. Nearly 90% of retail customer transactions
now occur electronically. Scotia OnLine transac-
tions have increased more than 30% this year.
And our electronic networks consistently earn
customer satisfaction ratings above 92%.
This year, Scotiabank’s call centres were recognized by Service Quality Measurement
Group Inc. (SQM) for delivering the highest customer sales experience and for achieving
the highest employee satisfaction among call centres in the banking industry. The Bank
also received Global Finance’s award for Best Online Securities Research. In an inde-
pendent survey, we were also rated the top bank for commercial automotive financing,
automotive wholesale lease financing and automotive dealer account management.
2006 Priorities
Priorities for the Domestic Bank in 2006 include growing our business with the existing
customer base, expanding market share by acquiring new customers, and making strategic
alliances and acquisitions to increase revenues.
Growing the existing customer base
One of our main goals in the coming year will be to focus on creating tailored financial
plans for key customer segments. The development of a financial plan has proved to be
a critical tool to increase loyalty and share of wallet among both new and current clients.
To this end, we have created new tools to help branch financial advisors and
Scotiabank Group financial consultants analyze customers’ current portfolios – including
investable assets held with other financial institutions – and create plans for them.
Our priority is to increase our share of the investment market, with a particular emphasis
on selling mutual funds and longer-term investments. To support this, we launched our
largest-ever investment skills training program for our branch-based financial advisors.
We will also continue to develop and offer innovative borrowing solutions.
We will continue to explore opportunities to expand our marketing initiatives to multiple
channels. For example, we were the first Canadian bank to use automated banking machines
as a sales channel. In 2006, we also expect to deliver 10 million e-marketing messages.
In Commercial Banking, we will begin to leverage our investment in the new business
model. We will be better able to develop full product solutions for customers with the help
of dedicated specialized professionals. Our new analytical tools will allow us to identify
our best opportunities for growth and price them more accurately to achieve overall
revenue growth.
Expanding market share by acquiring new customers
In 2006, we are planning to add over 200 sales officers throughout our branch network
in high growth markets. We also plan to open 20 branches in high-priority, high-growth
Scotiabank offers a full rangeof business banking productsand services to large andmid-sized businesses to helpthem realize their potential.
We are redefining and refocusing
our commercial banking business
to better deliver customer solutions,
based on the complexity of each
customer’s needs. Our goal is to
match the best and most appropriate
banker to every client.
1 6 S c o t i a b a n k 2 0 0 5 A n n u a l R e p o r t
2004 20052003
Scotia OnLine transactions(millions)
107
152
199

DOMESTIC BANKING
markets to attract new customers. This is in addition to the 10 branches we obtained by
acquiring the Canadian operations of NBG Bank, a wholly owned subsidiary of the
National Bank of Greece S.A., as announced on November 8, 2005. We will increase our
advertising spending and continue our successful “Find the Money” program.
To grow revenues and further expand the customer base, we are launching a new
initiative offering mortgages to the near-prime market. This growing market segment is
estimated at over $20 billion in annual originations and is very profitable. The near-
prime initiative will be run as a distinct business and brand, and the portfolio will be
fully insured against the risk of default. A pilot launch is scheduled for early 2006.
In indirect lending, we will complement our highly successful existing relationships with
new exclusive or semi-exclusive retail finance programs with leading auto manufacturers.
We will be revitalizing our Small Business offering, including enhancements to product
pricing and policies, and the construction of new sales tools and online resources to help
employees serve their customers better.
Mutual fund growth will be a major goal for Wealth Management in 2006. Increased
sales capacity and investment focus in our retail branches will be combined with a
product strategy that emphasizes packaged “fund of funds” solutions, including third-
party fund options.
A key strategy for Wealth Management in 2006 will be capturing “primary advisor”
status with new and current customers. The referral process is being streamlined by
making the Scotiabank Group financial consultant the single point of contact for referrals
from the Retail Bank, with an emphasis on development of financial plans to increase
loyalty and share of wallet.
We will continue to work across business lines to refer customers and ensure we are
serving our customers’ full financial needs. For example, ScotiaMcLeod International
offices are focusing on serving the wealth management needs of high net worth clients
in Mexico, Latin America and the Caribbean.
Commercial Banking will focus on improving market share, particularly in the smaller
end of the mid-market, and deepening our current client base through new third-party
solutions and alliances.
Scotiabank will also continue to support domestic growth through targeted acquisi-
tions and strategic alliances with organizations such as auto manufacturers, professional
associations and farm suppliers. Where our current base of customers is small, strategic
acquisitions may help us grow more quickly. We are looking for strategic acquisitions
that will allow us to reach out to more customers and, ultimately, create more growth
opportunities.
Summary
Domestic Banking continued to perform strongly in 2005. We are confident that by
building on our solid foundation and focusing on new opportunities to generate revenue
growth, our Canadian business lines will continue to prosper.
S c o t i a b a n k 2 0 0 5 A n n u a l R e p o r t 1 7
Nearly 90% of retail customer
transactions now occur electronically.
Our electronic networks consistently
earn very high customer satisfaction
ratings.
Our goal is to providecustomers with excellentservice, no matter whatthe channel.

1 8 S c o t i a b a n k 2 0 0 5 A n n u a l R e p o r t
Opportunity isaround the world.

REPORT ON BUSINESS L INES
B u i l d i n g t h e b e s t C a n a d i a n - b a s e d
i n t e r n a t i o n a l f i n a n c i a l s e r v i c e s c o m p a n y …
Scotiabank is, increasingly, an international bank. Some of our greatest
growth opportunities exist outside of Canada. In fiscal 2005, International
Banking accounted for 27% (or $800 million) of the Bank’s net income,
compared to 19% in 1999. This growing contribution to our overall
earnings underlines the long-term potential of International Banking.
Scotiabank has always looked beyond Canada’s borders for new opportuni-
ties: our first branch outside of Canada opened in Kingston, Jamaica, in 1889.
Today, our retail and commercial operations span more than 40 countries, and
the scale, diversity and expertise of our global network are widely recognized
as a distinction that sets us apart from the other major Canadian banks and
positions us well to build sustainable growth.
Scotiabank is the leading provider of financial services in the Caribbean – a presence that is further expanded through
our 35-year affiliation with Maduro & Curiel’s Bank of the Netherlands Antilles and Aruba. We are active in the Latin
American market through subsidiaries in Mexico, Costa Rica, El Salvador and Chile, as well as affiliates in Peru and
Venezuela. We also have a broad Asian network, including well-established bases in the fast-growing economies of
China and India.
Our global growth strategy has three main components: organic growth, acquisitions and efficiencies.
Main photo, page 18: Through its international wealth management operations, Scotiabank focuses on providing specialized solutions to meet the needsof high net worth clients. To long-time client José Luis Barraza of Mexico, it is important to deal with a solid, reputable bank that provides financial andinvestment solutions tailored to his personal risk profile.
Photo, above left: Scotiabank’s commitment to strong leadership and the advancement of women resulted in the appointment of Minna Israel as ManagingDirector of Scotiabank (Bahamas) Limited – the first female head of a Scotiabank subsidiary in the Caribbean and Central America.
Photo, above right: Scotiabank (Bahamas) Limited provided a syndicated loan of US$233 million to Baha Mar Development Company Limited to assist withthe purchase and revitalization of three hotel properties on Cable Beach in the Bahamas. Seen here are Baha Mar’s Chairman and CEO Sarkis Izmirlian (left)and Robert Sands, Vice-President, Administration and External Affairs.
S c o t i a b a n k 2 0 0 5 A n n u a l R e p o r t 1 9
International Banking net income($ millions)
2003 2004 2005
INTERNATIONAL BANKING
636718
800

REPORT ON BUSINESS L INES
O p p o r t u n i t y i s a r o u n d
t h e w o r l d .
Mexico has the most youthful
population in North America –
a demographic that appeals
to Scotiabank, since younger
people tend to consume and
borrow more.
Miriam Lino Pérez and Alejandro
Chávez Sánchez of Mexico City
are among the many dedicated
Scotiabank Inverlat employees
who are helping us grow our
lending portfolio.
Scotiabank Inverlat hasa strong share of themortgage and auto financemarkets.
REPORT ON BUSINESS L INES
Mexico
Our greatest opportunity for international growth currently exists in Mexico, where our
subsidiary, Scotiabank Inverlat, contributed $348 million to International Banking’s
results this year. The Mexican market is still developing and expanding rapidly, and there
is also a substantial youthful demographic who need a broad range of financial services.
Scotiabank Inverlat has 444 branches and offices, a network of 1,046 ABMs, more than
1.3 million customers, and a strong share of the mortgage and automotive financing markets.
Caribbean and Central America
We have 366 branches and offices, 775 ABMs and a large customer base in the
Caribbean and Central America, where we operate in 25 countries. We have particularly
strong, long-established franchises in Jamaica, Trinidad and Tobago, the Bahamas and
Barbados. Thanks to acquisitions in the Dominican Republic and El Salvador, we now
have significantly increased operations in these countries.
In fact, Central America and the Spanish-speaking Caribbean – particularly El
Salvador, Costa Rica, Panama, the Dominican Republic and Puerto Rico – represent a
tremendous growth opportunity for us, given their large, young populations whose need
for financial services is increasing.
Our goal is to leverage Scotiabank’s established capabilities to reinforce and further
expand our reputation for strength, stability and outstanding customer service through-
out the region.
Latin America
Our holdings in Latin America include Scotiabank Sud Americano in Chile, and affiliates in
Peru and Venezuela. In Chile, we operate 57 branches and offices and a network of 115
ABMs in a relatively mature, competitive market. There are opportunities in these mar-
kets to increase our share with more aggressive advertising and marketing, especially in
credit cards.
Asia Pacific
In Asia Pacific, we operate 24 branches and offices in nine countries, with China, India,
Malaysia, Thailand and Taiwan showing the greatest potential for growth. Our business
in these countries is primarily focused on commercial banking and trade finance, with
some wholesale banking.
2 0 S c o t i a b a n k 2 0 0 5 A n n u a l R e p o r t
Latin America – vital statistics
Total Branches & Offices Staff ABMs
Latin America* 651 11,266 1,324Mexico 444 6,960 1,046Chile 57 1,187 115Venezuela 116 2,142 137Peru 31 962 26
*6 countries including subsidiaries and affiliates

INTERNATIONAL BANKING
Our primary challenge is to expand our presence in this highly competitive market,
particularly by establishing a meaningful retail operation. Although China and India have
significant regulatory and foreign ownership restrictions, we will continue to look actively
for appropriate acquisitions. There is a large, growing population in many of these markets
with expanding needs for banking services.
2005 Achievements
Scotiabank’s international reach continued to grow this year. Scotiabank’s US$181 mil-
lion acquisition of Banco de Comercio (BanCo) in El Salvador in May gave us majority
ownership of the country’s fourth-largest bank, with $1.9 billion in assets and a consoli-
dated market share of 19 per cent. All BanCo branches were rebranded as Scotiabank.
Additionally, Scotiabank de Puerto Rico acquired Pan American Financial, a mortgage
company which has been active in Puerto Rico since 1997.
Early in fiscal 2005, we opened a new representative office in Shanghai, the financial
hub of China, positioning us to explore new business opportunities in this rapidly grow-
ing economy. Scotiabank was also approved as a foreign institutional investor by regula-
tors in India, permitting the Bank to invest in local Indian securities.
Around the globe, we continued to improve the products and services we offer to our
customers. Income from retail loans and deposits was significantly higher in the Caribbean,
Mexico and Chile. Credit cards are an important element of our retail strategy, and so
Scotiabank Inverlat renewed its agreement with Fiesta, the leading loyalty program in
Mexico, and issued a co-branded credit card.
We continued to expand our delivery network, opening 16 branches in Mexico and
expanding our Internet banking, which is now in nine Caribbean countries.
Our ScotiaGlobe systems platform now supports almost all the countries in the
Caribbean and Central America Region. Despite the different languages, currencies,
products and services offered in each country, the system is able to support customer,
product and account administration, branch sales, customer relationship management,
forms-free teller processing and self-service banking.
Scotiabank received a number of important international awards this year. Latin
Finance recognized Scotiabank’s achievements in 2005 by giving us three “Bank of the
Year” awards for our operations in Mexico, Jamaica and the Caribbean. Scotiabank
Inverlat was named one of the 50 best companies to work for in Mexico by The Great
With the acquisition of BanCo,we tripled our presence inEl Salvador and are now thefourth-largest bank inthe country.
A major media campaign and
rebranding – captured in these photos,
courtesy of the daily newspaper El Diario
de Hoy – introduced Salvadoreans to
the significantly expanded Scotiabank
El Salvador.
Today, we offer customers an extensive
range of retail, commercial and corporate
banking services through 67 branches
across the country.
S c o t i a b a n k 2 0 0 5 A n n u a l R e p o r t 2 1
Caribbean & Central America – vital statistics
Total Branches & Offices Staff ABMs
Caribbean & Central America* 366 10,049 775Dominican Republic 55 1,088 74Jamaica 45 1,469 156Trinidad and Tobago 25 904 67Bahamas 21 555 54
*25 countries including subsidiaries and affiliates

20051999
REPORT ON BUSINESS L INES
Place to Work Institute, reflecting our efforts to become an employer of choice globally.
We were also recognized as one of the top 20 employers in Jamaica in a survey con-
ducted by the Jamaica Employers’ Federation and the University of the West Indies.
2006 Priorities
Organic growth
Organic growth involves retaining and deepening relationships with current customers
as well as acquiring new ones, and continuing to implement our sales disciplines and
culture across our network.
We plan to obtain new customers by expanding our sales network, increasing our
spending on advertising, particularly in Spanish-speaking markets, and leveraging our
strengths in database marketing across the divisions.
In Mexico, Scotiabank Inverlat is continuing to use specialized sales forces (for example,
in auto finance and mortgages), and adding 20 to 30 branches to our network each year
in prime urban growth areas.
Growth in the English-speaking Caribbean will be challenging, because of the matu-
rity and competitiveness of these markets. Nevertheless, we believe growth is possible
by continuing to build deeper relationships with our customers – in part by offering them
more complementary services, such as insurance and wealth management.
In Chile, we continue to seek new customers and improve the profitability of existing
relationships through marketing, external sales forces and cross-selling, including instal-
lation of a new customer management information system.
Through the Bank’s new Global Transaction Banking unit, we believe we can achieve
a competitive advantage by bringing together our capabilities in global payments, trade
finance and cash management to meet the needs of our multinational customers.
Acquisitions
We are actively seeking international acquisitions as part of our global growth strategy.
More than 40% of International Banking’s 2005 earnings were generated by acquisitions
made since 1999.
Leveraging capabilities developed
in Jamaica and Trinidad, we are
focusing on offering a variety of
creditor, disability and wealth
insurance products in other
countries throughout the region.
The Caribbean and CentralAmerica offer growthopportunities in the saleof insurance products.
2 2 S c o t i a b a n k 2 0 0 5 A n n u a l R e p o r t
Acquisitions – A critical component of our growth(% of net income) Key acquisitions since 1999 40%
60%Mexico Chile Dominican RepublicEl Salvador

INTERNATIONAL BANKING
Our primary acquisition focus is on markets where we have a presence, especially
the Caribbean, Central America and Latin America, with a secondary focus on Asia,
given its long-term potential. However, opportunities vary from market to market and, in
some cases, particularly in Asia, they are limited by foreign ownership restrictions.
We are also increasing revenues by expanding into complementary businesses, such as
insurance and wealth management, in areas where we already have a large, well-developed
customer base. In wealth management, we are looking to expand our ScotiaMcLeod
International branch in Mexico, and add new locations in Chile, Barbados, Trinidad,
Jamaica and the Bahamas.
Increasing efficiency
Our International Shared Services initiative, which
lowers overall costs by delivering economies of
scale, and frees up more employees to focus on
revenue growth through sales and customer serv-
ice, will be continually improved, taking advantage
of our Canadian experience with shared services.
We also plan a number of major technology ini-
tiatives to improve efficiency and support
growth in Internet banking and business bank-
ing, call centres and voice and data capacity.
We continue to improve the efficiency ratios
of acquired operations. For example, Scotiabank
Inverlat’s productivity ratio has improved steadily
over the past five years and is now approaching the all-Bank target of below 58%. This
has been achieved through rapid revenue growth, while costs have been well controlled.
Summary
International Banking continues to play an important role in Scotiabank’s success. Our goal
is to create a truly global organization that enables each country where we operate to meet
local market needs by drawing on our breadth of common expertise and best practices.
To further tap the potential
of the Chinese market, we
opened another representative
office – in Shanghai – in 2005.
Asia continues to offerlong-term potential.
S c o t i a b a n k 2 0 0 5 A n n u a l R e p o r t 2 3
60
70
80
90
2004 200520032002*2001*
Scotiabank Inverlatproductivity ratio(%)
* As per published numbers and notrestated for preferred shares

2 4 S c o t i a b a n k 2 0 0 5 A n n u a l R e p o r t
Opportunity growswith relationships.

REPORT ON BUSINESS L INES
D e l i v e r i n g c o n s i s t e n t , s t r o n g r e t u r n s
o n s h a r e h o l d e r c a p i t a l …
Scotia Capital, the Bank’s corporate and investment banking division, had
record results for the second consecutive year. Our net income has more
than doubled since 2002, and we exceeded our primary objective of
achieving a good return on shareholder capital.
Our improved returns are the result of changes we implemented in our busi-
ness mix over the last several years, which have significantly transformed our
business. We have achieved a better balance between lending and non-lending
services, lowered loan losses, increased cross-sales of derivatives, fixed income
and other products, and improved client profitability.
Great relationships are how this business grows. However, producing sustainable revenue growth – our second objective
– continues to be a challenge, as clients turn to alternative sources of capital. To counter this, we are focusing on
organic growth among current priority clients and selling additional products and services to them. We will also look
to growth opportunities and growth through acquisitions in selected industries – particularly mining and energy,
where we are looking to build global expertise.
Scotia Capital’s businesses are in two key geographies: our NAFTA platform (Canada, the United States and Mexico)
and Europe. Our objective is to expand business across the Scotia Capital regions, while also taking advantage of
opportunities in Asia.
Main photo, page 24: Scotia Capital was exclusive financial advisor to Kohlberg Kravis Roberts & Co. in their acquisition of Masonite – the largest leveraged buyoutin Canadian history. Seen here are KKR partners Scott Nuttall (left) and Paul Raether.
Photo, above left: Sarah Kavanagh and Lawrence Lewis were members of a cross-functional team assembled to facilitate a multi-product offering that includedthe $550 million IPO of CanWest MediaWorks Income Fund.
Photo, above right: As an international wholesale bank with unique NAFTA-wide capabilities, Scotia Capital is particularly well suited to meeting the complexneeds of CEMEX, the world’s third-largest cement company, represented here by Chief Financial Officer Rodrigo Treviño.
S c o t i a b a n k 2 0 0 5 A n n u a l R e p o r t 2 5
Scotia Capital net income($ millions)
2003 2004 2005
SCOTIA CAPITAL
665
819915

REPORT ON BUSINESS L INES
Canada
In Canada, our objective is to build deeper and more profitable relationships with the
corporate and government clients we serve, particularly our 260 highest-value, multi-
product clients. We have extensive capabilities, offering the full suite of wholesale products
and services.
United States
In the United States, Scotia Capital is a leading syndicated lender, primarily to Fortune
1000 clients, with increasing cross-sell of select capital markets products, such as fixed
income, derivatives and foreign exchange.
We achieved our primary objective, which was to be a top quartile manager of credit
risk, and we expect that this will continue in 2006. We did not have to make provisions
for any of our core clients, and we recorded a net recovery of loan losses in our portfolio.
We also achieved a divisional return on economic equity that was well above our target.
Mexico
Mexico Wholesale is a full-service wholesale bank within Scotiabank Inverlat, targeting
corporate, government and institutional investor clients operating in the Mexican market.
Our relationship managers specialize in 10 different industry sectors and focus on providing
solutions to clients, with increased emphasis on cross-selling local products and services,
as well as the NAFTA-wide capabilities of Scotia Capital.
Europe
In Europe, our strategy is to be a top-tier destination for expertise in several specialized
areas – in particular, shipping – and in serving European clients with interests in the
Americas and vice-versa. We measure success on the basis of return, top-tier management
of credit and the extent of our cross-selling accomplishments. We recently exited a number
of low-return relationships and rationalized our cost structure.
Beyond these key markets, Scotia Capital focuses on meeting the highly complex
needs of investor clients worldwide, and on providing specialist support by structuring,
marketing and trading capital-efficient products, such as derivatives, fixed income and
foreign exchange, to corporate and government clients. This includes ScotiaMocatta,
which provides us with a market-leading global platform in precious metals, as well as
institutional equity sales, trading and research.
Scotia Capital maintained high asset quality during the year by adhering to stringent
lending guidelines and continuing to improve management information systems. We also
generated revenue growth with new products and services, such as prime brokerage,
which helped us develop new relationships with select Canadian and U.S. hedge funds.
2005 Achievements
Reflecting our overall success, Scotia Capital was named Best Investment Bank in Canada
for 2005, for the second consecutive year, by Global Finance magazine.
One of our most significant initiatives during 2005 was the purchase of Calgary-based
Waterous & Co., and the subsequent formation of Scotia Waterous, a new force in the energy
O p p o r t u n i t y g r o w s w i t h
r e l a t i o n s h i p s .
ScotiaMocatta is a globalleader in precious metalstrading and finance.
ScotiaMocatta serves the needs of
a diverse client base of producers
and consumers of bullion, from
gold mining companies to central
banks.
2 6 S c o t i a b a n k 2 0 0 5 A n n u a l R e p o r t2 6 S c o t i a b a n k 2 0 0 5 A n n u a l R e p o r t

SCOTIA CAPITAL
industry. This partnership gives us an excellent opportunity to broaden our client base,
expand our presence and continue to build on our knowledge in the global oil and gas
industry.
This year, we took a major step by beginning to integrate the Mexican wholesale
business of Scotiabank Inverlat with our U.S. and Canadian operations. In September,
we launched the Scotia Capital brand to Mexican clients and media. Mexico Wholesale
gives us a NAFTA platform that none of our competitors can match. Although it may be
several years before the impact of this initiative is fully felt, we believe it will eventually
make a significant contribution to our business, and we are excited by the potential it
offers. In a recent example, Scotia Capital acted as the financial advisor to Mexico’s
Grupo Comercial Chedraui on its purchase of 30 retail stores from France’s Carrefour
Group – one of the largest merger-and-acquisition deals of the year in Mexico.
We strengthened the U.S. business by deepening our relationships with existing clients
through cross-selling, as well as adding new clients. In one of our most notable deals during
2005, we leveraged a 30-year relationship to take on the roles of sole lead arranger on
National Rural Co-operative’s US$1.3 billion financing, and co-documentation agent on a
nearly US$2 billion loan. We were also lead arranger for Columbus Communications in two
multi-country transactions where the client acquired cable and fibre assets in the Caribbean,
Central America and South America.
We participated in a number of other major deals during 2005. In the largest lever-
aged buyout transaction in Canadian history, Scotia Capital acted as exclusive financial
advisor to Kohlberg Kravis Roberts & Co. on its $3.2 billion purchase of Masonite
International Corporation. We also acted as Yellow Pages Group’s lead arranger and sole
bookrunner for $3 billion in credit facilities. The funds were used to finance their $2.6
billion acquisition of the SuperPages brand of Advertising Directory Solutions Holdings
Inc. and to refinance existing debt. Furthermore, we acted as Yellow Pages’ co-bookrunner
for both a $1.4 billion treasury offering of trust units via subscription receipts, as well as
an $800 million medium-term notes offering as part of the client’s refinancing plan in
relation to the acquisition. And Scotia Waterous acted as financial co-advisor to Unocal
Corporation on the sale of Northrock Resources Ltd. for US$1.8 billion.
We continued to develop high-margin targeted products in 2005. As part of the first
Canadian dollar foreign corporate private placement done in Canada, Scotia Capital led a
$600 million debt issuance for Bear Stearns.
The foreign exchange team made significant gains, tying as the market leader in a
third-party market share ranking. As well, Global Finance magazine named Scotia
Capital Best Foreign Exchange Bank in Canada for the second consecutive year.
The Corporate Derivatives team received several number one rankings in a third-party
market survey this year – on the quality index, for overall market penetration, for creative
ideas/structuring, best advice on overall balance sheet management and as lead dealer.
In another third-party market survey, Scotia Capital tied for first place on overall quality
for combined institutional equity sales, trading and research among all institutions.
We reviewed our back and middle-office operations to realize efficiencies, and central-
ized a number of processes in London and New York to reduce costs.
Together with Scotia Capital,
Scotia Waterous offers clients a
complete and seamless solution
for oil and gas M&A advice
and financing.
Scotia Waterous is aglobal leader in oil and gasmergers and acquisitions.
S c o t i a b a n k 2 0 0 5 A n n u a l R e p o r t 2 7S c o t i a b a n k 2 0 0 5 A n n u a l R e p o r t 2 7

REPORT ON BUSINESS L INES
2006 Priorities
In 2006, our high-level objectives remain the same: to consistently deliver a good return
on shareholder capital and sustainable growth in revenue, with careful attention to bal-
ancing risk with potential rewards.
In Canada, our objective for 2006 is to be in the top three ranked companies in all of
our product areas, and to continue to grow by launching new initiatives, such as products
targeting alternative asset managers. Cross-selling to our current clients will also be a key
factor in revenue growth – especially from our new Scotia Waterous platform. Overall,
we will continue to maintain credit quality by adhering to stringent lending guidelines
and fully implementing new internal ratings enhancement rules.
In the U.S., we will implement an initiative to enhance internal risk ratings, and roll
out more decision support tools, such as Moody’s Risk Advisor. We will continue to grow
revenues by deepening ongoing client relationships, cross-selling our NAFTA capabilities
and leveraging the Scotia Waterous platform.
Another objective is to increase revenues by expanding cross-sales of products to
existing clients, and by broadening our capabilities in specific markets with select tradi-
tional products, such as fixed income. As in Scotia Capital’s other business lines, we are
planning to target growing client segments, such as alternative asset managers, with
new, high-margin products, as well as growing our hedge fund of funds business.
We have been studying business opportunities in the hedge fund industry, the fastest-
growing segment of institutional investing, and have developed plans to double our current
share of revenue earned from hedge fund clients within the next year.
As it integrates with Scotia Capital, Mexico Wholesale will strengthen and profitably
grow its current abilities in lending, fixed income and derivatives, and will develop new
capabilities in other areas such as equities, real estate income trusts (REITs) and
structured products.
Overall, we will continue to closely manage operational risk, including implementing
new methodologies associated with credit derivative products and counterparty risk. And
we will continue to search for efficiencies in operations by consolidating global platforms.
In collaboration with International Banking, we plan to commit more resources to
broaden and strengthen our activities in Asia, given the long-term growth prospects in
that region.
We will continue to look for further acquisitions that will generate revenue growth,
enhance our product capabilities and complement our existing strategies.
Summary
Scotia Capital has successfully repositioned its business and is now moving confidently
forward with a number of revenue growth initiatives across products, clients and geo-
graphies. In doing so, however, we will not compromise return or risk.
2 8 S c o t i a b a n k 2 0 0 5 A n n u a l R e p o r t2 8 S c o t i a b a n k 2 0 0 5 A n n u a l R e p o r t
Our risk management professionals
are the Canadian market leaders
in creative engineering of derivative
products. They’re the only Canadian
derivatives team to provide credit,
equity and interest rate risk manage-
ment products under one roof.
Seen here are team members Jason
Thompson (left) and Christy Bunker.
Scotia Capital is uniquelypositioned to provideclients with first-rate riskproducts, backed up bybest-in-class execution.

Working together to turnopportunity into success.
At the Scotiabank Group, organizational success and employee
success go hand in hand.
It is our employees who build relationships with customers, who identify the opportunities – both large and small –
that ensure we continue to grow and improve as an organization, and who give generously of their time and
money to support the communities in which we live and work.
Scotiabank, in turn, ensures that employees around the world have the opportunity to realize their potential and
enjoy truly rewarding careers. We work together with them to develop their skills and knowledge through continu-
ous and targeted learning. We recognize and reward their performances with opportunities to advance, develop
new skills, assume new challenges, embark on new career paths and benefit from new experiences.
Our employees are committed to the organization and are proud of our reputation as a successful company and the
quality of the products and services we provide. Internal employee surveys conducted this past year indicated that
Scotiabank employees are generally more highly engaged than employees elsewhere. While 83% expressed overall
satisfaction with their work environments, our diversity index – which measures perceptions of fairness, respect and
management sensitivity to work-life balance issues – is a strong 85%.
EMPLOYEES
S c o t i a b a n k 2 0 0 5 A n n u a l R e p o r t 2 9S c o t i a b a n k 2 0 0 5 A n n u a l R e p o r t 2 9
Main photo: Scotiabank’s diversified business lines and numerous business support and administrative units provide opportunities forvaried and challenging careers. From left: Shakila Hashmi, Scotia Capital; Nestor Blanco, International Banking; and Carol Bobiwash,Domestic Banking.

EMPLOYEES
Wo r k i n g t o g e t h e r t o t u r n
o p p o r t u n i t y i n t o s u c c e s s .
Working together provides uswith a world of opportunity.
Top photo: Volunteers from Toronto’s Electronic Banking Contact Centre answered 3,221 pledge calls duringthe Canada for Asia tsunami relief telethon in January, collecting $257,000 of the more than $4 million raised.From left: Zahra Areys Jama, Bruce Khabemba and Ahmet Tall.
Middle photo: Scotiabank was recognized as a top employer in 2005. Here, Debbie Bhanu, Manager, Bayviewand Weldrick, Richmond Hill, Ont., confers with Joe Brandt, Senior Vice-President, Toronto Region.
Bottom photo: From left, Karen Fisher, Kasia Parent and Sharon Best exchange information at a networkingevent for women in Wealth Management.
3 0 S c o t i a b a n k 2 0 0 5 A n n u a l R e p o r t
Being a top employer helps Scotiabank cultivate an engaged workforce to the benefit of all
our stakeholders. Scotiabank was named one of the 50 Best Employers in Canada in
The Globe and Mail Report on Business Magazine, recognized as one of the top 20
employers in Jamaica in a study by the Jamaica Employers’ Federation and the
University of the West Indies, and named one of the 50 best companies to work for in
Mexico by The Great Place to Work Institute, a U.S. research consultancy.
Scotiabank also ranked among Training magazine’s top 100 training organizations in the
world for the second year in a row. The Employee Assistance Society of North America also
recognized our strong Employee Assistance Program by presenting us with its Corporate
Award of Excellence.
To ensure we are positioned for success, we make the identification and develop-
ment of future leaders a key priority. We use an innovative approach to leadership
development that balances formal, informal, internal and external support – as well as
experience-based learning and cross-collaboration throughout the organization. Through
our Advancement of Women initiative, we continue to develop networks and mentoring
programs, and increase external awareness of women in leadership roles at Scotiabank.
In October, we launched an internal Advancement of Women website that houses up-
to-date information on the initiative, webcasts of interviews with female senior execu-
tives, and mentoring resources for all employees.
Scotiabank employees generously donate their time and money to worthwhile causes
in their own communities and others around the world. Scotiabankers have done every-
thing from shaving their heads, running marathons and cycling miles to baking cookies,
losing weight and building houses, all to help those in need. We partner with our employ-
ees who demonstrate such enthusiasm and effort in making a difference by matching the
funds they raise and making donations to organizations where they regularly volunteer.
Reflecting our commitment to leadership in corporate social responsibility, we rank
among Canada’s largest corporate donors – and in 2005, we increased our donations and
sponsorships substantially. We gave more than $40 million to help people and communities
around the world. Most of our giving is focused in the areas of health, education, social
services, and arts and culture. We also provide relief funds when disasters occur – for
example, the December 2004 tsunami in southeast Asia, and hurricane Katrina in the
southern United States this fall.
For more information, please see our Public Accountability Statement/Corporate Social
Responsibility Report, available at www.scotiabank.com.

Management’s Discussion and Analysis
Table of ContentsOverview32 Financial Results32 Strong Shareholder Returns33 Impact of Foreign Currency Translation33 Non-GAAP Measures
Group Financial Performance34 Total Revenue34 Net Interest Income36 Other Income38 Non-Interest Expenses38 Taxes38 Non-Controlling Interest40 Credit Quality42 Fourth Quarter Results42 Summary of Quarterly Results
Group Financial Condition43 Assets and Liabilities44 Capital Management48 Off-Balance Sheet Arrangements50 Financial Instruments
Business Lines51 Overview52 Domestic Banking54 International Banking56 Scotia Capital58 Other
Risk Management59 Overview61 Credit Risk63 Market Risk67 Liquidity Risk69 Operational Risk69 Reputational Risk70 Environmental Risk
Controls and Accounting Policies71 Controls and Procedures71 Critical Accounting Estimates74 Changes in Accounting Policies75 Related Party Transactions
Supplementary Data76 Credit Risk81 Capital82 Other Information84 11-Year Statistical Review
Forward-Looking StatementsThis document includes forward-looking statements which are made pursuant to the “safe harbour”provisions of the United States Private Securities Litigation Reform Act of 1995. These statementsinclude comments with respect to the Bank’s objectives, strategies to achieve those objectives,expected financial results (including those in the area of risk management), and the outlook for theBank’s businesses and for the Canadian, United States and global economies. Forward-lookingstatements are typically identified by words or phrases such as “believe,” “expect,” “anticipate,”“intent,” “estimate,” “plan,” “may increase,” “may fluctuate,” and similar expressions of future orconditional verbs such as “will,” “should,” “would” and “could.”
By their very nature, forward-looking statements involve numerous assumptions, inherent risksand uncertainties, both general and specific, and the risk that predictions and other forward-lookingstatements will not prove to be accurate. The Bank cautions readers not to place undue reliance onthese statements, as a number of important factors could cause actual results to differ materiallyfrom the estimates and intentions expressed in such forward-looking statements. These factorsinclude, but are not limited to, the economic and financial conditions in Canada and globally;fluctuations in interest rates and currency values; liquidity; the effect of changes in monetary policy;legislative and regulatory developments in Canada and elsewhere; operational and reputationalrisks; the accuracy and completeness of information the Bank receives on customers and counter-parties; the timely development and introduction of new products and services in receptive markets;the Bank’s ability to expand existing distribution channels and to develop and realize revenues fromnew distribution channels; the Bank’s ability to complete and integrate acquisitions and its othergrowth strategies; changes in accounting policies and methods the Bank uses to report its financialcondition and the results of its operations, including uncertainties associated with critical accountingassumptions and estimates; the effect of applying future accounting changes; global capital marketsactivity; the Bank’s ability to attract and retain key executives; reliance on third parties to providecomponents of the Bank’s business infrastructure; unexpected changes in consumer spending andsaving habits; technological developments; consolidation in the Canadian financial services sector;changes in tax laws; competition, both from new entrants and established competitors; judicial andregulatory proceedings; acts of God, such as earthquakes; the possible impact of internationalconflicts and other developments, including terrorist acts and war on terrorism; the effects of diseaseor illness on local, national or international economies; disruptions to public infrastructure, includingtransportation, communication, power and water; and the Bank’s anticipation of and success inmanaging the risks implied by the foregoing. A substantial amount of the Bank’s business involvesmaking loans or otherwise committing resources to specific companies, industries or countries.Unforeseen events affecting such borrowers, industries or countries could have a material adverseeffect on the Bank’s financial results, businesses, financial condition or liquidity. These and other factorsmay cause the Bank’s actual performance to differ materially from that contemplated byforward-looking statements. For more information, see the discussion starting on page 59 of theManagement’s Discussion & Analysis.
The Bank cautions that the foregoing list of important factors is not exhaustive. When relyingon forward-looking statements to make decisions with respect to the Bank and its securities,investors and others should carefully consider the foregoing factors, other uncertainties and potentialevents. The Bank does not undertake to update any forward-looking statements, whether written ororal, that may be made from time to time by or on behalf of the Bank.
The “Outlook” sections that follow in this document are based on the Bank’s views and theactual outcome is uncertain. Readers should consider the above-noted factors when reviewing thesesections.
Additional information relating to the Bank, including the Bank’s Annual Information Form,can be located on the SEDAR website at www.sedar.com and on the EDGAR section of the SEC’swebsite at www.sec.gov.
December 19, 2005

Financial results
Scotiabank achieved record results in 2005 and exceeded all of
its financial targets. Credit quality continued to improve, and
retail asset growth was robust for the third consecutive year.
These were partly offset by lower interest margins in Canada,
and the negative impact of foreign currency translation.
Earnings per share (diluted) were $3.15, up 12% from $2.82
in 2004. Net income available to common shareholders was a
record $3,184 million, $292 million or 10% higher than last year.
This strong performance boosted return on equity to 20.9%, its
highest level in eight years.
Total revenues rose 4% year over year. Net interest income
was up 3%, as we continued to see very strong retail loan
growth, both domestically and in the international portfolio.
This growth was partly offset by the negative effect of foreign
currency translation, a decline in the overall net interest margin,
and a reduction in corporate loan volumes. Other income grew
5% this year, as increases in retail fees and record trading
revenues were partly offset by a decrease in credit fees and
lower gains on the sale of investment securities.
Credit quality in the corporate loan portfolio continued to
strengthen, as new impaired loan formations declined year over
year. The total provision for credit losses fell $160 million from
last year.
Expenses were up 3% from last year, tempered by the
effect of foreign currency translation. Much of the increase
was caused by growth in business volumes, as well as higher
benefit costs, performance-based compensation and marketing
expenditures. Our productivity ratio, at 56.3%, continues to
lead the industry. The ratio improved slightly year over year,
despite the impact of foreign currency translation and targeted
spending initiatives.
The overall tax rate was 20.5%, down marginally from last year.
Our capital position remains strong, as we continue to generate
significant capital from operations. Our Tier 1 capital ratio, at
11.1%, remains among the highest of the major Canadian banks.
Our tangible common equity ratio, a key measure of capital
strength, was 9.3%, the strongest among the major Canadian
banks by a wide margin.
Strong shareholder returns
Our solid financial performance continues to drive strong share-
holder returns. Total return (including both dividends and the
appreciation of the price of the Bank’s common shares) was
12% in 2005. Shareholders have had positive annual returns
from the Bank’s shares for 11 consecutive years, the best record
among Canada’s major banks.
This performance has been driven by our continued focus
on achieving sustainable earnings growth and a high return on
equity, and has resulted in
excellent long-term returns to
shareholders. The five-year
compound annual return on the
Bank’s shares has averaged 18%,
and 23% over the past 10 years.
We continue to outperform the
S&P/TSX Composite Total
Return Index by a wide margin.
Shareholders also received
two quarterly dividend increases
during the year. Dividends per
share totaled $1.32, an increase
of 20% from 2004.
O v e r v i e w
Total Shareholder ReturnFor the year ended October 31 2005 2004 2003 2002 2001 5-yr CAGR(1)
Closing market price per common share ($) 42.99 39.60 32.74 22.94 21.93 14.6%Dividends paid ($ per share) 1.32 1.10 0.84 0.73 0.62 21.4%Dividends paid (%) 3.3 3.4 3.7 3.2 2.9Increase in share price (%) 8.6 21.0 42.7 4.6 0.8Total annual shareholder return (%) (2) 12.1 24.7 46.8 7.8 3.7 18.1%
(1) Compound annual growth rate (CAGR)(2) Total annual shareholder return assumes reinvestment of quarterly dividends, and therefore may not equal the sum of dividend and share price returns in the table.
0
100
200
300
400
500
600
700
800
900
95 97 99 01 03 05
ScotiabankS&P/TSX Banks Total Return IndexS&P/TSX Composite Total Return Index
Return to CommonShareholdersShare price appreciation plusdividends reinvested, 1995=100
MANAGEMENT’S DISCUSSION AND ANALYSIS
3 2 S c o t i a b a n k 2 0 0 5 A n n u a l R e p o r t

OVERVIEW
S c o t i a b a n k 2 0 0 5 A n n u a l R e p o r t 3 3
Impact of foreign currency translation
The movement in foreign currency exchange rates continued to
have a negative effect on the Bank’s earnings in 2005, although
to a lesser extent than last year. The Canadian dollar appreciated
8% relative to the U.S. dollar, and 5% against the Mexican peso.
The dollar also strengthened against the Jamaican dollar and
many other currencies in which the Bank conducts its business.
Changes in the average exchange rates affected net income
as shown in the following table:
Average exchange rate 2005 2004 2003
U.S. dollar/Canadian dollar 0.8217 0.7586 0.6936Mexican peso/Canadian dollar 9.0523 8.5968 7.3388
Impact on income ($ millions) 2005 vs. 2004 2004 vs. 2003
Net interest income $ (164) $ (321)Other income (123) (212)Non-interest expenses 95 227Other items (net of tax) 47 96Net income $ (145) $ (210)Earnings per share (diluted) $ (0.14) $ (0.21)
We will continue to take appropriate action to mitigate the
effect of foreign currency translation where it is cost-effective
to do so. A description of our hedging strategies can be found
on page 65.
Non-GAAP measures
The Bank, like many banks, analyzes revenues, net interest
margin and the productivity ratio on a taxable equivalent basis
(TEB). This methodology grosses up the tax-exempt income
earned on certain securities and recorded in the financial
statements on a GAAP basis, to an equivalent before-tax basis.
The corresponding offset is made in the provision for income
taxes. Management uses this form of reporting internally, and
believes that this basis for presentation provides a uniform
comparability of net interest income arising from both taxable
and non-taxable sources and facilitates a consistent basis of
measurement. This use of TEB results in certain measures that
are different from comparable GAAP measures, and may not be
the same as measures provided by other companies. The amount
of the taxable equivalent adjustment was $326 million in 2005,
compared to $274 million last year.

MANAGEMENT’S DISCUSSION AND ANALYSIS
3 4 S c o t i a b a n k 2 0 0 5 A n n u a l R e p o r t
Total revenue
Total revenue (on a taxable equivalent basis) was $10,726
million in 2005, an increase of $431 million or 4% from the
prior year. Before the impact of foreign currency translation,
the Bank’s revenues grew by $718 million or 7%. Growth was
broad based, with higher results from Domestic Banking, record
trading revenues, strong results in International Banking and
contributions from acquisitions made in 2005. This was
partially offset by lower corporate banking revenues and the
negative effect of foreign currency translation, as the Canadian
dollar continued to appreciate against most currencies in the
countries in which the Bank operates.
Net interest income
Net interest income on a taxable equivalent basis was $6,197
million in 2005, up $222 million or 4% over last year, despite
the negative impact of $164 million due to foreign currency
translation. Underlying net interest income rose by $386 million
or 6%.
The Bank’s interest margin (net interest income as a
percentage of average assets) was 2.00% in 2005, a decrease of
10 basis points from the previous year. This was due primarily
to a decline in the Canadian currency interest margin.
Canadian currency net interest income was $3,654 million in
2005, an increase of $134 million or 4% from the prior year.1
This was largely driven by another strong year of deposit and
retail lending growth, both in residential mortgages and personal
loans, resulting in a substantial rise of 14% in average retail
asset balances. These increases were partly offset by a
compression in the interest margin caused by several factors,
including customer preference for lower-yielding variable-rate
mortgages, a low level of interest rates and a flattening of the
yield curve. As well, retail asset growth exceeded retail deposit
growth, with the difference being funded by more expensive
wholesale deposits.
Foreign currency net
interest income was $2,543
million this year, $88 million
above 2004, despite a $164
million negative impact due to
foreign currency translation.
Underlying net interest
income rose by $252 million
or 10%. This increase was
largely from strong asset
growth in International
Banking, particularly
Scotiabank Inverlat in Mexico,
as well as the Caribbean and Central America. The acquisition
of Banco de Comercio in El Salvador contributed to this growth.
These improvements were partly offset by the impact of lower
corporate lending volumes and margins, primarily in the U.S.
and Europe.
Outlook
Canadian currency net interest income is expected to increase
next year, as a result of continued asset growth and some
stabilization of the interest margin. Foreign currency net
interest income should continue to grow, on the strength of
local currency asset growth. The extent of this growth will be
impacted by the volatility of the Canadian dollar.
G r o u p F i n a n c i a l P e r f o r m a n c e
1
2
3
4
5
6
7
02 04 050301
Net interest income by currencytaxable equivalent basis$ billions
Foreign currencyCanadian currency
1. 2004 Canadian currency net interest income was reduced by $164 million, reflectingthe impact of the retroactive reclassification of certain capital instruments fromshareholders’ equity to liabilities on the consolidated balance sheet, in accordancewith a new accounting standard. See Note 13 to the Consolidated Financial Statementson page 109.
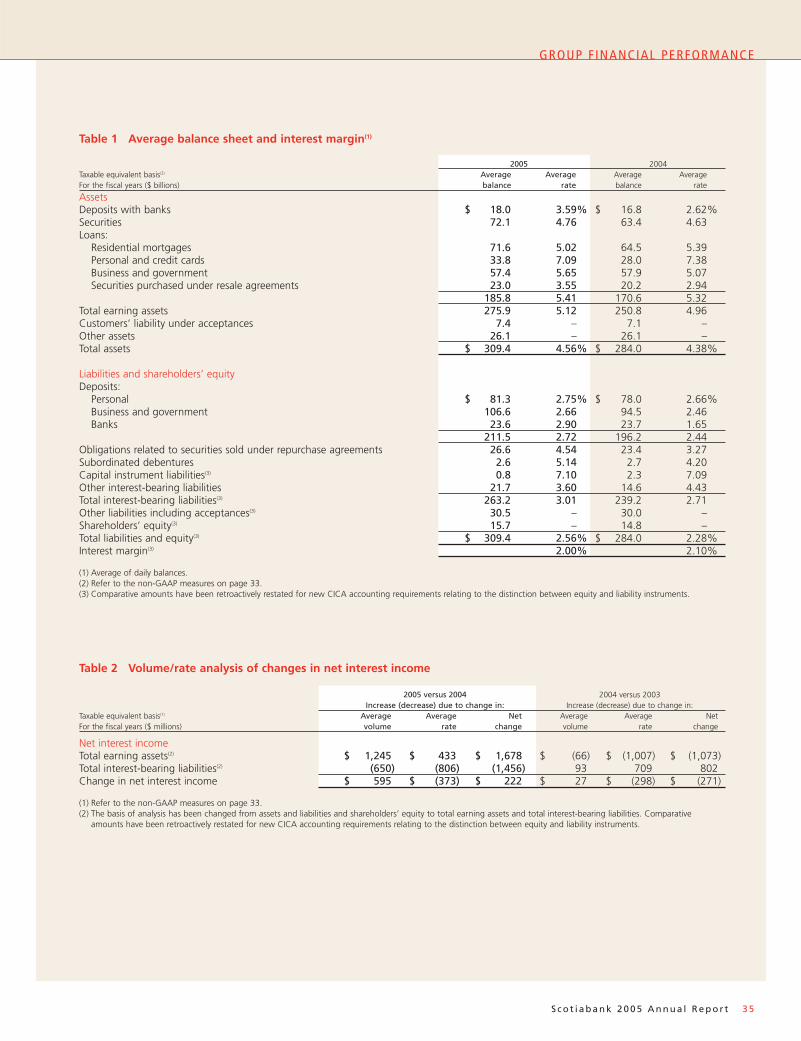
Table 2 Volume/rate analysis of changes in net interest income
2005 versus 2004 2004 versus 2003Increase (decrease) due to change in: Increase (decrease) due to change in:
Taxable equivalent basis(1) Average Average Net Average Average NetFor the fiscal years ($ millions) volume rate change volume rate change
Net interest incomeTotal earning assets(2) $ 1,245 $ 433 $ 1,678 $ (66) $ (1,007) $ (1,073)Total interest-bearing liabilities(2) (650) (806) (1,456) 93 709 802Change in net interest income $ 595 $ (373) $ 222 $ 27 $ (298) $ (271)
(1) Refer to the non-GAAP measures on page 33.(2) The basis of analysis has been changed from assets and liabilities and shareholders’ equity to total earning assets and total interest-bearing liabilities. Comparative
amounts have been retroactively restated for new CICA accounting requirements relating to the distinction between equity and liability instruments.
Table 1 Average balance sheet and interest margin(1)
2005 2004Taxable equivalent basis(2) Average Average Average AverageFor the fiscal years ($ billions) balance rate balance rate
AssetsDeposits with banks $ 18.0 3.59% $ 16.8 2.62%Securities 72.1 4.76 63.4 4.63Loans:
Residential mortgages 71.6 5.02 64.5 5.39Personal and credit cards 33.8 7.09 28.0 7.38Business and government 57.4 5.65 57.9 5.07Securities purchased under resale agreements 23.0 3.55 20.2 2.94
185.8 5.41 170.6 5.32Total earning assets 275.9 5.12 250.8 4.96Customers’ liability under acceptances 7.4 – 7.1 –Other assets 26.1 – 26.1 –Total assets $ 309.4 4.56% $ 284.0 4.38%
Liabilities and shareholders’ equityDeposits:
Personal $ 81.3 2.75% $ 78.0 2.66%Business and government 106.6 2.66 94.5 2.46Banks 23.6 2.90 23.7 1.65
211.5 2.72 196.2 2.44Obligations related to securities sold under repurchase agreements 26.6 4.54 23.4 3.27Subordinated debentures 2.6 5.14 2.7 4.20Capital instrument liabilities(3) 0.8 7.10 2.3 7.09Other interest-bearing liabilities 21.7 3.60 14.6 4.43Total interest-bearing liabilities(3) 263.2 3.01 239.2 2.71Other liabilities including acceptances(3) 30.5 – 30.0 –Shareholders’ equity(3) 15.7 – 14.8 –Total liabilities and equity(3) $ 309.4 2.56% $ 284.0 2.28%Interest margin(3) 2.00% 2.10%
(1) Average of daily balances.(2) Refer to the non-GAAP measures on page 33.(3) Comparative amounts have been retroactively restated for new CICA accounting requirements relating to the distinction between equity and liability instruments.
GROUP F INANCIAL PERFORMANCE
S c o t i a b a n k 2 0 0 5 A n n u a l R e p o r t 3 5

MANAGEMENT’S DISCUSSION AND ANALYSIS
3 6 S c o t i a b a n k 2 0 0 5 A n n u a l R e p o r t
Other income
Other income was $4,529 million in 2005, an increase of $209
million or 5% from 2004, despite a reduction of $123 million
from foreign currency translation. Underlying year-over-year
growth was a solid $332 million or 8%.
Card revenues rose 9% to $251 million in 2005. This was
due mainly to strong growth in transaction volumes in both
Domestic and International Banking, especially the Caribbean,
as well as continued expansion of the commercial card program.
Revenues from deposit and payment services grew by 8%
to $701 million in 2005. This growth arose from pricing changes
and higher volumes. Partly offsetting this growth was the
effect of foreign currency translation on International Banking
revenues.
Mutual fund fees were a record $193 million in 2005, an
increase of 13% from last year. This reflected higher average
balances, primarily in Canada, where balances rose 13%, and
a revised management fee structure.
Revenues from investment management, brokerage and trust
services were $600 million in 2005, an increase of $96 million
or 19% from last year, due in part to a reclassification of certain
fee income from investment banking revenues. Excluding this
reclassification, revenues rose 9%. ScotiaMcLeod full-service
retail brokerage commissions increased as a result of 14% growth
in trading volumes and higher managed asset volumes. Trust
and investment management fees were also higher, reflecting
continued business growth in Canada.
Credit fees declined by $41 million or 7% to $542 million in
2005. More than half of the decrease was due to the effect of
foreign currency translation. As well, fees were affected by
lower loan volumes, due to a very competitive environment,
and more borrowers choosing to directly access the highly
liquid capital markets.
Trading revenues were a record $594 million in 2005, an
increase of $118 million or 25% over last year, mainly in deriva-
tives, fixed income and institutional equity trading. Foreign
exchange and precious metals trading remained strong, near
the record results of 2004.
Investment banking revenues were $680 million in 2005, an
increase of $32 million or 5% from last year. Underwriting fees
and institutional brokerage fees rose $16 million, reflecting the
impact of the acquisition of Waterous & Co. by Scotia Capital,
strong new issue revenue and record institutional brokerage
fees. As well, non-trading foreign exchange revenues were
$16 million above 2004 levels due to growth in Domestic and
International Banking. These increases were partly offset by the
fee reclassification to investment management, brokerage and
trust services noted above.
The net gain on the sale of investment securities was $414
million in 2005, a decline of $63 million or 13% from the very
strong level of gains realized last year. There were lower net
gains from bonds and private equity fund investments. In 2005,
the Bank recorded a $118 million pre-tax gain on the sale of a
portion of its investment in Shinsei Bank in Japan, compared
to a gain of $125 million realized last year. Higher net gains on
other equity investments partly offset these decreases.
Securitization revenues fell by $32 million during the year
to $79 million, largely from a 40% decline in mortgage
securitizations, as well as maturities of certain revolving credit
securitizations. The decline in this category was offset by
increases in other fee-based revenues and net interest income.
Other revenues were virtually unchanged from last year, as
higher insurance revenues were offset by decreases in a number
of areas, including lower loan collection fees related to the
Baninter acquisition in the Dominican Republic; loan collection
activities are now complete. As well, there was a gain on sale
of Scotiabank Inverlat’s point of sale business in 2004.
Outlook
We expect growth in most retail revenue categories in 2006.
Capital markets revenues should show modest growth, while
credit fees will be linked to activity in the corporate loan
market. The extent of this growth will be impacted by the
volatility of the Canadian dollar.
3.0
3.5
4.0
4.5
01 02 03 04 05
Many sources of other income Other incomeexcluding sales of businesses$ billions
excluding chargesfor Argentina
Deposit & paymentservicesInvestment bankingInvestmentmanagement,brokerage & trustTrading revenues
Credit feesGains on sale ofinvestment securitiesCard revenuesMutual fundsSecuritizationOther

Table 3 Other income2005
versusFor the fiscal years ($ millions) 2005 2004 2003 2002 2001 2004
Card revenues $ 251 $ 231 $ 204 $ 280 $ 211 9%
Deposit and payment servicesDeposit services 581 536 479 445 456 8Other payment services 120 110 114 111 105 9
701 646 593 556 561 8
Mutual funds 193 171 161 174 161 13
Investment management, brokerage and trustRetail brokerage 427 335 280 304 317 28Investment management and custody 62 53 53 32 33 17Personal and corporate trust 111 116 122 137 127 (5)
600 504 455 473 477 19Credit feesCommitment and other credit fees 436 477 565 540 504 (9)Acceptance fees 106 106 119 131 136 –
542 583 684 671 640 (7)
Trading revenues 594 476 501 439 (1) 447 25
Investment bankingUnderwriting fees and other commissions 493 477 472 405 352 3Foreign exchange and other 187 171 201 187 246 10
680 648 673 592 598 5
Net gain on investment securities 414 477 159 179 (1) 217 (13)
Securitization revenues 79 111 140 162 220 (29)
Other 475 473 445 317 (1) 447 –
Total before the undernoted 4,529 4,320 4,015 3,843 3,979 5Gains on sale of businesses – – – 99 92 –Total other income $ 4,529 $ 4,320 $ 4,015 $ 3,942 $ 4,071 5%Percentage increase (decrease) over
previous year 5% 8% 2% (3)% 11%
(1) The following items were affected by Argentine charges – trading revenues included a gain of $4, net gain on investment securities included a charge of $20 and otherincluded a charge of $87.
Table 4 Trading revenue
Taxable equivalent basisFor the fiscal years ($ millions) 2005 2004 2003 2002 2001
Reported in:Other income $ 594 $ 476 $ 501 $ 439 $ 447Net interest income 340 287 301 337 190Total trading revenue 934 763 802 776 637
By trading products:Securities trading 175 112 179 117 140Foreign exchange and precious metals trading 295 306 280 257 216Derivatives and other trading 464 345 343 402 281Total trading revenue $ 934 $ 763 $ 802 $ 776 $ 637
% of total revenues (net interest income plus other income) 9% 7% 8% 7% 6%
GROUP F INANCIAL PERFORMANCE
S c o t i a b a n k 2 0 0 5 A n n u a l R e p o r t 3 7

MANAGEMENT’S DISCUSSION AND ANALYSIS
3 8 S c o t i a b a n k 2 0 0 5 A n n u a l R e p o r t
Non-interest expenses
Non-interest expenses were $6,043 million in 2005, an increase
of $181 million or 3% from last year, which was moderated by
the positive effect of foreign currency translation of $95 million.
Salaries and employee benefits were $3,488 million, up 1%
during the year, tempered by the effect of foreign currency
translation. Underlying salary and benefit expenses, before the
impact of foreign currency translation and the acquisitions
during the year, rose 2%. There was higher performance-based
compensation, reflecting the strong growth in retail brokerage
revenues in ScotiaMcLeod, and higher trading revenues in
Scotia Capital. This was partly offset by a decline in stock-based
compensation, due to a smaller rise in the Bank’s share price in
2005, and increased hedging activities. Pensions and other
employee benefits declined slightly, as higher medical, dental
and insurance costs were more than offset by lower payroll
taxes and adjustments to pension-related costs.
Premises and technology expenses were $1,148 million in
2005, an increase of 1% from last year. This was mainly the
result of a variety of technology projects, including system
enhancements and branch upgrades, partly offset by lower
depreciation expense.
Advertising and business development costs rose $22 million
or 11% year over year, due mainly to higher expenses in
Inverlat for a major credit card marketing campaign, as well
as higher advertising in the Caribbean.
Professional fees were $186 million, up $23 million or 14%
from last year, due to increases in legal and consulting fees,
as well as small increases in other categories.
Other expenses rose $79 million year over year, with
increases in a number of categories, including litigation costs,
donations and community giving, credit card reward points and
employee training.
The Bank’s productivity ratio – a measure of efficiency in the
banking industry – was 56.3%. This was a slight improvement
from last year, despite increased spending on initiatives to
facilitate future revenue growth. The ratio remained better
than our target of 58%.
Outlook
Cost discipline will continue to be a priority, although we will
continue to invest in revenue growth initiatives. Overall, while
some growth in operating expenses is likely, the Bank’s produc-
tivity ratio is expected to be in line with our objective for 2006.
Taxes
The Bank pays a large number of taxes, which include direct
taxes on income by Canadian federal and provincial govern-
ments and the governments of foreign jurisdictions in which
the Bank operates, as well as certain indirect taxes.
In 2005, the provision for income taxes and other taxes was
$1.6 billion, up 9% from the prior year.
The provision for income taxes was $847 million in 2005, an
increase of 8% over last year. This largely reflected the growth
in pre-tax income of 10%, partially offset by a higher proportion
of income from foreign subsidiaries with lower tax rates,
resulting in an overall effective tax rate for the year of 20.5%,
compared to 20.8% last year. Scotiabank Inverlat continued to
benefit from the utilization of previously unrecognized tax loss
carryforwards.
Indirect taxes, which include payroll taxes, business and
capital taxes, and deposit insurance premiums, were $416
million in 2005, up marginally from last year.
Outlook
The Bank’s effective tax rate should remain in the range of
20 to 23%, although it may vary on a quarterly basis.
Non-controlling interest
The deduction for non-
controlling interest in
subsidiaries was $71 million in
2005, a decline of $4 million
from 20041, reflecting the
full-year impact of the Bank
increasing its ownership of
Scotiabank Inverlat to 97%
during 2004.
1,000
2,000
3,000
4,000
5,000
6,000
03 04 05
54
58
62
66
70
74
01 02 03 04 05
Expenses well controlled$ millions
Industry-leading productivitynon-interest expenses as a %of revenue (TEB)
OtherProfessional & TaxesCommunications &advertising
Premises &technologySalaries &benefits
Scotiabank 5 other major Canadian banks
(Source: published financial data)
500
1,000
1,500
03 04 0501 02
Direct and indirect taxes$ millions
Direct taxes Indirect taxes
1. See footnote 1 on page 34.

Table 6 Taxes2005
versusFor the fiscal years ($ millions) 2005 2004 2003 2002 2001 2004
Income taxesProvision for income taxes (1)(2) $ 847 $ 786 $ 777 $ 594 $ 869 8%Taxable equivalent adjustment(3) 326 274 278 268 230 19Provision for income taxes (TEB)(3) 1,173 1,060 1,055 862 1,099 11
Other taxesPayroll taxes 137 139 139 149 149 (1)Business and capital taxes 147 142 144 168 208 3Goods and services and other 132 121 110 114 110 9Total other taxes 416 402 393 431 467 3Total taxes (4) $ 1,589 $ 1,462 $ 1,448 $ 1,293 $ 1,566 9%
(1) Includes provision for (recovery of) income tax related to the loss on disposal of subsidiary operations for Scotiabank Quilmes in 2003 – $3; 2002 – $(254); 2001 – $(38).(2) Comparative amounts have been retroactively restated for new CICA accounting requirements relating to the distinction between equity and liability instruments.(3) Taxable equivalent basis. Refer to the non-GAAP measures on page 33.(4) Comprised of $988 of Canadian taxes (2004 – $910; 2003 – $953; 2002 – $811; 2001 – $1,036) and $601 of foreign taxes (2004 – $552; 2003 – $495; 2002 – $482;
2001 – $530).
Table 5 Non-interest expenses and productivity2005
versusFor the fiscal years ($ millions) 2005 2004 2003 2002 2001 2004
Salaries and employee benefitsSalaries $ 1,963 $ 1,933 $ 2,001 $ 2,091 $ 2,047 1%Performance-based compensation 1,020 991 920 834 809 3Pensions and other employee benefits 505 528 440 419 364 (4)
3,488 3,452 3,361 3,344 3,220 1Premises and technologyNet premises rent 176 170 180 192 200 4Premises repairs and maintenance 50 46 44 53 49 8Property taxes 61 58 56 57 59 5Computer equipment, software and data
processing 519 509 498 456 404 2Depreciation 173 189 208 243 243 (8)Other premises costs 169 167 170 182 178 1
1,148 1,139 1,156 1,183 1,133 1CommunicationsTelecommunications 64 63 68 74 75 1Stationery, postage and courier 191 185 183 207 210 4
255 248 251 281 285 3Advertising and business developmentAdvertising and promotion 139 113 103 105 118 23Travel and business development 93 97 96 103 99 (4)
232 210 199 208 217 11
Professional 186 163 141 136 157 14
Business and capital taxesBusiness taxes 91 89 90 118 121 2Capital taxes 56 53 54 50 87 6
147 142 144 168 208 3OtherEmployee training 45 43 37 42 43 5Amortization of goodwill and other intangibles 29 27 29 28 52 8Other 513 438 382 347 347 17
587 508 448 417 442 15Total before the undernoted 6,043 5,862 5,700 5,737 5,662 3Loss on disposal of subsidiary operations (1) – – 31 237 – –Total non-interest expenses $ 6,043 $ 5,862 $ 5,731 $ 5,974 $ 5,662 3%Productivity ratio (TEB)(2)(3) 56.3% 56.9% 55.9% 55.7% 54.6%
(1) The loss on disposal of subsidiary operation was incurred for Scotiabank Quilmes.(2) Taxable equivalent basis. Refer to the non-GAAP measures on page 33.(3) Comparative amounts have been retroactively restated for new CICA accounting requirements relating to the distinction between equity and liability instruments.
GROUP F INANCIAL PERFORMANCE
S c o t i a b a n k 2 0 0 5 A n n u a l R e p o r t 3 9

MANAGEMENT’S DISCUSSION AND ANALYSIS
4 0 S c o t i a b a n k 2 0 0 5 A n n u a l R e p o r t
Credit quality
Impaired loans
Net impaired loans, after deducting the specific allowance for
credit losses, were $681 million at October 31, 2005, a significant
improvement of $198 million from a year ago. The largest
decline was in Scotia Capital, reflecting improved credit
conditions and the positive impact of risk and portfolio
management strategies.
As shown in the chart below, net impaired loans as a
percentage of loans and acceptances were 0.34% at October 31,
2005, much lower than 0.49% a year ago.
In Domestic Banking, the credit quality of the portfolio
remained in excellent condition. Despite an increase of
$44 million in gross impaired loans in the retail portfolio to
$311 million, retail delinquency rates were virtually unchanged
from last year. The credit quality of the commercial loan
portfolio remained good. Gross impaired loans increased
modestly by $31 million to $201 million, mainly as a result of
two new formations in the fourth quarter.
In International Banking, the credit quality of the portfolio
remained good. Gross impaired loans declined by $66 million,
notwithstanding a $62 million increase due to the acquisition of
Banco de Comercio in 2005. Most of the decline was in Asia, the
Caribbean and Mexico, reflecting a lower level of problem loans
in these regions.
Gross impaired loans in Scotia Capital’s U.S. portfolio fell by
$370 million to $331 million, a decline of just over 50%. Gross
impaired loans in Canada declined by $27 million to $25 million,
and remained stable in Europe at $220 million.
Specific provision for credit losses
The specific provision for credit losses was $275 million, down
substantially from $490 million last year, mostly in the commer-
cial and corporate portfolios, reflecting better credit conditions
throughout 2005.
Domestic Banking provisions were $274 million, a decrease
of $43 million from last year. The improvement was entirely in
the commercial portfolio where the provisions declined by
$61 million to $49 million. This reduction was offset in part
by an increase of $18 million in retail loans, consistent with
the continued growth in that portfolio. Nevertheless, retail
provisions remained low at 0.22% of average assets.
In International Banking, while provisions of $70 million
were unchanged from last year, higher provisions in Mexico
and Chile were offset by a decline in the Caribbean and Asia.
In Scotia Capital, there was a net recovery of $71 million in
2005, compared to provisions of $106 million in 2004. Of the
$177 million reduction, $147 million was in the U.S. and $33
million in Europe. These declines were due to fewer new
problem loans in 2005 compared to the previous year. Overall,
strong credit conditions prevailed in 2005.
General allowance
During 2005, the general allowance for credit losses was reduced
by $45 million to $1,330 million at October 31, 2005, or 0.82%
of risk-weighted assets. The mix of economic and business
trends which factor in the determination of the general
allowance were more favourable this year, consistent with
improved credit conditions and the credit quality of the
portfolio. This was tempered somewhat by the potential impact
on the loan portfolio of the significant appreciation of the
Canadian dollar, rising energy prices and weakness in the
forestry and auto sectors.
Outlook
A high level of net recoveries was realized in the corporate
lending portfolio in 2005 due to favourable credit conditions.
However, this level of recoveries is not sustainable. As a result,
the specific provision for credit losses is expected to be higher
in 2006.
The general allowance may, however, be further reduced in
2006 if the positive trends in economic and business conditions
continue.
0.0
0.3
0.6
0.9
1.2
01 02 03 04 05
Net impaired loan ratioas a % of loans & acceptances,as at October 31
Credit lossesspecific provisions as a % ofaverage loans & acceptances
excludingchargesfor Argentina
0.2
0.4
0.6
0.8
1.0
01 02 03 04 05

Table 7 Impaired loans by business line
2005Allowancefor credit Gross Impaired Loans
As at October 31 ($ millions) Net losses Gross 2004 2003 2002 2001
DomesticRetail $ 95 $ (216) $ 311 $ 267 $ 292 $ 287 $ 258Commercial 88 (113) 201 170 184 225 332
183 (329) 512 437 476 512 590International(1)
Latin America (68) (470) 402 369 607 995 1,587Caribbean 173 (85) 258 292 305 329 283Asia 19 (50) 69 133 142 164 302Europe 1 (2) 3 4 63 84 63
125 (607) 732 798 1,117 1,572 2,235Scotia CapitalCanada 5 (20) 25 52 199 127 203United States 249 (82) 331 701 1,084 1,688 1,280Other 119 (101) 220 212 386 113 156
373 (203) 576 965 1,669 1,928 1,639Gross impaired loans 1,820 2,200 3,262 4,012 4,464Allowance for credit losses
– specific and country risk(1) (1,139) (1,321) (1,740) (1,917) (2,730)$ 681 $ 879 $ 1,522 $ 2,095 $ 1,734
Allowance for credit losses –general (1,330) (1,330) (1,375) (1,475) (1,475) (1,475)
Net impaired loans after generalallowance $ (649) $ (496) $ 47 $ 620 $ 259
Net impaired loans(2) as a % ofloans and acceptances 0.34% 0.49% 0.85% 1.08% 0.94%
Specific allowance(1) for credit lossesas a % of gross impaired loans 63% 60% 53% 48% 61%
(1) Includes designated emerging market gross impaired loans and offsetting country risk allowance as follows: 2003 – $21; 2002 – $25; 2001 – $25.(2) Net impaired loans after deducting specific allowance for credit losses.
Table 8 Provisions for credit losses
For the fiscal years ($ millions) 2005 2004 2003 2002 2001
Specific provisions for credit lossesNet specific provisions $ 480 $ 648 $ 1,057 $ 2,198 $ 1,373Recoveries (205) (158) (164) (169) (123)Net specific provisions for credit losses 275 490 893(1) 2,029(1) 1,250General provision (45) (100) – – 175Total net provisions for credit losses $ 230 $ 390 $ 893 $ 2,029 $ 1,425
(1) Excluding reversals of credit losses (2002 – provision for credit losses) related to Argentina, net specific provisions were: 2003 – $957; 2002 – $1,575.
GROUP F INANCIAL PERFORMANCE
S c o t i a b a n k 2 0 0 5 A n n u a l R e p o r t 4 1

Fourth quarter results
Net income available to common shareholders was $803 million
in the fourth quarter, an increase of $102 million or 15% from
the same quarter last year, despite a negative impact of $24
million from foreign currency translation. Underlying net
income rose by $126 million or 18% from last year. The year-
over-year growth was due mainly to higher net interest income
driven by asset growth, increased brokerage and investment
management revenues and greater securities gains, partly offset
by a compression in the margin and higher expenses.
Total revenue (on a taxable equivalent basis) was $2,735
million in the fourth quarter, an increase of $278 million or 11%
over the same quarter last year, notwithstanding a negative
foreign currency translation impact of $56 million or 2%.
Quarter over quarter, total revenue rose $46 million or 2%,
tempered by a $47 million negative impact from foreign
currency translation.
Net interest income (on a taxable equivalent basis) was
$1,581 million in the fourth quarter, an increase of $120 million
or 8% over the same quarter last year, and $20 million above
the third quarter.
The Bank’s interest margin was 1.97% in the fourth quarter,
a decrease of nine basis points from last year, but unchanged
from last quarter.
Other income was $1,154 million in the fourth quarter, an
increase of $158 million or 16% from the same quarter last year.
This growth was driven by higher net gains on the sale of
investment securities and increased retail brokerage and trading
revenues. The Waterous & Co. and Banco de Comercio acquisi-
tions also contributed to the increase. Foreign currency
translation reduced other income by $20 million.
The total provision for credit losses was $36 million in the
fourth quarter, compared to $40 million last year and $85 million
in the previous quarter. This quarter’s provision comprised $81
million in specific provisions and a reduction of $45 million in the
general allowance for credit losses.
The specific provision for credit losses of $81 million in the
fourth quarter was down slightly from $90 million in the fourth
quarter of last year and $85 million in the previous quarter. The
continuing low levels of provisions reflect a generally good credit
environment. Scotia Capital had a net recovery of $7 million in
the fourth quarter, compared to a net recovery of $25 million in
the fourth quarter of last year and a $2 million provision for
credit losses in the previous quarter. In Domestic Banking, overall
credit quality remained strong, with specific provisions of $69
million, relatively unchanged from the same period last year and
the prior quarter. Specific provisions in International Banking of
$16 million in the fourth quarter were down from $21 million in
the previous quarter, and $43 million in the fourth quarter last
year when higher provisions were taken in the Caribbean region
due to the effects of hurricanes.
Non-interest expenses were $1,579 million in the fourth
quarter, an increase of $118 million or 8% over the same quarter
last year. Foreign currency translation had a positive impact on
expenses, partly offset by the impact of the Banco de Comercio
and Waterous & Co. acquisitions. Also contributing to the
increase were higher advertising costs, mainly from a major credit
card marketing campaign in Mexico, an underlying 3% increase
in salaries and employee benefits, and higher litigation costs.
Quarter over quarter, non-interest expenses rose $62 million,
due mainly to higher advertising, technology and professional
expenses, employee training and volume-driven appraisal and
acquisition fees.
The Bank’s effective tax rate was 20.4% in the fourth quarter,
a 180 basis point increase from the same quarter last year but
virtually unchanged from last quarter. The year-over-year
increase was due primarily to higher income from tax-exempt
securities in the prior year. This effect was partially offset by
higher levels of earnings from foreign subsidiaries with lower
tax rates.
The deduction for non-controlling interest in subsidiaries
was $20 million for the quarter, up $7 million from the same
period last year, and $3 million from last quarter due to higher
levels of earnings in subsidiaries.
Summary of quarterly results
The Bank’s results in each quarter this year were higher than
those in the same quarters of 2004. A major contributing factor
was the large decline in credit losses in the first two quarters of
this year compared to the corresponding quarters last year. As
well, revenues were higher in each of the quarters of 2005, with
the exception of the second quarter, where the prior year’s
quarter benefited from unusually high gains on securities.
Positive factors were continued solid retail asset growth in
Canada, strong local currency asset growth in the Caribbean
and Mexico, as well as higher trading and retail brokerage
revenues. On the negative side, earnings over the past eight
quarters were affected by continued appreciation of the
Canadian dollar, margin compression and lower credit fees,
particularly in the U.S. An eight-quarter trend in net income
and other selected information is provided on page 83.
MANAGEMENT’S DISCUSSION AND ANALYSIS
4 2 S c o t i a b a n k 2 0 0 5 A n n u a l R e p o r t

GROUP F INANCIAL CONDITION
S c o t i a b a n k 2 0 0 5 A n n u a l R e p o r t 4 3
Assets & liabilities
Assets
The Bank’s total assets were $314 billion as at October 31, 2005,
up $35 billion or 12% from last year. Growth was spread across
most asset categories, and was offset marginally by the trans-
lation impact of the stronger Canadian dollar, which reduced
assets by $3 billion.
Securities
Securities increased $15 billion from last year. Trading
securities rose $7 billion, largely in Scotia Capital, where these
securities are used to hedge market risk relating to trading
activities with clients, with smaller increases in Scotiabank
Inverlat’s trading portfolio.
Investment securities rose by $8 billion, due primarily to the
$5 billion that was recognized as a result of the consolidation of
a multi-seller commercial paper conduit from the adoption of
new accounting standards for variable interest entities (VIEs).
As at October 31, 2005, the surplus of the market value over
book value of the Bank’s investment securities was $1,035 million,
down only $13 million from the prior year, notwithstanding net
realized gains of $414 million in 2005. The Bank realized a gain
of $118 million on the sale of part of its holdings in Shinsei Bank
of Japan in 2005, compared to a gain of $125 million in 2004.
A breakdown of the surplus is shown in Table 27 on page 82.
Loans
The Bank had solid growth
in its loan portfolio in 2005,
with loans up $19 billion or
11%. Loan balances are at
their highest level in five
years. Domestic retail lending
operations continued to
reflect very good perform-
ance. Residential mortgages
grew $5 billion or 8%, and
personal and credit card
lending increased significantly,
up $4 billion or 15%. This
growth was driven by the
popularity of the new Flex Value mortgage and continued
strong sales of ScotiaLine products, as well as the low levels of
interest rates and a robust housing and home renovation market.
International Banking also experienced strong growth in
retail lending assets, particularly in Mexico and the Caribbean,
with growth of $2 billion.
Business lending increased $5 billion, in part due to
good loan growth in Mexico and the Caribbean and Central
American region. Securities purchased under resale agreements
contributed a further $3 billion to growth in loans. Underlying
lending volumes in the U.S. and European corporate loan
portfolios declined in 2005, following more substantial declines
in recent years.
Liabilities
The Bank’s total liabilities increased $34 billion to $298 billion
as at October 31, 2005, with underlying growth of $37 billion
partly offset by the negative foreign currency translation impact
of $3 billion.
Deposits
Deposits increased by $22
billion this year.
Business and government
deposits were up $15 billion
in 2005, mainly to fund retail
asset and securities growth.
Domestic personal
deposits rose by $3 billion,
due largely to growth in term
deposits, as customers took
advantage of higher interest
rates. As well, personal
deposits rose $1 billion in the Latin American and Caribbean
markets.
Obligations related to repurchase agreements
Obligations related to repurchase agreements are another
source of wholesale funding. The year-over-year increase of
$7 billion was attributable mainly to the growth in the securities
portfolio.
50
100
150
200
04 0503
50
100
150
200
04 0503
Loan portfolioloans & acceptances, $ billions
Securities purchased under resaleagreements
Business and governments
Other personal loans
Residential mortgages
Strong deposit base$ billions
Banks
Business and governments
Personal
G r o u p F i n a n c i a l C o n d i t i o n

MANAGEMENT’S DISCUSSION AND ANALYSIS
4 4 S c o t i a b a n k 2 0 0 5 A n n u a l R e p o r t
Table 9 Condensed Balance Sheet
As at October 31 ($ billions) 2005 2004 2003 2002 2001
AssetsCash resources $ 20.5 $ 17.1 $ 20.6 $ 20.3 $ 20.2Securities 73.5 58.8 63.2 56.2 53.3Loans 191.0 171.8 171.7 185.7 175.4Other 29.0 31.5 30.4 34.2 35.5
Total assets $ 314.0 $ 279.2 $ 285.9 $ 296.4 $ 284.4
Liabilities and shareholders’ equityDeposits $ 217.4 $ 195.2 $ 192.7 $ 195.6 $ 186.2Obligations related to securities sold under
repurchase agreements 26.0 19.4 28.7 31.9 30.6Other liabilities(1) 51.1 44.7 45.2 49.0 47.2Subordinated debentures 2.6 2.6 2.7 3.9 5.3Capital instrument liabilities(1) 0.8 2.3 2.5 2.2 2.0
Total liabilities(1) $ 297.9 $ 264.2 $ 271.8 $ 282.6 $ 271.3Shareholders’ equity(1) $ 16.1 $ 15.0 $ 14.1 $ 13.8 $ 13.1
Total liabilities and shareholders’ equity $ 314.0 $ 279.2 $ 285.9 $ 296.4 $ 284.4
(1) Comparative amounts have been retroactively restated for new CICA accounting requirements relating to the distinction between equity and liability instruments.
Shareholders’ equity
Total shareholders’ equity rose by $1,097 million in 2005, as the
Bank had a record level of internally generated capital of $1,867
million and issued $300 million non-cumulative preferred shares.
These increases were partly offset by the impact of common
share buy backs, and the net effect of unrealized foreign
currency translation losses recorded in shareholders’ equity.
Outlook
For 2006, we are expecting a more modest increase in retail
assets in Canada, in line with slower economic growth. We also
anticipate some growth in our commercial and corporate port-
folios. Outside Canada, growth in local currency assets in most
international operations is expected to continue.
Capital management
Scotiabank maintains a strong capital base to support its
diversified business activities. Scotiabank’s capital ratios remain
among the highest of its Canadian peer group. This strength
contributes to the Bank’s safety, fosters investor confidence,
supports high credit ratings, enables the Bank to take
advantage of growth opportunities and provides it with the
potential to enhance shareholder returns through increased
dividends or share repurchases.
As well, the Bank’s policy is to remain well capitalized in
order to provide adequate flexibility to take advantage of
growth opportunities, while supporting the risks associated with
the Bank’s activities.
In managing the Bank’s capital base, close attention is paid
to the capital structure, the cost and availability of the various
types of capital, desired leverage, changes in the balance sheet
and risk-weighted assets, and the opportunities to profitably
deploy capital. The amount of capital required for the business
risks being assumed and to meet regulatory requirements is
always balanced against our goal of generating an appropriate
return for our shareholders.
Capital adequacy for Canadian banks is governed by the
requirements of the Office of the Superintendent of Financial
Institutions (OSFI). These requirements are consistent with
the international standards set by the Bank for International
Settlements (BIS). Bank regulatory capital consists of two
components – Tier 1 capital and Tier 2 capital – both of which
are described below. Both components of capital provide
support for banking operations and protect depositors. Tier 1
capital, which is more permanent, is of particular importance
to regulators, financial markets and investors.
Certain changes in accounting standards, effective
November 1, 2004, affected the balance sheet classification of
the Bank’s Tier 1 trust securities (see Note 1 to the consolidated
financial statements on page 100). This change did not have any
effect on the Bank’s capital ratios, as these instruments remain
eligible as Tier 1 capital for regulatory purposes.

Table 10 Regulatory capital
As at October 31 ($ millions) 2005 2004 2003 2002 2001
Tier 1 capitalCommon shareholders’ equity $ 15,482 $ 14,685 $ 13,814 $ 13,502 $ 12,833Innovative capital instruments(1) 2,250 2,250 2,500 2,225 1,975Non-cumulative preferred shares 600 300 300 300 300Non-controlling interest in subsidiaries 306 280 326 662 586Less: Goodwill (498) (261) (270) (299) (400)
18,140 17,254 16,670 16,390 15,294Tier 2 capitalSubordinated debentures (net of amortization) 2,420 2,493 2,595 3,372 4,933Eligible amount of general allowance (2) 1,330 1,317 1,352 1,448 1,442
3,750 3,810 3,947 4,820 6,375Less: Investments in associated corporations and other items (358) (200) (209) (250) (329)Total capital $ 21,532 $ 20,864 $ 20,408 $ 20,960 $ 21,340Total risk-weighted assets ($ billions) $ 162.8 $ 150.5 $ 154.5 $ 165.4 $ 164.8
Capital ratiosTier 1 capital ratio 11.1% 11.5% 10.8% 9.9% 9.3%Total capital ratio 13.2% 13.9% 13.2% 12.7% 13.0%
Assets to capital multiple 15.1 13.8 14.4 14.5 13.5
(1) Includes $2.0 billion of Scotiabank Trust Securities (Scotia BaTS), and preferred shares issued by Scotia Mortgage Investment Corporation.(2) Under OSFI guidelines, the general allowance was included in Tier 2 capital up to a maximum of 0.875% of risk-weighted assets.
Table 11 Changes in regulatory capital
For the fiscal years ($ millions) 2005 2004 2003 2002 2001
Total capital, beginning of year $ 20,864 $ 20,408 $ 20,960 $ 21,340 $ 19,029Internally generated capital
Net income 3,209 2,908 2,422 1,708 2,077Preferred and common share dividends (1,342) (1,126) (865) (748) (637)
1,867 1,782 1,557 960 1,440External financing
Debentures (net of amortization) (73) (102) (777) (1,561) (57)Preferred shares 300 – – – –Innovative capital instruments (1) – (250) 275 250 –Common shares and contributed surplus 88 88 139 82 155Purchase of shares and premium on redemption (973) (290) (201) (154) –
(658) (554) (564) (1,383) 98Other
Net unrealized foreign exchange translation gains (losses) (178) (709) (1,176) (137) 79Non-controlling interest in subsidiaries 26 (46) (336) 76 357Other (2) (389) (17) (33) 104 337
(541) (772) (1,545) 43 773Total capital generated (used) 668 456 (552) (380) 2,311Total capital, end of year $ 21,532 $ 20,864 $ 20,408 $ 20,960 $ 21,340
(1) Includes $2.0 billion of Scotiabank Trust Securities (Scotia BaTS), and preferred shares issued by Scotia Mortgage Investment Corporation.(2) Represents changes to eligible general allowance, regulatory capital deductions for goodwill, investments in associated corporations and securitization-related amounts,
and other charges (credits) to retained earnings.
GROUP F INANCIAL CONDITION
S c o t i a b a n k 2 0 0 5 A n n u a l R e p o r t 4 5

MANAGEMENT’S DISCUSSION AND ANALYSIS
4 6 S c o t i a b a n k 2 0 0 5 A n n u a l R e p o r t
Tier 1 capital
Tier 1 capital consists primarily of common shareholders’ equity,
non-cumulative preferred shares and innovative structures such
as trust securities. Tier 1 capital rose to $18.1 billion, an
increase of $886 million over last year:
• Retained earnings grew $887 million, which was net of the
cost of the repurchase of common shares of $973 million.
• Preferred shares increased $300 million as a result of the
issuance of Series 13 non-cumulative preferred shares.
• Partially offsetting the above were: a net increase of $178
million in cumulative unrealized foreign currency translation
losses, due to the strengthening of the Canadian dollar; and
higher goodwill associated mainly with the Bank’s acquisitions
of Banco de Comercio and Waterous & Co. in 2005.
Over the past five years, notwithstanding large dividend
increases, solid growth in net income has created $7.6 billion
of internally generated capital. This level of internal capital
generation has consistently been among the highest of the
Canadian banks.
Tier 2 capital
Tier 2 capital consists mainly of subordinated debentures and
the eligible portion of the total general allowance for credit
losses. Tier 2 capital decreased marginally in 2005 to $3.8 billion
due to a reduction in the portion of subordinated debentures
that are eligible for inclusion in Tier 2 capital.
Regulatory capital ratios
Capital ratios are used to monitor the capital adequacy and the
financial strength of banks. The two primary regulatory capital
ratios, Tier 1 and Total, are determined by dividing those capital
components by risk-weighted assets.
In 2005, both of the Bank’s regulatory capital ratios
remained strong compared to the other major Canadian banks.
The Tier 1 and the Total capital ratios as at year end were
11.1% and 13.2%, respectively. These ratios exceeded OSFI’s
formal target levels of 7% and 10%. Scotiabank’s strong capital
ratios are the result of consistent earnings growth accompanied
by disciplined growth in risk-weighted assets.
In addition to the regulatory capital ratios, banks are also
subject to a maximum leverage test, the assets-to-capital
multiple (ACM). The ACM is calculated by dividing a bank’s
total assets, including specified off-balance sheet items, by its
total capital. Under this test, total assets should not be greater
than 20 times capital, although this multiple can be exceeded
with OSFI’s prior approval to an amount no greater than 23
times. As at October 31, 2005, the Bank’s ACM was 15.1 times,
an increase from 13.8 times last year, mainly reflecting the 12%
growth in assets.
Tangible common equity ratio
The level of tangible common equity (TCE) is generally
considered to be one of the most important measures of a
bank’s capital strength, and is often used by rating agencies in
their assessment of a bank’s capital position. Tangible common
equity is calculated by deducting unamortized goodwill and
intangibles from common shareholders’ equity.
The TCE ratio is calculated by dividing tangible common
equity by risk-weighted assets. At year end, the Bank’s TCE
ratio was 9.3%, 40 basis points lower than the 2004 level.
Scotiabank’s TCE ratio is the strongest of the major Canadian
banks.
Capital allocation
Besides the regulatory capital framework, the Bank also uses an
economic capital framework to allocate capital to the business
lines. This allows us to appropriately measure the returns from
the business lines and their activities, based upon the risk they
Scotia BMO TD Royal CIBC
10.3 10.111.1
9.68.5
3
6
9
12
04 0501 02 03
Tier 1 capital% October 31, 2005
Scotiabank’s tangiblecommon equity% October 31

GROUP F INANCIAL CONDITION
S c o t i a b a n k 2 0 0 5 A n n u a l R e p o r t 4 7
are assuming, by calculating a return on economic equity. The
economic capital allocation methodology separates risks into
three major components – credit risk, market risk and opera-
tional risk – and calculates the capital required for each risk.
The capital allocation models for credit risk use the Bank’s
internal credit risk ratings for business loans, and credit bureau
scoring for retail loans. In addition, the models take into
account differences in term to maturity, probabilities of default,
expected severity of loss in the event of default, and the
diversification benefits of large portfolios.
Capital related to market risk is based on the internal VAR
models used in the trading book, and on stress tests of the
Bank’s interest rate gap structure, foreign exchange structural
exposures, and equity investment portfolios.
Operational risk capital is allocated based on an assessment
of both business and event risk in each business line.
Economic capital is much more risk sensitive than the
existing regulatory capital measures. The proposed Basel II
capital framework will introduce more risk sensitivity into the
regulatory capital calculations, in certain instances using risk
parameters similar to those used in the Bank’s current
economic capital methodology.
Dividends
Our record of strong earnings growth and our capital position
allowed us to increase our quarterly dividend twice in 2005.
On a year-over-year basis, dividends rose by 20% to $1.32 per
share, and have risen at
a compound annual rate
of 15.6% over the past
10 years. The dividend
payout ratio for 2005 was
41%, up from 38% last year,
and well within the Bank’s
target payout range of 35%
to 45%.
Share buyback program
In January 2005, the Bank
renewed its normal course
issuer bid on the Toronto Stock Exchange to buy back up to 50
million common shares at prevailing market prices. During fiscal
2005, 26.1 million common shares were purchased at an average
price of $40.51 per share. In 2004, 9.1 million shares were
repurchased at an average cost of $34.96 per share. The normal
course issuer bid is expected to be renewed upon its expiry on
January 5, 2006.
Share data
Details of the Bank’s common and preferred share data, as well
as trust securities, are shown in the table below. Further details,
including convertability features, are shown in notes 13 and 14
of the consolidated financial statements.
0.25
0.50
0.75
1.00
1.25
95 97 99 01 03 05
Dividend growthdollars per share
15.6% CAGR1
1 Compound annual growth rate (CAGR)
Share Data
As at October 31 (thousands of shares)
Class A preferred shares issued by Scotia Mortgage Investment Corporation 250(1)
Series 2000-1 trust securities issued by BNS Capital Trust 500(1)
Series 2002-1 trust securities issued by Scotiabank Capital Trust 750(2)
Series 2003-1 trust securities issued by Scotiabank Capital Trust 750(2)
Preferred shares Series 12 12,000(3)
Preferred shares Series 13 12,000(4)
Common shares outstanding 990,182(5)
Outstanding options granted under the Stock Option Plans to purchase common shares 37,582(5)(6)
(1) Reported in capital instrument liabilities in the Consolidated Balance Sheet.(2) Reported in business and government deposits in the Consolidated Balance Sheet.(3) These shares are entitled to non-cumulative preferential cash dividends payable quarterly in an amount of $0.328125 per share.(4) These shares are entitled to non-cumulative preferential cash dividends payable quarterly in the amount of $0.30 per share.(5) As at November 30, 2005, the number of outstanding common shares and options were 990,416 and 37,358, respectively. The number of other securities disclosed in this table were
unchanged.(6) Included are 15,275 stock options with tandem stock appreciation right (SAR) features.

Basel II implementation
In June 2004, the Basel Committee on Banking Supervision
released its report entitled “International Convergence of Capital
Measurement and Capital Standards: A Revised Framework”
(Basel II). The new framework is designed to more closely align
regulatory capital requirements with underlying risks by
introducing substantive changes in the treatment of credit risk.
An explicit new capital charge for operational risk is also being
introduced, as well as increased supervisory review of capital
adequacy and potential expansion of the related public disclosure.
As a result of this more risk-based capital attribution approach,
potential capital reductions or increases might be possible;
however, it is too early to predict the impact at this stage. Any
potential reductions in fiscal years 2008 and 2009 will be limited
by regulatory capital “floors” of 90% and 80%, respectively, of
the current capital requirements.
Scotiabank has developed a comprehensive program aimed
at being in a position to meet the new regulatory requirements.
Our work effort is well under way under the governance of the
Bank’s internal Basel II Steering Committee and the Basel
Program Office. We remain committed to completing the
necessary tasks to position us for implementation of the new
framework.
The new Basel II Framework is expected to be fully effective
for the Canadian banks for fiscal 2008. The Office of the
Superintendent of Financial Institutions expects the major
Canadian banks to report on a “parallel run” basis for five quar-
ters, beginning with the quarter ending October 31, 2006, with a
November 1, 2007 date for implementation. The date in Europe
for similar advanced approaches is January 1, 2008. Regulators
in the United States have very recently announced a one-year
delay, resulting in an implementation date of January 1, 2009, in
the U.S. The difference in implementation dates in various
countries introduces a degree of additional complexity and
uncertainty for major institutions operating in different global
jurisdictions, although it is not expected to significantly impact
our implementation efforts.
Outlook
Scotiabank expects to maintain strong capital ratios in 2006.
Dividends are expected to continue to increase in line with
earnings growth, and the payout ratio is likely to be at the
higher end of the current target payout range of 35% to 45%.
Off-balance sheet arrangements
In the ordinary course of business, the Bank enters into
contractual arrangements that are not required to be included
in the Consolidated Balance Sheet. These arrangements could
have a current or future effect on the Bank’s results of
operations or financial condition. They comprise three main
categories: variable interest entities (VIEs), securitizations, and
guarantees and loan commitments.
Variable interest entities
The main types of off-balance sheet arrangements with VIEs are:
• VIEs that are used to provide a wide range of services to
customers. These include VIEs established to assist clients
in securitizing their financial assets (through asset-backed
commercial paper conduits), obtaining cost-efficient financing,
and to provide investment opportunities. In addition, the Bank
sponsors and actively manages mutual funds, as well as creates,
administers, and manages personal and corporate trusts.
• VIEs that are used to diversify the Bank’s funding sources and
manage its capital requirements by securitizing the Bank’s
own assets, primarily residential mortgages, and issuing
innovative Tier 1 capital instruments (e.g., Scotiabank Trust
Securities described in Note 13 to the consolidated financial
statements).
VIEs are subject to the review and approval processes that
the Bank applies to all transactions to ensure that relevant
risks, as well as accounting, related party, reputational, and
ownership issues, are properly addressed. For many of the VIEs
used to provide services to customers, the Bank earns fees but
has no exposure to loss on the underlying assets, as the Bank
does not guarantee the performance of these assets. For other
VIEs, such as securitization and investment vehicles, the Bank
earns fees and may be exposed to credit, market, liquidity, or
operational risks.
New Canadian accounting requirements for VIEs came into
effect for fiscal 2005 as described on page 74 under Changes in
accounting policies. As at October 31, 2005, total consolidated
assets related to VIEs were $6 billion. The amounts owed by or
to these VIEs were not significant. Further, consolidating and
deconsolidating these VIEs had no effect on the Bank’s net
income. The Bank earned fees of $13 million in 2005 from
certain VIEs in which it has a significant variable interest but
does not consolidate. More information with respect to the
MANAGEMENT’S DISCUSSION AND ANALYSIS
4 8 S c o t i a b a n k 2 0 0 5 A n n u a l R e p o r t
GROUP F INANCIAL CONDITION
S c o t i a b a n k 2 0 0 5 A n n u a l R e p o r t 4 9
Bank’s involvement with VIEs, including details of maximum
loss exposure by VIE category, is provided in Note 6 to the
consolidated financial statements on page 106.
Securitizations
The Bank securitizes a portion of its residential mortgages
and personal loans by transferring the assets to trusts. If certain
criteria are met, these transfers are treated as sales, and the
transferred assets are removed from the Consolidated Balance
Sheet (this is discussed further in Note 1 to the consolidated
financial statements on page 100). These securitizations enable
the Bank to diversify its funding sources, and manage risks and
capital requirements.
The amount of off-balance sheet securitized mortgages
outstanding was $7,801 million as at October 31, 2005,
compared to $7,523 million last year and $5,248 million two
years ago. The growth in securitized mortgages is consistent
with the growth in new mortgages for the Bank’s Canadian
operations as securitizations are a cost-effective alternative
to funding this growth. The amount of off-balance sheet
securitized personal loans was $809 million as at October 31,
2005, compared to $1,319 million last year and $2,417 million
two years ago. The decline is due to maturities.
Given the Bank’s sizable capital base, and the manner in
which these securitizations are structured, the Bank is not
exposed to significant liquidity risks in connection with these
off-balance sheet arrangements.
Subsequent to the transfer of assets, the Bank may
retain interests in securities issued by the trusts, has
agreements to make payments to the trusts under certain
limited circumstances, maintains relationships with the
underlying customers, and provides administrative services to
the trusts. Additional information on the commitments to the
trusts is disclosed in Note 21 to the consolidated financial
statements on page 111. The Bank recorded securitization
revenues of $79 million in 2005, compared to $111 million in
2004 and $140 million in 2003. This decrease was consistent
with the decline in securitized personal loan balances.
Additional information on the amount of securitizations and
associated cash flows, servicing fees, and retained interests is
provided in Note 4(b) to the consolidated financial statements
on pages 104 and 105.
Guarantees and loan commitments
Guarantees and loan commitments are issued by the Bank to
earn fee revenue. Details regarding the nature of these products
are as follows:
• Standby letters of credit and letters of guarantee – As at
October 31, 2005, these amounted to $15.8 billion, up from
$14.4 billion last year. These are issued at the request of
a Bank customer to secure the customer’s payment or
performance obligations to a third party.
• Liquidity facilities – These generally provide an alternate source
of financing to asset-backed commercial paper conduits in the
event that a general market disruption prevents the conduits
from issuing commercial paper or, in some cases, when certain
specified conditions or performance measures are not met. As
at October 31, 2005, these facilities amounted to $7.7 billion, a
reduction of $6.8 billion from a year ago, mainly as a result of
consolidating commercial paper conduit programs under the
new VIE accounting guideline in 2005.
• Credit enhancements – The Bank provides partial credit
enhancements, in the form of financial standby letters of
credit, to commercial paper conduits. As at October 31, 2005,
these credit enhancements, which are included within standby
letters of credit and letters of guarantee, amounted to $27
million, down from $846 million last year.
• Indemnification contracts – In the ordinary course of business,
the Bank enters into many contracts which contain indemnifi-
cation provisions where the Bank may indemnify contract
counterparties for certain aspects of the Bank’s past conduct
if other parties fail to perform, or if certain events occur. The
Bank cannot estimate, in all cases, the maximum potential
future amount that may be payable, nor the amount of collat-
eral or assets available under recourse provisions that would
mitigate any such payments. Historically, the Bank has not
made any significant payments under these indemnities.
• Credit commitments – The Bank has commitments to extend
credit, subject to specific conditions, which represent under-
takings to make credit available in the form of loans or other
financings for specific amounts and maturities. As at October
31, 2005, these commitments amounted to $100 billion,
compared to $104 billion a year earlier. The majority of these
commitments are short-term in nature, with original maturities
less than one year.

MANAGEMENT’S DISCUSSION AND ANALYSIS
These arrangements may expose the Bank to credit or
liquidity risks and are subject to the Bank’s standard review
and approval processes. For the guarantee products, the above
dollar amounts represent the maximum risk of loss in the event
of a total default by the guaranteed parties and are stated
before any reduction for recoveries under recourse provisions,
insurance policies, or collateral held or pledged.
Annual fees from the Bank’s guarantees and loan commit-
ment arrangements, recorded in credit fees in the Consolidated
Statement of Income, were $227 million in 2005, compared to
$258 million in the prior year. Detailed information on
guarantees and loan commitments is disclosed in Note 21 to
the consolidated financial statements on pages 119 and 120.
Financial instruments
Given the nature of the Bank’s main business activities, the
balance sheet is comprised mainly of financial instruments.
Assets that are financial instruments include cash resources,
securities, loans and customers’ liability under acceptances.
Financial instrument liabilities include deposits, acceptances,
obligations related to securities sold under repurchase agree-
ments, obligations related to securities sold short, subordinated
debentures and capital instrument liabilities. The Bank also
transacts derivative financial instruments for both trading and
asset/liability management purposes. Financial instruments are
generally carried at cost, except those held for trading purposes
which are carried at their estimated fair value.
The risks that arise from transacting financial instruments
include credit risk, liquidity risk, operational risk and market
risk. The latter includes risks related to changes in interest
rates, foreign currency exchange rates and equity prices. In
order to manage these risks, the Bank has implemented exten-
sive risk management policies and practices including various
Board-approved risk management limits and risk management
techniques. A discussion of the Bank’s risk management policies
and practices can be found in the Risk Management section
(see pages 59 to 70).
The notes to the 2005 consolidated financial statements
provide further details on the terms and conditions of the
Bank’s financial instruments. For example, Note 22 (see
pages 121 – 124) summarizes the fair value of financial instru-
ments and how these amounts were determined. This note also
presents the Bank’s interest rate risk profile and the Bank’s
credit exposure to selected financial instruments. Note 23 (see
pages 124 – 127) provides details on notional amounts of trading
and asset/liability management derivatives as well as their term
to maturity, credit risk and fair values.
The fair value of the Bank’s financial instruments exceeded
their book value by $1,248 million (2004 – $952 million) as at
October 31, 2005. The year-over-year change in the excess of
fair value over book value arises mainly from changes in interest
rates. Fair value estimates are based on market conditions at
October 31, 2005, and may not be reflective of future fair
values. Further information on how fair values are estimated
is contained in the Critical accounting estimates section (see
pages 71 – 74).
There are various measures that can be used to assess the
risks associated with the Bank’s financial instrument portfolios.
The interest rate risk arising from the Bank’s non-trading
financial instruments is discussed on page 65 which reflects the
impact of a 100 basis point increase in interest rates on annual
income and the present value of net assets. For trading
activities, the table on page 66, discloses the average one-day
Value at Risk by risk factor. Based on the Bank’s maturity
profile of derivative instruments, only 12% (2004 – 9%) had a
term to maturity greater than five years.
Interest income and expense on interest-bearing financial
instruments are recorded in the Bank’s Consolidated Statement
of Income as part of net interest income. Credit losses resulting
from loans are recorded in the provision for credit losses.
Realized gains and losses on disposals of investment securities,
as well as writedowns, are recorded in other income as are net
trading gains and losses. The Bank’s accounting policies for
derivatives and hedging activities are further described in
Note 1 (see pages 98 – 102).
5 0 S c o t i a b a n k 2 0 0 5 A n n u a l R e p o r t

BUSINESS L INES
S c o t i a b a n k 2 0 0 5 A n n u a l R e p o r t 5 1
DomesticBanking
B u s i n e s s L i n e O v e r v i e w
Domestic Banking had a strong year in 2005, with net income available tocommon shareholders of $1,253 million, a 13% increase over last year. Stronggrowth in retail mortgages, personal lending and deposits was partially offset bya narrowing interest margin. As well, credit card and retail brokerage revenuesgrew year over year. Non-interest expenses and provisions for credit lossesremained well controlled.
200
400
600
800
1,000
04 0503
InternationalBanking
International Banking had a good year in 2005, with net income available tocommon shareholders of $800 million, an increase of 12% from last year,notwithstanding the significant negative effect of foreign currency translation asa result of the appreciation of the Canadian dollar. Scotiabank Inverlat’s earningscontribution rose substantially, and the Caribbean and Central America also hadgood growth.
200
400
600
800
1,000
04 0503
Scotia Capital
Scotia Capital also had a good year, as net income available to commonshareholders rose 12% to $915 million in 2005. This result was achieveddespite the negative effect of foreign currency translation and a continuedreduction in corporate lending assets. Provisions for credit losses declined sharplyfor the third consecutive year, as credit quality improved, particularly in the U.S.and Europe.
2005Domestic International
($ millions) Banking Banking Scotia Capital Other Total
Net interest income $ 3,576 $ 1,969 $ 849 $ (523) $ 5,871Other income 1,819 793 1,320 597 4,529Provision for credit losses (274) (70) 71 43 (230)Non-interest expenses (3,296) (1,712) (929) (106) (6,043)Income taxes/non-controlling interest (566) (174) (390) 212 (918)
1,259 806 921 223 3,209Preferred dividends paid (6) (6) (6) (7) (25)Net income available to commonshareholders $ 1,253 $ 800 $ 915 $ 216 $ 3,184
Return on equity(1) (%) 31.0% 21.6% 28.4% N/A 20.9%Average earning assets ($ billions) $ 123 $ 50 $ 112 $ 24 $ 309
(1) For management and internal reporting purposes, the Bank allocates equity to its business lines using a methodology that considers credit, mar-ket and operational risk inherent in each business line. Return on equity is calculated based on the economic equity allocated to the business line.Economic equity is not a defined term under GAAP and, accordingly, the resulting return on equity for each business line may not be comparableto those used by other financial institutions.
N/A Not applicable
2005 Net Income
DomesticInternationalScotia CapitalOther
The Other category represents smaller operating segments, including Group Treasury,and other corporate adjustments, that are not allocated to an operating segment.Other
300
600
900
1,200
1,500
04 0503
Net income available tocommon shareholders
($ millions)

MANAGEMENT’S DISCUSSION AND ANALYSIS
5 2 S c o t i a b a n k 2 0 0 5 A n n u a l R e p o r t
MANAGEMENT’S DISCUSSION AND ANALYSIS
5 2 S c o t i a b a n k 2 0 0 5 A n n u a l R e p o r t
D o m e s t i c B a n k i n g
2005 Achievements
• Higher customer loyalty andsatisfaction.
• Opened one millionth ScotiaLineline of credit account.
• Mortgage retention of more than90%.
• Strong growth in customer tradingactivity and fee-based assets inScotiaMcLeod, our retail brokeragearm.
• Strong growth in mutual fundsales for Scotia Partners Portfolios.
• ScotiaMcLeod Direct Investingcontinued to increase market
share, and we received Global Finance’s award for BestOnline Securities Research.
• Re-engineered the Commercial Banking business model:– clear customer segmentation, matching the right
banker with the right customer;– creating a network of six business support centres; and– adding new relationship and risk management tools.
• Our call centres were recognized by Service QualityMeasurement Group Inc. for delivering the highestcustomer sales experience among call centres in thebanking industry.
2006 Priorities• Increase share of wallet with existing customers with
a focus on the emerging affluent investor segment.
• Acquire new customers with targeted marketinginitiatives, new branches and more financial advisors.
• Continue to pursue strategic alliances and acquisitionsto increase revenues.
• Expand the breadth of our consumer lending products,including an initiative offering mortgages to the near-prime market.
• Focus on improving market share in Commercial Banking,particularly in the smaller end of the mid-market.
• Revitalize our small business offering, includingenhancements to product pricing and policies and thedevelopment of new sales tools and online resources.
Business profile
Domestic Banking provides a full range of banking and investing
services to more than 6.8 million customers across Canada,
through a network of 954 branches and 2,624 ABMs, as well as
telephone and Internet banking.
Domestic Banking includes three main businesses. Retail
banking provides mortgages, loans, credit cards and day-to-day
Banking products to individuals and small businesses. Wealth
Management offers retail brokerage, mutual funds and private
client services. Commercial Banking delivers a full product suite
to medium and large businesses.
Strategy
Our core purpose is to help our customers become financially
better off by providing relevant solutions to their unique needs.
Domestic Banking’s strategy for growth is to expand our client
base and drive revenue growth by building on our strengths in
customer service, execution and cross-business line partnerships.
We are focused on growing business with mid-market
investors and small business clients, and capturing primary
advisor status with affluent clients. For our emerging and
existing affluent clients, we provide personalized solutions
based on a customized financial plan. In Commercial Banking,
we are working to redefine and re-engineer our business with
an emphasis on delivering client-valued, cost-effective solutions.
Key performance drivers
Management uses a number of key metrics to monitor business
performance:
• revenue growth;
• customer satisfaction and loyalty;
• new customer acquisition;
• productivity ratio; and
• loan loss ratio (specific provisions as a percentage of average
loans and acceptances).
Robert ChisholmVice Chairman,Scotiabank & Presidentand CEO, DomesticBanking & WealthManagement

BUSINESS L INES – DOMESTIC BANKING
S c o t i a b a n k 2 0 0 5 A n n u a l R e p o r t 5 3
Financial performance
Domestic Banking reported net income available to common
shareholders of $1,253 million in 2005, $148 million or 13%
higher than last year, with a strong return on equity of 31.0%.
Results included significant growth in wealth management,
along with continued strong performances in each of retail,
small business and commercial banking.
Assets and liabilities
Domestic retail assets grew 10% in 2005. This was led by a
substantial increase in residential mortgage balances before
securitization of $6.6 billion or 9%, partly driven by customer
preference for the new Scotia Flex Value Mortgage. There was
also very strong year-over-year growth of 15% in personal
revolving credit, reflecting continued strength in the home
renovation market.
Personal deposits grew by 5%, due mainly to an increase
in term deposit balances and the ongoing success of the
Money Master® High Interest Savings Account. Business
deposits, including the Money Master for businessTM account,
rose 11%, continuing the double-digit growth trend of the past
several years.
Assets under administration rose 14% to $111 billion, due
primarily to growth in mutual funds and retail brokerage. Net
asset inflows from new customers, as well as continued growth
in our share of customers’ investment business, complemented
market-driven gains.
Revenues
Total revenues were $5,395 million, up $230 million or 4% from
last year. Net interest income increased by $82 million to $3,576
million in 2005, because of strong volume growth in assets and
deposits. The interest margin declined year over year, largely
reflecting increased customer preference for lower-yielding
variable-rate mortgages, a flattening of the yield curve and
increased use of more expensive wholesale deposits to fund
strong retail asset growth.
Other income for the year was $1,819 million, an increase of
$148 million or 9%, driven primarily by retail banking and wealth
management activities. Brokerage revenues rose $67 million or
14%, from greater customer trading activity due to improved
equity markets, and higher fee-based assets. In addition, mutual
fund revenues reached a record level, due to higher balances,
reflecting in part the success of the Partners Portfolios and a
revised management fee structure. Retail banking revenues rose
from both volume increases and price changes.
Non-interest expenses
Non-interest expenses of $3,296 million remained well controlled
in 2005, up a relatively modest $79 million or 2% from last year.
The increase was due mainly to higher performance-based
compensation, in line with stronger brokerage revenues. This
was partly offset by lower mortgage acquisition and appraisal
costs, as well as a decline in stock-based compensation, due to a
smaller increase in the Bank’s share price in 2005. Salary costs
were basically unchanged, as normal merit increases were offset
by lower average staffing levels.
Credit quality
Provisions for credit losses were $274 million in 2005, down $43
million or 14% from last year, due to lower provisions in the
commercial portfolio. Credit quality remained strong in the retail
portfolio, with the ratio of loan losses to average loan balances
improving one basis point from last year to 22 basis points.
Furthermore, the consumer loan portfolio is 89% secured.
Outlook
We expect to maintain good growth in assets and deposits next
year, although retail lending growth will likely moderate some-
what from the robust levels seen over the past two years, as
interest rates rise and the housing and renovation markets slow.
Increases in net interest income will continue to be tempered
by pressure on the interest margin, but less so than the past
two years. Credit quality is expected to remain fairly stable, with
provisions for loan losses increasing in line with the growth in
average loans.
Domestic Banking Financial Performance($ millions) 2005 2004 2003
Net interest income(1) $ 3,576 $ 3,494 $ 3,430Other income 1,819 1,671 1,528Provision for credit losses (274) (317) (272)Non-interest expenses (3,296) (3,217) (3,076)Income taxes(1) (566) (522) (547)
1,259 1,109 1,063Preferred dividends paid (6) (4) (4)Net income available to common
shareholders $ 1,253 $ 1,105 $ 1,059
Return on equity (%) 31.0 30.6 30.9Average earning assets ($ billions) 123 112 101Productivity ratio(1) (%) 61.1 62.3 62.0
(1) Taxable equivalent basis.
Revenue by areaTaxable equivalent basis ($ millions) 2005 2004 2003
Retail and Small Business $ 3,651 $ 3,550 $ 3,382Commercial 833 820 828Wealth Management 911 795 748
Total revenue $ 5,395 $ 5,165 $ 4,958

MANAGEMENT’S DISCUSSION AND ANALYSIS
I n t e r n a t i o n a l B a n k i n g
5 4 S c o t i a b a n k 2 0 0 5 A n n u a l R e p o r t
2005 Achievements
• In El Salvador, we acquired Bancode Comercio, giving us a marketshare of 19% after consolidationwith our existing operations.We also acquired La General deSeguros, a Puerto Rican insurancecompany, to expand our productoffering.
• Named Bank of the Year in Mexico,Jamaica and the Caribbean byLatin Finance magazine.
• Recognized as one of the 50 best employers in Mexico byThe Great Place to Work Institute.
• Opened a new representative office in Shanghai, thefinancial hub of China, positioning us to explore newbusiness opportunities in this rapidly growing economy.
• Continued to expand our delivery network, opening 16branches in Mexico and continuing to roll out Internetbanking, which is now in nine Caribbean countries.
2006 Priorities
• Our objective is to obtain new customers by expandingour sales and delivery network, increasing advertising inSpanish-speaking markets and leveraging our strengthin database marketing.
• We will continue to actively seek acquisitions in theCaribbean, Central America and Latin America, with asecondary focus on Asia.
• We will also continue to refine our International BankingShared Services initiative to centralize back office processes,which will improve service quality and lower costs by takingadvantage of economies of scale, allowing front line staffto focus on customer sales and service.
• We are planning a number of major technological initiativesto improve efficiency and support growth in Internet andbusiness banking.
• We will continue to expand our product and serviceoffering beyond traditional banking, in areas such asinsurance and wealth management.
Business profile
International Banking operates in more than 40 countries, and
includes Scotiabank’s retail and commercial banking operations
outside of Canada. Through our network of more than 1,000
branches and offices and 2,100 ABMs, as well as telephone and
Internet Banking, we provide a full range of financial services to
almost three million customers.
International Banking is organized into the following
geographic regions: Caribbean and Central America, Mexico,
Latin America and Asia Pacific.
Strategy
Our global growth strategy has three main components: organic
growth, acquisitions and efficiencies. We are investing in high-
growth markets, where we anticipate increased demand for
financial services. We are also leveraging proven, bankwide
capabilities to expand our product and service offerings, deepen
customer relationships and increase sales productivity and
operating efficiency through a shared services approach and
common technology platforms.
Key performance drivers
Management uses a number of key metrics to monitor business
performance:
• net income growth;
• revenue growth (using normalized exchange rates);
• productivity ratio;
• loan loss ratio (specific provisions as a % of average loans and
acceptances);
• new customer acquisition; and
• growth in number of multi-product customers.
Robert PitfieldExecutive Vice-President,International Banking

BUSINESS L INES – INTERNATIONAL BANKING
S c o t i a b a n k 2 0 0 5 A n n u a l R e p o r t 5 5
Financial performance
International Banking continued to earn through the negative
impact of a stronger Canadian dollar, with net income available
to common shareholders in 2005 of $800 million. This was an
increase of $82 million or 12% from last year, despite a negative
impact of $62 million due to foreign currency translation.
Return on equity was a solid 21.6%.
While all regions contributed to this strong growth, the
most significant was Scotiabank Inverlat in Mexico. Inverlat’s
net contribution increased 28% from last year, dampened 5%
by the negative impact of foreign currency translation. This
increase was driven by strong loan growth and higher retail
banking fees. Results in the Caribbean also improved, due
primarily to lower loan losses and the acquisition of Banco
de Comercio in El Salvador.
Assets and liabilities
Assets increased 2% during the year, or 9% before the impact
of foreign currency translation. Underlying retail loan growth
was a very strong 19%, particularly in mortgages, led by growth
in Mexico, Chile and the Caribbean. Commercial loan growth
was 6%. Underlying growth in low-cost demand and savings
deposits was also strong at 11%, with increases in most
Caribbean countries and in Mexico.
Revenues
Total revenues were $2,762 million in 2005, an increase of
$163 million or 6% from last year. Total revenues were reduced
by 6% or $158 million due to the negative impact of foreign
currency translation.
Net interest income was $1,969 million in 2005, an increase
of $111 million or 6% from last year, despite a negative foreign
currency translation impact of $117 million or 6%. The increase
was driven by strong asset growth in Mexico and the Caribbean,
and the Banco de Comercio acquisition. Margins were up slightly,
with variations in individual markets.
Other income grew 7% year over year to $793 million, or
13% before the negative impact of foreign currency translation.
The increase was due mostly to gains on the sale of emerging
market securities and contributions from the newly acquired
Banco de Comercio. These were partially offset by lower fee
income from loan collection services associated with the
Baninter acquisition in the Dominican Republic; these loan
collection services are now complete. There was also strong
growth in retail fees in Mexico and the Caribbean due to our
credit card acquisition strategy, and higher wholesale revenues
in Mexico.
Non-interest expenses
Non-interest expenses were $1,712 million in 2005, up 7% or
$106 million from last year. Expenses would have been higher
by 11%, but benefited from a positive 4% impact from foreign
currency translation. Expenses rose due to the Banco de
Comercio acquisition, higher salaries in Mexico and the
Caribbean, credit card marketing initiatives and business-related
growth in Mexico, and higher litigation costs.
Credit quality
The provision for credit losses was $70 million in 2005,
unchanged from last year. Lower provisions in the Caribbean
and Asia were offset by higher provisions in Mexico and Chile.
Outlook
We expect International Banking’s track record of earnings
growth to continue in 2006, particularly in Mexico, the
Caribbean and Central American region, and Chile. We
anticipate further growth in assets and deposits, with an
increased focus on sales effectiveness, and ongoing expansion
of the delivery network. We continue to actively pursue
acquisition opportunities in key markets. However, growth
will be moderated by foreign currency translation, should the
Canadian dollar continue to appreciate.
Revenue by areaTaxable equivalent basis ($ millions) 2005 2004 2003
Caribbean & Central America $ 1,174 $ 1,149 $ 1,133Mexico 1,090 978 1,066Other 498 472 564
Total revenue $ 2,762 $ 2,599 $ 2,763
International Banking Financial Performance($ millions) 2005 2004 2003
Net interest income(1) $ 1,969 $ 1,858 $ 1,987Other income 793 741 776Provision for credit losses (70) (70) (73)Non-interest expenses (1,712) (1,606) (1,657)Income taxes/non-controlling interest(1) (174) (201) (393)
806 722 640Preferred dividends paid (6) (4) (4)Net income available to common
shareholders $ 800 $ 718 $ 636
Return on equity (%) 21.6 21.7 20.7Average earning assets ($ billions) 50 49 52Productivity ratio(1) (%) 62.0 61.8 60.0
(1) Taxable equivalent basis.

MANAGEMENT’S DISCUSSION AND ANALYSIS
S c o t i a C a p i t a l
5 6 S c o t i a b a n k 2 0 0 5 A n n u a l R e p o r t
2005 Achievements
• Named Best Investment Bank in Canada by Global Financemagazine for the second year in a row, and also namedBest Foreign Exchange Bank.
• Acquired Waterous & Co., a leading global energy advisoryfirm. Combined with our existing business, we have anexcellent opportunity to broaden our client base.
• The derivatives team received several number onerankings in a third-party market survey.
• Notable transactions during the year included:– Acting as exclusive financial advisor to Kohlberg, Kravis
& Roberts on its $3.2 billion purchase of MasoniteInternational Corporation; and
– Acting as Grupo Comercial Chedraui’s financialadvisor on its purchase of 30 retail stores from France’sCarrefour Group – one of the largest merger andacquisition deals of the year in Mexico.
2006 Priorities
• In Canada, our objective is to be in the top three in all ofour product areas, and to grow by launching new productinitiatives.
• In the U.S., we will take further steps to enhance creditrisk management and increase cross-sell by leveragingour NAFTA capabilities.
• We are targeting growing client segments, such asalternative asset managers, with new product offerings.As well, we are broadening our capabilities in specificmarkets with select traditional products, such as fixedincome.
• We will also begin to leverage the integration of theMexican wholesale business of Scotiabank Inverlat to createa NAFTA corporate and investment banking platform.
Business profile
Scotia Capital is the corporate and investment banking arm of
the Scotiabank Group, providing full-service coverage across the
NAFTA region, as well as other selected niche markets globally.
We offer wholesale financial products to corporate, government
and institutional investor clients.
Scotia Capital was reorganized into two main businesses,
effective November 1, 2005. Global Corporate and Investment
Banking provides corporate lending, equity underwriting and
mergers & acquisitions advisory services. Global Capital Markets
provides products and services such as fixed income; derivatives;
foreign exchange; equity sales, trading and research; and,
through ScotiaMocatta, precious metals.
Strategy
Our strategy remains focused on earning a good return on
capital by building strong client relationships and carefully
managing credit risk. Revenue growth is expected to come
from leveraging our strengths across our NAFTA platform,
and expanding our global capabilities in selected product areas
such as derivatives and in selected industries, such as energy
and mining.
Key performance drivers
Management uses a number of key metrics to monitor business
performance:
• revenue growth;
• client profitability (ROE, improvement in cross-sell);
• loan loss ratio (specific provisions as a percentage of average
loans and acceptances);
• Value at Risk; and
• daily trading profitability.
Stephen McDonaldCo-Chair and Co-CEO,Scotia Capital & Head,Global Corporate andInvestment Banking
C. John SchumacherCo-Chair and Co-CEO,Scotia Capital & Head,Global Capital Markets

BUSINESS L INES – SCOTIA CAPITAL
S c o t i a b a n k 2 0 0 5 A n n u a l R e p o r t 5 7
Financial performance
Scotia Capital reported net income available to common
shareholders of $915 million in 2005, a 12% increase year over
year. The growth was due mainly to net loan loss recoveries
in 2005, compared to a net provision for credit losses in 2004.
In addition, record earnings were reported in Global Trading,
with particularly strong results in derivatives. These were partly
offset by the negative impact of foreign currency translation of
$34 million and a reduction in corporate lending assets. Return
on equity was 28.4% in 2005, a significant increase from the
prior year.
Assets and liabilities
Corporate lending balances decreased 8% overall, and were down
16% in the U.S. and Europe, approximately half of which was
due to the negative impact of foreign currency translation. The
decline in lending volumes reflects continued high levels of
market liquidity. In Canada, asset growth of 5% was achieved, the
first increase in several years due to more robust client demand,
particularly in the oil and gas sector.
Revenues
Total revenues were relatively flat at $2,169 million in 2005.
Foreign currency translation reduced total revenues by
$65 million. Net interest income fell $88 million or 9% to
$849 million, while other income increased $93 million or
8% to $1,320 million.
Revenue from Canadian operations increased 8%, due to
stronger institutional equity trading results, higher new issue fees
in investment banking, and the inclusion of four months of results
from Scotia Waterous. These increases were partially offset by
lower credit fees and a decline in net interest income in corpo-
rate banking, as tighter market pricing offset volume gains.
Corporate banking revenues in the U.S. and Europe
decreased 22%, with lower interest income and credit fees,
as a result of a decline in corporate loan volumes and tighter
market pricing.
Global Trading had a strong year, as revenues increased
18%, including record results in derivatives due to client-driven
activity, and strong growth in fixed income revenues. Foreign
exchange and precious metals had solid results, although damp-
ened somewhat by the effect of foreign currency translation.
Non-interest expenses
Non-interest expenses were $929 million in 2005, a 3% decrease
from 2004, due largely to the positive impact of foreign currency
translation of $21 million and lower salary and benefit costs.
These declines were partially offset by higher severance
expenses and an increase in performance-related compensation,
in line with improved results.
Credit quality
Scotia Capital reported net recoveries of $71 million in 2005,
compared to net specific provisions for credit losses of $106
million last year. The improvement was primarily in the U.S. and
Europe, where provisions declined $147 million and $33 million,
respectively. There were net recoveries in Canada, although
down slightly compared to the prior year. Net impaired loans
continued to decline, particularly in the U.S., reflecting overall
strong credit conditions.
Outlook
The outlook for the trading businesses remains positive,
providing opportunities for growth in the coming year. As well,
the Waterous acquisition will provide leverage for investment
banking. In addition, while corporate lending markets remain
highly liquid, volume and margin trends should provide oppor-
tunities for growth. However, we do not expect the same level of
loan loss recoveries next year. Also, growth will be moderated by
foreign currency translation, should the Canadian dollar
continue to appreciate.
Revenue by areaTaxable equivalent basis ($ millions) 2005 2004 2003
Canada $ 733 $ 678 $ 707U.S. and Europe 614 786 1,066Global Trading 822 700 695
Total revenue $ 2,169 $ 2,164 $ 2,468
Scotia Capital Financial Performance($ millions) 2005 2004 2003
Net interest income(1) $ 849 $ 937 $ 1,179Other income 1,320 1,227 1,289Provision for credit losses 71 (106) (549)Non-interest expenses (929) (960) (986)Income taxes(1) (390) (275) (262)
921 823 671Preferred dividends paid (6) (4) (6)Net income available to common
shareholders $ 915 $ 819 $ 665
Return on equity (%) 28.4 20.3 12.9Average earning assets ($ billions) 112 109 119Productivity ratio(1) (%) 42.8 44.4 40.0
(1) Taxable equivalent basis.

MANAGEMENT’S DISCUSSION AND ANALYSIS
Financial performance
The Other category represents smaller operating segments,
including Group Treasury and other corporate items, which are
not allocated to a business line.
Net income available to common shareholders was $216
million in 2005, compared to $250 million in 2004. The decrease
was due mainly to a smaller reduction in the general allowance
for credit losses this year.
Revenues
Revenues decreased by $19 million from 2004, mainly from
lower investment gains in Group Treasury.
Net interest income was a negative $523 million in 2005, an
improvement of $65 million from last year, mainly from higher
dividend income.
Net interest income includes the elimination of the gross-up
of tax-exempt income. This amount is included in the operating
segments, which are reported on a taxable equivalent basis and
offset in this segment. This reduction was $326 million in 2005,
compared to $274 million in 2004.
Other income fell $84 million year over year. Investment
gains were $60 million lower in Group Treasury, primarily from
a decline in bond gains, partially offset by increased gains on
equity investments. In addition, in 2005, a gain of $118 million
was realized on the sale of a portion of the Bank’s investment in
Shinsei Bank, compared to a $125 million gain realized in 2004.
Credit quality
The provision for credit losses included a $45 million reduction
in the general allowance for credit losses in 2005, compared to
a $100 million reduction in 2004.
Income taxes
The provision for income taxes includes the elimination of the
gross-up of tax-exempt income, which was $52 million higher
than last year.
Outlook
In light of current and expected financial market conditions,
gains on the sale of investment securities are expected to
decline somewhat in 2006.
The general allowance may be further reduced if the positive
trends in economic and business conditions continue.
O t h e r
5 8 S c o t i a b a n k 2 0 0 5 A n n u a l R e p o r t
Other Financial Performance($ millions) 2005 2004 2003
Net interest income(1) $ (523) $ (588) $ (350)Other income 597 681 422Provision for credit losses 43 103 1Non-interest expenses (106) (79) (12)Income taxes(1) 212 137 (13)
223 254 48Preferred dividends paid (7) (4) (2)Net income available to common
shareholders $ 216 $ 250 $ 46
(1) Taxable equivalent basis.

R i s k m a n a g e m e n t
Risk management overviewRisk, to varying degrees and in different forms, is present in
virtually all business activities of a financial services organization.
In certain activities, risk is assumed as a means of generating
revenue, while in other activities, risk exists by virtue of
engaging in the activity. The primary goals of risk management
are to ensure that the outcomes of risk-taking activities are
predictable and within the Bank’s risk tolerance parameters,
and that there is an appropriate balance between risk and
reward in order to maximize shareholder returns. The Bank’s
risk management framework is designed to achieve this balance.
Taking properly evaluated and quantified risks is critical to
the success of our business activities. Risks to which the Bank
is exposed fall into one or more of the following categories:
1. Credit 4. Operational
2. Market 5. Reputational
3. Liquidity 6. Environmental
The Bank’s Global Risk Management group is responsible
for the design and application of the Bank’s risk management
framework, and is independent of the Bank’s business units.
The framework is integrated with the Bank’s strategy and
business planning processes. The effectiveness of this frame-
work is enhanced by strong risk governance, which includes
active participation of the Board of Directors, senior executive
and business line management in the risk management process.
The framework has four main components:
Each of the components utilized within this risk management
framework is continually reviewed and updated to ensure
consistency with risk-taking activities.
As an outcome of the processes used to identify and assess
risk, the components of the risk management framework are
reviewed and adjusted periodically to ensure they are relevant
to the risk-taking activities and strategies of the Bank.
Scotiabank’s risk management framework
Policies & limitsPolicies define the Bank’s overall risk appetite and are developedbased on the requirements of regulatory authorities and inputfrom the Board of Directors and senior executive management.Policies also provide guidance to the businesses and riskmanagement units by setting the boundaries on the types ofrisks the Bank is prepared to assume.
Limits are set for two purposes. First, limits ensure risk takingactivities will achieve predictable results within the tolerancesestablished by the Board of Directors and senior executivemanagement. Second, limits establish accountability for keytasks in the risk-taking process and establish the level or condi-tions under which transactions may be approved or executed.
GuidelinesGuidelines are the directives provided to implement policiesas set out above. Generally, these describe the facility types,quantum and conditions under which the Bank is prepared todo business on an ongoing basis. These may change from time totime due to market or other circumstances. Risk taking outsideof these guidelines is usually approved by either the Bank’sSenior Credit Committees, Market Risk Management & PolicyCommittee or Risk Policy Committee.
Processes & standardsProcesses are the activities associated with identifying, evaluating,documenting, reporting and controlling risk. Standards define thebreadth and quality of information required to make a decision, andthe expectations in terms of quality of analysis and presentation.
Measurement, monitoring and reportingMeasurement tools quantify risk across products and businessesand are used, among other things, to determine risk exposure.Global Risk Management is responsible for developing andmaintaining an appropriate suite of such tools to support theoperations of the various business lines.
Reporting tools are also required to aggregate measures ofrisk across products and businesses for the purposes of ensuringcompliance with policies, limits and guidelines and providinga mechanism for communicating the quantum, types andsensitivities of the various risks in the portfolio. This informationis used by the Board and senior executive management tounderstand the Bank’s risk profile and the performance of theportfolio against defined goals.
Internal Audit independently monitors the Bank’s risk manage-ment framework. Audit’s work includes an evaluation of thedesign and operating effectiveness of the Bank’s risk managementframework, including compliance with policies and proceduresand adherence to related internal controls over the identification,measurement, management, monitoring and reporting of risks.
Risk ManagementFramework
Policies& Limits
Processes& Standards
Guidelines
Measurement& Reporting
RISK MANAGEMENT
S c o t i a b a n k 2 0 0 5 A n n u a l R e p o r t 5 9

MANAGEMENT’S DISCUSSION AND ANALYSIS
6 0 S c o t i a b a n k 2 0 0 5 A n n u a l R e p o r t
The Bank implements its risk management framework using a committee structure, as outlined below:
Board of Directors &Board Committees
Executive andRisk Committee
Audit and ConductReview Committee
Board of Directors &Board Committees
Executive andRisk Committee
Market Risk Management& Policy Committee
Business Units
Senior CreditCommittees
MarketRisk
LiquidityRisk
CreditRisk
OperationalRisk
EnvironmentalRisk
ReputationalRisk
Reputational RiskCommittee
Chief ExecutiveOfficer
Risk PolicyCommittee
Strategic TransactionInvestment Committee
LiabilityCommittee
Systems Planning andPolicy Committee
Board of Directors &/or Board Committees:
Reviews and approves risk management strategies, policies, standards and key limits.
Senior Management Committees:
Risk Policy Committee: reviews key risk exposures and risk policies, andadjudicates risk issues referred by the Senior Credit, Market and ReputationalRisk committees.
Senior Credit Committees: adjudicate corporate and commercial creditswithin prescribed limits and establish the operating rules and guidelines forthe implementation of credit policies. Separate committees cover commercial,international, corporate and investment banking counterparties. In addition,there are separate senior committees that authorize major credit policychanges for retail and small business credits.
Market Risk Management and Policy Committee: oversees andestablishes standards for market and liquidity risk management processeswithin the Bank, including the review and approval of new products, limits,practices and policies for the Bank’s principal trading and treasury activities.
Reputational Risk Committee: reviews structured finance transactions,loans, merchant banking transactions, underwriting and other transactionsor new products referred by business lines or the Senior Credit or MarketRisk Management and Policy committees, to ensure that the Bank is, and isseen to be, acting legally with high ethical standards.
Liability Committee: provides strategic direction in the management ofglobal interest rate risk, foreign exchange risk, liquidity and funding risk, andtrading and investment portfolio decisions.
Strategic Transaction Investment Committee: reviews and approves allpotential acquisitions, investments and strategic initiatives that require amajor allocation of the Bank’s capital.
Systems Planning and Policy Committee: reviews and approvessignificant business initiatives involving system and computing facilities inexcess of designated executive approval limits.
Risk GovernanceRisks are managed within policies and limits approved by the Board of Directors and in accordance with the governance structure outlined below:
Board oversight – Risk strategies,policies and limits are subject toBoard approval. The Board, directlyor through its committees, receivesregular updates on the key risks ofthe Bank.
Senior management committeestructure is designed to ensurealignment of business objectives,risk tolerance and resources.
Business units are responsible and accountable for managing risks within their portfolios, and are allocated capital in line with their risk profiles.
Audit review – Internal Auditreports independently to the Auditand Conduct Review Committee ofthe Board on the effectiveness ofthe risk management framework,and to the extent internal controlsare appropriately designed andoperating effectively.

RISK MANAGEMENT
S c o t i a b a n k 2 0 0 5 A n n u a l R e p o r t 6 1
Credit Risk
Credit risk is the risk of loss resulting from the failure of aborrower or counterparty to honour its financial or contractualobligations to the Bank. Credit risk is created in the Bank’sdirect lending operations, and in its funding, investment andtrading activities where counterparties have repayment orother obligations to the Bank.
Credit risk management strategies setting out target markets
and risk tolerances are developed at an all-Bank level, and then
further refined at the business line level. These strategies are
reviewed by the Risk Policy Committee, which in turn recom-
mends the key overall strategies to the Executive and Risk
Committee of the Board for approval on an annual basis. Once
approved, the credit risk strategies form part of the policies that
govern credit risk.
Corporate and Commercial
Portfolio management and risk diversification are key considera-
tions used to determine policies and limits. Credit risk limits
covering specified industries, countries, and single name/aggrega-
tion exposure are reviewed and approved by the Board of Directors
annually and applied through the credit origination process.
Consistent with the Board-approved limits, corporate and
commercial credit exposures are segmented into major industry
groups. The risks in these industry groups are managed through
limits, and lending criteria and guidelines relevant to each
particular industry. Borrower limits are set within the context
of established guidelines for individual borrowers, particular
industries, countries and certain types of lending to ensure the
Bank does not have excessive concentration in any single
borrower, or related group of borrowers, industry sector or
geographic region. Through the portfolio management process,
loans may be syndicated to reduce overall exposure to a single
name. For certain segments of the portfolio, credit derivative
contracts are also used to mitigate the risk of loss on borrower
default. Risk is also mitigated through the selective sale of loans.
The decision-making process for corporate and commercial
credit exposures is intended to ensure that risks are adequately
assessed, properly approved, continually monitored and actively
managed. All significant credit requests are processed through
the credit adjudication units of Global Risk Management for
analysis and recommendation. Within the risk management
framework, these credit units have defined authority levels
appropriate to the size and risk of each transaction. Where the
decision is beyond these authority levels, the credit unit will
make a recommendation and refer the request to a senior credit
committee for adjudication. Senior credit committees also have
defined authority levels and, accordingly, forward certain
transactions to the Risk Policy Committee. In certain cases,
these must be referred to the Board of Directors.
The decision-making process begins with an assessment of
the credit risk of the individual borrower or counterparty. Key
factors considered in the assessment include: analysis of the
borrower’s current and projected financial results and credit
statistics; the industry in which the borrower operates; economic
trends; geopolitical risk; and the borrower’s management. Based
on this assessment, a risk rating is assigned to the individual
borrower or counterparty. A separate risk rating is also assigned
at the facility level, taking into consideration additional factors
that affect the amount of loss in the event of a default of the
facility such as security, seniority of claim, structure and term.
While the Bank applies different methodologies to arrive at risk
ratings for the various unique portfolios, all risk ratings are
assigned using the same 18-category risk rating system. The risk
rating determines the level of seniority at which the credit decision
can be made, and is an input to loan pricing, the assignment of
economic capital and the computation of the general allowance
for credit losses. The Bank periodically reassesses its risk rating
methodologies and makes enhancements when necessary.
In making credit adjudication decisions, a number of other
factors are also considered, including industry and country
limits, and single name and connection concentration limits.
Various internal and external modeling techniques are used to
supplement the risk analysis of individual borrowers and credit
portfolios. In addition, a risk-adjusted return on equity
profitability model is used to provide an assessment of each
credit application to ensure the client and transaction structure
offers an appropriate return for a given level of risk. For the
corporate and domestic commercial portfolios, the Loan
Portfolio Management Group independently reviews the
profitability model results, together with external benchmarks,
and provides an opinion on the relative return and pricing of
each transaction above a minimum threshold.
Individual credit exposures are regularly monitored for any
signs of deterioration by both the business line units and Global
Risk Management. In addition, a review and risk analysis of each
borrower is conducted annually, or more frequently for higher-
risk borrowers. If, in the judgment of management, an account
requires the expertise of specialists in workouts and restructur-
ings, it will be transferred to a separate group within Global Risk
Management for monitoring and resolution.
Banking units and Global Risk Management review the various
segments of the credit portfolio across the organization on a
regular basis to assess whether economic trends or specific
events may affect the performance of the portfolio and determine
whether corrective action needs to be taken. These reviews
include the examination of the risk to particular industries and
countries. The results of these reviews are reported to the Risk
Policy Committee and, when significant, the Executive and Risk
Committee of the Board of Directors. The Risk Policy Committee
makes recommendations to the Board of Directors or the

MANAGEMENT’S DISCUSSION AND ANALYSIS
6 2 S c o t i a b a n k 2 0 0 5 A n n u a l R e p o r t
Executive and Risk Committee regarding amendments to credit
policies, including limit adjustments for various industries and
countries.
Consumer
The decision-making process for consumer and small business
loans is intended to ensure that credit risks are adequately
assessed, properly approved, continually monitored and actively
managed. Generally, decisions on consumer loans are based on
risk ratings, which are generated using predictive credit scoring
models. Individual credit requests are processed by proprietary
adjudication software.
The Bank’s credit adjudication and portfolio management
methodologies are designed to ensure consistent underwriting
and early identification of problem loans. The Bank’s rigorous
credit underwriting methodology and risk modeling in Canada
is customer rather than product focused. We believe that a
customer-centric approach provides better risk assessment than
product-based approaches, and should result in lower loan losses
over time. Our adjudication software calculates the maximum
debt for which the customer qualifies. This allows customers to
choose the products that satisfy all of their credit needs. Inter-
national Banking is developing systems and capturing data to
develop a similar approach to underwriting and risk modeling.
All significant credit scoring and policy changes proposed by
the business line require analysis and recommendation by Global
Risk Management, which is independent of the business line,
and approval by the appropriate Senior Credit Committee. All
credit scoring models are subject to ongoing validation and
independent review by Global Risk Management.
Consumer credit portfolios are reviewed monthly to determine
emerging trends in loan quality and to assess whether corrective
action is required.
Portfolio review
Corporate and commercial
Scotia Capital’s performance trends continued to improve on a
year-over-year basis, with the most significant improvements in
loan losses and impaired loan
formations in the U.S. portfolio.
There are a number of factors
contributing to this trend. The
overall credit environment has
improved. Also, the application
of risk and portfolio manage-
ment strategies has resulted in a
decline in both existing problem
loans and the formation of new
problem loans.
The domestic and interna-
tional commercial portfolios
remained in good condition, as loan loss provisions in both
portfolios declined on a year-over-year basis.
Overall, the credit quality of the Bank’s corporate and
commercial portfolio has remained stable year over year.
Domestic retail
Overall credit quality in the consumer portfolio continued to be
excellent. Total retail reportable delinquency (dollars of assets
two or more months in arrears, divided by total outstanding
assets) was 1.36%, virtually unchanged from last year. As well,
the provision for credit losses in the domestic retail portfolio
was 22 basis points of average assets, an improvement of one
basis point from last year. Portfolio quality continues to benefit
from high levels of security, with nearly 90% of retail loans being
secured by an underlying asset such as a house or car. This high
level of security reflects the growth in Scotia Total Equity Plan
lending, where all products, even lines of credit and credit
cards, are secured. Currently, 63% of the ScotiaLine line of
credit and ScotiaLine VISA* portfolios are secured.
* VISA Int./Lic. User The Bank of Nova Scotia
International retail
Credit quality is at acceptable levels within the risk tolerances
that have been set for our international retail portfolio. Total
reportable retail delinquency rates and provisions for credit
losses in this portfolio have been improving over the last five
years. In 2005, delinquency rates and provisions remained
within approved tolerance levels, notwithstanding the significant
loan growth in the Scotiabank Inverlat portfolio.
Risk diversification
The Bank’s exposures to various countries and types of
borrowers are diversified, as shown in the following charts and
in Tables 16 and 17 on pages 77 and 78. Table 16 shows loans
and acceptances by geography. Ontario represents the largest
Canadian exposure at 42% of the total. Outside of Canada,
Latin America has the largest concentration with 8% of the total.
Table 17 shows loans and acceptances by type of borrower.
0.5
1.0
1.5
2.0
Q404
Q105
Q205
Q305
Q405
Low delinquency in Canadianretail portfoliodelinquent loans as a % of total loans
Well diversified in Canada,and internationally…loans & acceptances, excl. reverserepos, September 2005
CanadaLatin AmericaCaribbeanUnited States
Europe/Middle EastAsia
…and in household andbusiness lendingloans & acceptances, excl. reverserepos, September 2005
ResidentialBusinessPersonalFinancial & government

RISK MANAGEMENT
S c o t i a b a n k 2 0 0 5 A n n u a l R e p o r t 6 3
Excluding loans to households, the largest concentrations are
in financial services, real estate and construction, and wholesale
and retail distribution with 5.5%, 3.5% and 3.0% respectively,
of total loans and acceptances.
The Bank actively monitors industry concentrations, currently
focusing on those industries affected by higher oil and commodity
prices, and the strengthening of the Canadian dollar. The North
American automotive industry is a sector that the Bank is
carefully monitoring, due to a number of challenges in both the
manufacturer and supplier segments. The forestry industry is
also exhibiting signs of stress. The Bank does not have significant
concerns with the level of its exposure to either of these two
industries, due to proactive decisions taken in previous years to
mitigate risk exposures. As in the case of all industry concentra-
tions, the Bank continues to closely monitor developing trends
and take additional steps to mitigate risk as warranted.
Risk mitigation
To mitigate exposures in its performing corporate portfolios, the
Bank uses loan sales and credit derivatives. In 2005, loan sales
aggregated $655 million, compared to $630 million in 2004. At
October 31, 2005, credit derivatives used to mitigate exposures
in the portfolios aggregated $444 million, compared to $500
million at October 31, 2004.
Market Risk
Market risk is the risk of loss of value in the Bank’s portfoliosresulting from changes in interest rates, foreign exchangerates, credit spreads, and commodity and equity prices. TheBank assumes market risk in both its trading and non-trading(funding and investment) activities.
Interest rate risk is the risk of loss due to adverse changes ininterest rates.
Foreign exchange risk is the risk of loss due to adverse movementsin foreign currency rates.
Equity risk is the risk of loss due to adverse movements in the levelof the equity markets or in individual equity prices.
Commodities risk is the risk of loss due to adverse changes incommodity rates and prices.
Credit spread risk is the risk of loss due to adverse changes in themarket price of credit, or the creditworthiness of a particular issuer.
Risk Measurement Summary
Value at RiskValue at Risk (VAR) is an estimate, within a given level ofstatistical confidence, of the potential for loss of value thatcould result from holding a position for a specified period oftime. For trading books, VAR is calculated daily at a 99%confidence level, for a one-day holding period, using historicalsimulations based on 300 days of market data. The quality ofthe Bank’s VAR is validated by ongoing back testing analysis,in which the VAR is compared to theoretical and actual profitand loss results. VAR is also used to evaluate risks arising incertain funding and investment portfolios.
Stress testingVAR measures potential losses in normally active markets.Stress testing examines the impact that abnormally largeswings in market factors and periods of prolonged inactivitymight have on trading portfolios. The stress testing programis designed to identify key risks and ensure that the Bank’scapital can easily absorb potential losses from abnormalevents. The Bank subjects its trading portfolios to over 50stress tests on a daily basis, and over 200 stress tests on amonthly basis. From time to time, the Bank also evaluatesrisk in its investment portfolios, using stress tests based onspecific market events.
Sensitivity analysis and simulation modelingSensitivity analysis assesses the effect of changes in interestrates on current earnings and on the economic value ofassets and liabilities. It is applied globally to each of themajor currencies within the Bank’s operations. Simulationmodels enable the Bank to assess interest rate risk undera variety of scenarios over time. The models incorporateassumptions about growth, planned business mix, changesin interest rates, shape of the yield curve, embedded productoptions, maturities and other factors. Simulation modelingunder various scenarios is particularly important for managingrisk in the deposit, lending and investment products the Bankoffers to its retail customers.
Gap analysisGap analysis is used to assess the interest rate sensitivityof the Bank’s retail, wholesale banking and internationaloperations. Under gap analysis, interest rate sensitive assets,liabilities and off-balance sheet instruments are assigned todefined time periods on the basis of expected re-pricingdates. A liability gap occurs when more liabilities than assetsare subject to interest rate changes during a given timeperiod. Conversely, an asset-sensitive position arises whenmore assets than liabilities are subject to rate changes.
Funding
Interest rate risk
Foreign exchange risk
Investments
Interest rate risk
Foreign exchange risk
Equities risk
Credit spread risk
Trading
Interest rate risk
Foreign exchange risk
Equities risk
Commodities risk
Credit spread risk

MANAGEMENT’S DISCUSSION AND ANALYSIS
6 4 S c o t i a b a n k 2 0 0 5 A n n u a l R e p o r t
The Board of Directors reviews and approves all-Bank
market risk policies and limits annually. The Bank’s Liability
Committee (LCO) and Market Risk Management and Policy
Committee (MRMPC) oversee the application of the framework
set by the Board, and provide oversight over the Bank’s market
risk exposures and the activities that give rise to these
exposures. The MRMPC establishes specific operating policies,
and sets limits at the product, portfolio, business unit and
business line levels, and for the Bank in total. Limits are
reviewed at least annually.
Global Risk Management provides independent oversight
of all significant market risks, supporting the MRMPC and LCO
with analysis, risk measurement, monitoring, reporting and
proposals for standards. The Bank uses a variety of metrics
and models to measure and control market risk exposures.
The measurements used are selected based on an assessment
of the nature of risks in a particular activity. The principal
measurement techniques are Value at Risk, stress testing, sensi-
tivity analysis and simulation modeling, and gap analysis. The
use and attributes of each of these techniques is noted in the
Risk Measurement Summary on the previous page. Models are
independently validated prior to implementation and are subject
to formal periodic review.
To ensure compliance with policies and limits, market risk
exposures are independently monitored on a continuing basis
by Global Risk Management and back offices. They provide
senior management, business units, the LCO, and the MRMPC
with a series of daily, weekly and monthly reports of market
risk exposures by business line and risk type. The Board also
receives regular reports on key risk exposures and performance
covering various business lines.
Funding and investment activities
Market risk arising from the Bank’s funding and investment
activities are identified, managed and controlled through the
Bank’s asset liability management processes. The Liability
Committee meets weekly to review risks and opportunities,
and evaluate performance.
Interest rate risk
The Bank actively manages its interest rate exposures with the
objective of enhancing net interest income within established
risk tolerances. Interest rate risk arising from the Bank’s funding
and investment activities is managed in accordance with Board-
approved policies and global limits, which are designed to control
the risk to income and economic value. The income limit
measures the effect of a specified shift in interest rates on the
Bank’s annual net income, while the economic value limit
measures the impact of a specified change in interest rates on
the present value of the Bank’s net assets. Interest rate exposures
in individual currencies are also controlled by gap limits. Gap
analysis, simulation modeling, sensitivity analysis and VAR are
used to assess exposures and for planning purposes.
The table below shows the breakdown of the Canadian dollar
and foreign currency interest rate gaps as at October 31, 2005,
and the chart below illustrates trends in one-year interest rate
gaps. As at October 2004, the Bank had a moderate one-year
asset gap in Canadian dollars. During fiscal 2005, this asset gap
exposure was increased in anticipation of higher interest rates.
The Canadian dollar margin declined in 2005 as a result of a
flattening of the yield curve, a shift in customer preferences
toward lower yielding variable rate mortgages, and the funding
of retail asset growth, in part through wholesale deposits.
Table 12 Interest rate gap
Non-interestInterest rate sensitivity position(1) Within 3 to 12 Over rateAs at October 31, 2005 ($ billions) 3 months months 1 year sensitive Total
Canadian dollarsAssets $ 122.1 $ 17.4 $ 45.8 $ 6.3 $ 191.6Liabilities 107.3 23.7 42.9 17.7 191.6Gap 14.8 (6.3) 2.9 (11.4)Cumulative gap 14.8 8.5 11.4 –Foreign currenciesAssets 91.0 8.8 15.6 7.0 122.4Liabilities 100.9 4.1 1.5 15.9 122.4Gap (9.9) 4.7 14.1 (8.9)Cumulative gap (9.9) (5.2) 8.9 –TotalGap $ 4.9 $ (1.6) $ 17.0 $ (20.3)Cumulative gap 4.9 3.3 20.3 –As at October 31, 2004:
Gap $ 7.6 $ (4.5) $ 16.4 $ (19.5)Cumulative gap 7.6 3.1 19.5 –
(1) The above figures reflect the inclusion of off-balance sheet instruments, as well as an estimate of prepayments on consumerand mortgage loans and cashable GICs. The off-balance sheet gap is included in liabilities.
-6
0
6
12
040302 05
Interest rate gap$ billions, one-year liability gap
Canadian dollar
Foreign currencies

RISK MANAGEMENT
S c o t i a b a n k 2 0 0 5 A n n u a l R e p o r t 6 5
The Bank maintained a one-year liability gap in foreign
currencies throughout fiscal 2005. These exposures were modest
during the first half of the fiscal year and trended higher in the
last half of the year. Overall, foreign currency margins decreased
slightly in 2005.
Based on the Bank’s interest rate positions at year end 2005,
an immediate and sustained 100 basis point rise in interest rates
across all currencies and maturities would increase net income
after tax by approximately $42 million over the next 12 months.
During fiscal 2005, this measure has ranged between $41 million
and $84 million. This same increase would reduce the after-tax
present value of the Bank’s net assets by approximately $413
million. During fiscal 2004, this measure has ranged between
$311 million and $413 million.
Foreign currency risk
Foreign currency risk arising from the Bank’s funding andinvestment activities includes that from the Bank’s netinvestments in self-sustaining foreign operations (subsidiaries,branches and associated corporations) and from its netcorporate foreign currency positions. The Bank’s corporateforeign currency positions generally comprise foreign currencyprofits earned in its domestic and foreign branches.
The Bank’s exposure to its net investments in self-sustaining
foreign operations is controlled by a Board-approved limit and
is reviewed quarterly by the Liability Committee. When econom-
ically feasible, the Bank may hedge this exposure by funding
the investments in the same currency, or with other financial
instruments, including derivatives. In accordance with GAAP,
foreign currency translation gains and losses from net invest-
ments in self-sustaining foreign operations are recorded in
the cumulative foreign currency translation account within
shareholders’ equity. While gains/losses on net investments may
increase/reduce the Bank’s capital, depending on the strength
or weakness of the Canadian dollar against other currencies, the
Bank’s regulatory capital ratios are not materially affected, since
the risk-weighted assets of the foreign operations rise or fall in
about the same proportion as the change in capital.
The Bank is subject to foreign currency translation risk on the
earnings of its foreign operations. To manage this risk, foreign
currency revenues and expenses, which are primarily denominated
in U.S. dollars and Mexican pesos, are projected over a number of
future fiscal quarters. The Liability Committee assesses economic
data and forecasts and decides on the portion of the estimated
future foreign currency revenues and expenses to hedge. Hedging
instruments would normally include foreign currency spot and
forward contracts, as well as foreign currency options. Some of
these economic hedges may not qualify for hedge accounting
under current accounting rules, so there is a potential for a
mismatch in the timing of the recognition of economic hedge
gains/losses and the underlying foreign earnings translation
gains/losses. In accordance with GAAP, foreign currency
translation gains and losses from corporate positions are
recorded in earnings.
The translation effect of the strengthening of the Canadian
dollar on the Bank’s earnings is summarized on page 33. In the
absence of hedging activity, a one per cent increase (decrease)
in the Canadian dollar against all the currencies in which we
operate, decreases (increases) our earnings by approximately
$23 million before tax. A similar change in the Canadian dollar
would decrease (increase) the foreign currency translation
account in shareholders’ equity by approximately $81 million.
Investment portfolio risks
The Bank holds investment portfolios for liquidity, longer-term
capital appreciation or attractive after-tax yields. These portfolios
expose the Bank to interest rate, credit spread and equity risk.
Debt investments primarily consist of government, agency, and
corporate bonds. Equity investments include common and
preferred shares, as well as a diversified portfolio of third-party
managed funds. The majority of these securities are valued
using prices obtained from external sources. These portfolios
are controlled by a Board-approved policy and limits.
As at October 31, 2005, the market value of the Bank’s
investment portfolios was $1,035 million over book value,
compared to a surplus of $1,048 million over book value at
the end of fiscal 2004.
Trading activities
Scotiabank’s policies, processes and controls for trading
activities are designed to achieve a balance between pursuing
profitable trading opportunities and managing earnings volatility
within a framework of sound and prudent practices. Trading
activities are primarily customer focused, but also include a
proprietary component.
Market risk arising from the Bank’s trading activities is
managed in accordance with Board-approved policies and
aggregate VAR and stress testing limits. The Board reviews VAR
and stress testing results quarterly. Within the Board-approved
framework, the Market Risk Management and Policy Committee
establishes detailed trading policies, product and risk limits,
including VAR limits by business line.
Global Risk Management independently develops, executes
and analyzes stress testing, sensitivity analysis, VAR calculations
and valuation processes; develops models used for limit
monitoring and financial reporting purposes; and reviews and
participates in new product development. Models and policies
are subject to formal periodic review.
Trading portfolios are marked to market in accordance with
the Bank’s valuation policies. Positions are marked to market
daily and valuations are independently reviewed by back office
or Global Risk Management units on a regular basis. These units
also provide profit and loss reporting, as well as VAR and limit

MANAGEMENT’S DISCUSSION AND ANALYSIS
6 6 S c o t i a b a n k 2 0 0 5 A n n u a l R e p o r t
compliance reporting to business unit management and executive
management for evaluation and action where appropriate.
In fiscal 2005, the one-day VAR for trading activities averaged
$7.6 million, compared to $8.8 million in 2004. The decline in
VAR was due primarily to reduced interest rate risk. The
following table shows the VAR by risk factor.
One-day VAR by risk factor ($ millions)
2005 2004Year Yearend Avge. High Low end Avge. High Low
Interest rate 4.6 6.0 13.0 3.1 3.6 7.9 19.5 2.6Equities 4.3 3.9 6.0 1.7 4.0 4.3 8.3 2.1Foreign exchange 1.0 2.0 6.9 0.2 1.5 1.4 3.2 0.2Commodities 1.7 1.0 2.5 0.1 0.7 0.8 1.8 0.4Diversification effect (5.0) (5.3) N/A N/A (4.5) (5.6) N/A N/AAll-Bank VAR 6.6 7.6 15.9 4.9 5.3 8.8 19.0 4.2
The histogram below shows the distribution of daily trading
revenue for fiscal 2005. Trading revenue averaged $3.6 million
per day, compared to $3.0 million for 2004. Revenue was
positive on more than 95% of trading days during the year,
compared to 92% in 2004. During the year, the largest single
day loss was $4.0 million.
Derivative instruments and structured transactions
Derivatives
The Bank uses derivatives to meet customer needs, generate
revenues from trading activities, manage market and credit risks
arising from its lending, funding and investment activities, and
to lower its cost of capital. The Bank uses several types of
derivative products, including interest rate swaps, futures and
options, to hedge interest rate risk exposure. Forward contracts,
swaps and options are used to manage foreign currency risk
exposures. Credit exposures in its lending and investment books
are managed using credit default swaps. As a dealer, the Bank
markets a range of derivatives to its customers, including interest
rate, foreign exchange, equity, commodity and credit derivatives.
Market risk arising from derivatives transactions is subject to
the control, reporting and analytical techniques noted earlier
under Trading Activities. Additional controls and analytical
techniques are applied to address certain market-related risks
that are unique to derivative products.
To control credit risk associated with derivatives, the Bank
uses the same credit risk management activities and procedures
that are used in the lending business in assessing and adjudicating
potential credit exposure. The Bank applies limits to each
counterparty, measures exposure as the current fair value plus
potential future exposure, and uses credit mitigation techniques,
such as netting and collateralization. Note 23 to the consolidated
financial statements on page 125 summarizes the remaining term
to maturity of the notional amounts of the Bank’s derivative
instruments by type. Over half of the notional value of the
Bank’s derivative instruments mature within one year, while 88%
mature within five years. Investment grade counterparties
account for 85% of the credit risk amount arising from the
Bank’s derivative transactions, compared to 88% last year.
The Bank’s use of credit derivatives increased year over year,
as notional principal amounts rose by $2.3 billion to $21.1 billion.
The growth was in the Bank’s trading businesses, where the
activity includes trading with customers, structured transactions
and modest proprietary trading. Net credit derivative trading
exposures were not significant. The Bank also transacts credit
derivatives in its investment and loan portfolios. Credit protection
sold is used as an alternative to bond or loan assets, while credit
protection bought is used to manage credit exposures. As at
October 31, 2005, the notional value of credit default swaps sold
in the investment and credit portfolios was $0.4 billion and the
notional value bought was $0.4 billion.
-3-4 -1-2 0 2 4 6 8 10 14120
5
10
15
20
25
30
35
40
45
Low variability of trading revenuesperiod ending October 31, 2005
Gain
Neutral
Loss
Q1 Q2 Q3 Q4-20
-15
-10
-5
0
5
10
15
Daily trading revenue vs. Value At Risk$ millions, November 1, 2004, to October 31, 2005
Actual P&LVAR, 99%, 1 day holding period

RISK MANAGEMENT
S c o t i a b a n k 2 0 0 5 A n n u a l R e p o r t 6 7
Derivative products used for asset/liability management
(non-trading) purposes are economic hedges. They must meet
specified designation, documentation and effectiveness testing
requirements to qualify for hedge accounting treatment. Further
details on the accounting for derivatives can be found in Note 1
of the 2005 consolidated financial statements on page 98.
Structured transactions
Structured transactions are specialized transactions that may
involve combinations of cash, other financial assets and deriva-
tives designed to meet the specific risk management or financial
requirements of customers. These transactions are carefully
evaluated by the Bank to identify and address the credit, market,
legal, tax, reputational and other risks, and are subject to a
cross-functional review and sign off by trading management,
Global Risk Management, Taxation, Finance and Legal Departments.
All large structured transactions are also subject to review by
senior risk management committees and evaluated in accordance
with the procedures described below in Reputational Risk.
The market risk in these transactions is usually minimal, and
returns are earned by providing structuring expertise and by
taking credit risk. Once executed, structured transactions are
subject to the same ongoing credit reviews and market risk
analysis as other types of derivatives transactions. This review
and analysis includes careful monitoring of the quality of the
reference assets, and ongoing valuation of the derivatives and
reference assets.
Liquidity risk
Liquidity risk is the risk that the Bank is unable to meet itsfinancial obligations in a timely manner at reasonable prices.Financial obligations include liabilities to depositors, paymentsdue under derivative contracts, settlement of securitiesborrowing and repurchase transactions, and lending andinvestment commitments.
Managing liquidity risk is essential to maintaining the confidence
of depositors and counterparties. It is managed within the
framework of policies and limits that are approved by the Board
of Directors. The Board receives reports on risk exposures and
performance against approved limits. The Liability Committee
provides senior management oversight of liquidity risk and
meets weekly to review the Bank’s liquidity profile.
The key elements of the framework used to manage liquidity
risk are:
• Setting limits to control the key elements of risk – Limits are
in place for net cash outflows over specified short-term time
horizons, as well as for minimum liquid asset inventories.
• Measuring and forecasting cash commitments – On- and
off-balance sheet cash flows are monitored on a daily basis.
• Diversifying funding sources – The Bank actively manages the
diversification of its deposit liabilities by source, type of
depositor, instrument, term and geographic market.
• Maintaining appropriate holdings of core liquid assets – The
Bank maintains a pool of highly liquid, unencumbered assets
that can be readily sold or pledged to secure borrowings
under stressed market or enterprise specific environments.
The Bank also maintains liquid assets to support its intra-day
settlement obligations in payment, depository and clearing
systems.
• Conducting regular liquidity crisis stress testing – The Bank
performs liquidity crisis stress testing on a quarterly basis to
evaluate the effect of extreme market or enterprise specific
conditions on the Bank’s liquidity.
• Maintaining liquidity contingency plans – The Bank’s liquidity
contingency plan provides the framework from which to
determine appropriate action plans in the event of a liquidity
crisis.
Liquidity profile
The Bank maintains large holdings of liquid assets to support
its operations, as shown in Table 13 on page 68. These assets
generally can be sold or pledged to meet the Bank’s obligations.
As at October 31, 2005, liquid assets were $82 billion (2004 –
$69 billion), equal to 26% of total assets versus 25% the previous
year. These assets consist of securities, 75% (2004 – 75%), and
cash and deposits with banks, 25% (2004 – 25%).
In the course of the Bank’s day-to-day activities, securities
and other assets are pledged to secure an obligation, participate
in clearing or settlement systems, or operate in a foreign juris-
diction. Securities may also be sold under repurchase agreements.
As at October 31, 2005, total assets pledged or sold under
repurchase agreements were $48 billion (2004 – $33 billion).
The year-over-year increase was due to a higher level of
securities sold under repurchase agreements, as well as to an
increase in assets pledged with respect to securities borrowed
and securities lent.
Funding
The Bank ensures that its
funding sources are well-
diversified. Funding source
concentrations are regularly
monitored and analyzed by
type and by industry. The
principal sources of funding
are capital, deposits drawn
from retail and commercial
clients in the Bank’s extensive
domestic and international
branch network, and whole-
sale funding. To ensure that the Bank does not place undue
reliance on a single entity as a funding source, the Bank
maintains a limit on the amount of deposits it will accept from
any one entity. Core funds, represented by capital and core
40
80
120
160
04 0501 02 03
Core Funds$ billions, October 31

MANAGEMENT’S DISCUSSION AND ANALYSIS
6 8 S c o t i a b a n k 2 0 0 5 A n n u a l R e p o r t
deposits of the Bank’s retail and commercial clients, were $152
billion as at October 31, 2005, versus $146 billion last year. This
increase was attributable primarily to higher balances of demand
and notice deposits and personal term deposits. As at October
31, 2005, the Bank’s core funds represented 48% of total funding
(2004 – 52%).
Contractual obligations
The table on the right provides aggregated information about
the Bank’s contractual obligations as at October 31, 2005, which
affect the Bank’s liquidity and capital resource needs. The
Bank’s contractual obligations include contracts and purchase
obligations, including agreements to purchase goods and
services, that are enforceable and legally binding on the Bank.
The table excludes deposit liabilities (except term funding),
other short-term financing arrangements, lending commitments
and pension and other retirement benefit obligations, which are
discussed in Notes 10, 22, 21 and 17, respectively, of the 2005
consolidated financial statements.
The Bank has a number of note issuance programs to broaden
its base of term funding. The Bank raises term funding through
a number of different issuance programs in order to diversify its
sources of funds. In 2005, the Bank issued $2,936 million in
euro-medium term notes, $5,243 million in the domestic market
and $733 million of Yankee certificates of deposit and other
instruments. Subordinated debentures are issued periodically as
part of the Bank’s capital funding program. There was no change
in the amount of subordinated debentures outstanding in 2005.
Other long-term liabilities include transactions where the
Bank is the paying agent on customer lease transactions, and
term financing bonds in the Bank’s foreign subsidiaries.
Contractual ObligationsUnder Over
($ millions) 1 year 1-3 years 4-5 years 5 years Total
Term funding
Wholesale deposit notes 3,453 7,973 2,892 498 14,816
Euro MTN 2,356 3,622 1,194 – 7,172
Subordinated debentures – 295 – 2,302 2,597
Other long-term liabilities – 386 350 518 1,254
Subtotal 5,809 12,276 4,436 3,318 25,839
Operating leases 152 227 142 194 715
Outsourcing obligations 199 321 177 472 1,169
Total 6,160 12,824 4,755 3,984 27,723
The Bank leases a large number of its branches, offices and
other locations. The vast majority of these leases are for a term of
five years, with an option to renew. The total cost of these leases,
net of rental income from subleases, was $176 million in 2005.
The Bank has entered into two major outsourcing contracts.
The largest is a seven-year contract with IBM Canada signed in
2001 to manage the Bank’s domestic computer operations,
including data centres, branches, ABMs and desktop computing
environment. This contract was expanded in 2005 to include
data centre operations in the Caribbean and Central America
and Mexico. The second is a three-year contract, with two
optional five-year renewals, signed in 2003 with Symcor Inc. to
manage the Bank’s cheque and bill payment processing, including
associated statement and report printing activities across
Canada. Both outsourcing contracts are cancellable with notice.
Capital commitmentsScotiabank has an ongoing program of capital investment to
provide the necessary level of technology and real estate
resources to service our customers and meet new product
requirements. All major capital expenditures go through a
rigorous review and approval process.
Table 13 LiquidityFor the fiscal years ($ millions) 2005 2004 2003 2002 2001
Canadian dollar liquid assetsCash and deposits with Bank of Canada $ 481 $ 356 $ 647 $ 868 $ 1,062Deposits with other banks 1,770 1,255 1,382 686 1,124Securities 39,361 32,211 34,234 30,310 25,284Call and short loans – – – – –
41,612 33,822 36,263 31,864 27,470Foreign currency liquid assetsCash and deposits with Bank of Canada 3,142 2,624 2,388 2,370 2,147Deposits with other banks 15,112 12,920 16,163 16,348 15,827Securities 22,180 19,344 20,254 16,194 17,702Call and short loans – – – – 291
40,434 34,888 38,805 34,912 35,967Total liquid assetsCash and deposits with Bank of Canada 3,623 2,980 3,035 3,238 3,209Deposits with other banks 16,882 14,175 17,545 17,034 16,951Securities 61,541 51,555 54,488 46,504 42,986Call and short loans – – – – 291
$ 82,046 $ 68,710 $ 75,068 $ 66,776 $ 63,437Liquid assets as a % of total assets 26.1% 24.6% 26.3% 22.5% 22.3%

RISK MANAGEMENT
S c o t i a b a n k 2 0 0 5 A n n u a l R e p o r t 6 9
Total capital expenditures were $171 million in 2005, up
from $158 million in 2004. For 2005, 36% of this spending was
technology-related, particularly for branch equipment, new
ABMs and computer hardware. Real estate spending comprised
the remaining 64% of capital expenditures for 33 new branches
and offices, and the renovation or expansion of existing
locations.
Operational Risk
Operational risk is the risk of loss, whether direct or indirect,to which the Bank is exposed due to external events, humanerror, or the inadequacy or failure of processes, procedures,systems or controls. Operational risk, in some form, exists ineach of the Bank’s business and support activities, and canresult in financial loss, regulatory sanctions and damage tothe Bank’s reputation.
The Bank has developed policies, standards and assessment
methodologies to ensure that operational risk is appropriately
identified, managed and controlled. The governing principles
and fundamental components of the Bank’s operational risk
management approach consist of:
• Accountability in the individual business lines for management
and control of the significant operational risks to which they
are exposed.
• A robust internal control environment.
• An effective organization structure through which operational
risk is managed, including:
– A Board of Directors responsible for sound corporate
governance.
– Executive management who have clearly defined areas
of responsibility.
– A central operational risk management unit responsible
for developing methods to identify, assess and monitor
operational risks.
– Independent specialist units responsible for developing
methods to control/mitigate specific components of
operational risk, including codifying policies and processes
required to control those specific risks.
– Separation of duties between key functions.
– An independent internal audit department responsible for
verifying, through regular risk-based audits, that significant
risks are identified and assessed, and for determining
whether appropriate controls are in place to ensure that
overall risk is at an acceptable level.
• A program designed to promote compliance and manage
compliance risk through an estabished network and a process
that includes the conduct of compliance risk assessments,
implementation of policies and procedures, training,
monitoring and issue resolution.
• An operational risk management framework, consisting of
processes and controls to identify, assess, monitor and
manage operational risk, such as risk control self-assessments,
measurement and reporting of operational risk, business
continuity planning, and risk mitigation through insurance,
where feasible and appropriate.
The Bank’s central operational risk management unit is part of
Global Risk Management, and is responsible for:
• The Bank’s risk control self-assessment program, which entails
formal reviews of significant operations to identify and assess
operational risks. This program provides a basis for management
to ensure that appropriate and effective controls and processes
are in place on an ongoing basis to mitigate operational risk
and, if not, that appropriate corrective action is being taken.
Where appropriate, business line management develops action
plans to mitigate identified risks. Results of these reviews are
summarized and reported to executive management.
• The Bank’s centralized operational loss event database, which
captures key information on operational losses. The scope of
operational loss event data captured within the centralized
database continues to be enhanced. This data is analyzed,
benchmarked against external data, and reported to executive
management.
Reputational Risk
Reputational risk is the risk that negative publicity regardingScotiabank’s business practices, whether true or not, willadversely affect its revenues, operations or customer base,or require costly litigation or other defensive measures.
Negative publicity about an institution’s business practices
may involve any aspect of its operations, but usually relates to
questions of business ethics and integrity, or quality of products
and services. Negative publicity and attendant reputational
risk frequently arise as a by-product of some other kind of risk
management control failure.
Reputational risk is managed and controlled throughout
the Bank by codes of conduct, governance practices and risk
management programs, policies, procedures and training. Many
relevant checks and balances are outlined in greater detail
under other risk management sections, particularly Operational
Risk, where reference is made to the Bank’s well-established
compliance program. All directors, officers and employees have
a responsibility to conduct their activities in accordance with the
Scotiabank Guidelines for Business Conduct, and in a manner
that minimizes reputational risk. The activities of the Legal
Department, Corporate Secretary, Public, Corporate &
Government Affairs and Compliance departments, and the
Bank’s Reputational Risk Committee, are particularly oriented
to the management of reputational risk.

MANAGEMENT’S DISCUSSION AND ANALYSIS
7 0 S c o t i a b a n k 2 0 0 5 A n n u a l R e p o r t
In providing credit or advice to customers, the Bank considers
whether the transaction or relationship might give rise to
reputational risk. The Bank has an established, Board-approved
Reputational Risk Policy, as well as a policy and procedures for
managing reputational and legal risk relative to structured
finance transactions. Global Risk Management plays a significant
role in the identification and management of this reputational
risk related to credit underwriting. Identified reputational risk
issues are referred to the Reputational Risk Committee for
adjudication. In addition, the Reputational Risk Committee is
available to support other risk management committees and
business units with their assessment of reputational risk
associated with products and transactions.
The Committee considers a broad array of factors when
assessing transactions, to ensure that they meet high ethical
standards. These factors include: the extent, and outcome, of
legal and regulatory due diligence pertinent to the transaction;
the economic intent of the transaction; the effect of the trans-
action on the transparency of a customer’s financial reporting;
the need for customer or public disclosure; conflicts of interest;
fairness issues; and public perception.
The Committee may impose conditions on customer trans-
actions, including customer disclosure requirements to promote
transparency in financial reporting, to ensure that transactions
meet Bank standards. In the event the Committee recommends
not proceeding with a transaction and the sponsor of the
transaction wishes to proceed, the transaction is referred
to the Risk Policy Committee.
Environmental Risk
Environmental risk refers to the possibility that environmentalconcerns involving the Scotiabank Group or its customers couldaffect the Bank’s financial performance.
To safeguard the Bank and the interests of its stakeholders,
Scotiabank implemented an environmental policy in 1991 which,
with Board approval, has been periodically updated. This policy
– which guides our day-to-day operations, lending practices,
supplier agreements and the management of our real estate
holdings – is supplemented by specific policies and practices
relating to individual business lines.
The Scotiabank Environmental Lending Policy ensures
appropriate consideration is given to environmental risks
associated with the business operations of each borrower. Such
considerations are factored into the Bank’s credit evaluation
procedures. Global Risk Management has primary responsibility
for establishing the processes and standards associated with this
risk. Decisions are taken in the context of the risk management
framework discussed on page 57.
In 2005, the Bank’s environmental risk practices in the area
of project finance were further enhanced with the adoption of
the Equator Principles. These are environmental and social
guidelines for project finance transactions with a capital cost
of US$50 million or higher, set by the International Finance
Corporation, the private sector arm of the World Bank. The
Equator Principles provide safeguards for sensitive projects
to ensure protection of natural habitats and the rights of
indigenous peoples, as well as safeguards against child and
forced labour.
Environmental concerns also play a prominent role in
shaping our real estate practices. The Real Estate Department
adheres to an Environmental Compliance Policy to ensure
responsible management of the Bank’s real estate holdings.
In addition, considerable recycling and resource management
programs are in place in the Bank’s corporate offices and branch
networks. In order to further reduce the Bank’s environmental
footprint, we are in the process of developing and implementing
more definitive management processes on energy and paper use.
To ensure it continues to operate in an environmentally
responsible manner, the Bank monitors policy and legislative
requirements, such as the Government of Canada’s Climate
Action Plan, through ongoing dialogue with government,
industry and stakeholders in countries where it operates.
Scotiabank recognizes that climate change is a leading
environmental risk for the Bank, for our customers and
Canadians more generally. Scotiabank has been meeting with
environmental organizations, industry associations and socially
responsible investment organizations with respect to the role
of banks in helping to address the issues of climate change,
protection of biodiversity, and promotion of sustainable forestry
practices, and we are currently in the process of reviewing our
policies in these areas.
For more information on Scotiabank’s environmental policies
and practices, please refer to our annual Public Accountability
Statement/Corporate Social Responsibility Report, which is also
available online at www.scotiabank.com.

CONTROLS AND ACCOUNTING POLICIES
S c o t i a b a n k 2 0 0 5 A n n u a l R e p o r t 7 1
Controls and procedures
Management’s responsibility for financial information contained
in this Annual Report is described on page 92. In addition, the
Bank’s Audit and Conduct Review Committee of the Board of
Directors has reviewed this Annual Report, and the Board of
Directors has reviewed and approved this Annual Report prior to
its release. The Bank is committed to providing timely, accurate
and balanced disclosure of all material information about the
Bank and to providing fair and equal access to such information.
The Bank’s disclosure policies and practices are published on
the Bank’s website.
As of October 31, 2005, the Bank’s management evaluated the
effectiveness of the design and operation of its disclosure controls
and procedures, as defined under the rules adopted by the U.S.
Securities and Exchange Commission (SEC) and the Canadian
securities regulatory authorities. This evaluation was performed
under the supervision of, and with the participation of the Chief
Executive Officer (CEO) and the Chief Financial Officer (CFO).
In addition, the Bank’s management has assessed whether,
during the 2005 fiscal year, there have been any significant
changes in the Bank’s internal control over financial reporting
that have materially affected, or are reasonably likely to materially
affect, the Bank’s internal control over financial reporting.
Disclosure controls are procedures designed to ensure that
information required to be disclosed in reports filed with securities
regulatory authorities is recorded, processed, summarized and
reported on a timely basis, and is accumulated and communicated
to the Bank’s management, including the CEO and the CFO, as
appropriate, to allow timely decisions regarding required disclosure.
Internal control over financial reporting is a process designed by, or
under the supervision of, senior management, to provide reasonable
assurance regarding the reliability of financial reporting and prepa-
ration of the Bank’s consolidated financial statements in accordance
with Canadian generally accepted accounting principles.
The Bank’s management, including the CEO and the CFO, does
not expect that the Bank’s disclosure controls or internal control
over financial reporting will prevent or detect all misstatements
due to error or fraud. Because of the inherent limitations in all
control systems, an evaluation of controls can provide only
reasonable, not absolute assurance, that all control issues and
instances of fraud or error, if any, within the Bank have been
detected. The Bank is continually evolving and enhancing its
systems of controls and procedures.
Based on the evaluation of disclosure controls and assessment
of changes in internal control over financial reporting, the CEO
and the CFO have concluded that, subject to the inherent
limitations noted above:
• the Bank’s disclosure controls are effective in ensuring that
material information relating to the Bank is made known to
management on a timely basis, and is fairly presented in all
material respects in this Annual Report; and
• during the 2005 fiscal year, to the best of their knowledge
and belief, there have been no changes in the Bank’s internal
control over financial reporting that have materially affected,
or are reasonably likely to materially affect, the Bank’s
internal control over financial reporting.
Current SEC rules will require the CEO and CFO to certify
annually that they have evaluated the effectiveness of the design
and operation of internal control over financial reporting and to
provide an annual report on internal control over financial
reporting. During 2005, the application of this rule was deferred
and will be applicable to the Bank for the fiscal year ending
October 31, 2006. In addition, a similar requirement is
expected to be introduced by the Canadian securities regulatory
authorities commencing in 2007. The Shareholders’ Auditors
will be required to attest to and report on management’s
assessment. A significant effort is under way to meet this new
reporting requirement.
Critical accounting estimates
The Bank’s accounting policies are integral to understanding and
interpreting the financial results reported in this Annual Report.
The significant accounting policies used in preparing the Bank’s
consolidated financial statements are summarized in Note 1 to
those statements. Certain of those policies are considered to be
particularly important to the presentation of the Bank’s financial
position and results of operations, because they require
management to make difficult, complex or subjective judgments
and estimates, often as a result of matters that are inherently
uncertain. The following is a discussion of those critical
accounting estimates. These estimates are adjusted in the
normal course to reflect changing underlying circumstances.
C o n t r o l s a n d a c c o u n t i n g p o l i c i e s

MANAGEMENT’S DISCUSSION AND ANALYSIS
7 2 S c o t i a b a n k 2 0 0 5 A n n u a l R e p o r t
Allowance for credit losses
The allowance for credit losses adjusts credit-related assets for
probable incurred credit losses to their estimated net realizable
value and is comprised of both specific allowances and a general
allowance. Management determines the allowance for credit
losses based upon its best estimate of the probable incurred
credit-related losses existing in the portfolio of deposits with
banks, securities purchased under resale agreements, loans,
acceptances and other indirect credit commitments, such as
letters of credit and guarantees. Management reviews credit
quality on a regular basis in order to determine the adequacy of
the allowance for credit losses. This process inherently involves
the use of many estimates and subjective judgments at many
levels, including identifying credits that are impaired, considering
factors specific to individual credits, as well as the impact of
portfolio characteristics and risks. Changes to these estimates,
or the use of different but also reasonable judgments and
estimates, could have a direct impact on the provision for credit
losses and could result in a change in the related allowance.
In determining specific allowances applicable to individual
credit exposures, management must first form a judgment as to
whether a loan is impaired, and then as to its estimated net
realizable value, based on evidence available about the individual
borrower. If there is no longer reasonable assurance that interest
and principal payments will be paid on a timely basis, the loan
will be classified as impaired. In estimating net realizable value,
the amount and timing of future cash flows, the fair value of any
underlying security placed as collateral, costs of realization,
observable market prices, and expectations about the future
prospects of the borrower and any guarantors are taken into
consideration.
Specific allowances are determined on a group basis for
homogenous portfolios, including credit card loans, certain
personal loans and certain international residential mortgages.
A formula method is used that takes into account recent loss
experience to estimate the probable losses inherent in the
portfolio.
With the improvement in credit quality in the loan portfolio,
particularly in Scotia Capital, management’s best estimate of
incurred losses on impaired loans resulted in a reduction in the
specific provisions for credit losses in 2005 compared to 2004.
The general allowance is an estimate of probable incurred
losses inherent in the portfolio of loans and loan commitments
that have not yet been specifically identified on an individual
basis as impaired. The methodology used to determine the
appropriate level of the general allowance is based on numerous
factors, including historical default probabilities, loss severity in
the event of default and exposure at default. The Bank applies
estimates of these parameters in an internally developed model
to arrive at an initial quantitative estimate of the general
allowance. Any material change in the above parameters or
assumptions would affect the range of expected credit losses
and consequently may affect the general allowance level. If
either the probability of default or the loss severity parameters
for the non-retail portfolio were independently increased or
decreased by 10%, the model would indicate an increase or
decrease to the quantitative estimate of approximately
$65 million (2004 – $60 million).
Senior management then forms a judgment as to whether
adjustments are necessary to the initially calculated amounts
for the general allowance, to take account of portfolio conditions
not reflected in historically-based credit parameters.
Considerations include observable data, such as economic
trends and business conditions, portfolio concentrations, risk
migrations and recent trends in volumes and severity of
delinquencies. The estimated general allowance is reviewed
each quarter to ensure the amount is appropriate in relation
to the size of the portfolio, inherent credit risks and trends in
portfolio quality.
The mix of certain of the economic trends and business
conditions factored in the general allowance calculation were
more favourable this year, consistent with the improved credit
conditions and the credit quality of the portfolio. This led to a
net reduction to the general allowance in 2005 of $45 million
(2004 - $100 million). The general allowance may be further
reduced in 2006 if the positive trends in economic and business
conditions continue.
Fair value of financial instruments
The Bank’s trading portfolios, which are primarily comprised of
securities and derivatives held for trading purposes, are carried at
fair value on the Consolidated Balance Sheet. Changes in the fair
values of trading instruments are recognized immediately in the
Consolidated Statement of Income (see Note 1 for further details
on significant accounting policies).
Trading securities are normally valued using quoted market
prices. Most trading derivatives, which include customer-driven
transactions and those undertaken for proprietary positions, are
valued using quoted market prices or valuation models which
incorporate independent and observable market parameters.
These market inputs can include interest rate yield curves,
foreign exchange rates and option volatilities. At October 31,
2005, 99% (2004 – 99%) of the Bank’s trading securities were
valued using quoted market prices. The gross fair value of trading
derivatives based on quoted market prices or observable market
parameters was 98% at October 31, 2005 (2004 – 97%).

CONTROLS AND ACCOUNTING POLICIES
S c o t i a b a n k 2 0 0 5 A n n u a l R e p o r t 7 3
Where quoted market prices are not available, fair values are
usually determined using present value or other techniques
based on observable interest rates, foreign exchange rates, credit
spreads and equity prices. Management’s judgment on valuation
inputs may be necessary when observable market data is not
readily available. Management also applies judgment in the
selection of valuation models, as well as consideration, on a
portfolio basis, of customer credit risk and ongoing direct costs
in the determination of fair value. Uncertainty in the estimates
applied can affect the fair value and financial results recorded;
however, the impact of any change in these estimates is not
expected to be significant.
Other-than-temporary impairment of investment securities
Investment securities comprise debt and equity securities held
for liquidity and longer-term investment. Investment securities
that are held at cost or, in the case of debt securities, at amor-
tized cost, are reviewed quarterly to determine whether the fair
value is below the current carrying value. In circumstances
where management determines that an other-than-temporary
impairment of an investment security has occurred, the carrying
value of the security is written down to its estimated net realiz-
able value. To assess if an other-than-temporary impairment has
occurred, management must make certain judgments and
estimates and considers factors such as the type of investment,
the length of time and extent to which the fair value of a security
has been below its carrying value, prospects for recovery in fair
value, and the company’s financial condition and future prospects.
Once management has determined that the security has suffered
an other-than-temporary decline in value, management must
form a judgment as to the estimated net realizable value of the
security. In making this estimate, management considers all of
the data gathered during the impairment evaluation process, as
well as the market liquidity and the Bank’s plans for the security.
As at October 31, 2005, the gross unrealized gains on
individual investment securities were $1,304 million, and the
gross unrealized losses were $145 million, combining for a net
unrealized gain of $1,159 million before related derivative and
other hedge amounts ($1,035 million after related derivative and
other hedge amounts). Management does not expect these
losses to be realized, as they have been judged to be temporary
in nature. Other-than-temporary impairments in value are
recorded in net gains on investment securities in other income
in the Consolidated Statement of Income.
Pensions and other employee future benefits
The Bank provides pension and other future benefit plans for
qualified employees in Canada, the United States and other
international operations.
The cost of these employee future benefits is actuarially
determined each year and is dependent upon a number of best
estimate assumptions made by management. These assumptions
include the long-term rate of investment return on plan assets,
future compensation, health care costs, turnover of employees,
mortality and the retirement age of employees. Management
applies judgment in the selection of these assumptions taking
into consideration, among other things, expectations regarding
future economic trends and business conditions, including
inflation rates. As well, management reviews historical
investment returns, salary increases and health care costs.
These assumptions are reviewed and approved annually by
management.
The discount rate used for measuring the benefit obligation
is another critical assumption used to calculate the cost of
employee future benefits, although this rate is generally
prescribed to be equal to the current yield on long term,
high-quality corporate bonds with a duration similar to the
benefit obligation. Thus, management applies little judgment
in selecting this rate.
Actual experience will differ from the assumptions made by
management, resulting in a net actuarial gain or loss that will
cause the benefit expense for future years to increase or
decrease. In accordance with Canadian GAAP, the difference is
amortized into income over future periods, rather than being
recognized immediately in income. If the unrecognized net
actuarial gain or loss is more than 10% of the greater of the plan
assets or benefit obligation at the beginning of the year, the
excess above this 10% threshold is generally amortized into
income over the estimated average remaining service period of
active employees ranging from 11 to 22 years for the Bank’s
principal pension plans and 7 to 27 years for the Bank’s principal
other benefit plans.
Note 17 of the 2005 consolidated financial statements on
pages 114 – 115 discloses management’s key assumptions, along
with a sensitivity analysis of changes in these assumptions on
both the benefit obligation and the benefit expense. Note 1 on
pages 98 to 102 of the 2005 consolidated financial statements
contains further details on the significant accounting policies
underlying accounting for employee future benefits. The
management assumption with the greatest sensitivity impact is
the assumed long-term rate of return on assets. If this assumed
long-term rate of return on assets was 1% lower (higher), the
benefit expense for 2005 would have been $38 million higher
(lower). Over the past 10-year period, the actual annualized rate
of return of 10.7% on the assets of the Bank’s main pension plan
exceeded the assumed annualized rate by 3.2%.

MANAGEMENT’S DISCUSSION AND ANALYSIS
7 4 S c o t i a b a n k 2 0 0 5 A n n u a l R e p o r t
Changes in accounting policies
The Bank’s significant accounting policies are set out in Note 1
on pages 98 to 102 of the 2005 consolidated financial state-
ments. Included within that note is a description of the changes
in accounting policies required to be adopted in 2005 in
response to new accounting standards.
• Effective November 1, 2004, the Bank adopted a new
accounting guideline issued by the Canadian Institute of
Chartered Accountants (CICA), which requires prospective
consolidation of variable interest entities (VIEs) by the
primary beneficiary. On adoption, the Bank assessed that it
was the primary beneficiary of multi-seller commercial paper
conduit programs that it administers and consolidated these
conduits in its financial statements. As a result, investment
securities, personal and credit card loans, and other liabilities
on the Consolidated Balance Sheet increased on the date of
adoption by $5 billion, $3 billion, and $8 billion, respectively.
As well, the Bank assessed that it was not the primary
beneficiary of Scotiabank Capital Trust and deconsolidated
this entity. In so doing, the Bank reclassified $1.5 billion of
obligations to business and government deposit liabilities from
capital instrument liabilities in the Consolidated Balance
Sheet. There were other VIEs that the Bank consolidated on
adoption of this new guideline, but the resulting increase in
total assets and liabilities was insignificant.
• Effective November 1, 2004, the Bank, as required, retro-
actively adopted, with restatement of prior periods, a new
pronouncement issued by the CICA amending the accounting
for certain financial instruments that have the characteristics
of both a liability and equity. This pronouncement requires
that a financial instrument of the Bank that must or can be
settled by issuing a variable number of the Bank’s own equity
instruments be presented as a liability rather than as equity.
Corporate income taxes
Management uses judgment in determining the provision for
income taxes and future income tax assets and liabilities. The
provision for income taxes is calculated based on the expected
income tax consequences of transactions and events during the
period. Tax legislation for each country in which the Bank
operates must be interpreted and assumptions made about the
expected timing of the reversal of temporary differences that
result from the different treatment of items for tax and accounting
purposes. If the actual timing of the reversals of the future tax
asset and liabilities differs from the expected timing or if
management’s interpretations of the legislation differ from those
of the tax authorities, the provision for income taxes could
increase or decrease in future periods. In addition, management
is required to assess whether it is more likely than not that the
future income tax assets will be realized prior to expiration and
consequently determine if a valuation allowance is required.
Total gross future tax assets relating to subsidiaries’ unused
income tax losses arising in prior years were $180 million as at
October 31, 2005 (2004 – $180 million), for which the Bank
established a valuation allowance of $75 million (2004 – $84
million) due to the uncertainty in realizing these losses. The
Bank will adjust the valuation allowance if and when there is
greater certainty of realizing this future tax asset.
The Bank’s total net future income tax asset, including the
net amount for tax loss carryforwards, was $1,233 million as at
October 31, 2005 (2004 – $999 million). This year’s increase
related primarily to deferred compensation expense and the
allowance for credit losses. Note 1 on pages 98 to 102 of the
2005 consolidated financial statements contains further details
on the significant accounting policies underlying accounting for
income taxes, and Note 16 on page 113 provides further infor-
mation with respect to the Bank’s provisions for income taxes.
Variable interest entities
In the normal course of business, the Bank enters into arrange-
ments with variable interest entities (VIEs). Further details are
provided on page 48 in the Off-balance sheet arrangements
section. Management needs to exercise judgment to determine if
the VIEs are required to be consolidated. This process involves
understanding the arrangements; determining whether the
entity is considered a VIE under the accounting rules; and,
determining the Bank’s variable interests in the VIE. These
interests are then compared to those of the unrelated outside
parties to identify the party that is exposed to the majority of
the VIE’s expected losses, expected residual returns, or both,
and thus who should consolidate the entity. The comparison
uses both qualitative and quantitative analytical techniques that
may involve the use of a number of assumptions about the
business environment in which the VIE operates and the amount
and timing of future cash flows. Further details with respect to
the Bank’s involvement with VIEs are provided in Note 6 to the
consolidated financial statement on page 106.

CONTROLS AND ACCOUNTING POLICIES
S c o t i a b a n k 2 0 0 5 A n n u a l R e p o r t 7 5
Related party transactions
In the ordinary course of business, the Bank provides normal
banking services to its associated and other related corporations
on terms similar to those offered to non-related parties.
In Canada, loans are currently granted to directors and officers
at market terms and conditions. Effective March 1, 2001, in
Canada, the Bank discontinued the prior practice of granting
loans to officers and employees at reduced rates. Any loans
granted prior to March 1, 2001, are grandfathered until maturity.
In some of the Bank’s foreign subsidiaries and branches, in
accordance with local practices and laws, loans may be made
available to officers of those foreign units at reduced rates or on
preferred terms. Loans to executive officers of the Bank totaled
$5.1 million as at October 31, 2005 (2004 – $4.5 million), and
loans to directors totaled $1.0 million (2004 – $0.5 million).
Directors can use some or all of their director fees earned
to buy common shares at market rates through the Directors’
Share Purchase Plan. Commencing in 2004, the Bank no longer
grants stock options to non-officer directors (refer to Note 15
of the consolidated financial statements on page 111).
The Bank may also enter into commercial arrangements with
companies controlled by directors. These commercial arrangements
are conducted at market terms and conditions, and follow the
normal credit review processes within the Bank. The Bank’s
committed credit exposure to companies controlled by directors
totaled $550 million as at October 31, 2005 (2004 – $587 million),
while actual utilized amounts were $311 million (2004 – $408
million).
The Bank has various processes in place to ensure that the
related party information is identified and reported to the Audit
and Conduct Review Committee (ACRC) of the Board of
Directors on a semi-annual basis. The oversight provided by the
ACRC meets the requirements of the Bank Act. The ACRC has
the responsibility for reviewing policies and practices of the
Bank for identifying transactions with its related parties that
may materially affect the Bank, and reviewing the procedures
for ensuring compliance with the Bank Act for related party
transactions. The Bank Act requirements encompass a broader
definition of related party transactions than is set out in generally
accepted accounting principles. In addition, the ACRC approves
the terms and conditions of all transactions between the Bank
and Bank-sponsored asset securitization special purpose vehicles
to ensure that such transactions are at market terms and
conditions. The ACRC is provided with detailed reports that
reflect the Bank’s compliance with its established procedures.
The Bank’s Audit Department carries out audit procedures as
necessary to provide the ACRC with reasonable assurance that
the Bank’s policies and procedures with respect to the identification,
authorization and reporting of related party transactions are
appropriately designed and operating effectively.
This pronouncement affected $2 billion of Scotiabank Trust
Securities issued through BNS Capital Trust and Scotiabank
Capital Trust, and $250 million of preferred shares issued by
Scotia Mortgage Investment Corporation. These instruments
were retroactively reclassified from non-controlling interest in
subsidiaries and shareholders’ equity, respectively, to capital
instrument liabilities. As well, effective November 1, 2004, in
accordance with the new VIE accounting requirements
discussed above, $1.5 billion of these Scotiabank Trust Securities
were reclassified prospectively to deposit liabilities in the
Consolidated Balance Sheet.
These accounting policy changes did not affect net income
available to common shareholders, earnings per share, or the
Bank’s risk-based regulatory capital ratios.

MANAGEMENT’S DISCUSSION AND ANALYSIS
7 6 S c o t i a b a n k 2 0 0 5 A n n u a l R e p o r t
Table 14 Geographic distribution of earning assets
2005% of
earningAs at September 30 ($ billions) Balance assets 2004 2003 2002 2001
North AmericaCanada $ 187.2 64.2% $ 166.9 $ 158.5 $ 147.8 $ 135.3United States 32.5 11.1 25.0 34.1 46.4 43.1
219.7 75.3 191.9 192.6 194.2 178.4EuropeUnited Kingdom 6.8 2.3 7.4 8.1 10.2 10.4Germany 2.0 0.7 3.5 2.9 2.8 3.5Ireland 4.0 1.4 2.0 1.4 1.6 1.4France 1.9 0.7 1.1 1.5 1.4 1.5Netherlands 1.7 0.6 0.8 1.5 1.1 1.0Other 4.2 1.4 3.4 4.8 5.0 5.6
20.6 7.1 18.2 20.2 22.1 23.4AsiaIndia 1.5 0.5 2.0 1.1 1.1 1.1Malaysia 1.8 0.6 1.4 1.5 1.6 1.7South Korea 1.7 0.6 1.4 1.8 2.3 1.5Japan 1.0 0.3 1.1 1.7 1.6 1.4Hong Kong 1.4 0.5 0.9 1.0 1.2 1.4Other 2.7 1.0 2.4 2.0 2.2 1.9
10.1 3.5 9.2 9.1 10.0 9.0CaribbeanJamaica 2.8 1.0 3.0 2.6 3.4 3.2Puerto Rico 1.7 0.6 1.9 2.1 2.6 2.4Bahamas 1.8 0.6 1.7 1.7 1.8 1.7Trinidad & Tobago 1.7 0.5 1.5 1.6 1.7 1.7Other 6.1 2.1 6.7 6.4 6.9 5.2
14.1 4.8 14.8 14.4 16.4 14.2Latin AmericaMexico 20.4 7.0 18.7 18.2 20.3 19.7Chile 3.2 1.1 3.3 3.4 3.6 3.0Argentina – – – – 0.2 3.7Other 3.8 1.3 3.5 3.7 3.7 3.9
27.4 9.4 25.5 25.3 27.8 30.3Middle East and Africa 1.1 0.4 0.7 0.4 0.5 0.4General allowance(1) (1.3) (0.5) (1.4) (1.5) (1.5) (1.5)Total $ 291.7 100.0% $ 258.9 $ 260.5 $ 269.5 $ 254.2
(1) As at October 31.
* Certain comparative amounts in this report have been reclassified to conform with current year presentation.
S u p p l e m e n t a r y D a t a *
Credit Risk

SUPPLEMENTARY DATA
S c o t i a b a n k 2 0 0 5 A n n u a l R e p o r t 7 7
Table 15 Cross-border exposure to select countries(1)
Investment inInterbank Government and subsidiaries 2005 2004
As at October 31 ($ millions) Loans deposits Trade other securities and affiliates(3) Other Total Total
AsiaSouth Korea $ 350 $ – $ 330 $ 586 $ – $ 12 $ 1,278 $ 1,358Japan 630 79 109 433 – 91 1,342 1,238Malaysia 438 – 3 514 137 15 1,107 1,181India 650 – 546 75 – 11 1,282 1,369Hong Kong 297 – 81 529 – 48 955 818China 2 40 629 26 – 4 701 813Other (2) 305 65 119 228 – 27 744 961
2,672 184 1,817 2,391 137 208 7,409 7,738Latin AmericaMexico 1,083 – 60 648 1,445 36 3,272 3,076Brazil 29 – 320 400 – 2 751 789Chile 492 – 4 – 277 – 773 839Venezuela 2 – 6 88 75 – 171 202Argentina – – – 34 – – 34 21Other (4) 1,191 8 74 69 238 – 1,580 1,352
$ 2,797 $ 8 $ 464 $ 1,239 $ 2,035 $ 38 $ 6,581 $ 6,279
(1) Cross-border exposure represents a claim, denominated in a currency other than the local one, against a borrower in a foreign country on the basis of ultimate risk.(2) Includes Indonesia, The Philippines, Singapore, Taiwan and Thailand.(3) Excludes goodwill of $116 (2004 – $104) in Chile, and $129 (2004 – nil) in El Salvador.(4) Includes Colombia, Costa Rica, El Salvador, Panama, Peru and Uruguay.
Table 16 Loans and acceptances by geographyExcludes reverse repos Percentage mixAs at September 30 ($ billions) 2005 2004 2003 2002 2001 2005 2001
CanadaAtlantic provinces $ 12.1 $ 11.3 $ 10.0 $ 9.4 $ 9.3 7.0% 5.9%Quebec 9.8 8.4 7.9 7.1 6.9 5.6 4.4Ontario 72.4 66.5 60.8 55.5 51.5 41.7 32.8Manitoba and Saskatchewan 5.3 5.1 5.0 4.8 4.8 3.1 3.0Alberta 14.7 13.7 11.7 11.1 11.1 8.4 7.0British Columbia 14.2 13.3 12.8 12.3 12.2 8.2 7.8
128.5 118.3 108.2 100.2 95.8 74.0 60.9InternationalUnited States 8.8 9.8 13.8 21.5 21.5 5.1 13.7Europe 7.3 6.1 8.0 10.8 10.3 4.2 6.6Caribbean 10.1 10.1 10.2 11.6 10.6 5.8 6.7Asia 5.5 4.4 4.6 4.9 5.2 3.2 3.3Latin America 13.7 12.2 12.2 13.1 15.0 7.9 9.5Middle East and Africa 1.0 0.6 0.4 0.3 0.3 0.6 0.2
46.4 43.2 49.2 62.2 62.9 26.8 40.0General allowance (1) (1.3) (1.4) (1.5) (1.5) (1.5) (0.8) (0.9)Total loans and acceptances $ 173.6 $ 160.1 $ 155.9 $ 160.9 $ 157.2 100.0% 100.0%
(1) As at October 31.

MANAGEMENT’S DISCUSSION AND ANALYSIS
7 8 S c o t i a b a n k 2 0 0 5 A n n u a l R e p o r t
Table 17 Loans and acceptances by type of borrower
Excludes reverse repos 2005As at September 30 ($ billions) Balance % of total 2004 2003 2002
Loans to householdsResidential mortgages $ 74.6 43.0% $ 68.3 $ 60.4 $ 55.9Personal loans 34.2 19.7 29.8 25.6 22.9
108.8 62.7 98.1 86.0 78.8Loans to businesses and governmentsResource and manufacturing, excluding automotive
Oil and gas 2.9 1.7 3.1 2.6 3.8Mining and primary metals 2.8 1.6 3.0 3.3 4.0Food and beverage 2.3 1.3 2.3 2.5 3.1Agriculture 2.2 1.3 2.2 2.3 2.3Forest products 1.8 1.0 1.4 1.6 2.6Electrical and other machinery 1.2 0.7 1.3 1.6 2.2Other resource and manufacturing 5.2 3.0 4.7 5.5 6.3
18.4 10.6 18.0 19.4 24.3Banks and other financial services 9.5 5.5 7.5 6.5 7.9Real estate and construction 6.1 3.5 5.5 7.0 7.2Wholesale and retail distribution, excluding automotive 5.2 3.0 5.4 5.7 5.1Automotive manufacturing and distribution 4.5 2.6 4.6 4.8 5.0Transportation 4.0 2.3 3.6 3.8 4.8Hotels 2.5 1.4 2.4 2.9 3.0Business services 1.8 1.0 1.5 1.9 2.2Government 1.6 0.9 1.7 1.7 1.3Utilities 1.5 0.9 1.9 2.8 4.6Media 1.5 0.9 1.7 2.5 2.9Telecommunications and cable 1.4 0.8 2.0 3.2 4.8Leisure and amusements 1.2 0.7 1.7 2.1 2.4Other services 6.9 4.0 5.9 7.1 8.1
66.1 38.1 63.4 71.4 83.6174.9 100.8 161.5 157.4 162.4
General allowance(1) (1.3) (0.8) (1.4) (1.5) (1.5)Total loans and acceptances $ 173.6 100.0% $ 160.1 $ 155.9 $ 160.9
(1) As at October 31.
Table 18 Off-balance sheet credit instruments
As at October 31 ($ billions) 2005 2004 2003 2002 2001
Commitments to extend credit $ 99.9 $ 104.2 $ 110.5 $ 127.0 $ 132.6Standby letters of credit and letters of guarantee 15.8 14.4 14.2 14.8 11.5Securities lending, securities purchase commitments and other 9.3 4.8 7.7 5.9 4.9Total $ 125.0 $ 123.4 $ 132.4 $ 147.7 $ 149.0
Table 19 Provisions for credit losses as a percentage of average loans and acceptances
For the fiscal years (%) 2005 2004 2003 2002 2001
DomesticRetail 0.22% 0.23% 0.26% 0.28% 0.28%Commercial 0.23 0.53 0.32 0.41 0.47
0.22 0.28 0.27 0.30 0.31
International(1) 0.23 0.23 0.23 1.41 0.77
Scotia Capital(2) (0.31) 0.42 1.60 3.04 1.74
Weighted subtotal – specific provisions 0.14 0.27 0.48 1.05 0.68General provision (0.02) (0.05) – – 0.10Weighted total 0.12% 0.22% 0.48% 1.05% 0.78%
(1) Includes reversals of $64 in 2003 and charges of $454 in 2002 relating to Argentina, including cross-border exposure.(2) Corporate banking only.

SUPPLEMENTARY DATA
S c o t i a b a n k 2 0 0 5 A n n u a l R e p o r t 7 9
Table 20 Changes in net impaired loans(1)
As at October 31 ($ millions) 2005 2004 2003 2002 2001
Gross impaired loansBalance at beginning of year $ 2,200 $ 3,241 $ 3,987 $ 4,439 $ 2,741New additions 1,263 1,774 2,634 4,843Declassifications, payments and loan sales (1,034) (1,680) (1,936) (1,789)Net additions 229 94 698 3,054 1,820Acquisition of subsidiaries 64 – – – 906Disposal of Scotiabank Quilmes operations(2) – – – (1,006) –Writeoffs (650) (982) (927) (2,376) (1,165)Foreign exchange and other (23) (153) (517) (124) 137Balance at end of year 1,820 2,200 3,241 3,987 4,439Specific allowance for credit lossesBalance at beginning of year 1,321 1,719 1,892 2,705 1,502Acquisition of subsidiaries 59 – – – 919Specific provision for credit losses 275 490 893 2,029 1,250Disposal of Scotiabank Quilmes operations(2) – – – (504) –Writeoffs (650) (982) (927) (2,376) (1,165)Recoveries 205 158 164 169 123Foreign exchange and other(3) (71) (64) (303) (131) 76Balance at end of year 1,139 1,321 1,719 1,892 2,705Net impaired loansBalance at beginning of year 879 1,522 2,095 1,734 1,239Net change in gross impaired loans (380) (1,041) (746) (452) 1,698Net change in specific allowance for credit losses 182 398 173 813 (1,203)Balance at end of year 681 879 1,522 2,095 1,734General allowance for credit losses 1,330 1,375 1,475 1,475 1,475Balance after deducting general allowance $ (649) $ (496) $ 47 $ 620 $ 259
(1) Excludes net impaired loans pertaining to designated emerging markets in years prior to 2004.(2) Includes foreign exchange impact.(3) Includes $2 transferred from other liabilities in 2005, and $23 reclassified from country risk allowance and $8 transferred to other liabilities in 2004.
Table 21 Specific provisions for credit losses by business line
For the fiscal years ($ millions) 2005 2004 2003 2002 2001
DomesticRetail $ 225 $ 207 $ 204 $ 197 $ 185Commercial 49 110 68 85 98
274 317 272 282 283InternationalLatin America(1) 56 4 (29) 434 162Caribbean 16 53 84 73 62Asia and Europe (2) 13 18 16 26
70 70 73 523 250Scotia CapitalCanada (12) (15) 124 37 38United States (93) 54 270 1,131 671Other 34 67 155 79 45
(71) 106 549 1,247 754
Other 2 (3) (1) (23) (37)
Total $ 275 $ 490 $ 893 $ 2,029 $ 1,250
(1) Includes reversals of $64 in 2003 and charge of $454 in 2002 of specific provisions with respect to Argentina, including cross-border exposure.

MANAGEMENT’S DISCUSSION AND ANALYSIS
8 0 S c o t i a b a n k 2 0 0 5 A n n u a l R e p o r t
Table 22 Specific provisions for credit losses by type of borrower
For the fiscal years ($ millions) 2005 2004 2003
Personal loans $ 286 $ 241 $ 246
Businesses and governmentsResource and manufacturing, excluding automotive
Oil and gas (3) – (51)Food and beverage (18) 60 54Forest products 10 (6) 19Agriculture 13 41 25Electrical and other machinery 1 (7) 42Primary metals and mining (44) 10 56Other 25 15 25
(16) 113 170Automotive manufacturing and distribution 4 20 34Banks and other financial services 3 – –Transportation (8) (24) 140Wholesale and retail distribution, excluding automotive (17) 81 25Utilities (68) 28 113Telecommunications and cable 19 2 27Real estate and construction 6 6 55Media (2) – –Hotels (5) (6) 30Government 7 1 1Business services 1 – 67Leisure & amusements 24 (16) 14Other services 41 44 35
(11) 249 711275 490 957
Argentina – – (64)Total specific provisions $ 275 $ 490 $ 893
Table 23 Non-performing loans by type of borrower
2005 2004Excluding reverse repos Allowance for Allowance forAs at October 31 ($ millions) Net credit losses Gross Net credit losses Gross
Personal loans $ 168 $ (462) $ 630 $ 135 $ (460) $ 595
Businesses and governmentsResource and manufacturing, excluding automotive
Oil and gas – – – – – –Food and beverage 19 (22) 41 36 (97) 133Forest products – (17) 17 3 (7) 10Agriculture 21 (31) 52 18 (28) 46Electrical and other machinery 19 (14) 33 32 (30) 62Primary metals and mining 18 (48) 66 24 (63) 87Other 46 (50) 96 64 (75) 139
123 (182) 305 177 (300) 477Automotive manufacturing and distribution 19 (13) 32 21 (29) 50Banks and other financial services – (15) 15 9 (10) 19Transportation 3 (48) 51 32 (49) 81Wholesale and retail distribution, excluding
automotive 19 (45) 64 40 (88) 128Utilities 21 (36) 57 157 (121) 278Telecommunications and cable 192 (35) 227 193 (38) 231Real estate and construction 2 (126) 128 41 (112) 153Media 2 (13) 15 3 (16) 19Hotels 18 (23) 41 18 (25) 43Government 9 (12) 21 – (3) 3Business services 3 (7) 10 3 (8) 11Leisure & amusements 73 (33) 106 2 (10) 12Other services 29 (89) 118 48 (52) 100
513 (677) 1,190 744 (861) 1,605681 $ (1,139) $ 1,820 879 $ (1,321) $ 2,200
Allowance for credit losses – general (1,330) (1,375)Net impaired loans after general allowance $ (649) $ (496)

SUPPLEMENTARY DATA
S c o t i a b a n k 2 0 0 5 A n n u a l R e p o r t 8 1
Table 24 Capital funding activity
Issues Maturities / Redemptions/RepurchasesTier 1 Capital Preferred sharesMarch 15, 2005 $300,000,000 Series 13 None
Non-cumulative Preferred SharesSubordinated debenturesNone
Table 25 Risk-weighted assets
As at October 31 ($ billions) 2005 2004Conversion Weighting Risk- Risk-factor factor Gross weighted Gross weighted
On-balance sheet– 0 – 20% Cash resources $ 20.5 $ 2.8 $ 17.2 $ 2.4– 0 – 100% Securities(1) 73.5 7.4 58.8 7.6– 0 – 50% Residential mortgages 75.4 25.3 68.8 22.4– 0 – 100% Loans and acceptances 123.2 85.1 110.0 80.7– 0 – 100% Other assets 21.4 5.3 24.4 5.1
Total on-balance sheet 314.0 125.9 279.2 118.2Off-balance sheet
Indirect credit instruments0 – 10% 0 – 100% One year and under credit commitments 57.6 1.2 67.0 –20% 0 – 100% Short-term trade letters of credit 0.9 0.2 0.8 0.250% 0 – 100% Longer-term credit commitments 42.3 17.4 37.1 15.750% 0 – 100% Performance guarantees 6.7 3.4 5.3 2.6100% 0 – 100% Standby letters of credit, letters of guarantee,
securities lending and other commitments 17.5 7.5 13.2 7.0125.0 29.7 123.4 25.5
Interest rate instruments0 – 1.5% 0 – 50% Futures and forward rate agreements 100.1 – 120.0 –0 – 1.5% 0 – 50% Interest rate swaps 415.9 1.3 472.3 1.80 – 1.5% 0 – 50% Interest rate options 64.9 0.1 95.9 0.1
580.9 1.4 688.2 1.9Foreign exchange instruments
1 – 7.5% 0 – 50% Futures and foreign exchange contracts 188.1 1.5 186.1 2.11 – 7.5% 0 – 50% Currency swaps 61.6 1.9 52.6 1.61 – 7.5% 0 – 50% Currency options 4.3 – 5.7 0.1
254.0 3.4 244.4 3.8Other derivative instruments
6 – 10% 0 – 50% Equity swaps and options 27.5 0.8 23.3 0.56 – 15% 0 – 50% Credit derivatives 21.0 0.5 18.8 0.37 – 15% 0 – 50% Other 2.9 0.1 2.6 0.1
51.4 1.4 44.7 0.9Total off-balance sheet 1,011.3 35.9 1,100.7 32.1Total gross and risk-weighted assets 1,325.3 161.8 1,379.9 150.3
Impact of master netting (2.3) (2.7)Market risk – risk assets equivalent (1) 3.3 2.9
Total $ 1,325.3 $ 162.8 $ 1,379.9 $ 150.5
(1) Includes assets which are subject to market risk. The risk weighting of these assets is included in “Market risk – risk assets equivalent.”
Capital

MANAGEMENT’S DISCUSSION AND ANALYSIS
8 2 S c o t i a b a n k 2 0 0 5 A n n u a l R e p o r t
Table 26 Components of net income as a percentage of average total assets (1)
Taxable equivalent basisFor the fiscal years (%) 2005 2004 2003 2002 2001
Net interest income 2.00% 2.10% 2.16% 2.29% 2.32%Provision for credit losses (0.07) (0.14) (0.31) (0.69) (0.53)Other income 1.46 1.52 1.39 1.33 1.50Net interest and other income 3.39 3.48 3.24 2.93 3.29Non-interest expenses (1.95) (2.06) (1.98) (2.01) (2.08)Net income before the undernoted: 1.44 1.42 1.26 0.92 1.21
Provision for income taxes and non-controlling interest (0.40) (0.40) (0.42) (0.34) (0.45)Net income 1.04% 1.02% 0.84% 0.58% 0.76%Average total assets ($ billions) $ 309.4 $ 284.0 $ 288.5 $ 296.9 $ 271.8
(1) Income from tax-exempt securities has been expressed on an equivalent before-tax basis. The provision for income taxes has been adjusted by a corresponding amount: 2005 – $326million; 2004 – $274 million; 2003 – $278 million; 2002 – $268 million; 2001 – $230 million.
Table 27 General allowance and unrealized gains (losses) on investment securities
For the fiscal years ($ millions) 2005 2004 2003 2002 2001
General allowance $ 1,330 $ 1,375 $ 1,475 $ 1,475 $ 1,475
Unrealized gains (losses) on investment securitiesCommon and preferred shares $ 499 $ 502 $ 164 $ (131) $ 35Emerging market bonds 574 507 512 219 298Other fixed income (38) 39 27 (113) 204
$ 1,035 $ 1,048 $ 703 $ (25) $ 537
Table 28 Assets under administration and management
As at September 30 ($ billions) 2005 2004 2003 2002 2001
Assets under administrationPersonal
Retail brokerage $ 64.2 $ 54.2 $ 47.4 $ 41.0 $ 40.1Investment management and trust 57.0 53.4 56.6 57.1 51.2
121.2 107.6 104.0 98.1 91.3Mutual funds 18.4 15.8 14.2 14.4 14.1Institutional 31.8 33.4 43.8 31.9 47.7Total $ 171.4 $ 156.8 $ 162.0 $ 144.4 $ 153.1
Assets under managementPersonal $ 9.4 $ 7.5 $ 7.0 $ 7.8 $ 8.2Mutual funds 13.4 11.8 11.6 12.2 12.0Institutional 3.8 1.9 1.4 1.5 1.7Total $ 26.6 $ 21.2 $ 20.0 $ 21.5 $ 21.9
Table 29 Fees paid to the shareholders’ auditors
For the fiscal years ($ millions) 2005 2004
Audit services $ 12.8 $ 13.1Audit-related services 1.6 0.5Tax services outside of the audit scope 1.6 3.2Other non-audit services 1.4 3.2
$ 17.4 $ 20.0
Other Information

SUPPLEMENTARY DATA
S c o t i a b a n k 2 0 0 5 A n n u a l R e p o r t 8 3
Table 30 Selected quarterly information2005 2004
As at and for the quarter ended Q4 Q3 Q2 Q1 Q4 Q3 Q2 Q1
Operating results ($ millions)
Net interest income(1) (TEB(2)) 1,581 1,561 1,552 1,503 1,461 1,497 1,521 1,496Total revenue(1) (TEB(2)) 2,735 2,689 2,688 2,614 2,457 2,532 2,770 2,536Provision for credit losses 36 85 35 74 40 50 130 170Non-interest expenses 1,579 1,517 1,490 1,457 1,461 1,472 1,523 1,406Provision for income taxes(1) (TEB(2)) 289 286 320 278 238 262 311 249Net income(1) 811 784 826 788 705 731 784 688Net income available to common shareholders 803 775 822 784 701 727 780 684Operating performanceBasic earnings per share(3) ($) 0.81 0.78 0.82 0.78 0.70 0.72 0.77 0.68Diluted earnings per share(3) ($) 0.80 0.77 0.81 0.77 0.69 0.71 0.75 0.67Return on equity (%) 20.5 19.9 22.3 21.0 18.8 19.4 21.8 19.4Productivity ratio(1) (%)(TEB(2)) 57.8 56.4 55.4 55.7 59.4 58.1 55.0 55.4Net interest margin on total average assets(1) (%)(TEB(2)) 1.97 1.97 2.07 2.00 2.06 2.09 2.16 2.11Balance sheet information ($ billions)
Cash resources and securities 94.0 95.9 93.4 89.1 75.9 85.0 81.3 81.6Loans and acceptances 198.6 199.5 192.8 188.6 178.9 182.2 179.9 175.7Total assets 314.0 317.5 309.1 300.5 279.2 286.9 283.6 281.5Deposits 217.4 220.0 214.8 206.9 195.2 201.1 197.6 191.8Preferred shares(1) 0.6 0.6 0.6 0.3 0.3 0.3 0.3 0.3Common shareholders’ equity 15.5 15.6 15.3 14.9 14.7 15.0 14.9 14.2Assets under administration 171.4 166.7 163.0 158.0 156.8 162.1 162.3 167.7Assets under management 26.6 24.0 23.4 22.6 21.2 21.2 20.9 20.5Capital measures (%)
Tier 1 capital ratio 11.1 11.1 11.4 11.2 11.5 11.3 11.2 10.9Total capital ratio 13.2 13.1 13.4 13.5 13.9 13.7 13.6 13.4Common equity to risk-weighted assets 9.7 9.7 9.8 9.8 9.9 9.8 9.7 9.5Tangible common equity to risk-weighted assets(4) 9.3 9.3 9.5 9.5 9.7 9.5 9.4 9.2Risk-weighted assets ($ billions) 162.8 163.8 160.1 155.5 150.5 155.5 155.7 153.5Credit qualityNet impaired loans(5) ($ millions) 681 573 666 762 879 1,198 1,371 1,487General allowance for credit losses ($ millions) 1,330 1,375 1,375 1,375 1,375 1,425 1,475 1,475Net impaired loans as a % of loans and acceptances(5) 0.34 0.29 0.35 0.40 0.49 0.66 0.76 0.85Specific provision for credit losses as a % of average loans and
acceptances (annualized) 0.16 0.17 0.07 0.16 0.20 0.22 0.30 0.38Common share informationShare price(3) ($)
High 44.22 42.64 41.37 41.35 40.00 36.88 37.45 34.24Low 40.31 39.19 38.63 36.41 35.28 32.90 33.38 31.08Close 42.99 41.75 39.99 39.50 39.60 36.60 35.15 33.75
Shares outstanding(3) (millions)
Average – Basic 995 995 996 1,006 1,008 1,008 1,011 1,011Average – Diluted 1,008 1,009 1,011 1,021 1,024 1,024 1,028 1,027End of period 990 995 994 998 1,009 1,008 1,009 1,011(6)
Dividends per share(3) ($) 0.34 0.34 0.32 0.32 0.30 0.30 0.25 0.25Dividend yield (%) 3.2 3.3 3.2 3.3 3.2 3.4 2.8 3.1Dividend payout ratio(7) (%) 42.1 43.7 38.7 41.1 43.1 41.6 32.4 37.0Market capitalization ($ billions) 42.6 41.5 39.7 39.4 39.9 36.9 35.5 34.1Book value per common share(3) ($) 15.64 15.68 15.44 14.95 14.56 14.86 14.73 14.05Market value to book value multiple 2.7 2.7 2.6 2.6 2.7 2.5 2.4 2.4Price to earnings multiple (trailing 4 quarters) 13.5 13.6 13.2 13.3 13.8 13.0 13.0 13.5
(1) Comparative amounts have been retroactively restated for new CICA accounting requirements relating to the distinction between equity and liability instruments.(2) Taxable equivalent basis. Refer to the non-GAAP measures on page 33.(3) Amounts have been retroactively adjusted to reflect the stock dividend paid April 28, 2004, of one common share for each issued and outstanding common share. The stock dividend
had the same effect as a two-for-one stock split.(4) Represents common shareholders’ equity and non-controlling interest in the common equity of operating subsidiaries, less goodwill and intangible assets, as a percentage of risk-
weighted assets.(5) Net impaired loans are impaired loans less the specific allowance for credit losses.(6) Includes 1.4 million shares held by the Bank’s broker-dealer subsidiary.(7) Represents common dividends for the period as a percentage of the net income available to common shareholders for the period.

MANAGEMENT’S DISCUSSION AND ANALYSIS
8 4 S c o t i a b a n k 2 0 0 5 A n n u a l R e p o r t
Eleven-year Statistical ReviewConsolidated Balance SheetAs at October 31 ($ millions) 2005 2004 2003 2002
AssetsCash resources $ 20,505 $ 17,155 $ 20,581 $ 20,273SecuritiesInvestment 23,452 15,717 20,293 21,602Trading 50,007 43,056 42,899 34,592
73,459 58,773 63,192 56,194LoansResidential mortgages 75,520 69,018 61,646 56,295Personal and credit cards 34,695 30,182 26,277 23,363Business and government 62,681 57,384 64,313 77,181Securities purchased under resale agreements 20,578 17,880 22,648 32,262
193,474 174,464 174,884 189,101Allowance for credit losses 2,469 2,696 3,217 3,430
191,005 171,768 171,667 185,671OtherCustomers’ liability under acceptances 7,576 7,086 6,811 8,399Trading derivatives’ market valuation 11,622 14,198 15,308 15,821Land, buildings and equipment 1,934 1,872 1,944 2,101Other assets 7,924 8,360 6,389 7,921
29,056 31,516 30,452 34,242$ 314,025 $ 279,212 $ 285,892 $ 296,380
Liabilities and shareholders’ equityDepositsPersonal $ 83,953 $ 79,020 $ 76,431 $ 75,558Business and government 109,389 94,125 93,541 93,830Banks 24,103 22,051 22,700 26,230
217,445 195,196 192,672 195,618OtherAcceptances 7,576 7,086 6,811 8,399Obligations related to securities sold under
repurchase agreements 26,032 19,428 28,686 31,881Obligations related to securities sold short 11,250 7,585 9,219 8,737Trading derivatives’ market valuation 11,193 14,054 14,758 15,500Other liabilities 20,794 15,733 14,145 15,678Non-controlling interest in subsidiaries(2) 306 280 326 662
77,151 64,166 73,945 80,857
Subordinated debentures 2,597 2,615 2,661 3,878Capital instrument liabilities(2) 750 2,250 2,500 2,225Shareholders’ equityCapital stock
Preferred shares(2) 600 300 300 300Common shares and contributed surplus 3,317 3,229 3,141 3,002
Retained earnings and cumulative foreigncurrency translation 12,165 11,456 10,673 10,500
16,082 14,985 14,114 13,802$ 314,025 $ 279,212 $ 285,892 $ 296,380
(1) Pre-1996 comparative amounts have not been restated to reflect the reporting of trading derivatives’ market valuation on a gross basis, as they were not reasonably determinable.(2) Comparative amounts have been retroactively restated for new CICA accounting requirements relating to the distinction between equity and liability instruments.

SUPPLEMENTARY DATA
S c o t i a b a n k 2 0 0 5 A n n u a l R e p o r t 8 5
2001 2000 1999 1998 1997 1996 1995(1)
$ 20,160 $ 18,744 $ 17,115 $ 22,900 $ 18,174 $ 14,737 $ 16,728
25,450 19,565 20,030 17,392 17,091 15,835 13,82027,834 21,821 13,939 12,108 10,908 10,070 8,15453,284 41,386 33,969 29,500 27,999 25,905 21,974
52,592 50,037 47,916 45,884 41,727 30,683 28,62020,116 17,988 16,748 18,801 17,764 16,801 15,34379,460 78,172 69,873 76,542 59,353 50,408 47,74127,500 23,559 13,921 11,189 8,520 9,112 8,378
179,668 169,756 148,458 152,416 127,364 107,004 100,0824,236 2,853 2,599 1,934 1,625 1,568 2,295
175,432 166,903 145,859 150,482 125,739 105,436 97,787
9,301 8,807 9,163 8,888 7,575 5,945 5,56315,886 8,244 8,039 13,675 8,925 8,978 –2,325 1,631 1,681 1,759 1,716 1,523 1,4858,037 7,456 6,865 6,384 5,025 2,777 3,652
35,549 26,138 25,748 30,706 23,241 19,223 10,700$ 284,425 $ 253,171 $ 222,691 $ 233,588 $ 195,153 $ 165,301 $ 147,189
$ 75,573 $ 68,972 $ 65,715 $ 62,656 $ 59,239 $ 47,768 $ 45,53880,810 76,980 64,070 70,779 56,928 44,981 41,74729,812 27,948 26,833 32,925 22,808 25,145 24,060
186,195 173,900 156,618 166,360 138,975 117,894 111,345
9,301 8,807 9,163 8,888 7,575 5,945 5,563
30,627 23,792 16,781 14,603 11,559 7,894 7,3546,442 4,297 2,833 3,121 3,739 6,509 5,416
15,453 8,715 8,651 14,360 8,872 8,571 –15,369 14,586 11,667 9,787 9,731 7,387 6,809
586 229 198 173 137 101 13377,778 60,426 49,293 50,932 41,613 36,407 25,275
5,344 5,370 5,374 5,482 5,167 3,251 3,2491,975 1,975 1,475 1,475 1,468 1,325 1,225
300 300 300 300 – – 3502,920 2,765 2,678 2,625 2,567 2,161 1,994
9,913 8,435 6,953 6,414 5,363 4,263 3,75113,133 11,500 9,931 9,339 7,930 6,424 6,095
$ 284,425 $ 253,171 $ 222,691 $ 233,588 $ 195,153 $ 165,301 $ 147,189

MANAGEMENT’S DISCUSSION AND ANALYSIS
8 6 S c o t i a b a n k 2 0 0 5 A n n u a l R e p o r t
Consolidated Statement of IncomeFor the year ended October 31($ millions) 2005 2004 2003 2002
Interest incomeLoans $ 10,053 $ 9,074 $ 9,945 $ 10,708Securities 3,104 2,662 2,859 3,087Deposits with banks 646 441 442 573
13,803 12,177 13,246 14,368
Interest expenseDeposits 5,755 4,790 5,222 5,519Subordinated debentures 134 112 139 203Capital instrument liabilities(2) 53 164 182 158Other 1,990 1,410 1,735 1,971
7,932 6,476 7,278 7,851Net interest income(2) 5,871 5,701 5,968 6,517Provision for credit losses 230 390 893 2,029Net interest income after provision for credit losses(2) 5,641 5,311 5,075 4,488Other income 4,529 4,320 4,015 3,942Net interest and other income(2) 10,170 9,631 9,090 8,430
Non-interest expensesSalaries and employee benefits 3,488 3,452 3,361 3,344Other(3) 2,555 2,410 2,370 2,630Restructuring provisions following acquisitions – – – –
6,043 5,862 5,731 5,974Income before the undernoted(2) 4,127 3,769 3,359 2,456Provision for income taxes(2) 847 786 777 594Non-controlling interest in net income of subsidiaries(2) 71 75 160 154Net income(2) $ 3,209 $ 2,908 $ 2,422 $ 1,708Preferred dividends paid and other(2) 25 16 16 16Net income available to common shareholders $ 3,184 $ 2,892 $ 2,406 $ 1,692Average number of common shares outstanding (millions)(4):
Basic 998 1,010 1,010 1,009Diluted 1,012 1,026 1,026 1,026
Earnings per common share (in dollars)(4):Basic $ 3.19 $ 2.87 $ 2.38 $ 1.68Diluted $ 3.15 $ 2.82 $ 2.34 $ 1.65
Dividends per common share (in dollars)(4) $ 1.32 $ 1.10 $ 0.84 $ 0.73
(1) These financial results were prepared in accordance with Canadian GAAP, including the accounting requirements of the Superintendent of Financial Institutions, other than recordingthe increase in the general provision for credit losses as a direct charge to retained earnings in the fourth quarter of 1999, which was in accordance with the accounting requirementsspecified by the Superintendent under the Bank Act. Had the one-time increase in the general provision of $550 before tax ($314 after-tax) been recorded as a charge to theConsolidated Statement of Income, these financial results would have been as follows: provision for credit losses $1,185, net income $1,145, basic earnings per share $1.14 anddiluted earnings per share $1.13.
(2) Comparative amounts have been retroactively restated for new CICA accounting requirements relating to the distinction between equity and liability instruments.(3) Other non-interest expenses include (a) in 2003 and 2002, a loss on disposal of subsidiary operations of $31 and $237, respectively, (b) in 1997, a $26 writeoff of goodwill, and (c) in
1994, a $162 write off of goodwill.(4) Amounts have been retroactively adjusted to reflect the one-for-one stock dividend paid April 28, 2004, and the two-for-one stock split on February 12, 1998.

SUPPLEMENTARY DATA
S c o t i a b a n k 2 0 0 5 A n n u a l R e p o r t 8 7
2001 2000 1999(1) 1998 1997 1996 1995
$ 13,049 $ 12,129 $ 10,654 $ 10,269 $ 8,082 $ 7,881 $ 8,0073,062 2,286 1,874 1,815 1,636 1,757 1,991
872 916 943 1,007 770 740 59716,983 15,331 13,471 13,091 10,488 10,378 10,595
8,233 8,192 7,284 7,303 5,714 5,969 6,166303 324 314 354 260 214 209136 120 99 99 98 95 72
2,247 1,616 1,201 1,057 797 841 1,04610,919 10,252 8,898 8,813 6,869 7,119 7,4936,064 5,079 4,573 4,278 3,619 3,259 3,1021,425 765 635 595 35 380 5604,639 4,314 3,938 3,683 3,584 2,879 2,5424,071 3,665 3,183 2,858 2,683 2,008 1,4988,710 7,979 7,121 6,541 6,267 4,887 4,040
3,220 2,944 2,627 2,501 2,202 1,910 1,6522,442 2,209 2,149 1,945 1,607 1,327 1,192
– (34) (20) – 250 (20) –5,662 5,119 4,756 4,446 4,059 3,217 2,8443,048 2,860 2,365 2,095 2,208 1,670 1,196
869 983 860 755 758 665 371102 43 46 38 34 31 21
$ 2,077 $ 1,834 $ 1,459 $ 1,302 $ 1,416 $ 974 $ 80416 16 16 5 1 18 32
$ 2,061 $ 1,818 $ 1,443 $ 1,297 $ 1,415 $ 956 $ 772
1,001 991 986 982 958 937 9141,018 1,003 996 993 966 939 915
$ 2.06 $ 1.83 $ 1.46 $ 1.32 $ 1.48 $ 1.02 $ 0.84$ 2.02 $ 1.81 $ 1.45 $ 1.31 $ 1.46 $ 1.02 $ 0.84$ 0.62 $ 0.50 $ 0.44 $ 0.40 $ 0.37 $ 0.33 $ 0.31

MANAGEMENT’S DISCUSSION AND ANALYSIS
8 8 S c o t i a b a n k 2 0 0 5 A n n u a l R e p o r t
Consolidated Statement of Changes in Shareholders’ Equity
For the year ended October 31 ($ millions) 2005 2004 2003 2002
Preferred sharesBalance at beginning of year(1) $ 300 $ 300 $ 300 $ 300Issued(1) 300 – – –Redeemed(1) – – – –Balance at end of year(1) 600 300 300 300Common shares and contributed surplusBalance of common shares at beginning of year 3,228 3,140 3,002 2,920Issued 172 117 163 101Purchased for cancellation (84) (29) (25) (19)Balance of common shares at end of year 3,316 3,228 3,140 3,002Contributed surplus: Fair value of stock options 1 1 1 –Total 3,317 3,229 3,141 3,002Retained earnings and cumulative foreign currency translationBalance at beginning of year 11,456 10,673 10,500 9,913Adjustments – – – (76)(2)
Net income(1) 3,209 2,908 2,422 1,708Dividends: Preferred(1) (25) (16) (16) (16)
Common (1,317) (1,110) (849) (732)Net unrealized foreign exchange translation gains/(losses) (178) (709) (1,176) (137)Purchase of shares and premium on redemption(1) (973) (290) (201) (154)Other (7) – (7) (6)Balance at end of year 12,165 11,456 10,673 10,500Total shareholders’ equity at end of year(1) $ 16,082 $ 14,985 $ 14,114 $ 13,802
Other statistics(6)
Operating performanceBasic earnings per share ($)(7) 3.19 2.87 2.38 1.68Diluted earnings per share ($)(7) 3.15 2.82 2.34 1.65Return on equity (%) 20.9 19.9 17.6 13.0Productivity ratio(1) (%)(TEB) 56.3 56.9 55.9 55.7Return on assets(1) (%) 1.04 1.02 0.84 0.58Net interest margin on total average assets(1) (%)(TEB) 2.00 2.10 2.16 2.29Capital measuresTier 1 capital ratio (%) 11.1 11.5 10.8 9.9Total capital ratio (%) 13.2 13.9 13.2 12.7Assets to capital ratio(8) 15.1 13.8 14.4 14.5Common equity to risk-weighted assets (%) 9.7 9.9 9.2 8.6Tangible common equity to risk-weighted assets (%) 9.3 9.7 8.9 8.3Common share informationShare price ($):(7)
High 44.22 40.00 33.70 28.10Low 36.41 31.08 22.28 21.01Close 42.99 39.60 32.74 22.94
Number of shares outstanding (millions)(7) 990 1,009 1,011 1,008Dividends per share ($)(7) 1.32 1.10 0.84 0.73Dividend payout (%)(9) 41.4 38.4 35.3 43.2Dividend yield (%)(10) 3.3 3.1 3.0 3.0Price to earnings multiple(11) 13.5 13.8 13.8 13.7Book value per common share ($)(7) 15.64 14.56 13.67 13.39Other informationAverage total assets ($ millions) 309,374 283,986 288,513 296,852Number of branches and offices 1,959 1,871 1,850 1,847Number of employees(12) 46,631 43,928 43,986 44,633Number of automated banking machines 4,449 4,219 3,918 3,693
(1) Comparative amounts have been retroactively restated for new CICA accounting requirements relating to the distinction between equity and liability instruments.(2) Cumulative effect of adoption of new goodwill accounting standard.(3) Cumulative effect of adoption of new corporate income taxes accounting standard.(4) If the increase in the general provision had been charged to income (refer to footnote 1 on the previous page), these 1999 financial ratios would have been: return on equity 12.0%,
return on assets 0.50%, basic earnings per share $1.14, diluted earnings per share $1.13, dividend payout 38.0% and price earnings multiple 14.3.(5) In accordance with the guidelines issued by the Superintendent, the Bank adopted new impaired loans accounting principles established by the CICA.(6) Pre-1996 comparative amounts have not been restated to reflect the reporting of trading derivatives’ market valuation on a gross basis, as they were not reasonably determinable.

SUPPLEMENTARY DATA
S c o t i a b a n k 2 0 0 5 A n n u a l R e p o r t 8 9
2001 2000 1999 1998 1997 1996 1995
$ 300 $ 300 $ 300 $ – $ – $ 350 $ 550– – – 300 – – –– – – – – (350) (200)
300 300 300 300 – – 350
2,765 2,678 2,625 2,567 2,161 1,994 1,839155 87 53 58 406 167 155
– – – – – – –2,920 2,765 2,678 2,625 2,567 2,161 1,994
– – – – – – –2,920 2,765 2,678 2,625 2,567 2,161 1,994
8,435 6,953 6,414 5,363 4,263 3,751 3,302(39)(3) – (314)(4) – – (116)(5) –
2,077 1,834 1,459 1,302 1,416 974 804(16) (16) (16) (5) (1) (18) (32)
(621) (496) (429) (393) (355) (305) (283)79 163 (160) 152 43 (19) (15)
– – – – – – –(2) (3) (1) (5) (3) (4) (25)
9,913 8,435 6,953 6,414 5,363 4,263 3,751$ 13,133 $ 11,500 $ 9,931 $ 9,339 $ 7,930 $ 6,424 $ 6,095
2.06 1.83 1.46)(4) 1.32 1.48 1.02 0.842.02 1.81 1.45)(4) 1.31 1.46 1.02 0.8417.3 17.6 15.3)(4) 15.3 20.2 15.8 14.254.6 57.3 60.1 61.2 63.4 59.9 60.90.76 0.77 0.64)(4) 0.61 0.79 0.61 0.582.32 2.21 2.07 2.06 2.08 2.12 2.30
9.3 8.6 8.1 7.2 6.9 6.7 6.713.0 12.2 11.9 10.6 10.4 8.9 9.613.5 13.7 13.5 14.9 14.2 16.4 15.28.1 7.3 6.9 6.0 5.8 5.5 5.47.8 7.0 6.7 5.7 5.6 5.5 5.4
25.25 22.83 18.45 22.35 17.05 10.60 7.5718.65 13.03 14.30 11.40 10.28 7.10 6.0721.93 21.75 16.80 16.10 15.54 10.57 7.221,008 996 989 984 980 950 9290.62 0.50 0.44 0.40 0.37 0.33 0.3130.1 27.3 29.7)(4) 30.3 25.1 31.9 36.72.8 2.8 2.7 2.4 2.7 3.7 4.6
10.6 11.9 11.5)(4) 12.2 10.5 10.4 8.512.74 11.25 9.74 9.18 8.09 6.76 6.18
271,843 238,664 229,037 213,973 179,176 158,803 137,9882,005 1,695 1,654 1,741 1,658 1,464 1,460
46,804 40,946 40,894 42,046 38,648 34,592 33,7173,761 2,669 2,322 2,244 2,030 1,526 1,429
(7) Amounts have been retroactively adjusted to reflect the one-for-one stock dividend paid April 28, 2004, and the two-for-one stock split on February 12, 1998.(8) Based on guidelines issued by the Superintendent, the Bank’s assets to capital ratio is calculated by dividing adjusted total assets by total regulatory capital.(9) Dividend payments as a percentage of net income available to common shareholders.(10) Based on the average of the high and low common share price for the year.(11) Based on the closing common share price.(12) Includes all personnel (part-time stated on a full-time equivalent basis) of the Bank and all its subsidiaries.

GLOSSARY
9 0 S c o t i a b a n k 2 0 0 5 A n n u a l R e p o r t
ALLOWANCE FOR CREDIT LOSSES: An allowance set aside which, in management’sopinion, is adequate to absorb all credit-related losses from on and off-balancesheet items. It includes specific, country risk and general allowances.ASSETS UNDER ADMINISTRATION AND MANAGEMENT: Assets owned by customers, forwhich the Bank provides management and custodial services. These assets are notreported on the Bank’s consolidated balance sheet.BANKERS’ ACCEPTANCES (BAs): Negotiable, short-term debt securities, guaranteed fora fee by the issuer’s bank.BASIS POINT: A unit of measure defined as one-hundredth of one per cent.CAPITAL: Consists of common shareholders’ equity, preferred shareholders’ equityand subordinated debentures. It can support asset growth, provide against loanlosses and protect depositors.CAPITAL INSTRUMENT LIABILITY: A financial instrument, normally qualifying as Tier 1capital, that has the potential for being settled for a variable number of the Bank’sown equity instruments.COUNTRY RISK ALLOWANCE: Funds set aside initially in 1987-89 to cover potentiallosses on exposure to a designated group of emerging market countries deter-mined by OSFI.DERIVATIVE PRODUCTS: Financial contracts whose value is derived from an underly-ing price, interest rate, exchange rate or price index. Forwards, options and swapsare all derivative instruments.DESIGNATED EMERGING MARKETS (DEM): Countries against whose loans and securitiesOSFI has required banks to set aside a country risk allowance.FOREIGN CURRENCY TRANSLATION GAIN/LOSS: The unrealized gain or loss recordedwhen foreign currency assets and liabilities are translated into Canadian dollars ata balance sheet date, when exchange rates differ from those of the previous bal-ance sheet date.FOREIGN EXCHANGE CONTRACTS: Commitments to buy or sell a specified amount offoreign currency on a set date and at a predetermined rate of exchange.FORWARD RATE AGREEMENT (FRA): A contract between two parties, whereby a desig-nated interest rate, applied to a notional principal amount, is locked in for a spec-ified period of time. The difference between the contracted rate and prevailing mar-ket rate is paid in cash on the settlement date. These agreements are used to pro-tect against, or take advantage of, future interest rate movements.FUTURES: Commitments to buy or sell designated amounts of commodities, securi-ties or currencies on a specified date at a predetermined price. Futures are tradedon recognized exchanges. Gains and losses on these contracts are settled daily,based on closing market prices.GENERAL ALLOWANCE: Established by the Bank to recognize credit losses which haveoccurred as at the balance sheet date, but have not yet been specifically identifiedon an individual item-by-item basis.HEDGING: Protecting against price, interest rate or foreign exchange exposures bytaking positions that are expected to react to market conditions in an offsettingmanner.IMPAIRED LOANS: Loans on which the Bank no longer has reasonable assurance asto the timely collection of interest and principal, or where a contractual payment ispast due a prescribed period. Interest is not accrued on impaired loans.MARKED-TO-MARKET: The valuation of securities and off-balance sheet instruments,such as interest and exchange rate contracts, held for trading purposes, at marketprices as of the balance sheet date. The difference between market and bookvalue is recorded as a gain or loss to income.MIDDLE OFFICE: The independent middle office plays a key role in risk managementand measurement. It reviews trading models and valuations; develops and per-forms stress tests, sensitivity analysis and VAR calculations; reviews profit and lossperformance; and participates in new product development.NET INTEREST MARGIN: Net interest income, on a taxable equivalent basis, expressedas a percentage of average total assets.NOTIONAL PRINCIPAL AMOUNTS: The contract or principal amounts used to determinepayments for certain off-balance sheet instruments, such as FRAs, interest rateswaps and cross-currency swaps. The amounts are termed “notional” becausethey are not usually exchanged themselves, serving only as the basis for calculat-ing amounts that do change hands.
OFF-BALANCE SHEET INSTRUMENTS: These are indirect credit commitments, includingundrawn commitments to extend credit and derivative instruments.OPTIONS: Contracts between buyer and seller giving the buyer of the option theright, but not the obligation, to buy (call), or sell (put) a specified commodity,financial instrument or currency at a set price or rate on or before a specifiedfuture date.OSFI: The Office of the Superintendent of Financial Institutions Canada, the regu-lator of Canadian banks.PRODUCTIVITY RATIO: Measures the efficiency with which the Bank incurs expenses togenerate revenue. It expresses non-interest expenses as a percentage of the sumof net interest income on a taxable equivalent basis and other income. A lowerratio indicates improved productivity.REPOS: Repos is short for “obligations related to assets sold under repurchaseagreements” – a short-term transaction where the Bank sells assets, normally gov-ernment bonds, to a client and simultaneously agrees to repurchase them on aspecified date and at a specified price. It is a form of short-term funding.RETURN ON EQUITY (ROE): Net income available to common shareholders, expressedas a percentage of average common shareholders’ equity.REVERSE REPOS: Short for “assets purchased under resale agreements” – a short-term transaction where the Bank purchases assets, normally government bonds,from a client and simultaneously agrees to resell them on a specified date and ata specified price. It is a form of short-term collateralized lending.RISK-WEIGHTED ASSETS: Calculated using weights based on the degree of credit riskfor each class of counterparty. Off-balance sheet instruments are converted to bal-ance sheet equivalents, using specified conversion factors, before the appropriaterisk weights are applied.SECURITIZATION: The process by which financial assets (typically loans) are trans-ferred to a trust, which normally issues a series of different classes of asset-backedsecurities to investors to fund the purchase of loans. The Bank normally accountsfor these transfers as a sale, provided certain conditions are met, and according-ly, the loans are removed from the consolidated balance sheet.STANDBY LETTERS OF CREDIT AND LETTERS OF GUARANTEE: Assurances given by the Bankthat it will make payments on behalf of clients to third parties. The Bank hasrecourse against its clients for any such advanced funds.SWAPS: Interest rate swaps are agreements to exchange streams of interest pay-ments, typically one at a floating rate, the other at a fixed rate, over a specifiedperiod of time, based on notional principal amounts. Cross-currency swaps areagreements to exchange payments in different currencies over predeterminedperiods of time.TAXABLE EQUIVALENT BASIS (TEB): The grossing up of tax-exempt income earned oncertain securities to an equivalent before-tax basis. This ensures uniform meas-urement and comparison of net interest income arising from both taxable and tax-exempt sources.TIER 1, TOTAL CAPITAL AND TANGIBLE COMMON EQUITY RATIOS: These are ratios of capitalto risk-weighted assets, as stipulated by OSFI, based on guidelines developedunder the auspices of the Bank for International Settlements (BIS). Tier 1 capital,the more permanent, consists primarily of common shareholders’ equity, non-con-trolling interest in subsidiaries plus non-cumulative preferred shares, less unamor-tized goodwill and ineligible intangible assets. Tier 2 capital consists mainly ofsubordinated debentures and the eligible general allowance. Together, Tier 1 andTier 2 capital less certain deductions comprise total regulatory capital. Tangible com-mon equity is comprised of common shareholders’ equity, less goodwill and intan-gible assets.VALUE AT RISK (VAR): VAR is an estimate of the potential loss of value that mightresult from holding a position for a specified period of time, with a given level ofstatistical confidence.VARIABLE INTEREST ENTITY: An entity where its equity at risk is insufficient to permitthe financing of its activities on a stand-alone basis or where its equity investors,as a group, lack certain essential characteristics of a controlling financial interest.

CONSOLIDATED FINANCIAL STATEMENTS
S c o t i a b a n k 2 0 0 5 A n n u a l R e p o r t 9 1
2005 Consolidated Financial Statements
92 Management’s Responsibility for Financial Information
92 Shareholders’ Auditors’ Report
93 Consolidated Balance Sheet
94 Consolidated Statement of Income
95 Consolidated Statement of Changes in Shareholders’ Equity
96 Consolidated Statement of Cash Flows
97 Notes to the Consolidated Financial Statements
Table of Contents
S c o t i a b a n k 2 0 0 5 A n n u a l R e p o r t 9 1

The management of The Bank of Nova Scotia (the Bank) is respon-sible for the integrity and fair presentation of the financial informa-tion contained in this Annual Report. The consolidated financialstatements have been prepared in accordance with Canadiangenerally accepted accounting principles. The consolidated financialstatements also comply with the accounting requirements of theBank Act.
The consolidated financial statements, where necessary, includeamounts which are based on the best estimates and judgement ofmanagement. Financial information presented elsewhere in thisAnnual Report is consistent with that shown in the consolidatedfinancial statements.
Management has always recognized the importance of the Bankmaintaining and reinforcing the highest possible standards ofconduct in all of its actions, including the preparation and dissemi-nation of statements fairly presenting the financial condition of theBank. In this regard, management has developed and maintains asystem of accounting and reporting which provides for the neces-sary internal controls to ensure that transactions are properlyauthorized and recorded, assets are safeguarded against unautho-rized use or disposition, and liabilities are recognized. The system isaugmented by written policies and procedures, the careful selectionand training of qualified staff, the establishment of organizationalstructures providing an appropriate and well-defined division ofresponsibilities, and the communication of policies and guidelines ofbusiness conduct throughout the Bank.
The system of internal controls is further supported by a profes-sional staff of internal auditors who conduct periodic audits of allaspects of the Bank’s operations. As well, the Bank’s Chief Auditorhas full and free access to, and meets periodically with, the Auditand Conduct Review Committee of the Board of Directors. In
addition, the Bank’s compliance function maintains policies, proce-dures and programs directed at ensuring compliance with regulatoryrequirements, including conflict of interest rules.
The Office of the Superintendent of Financial Institutions,Canada, which is mandated to protect the rights and interests ofthe depositors and creditors of the Bank, examines and enquiresinto the business and affairs of the Bank, as deemed necessary, todetermine whether the provisions of the Bank Act are beingcomplied with, and that the Bank is in a sound financial condition.
The Audit and Conduct Review Committee, composed entirelyof outside directors, reviews the consolidated financial statementswith both management and the independent auditors before suchstatements are approved by the Board of Directors and submitted tothe shareholders of the Bank.
The Audit and Conduct Review Committee reviews and reportstheir findings to the Board of Directors on all related party transac-tions that may have a material impact on the Bank.
KPMG LLP and PricewaterhouseCoopers LLP, the independentauditors appointed by the shareholders of the Bank, have auditedthe consolidated financial statements of the Bank in accordance withCanadian generally accepted auditing standards and have expressedtheir opinion upon completion of such audit in the following reportto the shareholders. In order to provide their opinion on theseconsolidated financial statements, the Shareholders’ Auditors reviewselected aspects of the system of internal controls and conduct theirwork to the extent that they consider appropriate. The Shareholders’Auditors have full and free access to, and meet periodically with, theAudit and Conduct Review Committee to discuss their audit,including any findings as to the integrity of the Bank’s accounting,financial reporting and related matters.
CONSOLIDATED FINANCIAL STATEMENTS
9 2 S c o t i a b a n k 2 0 0 5 A n n u a l R e p o r t
Management’s Responsibility for Financial Information
Rick WaughPresident and Chief Executive Officer
Toronto, November 29, 2005
Luc A. VannesteExecutive Vice-Presidentand Chief Financial Officer
KPMG LLPChartered Accountants
PricewaterhouseCoopers LLPChartered Accountants Toronto, November 29, 2005
To the Shareholders of The Bank of Nova ScotiaWe have audited the Consolidated Balance Sheets of The Bank ofNova Scotia as at October 31, 2005 and 2004, and the Consoli-dated Statements of Income, Changes in Shareholders’ Equity andCash Flows for each of the years in the three-year period endedOctober 31, 2005. These financial statements are the responsibilityof the Bank’s management. Our responsibility is to express anopinion on these financial statements based on our audits.
We conducted our audits in accordance with Canadian gener-ally accepted auditing standards. Those standards require that weplan and perform an audit to obtain reasonable assurance whetherthe financial statements are free of material misstatement. An audit
includes examining, on a test basis, evidence supporting theamounts and disclosures in the financial statements. An audit alsoincludes assessing the accounting principles used and significantestimates made by management, as well as evaluating the overallfinancial statement presentation.
In our opinion, these consolidated financial statements presentfairly, in all material respects, the financial position of the Bank as atOctober 31, 2005 and 2004, and the results of its operations andits cash flows for each of the years in the three-year period endedOctober 31, 2005 in accordance with Canadian generally acceptedaccounting principles.
Shareholders’ Auditors’ Report

Consolidated Balance SheetAs at October 31 ($ millions) 2005 2004(1)
AssetsCash resourcesCash and non-interest-bearing deposits with banks $ 2,501 $ 1,921Interest-bearing deposits with banks 15,182 12,932Precious metals 2,822 2,302
20,505 17,155Securities (Note 3)Investment 23,452 15,717Trading 50,007 43,056
73,459 58,773Loans (Note 4)Residential mortgages 75,520 69,018Personal and credit cards 34,695 30,182Business and government 62,681 57,384Securities purchased under resale agreements 20,578 17,880
193,474 174,464Allowance for credit losses (Note 5 (b)) 2,469 2,696
191,005 171,768OtherCustomers’ liability under acceptances 7,576 7,086Trading derivatives’ market valuation (Note 23 (d)) 11,622 14,198Land, buildings and equipment (Note 7) 1,934 1,872Goodwill (Note 8) 498 261Other intangible assets (Note 8) 235 240Other assets (Note 9) 7,191 7,859
29,056 31,516$ 314,025 $ 279,212
Liabilities and shareholders’ equityDeposits (Note 10)Personal $ 83,953 $ 79,020Business and government 109,389 94,125Banks 24,103 22,051
217,445 195,196OtherAcceptances 7,576 7,086Obligations related to securities sold under repurchase agreements 26,032 19,428Obligations related to securities sold short 11,250 7,585Trading derivatives’ market valuation (Note 23 (d)) 11,193 14,054Other liabilities (Note 11) 20,794 15,733Non-controlling interest in subsidiaries 306 280
77,151 64,166Subordinated debentures (Note 12) 2,597 2,615Capital instrument liabilities (Note 13) 750 2,250
Shareholders’ equityCapital stock (Note 14)
Preferred shares 600 300Common shares and contributed surplus 3,317 3,229
Retained earnings 14,126 13,239Cumulative foreign currency translation (1,961) (1,783)
16,082 14,985$ 314,025 $ 279,212
Arthur R.A. Scace Rick WaughChairman of the Board President and Chief Executive Officer
(1) Certain comparative amounts have been retroactively restated for new CICA accounting requirements relating to the distinction between equity and liability instruments.
The accompanying notes are an integral part of these consolidated financial statements.
CONSOLIDATED FINANCIAL STATEMENTS
S c o t i a b a n k 2 0 0 5 A n n u a l R e p o r t 9 3

CONSOLIDATED FINANCIAL STATEMENTS
9 4 S c o t i a b a n k 2 0 0 5 A n n u a l R e p o r t
Consolidated Statement of IncomeFor the year ended October 31 ($ millions) 2005 2004(1) 2003(1)
Interest incomeLoans $ 10,053 $ 9,074 $ 9,945Securities 3,104 2,662 2,859Deposits with banks 646 441 442
13,803 12,177 13,246Interest expenseDeposits 5,755 4,790 5,222Subordinated debentures 134 112 139Capital instrument liabilities 53 164 182Other 1,990 1,410 1,735
7,932 6,476 7,278Net interest income 5,871 5,701 5,968Provision for credit losses (Note 5 (b)) 230 390 893Net interest income after provision for credit losses 5,641 5,311 5,075
Other incomeCard revenues 251 231 204Deposit and payment services 701 646 593Mutual funds 193 171 161Investment management, brokerage and trust services 600 504 455Credit fees 542 583 684Trading revenues 594 476 501Investment banking 680 648 673Net gain on investment securities (Note 3) 414 477 159Securitization revenues 79 111 140Other 475 473 445
4,529 4,320 4,015Net interest and other income 10,170 9,631 9,090
Non-interest expensesSalaries and employee benefits 3,488 3,452 3,361Premises and technology 1,148 1,139 1,156Communications 255 248 251Advertising and business development 232 210 199Professional 186 163 141Business and capital taxes 147 142 144Other 587 508 479
6,043 5,862 5,731Income before the undernoted 4,127 3,769 3,359Provision for income taxes (Note 16) 847 786 777Non-controlling interest in net income of subsidiaries 71 75 160Net income $ 3,209 $ 2,908 $ 2,422Preferred dividends paid 25 16 16Net income available to common shareholders $ 3,184 $ 2,892 $ 2,406
Average number of common shares outstanding (millions)(2) (Note 18):Basic 998 1,010 1,010Diluted 1,012 1,026 1,026
Earnings per common share (in dollars)(2)(3) (Note 18):Basic $ 3.19 $ 2.87 $ 2.38Diluted $ 3.15 $ 2.82 $ 2.34
Dividends per common share (in dollars)(2) $ 1.32 $ 1.10 $ 0.84
(1) Certain comparative amounts have been retroactively restated for new CICA accounting requirements relating to the distinction between equity and liability instruments.(2) Amounts have been retroactively adjusted to reflect the stock dividend paid April 28, 2004, of one common share for each issued and outstanding common share.
The stock dividend had the same effect as a two-for-one stock split.(3) The calculation of earnings per share is based on full dollar and share amounts.
The accompanying notes are an integral part of these consolidated financial statements.

Consolidated Statement of Changes in Shareholders’ EquityFor the year ended October 31 ($ millions) 2005 2004(1) 2003(1)
Preferred shares (Note 14)Balance at beginning of year $ 300 $ 300 $ 300Issued 300 – –Balance at end of year 600 300 300
Common shares and contributed surplusCommon shares (Note 14):
Balance at beginning of year 3,228 3,140 3,002Issued 172 117 163Purchased for cancellation (84) (29) (25)Balance at end of year 3,316 3,228 3,140
Contributed surplus: Fair value of stock options (Note 15) 1 1 1Total 3,317 3,229 3,141
Retained earningsBalance at beginning of year 13,239 11,747 10,398Net income 3,209 2,908 2,422Dividends: Preferred (25) (16) (16)
Common (1,317) (1,110) (849)Purchase of shares (973) (290) (201)Other (7) – (7)Balance at end of year 14,126 13,239 11,747
Cumulative foreign currency translationBalance at beginning of year (1,783) (1,074) 102Net unrealized foreign exchange translation losses(2) (178) (709) (1,176)Balance at end of year (1,961) (1,783) (1,074)Total shareholders’ equity at end of year $ 16,082 $ 14,985 $ 14,114
(1) Certain comparative amounts have been retroactively restated for new CICA accounting requirements relating to the distinction between equity and liability instruments.(2) Comprises unrealized foreign exchange translation losses on net investments in self-sustaining foreign operations of $(416) (2004 – $(1,085); 2003 – $(2,185)) and gains
from related foreign exchange hedging activities of $238 (2004 – $376; 2003 – $1,009).
The accompanying notes are an integral part of these consolidated financial statements.
CONSOLIDATED FINANCIAL STATEMENTS
S c o t i a b a n k 2 0 0 5 A n n u a l R e p o r t 9 5

Consolidated Statement of Cash FlowsSources and (uses) of cash flowsFor the year ended October 31 ($ millions) 2005 2004(1) 2003(1)
Cash flows from operating activitiesNet income $ 3,209 $ 2,908 $ 2,422Adjustments to net income to determine cash flows:
Depreciation and amortization 202 216 237Provision for credit losses 230 390 893Future income taxes (231) (87) (108)Net gain on investment securities (414) (477) (159)
Net accrued interest receivable and payable (204) (103) 406Trading securities (7,014) (1,514) (10,218)Trading derivatives’ market valuation, net (400) 350 (375)Other, net 1,300 (718) (244)
(3,322) 965 (7,146)Cash flows from financing activitiesDeposits 22,282 8,106 10,941Obligations related to securities sold under repurchase agreements 6,676 (8,011) 722Obligations related to securities sold short 3,693 (1,528) 653Subordinated debentures redemptions/repayments – – (1,059)Capital instrument liabilities issued – – 750Capital instrument liabilities redemptions/repayments – (260) (494)Capital stock issued 416 114 163Capital stock redeemed/purchased for cancellation (1,057) (319) (226)Cash dividends paid (1,342) (1,126) (865)Other, net 806 (230) (1,165)
31,474 (3,254) 9,420Cash flows from investing activitiesInterest-bearing deposits with banks (2,814) 3,483 (2,061)Loans, excluding securitizations (23,910) (7,998) (903)Loan securitizations 2,153 3,514 2,443Investment securities:
Purchases (26,200) (24,471) (26,566)Maturities 12,955 14,742 10,685Sales 10,724 14,384 15,168
Land, buildings and equipment, net of disposals (168) (228) (135)Other, net(2) (276) (59) (449)
(27,536) 3,367 (1,818)Effect of exchange rate changes on cash and cash equivalents (36) (54) (148)Net change in cash and cash equivalents(3) 580 1,024 308Cash and cash equivalents at beginning of year 1,921 897 589Cash and cash equivalents at end of year $ 2,501 $ 1,921 $ 897
Represented by:Cash and non-interest-bearing deposits with banks $ 2,501 $ 1,921 $ 1,373Cheques and other items in transit, net liability(3) – – (476)
Cash and cash equivalents at end of year $ 2,501 $ 1,921 $ 897
Cash disbursements made for:Interest $ 8,142 $ 6,581 $ 7,153Income taxes $ 907 $ 751 $ 414
(1) Certain comparative amounts have been retroactively restated for new CICA accounting requirements relating to the distinction between equity and liability instruments.(2) Comprises investments in subsidiaries which are net of non-cash consideration consisting of common shares issued from treasury of $49 (2004 – nil; 2003 – nil) and
cash and cash equivalents at the date of acquisition of $17 (2004 – nil; 2003 – $38).(3) In the fourth quarter of 2004, the Bank prospectively changed the balance sheet presentation of certain types of cheques and other items in transit. These items are
recorded gross in different asset and liability categories, whereas previously these items were recorded net in cheques and other items in transit in other liabilities in theConsolidated Balance Sheet. This change in balance sheet presentation also resulted in certain types of cheques and other items in transit no longer being classified aspart of cash and cash equivalents and had the effect of increasing the 2004 net change in cash and cash equivalents by $519. These changes resulted from a newCanadian Institute of Chartered Accountants’ standard for financial reporting, which eliminated industry practice as a source of generally accepted accounting principles.
The accompanying notes are an integral part of these consolidated financial statements.
CONSOLIDATED FINANCIAL STATEMENTS
9 6 S c o t i a b a n k 2 0 0 5 A n n u a l R e p o r t

Notes to the Consolidated Financial Statements
Page Note
98 1. Significant accounting policies
102 2. Future accounting changes
103 3. Securities
104 4. Loans
105 5. Impaired loans and allowance for credit losses
106 6. Variable interest entities
107 7. Land, buildings and equipment
107 8. Goodwill and other intangible assets
107 9. Other assets
108 10. Deposits
108 11. Other liabilities
108 12. Subordinated debentures
109 13. Capital instrument liabilities
110 14. Capital stock
111 15. Stock-based compensation
113 16. Corporate income taxes
114 17. Employee future benefits
116 18. Earnings per common share
116 19. Related party transactions
116 20. Segmented results of operations
119 21. Guarantees, commitments and contingent liabilities
121 22. Financial instruments
124 23. Derivative instruments
128 24. Acquisitions
129 25. Reconciliation of Canadian and United States generallyaccepted accounting principles (GAAP)
Table of Contents
S c o t i a b a n k 2 0 0 5 A n n u a l R e p o r t 9 7

1. Significant accounting policies
The consolidated financial statements of The Bank of Nova Scotia (theBank) have been prepared in accordance with Section 308 of theBank Act which states that, except as otherwise specified by theSuperintendent of Financial Institutions Canada (the Superinten-dent), the financial statements are to be prepared in accordancewith Canadian generally accepted accounting principles (GAAP). Thesignificant accounting policies used in the preparation of theseconsolidated financial statements, including the accounting require-ments of the Superintendent, are summarized on the followingpages. These accounting policies conform, in all material respects, toCanadian GAAP. In addition, Note 25 describes and reconciles thesignificant measurement differences between Canadian and U.S.GAAP affecting the accompanying consolidated financial statements.
The preparation of financial statements in conformity with GAAPrequires management to make estimates and assumptions that affectthe reported amount of assets and liabilities at the date of the financialstatements, and income and expenses during the reporting period. Keyareas where management has made difficult, complex or subjectivejudgements, often as a result of matters that are inherently uncertain,include those relating to the allowance for credit losses, the fair valueof financial instruments, corporate income taxes, pensions and otheremployee future benefits, other-than-temporary impairment of invest-ment securities and determination of the primary beneficiary of avariable interest entity (VIE). Actual results could differ from these andother estimates.
Certain comparative amounts have been reclassified to conformwith current year presentation. Where new accounting policies havebeen adopted during the year, the effects of these changes havebeen discussed in the respective notes.
Basis of consolidationThe consolidated financial statements include the assets, liabilities,results of operations and cash flows of the Bank and all of itssubsidiaries after the elimination of intercompany transactions andbalances. Subsidiaries are defined as corporations controlled by theBank, which are normally corporations in which the Bank owns morethan 50% of the voting shares.
Investments where the Bank has significant influence, which isnormally evidenced by direct or indirect ownership of between 20%and 50% of the voting shares, are accounted for using the equitymethod and are included in investment securities in the Consoli-dated Balance Sheet. The Bank’s share of earnings of such corpora-tions is included in interest income – securities in the ConsolidatedStatement of Income.
Change in accounting policy:Effective November 1, 2004, the Bank adopted a new accountingguideline issued by the Canadian Institute of Chartered Accountants(CICA), which requires consolidation of VIEs by the primary benefi-ciary. An entity is a VIE when, by design, one or both of thefollowing conditions exist: (a) total equity investment at risk is insuf-ficient to permit the entity to finance its activities without additionalsubordinated support from others; (b) as a group, the holders of theequity investment at risk lack certain essential characteristics of acontrolling financial interest. The VIE guideline also exempts certainentities from its scope. The primary beneficiary is the enterprise thatabsorbs or receives the majority of the VIE’s expected losses,expected residual returns, or both.
Investments in VIEs where the Bank has significant influence,but where the Bank is not the primary beneficiary, are accounted forusing the equity method.
On adoption of this new accounting guideline, the Bankassessed that it was the primary beneficiary of multi-seller commer-cial paper conduit programs which it administers, and consolidatedthese conduits in its financial statements. As a result, investmentsecurities, personal and credit card loans, and other liabilities on theConsolidated Balance Sheet increased by $5 billion, $3 billion, and$8 billion, respectively. Refer to Note 6 for total asset balances as atOctober 31, 2005.
The Bank also assessed that it is not the primary beneficiary ofScotiabank Capital Trust. As a result, on adoption of this newaccounting guideline, the Bank deconsolidated this entity on aprospective basis, with the effect of reclassifying $1.5 billion of obli-gations to business and government deposit liabilities from capitalinstrument liabilities in the Consolidated Balance Sheet.
There were other structures that the Bank consolidated onadoption of this new accounting guideline. However, the resultingincrease in total assets and liabilities was insignificant. The adoptionof this new accounting guideline did not affect net income availableto common shareholders or earnings per share.
Accounting standard setters continue to deliberate issues associ-ated with the VIE guideline. As these issues are addressed and revi-sions to the accounting guidance are made, the effects of this newguideline, as described above, may change in future.
Translation of foreign currenciesForeign currency monetary assets and liabilities of the Bank’sintegrated foreign operations, and all foreign currency denominatedassets and liabilities of its self-sustaining foreign operations aretranslated into Canadian dollars at rates prevailing at the end of thefinancial period. Foreign currency non-monetary assets and liabilitiesof the Bank’s integrated foreign operations are translated intoCanadian dollars at historical rates.
Unrealized gains and losses arising upon translation of netforeign currency investment positions in self-sustaining branches,subsidiaries and associated corporations, together with any gains orlosses arising from hedges of those net investment positions, arecredited or charged to cumulative foreign currency translation in theConsolidated Balance Sheet, except as noted below. Upon sale,reduction or substantial liquidation of an investment position, thepreviously recorded unrealized gains or losses thereon are trans-ferred from cumulative foreign currency translation in the Consoli-dated Balance Sheet to the Consolidated Statement of Income.
Translation gains and losses arising in the Bank’s integrated foreignoperations, as well as those arising from self-sustaining foreign opera-tions in highly inflationary environments, if any, are included in otherincome-trading revenues in the Consolidated Statement of Income.
Revenues and expenses denominated in foreign currencies aretranslated using average exchange rates, except for depreciationand amortization of foreign currency denominated buildings, equip-ment and leasehold improvements of the Bank’s integrated foreignoperations, which are translated using historical rates.
Precious metalsPrecious metals are carried at market value and are included in cashresources in the Consolidated Balance Sheet. The liability arisingfrom outstanding certificates is also carried at market value andincluded in other liabilities in the Consolidated Balance Sheet.
SecuritiesSecurities are held in either the investment or trading portfolio. Invest-ment securities comprise debt and equity securities held for liquidityand longer-term investment. Equity securities in which the Bank’sholdings of voting shares are less than 20% are carried at cost, except
CONSOLIDATED FINANCIAL STATEMENTS
9 8 S c o t i a b a n k 2 0 0 5 A n n u a l R e p o r t

where significant influence is demonstrated. Debt securities held in theinvestment account are carried at amortized cost with premiums anddiscounts being amortized to interest income – securities over theperiod to maturity. When there has been a decline in value of debt orequity securities that is other than temporary, the carrying value of thesecurities is appropriately reduced. Such reductions, if any, togetherwith gains and losses on disposals, which are determined on anaverage cost basis, are included in other income – net gain oninvestment securities in the Consolidated Statement of Income.
Trading securities are intended to be held for a short period of timeand are carried at market value. Gains and losses on disposal and adjust-ments to market value are included in other income – trading revenuesin the Consolidated Statement of Income. Where securities are used tomanage the volatility of stock-based compensation, gains and losses ondisposal and adjustments to market value are included in salaries andemployee benefits expense in the Consolidated Statement of Income.
Securities purchased under resale agreements and obligationsrelated to securities sold under repurchase agreementsThe purchase and sale of securities under resale and repurchaseagreements are treated as collateralized lending and borrowingtransactions and are recorded at cost. The related interest incomeand interest expense are recorded on an accrual basis.
Obligations related to securities sold shortThe Bank’s obligation to deliver securities sold that were not ownedat the time of sale is recorded at fair value. Realized and unrealizedgains and losses are recorded in other income – trading revenues inthe Consolidated Statement of Income. Interest expense accruing ondebt securities sold short is recorded in interest expense in theConsolidated Statement of Income.
LoansLoans are stated net of any unearned income and of an allowancefor credit losses. Interest income is accounted for on the accrualbasis for all loans other than impaired loans. Accrued interest isincluded in other assets in the Consolidated Balance Sheet.
A loan is classified as impaired when, in management’s opinion,there has been a deterioration in credit quality to the extent that thereis no longer reasonable assurance of timely collection of the fullamount of principal and interest. If a payment on a loan is contractually90 days in arrears, the loan will be classified as impaired, if not alreadyclassified as such, unless the loan is fully secured, the collection of thedebt is in process, and the collection efforts are reasonably expected toresult in repayment of the loan or in restoring it to a current statuswithin 180 days from the date a payment has become contractually inarrears. Finally, a loan that is contractually 180 days in arrears is classi-fied as impaired in all situations, except when it is guaranteed orinsured by the Canadian government, the provinces or a Canadiangovernment agency; such loans are classified as impaired if the loan iscontractually in arrears for 365 days. Any credit card loan that has apayment that is contractually 180 days in arrears is written off.
When a loan is classified as impaired, recognition of interestceases. Interest received on impaired loans is credited to the carryingvalue of the loan.
Loans are generally returned to accrual status when the timelycollection of both principal and interest is reasonably assured and alldelinquent principal and interest payments are brought current.
Foreclosed assets received after April 30, 2003, meeting specifiedcriteria are considered to be held for sale and recorded at fair valueless costs to sell. If the specified criteria are not met, the asset isconsidered to be held for use, measured initially at fair value andaccounted for in the same manner as a similar asset acquired in the
normal course of business. Prior to May 1, 2003, foreclosed assetswere included in impaired loans and presumed to be held for sale.
Loan fees are recognized in interest income over the appropriatelending or commitment period. Mortgage prepayment fees arerecognized in interest income when received, unless they relate to aminor modification to the terms of the mortgage, in which case thefees are deferred and amortized over the remaining period of theoriginal mortgage. Loan syndication fees are included in credit feesin other income when the syndication is completed.
Allowance for credit lossesThe Bank maintains an allowance for credit losses which, in manage-ment’s opinion, is adequate to absorb all incurred credit-related losses inits portfolio of the following on-and off-balance sheet items: depositswith banks, securities purchased under resale agreements, loans, accept-ances and other indirect credit commitments, such as letters of creditand guarantees. The allowance for credit losses consists of specificallowances and a general allowance which are reviewed on a regularbasis. Full or partial write-offs of loans are generally recorded whenmanagement believes there is no realistic prospect of full recovery. Actualwrite-offs, net of recoveries, are deducted from the allowance forcredit losses.
Specific allowancesSpecific allowances, except those relating to credit card loans,certain personal loans and certain international residential mort-gages, are determined on an item-by-item basis and reflect theassociated estimated credit loss. In the case of loans, the specificallowance is the amount that is required to reduce the carrying valueof an impaired loan to its estimated realizable amount. Generally,the estimated realizable amount is determined by discounting theexpected future cash flows at the effective interest rate inherent inthe loan at the date of impairment. When the amounts and timingof future cash flows cannot be measured with reasonable reliability,either the fair value of any security underlying the loan, net ofexpected costs of realization and any amounts legally required to bepaid to the borrower, or the observable market price for the loan isused to measure the estimated realizable amount. The change in thepresent value attributable to the passage of time on the expectedfuture cash flows is reported as a reduction of the provision for creditlosses in the Consolidated Statement of Income. Specific allowancesfor credit card loans, certain personal loans and certain internationalresidential mortgages are calculated using a formula method takinginto account recent loss experience. The allowance for credit lossesagainst on-balance sheet items is reflected as a reduction of the relatedasset category, and allowances relating to off-balance sheet items areincluded in other liabilities in the Consolidated Balance Sheet.
General allowanceThe general allowance is established against the loan portfolio inrespect of the Bank’s core business lines where prudent assessment bythe Bank of past experience and existing economic and portfolioconditions indicate that it is probable that losses have occurred, butwhere such losses cannot be determined on an item-by-item basis.
The general allowance for business and government loans isunderpinned by a risk rating process in which internal risk ratings areassigned at the time of loan origination, monitored on an ongoingbasis, and adjusted to reflect changes in underlying credit risk. Withthe internal risk ratings as the foundation, the allowance is initiallycalculated through the application of migration and default statisticsby risk rating, loss severity in the event of default, and exposure atdefault patterns within each of the business line portfolios. Basedupon recent observable data, senior management forms a judgement
CONSOLIDATED FINANCIAL STATEMENTS
S c o t i a b a n k 2 0 0 5 A n n u a l R e p o r t 9 9

whether adjustments are necessary to the initially calculated (quantita-tive) allowance and the amount of any such adjustments. In makingthis judgement, management considers observable factors such aseconomic trends and business conditions, portfolio concentrations,and trends in volumes and severity of delinquencies.
For personal loan, credit card and mortgage portfolios, expectedlosses are estimated through analysis of historical loss migration andwrite-off trends.
The level of the general allowance is re-assessed quarterly and mayfluctuate as a result of changes in portfolio volumes, concentrations andrisk profile; analysis of evolving trends in probability of loss, severity ofloss and exposure at default factors; and management’s current assess-ment of factors that may have affected the condition of the portfolio.
While the total general allowance is established through a step-by-step process that considers risk arising from specific segments ofthe portfolio, the resulting total general allowance is available toabsorb all incurred losses in the loan portfolio that have not beenspecifically provided for.
The general allowance for credit losses is recorded as a reductionof loans in the Consolidated Balance Sheet.
Sales of loansTransfers of loans to unrelated parties are treated as sales providedthat control over the transferred loans has been surrendered andconsideration other than beneficial interests in the transferred loanshas been received in exchange. If these criteria are not satisfied, thenthe transfers are treated as financing transactions. If treated as sales,the loans are removed from the Consolidated Balance Sheet and again or loss is recognized in income immediately based on thecarrying value of the loans transferred, allocated between the assetssold and the retained interests in proportion to their fair values at thedate of transfer. The fair values of loans sold, retained interests andrecourse liabilities are determined using either quoted market prices,pricing models which take into account management’s best estimatesof key assumptions such as expected losses, prepayments anddiscount rates commensurate with the risks involved, or sales ofsimilar assets. Where the Bank continues to service the loans sold, aservicing liability or asset is recognized and amortized over the serv-icing period as servicing fees.
Retained interests in securitizations that can be contractually prepaidor otherwise settled in such a way that the Bank would not recoversubstantially all of its recorded investment are classified in investmentsecurities in the Consolidated Balance Sheet. Such retained interests aretested regularly for other-than-temporary impairment. When there hasbeen an adverse change in the expected cash flows and the fair value ofsuch retained interests is less than the carrying value, the retainedinterest’s carrying value is reduced to that fair value by a charge to securi-tization revenues in the Consolidated Statement of Income. Otherretained interests are classified and accounted for as loans.
For securitizations of loans, gains and losses on sale and servicingfee revenues are reported in other income – securitization revenuesin the Consolidated Statement of Income. Where a servicing liabilityor asset is recognized, the amount is recorded in other liabilities orother assets in the Consolidated Balance Sheet.
For the sale of performing loans (other than by way of securitiza-tion), which is one of the Bank’s credit risk management strategies, gainsand losses are reported in other income – other. Gains and losses onsales of impaired loans are reported in the provision for credit losses inthe Consolidated Statement of Income.
AcceptancesThe Bank’s potential liability under acceptances is reported as a liabilityin the Consolidated Balance Sheet. The Bank has equivalent claims
against its customers in the event of a call on these commitments,which are reported as an asset. Fees earned are reported in otherincome – credit fees in the Consolidated Statement of Income.
Land, buildings and equipmentLand is carried at cost. Buildings, equipment and computer software,and leasehold improvements are carried at cost less accumulateddepreciation and amortization. Depreciation and amortization arecalculated using the straight-line method over the estimated usefullife of the related asset as follows: buildings – 40 years, equipmentand computer software – 3 to 10 years and leasehold improvements –term of lease. Prior to November 1, 2003, computer software wasexpensed as incurred. This change was made following the CICA’selimination of industry practice as a source of GAAP and did not havea material impact on the Bank’s results of operations for fiscal 2004.
Net gains and losses on disposal are included in other income – other,in the Consolidated Statement of Income, in the year of disposal.
Goodwill and other intangible assetsGoodwill is the excess of the purchase price paid over the fair valueof the net assets purchased in the acquisition of a subsidiary or a VIEthat is a business where the Bank is the primary beneficiary.
Goodwill and other intangible assets with indefinite useful livesare not amortized, but are subject to impairment tests on at least anannual basis. Goodwill is allocated to reporting units and any poten-tial goodwill impairment is identified by comparing the carrying valueof a reporting unit with its fair value. If any potential impairment isindicated, then it is quantified by comparing the carrying value ofgoodwill to its fair value, calculated as the fair value of the reportingunit less the fair value of its assets and liabilities.
Intangible assets, other than goodwill, which do not have indefi-nite useful lives are amortized on a straight-line basis over theiruseful lives not exceeding 20 years. These intangible assets aresubject to an impairment test when events and circumstances indi-cate the carrying amounts may not be recoverable. The amortizationof intangible assets is recorded in other non-interest expenses in theConsolidated Statement of Income.
Capital instrument liabilitiesChange in accounting policy:Effective November 1, 2004, the Bank, as required, retroactivelyadopted, with restatement of prior periods, a new pronouncementissued by the CICA amending the accounting for certain financialinstruments that have the characteristics of both a liability andequity. This pronouncement requires those instruments that mustor can be settled by issuing a variable number of the issuer’sown equity instruments to be presented as liabilities rather thanas equity.
This pronouncement affected $2 billion of Scotiabank TrustSecurities issued through BNS Capital Trust and Scotiabank CapitalTrust, and $250 million of preferred shares issued by Scotia Mort-gage Investment Corporation. These instruments were retroactivelyreclassified from non-controlling interest in subsidiaries and share-holders’ equity, respectively, to capital instrument liabilities. As well,for fiscal 2004 disbursements of $164 million (2003 – $182 million)associated with these instruments were retroactively reclassified asinterest expense, whereas prior to fiscal 2005, such disbursementswere recorded as non-controlling interest in net income ofsubsidiaries of $134 million (2003 – $120 million) and preferred divi-dends of $23 million (2003 – $55 million), net of provision forincome taxes of $7 million (2003 – $7 million).
Furthermore, effective November 1, 2004, in accordance witha new Canadian accounting pronouncement related to VIEs,
CONSOLIDATED FINANCIAL STATEMENTS
1 0 0 S c o t i a b a n k 2 0 0 5 A n n u a l R e p o r t

$1.5 billion of Scotiabank Trust Securities were reclassifiedprospectively to deposit liabilities in the Consolidated Balance Sheet(see the above changes in accounting policy regarding the basisof consolidation).
In all cases, there was no change to net income available tocommon shareholders or earnings per share. As well, the Bank’sregulatory capital ratios were not affected, as the Bank’s innovativeTier 1 capital instruments remain eligible as Tier 1 capital for regula-tory purposes.
Corporate income taxesThe Bank follows the asset and liability method of accounting forcorporate income taxes. Under this method, future tax assets andliabilities represent the cumulative amount of tax applicable totemporary differences between the carrying amount of the assets andliabilities, and their values for tax purposes. Future tax assets andliabilities are measured using enacted or substantively enacted taxrates expected to apply to taxable income in the years in which thosetemporary differences are expected to be recovered or settled.Changes in future income taxes related to a change in tax rates arerecognized in income in the period in which the tax change wasenacted or substantively enacted.
Future tax assets and liabilities are included in other assets andother liabilities in the Consolidated Balance Sheet.
Derivative instrumentsDerivative instruments are financial contracts whose value is derivedfrom interest rates, foreign exchange rates or other financial orcommodity indices. Most derivative instruments can be character-ized as interest rate contracts, foreign exchange and gold contracts,commodity contracts, equity contracts or credit contracts. Derivativeinstruments are either exchange-traded contracts or negotiatedover-the-counter contracts. Exchange-traded derivatives includefutures and option contracts. Negotiated over-the-counter deriva-tives include swaps, forwards and options.
The Bank enters into these derivative contracts for tradingpurposes, as well as to manage its exposures, mainly to currencyand interest rate fluctuations, as part of the Bank’s asset/liabilitymanagement. Trading activities are undertaken to meet the needs ofthe Bank’s customers, as well as for the Bank’s own account togenerate trading income.
Trading derivatives are carried at their fair values [refer to Note23(d)]. The determination of the fair value of trading derivativesincludes consideration, on a portfolio basis, of customer credit riskand ongoing direct costs over the life of the instruments. The gainsand losses resulting from changes in fair values are included in otherincome – trading revenues in the Consolidated Statement ofIncome. Unrealized gains and unrealized losses on trading deriva-tives are reported separately in the Consolidated Balance Sheet astrading derivatives’ market valuation.
Derivative instruments designated as “asset/liability manage-ment” (non-trading) are those used to manage the Bank’s interestrate, foreign currency and other exposures. These include instru-ments that meet specified criteria to be designated as hedges foraccounting purposes.
Effective November 1, 2003, the Bank adopted a newaccounting guideline for hedging relationships, issued by the CICA.This guideline establishes certain qualifying conditions for the use ofhedge accounting which are more stringent and formalized thanprior standards. The Bank formally documents all relationshipsbetween hedging instruments and hedged items, as well as its riskmanagement objective and strategy for undertaking hedge transac-
tions. This process includes linking all derivatives to specific assetsand liabilities on the Consolidated Balance Sheet or to specific firmcommitments or forecasted transactions. The Bank also formallyassesses both at the hedge’s inception, and on an ongoing basis,whether the derivatives that are used in the hedging transactionsare highly effective in offsetting changes in fair values or cash flowsof hedged items.
The Bank reassessed its hedging relationships as at November 1,2003, which on transition resulted in an associated unrealized net lossof $44 million from asset/liability management derivatives that did notqualify for hedge accounting under the new criteria. This amount wasdeferred in other assets in the Consolidated Balance Sheet, and isbeing recognized in earnings as the original hedged items affect netincome. The adoption of this accounting guideline did not have amaterial impact on the Bank’s results of operations for fiscal 2004.
Income and expenses on derivative instruments designated andqualifying as hedges are recognized in the Consolidated Statement ofIncome in the same period as the related hedged item. If a designatedhedge is no longer effective, the associated derivative instrument issubsequently carried at fair value. Asset/liability management derivativesthat do not qualify for hedge accounting are carried at fair value in theConsolidated Balance Sheet, and subsequent changes in their fairvalue are recorded in the Consolidated Statement of Income asfollows: interest rate-related contracts in net interest income; optionsused in managing investment securities in net gain on investmentsecurities; and other derivative contracts in other income – other.Accrued income and expenses, and deferred gains and losses areincluded in other assets and other liabilities, as appropriate, in theConsolidated Balance Sheet.
Where the Bank manages its exposures using written creditdefault swaps, these derivatives are carried at fair value withchanges in their fair value included in other income – other, in theConsolidated Statement of Income. Where derivative instrumentsare used to manage the volatility of stock-based compensation,these derivatives are carried at fair value with changes in their fairvalue included in salaries and employee benefits expense, in theConsolidated Statement of Income.
Employee future benefitsThe Bank provides pension and other future benefit plans for quali-fied employees in Canada, the United States and other internationaloperations. Pension benefits are generally based on an employee’slength of service and the final five years’ average salary. Otherfuture benefits provided include post-retirement health care, dentalcare and life insurance, along with post-employment benefits andcompensated absences.
The cost of these employee future benefits is actuarially determinedeach year using the projected benefit method prorated on service. Thecalculation uses management’s best estimate of a number of assump-tions – including the long-term rates of investment return on plan assets,future compensation, health care costs, mortality, as well as the retire-ment age of employees. The discount rate is based on market conditionsas at the calculation date. The expected return on plan assets is generallybased on a market-related value of plan assets, where gains or losses onequity investments are recognized over three years; fixed income invest-ments are recognized at market value. The Bank’s main pension planuses a measurement date of August 31, while the other principalemployee future benefit plans use a July 31 date.
Past service costs, from plan amendments that impact previouslyearned employee benefits, are amortized on a straight-line basis over theestimated average remaining period to full benefit eligibility for activeemployees. For the Bank’s principal pension plans, these periods range
CONSOLIDATED FINANCIAL STATEMENTS
S c o t i a b a n k 2 0 0 5 A n n u a l R e p o r t 1 0 1

CONSOLIDATED FINANCIAL STATEMENTS
1 0 2 S c o t i a b a n k 2 0 0 5 A n n u a l R e p o r t
from 11 to 22 years. For principal other benefit plans, these periods rangefrom 7 to 27 years. If the unrecognized net actuarial gain or loss is morethan 10% of the greater of the plan assets or benefit obligation at thebeginning of the year, the excess above this 10% threshold is generallyamortized over the estimated average remaining service period ofemployees. For the Bank’s principal pension plans and principal otherbenefit plans, these periods range from 11 to 22 years and from7 to 27 years, respectively. A pension valuation allowance is recognized ifthe prepaid benefit expense (the cumulative difference between pensionincome/expense and funding contributions) is more than the Bank’sexpected future benefit.
The cumulative difference between pension income/expense andfunding contributions is included in other assets and other liabilities,as appropriate, in the Consolidated Balance Sheet. The differencebetween other future benefits expense and payments to qualifiedplan members is included in other assets and other liabilities in theConsolidated Balance Sheet.
Stock-based compensationThe Bank has stock option plans and other stock-based compensa-tion plans for certain eligible employees and non-officer directorsthat are described more fully in Note 15.
Employee stock options granted after November 1, 2002, haveTandem Stock Appreciation Rights (Tandem SARs), which provide theemployee the choice to either exercise the stock option for shares, or toexercise the Tandem SAR and thereby receive the intrinsic value of thestock option in cash. Options with Tandem SARs are awards that maycall for settlement in cash and therefore, are recorded in other liabil-ities in the Consolidated Balance Sheet. Changes in this liability,which arise from fluctuations in the market price of the Bank’scommon shares, are recorded in salaries and employee benefitsexpense in the Consolidated Statement of Income on a gradedvesting basis. If an employee chooses to exercise the option, therebycancelling the Tandem SAR, both the exercise price and the accruedliability are credited to common shares in the Consolidated BalanceSheet.
The Bank’s other stock-based compensation plans are accountedfor in the same manner as stock options with Tandem SAR features.The stock-based compensation expense is recognized evenly over anapplicable vesting period.
Stock options granted after November 1, 2002, to non-officerdirectors do not have Tandem SAR features. These are expensed usinga fair-value-based method (Black-Scholes pricing model) and recordedin other non-interest expenses with a corresponding credit tocontributed surplus in the Consolidated Balance Sheet.
For stock options granted prior to November 1, 2002, the Bankaccounts for these options using the intrinsic method. Under thismethod, the Bank does not recognize any compensation expense,since the exercise price was set at an amount equal to the closing priceon the day prior to the grant of the stock options. When these stockoptions are exercised, the proceeds received by the Bank are creditedto common shares in the Consolidated Balance Sheet.
2. Future accounting changes
The following summarizes future accounting policy changes that arerelevant to the Bank’s Consolidated Financial Statements subsequentto October 31, 2005.
Financial instrumentsThe CICA has issued three new standards: Financial Instruments –Recognition and Measurement, Hedges and Comprehensive Income.These will be effective for the Bank on November 1, 2006, andrequire the following:
Financial Instruments – Recognition and MeasurementAll financial assets and liabilities will be carried at fair value in theConsolidated Balance Sheet, except the following, which will becarried at amortized cost: loans and receivables, certain securitiesand non-trading financial liabilities. Realized and unrealized gainsand losses on financial assets and liabilities that are held for tradingwill continue to be recorded in the Consolidated Statement ofIncome. Unrealized gains and losses on financial assets that are heldas available for sale will be recorded in other comprehensive incomeuntil realized, when they will be recorded in the Consolidated State-ment of Income. All derivatives, including embedded derivatives thatmust be separately accounted for, will be recorded at fair value inthe Consolidated Balance Sheet.
HedgesIn a fair value hedge, the change in fair value of the hedging deriva-tive will be offset in the Consolidated Statement of Income againstthe change in the fair value of the hedged item relating to thehedged risk. In a cash flow hedge, the change in fair value of thederivative to the extent effective will be recorded in other compre-hensive income until the asset or liability being hedged affects theConsolidated Statement of Income, at which time the relatedchange in fair value of the derivative will also be recorded in theConsolidated Statement of Income. Any hedge ineffectiveness willbe recorded in the Consolidated Statement of Income.
Comprehensive IncomeUnrealized gains and losses on financial assets that will be held asavailable for sale, unrealized foreign currency translation amountsarising from self-sustaining foreign operations, and changes in thefair value of cash flow hedging instruments, will be recorded in aStatement of Other Comprehensive Income until recognized in theConsolidated Statement of Income. Other comprehensive incomewill form part of shareholders’ equity.
The transitional impact of these new standards is not yet deter-minable as it is dependent on the Bank’s outstanding positions,hedging strategies and market volatility at the time of transition.

CONSOLIDATED FINANCIAL STATEMENTS
S c o t i a b a n k 2 0 0 5 A n n u a l R e p o r t 1 0 3
The net unrealized gain on investment securities of $1,159 million(2004 – $1,354 million) decreases to a net unrealized gain of$1,035 million (2004 – $1,048 million) after the net fair value of
derivative instruments and other hedge amounts associated withthese securities is taken into account.
3. SecuritiesRemaining term to maturity 2005 2004
NoWithin Three to One to Over specific Carrying Carrying
As at October 31 ($ millions) 3 months 12 months 5 years 5 years maturity value value
Investment securities:Canadian federal government debt(1) $ 1,606 $ 103 $ 1,411 $ 14 $ – $ 3,134 $ 1,658Canadian provincial and municipal debt 350 30 17 – – 397 384U.S. treasury and other U.S. agencies 6 59 1,498 1,466 – 3,029 1,386Other foreign governments 977 808 912 1,875 – 4,572 4,363Bonds of designated emerging markets 28 – 105 459 – 592 708Other debt 1,926 669 5,286 1,088 – 8,969 4,353Preferred shares – – 3 – 679(2) 682 760Common shares – – – – 1,910 1,910 1,964Associated corporations – – – 5 162(3) 167 141Total 4,893 1,669 9,232 4,907 2,751 23,452 15,717
Trading securities(4):Canadian federal government debt 736 1,152 2,403 1,554 – 5,845 5,452Canadian provincial and municipal debt 1,011 489 965 2,113 – 4,578 2,923U.S. treasury and other U.S. agencies 3 – 670 174 – 847 711Other foreign governments 758 1,504 3,273 270 – 5,805 5,226Common shares – – – – 25,494 25,494 21,447Other 1,984 902 3,096 1,238 218 7,438 7,297Total 4,492 4,047 10,407 5,349 25,712 50,007 43,056
Total securities $ 9,385 $ 5,716 $ 19,639 $ 10,256 $ 28,463 $ 73,459 $ 58,773Total by currency (in Canadian equivalent):
Canadian dollar $ 4,911 $ 2,319 $ 6,562 $ 4,335 $ 23,207 $ 41,334 $ 34,200U.S. dollar 1,929 706 8,531 4,273 5,006 20,445 14,528Other currencies 2,545 2,691 4,546 1,648 250 11,680 10,045
Total securities $ 9,385 $ 5,716 $ 19,639 $ 10,256 $ 28,463 $ 73,459 $ 58,773
(1) Includes securities retained by the Bank in connection with its mortgage securitizations. The outstanding balance of these mortgage-backed securities is $1,214 (2004 –nil) [refer to Note 4 (b)].
(2) Although these securities have no stated term, most provide the Bank with various means to retract or dispose of these shares on earlier dates.(3) Equity securities of associated corporations have no stated term, and as a result, have been classified in the “No specific maturity” column.(4) Trading securities are carried at market value.
An analysis of unrealized gains and losses on investment securities is as follows:
2005 2004Gross Gross Estimated Gross Gross Estimated
Carrying unrealized unrealized market Carrying unrealized unrealized marketAs at October 31 ($ millions) value gains losses value value gains losses value
Canadian federal government debt $ 3,134 $ 10 $ 18 $ 3,126 $ 1,658 $ – $ – $ 1,658Canadian provincial and municipal debt 397 – – 397 384 1 – 385U.S. treasury and other U.S. agencies 3,029 – 50 2,979 1,386 8 1 1,393Other foreign governments 4,572 411 14 4,969 4,363 408 11 4,760Bonds of designated emerging markets 592 286 – 878 708 360 2 1,066Other debt 8,969 48 20 8,997 4,353 84 9 4,428Preferred shares 682 21 9 694 760 31 11 780Common shares 1,910 528 34 2,404 1,964 535 39 2,460Associated corporations 167 – – 167 141 – – 141Total investment securities $23,452 $ 1,304 $ 145 $24,611 $15,717 $ 1,427 $ 73 $17,071

An analysis of net gain on investment securities is as follows:
For the year ended October 31 ($ millions) 2005 2004 2003
Realized gains $ 599 $ 691 $ 492Realized losses and impairment writedowns 185 214 333Net gain on investment securities $ 414 $ 477 $ 159
4. Loans(a) Loans outstanding
The Bank’s loans, net of unearned income and the allowance for credit losses in respect of loans, are as follows(1):
As at October 31 ($ millions) 2005 2004
Canada:Residential mortgages $ 69,431 $ 64,347Personal and credit cards 30,122 26,296Business and government 24,843 22,294Securities purchased under resale agreements 11,683 11,450
136,079 124,387United States:
Business, government and other 9,494 10,591Securities purchased under resale agreements 6,052 3,174
15,546 13,765Other International:
Personal lending 10,594 8,513Business and government 28,411 24,543Securities purchased under resale agreements 2,844 3,256
41,849 36,312193,474 174,464
Less: allowance for credit losses 2,469 2,696Total(2) $ 191,005 $ 171,768
(1) Geographic segmentation of assets is based upon the location of the ultimate risk of the underlying assets.(2) Loans denominated in U.S. dollars amount to $35,560 (2004 – $30,590) and loans denominated in other foreign currencies amount to $22,466 (2004 – $20,753).
CONSOLIDATED FINANCIAL STATEMENTS
1 0 4 S c o t i a b a n k 2 0 0 5 A n n u a l R e p o r t
(b) Sales of loans through securitizations
The Bank securitizes residential mortgages through the creation ofmortgage-backed securities. The net gain on sale of the mortgagesresulting from these securitizations is recognized in securitizationrevenues in the Consolidated Statement of Income. The keyweighted-average assumptions used to measure fair value at the
dates of securitization were a prepayment rate of 15.2% (2004 –15.6%; 2003 – 14.3%), an excess spread of 1.2% (2004 – 1.2%;2003 – 1.4%), and a discount rate of 3.8% (2004 – 4.2%; 2003 –4.3%). No credit losses are expected as the mortgages are insured.The following table summarizes the Bank’s sales.
For the year ended October 31 ($ millions) 2005 2004 2003
Net cash proceeds(1) $ 2,153 $ 3,514 $ 2,443Retained interest 66 106 89Retained servicing liability (14) (23) (16)
2,205 3,597 2,516Residential mortgages securitized 2,161 3,537 2,467Net gain on sale $ 44 $ 60 $ 49
(1) Excludes insured mortgages which were securitized and retained by the Bank of $1,452 (2004 and 2003 – nil). These assets are classified as investment securities andhave an outstanding balance of $1,214 (2004 and 2003 – nil) [refer to note 3].

The key assumptions used in measuring the fair value of the retained interests for mortgages securitized and the sensitivity of the current fairvalue of retained interests to a 10% and 20% adverse change to these assumptions are as follows:
As at October 31 ($ millions) 2005 2004
Carrying value of the retained interest ($) 212 209Fair value of the retained interest ($) 216 222Weighted average life (in years) 3 4Prepayment rate (%) 14.8 14.5
Impact on fair value of a 10% adverse change ($) (5) (7)Impact on fair value of a 20% adverse change ($) (9) (14)
Residual cash flow annual discount rate (%) 3.3-4.2 3.0-4.5Impact on fair value of a 10% adverse change ($) (1) (2)Impact on fair value of a 20% adverse change ($) (3) (4)
Excess spread (%) 1.2 1.3Impact on fair value of a 10% adverse change ($) (20) (20)Impact on fair value of a 20% adverse change ($) (39) (40)
CONSOLIDATED FINANCIAL STATEMENTS
S c o t i a b a n k 2 0 0 5 A n n u a l R e p o r t 1 0 5
The sensitivity measures above are hypothetical and should be usedwith caution. Other sensitivity estimates should not be extrapolatedfrom those presented above since the relationship between thechange in the assumption to the change in fair value is not linear.In addition, changes in a particular assumption and the effect on
the fair value of the retained interests is calculated withoutchanging any other assumption; however, the factors are not inde-pendent and the actual effects could be magnified or counteractedfrom the sensitivities presented.
Information on total securitized loan assets(1) is summarized as follows:2005 2004 2003
Outstanding Impaired and Net credit Outstanding Impaired and Net credit Outstanding Impaired and Net creditsecuritized other past due losses for securitized other past due losses for securitized other past due losses forloans as at loans as at the year ended loans as at loans as at the year ended loans as at loans as at the year ended
($ millions) October 31 October 31 October 31 October 31 October 31 October 31 October 31 October 31 October 31
Mortgages $ 7,801 $ – $ – $ 7,523 $ – $ – $ 5,248 $ – $ –Personal and
credit cards 809 4 2 1,319 5 5 2,417 12 16Total $ 8,610 $ 4 $ 2 $ 8,842 $ 5 $ 5 $ 7,665 $ 12 $ 16
(1) Excludes insured mortgages which were securitized and retained by the Bank [refer to Note 3].
5. Impaired loans and allowance for credit losses(a) Impaired loans
2005 2004Specific
As at October 31 ($ millions) Gross(1) allowance(2) Net Net
By loan type:Residential mortgages $ 264 $ (106) $ 158 $ 96Personal and credit cards 366 (356) 10 39Business and government 1,190 (677) 513 744
Total $ 1,820(3)(4) $ (1,139) $ 681 $ 879By geography:
Canada $ 188 $ 144United States 249 442Other International 244 293
Total $ 681 $ 879
(1) Gross impaired loans denominated in U.S. dollars amount to $612 (2004 – $940) and those denominated in other foreign currencies amount to $674 (2004 – $779).(2) The specific allowance for impaired loans evaluated on an individual basis amounts to $681 (2004 – $865).(3) Impaired loans without an allowance for credit losses against individual loans totalled $151 (2004 – $110).(4) Average balance of gross impaired loans totalled $1,939 (2004 – $2,989).

CONSOLIDATED FINANCIAL STATEMENTS
1 0 6 S c o t i a b a n k 2 0 0 5 A n n u a l R e p o r t
(b) Allowance for credit lossesSpecific General
As at October 31 ($ millions) allowance allowance 2005 2004 2003
Balance at beginning of year $ 1,329 $ 1,375 $ 2,704 $ 3,580 $ 3,848Presented with securities(1) – – – (363) –Write-offs(2) (650) – (650) (982) (948)Recoveries 205 – 205 158 164Provision for (reversal of) credit losses 275 (45) 230 390 893Other, including foreign currency adjustment (14)(3) – (14) (79) (377)Balance at end of year(4) $ 1,145 $ 1,330 $ 2,475 $ 2,704 $ 3,580(1)
(1) Effective November 1, 2003, the country risk allowance related to investment securities is no longer disclosed as part of the allowance for credit losses, but continues tobe deducted from investment securities.
(2) Write-offs of loans restructured during the year were $18 (2004 – $10; 2003 – $40).(3) Includes $59 on acquisition of Banco de Comercio S.A. de C.V., El Salvador.(4) As at October 31, 2005, $6 (October 31, 2004 – $8; October 31, 2003 – nil) has been recorded in other liabilities.
6. Variable interest entities
Effective November 1, 2004, the Bank adopted a new accounting guideline, which requires prospective consolidation of variable interest enti-ties (VIEs) by the primary beneficiary [refer to Note 1]. The following table provides information about VIEs that the Bank consolidated andother VIEs in which the Bank has a significant variable interest but is not the primary beneficiary. A significant variable interest is consideredto exist where the Bank absorbs or receives between 10% and 50% of the VIE’s expected losses, expected residual returns, or both.
Consolidated VIEs(a):Total
As at October 31, 2005 ($ millions) assets
Multi-seller conduits that the Bank administers(b) $ 4,722Funding vehicles(c) 824Other(d) 750
Other VIEs in which the Bank has a significant variable interest:Maximum
Total exposureAs at October 31, 2005 ($ millions) assets to loss(e)
Multi-seller conduits that the Bank administers(b) $ 4,085 $ 4,712Funding vehicles(c) 1,608 –Structured finance entities(d) 2,076 1,239Collateralized debt obligation entities(f) 1,404 375Other 486 91
(a) The assets supporting the obligations of these consolidated VIEsas at October 31, 2005 are as follows: cash and non-interestbearing deposits with banks of $128 million; residential mort-gage loans of $763 million; investment securities of $5,309million; and other assets of $96 million. In general, the investorsin the obligations of consolidated VIEs have recourse only to theassets of those VIEs and do not have recourse to the Bankexcept where the Bank has provided a guarantee to theinvestors or is the counterparty to a derivative transactioninvolving the VIE.
(b) The Bank administers multi-seller commercial paper conduitprograms, which involve the purchase of assets by conduit vehi-cles from outside parties funded by the issuance of asset-backedcommercial paper. The sellers continue to service the assets andabsorb first losses for their portion of the programs. The Bankhas no rights to these assets as they are available to support theobligations of the respective programs, but manages for a feethe commercial paper selling programs. As well, in someinstances the Bank is counterparty to derivative contracts withthese conduit programs and provides them with a large portionof their backstop liquidity and partial credit enhancement facili-ties. As at October 31, 2005, the conduit programs hadcommitments of $4,243 million to purchase securities inthe future.
(c) The Bank uses special purpose entities to facilitate cost-efficientfinancing of its own operations. Activities of these entities aregenerally limited to holding a pool of assets or receivables fromthe Bank used to finance distributions to their investors. Prior tothe adoption of this new accounting guideline, the Bank consol-idated all of these funding vehicles.
(d) This includes special purpose entities used to assist corporateclients in accessing cost-efficient financing. Generally, both theBank and the client invest in such entities with the proceedsused to make loans to corporations affiliated withthe client.
(e) The Bank’s maximum exposure to loss represents the notionalamounts of guarantees, liquidity facilities, and other creditsupport relationships with the VIE, the credit risk amount forcertain derivative contracts with the entities, and the amountinvested where the Bank holds an ownership interest in the VIE.The Bank has recorded $1,669 million of this exposure, primarilyits ownership interest in the VIEs, on its Consolidated BalanceSheet as at October 31, 2005.
(f) The Bank holds an interest in VIEs structured to match specificinvestor requirements. Loans or credit derivatives are held by theVIEs to create security offerings for investors that match theirinvestment needs and preferences.

8. Goodwill and other intangible assets
CONSOLIDATED FINANCIAL STATEMENTS
S c o t i a b a n k 2 0 0 5 A n n u a l R e p o r t 1 0 7
GoodwillThe changes in the carrying amount of goodwill by main operating segment are as follows:
Domestic International ScotiaAs at October 31 ($ millions) Banking Banking Capital 2005 2004 2003
Balance at beginning of year $ 115 $ 135 $ 11 $ 261 $ 270 $ 299Acquisitions – 143 84 227 – 76Impairment – – – – – –Adjustment to goodwill – – – – – (95)(1)
Effects of foreign exchange and other – 10 – 10 (9) (10)Balance at end of year $ 115 $ 288 $ 95 $ 498 $ 261 $ 270
Intangible assetsGross
carrying Accumulated 2005 2004 2003As at October 31 ($ millions) amount amortization Net Net Net
Intangible assets $ 421(1) $ 186 $ 235 $ 240 $ 284
Intangible assets are comprised primarily of core deposit intangibles. The aggregate amortization expense for the year ended October 31,2005, was $29 million (2004 – $27 million; 2003 – $29 million).
(1) In prior years, the Bank recognized income tax benefits (2004 – $94; 2003 – $102), relating to pre-acquisition income tax loss carryforwards that had not been reflectedin the purchase price equation at the date of acquisition. These income tax benefits were applied first to decrease goodwill (2004 – nil; 2003 – $95) and then to reduceintangible assets (2004 – $18; 2003 – $7).
9. Other assets
As at October 31 ($ millions) 2005 2004
Accrued interest $ 1,561 $ 1,608Accounts receivable 1,016 1,020Future income tax assets (Note 16) 1,295 1,055Other 3,319 4,176Total $ 7,191 $ 7,859
7. Land, buildings and equipment2005 2004
Accumulated Net Netdepreciation & book book
As at October 31 ($ millions) Cost amortization value value
Land $ 247 $ – $ 247 $ 236Buildings 1,417 400 1,017 1,005Equipment and computer software 2,464 1,987 477 447Leasehold improvements 700 507 193 184Total $ 4,828 $ 2,894 $ 1,934 $ 1,872
Depreciation and amortization in respect of the above buildings, equipment and computer software, and leasehold improvements for theyear amounted to $173 million (2004 – $189 million; 2003 – $208 million).

10. DepositsPayable Payable Payable on
on demand after notice a fixed date 2005 2004
As at October 31 ($ millions) Interest-bearing Non-interest-bearing
Personal $ 1,654 $ 1,330 $ 30,444 $ 50,525 $ 83,953 $ 79,020Business and government(1) 11,498 7,180 12,611 78,100 109,389 94,125Banks 98 221 855 22,929 24,103 22,051Total 13,250 8,731 43,910 151,554 217,445 195,196
Recorded in:Canada 154,297 136,949United States 9,778 9,592Other International 53,370 48,655
Total(2) $217,445 $195,196
(1) Includes deposits by Scotiabank Capital Trust of $1,500 (2004 – nil). Prior to November 1, 2004, the Bank consolidated Scotiabank Capital Trust, and the Trust’s liabilitieswere recorded as capital instrument liabilities [refer to Note 1 and Note 13].
(2) Deposits denominated in U.S. dollars amount to $51,220 (2004 – $49,923) and deposits denominated in other foreign currencies amount to $33,095 (2004 – $29,193).
12. Subordinated debentures
These debentures are direct, unsecured obligations of the Bank and are subordinate to the claims of the Bank’s depositors and other credi-tors. The Bank, where appropriate, enters into interest rate and cross-currency swaps to hedge the related risks. The outstanding debenturesas at October 31 were:
As at October 31 ($ millions)
Maturity date Interest rate (%) Terms(1) (currency in millions) 2005 2004
September 2008 6.25 US $250 $ 295 $ 305February 2011 7.4 Redeemable at any time. After February 8, 2006,
interest will be payable at an annual rate equalto the 90-day bankers’ acceptance rate plus 1% 300 300
July 2012 6.25 Redeemable at any time. After July 16, 2007, interestwill be payable at an annual rate equal to the 90-daybankers’ acceptance rate plus 1% 500 500
July 2013 5.65 Redeemable at any time. After July 22, 2008,interest will be payable at an annual rateequal to the 90-day bankers’ acceptance rate plus 1% 425 425
September 2013 8.3 Redeemable at any time 250 250May 2014 5.75 Redeemable at any time. After May 12, 2009, interest
will be payable at an annual rate equal to the 90-daybankers’ acceptance rate plus 1% 325 325
June 2025 8.9 Redeemable at any time 250 250August 2085 Floating US $214 bearing interest at a floating rate of the
offered rate for six-month Eurodollar deposits plus0.125%. Redeemable on any interest payment date 252 260
$ 2,597 $ 2,615The aggregate maturities of the debentures are as follows ($ millions):
Less than 3 years $ 295From 3 to 5 years –From 5 to 10 years 1,800Over 10 years 502
$ 2,597
(1) In accordance with the provisions of the Capital Adequacy Guideline of the Superintendent, all redemptions are subject to regulatory approval.
11. Other liabilities
As at October 31 ($ millions) 2005 2004
Accrued interest $ 1,876 $ 2,107Accounts payable and accrued expenses 3,353 3,280Deferred income 322 341Other liabilities of subsidiaries and VIEs(1) 5,969 919Gold and silver certificates 2,711 2,018Future income tax liabilities (Note 16) 62 56Other 6,501 7,012Total $ 20,794 $ 15,733
(1) Excludes deposits and capital instrument liabilities.
CONSOLIDATED FINANCIAL STATEMENTS
1 0 8 S c o t i a b a n k 2 0 0 5 A n n u a l R e p o r t

CONSOLIDATED FINANCIAL STATEMENTS
S c o t i a b a n k 2 0 0 5 A n n u a l R e p o r t 1 0 9
(a) Scotia Mortgage Investment Corporation, a wholly-ownedsubsidiary of the Bank, issued Class A Preferred Shares which areentitled to non-cumulative preferential cash dividends, if andwhen declared, payable semi-annually in an amount per share of$32.85. With regulatory approval, on or after October 31, 2007,Class A Preferred Shares may be redeemed in whole by thepayment of cash by Scotia Mortgage Investment Corporation or,at the option of the Bank, exchanged for a variable number ofcommon shares based upon an average of the Bank’s commonshare price near the redemption date. On or after October 31,2007, the Class A Preferred Shares will be exchangeable at theoption of the holder into a variable number of common sharesbased upon an average of the Bank’s common share price,subject to the right of the Bank prior to the exchange date topurchase for cash or find substitute purchasers for such shares.Under certain circumstances the Class A Preferred Shares of ScotiaMortgage Investment Corporation will be automaticallyexchanged, without the consent of the holder, into Series Z Non-cumulative Preferred Shares of the Bank which would bear thesame dividend rate and similar redemption features [refer to Note14 – Restrictions on dividend payments].
(b) On April 4, 2000, BNS Capital Trust, a wholly-owned closed-endtrust, issued 500,000 Scotiabank Trust Securities – 2000-1 (“ScotiaBaTS”). Each Scotia BaTS is entitled to receive non-cumulative fixedcash distributions payable semi-annually in an amount per ScotiaBaTS of $36.55. With regulatory approval, these securities may beredeemed in whole by the payment of cash prior to June 30, 2005,upon the occurrence of certain tax or regulatory capital changes, oron or after June 30, 2005, at the option of BNS Capital Trust. Onor after June 30, 2011, the Scotia BaTS may be exchanged, at theoption of the holder and subject to certain prior rights of the Bank,into Non-cumulative Preferred Shares Series Y of the Bank. TheseNon-cumulative Preferred Shares Series Y would pay a dividendrate equivalent to the cash distribution rate of the Scotia BaTS.Under certain circumstances, the Scotia BaTS would be automati-cally exchanged without the consent of the holder, into Non-cumu-lative Preferred Shares Series Y of the Bank [refer to Note 14 –Restrictions on dividend payments]. In all circumstances, the Non-cumulative Preferred Shares Series Y are exchangeable at theoption of the holder into a variable number of common shares ofthe Bank based upon an average of the Bank’s common share price,subject to regulatory approval, and certain prior rights of the Bank.
(c) On April 30, 2002, Scotiabank Capital Trust, a wholly-ownedopen-end trust, issued 750,000 Scotiabank Trust Securities –Series 2002-1. These securities are entitled to receive non-cumu-lative fixed cash distributions payable semi-annually in anamount of $33.13 per security. The first such payment wasmade on June 30, 2002, in an amount of $11.07. With
regulatory approval, these securities may be redeemed in wholeby the payment of cash prior to June 30, 2007, upon the occur-rence of certain tax or regulatory capital changes, or on or afterJune 30, 2007, at the option of Scotiabank Capital Trust. Theholder has the right at any time to exchange their security intoNon-cumulative Preferred Shares Series W of the Bank. TheSeries W shares will be entitled to cash dividends payable semi-annually in an amount of $0.53125 per $25.00 share. Undercertain circumstances, these trust securities would be automati-cally exchanged without the consent of the holder, into Non-cumulative Preferred Shares Series X of the Bank. The Series Xshares will be entitled to non-cumulative cash dividends payablesemi-annually in an amount of $0.70 per $25.00 share [refer toNote 14 – Restrictions on dividend payments]. Both the Non-cumulative Preferred Shares Series W and the Non-cumulativePreferred Shares Series X are exchangeable at the option of theholder into a variable number of common shares of the Bankbased upon an average of the Bank’s common share price,subject to regulatory approval, and certain prior rights of the Bank.On November 1, 2004, the Bank deconsolidated ScotiabankCapital Trust and these liabilities were reclassed to deposits[refer to Note 1 and Note 10].
(d) On February 13, 2003, Scotiabank Capital Trust issued 750,000Scotiabank Trust Securities – Series 2003-1. These securities areentitled to receive non-cumulative fixed cash distributions payablesemi-annually in an amount of $31.41 per security. The first suchpayment was made on June 30, 2003, in an amount of $23.58.With regulatory approval, these securities may be redeemed inwhole by the payment of cash prior to June 30, 2008, upon theoccurrence of certain tax or regulatory capital changes, or on orafter June 30, 2008, at the option of Scotiabank Capital Trust. Theholder has the right at any time to exchange their security intoNon-cumulative Preferred Shares Series U of the Bank. The Series Ushares will be entitled to cash dividends payable semi-annually inan amount of $0.50 per $25.00 share. Under certain circum-stances, these trust securities would be automatically exchangedwithout the consent of the holder, into Non-cumulative PreferredShares Series V of the Bank. The Series V shares will be entitled tonon-cumulative cash dividends payable semi-annually in anamount of $0.61250 per $25.00 share [refer to Note 14 – Restric-tions on dividend payments]. Both the Non-cumulative PreferredShares Series U and the Non-cumulative Preferred Shares Series Vare exchangeable at the option of the holder into a variablenumber of common shares of the Bank based upon an average ofthe Bank’s common share price, subject to regulatory approval,and certain prior rights of the Bank. On November 1, 2004, theBank deconsolidated Scotiabank Capital Trust and these liabilitieswere reclassed to deposits [refer to Note 1 and Note 10].
13. Capital instrument liabilities
Capital instrument liabilities are financial instruments, which can be settled at the Bank’s option by issuing a variable number of the Bank’sown equity instruments. These instruments, including the securities issued by Scotiabank Capital Trust that are not reflected as capital instru-ment liabilities in the Consolidated Balance Sheet in 2005, as a result of the prospective deconsolidation of Scotiabank Capital Trust effectiveNovember 1, 2004, [refer to Note 1 and Note 10] remain eligible as Tier 1 capital for regulatory purposes.
As at October 31 ($ millions) 2005 2004
Preferred shares issued by Scotia Mortgage Investment Corporation(a) $ 250 $ 250Scotiabank Trust Securities – Series 2000-1 issued by BNS Capital Trust(b) 500 500Scotiabank Trust Securities – Series 2002-1 issued by Scotiabank Capital Trust(c) – 750Scotiabank Trust Securities – Series 2003-1 issued by Scotiabank Capital Trust(d) – 750
$ 750 $ 2,250

(a) Series 12 Non-cumulative Preferred Shares are entitled to non-cumulative preferential cash dividends payable quarterly in anamount per share of $0.328125. With regulatory approval, theshares may be redeemed by the Bank at par on or after October29, 2013, in whole or in part, by the payment in cash of $25.00per share, together with declared and unpaid dividends to thedate then fixed for redemption.
(b) Series 13 Non-cumulative Preferred Shares, issued on March 15,2005, are entitled to non-cumulative preferential cash dividendspayable quarterly in an amount per share of $0.30. The initialdividend, paid July 27, 2005, was $0.4405 per share. With regu-latory approval, the shares may be redeemed by the Bank on orafter April 28, 2010, at $26.00 per share, together with declaredand unpaid dividends to the date then fixed for redemption, andthereafter at annually declining premiums until April 28, 2014,following which no redemption premium is payable.
(c) On April 28, 2004, the Bank paid a stock dividend of onecommon share for each of its issued and outstanding commonshares to common shareholders of record at the close of busi-ness on April 6, 2004. The effect is the same as a two-for-onestock split of its common shares. Comparative amountspresented in these consolidated financial statements relating tothe number of common shares and options, as well as all pershare amounts, have been retroactively adjusted.
(d) As at October 31, 2005, 22,134,489 common shares have beenreserved for future issue under the terms of the ShareholderDividend and Share Purchase Plan.
(e) In January 2005, the Bank initiated a new normal course issuerbid to purchase up to 50 million of the Bank’s common shares.This represents approximately 5 per cent of the Bank’soutstanding common shares. The bid will terminate on theearlier of January 5, 2006, or the date the Bank completes itspurchases. During the year ended October 31, 2005, 26.1 millionshares (2004 – 9.1 million shares; 2003 – 8.3 million shares) werepurchased at an average price of $40.51 (2004 – $34.96; 2003 –$27.31).
Restrictions on dividend paymentsUnder the Bank Act, the Bank is prohibited from declaring any divi-dends on its common or preferred shares when the Bank is, or wouldbe placed by such a declaration, in contravention of the capitaladequacy, liquidity or any other regulatory directives issued under theBank Act. In addition, common share dividends cannot be paidunless all dividends to which preferred shareholders are then entitledto have been paid or sufficient funds have been set aside to do so.Further, dividends cannot be declared if the total of all dividendsdeclared in that year would exceed the aggregate of the Bank’s netincome to that date and its net income for the preceding twofinancial years, unless the Superintendent’s approval is obtained.
In the event that applicable cash distributions on any of theScotiabank Trust Securities [refer to Note 13 Capital instrumentliabilities] are not paid on a regular distribution date, the Bank hasundertaken not to declare dividends of any kind on its preferred orcommon shares. Similarly, should the Bank fail to declare regulardividends on any of its directly issued outstanding preferred orcommon shares, cash distributions will also not be made on any ofthe Scotiabank Trust Securities.
Currently, these limitations do not restrict the payment ofdividends on preferred or common shares.
CONSOLIDATED FINANCIAL STATEMENTS
1 1 0 S c o t i a b a n k 2 0 0 5 A n n u a l R e p o r t
14. Capital stock
Authorized:An unlimited number of preferred and common shares without nominal or par value.
Issued and fully paid:2005 2004(1) 2003(1)
As at October 31 ($ millions) Number of shares Amount Number of shares Amount Number of shares Amount
Preferred shares:Series 12(a) 12,000,000 $ 300 12,000,000 $ 300 12,000,000 $ 300Series 13(b) 12,000,000 300 – – – –
Total preferred shares 24,000,000 $ 600 12,000,000 $ 300 12,000,000 $ 300Common shares:(c)
Outstanding at beginning of year 1,008,505,580 $ 3,228 1,010,705,772 $ 3,140 1,008,243,800 $ 3,002Issued under Shareholder Dividend
and Share Purchase Plan(d) 154,168 6 178,021 6 143,400 4Issued under Stock Option Plans (Note 15) 6,423,684 117 6,760,287 111 10,612,772 159Issued for acquisition of a subsidiary 1,195,294 49 – – – –Purchased for cancellation(e) (26,096,600) (84) (9,138,500) (29) (8,294,200) (25)Outstanding at end of year 990,182,126 $ 3,316 1,008,505,580 $ 3,228 1,010,705,772 $ 3,140
Total capital stock $ 3,916 $ 3,528 $ 3,440
(1) Certain comparative amounts have been retroactively restated for new CICA accounting requirements relating to the distinction between equity and liability instruments.

Details of the Bank’s Employee Stock Option Plan(1) are as follows:2005 2004 2003
Number Weighted Number Weighted Number Weightedof stock average of stock average of stock averageoptions exercise options exercise options exercise
As at October 31 (000’s) price (000’s) price (000’s) price
Outstanding at beginning of year 42,525 $ 19.93 47,400 $ 18.80 54,226 $ 17.63Granted 1,977 39.00 2,592 31.45 4,240 24.43Exercised (6,391) 17.00 (6,735) 15.95 (10,613) 15.00Forfeited/cancelled (149) 23.57 (374) 22.64 (411) 19.93Exercise of Tandem SARs (604) 25.04 (358) 24.75 (42) 24.68Outstanding at end of year(2) 37,358 $ 21.35 42,525 $ 19.93 47,400 $ 18.80Exercisable at end of year 29,305 $ 19.06 29,523 $ 17.67 29,424 $ 16.59Available for grant 22,598 23,821 9,680
As at October 31, 2005 Options Outstanding Options ExercisableNumber Weighted Weighted Number Weightedof stock average remaining average of stock average
Range of exercise prices options (000’s) contractual life (years) exercise price options (000’s) exercise price
$8.26 to $14.18 7,139 3.1 $ 13.14 7,139 $ 13.14$15.28 to $21.03 14,945 4.2 $ 18.94 14,945 $ 18.94$24.40 to $27.44 10,880 6.5 $ 24.60 6,648 $ 24.62$31.45 to $39.00 4,394 8.5 $ 34.79 573 $ 31.45
37,358 5.1 $ 21.35 29,305 $ 19.06
(1) Amounts have been retroactively adjusted to reflect the stock dividend paid April 28, 2004, of one common share for each issued and outstanding common share. Thestock dividend had the same effect as a two-for-one stock split.
(2) Included are 15,274,605 (2004 – 14,482,584; 2003 – 12,750,696) options with Tandem SAR features.
CONSOLIDATED FINANCIAL STATEMENTS
S c o t i a b a n k 2 0 0 5 A n n u a l R e p o r t 1 1 1
15. Stock-based compensation(a) Stock option plans
Under the terms of the Employee Stock Option Plan, options topurchase common shares may be granted to selected employees atan exercise price not less than the closing price of the Bank’scommon shares on the Toronto Stock Exchange (TSX) on the dayprior to the date of the grant. As well, the exercise price must not beless than the volume weighted average price on the TSX for the fivetrading days immediately preceding the grant date. Employeestock options granted after November 1, 2002, have Tandem StockAppreciation Rights (Tandem SARs), which provide the employee thechoice to either exercise the stock option for shares, or to exercise theTandem SAR and thereby receive the intrinsic value of the stock option incash. In addition, in fiscal 2003, Tandem SARs were retroactivelyattached to the fiscal 2002 employee stock options. All other termsand conditions relating to these 2002 stock options remainedunchanged. These 2002 stock options were out of the money at thedate of attachment. As a result, there was no impact on the Bank’sstock-based compensation expense on the date of retroactiveattachment of the Tandem SARs.
Options vest evenly over a four-year period and are exercisable nolater than 10 years after the date of the grant. Outstanding optionsexpire on dates ranging from June 3, 2006 to December 3, 2014. As
approved by the shareholders, a total of 114 million common shareshave been reserved for issuance under this plan of which 54.0 millioncommon shares have been issued as a result of the exercise ofoptions and 37.4 million common shares are committed underoutstanding options, leaving 22.6 million common shares available forissuance as options.
In 2001, a Directors’ Stock Option Plan was approved by the share-holders. A total of 800,000 common shares have been reserved forissuance to non-officer directors under this plan. As of November 1,2002, director stock options are expensed using a fair-value-basedmethod. As these options are fully exercisable at the time of grant, thefair value of $0.5 million for the 76,000 stock options granted in fiscal2003 was fully expensed in the 2003 fiscal year in other non-interestexpenses in the Consolidated Statement of Income. Currently, 224,000(2004 – 257,150; 2003 – 282,000) options are outstanding at aweighted average exercise price of $23.19 (2004 – $23.13; 2003 –$22.94). In 2005, 33,150 of these options (2004 – 24,850; 2003 – nil)were exercised at a weighted average exercise price of $22.71 (2004 –$20.95; 2003 – nil). These options expire between March 2011 andDecember 2012. Commencing in fiscal 2004, the Bank no longergrants stock options to these directors.

(b) Employee share ownership plans
Qualifying employees can contribute up to the lesser of a specifiedpercentage of salary and a maximum dollar amount towards thepurchase of common shares of the Bank or deposits with the Bank.In general, the Bank matches 50% of qualifying contributions whichis expensed in salaries and employee benefits. During 2005, theBank’s contributions totalled $26 million (2004 – $26 million; 2003– $24 million). Contributions, which are used by the plan trustee topurchase common shares in the open market, do not result in asubsequent expense to the Bank from share price appreciation.
(c) Other stock-based compensation plans
All other stock-based compensation plans use notional units that arevalued based on the Bank’s common share price on the TSX. Theseunits, with the exception of Stock Appreciation Rights (SARs), accu-mulate dividend equivalents in the form of additional units based onthe dividends paid on the Bank’s common shares. Fluctuations in theBank’s share price change the value of the units, which affects theBank’s stock-based compensation expense. As described below, thevalue of a portion of the Performance Share Unit notional units alsovaries based on Bank performance. Upon exercise or redemption,payments are made to the employees with a corresponding reduc-tion in the accrued liability. In 2005, an aggregate expense of $140million (2004 – $174 million; 2003 – $119 million) was recorded insalaries and employee benefits in the Consolidated Statement ofIncome for changes in the amount of the Bank’s liability for theseunits. This expense was net of gains arising from securities andderivatives used to manage the volatility of stock-based compensa-tion of $94 million (2004 – $138 million; 2003 – $113 million) andother items. Details of these plans are as follows:
Stock Appreciation Rights (SARs)The SARs include Tandem SARs, as described above, as well asstand-alone SARs which are granted instead of stock options toselected employees in countries where local laws may restrict theBank from issuing shares. SARs have vesting and exercise terms andconditions similar to the employee stock options. The cost of SARs isrecognized on a graded vesting basis. When a SAR is exercised, theBank pays the appreciation amount in cash equal to the rise in themarket price of the Bank’s common shares since the grant date.During fiscal 2005, 2,212,980 SARs were granted (2004 –2,830,312; 2003 – 5,368,824) and as at October 31, 2005,23,148,386 SARs were outstanding (2004 – 24,115,260; 2003 –23,661,894), of which 13,611,252 SARs were vested (2004 –11,278,066; 2003 – 8,564,344).
Deferred Stock Unit Plan (DSU)Under the DSU Plan, senior officers may elect to receive all or aportion of their cash bonus under the Management Incentive Plan(which is expensed for the year awarded in salaries and employeebenefits in the Consolidated Statement of Income) in the form ofdeferred stock units which vest immediately. Units are redeemable,in cash, only when an officer ceases to be a Bank employee andmust be redeemed by December 31 of the year following thatevent. As at October 31, 2005, there were 1,581,240 unitsoutstanding (2004 – 2,160,146; 2003 – 1,798,382).
Directors’ Deferred Stock Unit Plan (DDSU)Under the DDSU Plan, non-employee directors of the Bank mayelect to receive all or a portion of their fee for that fiscal year (whichis expensed by the Bank in other expenses in the ConsolidatedStatement of Income) in the form of deferred stock units which vestimmediately. Units are redeemable, in cash, only following resigna-tion or retirement and must be redeemed by December 31 of theyear following that event. As at October 31, 2005, there were145,593 units outstanding (2004 – 114,774; 2003 – 94,096).
Restricted Share Unit Plan (RSU)Under the RSU Plan, selected employees receive an award ofrestricted share units which vest at the end of three years. Thestock-based compensation expense is recognized evenly over thethree-year vesting period, at which time the units are paid, in cash,to the employee. As at October 31, 2005, there were 5,179,850units (2004 – 5,281,075; 2003 – 3,289,900) awarded andoutstanding of which none were vested.
Performance Share Unit Plan (PSU)In 2004, the Bank introduced the PSU Plan for eligible executives.PSU awards vest at the end of three years and a portion of the PSUawards are subject to performance criteria measured over a three-year period. The three-year performance measures include return onequity compared to target and total shareholder return relative tothe other major Canadian banks. The stock-based compensationexpense is recognized evenly over the three-year vesting period, andvaries based on performance compared to the performance meas-ures. Upon vesting, the units are paid, in cash, to the employee. Asat October 31, 2005, there were 1,279,483 units awarded andoutstanding (including 423,177 units subject to performancecriteria) of which none were vested.
Scotia Capital Deferred Payment PlanUnder the Scotia Capital Deferred Payment Plan, a portion of thebonus received by certain employees (which is accrued andexpensed in the year to which it relates) is allocated to employees inthe form of units. These units are subsequently paid, in cash, to thequalifying employees over each of the following three years.
Changes in the value of the units, which arise from fluctuationsin the market price of the Bank’s common shares, are expensed inthe same manner as the Bank’s other stock-based compensationplans in salaries and employee benefits expense in the ConsolidatedStatement of Income.
Prior to fiscal 2003, the deferred payment was held in a trust,which purchased common shares of the Bank in the open market.As a result, there was no subsequent expense to the Bank fromshare price appreciation.
CONSOLIDATED FINANCIAL STATEMENTS
1 1 2 S c o t i a b a n k 2 0 0 5 A n n u a l R e p o r t

CONSOLIDATED FINANCIAL STATEMENTS
S c o t i a b a n k 2 0 0 5 A n n u a l R e p o r t 1 1 3
Corporate income taxes recorded in the Bank’s consolidated financial statements for the years ended October 31 are as follows:
16. Corporate income taxes
(a) Components of income tax provisionFor the year ended October 31 ($ millions) 2005 2004 2003
Provision for income taxes in the Consolidated Statement of Income:Current $ 1,078 $ 873 $ 885Future (231) (87) (108)
847 786 777Provision for future income taxes in the Consolidated Statement of
Changes in Shareholders’ Equity (3) (1) 26Total provision for income taxes $ 844 $ 785 $ 803
Current income taxes:Domestic:
Federal $ 377 $ 210 $ 303Provincial 213 182 206
Foreign 488 481 3761,078 873 885
Future income taxes:Domestic:
Federal (198) (52) (48)Provincial (45) (7) (52)
Foreign 9 (29) 18(234) (88) (82)
Total provision for income taxes $ 844 $ 785 $ 803
(b) Reconciliation to statutory rateIncome taxes in the Consolidated Statement of Income vary from the amounts that would be computed by applying the composite federaland provincial statutory income tax rate for the following reasons:
2005 2004 2003Percent of Percent of Percent of
pre-tax pre-tax pre-taxFor the year ended October 31 ($ millions) Amount income Amount income Amount income
Income taxes at statutory rate $ 1,443 35.0% $ 1,325 35.2% $ 1,222 36.4%Increase (decrease) in income taxes resulting from:
Lower average tax rate applicable tosubsidiaries and foreign branches (370) (9.0) (257) (6.8) (233) (6.9)
Tax-exempt income from securities (210) (5.1) (235) (6.2) (197) (5.9)Future income tax effect of substantively
enacted tax rate changes 15 0.4 (22) (0.6) 25 0.7Other, net (31) (0.8) (25) (0.8) (40) (1.2)
Total income taxes and effective tax rate $ 847 20.5% $ 786 20.8% $ 777 23.1%
(c) Future income taxesThe tax-effected temporary differences which result in future income tax assets and (liabilities) are as follows:
As at October 31 ($ millions) 2005 2004
Allowance for credit losses $ 659 $ 604Deferred compensation 301 219Deferred income 82 105Loss carryforwards(1) 105 96Loss on disposal of subsidiary operations 87 87Premises and equipment (64) (73)Securities (58) (81)Pension fund (177) (165)Other 298 207Net future income taxes(2) $ 1,233 $ 999
(1) Includes a gross future tax asset of $180 as at October 31, 2005 (2004 – $180), relating to subsidiaries’ unused income tax losses arising in prior years. This future taxasset has been reduced by a valuation allowance of $75 (2004 – $84), resulting in a net future tax asset of $105 (2004 – $96).
(2) Net future income taxes of $1,233 (2004 – $999) are represented by future income tax assets of $1,295 (2004 – $1,055), net of future income tax liabilities of $62 (2004 – $56).
Earnings of certain international subsidiaries are subject to tax only upontheir repatriation to Canada. As repatriation is not currently planned inthe foreseeable future, the Bank has not recognized a future income tax
liability. If all international subsidiaries’ unremitted earnings were repatri-ated, taxes that would be payable as at October 31, 2005, are esti-mated to be $360 million (October 31, 2004 – $308 million).

The Bank sponsors a number of employee future benefit plans,including pensions and other post-retirement benefits, post-employ-ment benefits and compensated absences for most of its employeesglobally. The following tables present financial information related
to the Bank’s principal plans. The principal plans include pensionand other benefit plans in Canada, the U.S., Mexico, Jamaica andthe U.K.(1)
CONSOLIDATED FINANCIAL STATEMENTS
1 1 4 S c o t i a b a n k 2 0 0 5 A n n u a l R e p o r t
17. Employee future benefits
Pension plans Other benefit plansFor the year ended October 31 ($ millions) 2005 2004 2003 2005 2004 2003
Change in benefit obligationBenefit obligation at beginning of year $ 3,790 $ 3,524 $ 3,158 $ 808 $ 747 $ 663Cost of benefits earned in the year 116 105 91 36 36 31Interest cost on benefit obligation 250 239 226 55 51 48Employee contributions 9 9 8 – – –Benefits paid (175) (162) (143) (48) (42) (41)Actuarial loss 560 136 243 200 40 91Non-routine events(2) 36 (15) 52 (10) (1) –Foreign exchange (18) (46) (111) – (23) (45)Benefit obligation at end of year $ 4,568 $ 3,790 $ 3,524 $ 1,041 $ 808 $ 747
Change in fair value of assetsFair value of assets at beginning of year $ 4,097 $ 3,706 $ 3,627 $ 162 $ 162 $ 178Actual return on assets 702 540 325 17 12 13Employer contributions 157 77 44 73 41 36Employee contributions 9 9 8 – – –Benefits paid (175) (162) (143) (48) (42) (41)Non-routine events(2) – (12) – – – –Foreign exchange (25) (61) (155) 3 (11) (24)Fair value of assets at end of year(3) $ 4,765 $ 4,097 $ 3,706 $ 207 $ 162 $ 162
Funded statusExcess (deficit) of fair value of assets over benefit
obligation at end of year $ 197 $ 307 $ 182 $ (834) $ (646) $ (585)Unrecognized net actuarial loss 780 663 825 366 180 152Unrecognized past service costs 81 63 73 (6) (6) (7)Unrecognized transitional obligation (asset) (411) (460) (510) 229 267 294Valuation allowance (182) (171) (155) – – –Employer contributions after measurement date 90 129 27 7 19 9Net prepaid (accrued) benefit expense at end of year $ 555 $ 531 $ 442 $ (238) $ (186) $ (137)Recorded in:Other assets in the Bank’s Consolidated Balance Sheet 729 676 583 10 4 –Other liabilities in the Bank’s Consolidated Balance Sheet (174) (145) (141) (248) (190) (137)Net prepaid (accrued) benefit expense at end of year $ 555 $ 531 $ 442 $ (238) $ (186) $ (137)
Annual benefit expenseCost of benefits earned in the year $ 116 $ 105 $ 91 $ 36 $ 36 $ 31Interest cost on benefit obligation 250 239 226 55 51 48Actual return on assets (702) (540) (325) (17) (12) (13)Actuarial loss on benefit obligation 560 136 243 200 40 91Non-routine events(2) 36 (3) 52 (10) (1) –Elements of employee future benefit costs (income) before
adjustments to recognize the long-term nature ofemployee future benefit costs 260 (63) 287 264 114 157
Adjustments to recognize the long-term nature ofemployee future benefit costs:Difference between expected return and actual return
on plan assets 412 272 50 6 – (1)Difference between net actuarial loss recognized
and actual actuarial loss on benefit obligation (528) (105) (242) (193) (33) (89)Difference between amortization of non-routine
events and actual non-routine events (28) 9 (50) 10 – (1)Amortization to recognize transitional obligation (asset) (44) (43) (44) 19 23 24
(188) 133 (286) (158) (10) (67)Valuation allowance provided against prepaid benefit expense 11 16 22 – – –Benefit expense recognized $ 83 $ 86 $ 23 $ 106 $ 104 $ 90(1) Other plans operated by certain subsidiaries of the Bank are not considered material and are not included in these disclosures.(2) Non-routine events include plan amendments, acquisitions, divestitures, transfers, etc.(3) The fair value of pension plan assets invested in common shares of the Bank totalled $540 (2004 – $498; 2003 – $405).

CONSOLIDATED FINANCIAL STATEMENTS
S c o t i a b a n k 2 0 0 5 A n n u a l R e p o r t 1 1 5
Included in the benefit obligation and fair value of assets are the following amounts in respect of plans that are not fully funded:
Pension plans Other benefit plans
For the year ended October 31 ($ millions) 2005 2004 2003 2005 2004 2003
Benefit obligation(1) $ 787 $ 830 $ 821 $ 1,041 $ 808 $ 747Fair value of assets 379 497 451 207 162 162Deficit of fair value of assets over benefit obligation $ (408) $ (333) $ (370) $ (834) $ (646) $ (585)
(1) Includes the benefit obligation of $278 at the end of 2005 (2004 – $230; 2003 – $228) related to supplemental unfunded pension arrangements.
Key weighted-average assumptions (%)(1)
The key weighted-average assumptions used by the Bank for the measurement of the benefit obligation and benefit expense are summa-rized as follows:
Pension plans Other benefit plans
For the year ended October 31 2005 2004 2003 2005 2004 2003
To determine benefit obligation at end of yearDiscount rate 5.50% 6.50% 6.75% 5.75% 6.90% 6.85%Rate of increase in future compensation 3.55% 3.75% 3.95% 3.85% 4.00% 4.00%
To determine benefit expense (income) for the yearDiscount rate 6.50% 6.50% 7.25% 6.90% 6.85% 7.40%Assumed long-term rate of return on assets 7.25% 7.25% 7.25% 7.30% 7.60% 8.50%Rate of increase in future compensation 3.75% 3.95% 4.05% 4.00% 4.00% 3.90%
Health care cost trend rates at end of yearInitial rate n/a n/a n/a 8.90% 8.10% 7.40%Ultimate rate n/a n/a n/a 4.60% 4.90% 4.60%Year ultimate rate reached n/a n/a n/a 2014 2011 2009
(1) Includes international plans which generally have higher rates than Canadian plans. The discount rate used to determine the 2005 benefit expense for the main pensionplan was 6.25% (2004 – 6.50%; 2003 – 7.00%) and the discount rate for the other Canadian pension and benefit plans was 6.50% (2004 – 6.50%; 2003 – 7.00%).The discount rate for the 2005 end of year benefit obligation was 5.25% for all Canadian pension and other benefit plans (2004 – 6.25% for the main pension planand 6.50% for the other Canadian pension and benefit plans; 2003 – 6.50% for all Canadian pension and other benefit plans); and the assumed long-term rate ofreturn on assets for all Canadian pension plans was 7.0% (2004 – 7.00%; 2003 – 7.00%).
Sensitivity analysisPension plans Other benefit plans
For the year ended October 31, 2005 ($ millions) Benefit obligation Benefit expense Benefit obligation Benefit expense
Impact of 1% decrease in discount rate $ 831 $ 67 $ 165 $ 14Impact of 1% decrease in assumed long-term rate of return on assets – 36 n/a 2Impact of 0.25% increase in rate of increase in future compensation 54 7 1 –Impact of 1% increase in health care cost trend rate n/a n/a 125 15Impact of 1% decrease in health care cost trend rate n/a n/a (94) (12)
Assets
The Bank’s principal plans’ weighted-average asset allocations at the measurement date, by asset category, are as follows:Pension plans Other benefit plans
Asset category 2005 2004 2003 2005 2004 2003
Equity investments 66% 67% 65% 15% 13% 10%Fixed income investments 33% 32% 35% 85% 87% 90%Other 1% 1% – – – –Total 100% 100% 100% 100% 100% 100%
Actuarial valuationsActuarial valuations for the Bank’s principal pension plans are generally required every three years. The most recent actuarial valuation of theBank’s main pension plan was conducted as of November 1, 2003, and the date of the next required valuation is November 1, 2006 (thisplan accounts for 69% of principal pension plans’ benefit obligation and 70% of principal pension plans’ fair value of assets). The Bank maychoose to perform a valuation at another date, which is earlier than November 1, 2006. Actuarial valuations for the Bank’s principal otherbenefit plans are generally carried out every two to three years, with the most recent valuation completed as of July 31, 2005 for the otherpost-retirement benefits and July 31, 2004 for post-employment benefits. The next actuarial valuations are currently scheduled in 2008 and2006, respectively.
Cash payments and contributionsIn fiscal year 2005, the Bank made cash payments of $118 million (2004 – $179 million; 2003 – $68 million) to fund the principal pensionplans, including the payment of benefits to beneficiaries under the unfunded pension arrangements. The Bank also made cash payments of$61 million (2004 – $51 million; 2003 – $37 million) during the year to the principal other benefit plans, primarily in respect of benefitpayments to beneficiaries under these plans.

CONSOLIDATED FINANCIAL STATEMENTS
1 1 6 S c o t i a b a n k 2 0 0 5 A n n u a l R e p o r t
Scotiabank is a diversified financial services institution that providesa wide range of financial products and services to retail, commercialand corporate customers around the world. The Bank is organizedinto three main operating segments: Domestic Banking, Interna-tional Banking, and Scotia Capital.
Domestic Banking, including wealth management operations,provides a comprehensive array of retail and commercial bankingservices through branch and electronic delivery channels, to individ-uals and small to medium-sized businesses in Canada. The retailservices include consumer and mortgage lending, credit and debitcard services, savings, chequing and retirement products, personaltrust services, retail brokerage, mutual funds and transaction serv-ices. In addition to credit, commercial clients are provided withdeposit and cash management services.
International Banking supplies retail and commercial bankingservices through branches, subsidiaries and foreign affiliates. Theproducts, services and channels offered are generally the same asthose in Domestic Banking.
Scotia Capital is an integrated corporate and investment bankwhich services the credit, capital market and risk managementneeds of the Bank’s global relationships with large corporations,financial institutions and governments. The services provided includecredit and related products, debt and equity underwriting, foreign
exchange, derivative products, precious metals products and finan-cial advisory services. Also, it conducts trading activities for its ownaccount and provides short-term Canadian dollar funding for the Bank.
The Other category represents smaller operating segments,including Group Treasury and other corporate items, which are notallocated to an operating segment.
The results of these business segments are based upon the internalfinancial reporting systems of the Bank. The accounting policies used inthese segments are generally consistent with those followed in thepreparation of the consolidated financial statements as disclosed inNote 1. The only notable accounting measurement difference is thegrossing up of tax-exempt net interest income to an equivalent before-tax basis for those affected segments. This change in measurementenables comparison of net interest income arising from taxable andtax-exempt sources.
Because of the complexity of the Bank, various estimates and allo-cation methodologies are used in the preparation of the businesssegment financial information. The assets and liabilities are transfer-priced at wholesale market rates, and corporate expenses are allocatedto each segment based on utilization. As well, capital is apportioned tothe business segments on a risk-based methodology. Transactionsbetween segments are recorded within segment results as if conductedwith a third party and are eliminated on consolidation.
18. Earnings per common share
For the year ended October 31 ($ millions) 2005 2004(1) 2003(1)(2)
Basic earnings per common shareNet income $ 3,209 $ 2,908 $ 2,422Preferred dividends paid 25 16 16Net income available to common shareholders $ 3,184 $ 2,892 $ 2,406
Average number of common shares outstanding (millions) 998 1,010 1,010
Basic earnings per common share(3) $ 3.19 $ 2.87 $ 2.38
Diluted earnings per common shareNet income available to common shareholders $ 3,184 $ 2,892 $ 2,406
Average number of common shares outstanding (millions) 998 1,010 1,010Stock options potentially exercisable (millions)(4) 14 16 16Average number of diluted common shares outstanding (millions)(5) 1,012 1,026 1,026
Diluted earnings per common share(3) $ 3.15 $ 2.82 $ 2.34
(1) Certain comparative amounts have been retroactively restated for new CICA accounting requirements relating to the distinction between equity and liability instruments.(2) Amounts have been retroactively adjusted to reflect the stock dividend paid April 28, 2004, of one common share for each issued and outstanding common share.
The stock dividend had the same effect as a two-for-one stock split.(3) Earnings per share calculations are based on full dollar and share amounts.(4) Reflects the potential dilutive effect of stock options granted under the Bank’s Stock Option Plans as determined under the treasury stock method.
Excludes options with Tandem SAR features as these options are expensed and booked as liabilities. All other stock options are included in the computation.(5) Certain convertible instruments have not been included in the calculation since the Bank has the right to redeem them for cash prior to conversion date.
19. Related party transactions
In the ordinary course of business, the Bank provides normalbanking services to its associated and other related corporations onterms similar to those offered to non-related parties.
In Canada, loans are currently granted to directors, officers andemployees at market terms and conditions. In some of the Bank’sforeign subsidiaries and branches, in accordance with local practicesand laws, loans may be made available to officers and employees ofthose foreign units at reduced rates or on preferred terms. EffectiveMarch 1, 2001, the Bank discontinued the practice of granting
loans to officers and employees in Canada at reduced rates. Any ofthese loans granted prior to March 1, 2001 are grandfathered untilmaturity.
Directors can use some or all of their director fees earned tobuy common shares of the Bank at market rates through theDirectors’ Share Purchase Plan. Commencing in fiscal 2004, theBank no longer grants stock options to non-officer Directors [referto Note 15 – Stock-based compensation].
20. Segmented results of operations

CONSOLIDATED FINANCIAL STATEMENTS
S c o t i a b a n k 2 0 0 5 A n n u a l R e p o r t 1 1 7
For the year ended October 31, 2005 ($ millions)Domestic International Scotia
Taxable equivalent basis Banking Banking Capital Other(1) Total
Net interest income $ 3,576 $ 1,969 $ 849 $ (523) $ 5,871
Provision for credit losses 274 70 (71) (43) 230
Other income 1,819 793 1,320 597 4,529
Net interest and other income 5,121 2,692 2,240 117 10,170
Depreciation and amortization 130 50 20 2 202
Other non-interest expenses 3,166 1,662 909 104 5,841
Income before the undernoted: 1,825 980 1,311 11 4,127
Provision for income taxes 566 103 390 (212) 847Non-controlling interest in net income of subsidiaries – 71 – – 71
Net income $ 1,259 $ 806 $ 921 $ 223 $ 3,209
Preferred dividends paid 6 6 6 7 25
Net income available to common shareholders(2) $ 1,253 $ 800 $ 915 $ 216 $ 3,184
Total average assets ($ billions) $ 123 $ 50 $ 112 $ 24 $ 309
For the year ended October 31, 2004 ($ millions)Domestic International Scotia
Taxable equivalent basis Banking Banking Capital Other(1) Total
Net interest income $ 3,494 $ 1,858 $ 937 $ (588) $ 5,701
Provision for credit losses 317 70 106 (103) 390
Other income 1,671 741 1,227 681 4,320
Net interest and other income 4,848 2,529 2,058 196 9,631
Depreciation and amortization 137 57 21 1 216
Other non-interest expenses 3,080 1,549 939 78 5,646
Income before the undernoted: 1,631 923 1,098 117 3,769Provision for income taxes 522 126 275 (137) 786Non-controlling interest in net income of subsidiaries – 75 – – 75
Net income $ 1,109 $ 722 $ 823 $ 254 $ 2,908
Preferred dividends paid 4 4 4 4 16
Net income available to common shareholders(2) $ 1,105 $ 718 $ 819 $ 250 $ 2,892
Total average assets ($ billions) $ 112 $ 49 $ 109 $ 14 $ 284
For the year ended October 31, 2003 ($ millions)Domestic International Scotia
Taxable equivalent basis Banking Banking Capital Other(1) Total
Net interest income $ 3,430 $ 1,987 $ 1,179 $ (628) $ 5,968
Provision for credit losses 272 73 549 (1) 893
Other income 1,528 776 1,289 422 4,015
Net interest and other income 4,686 2,690 1,919 (205) 9,090
Depreciation and amortization 150 66 20 1 237
Other non-interest expenses 2,926 1,591 966 11 5,494
Income before the undernoted: 1,610 1,033 933 (217) 3,359
Provision for income taxes 547 233 262 (265) 777Non-controlling interest in net income of subsidiaries – 160 – – 160
Net income $ 1,063 $ 640 $ 671 $ 48 $ 2,422
Preferred dividends paid 4 4 6 2 16
Net income available to common shareholders(2) $ 1,059 $ 636 $ 665 $ 46 $ 2,406
Total average assets ($ billions) $ 101 $ 52 $ 119 $ 17 $ 289
(1) Includes revenues from all other smaller operating segments of $432 in 2005 (2004 – $445; 2003 – $231), and net income available to common shareholders of $274in 2005 (2004 – $266; 2003 – $125). As well, includes corporate adjustments such as the elimination of the tax-exempt income gross-up reported in net interest incomeand provision for income taxes of $326 (2004 – $274; 2003 – $278), changes in the general allowance, differences in the actual amount of costs incurred and chargedto the operating segments, and the impact of securitizations.
(2) Commencing in 2005, the measure of segment profitability has been changed from net income to net income available to common shareholders. Prior periods havebeen restated.

CONSOLIDATED FINANCIAL STATEMENTS
1 1 8 S c o t i a b a n k 2 0 0 5 A n n u a l R e p o r t
Geographical segmentation(1)
The following table summarizes the Bank’s financial results by geographic region. Revenues and expenses which have not been allocatedback to specific operating business lines are reflected in corporate adjustments.
United OtherFor the year ended October 31, 2005 ($ millions) Canada States International Total
Net interest income $ 3,808 $ 199 $ 2,128 $ 6,135Provision for credit losses 262 (93) 104 273Other income 2,737 484 1,079 4,300Non-interest expenses 3,917 246 1,854 6,017Provision for income taxes 450 216 143 809Non-controlling interest in net income of subsidiaries – – 71 71
Preferred dividends paid 9 2 8 19
$ 1,907 $ 312 $ 1,027 $ 3,246
Corporate adjustments (62)
Net income available to common shareholders(2) $ 3,184
Total average assets ($ billions) $ 205 $ 25 $ 76 $ 306
Corporate adjustments 3Total average assets, including corporate adjustments $ 309
United OtherFor the year ended October 31, 2004 ($ millions) Canada States International Total
Net interest income $ 3,624 $ 334 $ 2,040 $ 5,998Provision for credit losses 303 54 136 493Other income 2,495 513 1,058 4,066Non-interest expenses 3,794 262 1,776 5,832Provision for income taxes 384 194 187 765Non-controlling interest in net income of subsidiaries – – 75 75
Preferred dividends paid 6 2 4 12
$ 1,632 $ 335 $ 920 $ 2,887
Corporate adjustments 5
Net income available to common shareholders(2) $ 2,892
Total average assets ($ billions) $ 188 $ 21 $ 73 $ 282
Corporate adjustments 2Total average assets, including corporate adjustments $ 284
United OtherFor the year ended October 31, 2003 ($ millions) Canada States International Total
Net interest income $ 3,586 $ 548 $ 2,194 $ 6,328Provision for credit losses 396 270 228 894Other income 2,377 448 967 3,792Non-interest expenses 3,623 311 1,825 5,759Provision for income taxes 423 165 233 821Non-controlling interest in net income of subsidiaries – – 160 160
Preferred dividends paid 6 3 5 14
$ 1,515 $ 247 $ 710 $ 2,472
Corporate adjustments (66)
Net income available to common shareholders(2) $ 2,406
Total average assets ($ billions) $ 176 $ 34 $ 75 $ 285
Corporate adjustments 4Total average assets, including corporate adjustments $ 289
(1) Revenues are attributed to countries based on where services are performed or assets are recorded.(2) Refer to footnote 2 on the previous page.

CONSOLIDATED FINANCIAL STATEMENTS
S c o t i a b a n k 2 0 0 5 A n n u a l R e p o r t 1 1 9
Standby letters of credit and letters of guaranteeStandby letters of credit and letters of guarantee are issued at therequest of a Bank customer in order to secure the customer’s paymentor performance obligations to a third party. These guarantees repre-sent an irrevocable obligation of the Bank to pay the third-party bene-ficiary upon presentation of the guarantee and satisfaction of thedocumentary requirements stipulated therein, without investigation asto the validity of the beneficiary’s claim against the customer. Gener-ally, the term of these guarantees does not exceed four years. Thetypes and amounts of collateral security held by the Bank for theseguarantees is generally the same as for loans.
Credit enhancementsThe Bank provides partial credit enhancements, in the form of finan-cial standby letters of credit, to commercial paper conduits, adminis-tered by the Bank and by third parties. As at October 31, 2005,these credit enhancements amounted to $27 million (2004 – $846million) and are included within standby letters of credit and lettersof guarantee in the above table. The credit enhancements areprovided to ensure a high investment grade credit rating is achievedfor notes issued by the conduits. Generally, these facilities have aterm of up to one year. No amounts have been recorded in theConsolidated Balance Sheet with respect to these facilities.
Liquidity facilitiesThe Bank provides backstop liquidity facilities to asset-backedcommercial paper conduits, administered by the Bank and by thirdparties. These facilities provide an alternative source of financing, inthe event market disruption prevents the conduit from issuingcommercial paper or, in some cases, when certain specified condi-tions or performance measures are not met. Generally, these facili-ties have a term of up to one year.
Derivative instrumentsThe Bank enters into written credit derivative contracts under which acounterparty is compensated for losses on a specified referenced asset,typically a loan or bond, if a default or other defined triggering eventoccurs. The Bank also enters into written option contracts under whicha counterparty is granted the right, but not the obligation, to sell aspecified quantity of a financial instrument at a pre-determined priceon or before a set date. These written option contracts are normallyreferenced to interest rates, foreign exchange rates or equity prices.Typically, a corporate or government entity is the counterparty to the
written credit derivative and option contracts that meet the characteris-tics of guarantees described above. The maximum potential amount offuture payments disclosed in the table above relates to written creditderivatives, puts and floors. However, these amounts exclude certainderivatives contracts, such as written caps, as the nature of thesecontracts prevents quantification of the maximum potential amount offuture payments.
SecuritizationsThe Bank’s revolving securitization agreements may require paymentsto be made to the trusts under certain limited circumstances. Theseguarantees will be outstanding for the remaining term to maturity ofthe trusts’ securitization notes, which is on average 16 months. Thesepayments are contingent on failure to maintain a minimum pool sizedue to the occurrence of certain limited predefined events.
IndemnificationsIn the ordinary course of business, the Bank enters into many contractswhich contain indemnification provisions, such as purchase contracts,service agreements, trademark licensing agreements, escrow arrange-ments, sales of assets or businesses, outsourcing agreements, leasingarrangements, clearing system arrangements, securities lending agencyagreements and structured transactions. In such contracts, the Bankmay indemnify counterparties to the contracts for certain aspects ofthe Bank’s past conduct if other parties fail to perform, or if certainevents occur, such as changes in laws and regulations (including taxlegislation), changes in financial condition of third parties, infringe-ments and breaches of representations and warranties, undisclosedliabilities, and loss caused by the actions of third parties, or as a resultof litigation claims by third parties. These indemnification provisionswill vary based upon the contract. In certain types of arrangements,the Bank may in turn obtain indemnifications from other parties to thearrangement or may have access to collateral under recourse provi-sions. In many cases, there are no pre-determined amounts or limitsincluded in these indemnification provisions and the occurrence ofcontingent events that will trigger payment under them is difficult topredict. Therefore, the Bank cannot estimate in all cases the maximumpotential future amount that may be payable, nor the amount ofcollateral or assets available under recourse provisions that would miti-gate any such payments. Historically, the Bank has not made anysignificant payments under these indemnities. As at October 31, 2005,$13 million (2004 – $9 million) was included in other liabilities in theConsolidated Balance Sheet with respect to indemnifications.
21. Guarantees, commitments and contingent liabilities(a) GuaranteesA guarantee is a contract that contingently requires the guarantor to make payments to a third party based on (i) changes in an underlying interestrate, foreign exchange rate or other variable, including the occurrence or non-occurrence of an event, that is related to an asset, liability or equitysecurity held by the guaranteed party, (ii) an indemnification provided to the third party with the characteristics listed above, (iii) another entity’sfailure to perform under an obligating agreement, or (iv) another entity’s failure to perform related to its indebtedness. The various guarantees andindemnifications that the Bank provides to its customers and other third parties are presented below.
2005 2004
Maximum potential Maximum potentialamount of future Carrying amount of future Carrying
As at October 31 ($ millions) payments(1) value payments(1) value
Standby letters of credit and letters of guarantee $ 15,777 $ 6 $ 14,417 $ –Liquidity facilities 7,728 – 14,577 –Derivative instruments 1,042 47 4,500 42Securitizations 809 – 1,319 –Indemnifications 555 13 495 9Other guarantees 1 – 1 –
(1) The maximum potential amount of future payments represents those guarantees that can be quantified and excludes other guarantees that cannot be quantified. As manyof these guarantees will not be drawn upon and the maximum potential amount of future payments listed above does not consider the possibility of recovery underrecourse or collateral provisions, the above amounts are not indicative of future cash requirements, credit risk, or the Bank’s expected losses from these arrangements.

CONSOLIDATED FINANCIAL STATEMENTS
1 2 0 S c o t i a b a n k 2 0 0 5 A n n u a l R e p o r t
(b) Other indirect commitmentsIn the normal course of business, various other indirect commit-ments are outstanding which are not reflected on the ConsolidatedBalance Sheet. These may include:– Commercial letters of credit which require the Bank to honour drafts
presented by a third party when specific activities are completed;– Commitments to extend credit which represent undertakings to
make credit available in the form of loans or other financings forspecific amounts and maturities, subject to specific conditions;
– Securities lending transactions under which the Bank, acting asprincipal or agent, agrees to lend securities to a borrower. Theborrower must fully collateralize the security loan at all times.The market value of the collateral is monitored relative to theamounts due under the agreements, and where necessary,additional collateral is obtained;
– Security purchase commitments which require the Bank to fundfuture investments.
These financial instruments are subject to normal credit standards,financial controls and monitoring procedures.
The table below provides a detailed breakdown of the Bank’s other indirect commitments expressed in terms of the contractual amounts ofthe related commitment or contract which are not reflected on the Consolidated Balance Sheet.
As at October 31 ($ millions) 2005(1) 2004
Commercial letters of credit $ 937 $ 849Commitments to extend credit:
Original term to maturity of one year or less 57,574 67,038Original term to maturity of more than one year 42,335 37,129
Securities lending 6,675 2,639Security purchase and other commitments 1,747 1,380Total $ 109,268 $ 109,035
(1) Amounts relating to variable interest entities are disclosed in Note 6.
(c) Lease commitments and other executory contractsMinimum future rental commitments at October 31, 2005, for buildings and equipment under long-term, non-cancellable leases are shown below.
For the year ($ millions)
2006 $ 1522007 1252008 1022009 812010 612011 and thereafter 194Total $ 715
Building rent expense, net of rental income from subleases, included in the Consolidated Statement of Income was $176 million (2004 –$170 million; 2003 – $180 million).
In addition, the Bank and its subsidiaries have entered into certain long-term executory contracts relating to outsourced services. Thesignificant outsourcing arrangements have variable pricing based on utilization and are cancellable with notice.
(d) Assets pledged and repurchase agreementsIn the ordinary course of business, securities and other assets are pledged against liabilities. As well, securities are sold under repurchaseagreements. Details of these assets are shown below.
As at October 31 ($ millions) 2005 2004
Assets pledged to:Bank of Canada(1) $ 25 $ 60Foreign governments and central banks(1) 2,799 2,394Clearing systems, payment systems and depositories(1) 1,412 927
Assets pledged in relation to exchange-traded derivative transactions 148 131Assets pledged as collateral related to securities borrowed, and securities lent 15,883 7,878Assets pledged in relation to over-the-counter derivative transactions 1,366 2,515
Total assets pledged 21,633 13,905Securities sold under repurchase agreements 26,032 19,428Total $ 47,665 $ 33,333
(1) Includes assets pledged in order to participate in clearing and payment systems and depositories, or to have access to the facilities of central banks in foreign jurisdictions.
(e) LitigationIn the ordinary course of business, the Bank and its subsidiaries areroutinely defendants in or parties to a number of pending andthreatened legal actions and proceedings, including actions broughton behalf of various classes of claimants.
In view of the inherent difficulty of predicting the outcome ofsuch matters, the Bank cannot state what the eventual outcome of
such matters will be; however, based on current knowledge,management does not believe that liabilities, if any, arising frompending litigation will have a material adverse effect on theconsolidated financial position, or results of operations of the Bank.

CONSOLIDATED FINANCIAL STATEMENTS
S c o t i a b a n k 2 0 0 5 A n n u a l R e p o r t 1 2 1
Fair value amounts represent estimates of the consideration thatwould currently be agreed upon between knowledgeable, willingparties who are under no compulsion to act and is best evidencedby a quoted market price, if one exists. Many of the Bank’s financialinstruments lack an available trading market. Therefore, theseinstruments have been valued using present value or other valuationtechniques and may not necessarily be indicative of the amountsrealizable in an immediate settlement of the instruments. In addi-tion, the calculation of estimated fair value is based on market
conditions at a specific point in time and may not be reflective offuture fair values.
Changes in interest rates are the main cause of changes in thefair value of the Bank’s financial instruments. The majority of theBank’s financial instruments are carried at historical cost and are notadjusted to reflect increases or decreases in fair value due to marketfluctuations, including those due to interest rate changes. For thosefinancial instruments held for trading purposes, the carrying value isadjusted regularly to reflect the fair value.
22. Financial instruments(a) Fair value
The following table sets out the fair values of on-balance sheet financial instruments and derivative instruments of the Bank using the valua-tion methods and assumptions described below. The fair values disclosed do not reflect the value of assets and liabilities that are not consid-ered financial instruments, such as land, buildings and equipment.
2005 2004Total Total Favourable/ Total Total Favourable/
fair book (Unfavour- fair book (Unfavour-As at October 31 ($ millions) value value able) value value able)
Assets:Cash resources $ 20,505 $ 20,505 $ – $ 17,155 $ 17,155 $ –Securities 74,618 73,459 1,159(1) 60,127 58,773 1,354(1)
Loans 191,956 191,005 951 172,648 171,768 880Customers’ liability under acceptances 7,576 7,576 – 7,086 7,086 –Other 3,959 3,959 – 4,738 4,738 –
Liabilities:Deposits 218,002 217,445 (557) 195,946 195,196 (750)Acceptances 7,576 7,576 – 7,086 7,086 –Obligations related to securities sold under
repurchase agreements 26,032 26,032 – 19,428 19,428 –Obligations related to securities sold short 11,250 11,250 – 7,585 7,585 –Other 19,072 19,072 – 13,957 13,957 –Subordinated debentures 2,810 2,597 (213) 2,840 2,615 (225)Capital instrument liabilities 830 750 (80) 2,469 2,250 (219)
Derivatives (Note 23) (149) (137)(2) (12) (602) (514)(2) (88)
(1) This excludes net deferred hedge losses on securities of $109 (2004 – $221).(2) This represents a net liability.
Determination of fair value
The following methods and assumptions were used to estimate thefair values of on-balance sheet financial instruments.
The fair values of cash resources, securities purchased underresale agreements, customers’ liability under acceptances, otherassets, obligations related to securities sold under repurchase agree-ments, acceptances and other liabilities are assumed to approximatetheir carrying values, due to their short-term nature.
The fair value of securities is assumed to be equal to theestimated market value of securities provided in Note 3. The fairvalue of obligations related to securities sold short is assumed to beequal to their book value as they are carried at market value. Thesemarket values are based on quoted prices, when available. When aquoted price is not readily available, market values are estimatedusing quoted market prices of similar securities, or other valuationtechniques.
The book value of financial assets and financial liabilities held forpurposes other than trading may exceed their fair value dueprimarily to changes in interest rates. In such instances, the Bank
does not reduce the book value of these financial assets and finan-cial liabilities to their fair value as it is the Bank’s intention to holdthem to maturity.

(b) Interest rate risk
The following table summarizes carrying amounts of balance sheet assets, liabilities and equity, and off-balance sheet financial instruments inorder to arrive at the Bank’s interest rate gap based on the earlier of contractual repricing or maturity dates. To arrive at the Bank’s view of itseffective interest rate gap, adjustments are made to factor in expected mortgage and loan repayments based on historical patterns andexpected repricing of the Bank’s trading instruments.
Immediately Within Three to One to Over Non-rateAs at October 31, 2005 ($ millions) rate sensitive(1) 3 months 12 months 5 years 5 years sensitive Total
Cash resources $ 1,085 $ 11,414 $ 2,454 $ 32 $ – $ 5,520 $ 20,505Investment securities 150 9,071 1,879 5,139 4,462 2,751(2) 23,452Trading securities – 5,205 3,881 9,984 5,225 25,712 50,007Loans 24,744 91,011 21,160 50,860 3,879 (649)(3) 191,005Other assets – – – – – 29,056 (4) 29,056Total assets 25,979 116,701 29,374 66,015 13,566 62,390 314,025
Deposits 23,321 126,496 26,076 30,339 2,124 9,089 217,445Obligations related to securities
sold under repurchase agreements – 24,834 1,198 – – – 26,032Obligations related to
securities sold short – 481 925 4,841 3,609 1,394 11,250Subordinated debentures – – 552 1,545 500 – 2,597Capital instrument liabilities – – – 250 500 – 750Other liabilities – 4,631 90 – – 35,148 (4) 39,869Shareholders’ equity – – – – – 16,082 (4) 16,082Total liabilities and
shareholders’ equity 23,321 156,442 28,841 36,975 6,733 61,713 314,025On-balance sheet gap 2,658 (39,741) 533 29,040 6,833 677 –Off-balance sheet gap – (7,434) 98 8,423 (1,087) – –Interest rate sensitivity gap based
on contractual repricing 2,658 (47,175) 631 37,463 5,746 677 –Adjustment to expected repricing 11,176 38,261 (2,259) (24,412) (1,805) (20,961) –
Total interest rate sensitivity gap $ 13,834 $ (8,914) $ (1,628) $ 13,051 $ 3,941 $ (20,284) $ –Cumulative gap 13,834 4,920 3,292 16,343 20,284 – –
As at October 31, 2004
Total interest rate sensitivity gap $ 4,723 $ 2,872 $ (4,498) $ 14,996 $ 1,384 $ (19,477) $ –Cumulative gap 4,723 7,595 3,097 18,093 19,477 – –
(1) Represents those financial instruments whose interest rates change concurrently with a change in the underlying interest rate basis, for example, prime rate loans.(2) This includes financial instruments such as common shares, non-term preferred shares, and shares in associated corporations.(3) This includes net impaired loans and the general allowance.(4) This includes non-financial instruments.
The tables on the following page summarize average effective yields, by the earlier of the contractual repricing or maturity dates, for thefollowing on-balance sheet rate-sensitive financial instruments (these rates are shown before and after adjusting for the impact of relatedderivatives used by the Bank for asset/liability risk management purposes).
CONSOLIDATED FINANCIAL STATEMENTS
1 2 2 S c o t i a b a n k 2 0 0 5 A n n u a l R e p o r t
The estimated fair value of loans reflects changes in the generallevel of interest rates that have occurred since the loans were origi-nated. The particular valuation methods used are as follows:– For loans to designated emerging markets, fair value is based on
quoted market prices.– For floating rate loans, fair value is assumed to be equal to book
value as the interest rates on these loans automatically reprice tomarket.
– For all other loans, fair value is determined by discounting theexpected future cash flows of these loans at market rates forloans with similar terms and risks.
The fair values of deposits payable on demand or after notice orfloating rate deposits payable on a fixed date are assumed to beequal to their carrying values. The estimated fair values of fixed-ratedeposits payable on a fixed date are determined by discounting thecontractual cash flows, using market interest rates currently offeredfor deposits with similar terms and risks.
The fair values of subordinated debentures and capital instru-ment liabilities are determined by reference to quoted market prices.When quoted market prices are not available, fair values areestimated using current market prices for debt with similar termsand risks.

CONSOLIDATED FINANCIAL STATEMENTS
S c o t i a b a n k 2 0 0 5 A n n u a l R e p o r t 1 2 3
Average effective yields by the earlier of the contractual repricing or maturity dates:Unadjusted Adjusted
Immediately Within Three to One to OverAs at October 31, 2005 rate sensitive 3 months 12 months 5 years 5 years Total Total(1)
Cash resources 4.8% 4.0% 5.4% 4.1% –% 4.3% 4.3%Investment securities(2) 4.9 4.6 5.8 5.0 5.8 5.0 5.0Trading securities – 4.3 5.7 6.1 5.7 5.5 5.5Loans(3) 6.2 5.1 5.5 5.7 7.7 5.5 5.5
Deposits(4) 2.5 3.1 3.2 3.9 6.3 3.2 3.2Obligations related to
securities sold underrepurchase agreements(4) – 4.7 7.7 – – 4.9 4.9
Obligations related tosecurities sold short – 3.0 3.4 4.0 4.7 4.2 4.2
Subordinated debentures(4) – – 5.5 6.0 8.6 6.4 5.2Capital instrument liabilities(4) – – – 6.6 7.3 7.1 7.1Other liabilities – 3.9 4.0 – – 3.9 3.9
Unadjusted Adjusted
Immediately Within Three to One to OverAs at October 31, 2004 rate sensitive 3 months 12 months 5 years 5 years Total Total(1)
Cash resources 1.2% 3.2% 4.0% 4.0% –% 3.0% 3.0%Investment securities(2) 3.2 5.7 5.2 4.5 6.6 5.3 5.2Trading securities – 3.2 5.5 4.5 5.6 4.6 4.6Loans(3) 5.4 4.3 5.4 6.1 8.6 5.2 5.2
Deposits(4) 1.6 2.5 2.6 2.9 4.8 2.5 2.6Obligations related to
securities sold underrepurchase agreements(4) – 4.2 4.2 – – 4.2 4.2
Obligations related tosecurities sold short – 2.5 2.7 3.5 4.9 3.9 3.9
Subordinated debentures(4) – – 2.1 6.2 8.6 6.3 5.0Capital instrument liabilities(4) – – – 6.6 6.7 6.7 6.7
(1) After adjusting for the impact of related derivatives.(2) Yields are based on book values and contractual interest or stated dividend rates adjusted for amortization of premiums and discounts. Yields on tax-exempt securities
have not been computed on a taxable equivalent basis.(3) Yields are based on book values, net of allowance for credit losses, and contractual interest rates, adjusted for the amortization of any deferred income.(4) Yields are based on book values and contractual rates.
(c) Credit exposure
The following table summarizes the credit exposure of the Bank to businesses and governments, net of the allowance for credit losses.2005 2004
Loans and Derivative OtherAs at September 30 ($ millions) acceptances(1) instruments(2) exposures(3) Total Total
By sector:Resource and manufacturing, excluding automotive $ 18,409 $ 536 $ 4,565 $ 23,510 $ 22,853Finance and government 11,061 10,212 3,321 24,594 26,858Other 36,617 1,741 8,461 46,819 45,208Total $ 66,087 $ 12,489 $ 16,347 $ 94,923 $ 94,919General allowance(2)(4) 1,308 1,355
$ 93,615 $ 93,564
By geography(5):Canada $ 29,867 $ 6,316 $ 5,801 $ 41,984 $ 40,747United States 8,723 2,948 7,693 19,364 21,341Other International 27,497 3,225 2,853 33,575 32,831Total $ 66,087 $ 12,489 $ 16,347 $ 94,923 $ 94,919General allowance(2)(4) 1,308 1,355
$ 93,615 $ 93,564
(1) Excludes securities purchased under resale agreements.(2) Derivative instruments and general allowance are as at October 31.(3) Comprises guarantees and letters of credit.(4) The remaining $22 (2004 – $20) of the $1,330 (2004 – $1,375) general allowance relates to loans other than business and government loans.(5) Geographic segmentation is based upon the location of the ultimate risk of the credit exposure.

CONSOLIDATED FINANCIAL STATEMENTS
1 2 4 S c o t i a b a n k 2 0 0 5 A n n u a l R e p o r t
In its normal course of business, the Bank may decide to hedgeanticipatory transactions such as future foreign revenues and
expenses and planned deposit campaigns. As at October 31, 2005,and 2004, there were no material anticipatory hedges outstanding.
(d) Anticipatory hedges
23. Derivative instruments(a) Notional amounts
The following table provides the aggregate notional amounts of off-balance sheet derivative instruments outstanding by type and segregatedbetween those used by the Bank in its dealer capacity (Trading) and those used in the Bank’s asset/liability risk management process (ALM).The notional amounts of these contracts represent the derivatives volume outstanding and do not represent the potential gain or loss associ-ated with the market risk or credit risk of such instruments. The notional amounts represent the amount to which a rate or price is applied todetermine the amount of cash flows to be exchanged. Other derivative contracts – other includes precious metals other than gold, and basemetal derivatives.
2005 2004As at October 31 ($ millions) Trading ALM Total Trading ALM Total
Interest rate contractsExchange-traded:
Futures $ 58,526 $ 13,647 $ 72,173 $ 45,226 $ 14,744 $ 59,970Options purchased 8,568 – 8,568 14,838 – 14,838Options written – – – 4,454 – 4,454
67,094 13,647 80,741 64,518 14,744 79,262Over-the-counter:
Forward rate agreements 18,174 9,735 27,909 45,628 14,440 60,068Swaps 357,252 58,673 415,925 388,839 83,436 472,275Options purchased 21,978 4,751 26,729 31,714 4,601 36,315Options written 28,952 648 29,600 39,317 914 40,231
426,356 73,807 500,163 505,498 103,391 608,889Total $ 493,450 $ 87,454 $ 580,904 $ 570,016 $ 118,135 $ 688,151Foreign exchange and gold contractsExchange-traded:
Futures $ 4,753 $ – $ 4,753 $ 2,964 $ – $ 2,964Options purchased 7 – 7 14 – 14Options written 6 – 6 3 – 3
4,766 – 4,766 2,981 – 2,981Over-the-counter:
Spot and forwards 176,525 6,819 183,344 177,699 5,391 183,090Swaps 49,745 11,818 61,563 41,217 11,429 52,646Options purchased 2,200 – 2,200 2,896 – 2,896Options written 2,146 – 2,146 2,831 – 2,831
230,616 18,637 249,253 224,643 16,820 241,463Total $ 235,382 $ 18,637 $ 254,019 $ 227,624 $ 16,820 $ 244,444Other derivative contracts
Equity: over-the-counter $ 24,151 $ 3,322 $ 27,473 $ 20,471 $ 2,770 $ 23,241Credit: over-the-counter 20,154 938 21,092 17,875 940 18,815Other 2,840 – 2,840 2,583 31 2,614
Total $ 47,145 $ 4,260 $ 51,405 $ 40,929 $ 3,741 $ 44,670Total notional amounts outstanding $ 775,977 $110,351 $ 886,328 $ 838,569 $ 138,696 $ 977,265

CONSOLIDATED FINANCIAL STATEMENTS
S c o t i a b a n k 2 0 0 5 A n n u a l R e p o r t 1 2 5
(b) Remaining term to maturity
The following table summarizes the remaining term to maturity of the notional amounts of the Bank’s derivative instruments by type:
Within One to OverAs at October 31, 2005 ($ millions) 1 year 5 years 5 years Total
Interest rate contractsFutures $ 57,910 $ 14,263 $ – $ 72,173Forward rate agreements 25,914 1,995 – 27,909Swaps 131,818 206,689 77,418 415,925Options purchased 22,538 12,302 457 35,297Options written 14,974 11,947 2,679 29,600
253,154 247,196 80,554 580,904Foreign exchange and gold contracts
Futures 3,529 1,224 – 4,753Spot and forwards 173,778 8,315 1,251 183,344Swaps 13,372 27,105 21,086 61,563Options purchased 1,897 310 – 2,207Options written 1,922 230 – 2,152
194,498 37,184 22,337 254,019Other derivative contracts
Equity 20,021 6,994 458 27,473Credit 5,379 15,304 409 21,092Other 2,599 241 – 2,840
27,999 22,539 867 51,405Total $ 475,651 $ 306,919 $ 103,758 $ 886,328
Within One to OverAs at October 31, 2004 ($ millions) 1 year 5 years 5 years Total
Interest rate contractsFutures $ 41,085 $ 18,885 $ – $ 59,970Forward rate agreements 59,553 515 – 60,068Swaps 183,124 217,656 71,495 472,275Options purchased 34,294 15,789 1,070 51,153Options written 24,370 17,573 2,742 44,685
342,426 270,418 75,307 688,151Foreign exchange and gold contracts
Futures 2,253 711 – 2,964Spot and forwards 169,124 13,097 869 183,090Swaps 9,590 28,552 14,504 52,646Options purchased 2,328 582 – 2,910Options written 2,369 465 – 2,834
185,664 43,407 15,373 244,444Other derivative contracts
Equity 17,485 5,603 153 23,241Credit 5,474 13,081 260 18,815Other 2,407 207 – 2,614
25,366 18,891 413 44,670Total $ 553,456 $ 332,716 $ 91,093 $ 977,265

CONSOLIDATED FINANCIAL STATEMENTS
1 2 6 S c o t i a b a n k 2 0 0 5 A n n u a l R e p o r t
As with on-balance sheet assets, derivative instruments are subjectto credit risk. Credit risk arises from the possibility that counterpar-ties may default on their obligations to the Bank. However, whereasthe credit risk of on-balance sheet assets is represented by the prin-cipal amount net of any applicable allowance for credit losses, thecredit risk associated with derivatives is normally a small fraction ofthe notional amount of the derivative instrument. Derivativecontracts generally expose the Bank to credit loss if changes inmarket rates affect a counterparty’s position unfavourably and thecounterparty defaults on payment. Accordingly, credit risk of deriva-tives is represented by the positive fair value of the instrument.
Negotiated over-the-counter derivatives often present greatercredit exposure than exchange-traded contracts. The net change in
the exchange-traded contracts is normally settled daily in cash withthe exchange. Holders of these contracts look to the exchange forperformance under the contract.
The Bank strives to limit credit risk by dealing with counterpartiesthat it believes are creditworthy, and manages its credit risk for deriv-atives through the same credit risk process applied to on-balancesheet assets.
The Bank pursues opportunities to reduce its exposure to creditlosses on derivative instruments. These opportunities include enteringinto master netting arrangements with counterparties. The credit riskassociated with favourable contracts is eliminated by a masternetting arrangement to the extent that unfavourable contracts withthe same counterparty are not settled before favourable contracts.
(c) Credit risk
The following table summarizes the credit exposure of the Bank’s derivatives. The credit risk amount (CRA) represents the estimated replace-ment cost, or positive fair value, for all contracts without taking into account any master netting or collateral arrangements that have beenmade. The CRA does not reflect actual or expected losses.
The credit equivalent amount (CEA) is the CRA plus an add-on for potential future exposure. The add-on amount is based on a formulaprescribed in the Capital Adequacy Guideline of the Superintendent. The risk-weighted balance is the CEA multiplied by counterparty risk factorsprescribed by this Guideline. Other derivative contracts – other includes precious metals other than gold, and base metal derivatives.
2005 2004Credit
Credit risk Potential equivalent Risk- Credit risk Risk-Notional amount future amount weighted amount weightedamount (CRA) exposure (CEA) balance (CRA) balance
As at October 31 ($ millions) (a) (b) (a) + (b)
Interest rate contractsFutures $ 72,173 $ – $ – $ – $ – $ – $ –Forward rate agreements 27,909 6 11 17 5 31 13Swaps 415,925 3,798 1,943 5,741 1,351 5,974 1,829Options purchased 35,297 240 69 309 69 366 108Options written 29,600 – – – – – –
580,904 4,044 2,023 6,067 1,425 6,371 1,950Foreign exchange and gold contracts
Futures 4,753 – – – – – –Spot and forwards 183,344 3,372 2,003 5,375 1,532 4,757 2,076Swaps 61,563 3,863 3,071 6,934 1,860 3,437 1,644Options purchased 2,207 47 34 81 32 93 52Options written 2,152 – – – – – –
254,019 7,282 5,108 12,390 3,424 8,287 3,772Other derivative contracts
Equity 27,473 922 1,687 2,609 806 408 564Credit 21,092 173 1,306 1,479 484 139 289Other 2,840 68 199 267 97 138 118
51,405 1,163 3,192 4,355 1,387 685 971Total derivatives $ 886,328 $ 12,489 $ 10,323 $ 22,812 $ 6,236 $ 15,343 $ 6,693
Less: impact of master nettingagreements 6,529 3,805 10,334 2,358 8,039 2,745
Total $ 5,960 $ 6,518 $ 12,478 $ 3,878 $ 7,304 $ 3,948

CONSOLIDATED FINANCIAL STATEMENTS
S c o t i a b a n k 2 0 0 5 A n n u a l R e p o r t 1 2 7
Fair values of exchange-traded derivatives are based on quoted marketprices. Fair values of over-the-counter (OTC) derivatives are determinedusing pricing models, which take into account current market andcontractual prices of the underlying instruments, as well as time value
and yield curve or volatility factors underlying the positions.The determination of the fair value of trading derivatives
includes consideration, on a portfolio basis, of customer credit riskand ongoing direct costs over the life of the instruments.
(d) Fair value
The following table summarizes the fair value of derivatives segregated by type and segregated between trading and those derivatives used inthe Bank’s asset/liability risk management process (ALM).
2005 2005 2004Average fair value(1) Year-end fair value Year-end fair value
As at October 31 ($ millions) Favourable Unfavourable Favourable Unfavourable Favourable Unfavourable
TradingInterest rate contracts
Forward rate agreements $ 19 $ 7 $ 2 $ 6 $ 26 $ 14Swaps 4,862 4,553 3,501 3,432 5,554 4,742Options 290 346 224 264 345 452
5,171 4,906 3,727 3,702 5,925 5,208Foreign exchange and gold contracts
Forwards 3,701 3,559 3,327 3,263 4,701 4,668Swaps 3,262 2,636 3,630 2,833 3,048 2,861Options 59 91 47 67 93 129
7,022 6,286 7,004 6,163 7,842 7,658Other derivative contracts
Equity 483 962 657 838 172 795Credit 127 299 166 415 121 237Other 91 101 68 75 138 156
701 1,362 891 1,328 431 1,188Trading derivatives’ market valuation $ 12,894 $ 12,554 $ 11,622 $ 11,193 $ 14,198 $ 14,054
ALM (2)
Interest rate contractsForward rate agreements $ 4 $ 4 $ 5 $ 5Swaps 297 351 420 486Options 16 8 21 –
317 363 446 491Foreign exchange and gold contracts
Forwards 45 68 56 189Swaps 233 982 389 1,197Options – – – –
278 1,050 445 1,386Other derivative contracts
Equity 265 27 236 6Credit 7 5 18 8Other – – – –
272 32 254 14Total ALM derivatives’ market valuation $ 867 $ 1,445 $ 1,145 $ 1,891Total gross fair values before netting $ 12,489 $ 12,638 $ 15,343 $ 15,945Less: impact of master netting agreements 6,529 6,529 8,039 8,039Total derivatives’ market valuation $ 5,960 $ 6,109 $ 7,304 $ 7,906
(1) The average fair value of trading derivatives’ market valuation for the year ended October 31, 2004 are: favourable $13,972 and unfavourable $13,516. Average fairvalue amounts are based on month-end balances.
(2) The changes in the fair values of these derivative financial instruments wholly or partially offset the changes in the fair values of related on-balance sheet financial instru-ments, specific firm commitments or forecasted transactions.

CONSOLIDATED FINANCIAL STATEMENTS
1 2 8 S c o t i a b a n k 2 0 0 5 A n n u a l R e p o r t
24. Acquisitions
(a) Grupo Financiero Scotiabank Inverlat, Mexico
On April 30, 2003, the Bank increased its ownership in GrupoFinanciero Scotiabank Inverlat to 91%. The purchase price for the addi-tional 36% was $465 million, which was paid in cash. This transactionresulted in increases in goodwill of $62 million, other intangible assetsof $16 million, and net positive fair value adjustments to other assets
of $12 million, as well as a reduction in non-controlling interest insubsidiaries of $375 million.
On March 23, 2004, the Bank paid an additional $59 million incash to increase its ownership in Inverlat to 97%. No goodwill or otherintangible assets were recognized on this transaction.
During the year, the Bank completed three acquisitions: Banco deComercio in El Salvador; Waterous & Co., a global oil and gasenergy acquisition and divestiture advisory firm; and, thebusiness of Pan American Financial, a mortgage originator inPuerto Rico.
These purchases did not have a material effect on the Bank’sconsolidated financial results for the fiscal year or the consolidated
financial position. Total goodwill of $227 million and other intangibleassets of $24 million have been recorded in the ConsolidatedBalance Sheet [refer to Note 8]. This amount may be refined as theBank completes its valuation of the assets acquired and liabilitiesassumed.
(b) Other

CONSOLIDATED FINANCIAL STATEMENTS
S c o t i a b a n k 2 0 0 5 A n n u a l R e p o r t 1 2 9
Reconciliation of net incomeNet income
For the year ended October 31 ($ millions) 2005 2004(1) 2003(1)
Net income based on Canadian GAAP $ 3,209 $ 2,908 $ 2,422Employee future benefits (a) (16) 1 31Restructuring costs (b) (2) (23) (4)Transfers of loans (c) (8) (21) (32)Derivative instruments and hedging activities (d) (1) 60 248Unrealized gains (losses) on securities reclassified as trading (d) (7) 55 7Conversion of loans into debt securities (e) 86 39 1Available-for-sale securities (e) 45 81 95Computer software (f) (22) (29) 14Liabilities and equity (g) – 14 47Other – 10 (1)Tax effect of above differences (21) (49) (81)Net income based on U.S. GAAP $ 3,263 $ 3,046 $ 2,747
Preferred dividends paid and other (25) (30) (62)Net income available to common shareholders based on U.S. GAAP $ 3,238 $ 3,016 $ 2,685Earnings per common share based on U.S. GAAP (in dollars)(2)(3):
Basic $ 3.24 $ 2.99 $ 2.66Diluted $ 3.20 $ 2.94 $ 2.62
(1) Certain comparative amounts have been retroactively restated for new CICA accounting requirements relating to the distinction between equity and liability instruments[refer to (g)].
(2) Amounts have been retroactively adjusted to reflect the stock dividend paid April 28, 2004, of one common share for each issued and outstanding common share. Thestock dividend had the same effect as a two-for-one stock split.
(3) Earnings per share calculations are based on full dollar and share amounts.
(a) Employee future benefitsCanadian and U.S. accounting standards for employee future benefitsare substantially consistent; however, there continues to be a differ-ence in the charge to income between Canadian and U.S. GAAP,principally due to differences in the amortization of the transitionalamounts resulting from differing adoption dates of those standards,and differences in the treatment of the pension valuation allowance.
Canadian GAAP requires recognition of a pension valuationallowance for any excess of the prepaid benefit expense over theexpected future benefit. Changes in the pension valuation allowanceare recognized in the Consolidated Statement of Income. U.S. GAAPdoes not permit recognition of a pension valuation allowance.
U.S. GAAP requires the excess of any unfunded accumulatedbenefit obligation (with certain other adjustments) to be reflectedas an additional minimum pension liability in the U.S. GAAPConsolidated Balance Sheet with an offsetting adjustment tointangible assets to the extent of unrecognized prior service costs,with the remainder recorded in other comprehensive income.
(b) Restructuring costsUnder Canadian GAAP, restructuring costs incurred for activities initi-ated prior to April 1, 2003, were accrued as liabilities provided that arestructuring plan detailing all major actions to be taken had beenapproved by an appropriate level of management, and significantchanges to the plan were not likely. Under U.S. GAAP, for activitiesinitiated prior to January 1, 2003, additional criteria were required tohave been met prior to accrual, including that certain restructuringcosts be incurred within one year from the date of approval of therestructuring plan; the accruals recorded under Canadian GAAP forcertain planned restructuring costs not incurred within the one-yeartime limit were reversed under U.S. GAAP and the costs areexpensed as incurred. For restructuring costs incurred for activitiesinitiated after March 31, 2003, Canadian and U.S. GAAP areconsistent.
(c) Transfers of loans through securitizationsEffective July 1, 2001, the Bank adopted a new Canadianaccounting guideline for transfers of loans on a prospective basis.This guideline is consistent with the U.S. standard for transfers ofloans adopted on April 1, 2001.
Prior to the adoption of the new Canadian guideline, transfers ofloans were treated as sales under Canadian GAAP when the significantrisks and rewards of ownership were transferred. Gains on transfers ofloans were recognized immediately, unless there was recourse to theBank in excess of expected losses, in which case the gains were consid-ered unrealized and deferred until they were collected in cash andthere was no recourse to that cash. Under U.S. GAAP, gains on trans-fers of loans that qualify as sales are recognized in income at the timeof sale. There will continue to be differences in Canadian and U.S.GAAP income until the deferred gains related to assets securitized priorto July 1, 2001 have all been recognized in Canadian GAAP income.
Prior to the harmonization of Canadian and U.S. GAAP, sometransfers of assets did not qualify for sale accounting under U.S.GAAP. These transfers have been accounted for as secured lendingarrangements under U.S. GAAP. This results in the assets remainingon the U.S. GAAP Consolidated Balance Sheet and in the net spreadbeing recognized in U.S. GAAP income over the term of the loansrather than immediate recognition of a gain.
(d) Derivative instruments and hedging activitiesUnder Canadian GAAP, the Bank accounts for derivative instrumentsheld for asset/liability management purposes on an accrual basis ifthey qualify for hedge accounting. Derivative instruments held forasset/liability management purposes which do not meet hedgeaccounting criteria and those held for trading purposes are accountedfor at fair value with changes in fair value recognized in income.
U.S. GAAP requires all derivative instruments to be recognized atfair value in the Consolidated Balance Sheet. U.S. GAAP restricts thetypes of transactions that qualify for hedge accounting and contains
25. Reconciliation of Canadian and United States generally accepted accounting principles (GAAP)The consolidated financial statements of the Bank have been preparedin accordance with Canadian GAAP. The significant measurement
differences between Canadian and U.S. GAAP affecting the consoli-dated financial statements are as follows:

CONSOLIDATED FINANCIAL STATEMENTS
1 3 0 S c o t i a b a n k 2 0 0 5 A n n u a l R e p o r t
guidance on measuring hedge effectiveness. The change in fair value ofa derivative instrument designated as a fair value hedge is offset in U.S.GAAP income against the change in the fair value of the hedged itemrelating to the hedged risk. The change in fair value of a derivativeinstrument designated as a cash flow hedge is recorded in othercomprehensive income until the revenues or expenses relating to thehedged item are recorded in income. Hedge ineffectiveness andchanges in the fair value of derivative instruments that do not qualify ashedges are recognized in income as they arise. The Bank has recordedan after-tax loss of $5 million (2004 – after-tax loss of $17 million; 2003– after-tax loss of $19 million), which represents the ineffective portionof designated hedges. Prior to 2004, certain foreign currency fundingtransactions that were designated as hedges for Canadian GAAP didnot meet the strict U.S. GAAP hedge criteria. Therefore, the change inthe fair value of these transactions has been recognized in U.S. GAAPincome.
U.S. GAAP also requires derivative instruments embedded infinancial instruments that are not clearly and closely related to theirhost instrument to be separated and recorded at their fair value. If anembedded derivative cannot be separated, the entire financial instru-ment is recorded at fair value. Certain securities with embedded deriva-tives were reclassified from available-for-sale to trading securities. UnderCanadian GAAP, these securities are classified as investment securities.
The Bank has fair value hedges of interest rate risk relating to itsfixed rate instruments in addition to cash flow hedges of its variablerate instruments. The Bank expects to reclassify $7 million (2004 –$10 million; 2003 – $(11) million) of after-tax gains/(losses) fromaccumulated other comprehensive income to earnings as a result ofits cash flow hedges within the next twelve months. As at October31, 2005, 2004 and 2003, the maximum term of cash flow hedgeswas less than 10 years.
(e) SecuritiesU.S. GAAP requires securities to be classified as either trading, held tomaturity or available for sale. The Bank has classified all investmentsecurities as available for sale under U.S. GAAP (other than thosereclassified to trading on adoption of the U.S. accounting standard onderivative instruments and hedging activities as discussed in (d) above),which are carried on the Consolidated Balance Sheet at their fair value.Other-than-temporary declines in the fair value of available-for-salesecurities are recognized in U.S. GAAP income based on market values;declines in fair values are generally presumed to be other than tempo-rary if they have persisted over several quarters. Both investmentsecurities and trading securities are required to be accounted for on atrade date basis in the Consolidated Statement of Income andConsolidated Balance Sheet.
Under U.S. GAAP, unrealized gains and losses on available-for-sale securities, net of related income taxes, are recorded in othercomprehensive income until realized, except for the unrealized gainsand losses on hedged available-for-sale securities, which are recordedin U.S. GAAP income.
Under Canadian GAAP, securities are classified as either tradingor investment. The Bank carries investment securities at amortizedcost. Other-than-temporary declines in the value of investment secu-rities are recorded in income based on net realizable values; declinesin fair values are generally presumed to be other than temporary ifconditions indicating impairment have persisted for a moreprolonged period of time than under U.S. GAAP. Investment securi-ties and trading securities are accounted for on a settlement datebasis in the Consolidated Balance Sheet and on a trade date basis inthe Consolidated Statement of Income.
Under Canadian GAAP, debt securities acquired in a loan restruc-turing prior to May 1, 2003 were recorded at net book value. UnderU.S. GAAP, the debt securities are recorded at their fair value with
the difference between the carrying value of the loans and the fairvalue of the debt securities acquired recorded in income. For debtsecurities acquired in a loan restructuring after April 30, 2003, Cana-dian and U.S. GAAP are consistent.
(f) Computer softwareU.S. GAAP requires qualifying software costs to be capitalized anddepreciated over the useful life of the software. Prior to November 1,2003, these costs were expensed as incurred under Canadian GAAP.For software costs incurred after November 1, 2003, Canadian andU.S. GAAP are consistent.
(g) Liabilities and equityUnder Canadian GAAP, effective November 1, 2004, the Bankretroactively adopted, with restatement of prior periods, a newpronouncement amending the accounting for certain financialinstruments that have the characteristics of both a liability andequity. Details are provided in Notes 1 & 13. There was no corre-sponding change in U.S. GAAP. As a result of the change in Cana-dian GAAP, the Bank has reclassified its reconciliation of net incomefor 2004 and 2003. The dividends paid on the preferred sharesissued directly by the Bank that have retroactively been reclassifiedas interest expense under Canadian GAAP continue to be recordedin shareholders’ equity under U.S. GAAP.
Under Canadian GAAP, the preferred shares issued by Scotia Mort-gage Investment Corporation are recorded as capital instrument liabili-ties whereas under U.S. GAAP, these are recorded as non-controllinginterest in subsidiaries. As well, under Canadian GAAP, the ScotiabankTrust Securities issued by BNS Capital Trust and, prior to November 1,2004, the Scotiabank Trust Securities issued by Scotiabank Capital Trustare recorded as capital instrument liabilities. Under U.S. GAAP, theseinstruments are recorded as non-controlling interest in subsidiariesexcept that effective October 31, 2004, the Scotiabank Trust Securitiesissued by Scotiabank Capital Trust are recorded as deposit liabilities as aresult of implementing the VIE accounting standard. Effective November1, 2004 and on a prospective basis, Canadian and U.S. GAAP areconsistent in accounting for the Scotiabank Trust Securities issuedby Scotiabank Capital Trust.
(h) GuaranteesEffective February 2003, the Bank adopted a Canadian guideline ondisclosure of guarantees, as set out in Note 21. The U.S. standard isconsistent with this Canadian guideline, except that it also requiresrecognition of a liability for the fair value of the obligation assumed atthe inception of the arrangement for guarantees issued or modifiedafter December 31, 2002.
The fair value under U.S. GAAP for guarantees at October 31, 2005amounted to $304 million (2004 – $268 million). The amount excludesderivative instruments meeting the Canadian GAAP definition of guar-antees, the fair value of which is included in the amounts disclosed inNote 23.
(i) Variable interest entities (VIEs)Under U.S. GAAP, VIEs created after January 31, 2003 are required tobe consolidated where the Bank is the primary beneficiary; there is nomaterial measurement difference between Canadian and U.S. GAAPaffecting the consolidated financial statements as a result of thisrequirement. For the remaining VIEs, the accounting on a U.S. GAAPbasis is effective October 31, 2004. Under Canadian GAAP, the Bankprospectively adopted, on November 1, 2004, a new guideline on theconsolidation of VIEs, which, apart from the difference in effectivedates, is harmonized with U.S. GAAP.
The following material adjustments were made to the U.S. GAAPConsolidated Balance Sheet in 2004, as a result of consolidating VIEsunder U.S. GAAP as at October 31, 2004: $4,854 million addition to

CONSOLIDATED FINANCIAL STATEMENTS
Consolidated statement of comprehensive incomeFor the year ended October 31 ($ millions) 2005 2004 2003
Net income based on U.S. GAAP $ 3,263 $ 3,046 $ 2,747Other comprehensive income, net of income taxes:
Change in unrealized gains and losses on available-for-sale securities, net of hedging activities(1) (211) 101 434Change in unrealized foreign currency translation gains and losses, net of hedging activities(2) (178) (705) (1,295)Change in gains and losses on derivative instruments designated as cash flow hedges(3) 9 (8) 24Change in additional minimum pension liability(4) (29) 16 (17)
Total other comprehensive income $ (409) $ (596) $ (854)Total comprehensive income $ 2,854 $ 2,450 $ 1,893
Accumulated other comprehensive incomeFor the year ended October 31 ($ millions) 2005 2004 2003
Unrealized gains and losses on available-for-sale securities, net of hedging activities $ 860 $ 1,071 $ 970Unrealized foreign currency translation gains and losses, net of hedging activities (2,075) (1,897) (1,192)Derivative instruments (17) (26) (18)Additional minimum pension liability (41) (12) (28)Total accumulated other comprehensive income $ (1,273) $ (864) $ (268)
(1) Net of income tax benefit of $112 (2004 – expense of $115; 2003 – expense of $199).(2) Net of income tax of nil (2004 – benefit of $1; 2003 – expense of $25).(3) Net of income tax expense of $3 (2004 – expense of $1; 2003 – expense of $13).(4) Net of income tax benefit of $16 (2004 – expense of $7; 2003 – benefit of $8).
Stock-based compensation – Pro-forma disclosures
For U.S. GAAP purposes, the Bank accounted for stock optionsissued prior to November 1, 2002 using the intrinsic value basedmethod, which did not result in a compensation expense to theBank. Effective November 1, 2002, the Bank commenced expensing
the fair value of stock options on a prospective basis. All stock-basedcompensation awards are accounted for consistently under bothCanadian and U.S. GAAP subsequent to that date.
U.S. GAAP requires pro-forma disclosure of net income and earnings per share as if the fair-value-based method had been applied retroac-tively, as detailed below:
For the year ended October 31 ($ millions) 2005 2004 2003
Net income, as reported $ 3,263 $ 3,046 $ 2,747Pro-forma fair value of stock options not previously expensed – 21 32Pro-forma net income $ 3,263 $ 3,025 $ 2,715
Earnings per share(1)(2):Basic, as reported $ 3.24 $ 2.99 $ 2.66Basic, pro-forma $ 3.24 $ 2.97 $ 2.63
Diluted, as reported $ 3.20 $ 2.94 $ 2.62Diluted, pro-forma $ 3.20 $ 2.92 $ 2.59
(1) Amounts have been retroactively adjusted to reflect the stock dividend paid April 28, 2004, of one common share for each issued and outstanding common share.The stock dividend had the same effect as a two-for-one stock split.
(2) Earnings per share calculations are based on full dollar and share amounts.
investment securities/available-for-sale, $2,746 million addition to loansand $7,624 million addition to other liabilities. There were no differ-ences in 2005 relating to the consolidation of VIEs under U.S. GAAP.
(j) Non-cash collateralUnder Canadian GAAP, non-cash collateral received as part of secu-rities lending transactions is not recognized in the ConsolidatedBalance Sheet. Under U.S. GAAP, collateral received for transactionswhere the Bank lends securities as principal is accounted for as asecured borrowing in the Consolidated Balance Sheet.
The adjustment for non-cash collateral received in securitieslending transactions resulted in an addition to other assets of$6,969 million (2004 – $2,822 million) and an addition to otherliabilities of $6,969 million (2004 – $2,822 million).
(k) Comprehensive incomeU.S. GAAP requires a statement of comprehensive income to be
included in the financial statements. Comprehensive incomeincludes net income and all changes in equity, net of taxes, for theperiod except those resulting from investments by and distributionsto shareholders. Comprehensive income also includes the foreigncurrency translation adjustments arising from the consolidation ofsubsidiaries where the functional currency is other than thereporting currency. Under Canadian GAAP, there is no currentrequirement to present a statement of comprehensive income, andthe foreign currency translation adjustments pertaining to netinvestments in foreign subsidiaries are presented in cumulativeforeign currency translation in the Consolidated Balance Sheet.
(l) Non-controlling interest in subsidiariesUnder U.S. GAAP, non-controlling interest in subsidiaries ispresented separately.
S c o t i a b a n k 2 0 0 5 A n n u a l R e p o r t 1 3 1

CONSOLIDATED FINANCIAL STATEMENTS
1 3 2 S c o t i a b a n k 2 0 0 5 A n n u a l R e p o r t
Condensed consolidated balance sheet2005 2004
Canadian U.S. Canadian U.S.As at October 31 ($ millions) GAAP Adjustments GAAP GAAP Adjustments GAAP
AssetsCash resources $ 20,505 $ – $ 20,505 $ 17,155 $ 94i $ 17,249Securities
Investment/Available-for-sale 23,452 650c,d,e 24,102 15,717 5,689c,d,e,i 21,406Trading 50,007 56d,e 50,063 43,056 79d,e 43,135
Loans 191,005 674c 191,679 171,768 3,877c,i 175,645Derivative instruments 11,622 1,366d 12,988 14,198 1,456d,i 15,654Other 17,434 6,587(1) 24,021 17,318 2,129(5) 19,447
$ 314,025 $ 9,333 $ 323,358 $ 279,212 $ 13,324 $ 292,536Liabilities and shareholders’ equityLiabilitiesDeposits $ 217,445 $ 717c,d $ 218,162 $ 195,196 $ 2,736c,d,i $ 197,932Derivative instruments 11,193 1,911d 13,104 14,054 2,213d,i 16,267Other 65,652 5,954(2) 71,606 49,832 8,933(6) 58,765Non-controlling interest in subsidiaries 306 (306)g,l – 280 (280)l –Subordinated debentures 2,597 52d 2,649 2,615 66d 2,681Capital instrument liabilities 750 (750)g – 2,250 (2,250)g,i –
$ 297,943 $ 7,578 $ 305,521 $ 264,227 $ 11,418 $ 275,645
Non-controlling interest in subsidiaries $ – $ 1,056g,l $ 1,056 $ – $ 1,030g, l $ 1,030
Shareholders’ equityCapital stock
Preferred shares $ 600 $ – $ 600 $ 300 $ – $ 300Common shares and contributed surplus 3,317 – 3,317 3,229 – 3,229
Retained earnings 14,126 11(3) 14,137 13,239 (43)(7) 13,196Cumulative foreign currency translation (1,961) 1,961k – (1,783) 1,783k –Accumulated other comprehensive income – (1,273)(4) (1,273) – (864)(8) (864)
$ 16,082 $ 699 $ 16,781 $ 14,985 $ 876 $ 15,861$ 314,025 $ 9,333 $ 323,358 $ 279,212 $ 13,324 $ 292,536
Note references refer to GAAP differences described above.(1) Refer to a, b, c, d, e, f, h, j. (4) Refer to a, d, e, k. (7) Refer to a, b, c, d, e, f.(2) Refer to a, b, c, d, e, h, j. (5) Refer to a, b, c, d, e, f, h, i, j. (8) Refer to a, d, e, k.(3) Refer to a, b, c, d, e, f. (6) Refer to a, b, c, d, e, h, i, j.
Future U.S. accounting change
In December 2004, the U.S. Financial Accounting Standards Boardissued a new standard amending the accounting for stock-basedcompensation. This standard requires the use of a fair-value-basedmethod to measure and account for the cost of employee services
received in exchange for an award linked to the Bank’s commonshares. The requirements of this standard will be effective for the Bankbeginning November 1, 2005. The transition approach and impact ofthis change for the Bank has not yet been determined.
In determining the pro-forma disclosures above, the fair value ofoptions granted is estimated as at the date of grant using an optionpricing model. The fair value is then amortized over the vesting period.As a result of the retroactive attachment of Tandem SARs to the 2002employee stock option grants, the 2003 and 2004 pro-forma disclo-sures do not reflect a fair value expense for these employee stock
options. The fair value of the fiscal 2002 employee stock option grantswas $7.06(1). Significant assumptions for 2002, were as follows:(i) risk-free interest rate of 5.2%; (ii) expected option life of 6 years;(iii) expected volatility of 30%; and (iv) expected dividends of 2.7%.By the end of fiscal 2004, all stock options issued prior toNovember 1, 2002, were fully amortized.

PRINCIPAL SUBSIDIARIES
S c o t i a b a n k 2 0 0 5 A n n u a l R e p o r t 1 3 3
Principal Subsidiaries(1)
As at October 31, 2005 ($ millions) Principal office Carrying value of shares
CanadianBNS Capital Trust Toronto, Ontario $ 121BNS Investments Inc. Toronto, Ontario $ 7,381
Montreal Trust Company of Canada Montreal, QuebecMontroServices Corporation Montreal, QuebecScotia Merchant Capital Corporation Toronto, Ontario
National Trustco Inc. Toronto, Ontario $ 482The Bank of Nova Scotia Trust Company Toronto, OntarioNational Trust Company Toronto, Ontario
RoyNat Inc. Toronto, Ontario $ 56Scotia Capital Inc. Toronto, Ontario $ 209Scotia Cassels Investment Counsel Limited Toronto, Ontario $ 11Scotia Life Insurance Company Toronto, Ontario $ 66Scotia Mortgage Corporation Toronto, Ontario $ 219Scotia Mortgage Investment Corporation St. John’s, Newfoundland $ 58Scotia Securities Inc. Toronto, Ontario $ 302Scotiabank Capital Trust(2) Toronto, Ontario $ 9
InternationalThe Bank of Nova Scotia Berhad Kuala Lumpur, Malaysia $ 137The Bank of Nova Scotia International Limited Nassau, Bahamas $ 6,978
BNS International (Barbados) Limited Warrens, BarbadosThe Bank of Nova Scotia Asia Limited SingaporeThe Bank of Nova Scotia Trust Company (Bahamas) Limited Nassau, Bahamas
Scotiabank & Trust (Cayman) Limited Grand Cayman, Cayman IslandsScotia Insurance (Barbados) Limited Warrens, BarbadosScotiabank (Bahamas) Limited Nassau, BahamasScotiabank (British Virgin Islands) Limited Road Town, Tortola, B.V.I.Scotiabank (Hong Kong) Limited Hong Kong, ChinaScotiabank (Ireland) Limited Dublin, Ireland
The Bank of Nova Scotia Jamaica Limited (70%) Kingston, Jamaica $ 270Grupo Financiero Scotiabank Inverlat, S.A. de C.V. (97%) Mexico, D.F., Mexico $ 1,445Nova Scotia Inversiones Limitada Santiago, Chile $ 379
Scotiabank Sud Americano, S.A. (99%) Santiago, ChileScotia Capital (USA) Inc. New York, New York (3)
Scotia Holdings (US) Inc. Atlanta, Georgia (4)
The Bank of Nova Scotia Trust Company of New York New York, New YorkScotiabanc Inc. Atlanta, Georgia
Scotia International Limited Nassau, Bahamas $ 502Corporacion Mercaban de Costa Rica, S.A. San Jose, Costa RicaScotiabank Anguilla Limited The Valley, Anguilla
Scotiabank de Puerto Rico Hato Rey, Puerto Rico $ 223Scotiabank El Salvador, S.A. San Salvador, El Salvador $ 313Scotiabank Europe plc London, England $ 1,951Scotiabank Trinidad & Tobago Limited (51%) Port of Spain, Trinidad $ 124Scotia Capital (Europe) Limited London, England $ 16(1) The Bank owns 100% of the outstanding voting shares of each subsidiary unless otherwise noted. The listing includes major operating subsidiaries only.(2) In terms of current accounting standards, this entity is not consolidated as the Bank is not the primary beneficiary.(3) The carrying value of this subsidiary is included with that of its parent, Scotia Capital Inc.(4) The carrying value of this subsidiary is included with that of its parent, BNS Investments Inc.

SHAREHOLDER INFORMATION
1 3 4 S c o t i a b a n k 2 0 0 5 A n n u a l R e p o r t
Annual Meeting
Shareholders are invited to attend the 174th Annual Meeting of
Holders of Common Shares, to be held on March 3, 2006, at The
Fairmont Winnipeg, Winnipeg Ballroom, 2 Lombard Place, Winnipeg,
Manitoba, Canada, beginning at 10:00 a.m. (Central Time).
Shareholdings and Dividends
Information regarding your shareholdings and dividends may be
obtained by contacting the Transfer Agent.
Direct Deposit Service
Shareholders may have dividends deposited directly into accounts
held at financial institutions which are members of the Canadian
Payments Association. To arrange direct deposit service, please write
to the Transfer Agent.
Dividend and Share Purchase Plan
Scotiabank’s dividend reinvestment and share purchase plan allows
common and preferred shareholders to purchase additional
common shares by reinvesting their cash dividend without incurring
brokerage or administrative fees.
As well, eligible shareholders may invest up to $20,000 each
fiscal year to purchase additional common shares of the Bank.
Debenture holders may apply interest on fully registered Bank subor-
dinated debentures to purchase additional common shares. All
administrative costs of the plan are paid by the Bank.
For more information on participation in the plan, please
contact the Transfer Agent.
Listing of Shares
Common shares of the Bank are listed for trading on the Toronto
and New York stock exchanges.
Series 12 and Series 13 preferred shares of the Bank are listed
on the Toronto Stock Exchange.
Stock Symbols
STOCK TICKER SYMBOL CUSIP NO.
Common shares BNS 064149 10 7
Series 12, Preferred BNS.PR.J 064149 81 8
Series 13, Preferred BNS.PR.K 064149 79 2
Dividend Dates for 2006
Record and payment dates for common and preferred shares,
subject to approval by the Board of Directors.
RECORD DATE PAYMENT DATE
January 3 January 27
April 4 April 26
July 4 July 27
October 3 October 27
Future Annual Meeting
The Annual Meeting for the fiscal year 2006 is scheduled for Tuesday,
March 6, 2007, in Halifax, Nova Scotia, at 10:00 a.m. (Atlantic Time).
Valuation Day Price
For Canadian income tax purposes, The Bank of Nova Scotia’s common
stock was quoted at $31.13 per share on Valuation Day, December
22, 1971. This is equivalent to $1.297 after adjustment for the two-
for-one stock split in 1976, the three-for-one stock split in 1984, the
two-for-one stock split in 1998, and the stock dividend (with the effect
of a two-for-one stock split) in 2004.
Duplicated Communication
Some registered holders of The Bank of Nova Scotia shares might
receive more than one copy of shareholder mailings, such as this
annual report. Every effort is made to avoid duplication; however,
if you are registered with different names and/or addresses, multiple
mailings may result.
If you receive, but do not require, more than one mailing for the
same ownership, please contact the Transfer Agent to combine the
accounts.
Credit Ratings
SENIOR LONG-TERM DEBT/DEPOSITS
DBRS AA(low)
FITCH AA-
Moody’s Aa3
Standard & Poor’s AA-
SHORT TERM DEPOSITS/COMMERCIAL PAPER
DBRS R-1(middle)
FITCH F1+
Moody’s P-1
Standard & Poor’s A-1+
SUBORDINATED DEBT
DBRS A(high)
Moody’s A1
Standard & Poor’s A+
NON-CUMULATIVE PREFERRED SHARES
DBRS Pfd-1(low)n

Founded in 1832 in Halifax,
Nova Scotia, Scotiabank is
one of North America’s
premier financial institutions,
with assets of $314 billion.
As Canada’s most international
bank, the Scotiabank Group
of Companies serves more
than 10 million customers in
some 50 countries in the
Americas, the Caribbean,
Europe and Asia.
Corporate HeadquartersScotiabankScotia Plaza44 King Street WestToronto, OntarioCanada M5H 1H1Tel: (416) 866-6161Fax: (416) 866-3750E-mail: [email protected]
Shareholder Services
TRANSFER AGENT AND REGISTRARMAIN AGENT
Computershare Trust Company of Canada100 University Avenue, 9th FloorToronto, OntarioCanada M5J 2Y1Tel: 1-877-982-8767Fax: 1-888-453-0330E-mail: [email protected]
CO-TRANSFER AGENT (U.S.A.)
Computershare Trust Company, Inc.350 Indiana StreetGolden, Colorado 80401U.S.A.Tel: 1-800-962-4284
FINANCE DEPARTMENT
Scotiabank44 King Street WestToronto, OntarioCanada M5H 1H1Tel: (416) 866-4790Fax: (416) 866-4048E-mail:[email protected]
FINANCIAL ANALYSTS, PORTFOLIO MANAGERSAND OTHER INSTITUTIONAL INVESTORS
Tel: (416) 866-5982Fax: (416) 866-7867E-mail: [email protected]
For further informationPUBLIC, CORPORATE AND GOVERNMENT AFFAIRS
Scotiabank44 King Street WestToronto, OntarioCanada M5H 1H1Tel: (416) 866-3925Fax: (416) 866-4988E-mail: [email protected]
CUSTOMER SERVICE CENTRE
1-800-4-SCOTIA
Online
For product, corporate, financialand shareholder information:www.scotiabank.com andwww.scotiacapital.com
™ Trademark of The Bank of Nova Scotia.
Inside printed on FSC-certified Rolland Enviro100
Rolland Enviro100 environmental savingsQuantity of paper used: 198,324 lb. = 99.16 tons
Savings:
Trees: 1,686 trees – Mature trees that would have been cut
Waste: 107,192 lb. – Solid waste not generated
Water: 684 lb./1,011,035 gallons –Waterborne waste not created – Water/wastewater flow save
Air: 208,018 lb. – Atmospheric emissions eliminated
Energy: Mill powered with biogas:245,738 cubic feet of natural gas (70 m3) was saved and theair emissions were lowered by 27,170 lb. (CO2, SO2, NOx)
Cover printed on FSC-certified Domtar Luna Silk
At least 30% of the fiber used to manufacture FSC-certified Domtar Luna comes from well-managedforests independently certified by SmartWoodaccording to Forest Stewardship Council rules.
Cert no. SW-COC-1078
Cert no. SW-COC-1078