Opportunity Day Y2009 - set.or.th · BAFS’s Subsidiaries in 2009 4 Additional Investment in...
25
1 Opportunity Day Y2009
Transcript of Opportunity Day Y2009 - set.or.th · BAFS’s Subsidiaries in 2009 4 Additional Investment in...

1
Opportunity Day
Y2009
2
Disclaimer
The information, statements, forecasts and projects
contained herein reflect the Company’s current views
with respect to future events and financial
performance. These views are based on assumptions
subject to various risks and uncertainties. No
assurance is given that future events will occur, that
projections will be achieved or that the Company’s
assumptions are correct. Actual results may differ
materially from those projected.

3
Industry andCompany Update
Financial
Performance
Q & A
Content

4
2008 : 43.6 Mil. 2009 : 43.0 Mil.
Unit : Passenger Growth -1.6%
Source : AOT
Q1/09 Q2/09 Q3/09Q1/08 Q2/08 Q3/08 Q4/08 Q4/09
Around 70% was International passenger
Passenger Statistic At BKK & DMK
72%
72%73%
74%
10.8
71%
9.6
70%
10.5
70%71%
13.111.3
10.48.9
12.1

5
Flights Statistic At BKK & DMK
2009 (Y-O-Y) Growth -3.2%, Q4/2009 (Y-O-Y) Growth 17.1%
9,500
10,000
10,500
11,000
11,500
12,000
12,500
13,000
13,500
14,000
Jan. Feb. Mar Apr. May Jun. Jul. Aug. Sep. Oct. Nov. Dec.
2009 : 141,336
2008 : 146,047
2007 : 154,719Unit : Flights
Around 65% was International Flight

6
Uplift Volume At BKK & DMK
2009 (Y-O-Y) Growth -4.6%, Q4/2009 (Y-O-Y) Growth 16.0%
280
300
320
340
360
380
400
420
Jan. Feb. Mar Apr. May Jun. Jul. Aug. Sep. Oct. Nov. Dec.
2009 : 4,117
2008 : 4,313
2007 : 4,588
Unit : mil. litres
Around 90% was International Volume

7
356.6293.1297.9
363.0 383.6353.1
Oct. Nov. Dec. Oct. Nov. Dec.Oct. Nov. Dec. Oct. Nov. Dec.
11,833
9,900 9,965
12,10211,935
13,070
Q4/2009’s Flights & Volume
Flights
31,698
Q4/2008 Q4/2009
37,107
Volume
Q4/2009Q4/2008
1,100948
8
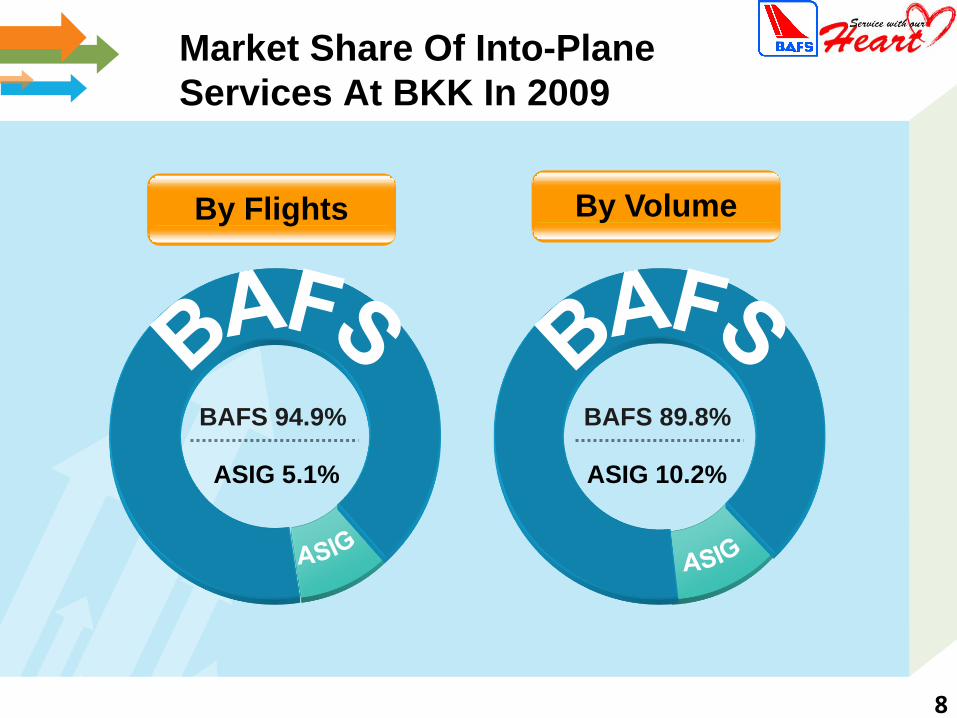
Market Share Of Into-Plane
Services At BKK In 2009
ASIG 10.2%
BAFS 89.8%
By Flights By Volume
ASIG 5.1%
BAFS 94.9%

9
Budget Airlines’ Flights
At BKK & DMK
2009 (Y-O-Y) Growth 2.6%, Q4/2009 (Y-O-Y) Growth 43.3%
1,500
2,000
2,500
3,000
3,500
Jan. Feb. Mar Apr. May Jun. Jul. Aug. Sep. Oct. Nov. Dec.
2009 : 30,636
2008 : 29,857
2007 : 34,012
Unit : Flights

10
Budget Airlines’ Volume
At BKK & DMK
2009 (Y-O-Y) Growth 4.6%, Q4/2009 (Y-O-Y) Growth 51.5%
10.00
15.00
20.00
25.00
Jan. Feb. Mar Apr. May Jun. Jul. Aug. Sep. Oct. Nov. Dec.
2009 : 235.8
2008 : 225.4
2007 : 264.5
Unit : mil. litres

11
Into-Plane Market Share By
Volume At BKK. And DMK.
in 2009
1. THAI AIRWAYS 40.8%
4. EVA AIR 3.0%
2. THAI AIRASIA 3.7%
6. QANTAS AIRWAYS 2.5%
7. OTHERS 44.0%
5. EMIRATES 2.8%
3. CHINA AIRLINES 3.2%

12
Company Update
Company’s Board approved 2nd Half 2009
dividend payment of baht 0.30 per share
which
XD date on Apr. 23, 2010 and
Payment date on May 14, 2010
1
Expected 2010’s Volume Growth 4%2
Total 2009’s DPS is 0.43 Bt.
Dividend Payout ratio is 59%
of Net Profit of BAFS Only

13
389
355378
270
290
310
330
350
370
390
410
Jan Feb Mar Apr May Jun Jul Aug Sep Oct Nov Dec
Outlook 2010
Actual Jan. and Feb. 2010’s Volume = 744 ML.
(Growth +9.6% (Y-O-Y))
Est. Q1/2010 Growth +8.3% (Y-O-Y)
Actual 2009 : 4,117 ML.Growth -4.6% (Y-O-Y)
Budget 2010 : 4,182 ML. ,Growth +1.7% (Y-O-Y)
Est. Growth 2010 +4% (Y-O-Y)
Unit : mil. litres

14
Company Update
2009’s Significant Performance compared
with 2008
Negative Positive
Volume -4.6%
Total Revenue -4.3%
Cost of Services -2.9%
Admin. Expense -6.6%
Personnel Expense -5.1%
Net Profit +5.8%
3

15
Company Update
Received dividend 133.7 mil. Bt. from
BAFS’s Subsidiaries in 2009
4
Additional Investment in Hydrant
Pump#10 around 21.0 mil. Bt. due to
demand of volume expansion
5

16
Financial Performance

17
Consolidated P<HB. Million 2009 2008 % Y-O-Y
Services income 1,996.8 2,058.9 -3.0%
Rental income 16.7 19.3 -13.4%
Others income 21.4 48.8 -56.1%
Total revenues 2,035.0 2,127.0 -4.3%
Cost of services 895.5 922.4 -2.9%
- A.C.F. 216.8 222.1 -2.4%
- Depre.&Amort. 365.0 357.1 2.2%
Administrative exp. 322.4 345.4 -6.6%
EBIT 789.0 833.5 -5.3%
Finance exp. 107.0 163.7 -34.6%
Income tax 191.6 203.3 -5.8%
Net Profit 463.0 437.7 5.8%
Net Profit Margin 22.8% 20.6%

18
Consolidated P<HB. Million 4Q2009 4Q2008 % Y-O-Y
Services income 532.4 457.5 16.4%
Rental income 4.1 4.6 -12.0%
Others income 8.0 26.0 -69.4%
Total revenues 544.4 488.2 11.5%
Cost of services 253.4 243.2 4.2%
- A.C.F. 58.8 49.0 20.0%
- Depre.&Amort. 90.6 94.3 -3.9%
Administrative exp. 113.8 119.7 -4.9%
EBIT 170.2 118.7 43.3%
Finance exp. 24.0 40.2 -40.2%
Income tax 41.9 29.6 41.3%
Net Profit 97.0 43.2 124.3%
Net Profit Margin 17.8% 8.9%

19
2009 Cost Structure
COS = 74%
Admin. = 26%ACF.
18%
Direct Labor
18%
Depre.&
Amort.
30%
Others
15%
Maintenance
4%
Indirect Labor
13%
Insurance
2%

20
2,0352,127
1,1541,228
438 463-
500
1, 000
1, 500
2, 000
Revenue EBITDA Net Profit
Profitability Margin
Unit : Million Baht
56.7%
2009
57.7%
EBITDA Margin (%)
2008

21
4,070 3,571
2,991 3,273
Total Liabilities Total Equity
48%
Unit : Million Baht
52%
Capital Structure
D/E Ratio improved from 1.36(x) to 1.09(x) and
BV/S increased to 6.42 bt. From 5.86 bt.
2008 2009
Total Equity +9.4% and Total Liabilities -12.3%
6,8447,061

22
(Unit : MB.)
Outstanding Loan as of Dec. 2009
* Including portion will be paid in one year which total amount of
3,102 MB. & Average cost of debts at 3.2% per year
Credit Facility
Outstanding Loan*
Rate
BAFS-KBANK 800 457 5.6%
BAFS-BBL 2,000 1,600 FDR+1.25%
TARCO-BBL 700 420 FDR+1.75%
TARCO-BBL 8 M.US$ 163(4.8 M.US$) 6.56%
TARCO-BBL 300 170 MLR-1.5%
JP-One-BBL 120 72 MLR-1.0%
BAFS-NBANK 220 220 MLR-2.0%

23
102 102 102 51
260 260360 360
360
269 269214
102
2424
-
24
2525
2525
0
300
600
2010 2011 2012 2013 2014 2015
MB.
KBANK BBL BBL (TARCO) BBL (JP-One) NBANK
Loan Payment Schedule
655680
725
487436
120

24
Financial Ratios As Of 2009
2009 2008 2007
Gross Margin 55.5% 55.6% 58.5%
EBITDA Margin 56.7% 57.7% 60.5%
Net Profit Margin 22.8% 20.6% 24.1%
ROA 6.7% 6.0% 7.2%
ROE 14.8% 14.5% 19.0%
D/E (X) 1.09 1.36 1.47
BV / Share (bt.) 6.42 5.86 5.96
EPS (bt.) 0.91 0.86 1.14
DPS (bt.) 0.43 0.40 0.52

25
Opportunity Day
2009
![[1]Oracle® Retail Invoice Matching Security Guide Release 21.0](https://static.fdocuments.us/doc/165x107/623724c926ea023b1a048315/1oracle-retail-invoice-matching-security-guide-release-210.jpg)