Opportunity Day Q2/2021 Operating Results
40
World’s Greenergy Icon Evolving the world through the greener ways 1 Opportunity Day Q2/2021 Operating Results 27 August 2021 Ticker: BCPG (SET)
Transcript of Opportunity Day Q2/2021 Operating Results

World’s Greenergy IconEvolving the world through the greener ways 11
Opportunity DayQ2/2021 Operating Results27 August 2021Ticker: BCPG (SET)

2Q21 Highlights
The project had already become the first renewable energy project in Thailand to deploy an energy storage system (ESS) as the solution to the intermittency of wind power and was selected as an ERC Sandbox Project.
Lom Ligor Wind Farm won “Battery Storage Deal of The Year” at the Triple A Infrastructure Asset Awards 2021
Impressive recurring earnings growth from Hydropower projects
33.6%
Strong revenue contribution from Hydropower project in Lao PDR named “Nam San 3A” and “Nam San 3B” owing to higher rainfall.
Assigned credit rating of A- by TRIS Rating with a stable outlook and issue rating of A-
Credit rating “A-” with Stable Outlook”
Issue rating of “A-” in senior unsecured debentures
Entering high season
High season
Efficiency improvement scheme to solar projects in Thailand
Improved efficiency to 3 solar projects in Thailand to enhance revenue contribution and projects return.
Efficiency improvement by installed tracking system and change PV module.
2
Forecast capacity factor of Nam san 3A and Nam
San 3B

…. And new investments followed by
3
Monsoon Wind power projectInstalled capacity: 600MWEquity capacity: 270MWHolding (%): 45%COD: 2025
VRB® Energy is a global leader in vanadium redox battery- Utility scale- Long life cycle- Scalability / Flexibility- Depth of discharge- Safety- Recyclable
✓ ✓
New Investments in pipeline
Monsoon Signed PPA with EVN Investment in VRB Energy

4
Key developments
Performance & Guidelines
Agenda
Portfolio & Pipelines

5
Key developments
Performance & Guidelines
Agenda
Portfolio & Pipelines

6
860.0 MWppa
165.8 MW 10.0 MW
THAILAND
Operating Developing
157.5 MW 24.0 MW
INDONESIA
Operating Developing
14.4 MW 5.6 MW
THE PHILIPPINES
Operating Developing
14.7 MW 75.0 MW
JAPAN
Operating Developing
114.0 MW
LAOS TO VIETNAM
Unit: Contracted capacity or equity MWppa
9.0 MW
475.4 384.6
Operating Developing
270.0 MWDevelopingOperating
Business footprints in 5 countries in Asia
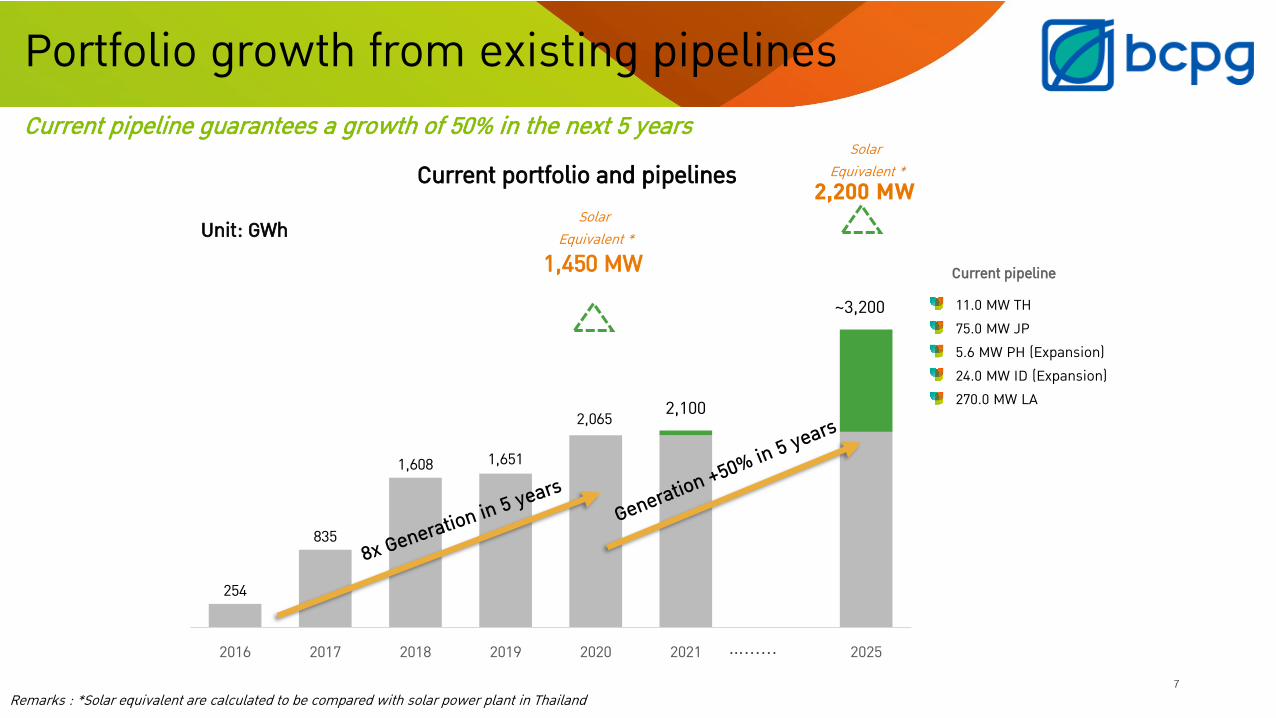
254
835
1,608 1,651
2,065
2016 2017 2018 2019 2020 2021 20257
…......
Remarks : *Solar equivalent are calculated to be compared with solar power plant in Thailand
Unit: GWh
Current portfolio and pipelines
Current pipeline guarantees a growth of 50% in the next 5 years
Solar Equivalent *
11.0 MW TH75.0 MW JP 5.6 MW PH (Expansion)24.0 MW ID (Expansion)270.0 MW LA
Current pipeline1,450 MW
2,200 MWSolar
Equivalent *
Portfolio growth from existing pipelines
2,100
~3,200

50%
25%
25%
DevelopingMature
Frontier
158
114
249
300
Target PortfolioMix
Future Project
Target PortfolioMix
2025F
Balancing our portfolio risk appetite
Technology mix can be flexible given dynamic environment and availability of potential projects
Portfolio mix design based on risk appetite and mitigation capability

Concentrate in matured and developing countries to balance our portfolio risk appetite
Operating – Quick win to generate immediate contributionGreenfield – Assurance to medium and long term growth
Geog
raph
ies
Maintain focus on clean energy, with endeavor in advanced technologies like ESS & Digital Energy
Tech
nolo
gies
Inve
stm
ent S
tage
9
Expanding through organic and inorganic growthto sustain growth after end of government subsidization
Remark:Matured Countries : Fitch’s Rating “A” and aboveDeveloping Countries : Fitch’s Rating Between “B” and “BBB+”
“Accelerating growth by focusing on large scale projects”

1010
VRB® Energy is a global leader in vanadium redox battery
MW & GW-class are available
VRB Energy: Footprint to ESS business

11
Key developments
Performance & Guidelines
Agenda
Portfolio & Pipelines

12
Lao: Hydropower PlantNam San 3A & 3B Hydro Power Plants (Run-of-the-river)
Projects: Nam San 3A Nam Sam 3B Total
Installed MW 69 MW 45 MW 114 MW
Holding (%): 100%
COD: 29 Jan 2016 25 Sep 2015
Acquisition Date: 20 Sep 2019 26 Feb 2020
Investment: USD 173.2 mn(THB 5,326 mn)
USD113.2 mn(THB 3,581 mn)
USD 286.4 mn(THB 8,907 mn)
PPA: Laos Terms: 27 years from COD (2015 – 2042)Tariff: 6.72 Uscent/kWh (2020)Take-or-pay: 95%Currency: 90% USD/10% KIP
PPA: Vietnam Terms: 25 years from COD ([2022] – 2047)Tariff: 6.95 Uscent/kWhTake-or-pay: 90%Currency: 100% USD
Location: Xiengkhouang, Laos PRD
Capacity Factor: 44% - 47% (Q3 66% - 75%)Range capacity factor after acquisition since Sep 2019
Nam San 3A 69 MWOperating
Nam San 3B 45 MWOperating
Transmission LineDeveloping
Thailand
Cambodia
Vietnam
32 1
Laos
220kV Transmission line>500 MW capacity
1
2
3
Northern Region

Developing: 0.0 MWOperating: 114.0 MW
Hold: 100.0%
Subsidiaries
13
220 kV transmission line
Transmission line 3A & 3B: LA-VNMilestones tracking to be COD within 2022
1
Substation construction2
Switching station at border3
79 km Transmission Line
BorderNam San 3A
Nam San 3B
1
2 3
Foundation excavation
Steel binding Framework installationConcrete pouring Foundation
Land preparation & substation foundation work
Overall construction progress as plan at 44% completed.
Tower

Nam San 3A & 3B HPP milestones
Prime Minister’s Approval
PPA signed with EVN
- Acceptance of Grid Study- Tariff Negotiation Range- Project Timeline
- Inclusion of Energy Import into VN’s PDP - Construction of transmission line in VN- COD by 2022- Tariff Ceiling Price
- Signing of Definitive PPA and other ancillary agreements
3 steps of PPA issuance process completed, transmission line is well under wayCross-border PPA milestones: Hydropower
23
Jan-20
14
Tariff MOU: Hydropower✓
✓
✓
1
Switc
h of
f-tak
er to
EV
N wi
thin
2022
Transmission line construction

15
Laos: Wind Power Plant
Monsoon Wind Power Plant Installed MW 600 MW
Equity MW 270 MW
Holding (%): 45%
Area Exploration area of over 425,000 rais
Status Advanced DevelopmentMet mast installed >3 yearsPPA signed in July 2021
COD: 2025
Location: Attopu, Lao PRD
Capacity Factor: Est. 33%
Leverage (D:E) [70:30]
Thailand
Cambodia
Vietnam
Project Area
Laos
Large scale development, with cross-border PPA

16
Lao-VN 600MW Wind Farm milestones
Cross-border milestones: Wind farm
Project and transmission line construction
16
Financial close
- Financing in place
To b
e CO
D wi
thin
2025
Prime Minister’s Approval
- Acceptance of Grid Study- Tariff Negotiation Range- Project Timeline
- Inclusion of Energy Import into VN’s PDP - Construction of transmission line in VN- COD by 2023- Tariff Ceiling Price
Tariff MOU: Wind Farm
PPA signed with EVN EPC Selection
- Final negotiation with EPC bidders
✓
Jul-2021
1
2
34
✓
✓Aug-2020
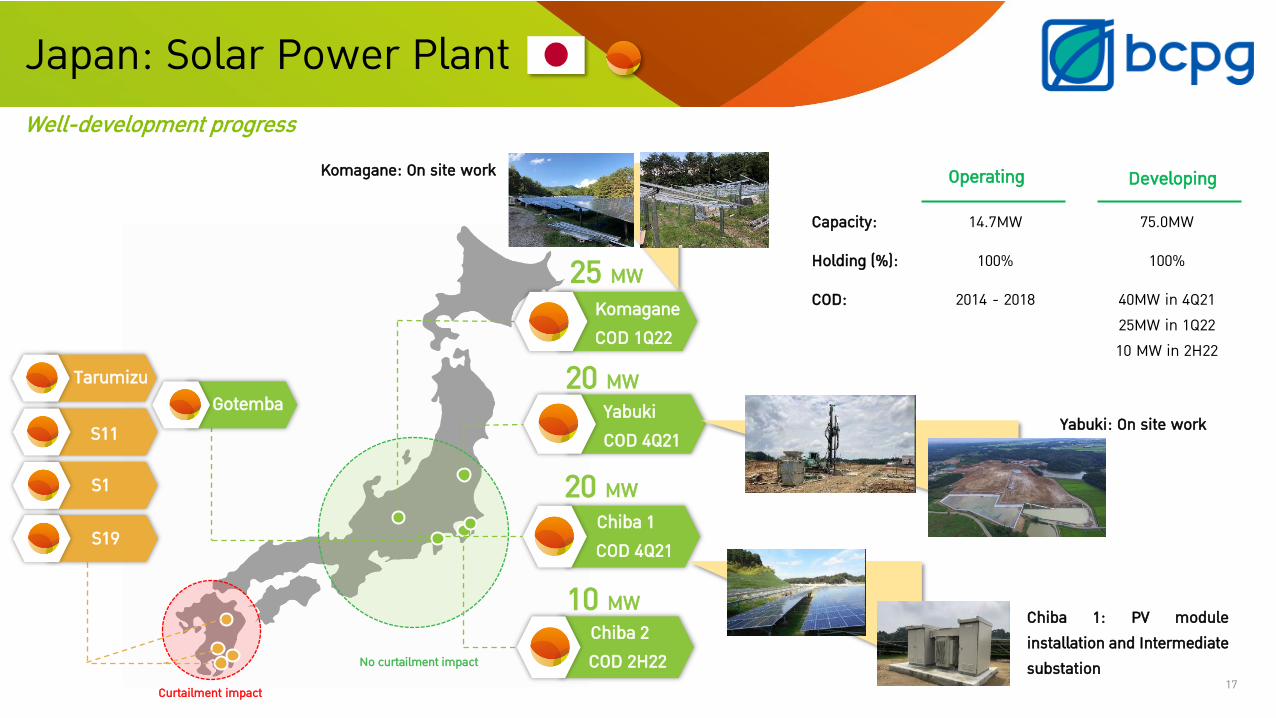
Japan: Solar Power Plant
Operating
Capacity: 14.7MW 75.0MW
Holding (%): 100% 100%
COD: 2014 - 2018 40MW in 4Q2125MW in 1Q22 10 MW in 2H22
Developing
25 MW
20 MWYabukiCOD 4Q21
Chiba 1COD 4Q21
Chiba 2COD 2H22
20 MW
10 MW
S1
S19
S11
TarumizuGotemba
KomaganeCOD 1Q22
Curtailment impact
No curtailment impact
Well-development progress
Chiba 1: PV module installation and Intermediate substation
Yabuki: On site work
17
Komagane: On site work

18
Efficiency Improvement of 15 MW of Solar THOpportunity to enhance efficiency of 15MW solar TH
No. Projects LocationTariff Power
StructureContracted
Capacity (MW)COD
1 RPV Energy KanchanaburiAdder THB
8/kWh
5.015/10/12
2 JKR Energy Kanchanaburi 5.0
3 Lopburi Solar Lopburi 5.0 4/2/14
4 Prachinburi Solar Prachinburi FiT: THB 5.66/kWh 5.0 30/12/16
1-23
4
Efficiency improvement by installed tracking system and change PV
module for “Better operating performance”
Lopburi SolarEfficiency improvement COD: 18 May 2021
RPV & JKREfficiency improvement COD: 3 June 2021

19
Key developments
Performance & Guidelines
Agenda
Portfolio & Pipelines

20
2Q21 QoQ YoY 1H21 YoY 2Q21 YoY
EBITDA 992.1 +4.7% +15.4% 1,940 15.2% MW 475.4 +5.1%
Core profit 503.9 +3.1% +33.6% 992.8 27.1% D/E 1.1 -0.4
Unit: THB mn
YoY
(+) Full quarter contribution from 4 new solar power projects in Thailand (20MW) and higher revenue contribution from hydropower projects, owing to higher rainfall. (+) Higher share of profit from both geothermal power plants in Indonesia and wind power plant in Philippine.
Key Takeaway
Financial highlights for 2Q21Core profit grew YoY and QoQ
QoQ
(+) Higher revenue contribution from hydropower projects (entering high season) and solar projects in Japan (better irradiation).(+) Higher share of profit from geothermal power plants in Indonesia thanks to lower shutdown days.
YoY
(+) Full 6-month of revenue contribution from new projects including hydropower project, “Nam San 3B” and the 4 new solar power projects in Thailand (20MW). (+) Higher revenue contribution from hydropower project in Lao PDR, owing to higher rainfall. (+) Higher share of profit from both geothermal power plants in Indonesia and wind power plant in Philippines.

Developing: 0.0 MWOperating: 9.0 MW
Hold: 100.0%
Subsidiaries
Developing: 11.0 MWOperating: 164.2 MW
Hold: 100.0%
Subsidiaries
TH performanceTH revenue growth YoY was backed by better performance of solar and wind projects.
21
Unit: GWh Unit: GWh
Power generation & Capacity factor (%)
In 2Q21, solar revenue increased YoY from the full quarter contribution of the 4 new solar power plants (20MW) but decreased QoQ following the drop in capacity factor. For 1H21, solar revenue increased YoY from the contribution of the 4 new solar power plants (20MW).
Revenue (TH) Unit: THB million
TH revenue grew YoY, driven by the increase in solar and wind revenue but dropped QoQdue to the decrease in solar and wind revenue.
In 2Q21, wind revenue rose YoY from higher wind speed at the project. However, wind revenue declined QoQ due to entering low season.For 1H21, wind revenue rose YoY from higher wind speed at the project.
Solar Wind

LA Performance
22
LA revenue grew YoY from higher rainfall and QoQ from entering high season.
Unit: GWh
2Q21 electricity generation grew YoY. “Nam San 3A” and “Nam San 3B” capacity factor was 41% thanks to higher rainfall.Also, 2Q21 electricity generation rose QoQ owing to seasonal factor of hydro power plants.For 1H21, electricity generation enhanced YoY from the full 6-month recognition of “Nam San 3B” and higher capacity factor from higher rainfall.
Unit: THB millionRevenue (LA) Power generation & Capacity factor (%)
Developing: 0.0 MWOperating: 114.0 MW
Hold: 100.0%
Subsidiaries
LA (Hydro)

Developing: 75.0 MWOperating: 14.7 MW
Hold: 100.0%
Subsidiaries
JP performance
23
JP revenue rose QoQ from favorable weather condition but dropped YoY due to lower irradiation.
Unit: THB million
2Q21 electricity generation dropped YoY due to lower irradiation.However, 2Q21 electricity generation increased QoQ from higher irradiation from favorable weather condition compared to winter season in Q1/2021 (low season). For 1H21, electricity generation rose YoY from better irradiation.
Unit: GWh
Subsidiaries
Power generation & Capacity factor (%) Revenue (JP)

Developing: 24.0 MWOperating: 157.5 MW
Hold: 33.3%
Associates
ID PerformanceGeothermal power plants in Indonesia
24Remark: *Generation based on holding percentage
Share of profit improved both YoY and QoQ.
Unit: GWh
Power generation & Capacity factor (%)
Unit: THB million
In 2Q21, the improvement YoY came from higher tariff, increase in electricity generation and lower finance cost. Meanwhile, the increase QoQ resulted from lower shutdown days. For 1H21, the increase YoY came from higher tariff rate and lower finance cost.
Amortization (96.5) (90.8) (95.1) (190.9) (185.9)
One-time items* - - - (66.7)* -
Net share of profit 117.6 121.5 152.6 251.5 274.0*Including Tax provision THB 23.9 mn and Allowance for account receivable THB 42.8 mn in 1Q20.
Share of profit

Developing: 5.6 MWOperating: 14.4 MW
Hold: 40.0%
Associates
PH PerformanceWind power plant in the Philippines
25
Growth YoY was supported by higher wind speed and tariff escalation.
Remark: *Generation based on holding percentage
Unit: GWh
Amortization (8.2) (7.7) (8.1) (16.3) (15.8)
One-time items - - - - -
Net share of profit (15.1) 19.0 4.5 9.1 23.5
2Q21 Electricity generation rose YoY from higher wind speed. Also, tariff escalation for Jan – May 2021 has been recently approved. However, 2Q21 Electricity generation dropped QoQ due to entering low season.For 1H21, electricity generation increased YoY from higher wind speed and approved tariff escalation for Jan – May 2021.
Unit: THB million
Power generation & Capacity factor (%) Share of profit

Remark: EBITDA from operation including share of profit from associates (after amortization and before one-time items)
Revenue and EBITDA grew YoY and QoQ.
26
EBITDA (Incl. shares of profit)
EBTIDA growth YoY and QoQ followed the increase of operating revenue and share of profit. For 1H21, EBITDA increased YoY in line with revenue growth and share of profit growth.
Financial Performance: Revenue & EBITDA
2Q21 revenue grew YoY from the increase in TH and LA revenue. Meanwhile, 2Q21 revenue increased QoQ from the increase in JP and LA revenue. For 1H21, revenue rose YoY thanks to the increase in TH, JP and LA revenue.
Unit: THB millionUnit: THB millionRevenue

27
Unit: THB million
IBD breakdown by maturity IBD breakdown by currency IBD breakdown by Fixed-Floating rate
Cost of debt (Kd) was lower YoY thanks to declining of market interest rate resulted in floating rate loan (majority portion) had lower finance cost and partial loan repayment.
Finance cost and Kd (%)
Remark: The average finance costs calculated by a simple average method.
Kd reduction YoY from benefit of floating portion after market rate decline
Finance cost

28
2Q21 core profit grew YoY and QoQCore profit & Core profit margin (%)
Remark: Core profit equals to net profit minus FX gain/loss and one-time items
Unit: THB million
Net profit & Net profit margin (%)
Core profit & Net profit
Unit: THB million
2Q21 core profit growth YoY and QoQ was mainly driven by revenue growth and share of profit growth. For 1H21, core profit improved from the recognition of 6-month contribution from the new projects, better contribution from existing power plants and receiving tariff escalation.
2Q21 net profit increased YoY and QoQ, mainly came the improvement of core profit as mentioned. Also, there was FX gain of THB 80.3 million in 2Q21, compared to FX loss of THB 98.4 million in 2Q20 and FX gain of THB 22.7 million in 1Q21. For 1H21, FX gain was THB 103.0 million compared to FX gain of THB 226.8 million in1H20. As a result, net profit growth was slightly lower than core profit growth.

29
Total assets
D/E ratio below covenant level
Financial position
Remark: Dividend policy = not less than 40% of the Company’s net profit based on separated yearly Financial Statement
Covenant = 3.0x
2021 Dividend Payment
D/E Ratio Credit Rating
Period Per share (THB) Amount (THB mn)
1H21 0.16 434
Payout Ratio 40.0%
Credit rating “A-” with Stable Outlook”
Issue rating of “A-” in senior unsecured debentures
30
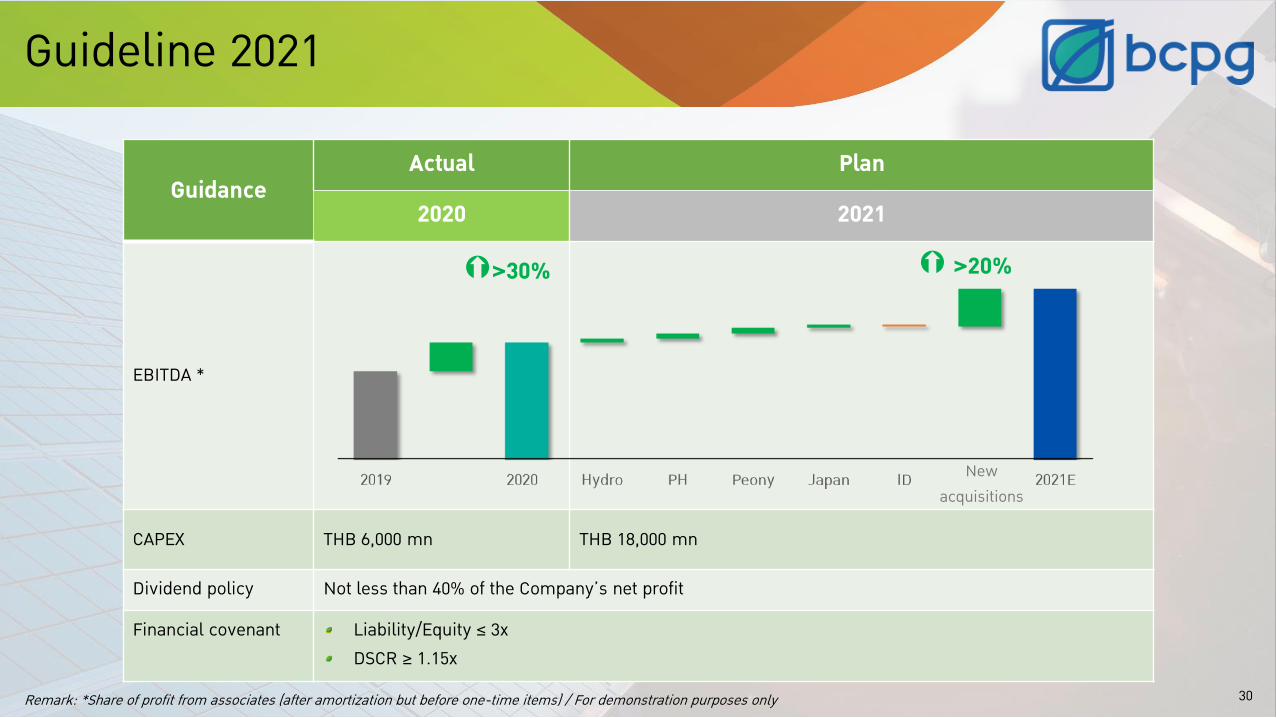
GuidanceActual Plan
2020 2021
EBITDA *
CAPEX THB 6,000 mn THB 18,000 mn
Dividend policy Not less than 40% of the Company’s net profit
Financial covenant Liability/Equity ≤ 3xDSCR ≥ 1.15x
Remark: *Share of profit from associates (after amortization but before one-time items) / For demonstration purposes only
Guideline 2021
>20%
New acquisitions
>30% >20%

31
Q&A

32
Financial Statement
Unit: THB million 2Q20 2Q21 ∆ (%) 1Q21 ∆ (%) 1H20 1H21 ∆ (%)
Revenue from sale and redering of service 969.6 1,088.2 12.2% 1,046.6 4.0% 1,856.0 2,134.9 15.0%Cost of sale and rendering of services (358.1) (396.1) 10.6% (393.7) 0.6% (667.0) (789.7) 18.4%Administrative expenses (114.2) (148.9) 30.3% (137.5) 8.3% (261.7) (286.3) 9.4%Operating profit 497.3 543.3 9.2% 515.5 5.4% 927.3 1,058.8 14.2%Share of profit of investment in associates (exlcuding one-time item) 102.4 157.0 53.3% 140.5 11.8% 260.6 297.5 14.2%
EBITDA 860.0 992.1 15.4% 947.9 4.7% 1,684.4 1,939.9 15.2%Other income/(expense) 4.4 15.3 244.0% 24.8 (38.6%) 14.4 40.1 178.1%FX gain/(loss) (98.4) 80.3 NA 22.7 NA 226.8 103.0 NAOther one-time item (1.1) (14.4) 1192.8% 6.9 (309.5%) (70.1) (7.5) (89.3%)EBIT 504.7 781.5 54.8% 710.3 10.0% 1,359.0 1,491.8 9.8%Finance costs (220.3) (192.8) (12.5%) (185.5) 3.9% (407.9) (378.3) (7.3%)EBT 284.4 588.8 107.0% 524.8 12.2% 951.1 1,113.6 17.1%Income tax (expense) benefit 70.4 (23.9) NA (1.6) NA (22.7) (25.5) NAMinority interest 0.0 0.2 NA 0.2 NA (0.0) 0.3 NANet profit 354.8 565.1 59.3% 523.4 8.0% 928.5 1,088.4 17.2%Recurring profit * 377.1 503.9 33.6% 488.8 3.1% 780.8 992.8 27.1%Basic Earnings per Share (THB) 0.18 0.21 16.7% 0.20 5.0% 0.46 0.41 (10.9%)Remark:*Excluding gain/(loss) on FX and one-time items

33
Financial StatementUnit: THB million 2020
% of total assets
2Q21 % of total
assets ∆ (%)
Cash and cash equivalents 11,138.3 21.7% 6,297.6 12.2% (43.5%)Current investments 4.6 0.0% 3,000.0 5.8% 65164.2%Trade accounts receivables 1,219.2 2.4% 1,544.9 3.0% 26.7%Other current assets 130.9 0.3% 246.7 0.5% 88.5%Total current assets 12,492.9 24.4% 11,089.3 21.4% (11.2%)Investments in associate & subsidiaries 11,722.8 22.9% 12,719.8 24.6% 8.5%Property, plant and equipment 14,667.8 28.6% 15,141.1 29.3% 3.2%Goodwill and Intangible assets 11,313.7 22.1% 11,661.6 22.5% 3.1%Other non-current assets 1,022.4 2.0% 1,151.5 2.2% 12.6%Total non-current assets 38,726.6 75.6% 40,674.0 78.6% 5.0%Total Assets 51,219.6 100.0% 51,763.3 100.0% 1.1%Short-term borrowings from financial institutions 1,770.6 3.5% 0.0 0.0% (100.0%)Current portions of long-term borrowings 1,701.0 3.3% 2,568.7 5.0% 51.0%Long-term borrowings 23,589.7 46.1% 23,593.4 45.6% 0.0%Other liabilities 1,609.3 3.1% 1,477.5 2.9% (8.2%)Total liabilities 28,670.6 56.0% 27,639.6 53.4% (3.6%)Equity attributable to owners of the Company 22,480.1 43.9% 24,055.2 46.5% 7.0%Non-controlling interests 68.8 0.1% 68.5 0.1% (0.5%)Total liabilities and Equity 51,219.6 100.0% 51,763.3 100.0% 1.1%

34
Financial Statement
Unit: THB million 1H20 1H21 ∆ YoYNet cash from (used in) operating activities 1,599.5 1,451.1 (148.4)
Net cash from (used in) investing activities (4,718.2) (4,026.0) 692.2
Net cash from (repay to) financing activities 5,624.5 (2,439.6) (8,064.1)
Net increase in cash and cash equivalents 2,505.8 (5,014.4) (7,520.3)
Cash and cash equivalents at 1 January 1,445.2 11,138.3 9,693.1
Effect of exchange rate changes on balances held in foreign currencies (195.6) 173.8 369.4
Cash and cash equivalents at end period 3,755.5 6,297.6 2,542.2
CAPEX (4,716.6) (966.1) 3,750.5
35
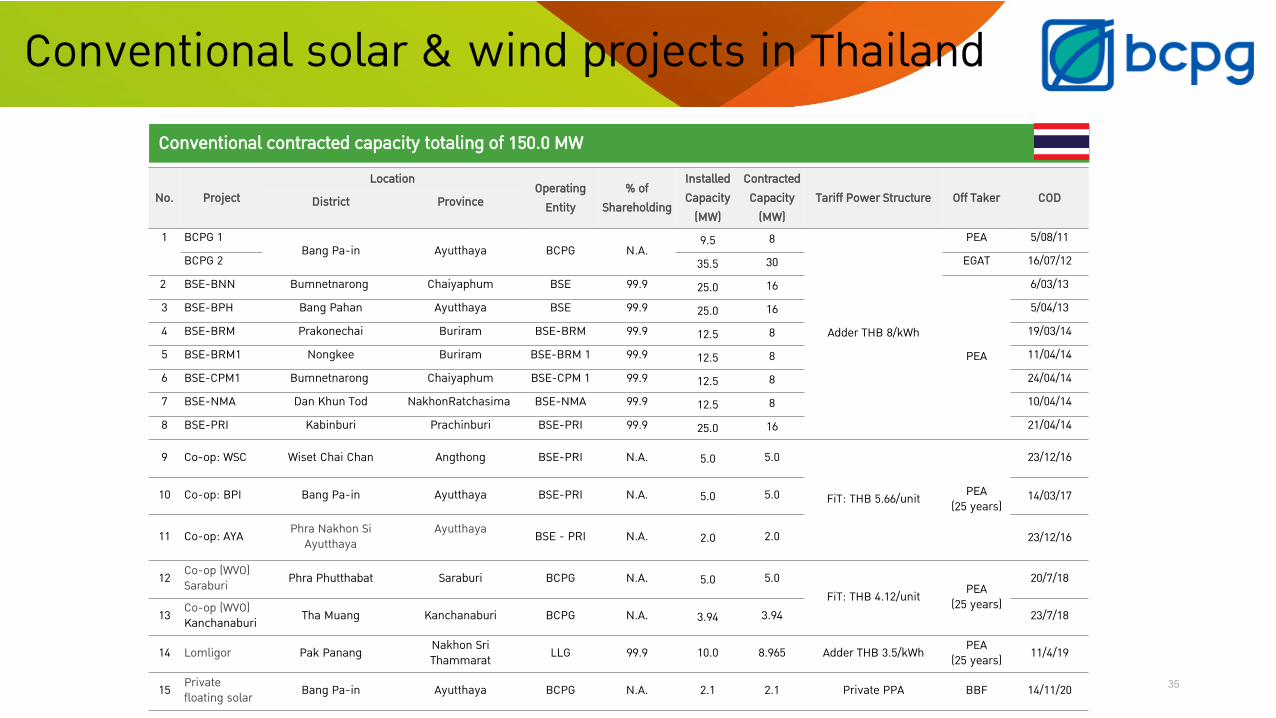
No. ProjectLocation
Operating Entity
% of Shareholding
Installed Capacity
(MW)
Contracted Capacity
(MW)Tariff Power Structure Off Taker CODDistrict Province
1 BCPG 1Bang Pa-in Ayutthaya BCPG N.A.
9.5 8
Adder THB 8/kWh
PEA 5/08/11BCPG 2 35.5 30 EGAT 16/07/12
2 BSE-BNN Bumnetnarong Chaiyaphum BSE 99.9 25.0 16
PEA
6/03/133 BSE-BPH Bang Pahan Ayutthaya BSE 99.9 25.0 16 5/04/134 BSE-BRM Prakonechai Buriram BSE-BRM 99.9 12.5 8 19/03/145 BSE-BRM1 Nongkee Buriram BSE-BRM 1 99.9 12.5 8 11/04/146 BSE-CPM1 Bumnetnarong Chaiyaphum BSE-CPM 1 99.9 12.5 8 24/04/147 BSE-NMA Dan Khun Tod NakhonRatchasima BSE-NMA 99.9 12.5 8 10/04/148 BSE-PRI Kabinburi Prachinburi BSE-PRI 99.9 25.0 16 21/04/14
9 Co-op: WSC Wiset Chai Chan Angthong BSE-PRI N.A. 5.0 5.0
FiT: THB 5.66/unit PEA(25 years)
23/12/16
10 Co-op: BPI Bang Pa-in Ayutthaya BSE-PRI N.A. 5.0 5.0 14/03/17
11 Co-op: AYA Phra Nakhon Si Ayutthaya
Ayutthaya BSE - PRI N.A. 2.0 2.0 23/12/16
12 Co-op (WVO)Saraburi Phra Phutthabat Saraburi BCPG N.A. 5.0 5.0
FiT: THB 4.12/unit PEA(25 years)
20/7/18
13 Co-op (WVO)Kanchanaburi Tha Muang Kanchanaburi BCPG N.A. 3.94 3.94 23/7/18
14 Lomligor Pak Panang Nakhon Sri Thammarat LLG 99.9 10.0 8.965 Adder THB 3.5/kWh PEA
(25 years) 11/4/19
15 Private floating solar Bang Pa-in Ayutthaya BCPG N.A. 2.1 2.1 Private PPA BBF 14/11/20
Conventional contracted capacity totaling of 150.0 MW
Conventional solar & wind projects in Thailand
36
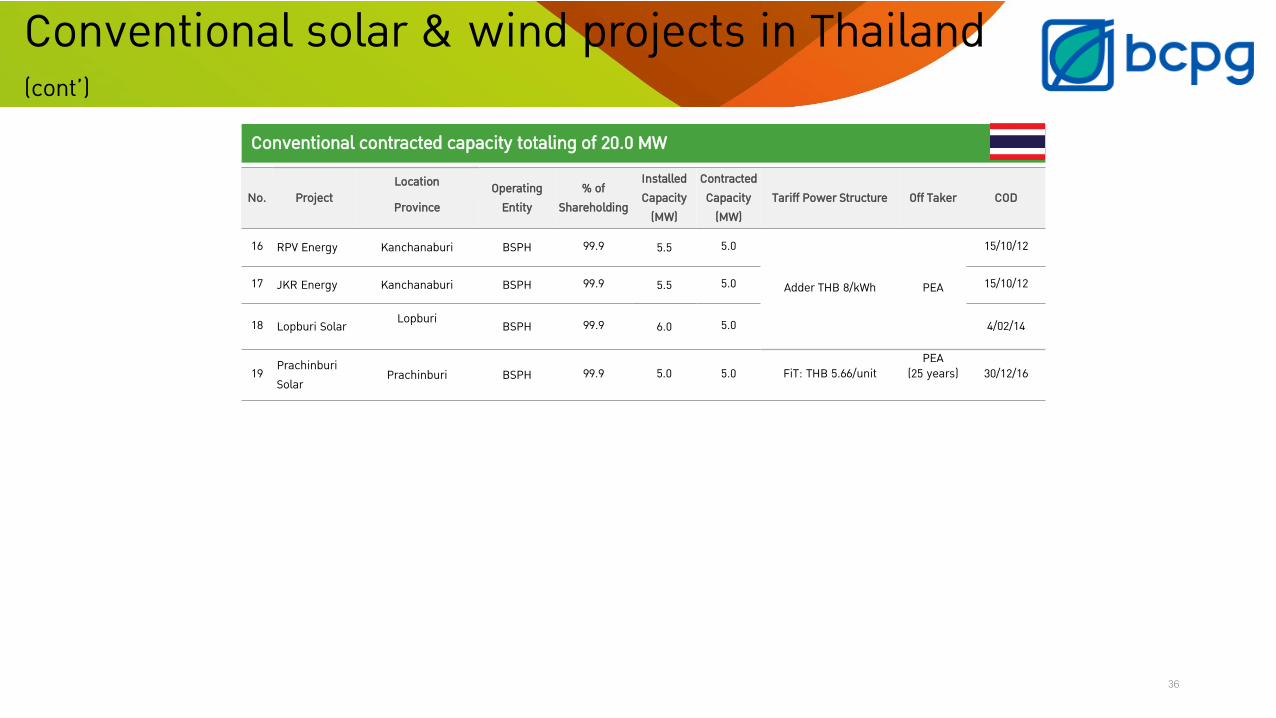
No. ProjectLocation Operating
Entity% of
Shareholding
Installed Capacity
(MW)
Contracted Capacity
(MW)Tariff Power Structure Off Taker COD
Province
16 RPV Energy Kanchanaburi BSPH 99.9 5.5 5.0
Adder THB 8/kWh PEA
15/10/12
17 JKR Energy Kanchanaburi BSPH 99.9 5.5 5.0 15/10/12
18 Lopburi Solar Lopburi BSPH 99.9 6.0 5.0 4/02/14
19 Prachinburi Solar
Prachinburi BSPH 99.9 5.0 5.0 FiT: THB 5.66/unitPEA
(25 years) 30/12/16
Conventional contracted capacity totaling of 20.0 MW
Conventional solar & wind projects in Thailand(cont’)

37
Contracted operating capacity of 4.6 MW
# Type Segment Relation-ship
Project Location Contracted Capacity
Terms (year)
Tariff power structure
Status/ COD
1 Rooftop Industrial Subsidiary Kingboard Uthai, Ayutthaya 0.752 MW 20 Private PPA COD 1/12/2018
2Rooftop Commercial Partner
Habito, T77, Sansiri
Wattana, Bangkok 0.053 MW 25 Private PPA COD 12/1/2019
3Rooftop
Commercial/Residential
Partner T77, Sansiri Wattana, Bangkok 0.376 MW 25 Private PPA COD 1/5/2019
4 Rooftop Commercial/Residential
Partner Escape, Sansiri
Lam Luk Ka, Phathum Thani
0.277 MW25 Private PPA COD 1/2/2020
5 Rooftop Industrial Partner PCF, Sansiri Pak Chong, Nakhon Ratchasima
0.063 MW25 Private PPA COD 1/2/2020
6 Rooftop Mix Others Lots Several cities 2.131 MW 15 – 20 Private PPA 4Q20-2Q21
7 Rooftop Commercial Partner (75%)
CMU Mueang, Chiangmai 0.9 MW 20 Private PPA COD 1/7/2020
8 Rooftop Commercial Partner (75%)
CMU Mueang, Chiangmai 8.1 MW 20 Private PPA Under construction
9 Rooftop Mix Others Lots Several cities 2.8 MW 15 – 20 Private PPA Under construction
Other solar rooftop projects in Thailand
38
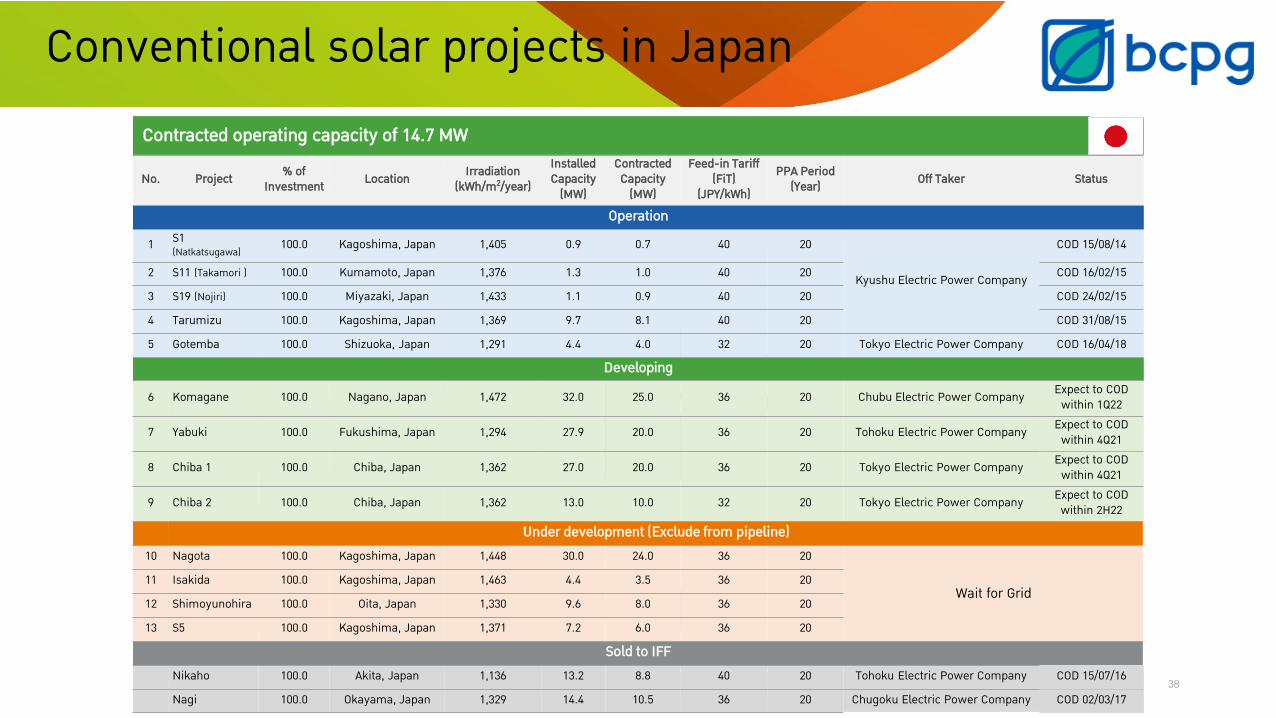
Contracted operating capacity of 14.7 MW
38
No. Project % ofInvestment Location Irradiation
(kWh/m2/year)Installed Capacity
(MW)
Contracted Capacity
(MW)
Feed-in Tariff (FiT)
(JPY/kWh)PPA Period
(Year) Off Taker Status
Operation1 S1
(Natkatsugawa) 100.0 Kagoshima, Japan 1,405 0.9 0.7 40 20
Kyushu Electric Power Company
COD 15/08/14
2 S11 (Takamori ) 100.0 Kumamoto, Japan 1,376 1.3 1.0 40 20 COD 16/02/15
3 S19 (Nojiri) 100.0 Miyazaki, Japan 1,433 1.1 0.9 40 20 COD 24/02/15
4 Tarumizu 100.0 Kagoshima, Japan 1,369 9.7 8.1 40 20 COD 31/08/15
5 Gotemba 100.0 Shizuoka, Japan 1,291 4.4 4.0 32 20 Tokyo Electric Power Company COD 16/04/18
Developing
6 Komagane 100.0 Nagano, Japan 1,472 32.0 25.0 36 20 Chubu Electric Power Company Expect to COD within 1Q22
7 Yabuki 100.0 Fukushima, Japan 1,294 27.9 20.0 36 20 Tohoku Electric Power Company Expect to COD within 4Q21
8 Chiba 1 100.0 Chiba, Japan 1,362 27.0 20.0 36 20 Tokyo Electric Power Company Expect to COD within 4Q21
9 Chiba 2 100.0 Chiba, Japan 1,362 13.0 10.0 32 20 Tokyo Electric Power Company Expect to COD within 2H22
Under development (Exclude from pipeline)10 Nagota 100.0 Kagoshima, Japan 1,448 30.0 24.0 36 20
Wait for Grid11 Isakida 100.0 Kagoshima, Japan 1,463 4.4 3.5 36 20
12 Shimoyunohira 100.0 Oita, Japan 1,330 9.6 8.0 36 20
13 S5 100.0 Kagoshima, Japan 1,371 7.2 6.0 36 20
Sold to IFFNikaho 100.0 Akita, Japan 1,136 13.2 8.8 40 20 Tohoku Electric Power Company COD 15/07/16
Nagi 100.0 Okayama, Japan 1,329 14.4 10.5 36 20 Chugoku Electric Power Company COD 02/03/17
Conventional solar projects in Japan

39
Public
BSE BSE-BRM BSE-BRM1 BSE-CPM1 BSE-NMA BSE-PRI LLG TDED
Thailand
Singapore
99.9% 99.9% 99.9% 99.9% 99.9% 99.9% 99.9% 75.0%
BSEH
100.0%
BCPGI SEGHPL
GreenergyHoldings
GreenergyPower BCPG Wind
100.0% 100.0% 100.0%The Netherlands
JapanPetrowind
Energy
The Philippines 40.0%HMJ BCPGJ
EPC(1) AM(2) Investment(3) Project Under Development
Operating Projects
Operating Projects
Operating Projects
100.0% 100.0%
100.0% 51.0% 100.0% 100.0% 100.0% 100.0%
100.0%
(1) EPC = Groups of companies doing such business as (1) a turnkey EPC contractor and (2) an operation and maintenance contractor for solar power plants in Japan(2) AM = an Asset Management company rendering operation and maintenance service for the Tiramizu project and its remaining shares of 49.0% are held by a juristic person (3) Investment = companies investing in solar farms in Japan as TK investor
Laos
BCPGIndochina
99.9%
Nam San 3A
100.0%
IDO(New SG)
100.0% 33.33%
Nam San 3B
100.0%
Monsoon100.0%
Group’s Business Structure
RPV
99.9%
JKRAQU
LS PS
99.9%99.9%
99.9% 99.9%
BSPH
99.9%
CDC
60.0%
Hong Kong 45.0%
IEAD
100.0%

40Survey link