OPPORTUNITIES - HSC · PDF filecompetitive and profitable engine for growth in the next three...
80
OPPORTUNITIES HSC ANNUAL REPORT 2016
Transcript of OPPORTUNITIES - HSC · PDF filecompetitive and profitable engine for growth in the next three...

OPPORTUNITIESHSC ANNUAL REPORT 2016

I strongly believe that the next three to five years will be a window of opportunity for HSC, not only to do good business, but also to rise to the next level of playing field
OPPORTUNITIES
”“
Mr. Johan Nyvene - CEO
In order to protect the environment, HSC 2016 Annual Report is printed on environmental-friendly paper and in a limited number of copies. Therefore, once no longer in use, please kindly hand them over to persons who are interested in. In addition, HSC 2016 Annual Report is also announced in electronic version, interested readers please kindly access to: www.hsc.com.vn
CEO’s Message 02
Financial Highlights 06
HSC Profile 08
HSC Services 10
Corporate Milestones 12
Awards & Accolades 14
PRODUCTIVITY DRIVES OPPORTUNITIES2016 Performance Overview 17
Market Performance Review 17
Private Client Division 21
Institutional Client Division 24
Corporate Finance Division 26
Investment Division 28
Total Operating Expenses 30
Strategy and Macro Report 2017 34
PROCESS EFFICIENCY EMPOWERS OPPORTUNITIESInformation Technology Department 46
Securities Services Department 48
Risk Management Department 49
Internal Audit Department 53
STRONG GOVERNANCE SUPPORTS OPPORTUNITIESBoard of Directors 56
Report of the Board of Directors 58
Supervisory Board 71
Report of the Supervisory Board 72
Organization Structure 75
Management Board 76
Shareholders’ Information 78
SUSTAINABILITY CREATES OPPORTUNITIESSustainability Report 83
Outline of the Sustainability Report 83
Review of Sustainability Development Activities at HSC 85
Focus for 2017 96
Contact 96 INTEGRITY SECURES OPPORTUNITIESFinancial Statements 2016 98
Operation Network IBC
TABLE OF CONTENTS

I would like to share with you a vision our senior management and I have had since the middle of 2016. We believe we have arrived at another crossroad where the decision to take a strategic turn might be critical for our future. We believe this turn will lead us to where new opportunities lie. We strongly believe these opportunities will shape and form our organization into a more competitive and profitable engine for growth in the next three to five years.
There will be divestment in confectionary companies by Vinataba. Viglacera is currently being divested by the Ministry of Construction, and Vinachem also has a list of group companies in fertilizer and chemical industries that need to be divested. These are just some examples of the pipeline of divestments in the state-owned sector.
In addition to equitization and divestment of state holdings, the direction of reform in Vietnam has turned its attention towards empowering the private sector. At the onset of its new term, the newly assembled government already reached out to the corporate sector, by organizing various high level meetings directly with all types of companies both in Hanoi and HCMC. One of the most exemplary results was the establishment of the Vietnam Private Sector Forum (VPSF), with which I am involved in my personal capacity as the Chairman of the Capital Markets and Finance Committee. The aim of the VPSF is to connect the voice of the private sector to the central government, and at the highest level, as the initiative has been directed by none less than Deputy Prime Minister Vuong Dinh Hue. With ten different steering committees guiding ten most important aspects of the development of Vietnam’s private sector including agriculture, logistics and distribution, the digital economy, supporting industries, etc, we are confident that the empowerment of the private sector will be one of the top priorities of the government in the immediate future. This initiative could mean that the legal and administrative framework will be made less onerous to the private sector, and there would be additional resources allocated to the private sector to fuel their growth and produce more competitive companies in the future.
With these exciting developments in the corporate sector, we have awakened to the idea of broadening our business scope, market segments, as well as risk appetite.
Looking ahead, we see tremendous potential in the Private Client business. At HSC, we have achieved and built a prominent business as a brokerage firm, having captured one of the largest market shares over a number of years. We have secured the position as one of the most reliable and trust worthy brokers in both institutional and retail investor segments. However, 2016 was a year of revelation in our business. While we had a stellar performance that met the financial goals, our business model continued to be primarily driven by the secondary markets and fueled by a significant expansion in our margin financing business. Market share in the brokerage business, especially on the private client side continued to be extremely competitive. We continued to lead the market on private clients but inevitably found ourselves defending our position on various aspects of the business. We have had to revamp our policies on brokers’ commission rates, service pricing, and credit provision. We have monitored the expansion of our margin loan book in conjunction with the expansion in our brokerage market share and detected that growth on the two sides was not in tandem. Our average margin loan book grew by almost 60% in 2016 YOY, while our brokerage market share edged up to only 11.2% from 10.4% the year before. This has prompted us to believe that we need to expand our reaches beyond the traditional private client pool and explore new segments.
Mr. Johan Nyvene - Chief Executive Officer
Dear fellow Shareholders, Customers & Colleagues,
CEO'S MESSAGE
I wish to use the theme “Opportunities” to describe what we have in mind for 2017 and beyond. Opportunities certainly come and go. HSC has been in existence for 14 years and invariably we have seen numerous opportunities appearing over those years. We have taken some opportunities and regretfully missed out on others. Some of those opportunities turned out to be less spectacular or riskier than others. But this time I believe we are facing a major turning point.
There were two key characteristics to Vietnam’s stock market starting in 2016: an accelerated schedule in the privatization of state owned companies and assets, and an emergence of large privately owned companies going public. We have seen a clear trend as well as potentially attractive opportunities in the market with these two characteristics.
Vietnam has turned a significant corner in recent history in the government’s administrative mindset. The country appears to have embarked on a more progressive reform path with a visible sense of determination and decisiveness.
As the government continues to carry on the unfinished job of privatization, there is now a clear sense of urgency with a number of equitization cases which have been lingering over the past several years. The road map for equitization suggests that “everything must go” (be privatized and divested) by the end of 2020. The mandate has also been cascaded from the central government to the provincial and city governments, and various levels of administration at the ministries who are held accountable to carry out this mandate. This process would mean that the opportunities for investors to access the shares of some of the largest companies in Vietnam would present themselves in the next three to four years. Although still somewhat awkward in its process, we have seen the auction of Vinamilk (VNM) by the State Capital Investment Company (SCIC). Besides VNM, the SCIC is also scheduled to gradually sell down a significant part of its remaining holdings in companies in various industries including consumer goods, insurance, and foods. The divestment in Sabeco and Habeco by the Ministry of Industry and Trade should be well underway by the middle of 2017.
0302 HSC ANNUAL REPORT 2016 OPPORTUNITIES

advantage of market upside potential. We envision that there will be significant opportunities for underwriting and principal investment activities. The formula to shape this business is by developing corporate finance advisory capabilities and corporate access work, further aligning corporate finance work with our brokerage functions, and establishing an efficient capital allocation process. There might be situations where capital requirements are significant in which we would aim to cooperate with other top securities firms to jointly underwrite and distribute an issue.
The commercial direction we have embarked upon in business has also been reflected into our human capital policy. In 2016, we launched a company-wide incentive program to promote cross-sale activities and business referrals. On various HR communication occasions, I have reiterated the message among all HSC personnel that we will recognize and directly reward people who bring extra business opportunities to the Company, or who go above and beyond their normal scope of work in order to generate revenue for HSC. This commercial mindset, driven by the incentive program has certainly resulted in extra business activities in all of our business functions, which have contributed to a 43% increase in revenue over the previous year. I believe that HSC’s competitive mindset will be further sharpened going forward with our direct reward system. This is the mindset from which we will derive opportunities.
2016 also marked a sharp change in our human capital mindset. In addition to incentivization, we also opened up opportunities for high caliber managers to take charge of their business forward. On the institutional client side, we took the opportunity of having a new managing director in the team to restructure the organization of the business. On the private client side, we have created additional business regions and units and have promoted middle level managers into leadership roles to manage new business units. This movement has in turn fortified our management of the private client business, and more importantly empowered our personnel in various layers of the business to be able to recognize opportunities on their own. This is also a positive step toward succession planning in my view.
Opportunities will not wait for anyone and I am very happy to say that I have already detected a strong sense of urgency in many of our colleagues in pushing business forward. I strongly believe that the next three to five years will be a window of opportunity for HSC, not only to do good business, but also to rise to the next level of playing field.
I wish all of you success in seizing new opportunities in 2017.
Johan NyveneChief Executive Officer
One of the most notable achievements for HSC in 2016 is the development of derivative products. HSC has been a pioneering securities firm in developing new products and we have closely cooperated with the stock exchanges and the central depository to formulate what would be the first derivative products in Vietnam.
The investment environment in Vietnam has been traditionally limited given the perceived high level of risk in information inefficiency and in the lack of investment know-how. These reasons have turned the mass market in Vietnam away shy from the stock markets and investors continue to favor other types of assets, including real estate, gold and hard currencies. The lack of pension funds further exacerbates this situation as virtually all institutional investors in Vietnam’s equity markets are foreign. This risk mentality has resulted in a very low level of liquidity in Vietnam’s stock market. Although Vietnam’s market capitalization level has risen significantly over the years, the markets have been relatively lackluster in liquidity. In fact, the lack of liquidity remains one of the trickiest factors for investors, both institutional as well as private to overcome, and it has become a vicious circle.
The risks in Vietnam’s stock markets are further weighed by the occasional anomalies in corporate accounting practices, whether intentional or not, that have resulted in inaccurate information from the companies, and hence inaccurate valuation of their share price. This is sometimes a serious issue, which could result in over exposure to investors and market intermediaries including ourselves. In 2016, despite our conservative credit culture and a fortified risk management framework, HSC fell victim to a case of corporate fraud and lost some money in margin lending activities. While margin lending continues to be the backbone of our business, we have realized that the risk in this business is not because of flaws in the products, but because of a significant dependence on financing on our part, to expand in a very concentrated market.
The realization that the existing private client segment has limitations has led us to think about expanding our private client business beyond the current reach. We have conceptually categorized the private client business into different segments. We believe that the private client segment that has been traditionally served by most brokers including ourselves consists of mostly day traders who are inclined to employ margin financing but who are not significantly adhered to fundamental factors. While we continue to serve this segment, we have also recognized that with the growth of the Vietnamese economy, the emergence of a middle class and growth in people's savings and wealth, there would be a need for mainstream investment in capital market products by the mass market. We have recognized a need for
wealth management in the high net worth individual segment, and have approached this segment with the managed account concept. Our specialized strategists would recommend tailor made investment portfolios to individual investors who would employ their dedicated trading team at HSC to manage day-to-day trading activities for them.
For the mass market, the most visible trend of development is in online channels and automated services. With internet and mobile trading tools already developed and available for use, we aim to develop a web based platform to provide internet based clients the flexibility to access all of our current and future products and services through one single portal online. This portal would also allow us to consider the discount brokerage concept in the future. We are aware of the fact that this concept has prospered in developed markets, and while the market in Vietnam is still not developed, we believe that we should be prepared for that future.
One of the most notable achievements for HSC in 2016 was the development of derivative products. HSC has been a pioneering securities firm in developing new products and we have closely cooperated with the stock exchanges and the central depository to formulate what would be the first derivative products in Vietnam. We should witness the launch of the index futures product at the end of the first half of 2017 and the covered warrant product later on in the year. These products will be a part of our comprehensive offerings on the aforementioned web portal, which is also aimed for launch in its initial phase by the end of 2017.
HSC has built and operated a highly stable service oriented business model over the last ten years. However, we believe that there are more opportunities in Vietnam's capital markets than just being a brokerage service provider. With the rising trend of privatization and IPOs, there would be opportunities for the firm to take advantage of its established distribution networks in various investor segments, as well as technical capabilities to build up positions and take market exposure. HSC would be in a position to further establish itself as a market maker, and provide liquidity to the market by leveraging the well-established brokerage capabilities. At the same time, we can explore opportunities to put more of our capital to work and take
CEO'S MESSAGE
05OPPORTUNITIES04 HSC ANNUAL REPORT 2016

21,5
03
17,6
61
18,5
35
17,9
23
18,8
11
213,
310
376,
152
282,
174
246,
381
304,
531
TOTAL ASSETS (VND MILLION) SHAREHOLDERS’ EQUITY (VND MILLION)
2012
2012
2012
2012
2012
2012
2013
2013
2013
2013
2013
2013
2014
2014
2014
2014
2014
2014
2015
2015
2015
2015
2015
2015
2016
2016
2016
2016
2016
2016
REVENUE (VND MILLION)
BOOK VALUE PER COMMON SHARE (VND) BASIC EARNINGS PER SHARE (VND)
PROFIT AFTER TAX (VND MILLION)
562,
372
2,95
6
2,24
1
2,47
4
1,59
82,
279,
549
3,10
3,57
4
4,06
9,80
4
3,12
7,78
1
3,19
8,93
5
2,24
7,34
8
2,16
2,51
4
2,35
8,23
1
634,
760 83
1,13
5
591,
139 82
4,24
5
2,39
52,
391,
917
3,61
6,84
2
FINANCIAL HIGHLIGHTS
(*) Estimated for Y2016 and subject to final approval
2012 2013 2014 2015 2016 CAGR in 5 years
Statement of income (VND million)
Revenue 562,372 634,760 831,135 591,139 824,245 11%
Brokerage fees 145,027 199,104 299,432 262,076 348,957
Principal investment 29,807 152,919 194,425 35,026 69,535
Financial advisory services 12,772 16,399 12,362 11,155 24,602
Other revenues 374,765 266,337 324,916 282,882 381,151
Operating expenses 255,685 260,049 349,692 319,667 439,651
Net profit from operating activities
306,686 374,711 481,443 271,472 384,594
Other profit/(loss) 158 718 4 28 790
Profit before tax 306,844 375,428 481,447 271,500 385,383
Profit after tax 246,381 282,174 376,152 213,310 304,531
Balance sheet (VND million)
Total assets 3,198,935 3,127,781 4,069,804 3,103,574 3,616,842 7%
Charter capital 1,008,486 1,272,568 1,272,568 1,272,568 1,272,568 5%
Shareholders' equity 2,162,514 2,247,348 2,358,231 2,279,549 2,391,917 3%
Financial indicators
Return on average assets (ROAA) 8.5% 8.9% 10.5% 6.6% 9.1%
Return on average equity (ROAE) 11.8% 12.8% 16.3% 9.2% 13.0% 4%
Equity's value
Outstanding shares 100,565,957 127,249,720 127,229,583 127,185,417 127,155,368 5%
Basic earnings per share - VND 2,474 2,241 2,956 1,598 2,395 -4%
Book value per common share - VND 21,503 17,661 18,535 17,923 18,811 -2%
Dividend - VND 2,000 1,700 2,100 1,430 1,700 (*)
Market price at year end - VND 21,600 24,500 31,200 30,800 27,200 14%
P/E 8.7 10.9 10.6 19.3 11.4 19%
0706 HSC ANNUAL REPORT 2016 OPPORTUNITIES

VISION
MISSIONBeing a leading securities company in the industry and Vietnam’s capital markets with the standards of professionalism, innovation, financial strength and sustainability.
To become one of the country’s most admired, trusted, and valued financial institutions, and be an active contributor to the economy and community of Vietnam.
CORE VALUESAt HSC we strive to be true to our corporate values and to apply them in everything we do.
INTEGRITYIt is our aim to build a high level of trust from our clients, investors and those in the securities business in Vietnam and beyond.
DEDICATIONAt all levels, our staff are dedicated to providing the best service to our clients, going the extra mile for our partners, and forging strong relationships with all our stakeholders.
PROFESSIONALISM We constantly develop and adopt best practices; upgrade our expertise and processes to execute all transactions in the best interest of our valued clients.
Ho Chi Minh City Securities Corporation (HSC) is a well-established and award-winning professional securities brokerage and equity firm in Vietnam. HSC provides an array of services and financial products that are catered to private and institutional clients, providing professional investment advisory services which are reinforced by solid, trusted, award-winning research expertise. Through its Corporate Finance Division, HSC has produced an exceptional track record of bridging businesses to investors as well as building long-term sustainable partnerships.
HSC benefits from the synergy that exists between two financial powerhouses in Vietnam; the founding shareholder HCMC Finance and Investment State-owned Company (HFIC); and strategic shareholder Dragon Capital Group, a prominent and leading diversified investment group.
HSC officially went public in May 2009 and was listed on the Ho Chi Minh Stock Exchange (HOSE), bearing the ticker HCM. As of 31 December 2016, shareholders’ equity of HSC totaled to VND2,392 billion (approximately US$ 105 million), making HSC one of the largest securities companies in the country with a strong financial base and sound investment capacity.
HSC strives to continuously develop its core competencies and foster human capital in terms of research and technology. Strategic investment into the scope of research and technology allows HSC to adapt and nurture its business capacity with speed to fulfill the needs of clients that are constantly evolving. As such, HSC is able to pioneer and develop product innovations (e.g. products, services) in order to expand the business and cultivate growth for HSC. We greatly emphasize the ongoing enhancements within the Corporate Governance aspect that serves as the cornerstone for long-term sustainable growth.
Over the last 14 years, HSC has affirmed itself as one of the industry leaders as it continues to maintain its top market position among securities firms in Vietnam with HSC consistently gaining a dominant market share.
Aside from the development of its core business segments, HSC aims to impart a positive influence to society by progressively redefining the securities industry for the better, and ultimately, contributing to the overall development of society in Vietnam.
Presently, HSC have expanded its operations into eight branches and transaction offices nationwide with the Head Office based in HCMC.
HSC PROFILE
0908 HSC ANNUAL REPORT 2016 OPPORTUNITIES

4. RESEARCH AND ADVISORY SERVICES
• Macro & Strategy report
• Investment advisory report
• Daily call report
• Industry research report
• Company report
• Stock valuation report
• Technical analysis report
• Corporate access report
• Company visits to listed/unlisted companies
• Seminars to introduce investment opportunities to Vietnam and international investors
5. CORPORATE FINANCE ADVISORY AND INVESTMENT BANKING SERVICES
Corporate Finance Advisory
• Equitization
• Divesting the State’s interest in SOEs
• Enterprise valuation
• Equity valuation
• Financial Restructuring
• Public company registration
• Registration for trading on Upcom
• Securities depository on VSD
• Listing on HOSE and HNX
Investment Banking
• Merger & Acquisition (M&A)
• Divestment
• Capital raising in domestic and international capital market
• Stocks and bond issuance
• Private placement
• Initial Public Offering (IPO)
• Underwriting
1. SECURITIES SERVICES
• Opening transaction accounts for clients
• Securities transferring and depository
• Securities brokerage
• Securities investment advisory
• Blocking / releasing securities as requirement
• Securities withdrawal
• Receiving and executing buy/sell order of securities
• Fund certificates distribution
• Account management
• OTC stocks quoting and shareholders management
2. FINANCIAL SERVICES
• Margin lending
• Cash advances
• OTC repo
• Government bond auction
• Government bond repo
• Short-term funding for buying government bond
HSC SERVICES
3. TRADING SUPPORT SERVICES
• IPO auction agent
• Organizing auction at the company
• Authorizing auction of securities initially issued
• Placing buy/ sell order via telephone, email, fax, Bloomberg
• Online trading services (Vi-Trade, VM Trade, and VIP-Trade), trading on iPad via HSC Trade Pro, and trading on smartphone via HSC trade (on Android and iOS)
• OCT online cash transfer
• Registering rights to buy securities via telephone
• Announcing of securities trading result via SMS
• SMS for any change in remaining balance, operating rights, dividend and relevant information about margin trading accounts
HSC provides a range of financial services to individual, institutional and corporate clients. The Company adheres to high standards of professional ethics, helping to ensure that all of its client-facing activities are conducted responsibly and effectively by a dedicated team of professionals.
11OPPORTUNITIES10 HSC ANNUAL REPORT 2016

Since its inception in 2003, HSC has continuously grown in capital and size to be one of the leading securities and financial services firms in Vietnam. Over the past 14 years, HSC has strengthened its position as the leading securities company in Vietnam, while gearing itself towards sustainable development.
2013Increased charter capital to over VND 1,273 billion
Celebrated HSC’s 10th anniversary with “Positive value and influence” orientation
Obtained certification of ISO/IEC 27001:2005 standard for “Providing online trading and brokerage services” from TUV Rheinland (Germany)
2014Launched new website with responsive web design, and online trading application on iPad – HSC Trade Pro
Received Certificate of Merit from Ministry of Finance for significant contribution to HNX’s development from 2009 – 2014
2015Established Nguyen Van Troi transaction office in HCMC and Lang Ha transaction office in Hanoi
Received Certificate of Merit from The Prime Minister of Vietnam for significant contribution to securities market development in 2010 - 2014
Received Certificate of Merit from The Chairman of Ho Chi Minh City People’s Committee for significantly contributing to the long term development goals of HCMC
2016Launched the HSC iTrade, breakthrough product based on smart trading applications
Received Certificate of Merit from The Ministry of Finance for significant contribution to securities market development, contributing to economic – social development
CORPORATE MILESTONES
2003Initiated operations after receiving Certificate of Business (Registration No. 4103001573) from the Department of Planning and Investment of HCMC on April 23, 2003 and Business Permit No. 11 / SSC-GPHDKD from the State Securities Commission issued on April 29, 2003
Commenced operations with initial capital of VND50 billion, it being one of the largest capital bases in the securities sector in Vietnam at that time
2006Increased charter capital to VND 100 billion
Relocated headquarters and transaction office to Capital Place Building, 6 Thai Van Lung Street, District 1, HCMC
2007Increased charter capital to VND 200 billion
Established the Hanoi branch at 6 Le Thanh Tong, Hoan Kiem District
Issued shares for strategic shareholders HDBANK and FIDICO
2008Increased charter capital to VND 395 billion
Launched the Call Center PBX support system and VI-Trade system to facilitate Internet trading
Established Hau Giang transaction office in HCMC
2009Officially listed on the Ho Chi Minh City Stock Exchange under the stock ticker HCM
Upgraded internet trading platform (VI-Trade system) and launched VIP-Trade, an advanced version of the portal allowing real-time transactions
Established Lang Ha transaction office in Hanoi
2010Increased charter capital to VND 600 billion
Established 4 transaction offices: Tran Hung Dao, 3 Thang 2 in HCMC and Ba Trieu, Kim Lien in Hanoi
Renamed and relocated Hau Giang transaction office to 3 Thang 2 transaction office in HCMC
2011Increased charter capital to over VND 998 billion
Relocated head office and IT Data Center to new corporate headquarters at AB Tower, 76 Le Lai, District 1, HCMC
Closed 3 Thang 2 transaction office in HCMC
2012Increased charter capital to over VND 1,008 billion
Established Cho Lon transaction office in HCMC, closed Ba Trieu and Lang Ha transaction offices in Hanoi
Officially launched direct connections to both Bloomberg and Reuters networks by FIX (Financial Information Exchange) – standard electronic protocol for pre-trade communications and trade executions
1312 HSC ANNUAL REPORT 2016 OPPORTUNITIES

Top 50 selected by Forbes Vietnam
Recognized by Forbes Vietnam as one of Top 50 listed companies for 4 consecutive years based on sustainable growth and strong corporate governance shown.
Certificate of Merit from the Ministry of Finance
Recipient of Certificate of Merit from The Ministry of Finance for significant contribution to the development of the securities market, economy and social aspect in Vietnam.
Top 100 Sustainable Companies in Vietnam 2016 (CSI100) - VCCI
Achieved high ranking in Top 100 Sustainable Companies in Vietnam for significant contribution in promoting business sustainability, thereby, bringing increased confidence among partners, investors and shareholders that led to enhanced reputation, brand, competitiveness and new business opportunities.
Top 10 Best Annual Report in Vietnam
Ranked in the Top 10 Best Annual Report in Vietnam awarded by Vietnam Investment Review and HOSE which recognizes our continued focus on corporate governance and compliance with information disclosure regulations.
2015Honored in the Top 50 Performing Companies in Vietnam by Nhip Cau Dau Tu magazine for the third time.
Honored in the Top 50 Listed Companies in Vietnam by Forbes Vietnam for the third consecutive year.
Honored in the Top 3 Publicly Listed Companies in Vietnam 2015 by ASEAN Corporate Governance Scorecard award in Manila, Philippines.
Received Certificate of Merit from the Prime Minister for significant contribution to securities market development in 2010-2014.
Received Certificate of Merit from the Ho Chi Minh City People’s Committee.
Voted as the best member firm in the event of 10-year anniversary of Ha Noi Stock Exchange (2005-2015). In addition, HSC was also selected as the best brokerage service provider by both local and international institutions.
Received first Prize for the Best Annual Report, the Best content of Corporate Governance 2015 and in the Top 3 Best Sustainability report given by Vietnam Investment Review and HOSE.
Received "Bronze Award” for Traditional Annual Report in Financial Services - Brokerage & Commodity category; and "Honors Award" for Written Text category at 2015 ARC Awards.
2016 AWARDS
2014Voted “Best Brokerage House in Vietnam” and “Best M&A House in Vietnam” at the Triple A Country Awards 2014 by The Asset.
Honored in “Top 3 Best Salespersons in Vietnam” in 2014 plus other accolades for brokerage services and research coverage, by Asiamoney.
Awarded “CEO Leadership” & “The Best Managed Brokerage House in the APAC Region” by the Asian Banker - the only brokerage house in the region.
Received Certificate of Merit from Ministry of Finance for significant contribution to HNX’s development from 2009 – 2014.
Awarded in the Top 50 Performing Companies in Vietnam by Nhip Cau Dau Tu magazine for the second time - the only securities firm.
Honored in the Top 50 Listed Companies in Vietnam by Forbes Vietnam for the second consecutive year, leading the Finance category.
Ranked 145 out of 1,000 Companies contributing most to national budget.
Received "Bronze Award” for Traditional Annual Report in Financial Services: Brokerage & Commodity category, and "Honors Award" for Written Text category, at the 2014 ARC Awards.
Received “Gold Award” in Financials - Capital markets category and 3 other major accolades at the 2013 LACP Vision Awards for Annual Reports.
Recognized in Top 10 Best Annual Reports by HOSE and Dau tu Chung khoan newspaper, ranked 6 among 700 reports nationwide.
2012Voted as “Best Brokerage House in Vietnam” – The Country Awards 2012 by FinanceAsia, and The Asset.
Honored “Best Local Brokerage in Vietnam” and 21 other major accolades – Asiamoney Brokers Poll 2012 by Asiamoney.
Received Platinum Award for annual report in Financial – Capital markets and 6 other accolades at LACP 2012 Vision Awards, by League of American Communications Professionals (LACP).
Included in the securities firm industry listed in Vietnam’s Top 50 Performing Companies 2012, by Nhip Cau Dau Tu.
Received “The M&A advisory firm of the year 2011 – 2012” at M&A Forum Vietnam 2012.
2013Voted as “The Best Brokerage Firm in Vietnam” – The Country Awards 2013 by The Asset.
Honored in Top 50 Listed Companies in Vietnam by Forbes.
Recognized as the outstanding securities company in 2013, awarded by Hanoi Stock Exchange.
Honored in Top 10 members of government bond trading 2013 by Hanoi Stock Exchange.
Received Gold Award for “Written text” category and 2 other accolades for Financial Services category in Annual Report Competition (ARC), by Marcomm Inc.
Received Silver Award for annual report in Financial – Capital markets and 3 other accolades at LACP 2012 Vision Awards, by League of American Communications Professionals (LACP).
AWARDS & ACCOLADES
15OPPORTUNITIES14 HSC ANNUAL REPORT 2016

Jan/2016
Feb/2016
Mar/2016
Apr/2016
May/2016
Jun/2016
July/2016
Aug/2016
Sep/2016
Oct/2016
Nov/2016
Dec/2016
% Change in VN-Index % Change in HSC Share Price
15.00%
10.00%
5.00%
0.00%
-5.00%
-10.00%
-15.00%
HSC Share Performance vs. Index Performance
PERFORMANCE OVERVIEW
In 2016, the stock market in Vietnam matured into a more progressive stage compared to 2015 with 22% increment in VN-Index from 544 to 665 points (i.e. up by 121 points) for the year, while daily average transaction value expanded by 19% reaching VND 3,047 billion. VN-Index growth was largely stimulated by the stable macroeconomic environment along with increased market liquidity in Vietnam. An active trading environment led to higher domestic and foreign transaction values which increased by 14% and 39% respectively.
Trading activity for domestic investors became more dynamic amidst a backdrop of widespread equitization processes and divestitures of the State capital in large cap state-owned enterprises and corporations particularly in Q4-2016. The surge in transaction volume of actively traded stocks in dairy and steel industries also contributed to the increase. Meanwhile, foreign investors ended up in a “net selling” position for the first time with sizable offload of Vietnamese investments, which was mostly due to the restructuring of their ETF portfolios.
Out of 12 months of trading in 2016, HSC shares outperformed the stock market in four months: January, February, June and December, while underperformed in the remain months. However, the lackluster performance may be attributed to the time lag factor in which share performance is reflective of past data shown in previous quarters. By Q4-2016, it can be noted that HSC’s share price was back on the rising trend with the perceived boost in market sentiment. Overall, in 2016 HSC attained significant growth in revenues, net profit and earnings per share through positive developments on various business functions throughout the year.
MARKET PERFORMANCE REVIEW
HSC’s brokerage market share
FY2016 FY2015 2016 Target
HOSE 12.5% 12.0%
HNX 6.8% 6.1%
Upcom 5.6% 3.2%
Total market share by exchanges 11.2% 10.4% 11.8%Retail clients of HSC / Total market 7.1% 6.9% 8.0%
Institutional clients of HSC / Total market 3.9% 3.4% 3.8%
Proprietary trading of HSC / Total market 0.2% 0.1%
Total market share by type of clients 11.2% 10.4% 11.8%Private Client of HSC / Total local market 9.6% 8.9% 10.8%
Foreign Institution of HSC / Total foreign market 28.5% 27.9% 28.0%
PRODUCTIVITY DRIVES OPPORTUNITIES
17OPPORTUNITIES16 HSC ANNUAL REPORT 2016

Jan/15
Feb/15
Mar/15
Apr/15
May/15
Jun/15Jul/1
5
Aug/15
Sep/15
Oct/15
Nov/15
Dec/15
Jan/16
Feb/16
Mar/16
Apr/16
May/16
Jun/16Jul/1
6
Aug/16
Sep/16
Oct/16
Nov/16
Dec/16
7.3 %
3.8 %
Brokerage and sales
Credit income
Interest income
Principal investment (net)
Investment banking
Other revenue
0.8%
3.0%
8.4%
3.7%
41.7%
42.3 %
Revenue (by Type)
Revenue (by Division)
22.6 %
64.4 %
Private Client Division
Institutional Client Division
Corporate Finance Division
Proprietary Trading Department
Treasury Department
2.0 %
15%
40
35
30
25
20
15
10
5
12%
9%
6%
3%
0%
HSC’s brokerage market share
HSC’s total Retail Institutional
HSC’s market share over total domestic and foreign transaction volume
Retail client market share over total domestic transaction volume
Foreign institutional client market share over total foreign transaction volume
Jan/15
Feb/15
Mar/15
Apr/15
May/15
Jun/15Jul/1
5
Aug/15
Sep/15
Oct/15
Nov/15
Dec/15
Jan/16
Feb/16
Mar/16
Apr/16
May/16
Jun/16Jul/1
6
Aug/16
Sep/16
Oct/16
Nov/16
Dec/16
The two pie charts above display the revenue contribution segregated by division and type. Clearly, Private Client Division occupies the biggest revenue share for HSC at 64%, closely followed by the Institutional Client Division which accounts for 23%.
In terms of revenue generated by income type, brokerage fees and credit income are the core drivers of HSC’s total revenue, each accounting for 42% of total revenue in 2016. Contribution from credit income saw a huge gain in line with the boom in the margin lending business.
FY2016 Performance Summary
In VND Million FY2016 FY2015 % Change 2016 Target % 2016 Target
Revenue 824,245 591,139 39% 734,593 112%Brokerage and sales 348,957 262,076 33% 347,573 100%
Credit income 343,657 222,636 54% 286,000 120%
Interest income 30,569 54,719 -44% 34,947 87%
Principal investment 69,535 35,026 99% 35,373 197%
Investment banking 24,602 11,155 121% 25,500 96%
Other revenue 6,926 5,527 25% 5,200 133%
Operating expenses 439,651 319,667 38% 358,236 123%Operating expenses 338,446 287,123 18% 340,236 99%
Bank interest expenses 45,252 7,390 512% 18,000 251%
Securities trading expenses 14,268 49,496 -71% n/a
Loss from revaluation of financial assets at FVTPL
3,497 (24,342) n/a n/a n/a
General provision for margin lending 19,997 - n/a n/a
Other income 790 28 2,729%
Profit before tax 385,383 271,500 42% 376,357 102%Profit after tax 304,531 213,310 43% 301,086 101%Total assets 3,616,842 3,103,574 17% 3,330,481 109%
Shareholders' equity 2,391,917 2,279,549 5% 2,468,163 97%
Number of shares 127,155,368 127,185,417 127,185,417
Weighted average number of shares 127,167,449 127,201,122 127,185,417
Earnings per share (VND) 2,395 1,598 50% 2,367
Book value per share (VND) 18,811 17,923 5% 19,406
% Cost / Income (VND) 53% 54% 49%
Total revenues in 2016 reached VND 824 billion, representing an increase of 39% compared to 2015, and 12% in excess of the target.
Brokerage and sales income increased by 33% to reach VND 349 billion as it was driven by the increase in transaction values on the back of improved market share. Revenue from margin lending operations soared in 2016 outperforming the target by 20%, and rising to VND 343 billion. Capital gains from trade in new portfolios and ETF led the income derived from proprietary trading to reap higher growth, almost double those of 2015. Corporate finance advisory income saw a hike of 121% with support from several high-valued advisory projects as well as client referrals and client research projects.
PERFORMANCE OVERVIEW
In terms of market share, HSC secured a marginal increase with higher level of brokerage activities through retail clients, institutional clients and proprietary trading. HSC’s brokerage services occupied 11.2% of total market, a slight increase from 2015, drawing close to the 11.8% target for 2016.
HSC’s domestic retail business steadily gained market share during 2016 with a slight decline towards the end of Q4-2016. Its market share generated by domestic retail clients improved to 9.6%, despite falling short of the 10.8% target. This was primarily due to the fact that certain active stocks (e.g. GEX, ROS, FLC, VIC), that represents 12% of total domestic trade value, were not traded via HSC. Total trading volume of the stocks accounted for 12% of total trading volume of local investors while there was only 0.25% of the volume trade via HSC.
Meanwhile, contribution from foreign investors saw several peaks of volatility throughout 2016. While accounting for 28.5% of total foreign trade value in the market in 2016, HSC’s foreign market share had been fairly consistent at approx. one-third of the market over the past years. The noticeable peaks in foreign transactions in the months of March, September and December, were triggered by large transactions in MSN, VNM, FPT, SAB, etc.
1918 HSC ANNUAL REPORT 2016 OPPORTUNITIES

PRIVATE CLIENT DIVISION
Market optimism amidst growing business momentum
Riding the wave of high growth in Vietnamese securities market, the Private Client Division achieved swift, positive recovery from its subdued performance in 2015. The division remained as HSC’s core revenue-generator at 64% of total revenue, contributing more than two-thirds of the profit before taxes – which also increased sharply against 2015. The Private Client Division represented the broad upswing in growth of HSC’s overall business performance as the division outperformed its 2016 Target.
Private Client Division (VND million)
FY2016 FY2015 % Change 2016 Target % 2016 Target
Revenue 530,452 391,068 36% 508,242 104%
Brokerage fees 203,500 168,216 21% 225,264 90%
Margin lending 319,945 218,065 47% 278,278 115%
Other revenues 7,007 4,788 46% 4,700 149%
Operating expense 272,655 195,595 39% 244,900 111%
Direct expenses 166,891 147,277 13% 182,178 92%
Indirect expenses 45,491 41,081 11% 45,214 101%
Bank interest expense 42,082 7,237 481% 17,509 240%
Provision for doubtful debts 18,191 - n/a - n/a
Profit before tax 257,797 195,473 32% 263,342 98%
% HSC revenue 64% 66% 69%
% HSC profit before tax 67% 72% 70%
% Expense/Revenue 51% 50% 48%
Revenue
Total revenue for Private Client Division was VND 530 billion, a rise of 36% from 2015. Most of the division’s income is derived from brokerage fees and margin lending. Both of these revenue streams displayed higher values for 2016 compared to 2015.
Revenue: Brokerage fees
Private Client Division (VND million)
FY2016 FY2015 % Change 2016 Target % 2016 Target
Market local trading value 564,449,021 493,510,415 14% 548,340,000 103%
PCD trading value/Market local trading value 9.6% 8.9% 9% 10.8% 89%
PCD trading value 108,646,823 87,416,306 24% 118,560,000 92%
Average gross brokerage fee rate % 0.187% 0.192% -3% 0.190% 99%
Total gross brokerage fees 203,500 168,216 21% 225,264 90%
Profitability
Operating profit margin and net profit margin remained relatively steady on a year on year basis despite significant rise in revenues from the Private Client Division and the Institutional Client Division. ROAA and ROAE saw large increments with ROAA up by 2.5 percentage points and ROAE by 3.8 percentage points in 2016. The rise in both ROAA and ROAE is predominantly due to the significant increase in HSC’s net profit.
Liquidity
Cash ratio decreased slightly as a result of higher investments in various business functions of HSC to support growth. Much of the cash was utilized to finance margin trading and other short-term investments. Current ratio also saw a drop of 80 bps with assets invested to expand the margin lending business. Although current ratio turned out to be relatively lower, HSC is still high in liquidity and it is well-financed to fulfill its short-term obligations.
PERFORMANCE OVERVIEW
Ratio Analysis
Key ratios FY2016 FY2015
Profitability Ratios
Operating profit margin 56.2% 57.0%
Net profit margin 36.9% 36.1%
ROAA 9.1% 6.6%
ROAE 13.0% 9.2%
Liquidity Ratios
Cash ratio 0.30x 0.36x
Current ratio 2.84x 3.60x
Gearing Ratios
Debt to equity ratio 51.2% 36.1%
Debt ratio 33.9% 26.6%
Market Ratios
EPS 2,395 1,598
Dividend yield 6.3% 4.6%
P/E 11.4 19.3
Similarly, operating expenses went far beyond the 2016 Target, hitting VND 440 billion as HSC provided substantial working capital for the margin lending operations. This led the bank interest expenses to increase five-fold, and thus, being the main factor towards the increase in operating expenses. A large proportion was also spent for salary, office rent, IT-related expenses and outsourcing expenses. Moreover, HSC recorded additional expenses in the form of provision for bad debt at VND 18.2 billion to account for unrecoverable margin loans and general provision for loans amounted to VND 20 billion.
Gearing
Both debt-to-equity ratio and debt ratio increased in 2016 on a relative basis. D/E ratio crossed 51% as HSC tapped in to bank loans to finance its growing brokerage business instead of utilizing its own equity capital. Similar story can be seen for the Debt ratio as well.
Market Ratio
EPS increased almost by a half between 2016 and 2015 - in line with the rise in net profit owing to bigger-than-expected growth in HSC’s margin lending business. Dividend yield increased by 1.7 percentage points while P/E was slashed by half as a result from a much higher EPS. This denotes that the company is projecting good growth with the market perceiving HSC to be of lower risk for investors.
The subsequent segments offer further details on the new developments of each business segment under HSC.
2120 HSC ANNUAL REPORT 2016 OPPORTUNITIES

Jan/15
Feb/15
Mar/15
Apr/15
May/15
Jun/15Jul/1
5
Aug/15
Sep/15
Oct/15
Nov/15
Dec/15
Jan/16
Feb/16
Mar/16
Apr/16
May/16
Jun/16Jul/1
6
Aug/16
Sep/16
Oct/16
Nov/16
Dec/16
20.00%
15.00%
10.00%
3,000
2,500
2,000
1,500
1,000
500
0
Margin balance Margin rate
Margin lending
VND BIllion
Operating expenses
In line with growing revenue base, operating expenses also rose sharply by 39% to reach VND 273 billion in 2016, driven by increases of 13% of direct expenses and 11% of indirect expenses. Rise in operating expenses was predominantly brought by HSC’s expansion in its margin lending portfolio as well as additional provision for bad debt.
The majority (i.e. 88%) of direct expenses consists of associated fixed costs involving salaries, office rent and IT expenditures and commission paid to the Exchanges at 0.03% regarding to value of transactions through HSC. The 13% increase in direct expenses was a result of greater investment into personnel and technology (e.g. higher salaries paid for the higher number of brokers working, from 213 to 239 personnel in 2016 on average, i.e. 12% increase). The 12% increase in indirect expenses was essentially due to the resource support deployed to develop the margin lending risk management department (e.g. legal counseling fees, staffing expenses of the support team).
The expansion of HSC’s margin lending portfolio led the interest expenses to go up five-fold to VND 42 billion in order to meet the capital requirements of bigger margin lending activities in 2016.
Focus on New Market Segment and Product Innovations
Moving to 2017 and beyond, PCD is aiming to take a new direction to help improve the consultative capability of its brokers. Some of the key initiatives include:
• Establish an exclusive radio channel for PCD members with fortnightly broadcasting to keep them up-to-date on the following topics: HSC’s policies, HSC’s success stories, PCD’s and HSC’s targets / progress, interviews with guest speakers from HSC’s other departments, etc.;
• Divide PCD into three separate regions in order to ensure staff’s interest and concerns are listened carefully, and appropriate responses are provided by three regional heads;
• Penetrate the new market segments: Striving to target high-net-worth individuals (HNWI) who need personal advisors to make rather large investment decisions, and financially astute individuals who need intelligence reports to support their own investments;
• Further strengthen PCD’s research team to produce high quality investment research and more effective investment guides for clients;
• PCD is also preparing to introduce two new upcoming derivative products, namely Index Futures and Covered Warrants, which are expected to be introduced into the Vietnam market by Q2 and Q3-2017 respectively. These products are geared towards expanding clients’ investment options which will help strengthen HSC’s foothold in the private client market. The introduction of these products, however, may necessitate HSC to have more capital allocated for the division.
Leading Innovative Trading Mechanisms
As competition for the retail brokerage market in Vietnam becomes more intense, with large trade volumes arising from large retail clients, HSC positions itself to embrace a more customer-centric approach by delivering unique user experiences by investing in key technologies to build better customer value.
In relation to this, HSC continued to improve its overall trading platform by infusing new technology and high quality content with the creation of a multi-channel Internet trading platform with various value-added functionalities to feed insightful information to the clients. The development of the integrated trading platform was initiated at the end of 2016 and is expected to be operational by the end of Q2-2017.
Gross brokerage fees increased by 21% to VND 204 billion in 2016, primarily driven by the following factors:
• PCD trading value increased by 24% due to positive consumer sentiment and business confidence in Vietnam. This increase in trading values was directly proportional to the increase in Vietnam’s benchmark index.
• PCD’s market share increased from 8.9% in 2015 to 9.6% in 2016.
• Whereas the average gross brokerage fee rate saw a decrease of 3% compared to 2015.
Revenue: Margin lending
Margin Lending (VND million) FY2016 FY2015 % Change 2016 Target % 2016 Target
HSC’s average margin balance 2,599,380 1,656,851 57% 2,200,000 118%
In which:
PCD’s margin balance 2,432,746 1,612,911 51% 2,140,600 114%
PCD’s lending rate 13.2% 13.5% -2% 13.0% 102%
PCD’s margin income 319,945 218,065 47% 278,278 115%
Margin lending revenues went up almost by a half to reach VND 320 billion, exceeding the 2016 target by 15%. Such substantial gain can be attributed to the following factors:
• Average margin balance for PCD increased by 51% to VND 2,432 billion in 2016, and at one point peaked at VND 3,235 billion, due to additional demand stimulated by buoyed trading patterns along with liberal margin lending policies;
• HSC also extended its margin lending portfolio from 150 to over 230 stock tickers that are eligible for margin lending under State of Securities Commission (SSC);
• Average margin rate dropped by 30 basis points to 13.2% from 13.5% in 2015 because of the downtrend in market deposit rate and the stiff competition faced by HSC in the private client market. The policy indicting penalty interest on overdue margin loans was cancelled to make HSC more competitive.
Revenue: Others
PCD’s other revenue streams consist of gains from securities trading services, client referrals to the Corporate Finance Division and shareholder management services.
PERFORMANCE OVERVIEW
2322 HSC ANNUAL REPORT 2016 OPPORTUNITIES

Revenue: Listed stock brokerage fees
Brokerage fees for the listed shares rose by half to reach VND 135 billion, surpassing the 2016 Target by 11%. The increase is owed to the following:
• Total trading value by conventional institutional clients expanded by more than one third and brought a 37% rise in gross fees earned for 2016 at VND 82.4 billion;
• Total trading value led by client referrals through intermediary brokerage firm recorded 73% higher gross fee earnings to reach VND 33.9 billion;
• Bond brokerage activities were more active as seen from the 16% increase to reach VND 10.5 billion, exceeding the 2016 target by 5%.
Revenue: OTC stock brokerage fees
OTC stock brokerage fees expanded by more than ten times compared to 2015. These transactions related to Sabeco when they were not listed yet.
Revenue: Margin lending
Margin trading turnover increased four-fold to reach VND 23.6 billion, exceeding the set target for 2016 by thrice due to the increasing demand for margin in equity transaction of our institutions clients.
Revenue: Income from capital using activities
Revenue from capital using activities in 2016 was mainly attributed to the purchase and resale to institutional investors. Average capital invested decreased by two-thirds to VND 14 billion but provided higher ROI of 44% p.a. compared to 26% p.a. in 2015.
Operating expenses
The 39% increase in operating expenses in 2016 was prompted by increase in all three expenditure types: direct operating expenses, indirect operating expenses and bank interest expenses.
• Direct operating expenses had a 39% increase, in which:
- The brokerage expenses increased by 41% in line with the rise in stock brokerage fee revenue;
- Commission expenses is a pay away to offshore brokers;
- Other direct expenses include staff costs and information technology expenses, which remained unchanged from 2015.
• Indirect operating expenses was up by 9% with more expenses allocated to reinforce the supporting departments;
• Bank interest expense accelerated sharply as a result from HSC’s incentive to expand its margin lending activities.
Building synergy between business functionalities
Looking forward to 2017, HSC plans to synergize the business functionalities between the Institutional Client Division and the Corporate Finance Division. This synergy is crucial especially because the Corporate Finance division is in a state of transition into a mature investment banking business. Through Institutional Client Division, HSC may be able to leverage on the division’s secondary market capabilities in the brokerage business, to support the development of the investment banking business.
In particular, support may be provided in the form of attracting clients from the institutional client base to engage with HSC in facilitating large-scale, primary transactions (e.g. IPO, M&A). This would allow HSC to execute successful IPO or M&A transactions and further solidify HSC’s penetration into the investment banking market. Going to 2017, more resource support will be given to reinforce and expand the investment banking business for HSC.
Having successfully merged the research and institutional brokerage departments into Institutional Client Division a few years ago, the division is able to offer an in-depth, high quality service to clients, who routinely come into contact with divisional representatives from both the sales and research teams. All staffs are closely mentored to be able to provide this direct service to the highest quality as this is increasingly demanded by clients.
Another very important requirement for institutional investors is corporate access, and the division has again been very active in providing this through various programs. In 2016, the division arranged nearly 90 trips to enable both domestic and international investors to visit leading Vietnamese companies. This value-added activity will continue in 2017.
Moreover, the investment options for institutional clients will be expanded through introduction of two new derivatives products, Index Futures and Covered Warrants, which are expected to be available in the Vietnam market by Q2 and Q3 2017.
PERFORMANCE OVERVIEW
INSTITUTIONAL CLIENT DIVISION
Accelerated market conditions and attractive foreign investments
2016 was a period of significant change for the Institutional Client Division. The fundamental drivers for this were improved market conditions as evidenced by the strong market performance, an increased market trading volume and the continued strong performance of the Institutional Client Division in delivering excellent research, sales and trading performance.
The division contributed a larger percentage (i.e. 23%) to HSC’s total revenue, and remained as the second largest business segment for HSC. Significant growth was seen with the 94% surge in profit before tax that reached VND 91 billion, far outperforming the 2016 Target by 32%.
Net selling position, the first for foreign investors
In 2016, the market demonstrated significant increases in the number of transactions by foreign clients. Moreover, total trading value of foreign transactions increased by 39% as a result of higher flexibility in trading large-cap stocks. By the end of 2016, the market closed at a net selling position with foreign investors causing a massive sell-off of blue-chip stocks, particularly VNM, MSN, VIC and FPT.
The main reason for this was the dramatic underperformance of the two leading ETFs in the market which was a result of foreign investors not being able to hold key stocks due to those stocks being at their foreign ownership limits. This resulted in major outflows in both these ETFs which led to a net-sell amongst foreign investors in 2016.
In addition, the announcement of the U.S. Federal Reserve interest rate hike and reduced risk appetite for frontier market exposure also played a key role in net selling position. With this, HSC’s foreign institutional trading value went up by 42% to reach VND 57 trillion in 2016.
Institutional Client Division (VND Million)
FY2016 FY2015 % Change 2016 Target % 2016 Target
Revenue 185,895 114,928 62% 144,531 129%
Listed stock brokerage fees 135,416 93,038 46% 122,309 111%
OTC stock brokerage fees 9,911 823 1105% - n/a
Margin lending 23,529 4,572 415% 7,722 305%
Income from capital using activities 8,892 10,471 -15% 9,000 99%
Other revenues 8,147 6,025 35% 5,500 148%
Operating expense 94,429 67,730 39% 75,287 125%
Direct expenses 81,967 59,015 39% 65,844 124%
Indirect expenses 9,292 8,561 9% 8,952 104%
Bank interest expense 3,170 153 1967% 491 645%
Profit before tax 91,466 47,198 94% 69,245 132%
% HSC revenue 23% 19% 20%
% HSC profit before tax 24% 12% 18%
% Expense/Revenue 51% 59% 52%
Revenue
Total revenue for the Institutional Client Division increased by 62% to reach VND 186 billion, and exceeded the 2016 target by 29%. Listed stock brokerage fees contributed to more than two-third of the division’s income with the remaining portion generated by OTC stock brokerage fees, margin lending, income from capital using activities and others.
2524 HSC ANNUAL REPORT 2016 OPPORTUNITIES

Seizing Corporate Finance and Investment Banking opportunities in 2017-2021
In next 5 years, Vietnam economic activity will likely continue to grow the fastest amongst all Asian economies, fueled by strong consumer confidence of a young population with a growing middle class and within quite a stable political environment.
In an effort to enhance efficiency and generate much needed additional tax revenues, since 2016 the Vietnam Government has launched a large-scale privatization program by continuing to reduce its stakes in, or equitizing, over 400 state corporations at all government levels including state corporations controlled by the Government such as Electricity of Vietnam (EVN), by Ministries (such as Ministry of Industry and Commerce, Ministry of Construction, Ministry of Agriculture and Rural Development, Ministry of Transport, etc), and by Peoples Committees of Cities including Hanoi and HCMC.
Opportunities for Corporate Finance advisory will likely abound due to:
• Increased demand for fund raising mandates such as IPOs or Placements by Vietnam private and public sector companies, which continue to roll-out even bigger expansion plans, after having grown in last 15 years to become industry leaders in Vietnam and now preparing to outgrow their domestic markets to start covering other regional markets;
• Divestments by the State in equity stakes in small and large SOEs by way of public auctions or negotiated transactions on stock exchanges or if these fail to succeed through private placement sales.
New emerging trends in Vietnam Corporate Finance this year include IPOs launched in Vietnam by foreign-owned enterprises, which started many years ago as green field or venture capital projects to successfully grow to occupy today major market share in their own industry sectors in Vietnam.
Involvements of foreign and global investment banking firms have also increased as a result of the increased size of the transactions. Taking advantage of that trend, HSC has established solid working and cooperation relationships with global investment banking and brokerage firms such as CLSA, Deutsche Bank, HSBC, Samsung Securities and J.P. Morgan in order to bid on the increasing number of cross-border transactions.
Looking forward, 2017 is expected to be another active year for Corporate Finance business as market sentiment will continue to improve in Vietnam. Particular focus will be in consumer related sectors (e.g. food & beverage, FMCG, finance, residential real estate, construction materials, etc) supported by the fact that vast majority of Vietnam’s economic activities are centered on consumption by a fast growing middle class. Education and healthcare sectors will also be potentially lucrative areas for HSC.
The continued privatization of large state-owned enterprises in the pipeline for 2017-2021 such as Viglacera and HUD (under Ministry of Construction), Habeco, Sabeco and Vinachem (under Ministry of Industry and Trade), Vietnam Rubber Group (under Ministry of Agriculture and Rural Development), Mobifone and VNPT (under Ministry of Information and Communications) and Viettel (under Ministry of Defense) will further fuel the advisory market in Vietnam. While the related transaction execution process may be time-consuming and subject to many constraints, privatization and equitizations will offer significant business opportunities for HSC to establish its foothold as a reputable investment banking firm in Vietnam.
PERFORMANCE OVERVIEW
CORPORATE FINANCE DIVISION
2016: The year of Revival for Corporate Finance
HSC’s Corporate Finance Division significantly turned around in 2016 from a rather lackluster performance in 2015, amidst the backdrop of quite an active advisory market in Vietnam. The priority of the Corporate Finance team was to enhance the advisory capabilities of the team to prepare for larger deals to be undertaken in 2017, with plans to use the firm’s capital to compete on future deals, whereas no capital was used by the team in 2016.
Despite contributing merely 2% of HSC’s total revenues in 2016, Corporate Finance Division will very much be a focus area in the coming years for HSC.
Corporate Finance Division (VND million)
FY2016 FY2015 % Change 2016 Target % 2016 Target
Revenue 16,279 6,093 167% 30,080 54%
Advisory fee 16,279 5,733 184% 20,000 81%
Income from using capital - 360 -100% 10,080 n/a
Operating expense 14,248 10,211 40% 13,340 107%
Direct expenses 9,165 5,355 71% 8,724 105%
Indirect expenses 5,083 4,856 5% 4,616 110%
Profit/(loss) before tax 2,032 (4,118) n/a 16,740 12%
% HSC revenue 2% 1% 4%
% HSC profit before tax 1% n/a 4%
% Expense/Revenue 88% 168% 44%
Advisory Fees
Revenues from advisory fees more than tripled in 2016 to reach VND 16.3 billion but were lower than initial targets, as the Corporate Finance team have not committed any of the firm’s capital to compete in deals during 2016.
Key advisory clients in 2016 included: HD Saison, CTI, Con Cung Investment JSC, Nam Long Investment JSC, Siam Brothers Vietnam, Viglacera Corporation, Dong A, KIDO, Saigon Union of Trading Cooperatives and Digiworld Corporation.
Operating expenses
Total operating expenses of Corporate Finance Division in 2016 was VND 14.2 billion, increasing by 40% compared to 2015, as a result of capacity building of its human resources. Total direct expenses increased by 71% due to increase in salary expenses for senior personnel and customer related expenses.
2726 HSC ANNUAL REPORT 2016 OPPORTUNITIES

Treasury (VND million) FY2016 FY2015 % Change 2016 Target % 2016 Target
Revenue 31,314 57,525 -46% 35,447 88%
Deposit income 30,569 54,719 -44% 34,947 87%
Bond investment 139 2,670 -95% - n/a
Other 607 136 345% 500 121%
Operating expense 4,775 4,216 13% 4,177 114%
Direct expenses 3,363 2,879 17% 2,825 119%
Indirect expenses 1,411 1,337 6% 1,352 104%
Profit/(loss) before tax 26,540 53,309 -50% 31,269 85%
% HSC revenue 4% 10% 5%
% HSC profit before tax 7% 20% 8%
% Expense/Revenue 15% 7% 12%
Revenues
Revenues from the Treasury function in 2016 fell to VND 31 billion, down by 46% compared to 2015 primarily due to interest rate fall and meager return from bond investments in Vietnam.
Capital in 2016 was mainly allocated to margin lending and proprietary trading business, while the remaining portion was deposited in banks.
Average interest rates on deposits in 2016 rose to 5.45% p.a. from 4.97% p.a. in 2015.
Operating Expenses
Operating expenses grew by 13% in 2016 from the previous year to reach VND 4.8 billion included bond brokerage expenses in 2016 compared to no such expenses incurred in 2015.
Derivatives pave the way for Revenue Growth
Two new derivative products, i.e. Index Futures & Covered Warrants, will not only provide new opportunities for HSC in 2017, it will also beacon a new era of client transactions. HSC will strive to expand the funding capacity of the Treasury Trading business to facilitate the derivative products development as well as the existing margin lending business.
By Q2-2017, technology preparations and regulatory hurdles of Index Futures are expected to be completed. HSC is one of the first securities brokerage firms to have been collaborating with HNX in regards to this market development.
In case of Covered Warrants, regulatory framework has already been established and partnership with HOSE is under way. This product will primarily attract local retail investors who are keen on adding leveraged assets to their portfolio.
Treasury Department
The main purpose of the Treasury Department is to ensure optimum allocation of capital and resources, to support the core businesses of HSC through efficient balance sheet management. Although this non-core function is a revenue generating entities, making profits remain a secondary priority.
Profit before taxes of the department plunged by a half to reach VND 26.5 billion, contributing a meagre 7% of HSC’s net profit.
PERFORMANCE OVERVIEW
INVESTMENT DIVISION
Proprietary Trading
Proprietary Trading performance turned positive in 2016 after making losses in 2015. Not only did the department exceed the 2016 target by more than three times, it also recorded a higher proportion of HSC’s total revenue in 2016. Profit before taxes for the department reached almost VND 40 billion in 2016.
Proprietary Trading (VND million)
FY2016 FY2015 % Change 2016 Target % 2016 Target
Revenue 60,304 21,525 180% 16,293 370%
Old portfolio 1,050 462 127% 845 124%
New Portfolio 53,362 21,062 153% 12,448 429%
ETF Portfolio 5,892 0 n/a 3,000 196%
Operating expense 20,765 29,915 -31% 5,102 407%
Direct expenses 19,280 28,393 -32% 3,587 537%
Indirect expenses 1,485 1,521 -2% 1,514 98%
Profit/(loss) before tax 39,539 (8,390) n/a 11,192 353%
% HSC revenue 7% 4% 2%
% HSC profit before tax 10% n/a 3%
% Expense/Revenue 34% 139% 31%
Revenues
The main driver behind revenue growth in 2016 was the improved performance of new portfolio – which contributed to almost 90% of the entire division’s revenues.
After the adverse impacts of the Chinese stock market in early 2016, the market regained its footing from Q2-2016 onwards, which resulted in revenues of VND 53.4 billion from the new portfolio. This sharp rise in revenues mainly consisted of realized gain of MWG, VNM, HSG, HPG, NVL stocks, and reversal of provision for new portfolio in 2016.
Average capital invested in the new portfolio in 2016 was VND 84 billion with ROI of 52% p.a. compared with an average investment of VND 74 billion in 2015.
The old portfolio includes stocks brought forward from 2013. The main revenue generated in 2016 on this portfolio arose from dividends and totalled VND 1 billion.
Operating Expenses
Total operating expenses of Proprietary Trading dropped sharply in 2016 to reach VND 20.7 billion, driven by lower direct costs which accounted for 94% of the total expenses.
Direct costs fell 32% compared to 2015, and mainly comprised expenses relating to securities investment, and also release of provisions held against the OTC portfolio.
2928 HSC ANNUAL REPORT 2016 OPPORTUNITIES

Information technology expenses
Information technology expenses mainly included the IT operation expense, which remained almost unchanged from 2015.
Leasing expenses
Leasing expense slightly rise by 3% compared to 2015 because of the movement of Kim Lien transaction office to new location at VCCI building since the end of 2015. Existing leasing contracts are all long-term with fixed monthly fees.
Depreciation & Amortization
Fixed assets depreciation in 2016 increased by 8% compared to 2015 due to 9% increase in depreciation
expenses for IT assets which accounted for 92% of total depreciation. Newly acquired IT assets in the H2-2015, such as customer relationship management (CRM) software, new server system and data storage devices, raised depreciation expenses in 2016. Depreciation expenses in 2016 only represented 63% of the target since some investments were not made as planned before and thus, no associated depreciation costs were incurred. A number of projects, which were underway at the end of 2016, are expected to be completed and put into operation in 2017 such as:
• Derivatives Trading Platform
• Disaster Recovery Plan (DRP) implementation
• Business process management (BPM) platform
• Business Intelligence (BI) Platform
IT related depreciation expense (VND million) FY2016 FY2015 % Change 2016 Target %2016 Target
Existing assets
1 Software 2,803 2,109 33% 1,988 141%
HSC 453 415 9% 453 100%
CRM Software 809 439 84% 743 109%
Device connecting Core CAL Software 319 416 -23% 333 96%
Key pass (OTP) authentication software 682 573 19% 336 203%
Windows Copyright 428 95 351% 111 384%
Other software 113 112 1% 12 941%
2 Servers 871 1,069 -19% 860 101%
3 Network Equipment 807 701 15% 620 130%
4 CCTV System 240 824 -71% 64 373%
5 Firewall System 271 115 136% 177 153%
6 Computers and phones 134 138 -3% 206 65%
Assets planned for acquisition
7 Derivatives Trading Platform - - 1,500 0%
8 DRP implementation - - 1,500 0%
9 BPM platform - - 667 0%
10 Business Intelligence platform - - 667 0%
11 HRIS HR Software - - 197 0%
12 Investment in infrastructure (new servers) 292 500 58%
Total depreciation expenses related to IT 5,418 4,957 9% 8,945 61%
TOTAL OPERATING EXPENSES
2016 compared to 2015
As revenue base expanded in 2016 for HSC - so did the operational expenses which touched VND 439 billion in total. This indicates a rise of 38% compared to the year before, surpassing the 2016 target by more than a fifth. Subsequently, cost to income ratio, which is computed by dividing operating expenses by net income, in 2016 was at 53%, slightly lower than 54% in 2015.
However, excluding the bank interest expense and provisions, HSC’s operating expenses in 2016 only increased by 18% compared to the corresponding period last year.
Operating Expenses (VND Million)
Weight FY2016 FY2015 % Change 2016 Target % 2016 Target
Salary and related expenses 50% 167,553 141,925 18% 166,581 100%
Brokerage expenses 18% 61,074 44,444 37% 54,624 112%
Outsourcing expenses 16% 55,769 48,149 16% 54,933 103%
Information technology expenses 4% 14,742 14,811 0% 18,566 79%
Leasing expenses 6% 20,608 20,079 3% 21,255 97%
Depreciation and amortization 2% 5,921 5,507 8% 9,399 63%
Other expenses 4% 12,778 12,208 5% 14,878 86%
Operating expenses before interest expenses and provisions
100% 338,446 287,123 18% 340,235 104%
Interest expenses 45,252 7,390 512% 18,000 251%
Securities trading expenses 14,968 49,496 -71% - n/a
Loss from revaluation of financial assets at FVTPL 3,497 (24,342) n/a - n/a
Provision for bad debts 18,191 - n/a - n/a
General provision for lending 19,997 - n/a - n/a
Total operating expenses 439,651 319,667 38% 358,235 123%% Total expenses/Total revenue 53% 54% 49%
Salaries and Personnel Related Expenses
Salaries expenses accounted for almost half of the total operating expenses in 2016, which increased by 18% on a year on year basis. This can be attributed to:
• Higher number of brokers in transaction offices and support staff in Private Client Division (from 419 people to 450 people in 2016 on average) as a result of increased market activities. This division alone contributed to 4 percentage point increase in Salaries in 2016;
• Increased personnel expenses for Corporate Finance division, Institutional Client division, and Internal Audit Departments, was accountable for 4% increase;
• Increased in brokerage commission paid to brokers, which led to an increase of 10% in salaries expenses in 2016.
Brokerage expenses
Brokerage expenses accounted for 18% of total operating expenses and increased 37% in comparison to 2015, was in line with the trend of higher trading value at HSC during 2016.
Outsourcing expenses
Outsourcing expenses accounted for 16% of total operating expenses, rise by 16% compared to 2015. An increase in brokerage commission paid to offshore brokers in 2016 as the result of the increase in outsourcing expenses.
PERFORMANCE OVERVIEW
3130 HSC ANNUAL REPORT 2016 OPPORTUNITIES

Balance Sheet Analysis
2016 compared to 2015
HSC’s balance sheet has expanded by 17% to reach VND 3,616 billion between 31 December 2015 and 31 December 2016. This was largely due to increase in financial assets and loans as margin lending business flourished in 2016.
Item (VND million) 31/12/2016 31/12/2015 % change 2016 Average 2016 Target % 2016 Target
A. Current Assets And Short-Term Investments
3,472,717 2,970,428 17% 3,031,710 3,190,138 95%
I. Current assets 3,468,203 2,965,610 17% 3,027,044 3,184,909 95%1. Cash (excluding deposits
from investors)60,194 164,147 -70% 107,729 323,157 26%
2. Financial assets 306,372 132,175 132% 180,105 147,752 122%3. Loans 2,750,945 2,609,605 10% 2,687,734 2,200,000 122%
Margin 2,666,331 2,515,797 10% 2,599,380 2,200,000 118%4. Advance to suppliers 425 512 10%5. Receivables from services
provided370,008 57,145 -15% 53,198 526,219 10%
6. Other receivables 35,168 18,745 88% 26,956 4,500 599%
7. Provision for bad debts (54,908) (16,719) 228% (21,219) (16,719) 127%
II. Other current assets 4,514 4,818 -6% 4,666 5,229 89%
B. Fixed Assets And Long-Term Investments
144,125 133,146 8% 138,636 139,015 100%
I. Fixed assets 9,116 10,306 -12% 9,711 20,415 48%II. Works in progress 11,158 1,807 517% 6,483 -III. Other long-term assets 123,851 121,033 2% 122,442 118,600 103%
Total Assets 3,616,842 3,103,574 17% 3,170,345 3,329,153 95%
A. Liabilities 1,224,925 824,025 49% 834,612 862,318 97%I. Short term liabilities 1,224,925 824,025 49% 834,612 862,318 97%
Loans & bank overdrafts 1,000,000 654,103 53% 613,781 200,000 307%
B. Owers’ Equity 2,391,917 2,279,549 5% 2,335,733 2,466,835 95%I. Equity 2,391,917 2,279,549 5% 2,335,733 2,466,835 95%
Total Equity 3,616,842 3,103,574 17% 3,170,345 3,329,153 95%
Total assets as at 31 December 2016 consisted of loans (76%), financial assets (8%), cash (2%), fixed asset and long term investments (4%) and other accounts receivables.
Cash balance, including loans and bank overdrafts, at the end of 2016 dropped substantially to VND 60 billion from VND 164 billion. Majority of that cash was utilized in order to finance margin trading business and short-term investments while the rest was deployed to maintain day-to-day operations.
Financial assets include HSC’s investments in shares, which valued at market prices (after provision) at 31 December 2016.
Loan balance of VND 2,750 billion mainly includes margin loans extended during 2016. The average margin balance for HSC reached VND 2,600 billion in 2016.
Receivables from services provided mainly include receivables from clearing settlement with the Stock Exchanges in the amount of VND 313 billion.
Capital as at 31 December 2016 reached VND 2,392 billion, increasing by VND 112.4 billion compared to late 2015, which can be attributed to:
• Increased income after tax in 2016: VND 304.5 billion;
• Deduction from the 1st interim dividend advance in 2016 (5%): VND 63.5 billion;
• Deduction from the 2nd interim dividend advance in 2015 (9.3%): VND 118.2 billion;
• Deduction from appropriation of funds from 2015’s income after tax: VND 10.0 billion.
Bank Interest Expenses
Bank interest expenses in 2016 increased five-fold to reach VND 45 billion compared to 2015 in order to meet working capital demands for margin lending business, which had a significant upswing amidst improved market sentiment.
Securities trading expenses
This expense incurred where securities were sold at lower price than cost price, thereby resulting in a loss. In according with Circular 95/2008/TT-BTC issued by Ministry of Finance guiding on accounting of securities investment, this should be booked as a direct cost rather than as a contra against revenue.
Loss from revaluation of financial assets at FVTPL
HSC recorded a provision for impairment of investment at VND 3.5 billion in 2016 compared to the reversal for impairment of securities investment in 2015.
PERFORMANCE OVERVIEW
Provision for bad debts
HSC recorded additional expense in the form of provision for bad debt at VND 18.2 billion to account for unrecoverable margin loans.
General provision for lending
These are general provisions for margin loans to be added in 2017 at a proportion of 0.75% on the margin increase compared to late 2016.
3332 HSC ANNUAL REPORT 2016 OPPORTUNITIES

M2 vs. Credit % y/y growth M2 vs. Deposit vs. VND deposit y/y deposit growth rates
Jan-
10M
ar-1
0M
ay-1
0Ju
l-10
Sep-
10N
ov-1
0Ja
n-11
Mar
-11
May
-11
Jul-1
1Se
p-11
Nov
-11
Jan-
12M
ar-1
2M
ay-1
2Ju
l-12
Sep-
12N
ov-1
2Ja
n-13
Mar
-13
May
-13
Jul-1
3Se
p-13
Nov
-13
Jan-
14M
ar-1
4M
ay-1
4Ju
l-14
Sep-
14N
ov-1
4Ja
n-15
Mar
-15
May
-15
Jul-1
5Se
p-15
Nov
-15
Jan-
16M
ar-1
6M
ay-1
6Ju
l-16
Sep-
16N
ov-1
6
Jan-
11M
ar-1
1M
ay-1
1Ju
l-11
Sep-
11N
ov-1
1Ja
n-12
Mar
-12
May
-12
Jul-1
2Se
p-12
Nov
-12
Jan-
13M
ar-1
3M
ay-1
3Ju
l-13
Sep-
13N
ov-1
3Ja
n-14
Mar
-14
May
-14
Jul-1
4Se
p-14
Nov
-14
Jan-
15M
ar-1
5M
ay-1
5Ju
l-15
Sep-
15N
ov-1
5Ja
n-16
Mar
-16
May
-16
Jul-1
6Se
p-16
Nov
-16
M2 y/y % growth M2 y/y % growth
Deposit y/y % growth
VND deposit y/y % growthCredit y/yC % growth
M2 vs. Credit % y/y growth
Jan-
10M
ar-1
0M
ay-1
0Ju
l-10
Sep-
10N
ov-1
0Ja
n-11
Mar
-11
May
-11
Jul-1
1Se
p-11
Nov
-11
Jan-
12M
ar-1
2M
ay-1
2Ju
l-12
Sep-
12N
ov-1
2Ja
n-13
Mar
-13
May
-13
Jul-1
3Se
p-13
Nov
-13
Jan-
14M
ar-1
4M
ay-1
4Ju
l-14
Sep-
14N
ov-1
4Ja
n-15
Mar
-15
May
-15
Jul-1
5Se
p-15
Nov
-15
Jan-
16M
ar-1
6M
ay-1
6Ju
l-16
Sep-
16N
ov-1
6
5.0%
15.0%
25.0%
35.0%
45.0%
55.0%
65.0%
M2 y/y % growth
Credit y/yC % growth
Credit growth y/y
Jan-
10M
ar-1
0M
ay-1
0Ju
l-10
Sep-
10N
ov-1
0Ja
n-11
Mar
-11
May
-11
Jul-1
1Se
p-11
Nov
-11
Jan-
12M
ar-1
2M
ay-1
2Ju
l-12
Sep-
12N
ov-1
2Ja
n-13
Mar
-13
May
-13
Jul-1
3Se
p-13
Nov
-13
Jan-
14M
ar-1
4M
ay-1
4Ju
l-14
Sep-
14N
ov-1
4Ja
n-15
Mar
-15
May
-15
Jul-1
5Se
p-15
Nov
-15
Jan-
16M
ar-1
6M
ay-1
6Ju
l-16
Sep-
16N
ov-1
6
-40%
-20%
0%
20%
40%
60%
80%
65.0% 48.0%
43.0%
38.0%
33.0%
28.0%
23.0%
18.0%
13.0%
8.0%
55.0%
45.0%
35.0%
25.0%
15.0%
5.0%
Total credit y/yVND credit y/yForeign currency credit y/y
Jan-
10Ap
r-10
Jul-1
0O
ct-1
0Ja
n-11
Apr-
11Ju
l-11
Oct
-10
Jan-
12Ap
r-12
Jul-1
2O
ct-1
2Ja
n-13
Apr-
13Ju
l-13
Oct
-13
Jan-
14Ap
r-14
Jul-1
4O
ct-1
4Ja
n-15
Apr-
15Ju
l-15
Oct
-15
Jan-
16Ap
r-16
Jul-1
6O
ct-1
6Ja
n-17
Apr-
17Ju
l-17
Oct
-17
May
-08
Aug-
08N
ov-0
8Fe
b-09
May
-09
Aug-
09N
ov-0
9Fe
b-10
May
-10
Aug-
10N
ov-1
0Fe
b-11
May
-11
Aug-
11N
ov-1
1Fe
b-12
May
-12
Aug-
12N
ov-1
2Fe
b-13
May
-13
Aug-
13N
ov-1
3Fe
b-14
May
-14
Aug-
14N
ov-1
4Fe
b-15
May
-15
Aug-
15N
ov-1
5Fe
b-16
May
-16
Aug-
16N
ov-1
6
CPI y/y (LHS)
CPI m/m (RHS)Core CPI y/y
CPI y/y
CPI - m/m and y/y trend Core vs. Headline CPI (y/y %)
30%
25%
20%
15%
10%
5%
0%
-5%
30%
25%
20%
15%
10%
5%
0%
-5%
5%
4%
3%
2%
1%
0%
-1%
Hence we forecast credit growth of about 16.9% in 2017, based on M2 growth of 17.5% y/y. Both represent a modest deceleration on the estimated levels for 2016.
In 2016 credit growth was significantly faster than GDP growth. This was never going to be sustainable, and we view the acceleration in 2016 credit growth as anomalous given slowing GDP growth. And while we do argue for a modest acceleration in 2017 GDP growth we think a mild deceleration in credit growth is simply normative.
In FY2016, we estimated that M2 grew by some 18.5% (as of end November we estimate the y/y trend at around 18.6% y/y), which placed it around 290 bps faster than in 2015. Then for 2017 we forecast M2 will decelerate to some 17.5% growth y/y, i.e. approx. 100 bps slower than 2016, just slightly ahead of our credit growth forecast.
In Vietnam, M2 growth targets are the result of a tussle between a need for growth and fear of inflation – As indeed elsewhere. Nothing new there then. However the two factors work in different ways. The need for growth is a constant. Every government would like to grow their economy as fast as possible. Always. In contrast the fear of inflation rises and falls.
Source - SBV; HSC estimates
Source - SBV; HSC estimates
Source - SBV; HSC estimates
Source - SBV; HSC estimates
HSC forecasts M2 to grow by 17.5% y/y in 2017
STRATEGY & MACROECONOMIC 2017
HSC sees further room for economic growth in 2017 as the spectre of inflation returns
2017 CPI is forecasted to rise by 6.2% y/y
HSC estimates the FY2017 headline CPI to rise by 6.2% y/y while core inflation will increase by 2.2% y/y. Our forecasts are well above the Government’s official forecast calling for a 4% y/y increase (they have now moved to an average CPI methodology). This also marks a mild acceleration on the 4.74% y/y increase seen in headline CPI and 1.87% in core CPI in 2016. We have already seen a quickening in the pace of inflation since 2015 when it ended the year with a 0.6% y/y increase.
We see some of the same forces at work in 2017; plus some new forces. CPI rise in 2016 was driven by (1) a 38% increase in healthcare service costs and an 11% increase in education costs coupled with a (2) 9% increase in fuel costs (including a 7.2% increase in the benchmark A92 petrol price and a 12.1% increase of diesel oil). Plus a more modest 3% increase in the food & foodstuffs index and finally a 3.57% increase in the accommodation and construction materials index.
As for 2017, the view is:
• Healthcare and education costs will continue to increase as per a prepared schedule, which has been partially delayed into 2017 increasing its impact;
• We forecast that WTI crude oil prices will rise to an average of US$60 per barrel in 2017 leading to steady upward pressure on all petroleum products during the year;
• We also see higher food prices following the global trend. As higher demand coupled with higher fuel costs and uncertain weather patterns all play a part.
Credit growth expected to slow down to 16.9% in 2017
HSC had predicted that 2016 credit growth would expand around 15% whereas the actual figure touched 18%. We hadn’t anticipated that the authorities would encourage credit growth so much, and more importantly would be able to do so for much of the year given moribund inflationary pressures (until Q3) and a somnolent currency. The key to credit growth in fact was money supply, and how much money supply can grow depends on the currency and inflation. In such a benign environment as we had for much of 2016 this meant that M2 could expand quite a bit. The waters of FY2017 won’t be quite as calm and forgiving in our opinion.
Source - GSO; MOF; all forecasts by HSC Source - GSO; IMF
3534 HSC ANNUAL REPORT 2016 OPPORTUNITIES

24,000
23,000
22,000
21,000
20,000
19,000
18,000
17,000
16,000
15,000
VND US$ exchange rate and band
Mar
-08
May
-08
Nov
-08
Nov
-08
Jan-
09
Jul-0
8Se
p-08
Mar
-09
May
-09
Nov
-09
Jul-0
9Se
p-09
Jan-
10M
ar-1
0M
ay-1
0
Nov
-10
Jul-1
0Se
p-10
Jan-
11M
ar-1
1M
ay-1
1
Nov
-11
Jul-1
1Se
p-11
Jan-
12M
ar-1
2M
ay-1
2
Nov
-12
Jul-1
2Se
p-12
Jan-
13M
ar-1
3M
ay-1
3
Nov
-13
Jul-1
3Se
p-13
Jan-
14M
ar-1
4M
ay-1
4
Nov
-14
Jul-1
4Se
p-14
Jan-
15M
ar-1
5M
ay-1
5
Nov
-15
Jul-1
5Se
p-15
Jan-
16M
ar-1
6M
ay-1
6
Nov
-16
Jul-1
6Se
p-16
interbank market mid market price
Black market (mid)
lower band
upper band
Short-term interest rate
Mar
-08
May
-08
Jul-0
8Se
p-08
Nov
-08
Jan-
09M
ar-0
9M
ay-0
9Ju
l-09
Sep-
09N
ov-0
9Ja
n-10
Mar
-10
May
-10
Jul-1
0Se
p-10
Nov
-10
Jan-
11M
ar-1
1M
ay-1
1Ju
l-11
Sep-
11N
ov-1
1Ja
n-12
Mar
-12
May
-12
Jul-1
2Se
p-12
Nov
-12
Jan-
13M
ar-1
3M
ay-1
3Ju
l-13
Sep-
13N
ov-1
3Ja
n-14
Mar
-14
May
-14
Jul-1
4Se
p-14
Nov
-14
Jan-
15M
ar-1
5M
ay-1
5Ju
l-15
Sep-
15N
ov-1
5Ja
n-16
Mar
-16
May
-16
Jul-1
6Se
p-16
Nov
-16
Overnight rate1 month VND rate
Deposit rate vs. lending rates vs Benchmark yield
30%
25%
20%
15%
10%
5%
0%
Jun-
08Se
p-08
Dec-
08M
ar-0
9Ju
n-09
Sep-
09De
c-09
Mar
-10
Jun-
10Se
p-10
Dec-
10M
ar-1
1Ju
n-11
Sep-
11De
c-11
Mar
-12
Jun-
12Se
p-12
Dec-
12M
ar-1
3Ju
n-13
Sep-
13De
c-13
Mar
-14
Jun-
14Se
p-14
Dec-
14M
ar-1
5Ju
n-15
Sep-
15De
c-15
Mar
-16
Jun-
16Se
p-16
23%21%19%17%15%13%11%
9%7%5%3%
Actual lending rates
Actual deposit ratesPosted deposit rates
Benchmark yield
HSC forecasts VND to depreciate by 3% in FY2017
Source - Reuters; SBV
• Widening interest rate differentials will put modest pressure on the VND. With domestic US$ deposit rates likely to remain at zero for the 1-H at least; the interest rate differentials between onshore and offshore US$ rates can only increase further. This will also spill over into VND interest rates given the government’s commitment to keep rates as low as possible for as long as possible. Hence some investors may not feel sufficiently compensated for currency risk in fixed assets and therefore reduce exposure.
• Increasing global pricing pressure an important factor here. With commodity prices having bottomed out in Q1 2016 and the Bloomberg commodity index up 10.9% since then the resurgence of wholesale and consumer price inflation is real. And will accelerate in 2017. This adds to pressures as it will put upward pressure on the price of money. And to the extent that the pace of increase in the price of money differs between nations; currencies will bear the resulting additional pressure.
• Modest decline in VND in 2016 was due to some one-off factors - Here we are also assuming that the modest decline of the VND in 2016 was anomalous to some extent. Given that the effect of the declining balance of foreign currency deposits in the banking sector was both enormously helpful and also unsustainable. So our basic notion is to assume that this factor will not be as prominent in 2017.
• Back to trade deficits - HSC forecasts a trade deficit of some US$2.71 billion in 2017 versus a trade surplus of some US$2.68 billion in 2016 (according to the preliminary numbers). We also see the trade surplus as somewhat anomalous also being governed by a fairly sharp drop in imports. Which we see as related to destocking. This isn’t sustainable in our view and the brighter outlook for global trade in 2017 will lead first to restocking and a resulting quickening in imports.
• Slowing FDI; Incoming remittance and ODA flows will cumulatively add to a US$ shortage onshore – following our views above which forecasts a small but still significant decline in FDI; incoming remittance and also ODA flows in 2017 will have a clear impact on the capital account. And will only add to the pressure on the currency given that we expect a relative shortage of US$ onshore.
• Pressure is building in the OTC and gold markets – we have seen familiar signs of pressure building in both the OTC forex markets and also the gold markets. Given rising premiums of domestic gold over foreign gold and OTC forex rate over the interbank market upper ceiling. This is a clear sign that an adjustment is likely.
HSC forecasts that the VND will depreciate by up to 3% of its value versus the US$ in FY2017 – We forecast that the VND will drop a further 3% versus the US$ in 2017 to end the year at a rate of around VND23,448.
STRATEGY & MACROECONOMIC 2017
And it is then that determines the sustainable level of growth. In this case we are talking specifically about monetary growth.
We think the SBV will slow down base money growth to protect the currency – And by doing so try to slow down any further dramatic acceleration in inflation. By reducing the growth in the supply of money to a level sufficient to ensure economic growth and also ensure that the State Treasury can find bank buyers for its bond issuance. Some of what happens here is beyond the control of the central bank. For example they can’t defend a currency with a dollar peg indefinitely. And if commodity prices continue to rise there is little they can do about the accompanying increase in inflation except deal with its consequences.
Slower M2 will raise the price of money - Even so; by getting ahead of the trend so to speak they can attempt to slow it down. And one obvious way to do that is to slow M2 and also credit growth targets for next year. This of course is more about policy nuance than any dramatic change. Even so; the effects of slightly slower M2 growth will be clear. It offers (1) a small buffer against dramatic currency depreciation; (2) slightly cools inflationary pressure; (3) leads to higher bank interest rates as supply is restricted against the background of constant demand.
In other words lower M2 growth, as much as higher interest rates, is a form of tightening monetary policy. And an appropriate and balanced approach to increasing pricing pressure. Given that this pricing pressure is still in its early phases. Effectively applied it may allow the SBV to avoid having to raise policy rates. As the simple effect of this will be to guide market interest rates higher. In a gradual and unobtrusive fashion.
Source - HSC collection; BloombergSource - HSC collection; Bloomberg
be hiked thrice in 2017 instead of twice as was the previous view. And that suggests about a 0.75% increase in the Fed funds rate to some 1.25-1.50% by the end of next year.
The interest rate view is more aggressive than the previously given perception that wholesale and consumer price inflation is quickening throughout the globe and the announcement of an aggressive fiscal stimulus by the incoming administration. Now of course it assumes to some extent that Congress will allow the plan to pass but then with a built-in Republican majority the chances of this are fairly high.
Rising CPI and core CPI will keep upward pressure on rates. HSC forecasts CPI will increase 6.2% y/y during FY2017 as commodity (food and fuel) prices quicken. And further believe core inflation will move higher also. This will exert consistent upward pressure on deposit rates and VGB bond yields as well.
• Fed guidance now looking for three interest rate hikes in 2017;
• Our view of the expected trend for US benchmark treasury bond yields;
• Our forecasts for headline & core inflation here in Vietnam;
• Need to maintain a spread between VND and US$ rates to ensure currency stability.
Recent Fed hike less significant for forward interest rates than change in forward rate guidance. The recent increase in the Fed funds rate of 25 bps was already long expected. However it was the increase in the forward guidance as shown in the so called “dot plot” (which gives a view on the likely future trajectory of the Fed funds rate) that led to an immediate reaction in all US interest earning asset classes. The Fed now expects that interest rates will
Vietnamese Interest Rates will rise on average by 120 bps in 2017
HSC forecasts that average deposit & loan rates along with benchmark yields will increase by some 120 bps in 2017. This is based on a combination of factors:
37OPPORTUNITIES36 HSC ANNUAL REPORT 2016

Real GDP Growth (y/y)
Seasonal-Adjusted Real GDP (y/y)
Real GDP and Seasonal-Adjusted GDP y/y
VN-Index Bull vs. Bear
2001
-Q1
2001
-Q3
2002
-Q1
2002
-Q3
2003
-Q1
2003
-Q3
2004
-Q1
2004
-Q3
2005
-Q1
2005
-Q3
2006
-Q1
2006
-Q3
2007
-Q1
2007
-Q3
2008
-Q1
2008
-Q3
2009
-Q1
2009
-Q3
2010
-Q1
2010
-Q3
2011
-Q1
2011
-Q3
2012
-Q1
2012
-Q3
2013
-Q1
2013
-Q3
2014
-Q1
2014
-Q3
2015
-Q1
2015
-Q3
2016
-Q1
2016
-Q3
10%
1,200
1,000
800
600
400
200
0
9%
8%
7%
6%
5%
4%
3%
Feb-
07M
ay-0
7Au
g-07
Nov
-07
Feb-
08M
ay-0
8Au
g-08
Nov
-08
Feb-
09M
ay-0
9Au
g-09
Nov
-09
Feb-
10M
ay-1
0Au
g-10
Nov
-10
Feb-
11M
ay-1
1Au
g-11
Nov
-11
Feb-
12M
ay-1
2Au
g-12
Nov
-12
Feb-
13M
ay-1
3Au
g-13
Nov
-13
Feb-
14M
ay-1
4Au
g-14
Nov
-14
Feb-
15M
ay-1
5Au
g-15
Nov
-15
Feb-
16M
ay-1
6Au
g-16
Nov
-16
Then we see a narrowing of the free liquidity which was so ample in 2016 as the next biggest challenge. Therefore much of our still positive investment thesis for 2017 depends on a return of foreign investors. However, all of that depends on the timeline of interesting equitizations which will be lumpy.
Market successfully overcame foreign net selling over the last 6 months or so. We have already seen a lot of these features in the last 6 months of 2016 except for the foreign net buying part. This occurred mostly due to aggressive foreign net selling. In fact, were it not for the positive net liquidity and aggressive increase in margin lending activity the market would have performed significantly worse.
Free liquidity gap also looks set to narrow as both credit growth and M2 growth likely to slow. Our macro view on liquidity assumes that credit growth will slow to around 16.9% in FY2017 versus our target for 17.5% growth in M2 money supply. We see this as narrowing the positive free liquidity gap seen in 2016 to just some 60 bps as a result of resurgence in inflation and heightened currency concerns
which are forcing a rethink in the State Bank of Vietnam’s (SBV) priorities for 2017. This is, of course, not so good news for the stock market.
The Vietnamese equity market, like any equity market rests on the condition of its three main pillars:
• Free liquidity - small positive
• Net supply - small negative
• Earnings growth - large positive
HSC is not concerned about oversupply this year as we argue that for most IPOs & listings only a small percentage of the shares actually change hands. So while the overall market capitalisation of the market may increase substantially as we have seen in 2016, this doesn’t mean that a lot of shares will change hands.
At first glance, the backdrop might look rather mixed for equities. However, the micro climate for several key industries looks better.
BUY signals for the Vietnamese stock market Importance level-Primary/ Secondary
Likelihood in next 3 months
Likelihood in next 6 months
Likelihood in next 12 months
Macroeconomic changes
Acceleration in GDP growth in 2017 Primary Low Medium Medium
Early signs of a pickup in consumption & exports Primary High High High
Recovery in resource & agriculture sector on higher commodity prices
Primary High High High
Slowdown in manufacturing and construction sectors Secondary Low Medium Medium
CPI to accelerate Primary Low Medium Medium
Currency to depreciate at a faster rate than in 2016 Primary Low Medium Medium
Monetary policy changes
Credit growth & M2 to slow down in 2017 Positive free liquidity gap to narrow Interest rates to move higher
Primary Primary Primary
Medium High Low
High High Medium
High High High
Fiscal Policy and Balance of Payments
Budget deficit to narrow as new revenue sources added Trade deficit to return as imports accelerate Balance of Payments to see small deficit as incoming flows slow
Primary Primary Primary
Medium Low Low
Medium Medium Medium
High High High
Structural change
Equitisation program to continue at same rapid pace as in 2-H 2016 Acceleration of bank restructuring and M&A Addition of derivative and covered warrant products to deepen market liquidity
Primary Primary Primary
High Low Low
High High Medium
High High High
Other factors
Incoming M&A activity in several key sectors Moving up value chain for exports especially high tech exports Failure of TPP leads to vacuum in trade policy
Primary Secondary Primary
High High High
High High High
High High High
Key positive and negative factors for the Vietnamese stock market in 2017
Source - HSC
STRATEGY & MACROECONOMIC 2017
Impact so far to US$ strength has been quite reserved. We don’t see that lasting however – As mentioned the YTD 1.2% decline in the VND versus the US$ is quite modest when compared to (1) recent history and (2) other regional currencies.
• For example in FY2015 the VND lost 4.97%;
• While in 2016, the Chinese Yuan lost 6.31% while the Ringgit has lost 4.34% both against the US$.
Supporting our view that the very slight VND currency movement YTD has been rather unusual. And that we shouldn’t bank on another year of very modest adjustments. Especially now that inflation has returned. While the potentially dislocatory effects of abnormally low interest rates globally accompanied with aggressive flows cannot be expected to unravel without causing any impact.
quarter which at least suggests that things got better after a rocky start. The worst of the drought in the Mekong Delta coupled with the collapse in crude oil prices both had occurred in Q1.
Our assumptions for GDP prediction include a recovery in the agriculture and mining sector, along with consumption related sectors. The potential recovery in commodity prices could well be the most significant tailwind for GDP in 2017 as the long downtrend on prices has depressed the primary (agriculture); secondary (mining) and tertiary (retail & wholesale) segments of the GDP series over the last few years.
Even so we also see some headwinds such as rising inflation which will likely push up interest rates and the risk of some currency volatility. We also suggest that the manufacturing and construction segments, two growth stalwarts over the last few years, will see decelerating growth in 2017.
In the end 2016, GDP came to 6.21%, slightly below the adjusted target of 6.3–6.5% and of course also below the initial target of 6.7%. Even so, looking through the year each quarter saw a mild acceleration on the previous
GDP will grow 6.54% in FY2017 after a slightly disappointing 2016
HSC has set the VN-Index target of 800 for 2017
In 2017, HSC forecast of 800 suggests a 20.3% gain on the 664.9 close for the index at the end of 2016, which compares to a gain of 18.6% in the preceding year. We see this performance being supported by:
• Modest and positive free liquidity as we expect that despite a narrowing of the gap between M2 growth and credit growth on an annualized basis that foreigners will turn around and become significant net buyers in 2017;
• A significant increase in mainly SOE related new listings further boosted by a sell down of government stakes in existing listed companies, will spur investment and interest in the stock market to unprecedented levels in 2017;
• Strong earnings growth with HSC calling for net profits growth of 19.7% for the Top 70 companies by market capitalization.
Much of 2017’s performance will have to come from foreigners attracted by the active new listings. We don’t see a linear market in 2017. The main challenge to performance will come from:
• Expected large increases in market supply from new listings;
• Stake sales by the government; and
• Normal capital raising activity by corporations.
Source - HSC calculations
Source - HSC calculations
39OPPORTUNITIES38 HSC ANNUAL REPORT 2016

% net buying of total
Net foreign buying
6,000
5,000
4,000
3,000
2,000
1,000
0
-1,000
-2,000
-3,000
-4,000
40%
30%
20%
10%
0%
-10%
-20%
-30%
HSX Net foreign buying vs net buying as % o� total
Feb-
07M
ay-0
7Au
g-07
Nov
-07
Feb-
08M
ay-0
8Au
g-08
Nov
-08
Feb-
09M
ay-0
9Au
g-09
Nov
-09
Feb-
10M
ay-1
0Au
g-10
Nov
-10
Feb-
11M
ay-1
1Au
g-11
Nov
-11
Feb-
12M
ay-1
2Au
g-12
Nov
-12
Feb-
13M
ay-1
3Au
g-13
Nov
-13
Feb-
14M
ay-1
4Au
g-14
Nov
-14
Feb-
15M
ay-1
5Au
g-15
Nov
-15
Feb-
16M
ay-1
6Au
g-16
Nov
-16
Market reform will be a major 2017 theme
Equity market reform - possible timeline
Done in 2016
FOL access lifted for 9 stocksAuction of partial government stakes in some large cap companies in VNM Possible discussion of FOL reform for banking sharesListing of equitised former SOEs - Habeco, Sabeco, Vietnam Airlines and ACV
Expected within 2017
Possible discussion of FOL reform for banking shares. Another 5-10 companies to lift FOL Possible completion of HCMC & HN Exchange mergerDerivatives markets launch offering some VN30 index and bond future productsCovered warrants - options for individual stocksMulti account same day buy sell trading offered IPOs of Mobifone; Petrolimex;More equitised former SOEs may list - Vinatex; VEAM. Also 5-6 private banks. Along with Novaland and Vietjet Air.Auction of partial government stakes in some large cap companies in Sabeco; Habeco; FPT Telecom; more VNM
Expected within 2018
Possible launch of currency hedging products Possible NVDR launchMore SOE IPO auctions and listings
Expected within 2019
Inclusion in MSCI emerging market index may be considered assuming market access issue tackledMore SOE IPO auctions and listings
Given the advent of derivatives and covered products, with intraday trading at some stage, the common theme for 2017 might be “deepening the market”. The listing of many large SOEs and some private sector companies will ensure there are also more alternatives on offer.
All of this looks to be part of a serious and sustained effort to win the emerging market status for Vietnam in a few years. The end game here is clear: MSCI Emerging market status perhaps in 2-3 years once the current program of reform has taken root. The main issue was always market depth in terms of daily liquidity and choices. And therefore we note that the current batch of reforms aims to tackle those shortcomings.
Several major changes coming this year as the authorities have set their stall out for market reform in 2017:
• A derivatives market with one or two products including a VN30 index futures contract and a bond index futures will be launched in Q2 2017;
• Covered warrants on individual stocks will be launched later in the year;
• Intraday trading to be allowed also. However, the start date for this is still unclear;
• The timeline for a merger between the HSX and HNX will be announced fairly soon;
• FOL opening will continue at a fairly leisurely pace in 2017.
We have a very high level of confidence for the first two reforms – as preparations for both are advanced.
Source - HSC
STRATEGY & MACROECONOMIC 2017
Foreigners were significant net sellers in 2016. We look for better times in 2017
First time foreigners in Vietnam have been net sellers for a whole year. Foreign investors sold a record US$354.08 worth of Vietnamese equities in 2016. In fact, it’s even the first year there have been net sellers since we started keeping the records. The net selling all occurred on the HSX and was confined to the net selling of a handful of blue chips notably VNM. Some of the net selling pressure came from the two ETFs which have seen a drop in AUM over the period in question. However it was broader than that.
• Foreigners have been taking money out of frontier and emerging markets in general – as is well known there has been a retreat out of emerging and frontier markets in general. This comes down to currency risk apparently. The better the US$ does against all comers the more risky emerging and frontier assets look. This is not even about country risk – it is bigger than that.
It reflects the gap between where the US economy is right now vs. the rest of the world. With the perception that the gap is widest between the US economy and emerging and frontier markets, and that it’s the currencies that will take the hit. True or not that’s the perception.
• TPP and Trump have also soured investors slightly on the Vietnam story. The TPP theme has been inextricably linked to the Vietnam story for several years. The belief was that TPP was like adding a turbo to the GDP engine, and therefore it certainly brought some incoming investors into Vietnamese equities. At the heart of this is an export trade story. And now with the apparent failure of TPP and the election of President Trump this story has a cloud hanging over it. It’s perhaps no coincidence that foreigners have been net sellers in four of the last five months – including a record monthly amount in September 2016.
• Our base case is that after such a massive sell-off we sense foreigners are now heavily underweight in Vietnam. In contrast to some other regional markets, the currency hasn’t moved much and therefore fears of being caught in a weakening currency have not come to fruition. And are unlikely to, given the tight grip the SBV has been keeping on currency management. Hence we argue that given the right opportunities, some or the entire outflow will come back in 2017.
Source - HSX
Source - HSX; HNX
Foreign net buying of equities (FY2007-2016)
HSX HNX Total Total in US$mn
FY2007 22,875 2,865 25,740 1,225.71
FY2008 5,827 554 6,381 303.86
FY2009 3,177 370 3,546 168.87
FY2010 15,367 823 16,191 770.98
FY2011 1,263 642 1,905 90.69
FY2012 3,321 1,083 4,404 209.71
FY2013 5,502 1,304 6,806 324.10
FY2014 2,155 877 3,031 144.35
FY2015 2,095 788 2,883 137.28
FY2016 (8,997) 959 (8,038) (354.08)
41OPPORTUNITIES40 HSC ANNUAL REPORT 2016

Risks & Opportunities for 2017
Major risks for the market & economy in 2017
Risks Impact on Vietnam’s economy & stock market
Debt crisis or currency run in China
Likely spillover effect on VND from Chinese currency weakening Impact on trade flows within the region
Further downside risk for many commodities
Acceleration in inflation above 6%
Pressure to slow M2 growth further Interest rates and bond yields jump
Equities correct as money switches to bank deposits
Disruption to status quo in trade policy
Uncertainty as to US-China trade policy would directly affect Vietnamese exports
Move towards protectionism would affect global trade; currency; FDI and equity flows
The risks all look external while the opportunities are being created by domestic reform – not a bad position to be in really. Legacy problems such as the fiscal deficit and bank restructuring are top of the government’s agenda. And we sense that they are being tackled in a very deliberate fashion. The break with the past comes from the following:
• There is a consensus to tackle problems rather than let them fester; hence the equitisation program was sped up quite quickly since mid Q3. Talks followed action within the space of a few months, which is a lot different to the pace of change in the past. We also sense the same thing will happen to bank restructuring in 2017;
• Issues like the fiscal deficit and NPLs are serious enough to spur the need for action – of course with some of these issues having been around for a year there is arguably little time to waste. And therefore the sense of urgency is coming from a need to tackle these issues before they affect economic growth rates;
• Growing confidence in the government’s ability to match words with deeds – execution is every- thing. And the actions of the last 6 months suggest that the rhetoric of the new cabinet is being backed up by concrete actions within a fairly short period of time.
Source - HSC
Equitisation program will be front and centre in 2017
STRATEGY & MACROECONOMIC 2017
No. Company Owner Chartered Capital Outstanding Share
1 Ben Thanh Group HCMC People's Committee 1,936,000,000,000
2 Saigon Real Estate (Resco)
3 Saigon Water Co (Sawaco) HCMC People's Committee
4 PVPower PVN 13,107,000,000,000
5 Genco 3 EVN 12,600,000,000,000
6 Nam Cuong (Hanoi Real Estate Group)
7 PV Oil PVN 10,884,251,000,000
8 Kidos Ice Cream
9 Hai Ha Kotobuki Co. Ltd Vinataba
10 Vinaapaco (Apatit) Vinachem 1,500,000,000,000 150,000,000
11 Saigon Trading Group (Satra) HCMC People's Committee
12 Saigon Transportation Mechancial Co (SAMCO) HCMC People's Committee
13 General Saigon Agriculture Co (SAGRI) HCMC People's Committee
14 Saigon Tourist HCMC People's Committee 5,300,000,000,000
15 4 Big C grocery stores in Hanoi area Hanoi Tourist (GTC Thang Long Co Ltd)
16 Capital Tower (Hanoi) Hanoi Tourist (GTC Thang Long Co Ltd)
17 Hilton Hotel Hanoi (Intercontinental Hotel) Hanoi Tourist (GTC Thang Long Co Ltd)
18 Pan Horizon Hanoi Hanoi Tourist (GTC Thang Long Co Ltd)
19 Hanoitourist Taxi Hanoi Tourist (GTC Thang Long Co Ltd)
20 Thang Long GTC Travel Hanoi Tourist (GTC Thang Long Co Ltd)
21 Capital Tourist Co Hanoi Tourist (GTC Thang Long Co Ltd)
22 Song Da Group Ministry of Construction
23 Housing and Urban Development Co (HUD - OTC) Ministry of Construction24 Vietnam Water and Environment
Investment Co JSC (Viwaseen)Ministry of Construction
25 Vietnam Urban & Industrial Zone Development Investment Co (IDICO)
Ministry of Construction
26 FICO Co JSC Ministry of Construction
27 Vientam Cement Industry Co (VICEM) Ministry of Construction28 Vietnam Construction and
Import-Export JSC (Vinaconex)Ministry of Construction
29 Construciton Machinery Co (COMA) Ministry of Construction
30 Vinalines Ministry Transportation
31 Mobifone Ministry of Post and Telecommunication
32 Vinaphone Ministry of Post and Telecommunication
33 Viettel Ministry of Defence34 Vietnam Northern Food Corporation
(Vinafood 1)MinistryofAgriculture& Rural Development
5,520,334,853,938 552,033,485
35 Vina Railways (VNR) MinistryofAgriculture& Rural Development
36 Vietnam Rubber Group (VRG) MinistryofAgriculture& Rural Development
37 Saigon New Port Co HFIC38 Voluntary Youth Agricultural
Development Co (ADECO)HFIC
39 Ho Chi Minh House Trade Management (HMTC) HFIC
40 Ho Chi Minh Ferry Bridge Construction JSC HFIC
41 Saigon Construction Quality Control JSC (SCQC) HFIC
Source – various media; HSC. List is incomplete. Highlighted names are the interesting ones
43OPPORTUNITIES42 HSC ANNUAL REPORT 2016
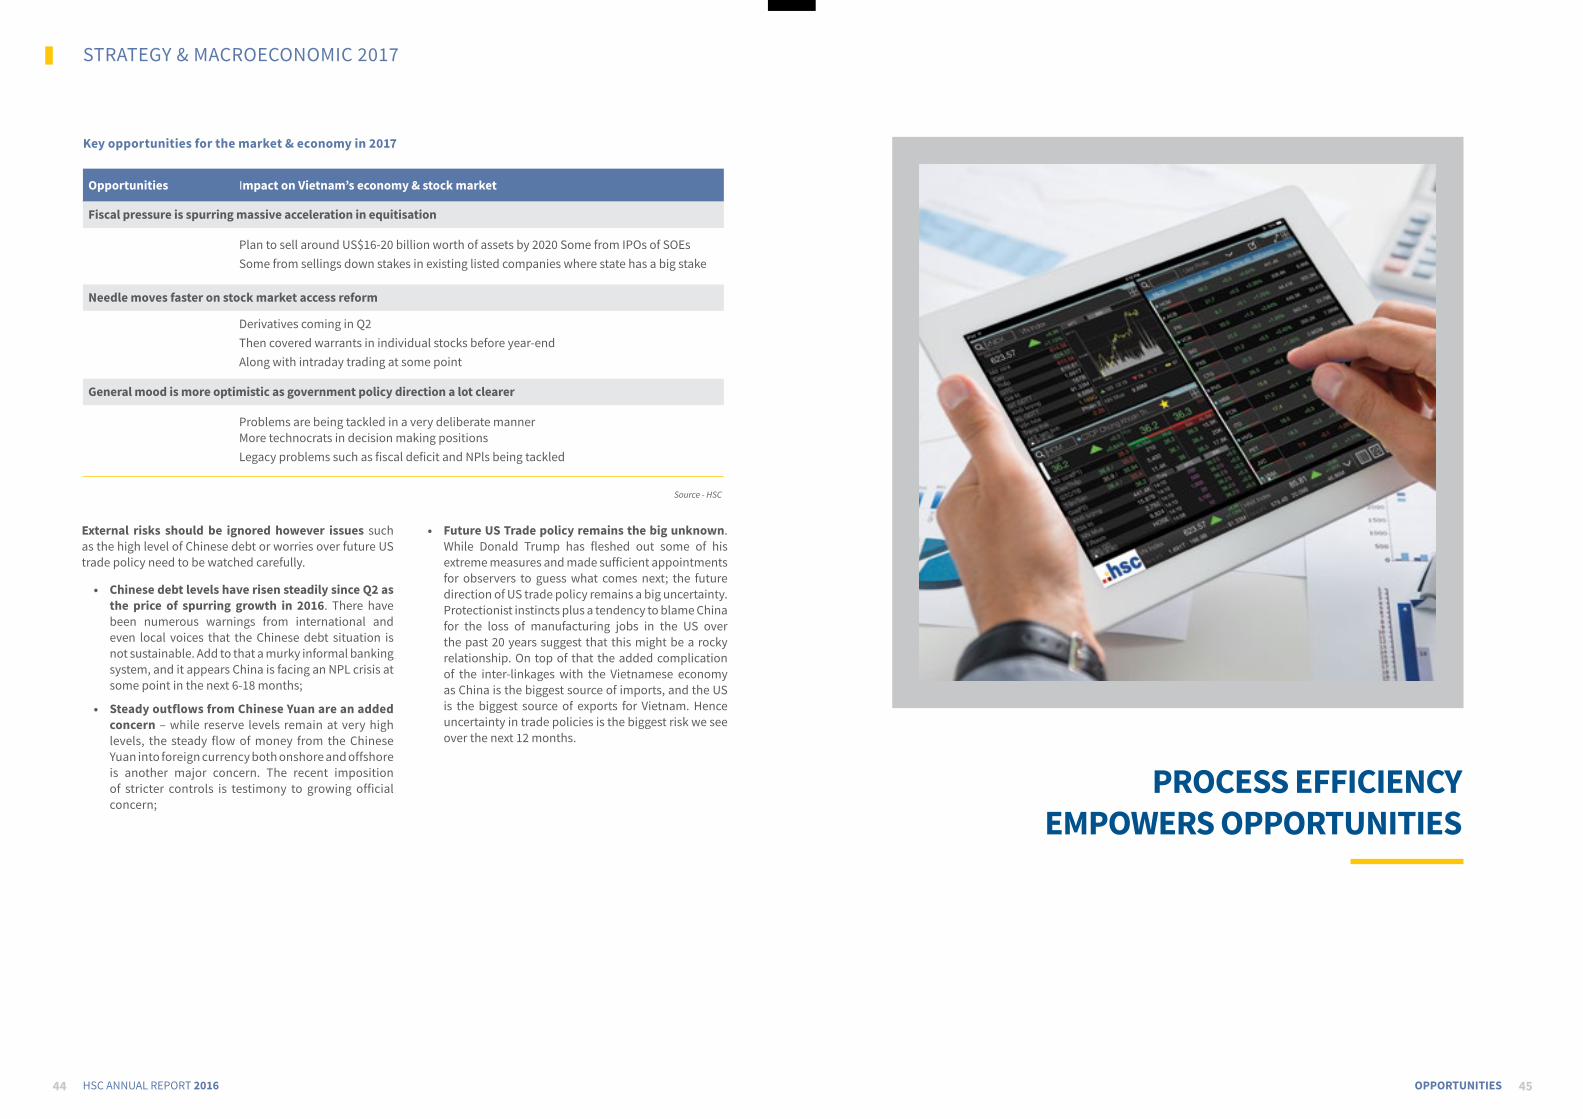
PROCESS EFFICIENCY EMPOWERS OPPORTUNITIES
STRATEGY & MACROECONOMIC 2017
Key opportunities for the market & economy in 2017
External risks should be ignored however issues such as the high level of Chinese debt or worries over future US trade policy need to be watched carefully.
• Chinese debt levels have risen steadily since Q2 as the price of spurring growth in 2016. There have been numerous warnings from international and even local voices that the Chinese debt situation is not sustainable. Add to that a murky informal banking system, and it appears China is facing an NPL crisis at some point in the next 6-18 months;
• Steady outflows from Chinese Yuan are an added concern – while reserve levels remain at very high levels, the steady flow of money from the Chinese Yuan into foreign currency both onshore and offshore is another major concern. The recent imposition of stricter controls is testimony to growing official concern;
• Future US Trade policy remains the big unknown. While Donald Trump has fleshed out some of his extreme measures and made sufficient appointments for observers to guess what comes next; the future direction of US trade policy remains a big uncertainty. Protectionist instincts plus a tendency to blame China for the loss of manufacturing jobs in the US over the past 20 years suggest that this might be a rocky relationship. On top of that the added complication of the inter-linkages with the Vietnamese economy as China is the biggest source of imports, and the US is the biggest source of exports for Vietnam. Hence uncertainty in trade policies is the biggest risk we see over the next 12 months.
Opportunities Impact on Vietnam’s economy & stock market
Fiscal pressure is spurring massive acceleration in equitisation
Plan to sell around US$16-20 billion worth of assets by 2020 Some from IPOs of SOEsSome from sellings down stakes in existing listed companies where state has a big stake
Needle moves faster on stock market access reform
Derivatives coming in Q2Then covered warrants in individual stocks before year-end Along with intraday trading at some point
General mood is more optimistic as government policy direction a lot clearer
Problems are being tackled in a very deliberate manner More technocrats in decision making positionsLegacy problems such as fiscal deficit and NPls being tackled
Source - HSC
45OPPORTUNITIES44 HSC ANNUAL REPORT 2016

Introduction
IT systems are crucial to the performance of firms within the financial services industry given the growth of today’s IoT and Big Data landscape. As competitive as the retail industry can be, HSC has strategically built its core competencies by leveraging on its technological capabilities to provide unique and differentiated user experience through HSC’s integrated trading platform. The IT architecture is continually being redefined and redesigned to champion efficient and effective business processes for HSC.
Enterprise activities within this function center upon two focal areas, i.e. security management and IT services management. Security management relates to the IT governance and protection of sensitive data and information while IT services management involves the development of HSC’s core trading system and the IT maintenance of the various business functionalities across HSC. The division also offers support in the execution of HSC’s contingency plans such that the firm closely aligns with the Risk Management Department in managing business continuity activities.
Enhancement of IT systems in 2016
HSC’s Trading Platform
The IT function continuously seeks technological improvements within HSC’s core trading system that is made accessible via application, website and mobile. Brokerage clients enjoy the convenience and ease of market access with the multiple trading channels provided by HSC. HSC Trade Pro – a trading application on iPad; HSC Trade on iOS – an application on the idea of “Apple style” for iPhone users. In 2016, we took the next step of enhancing user experience with an improved web-based trading platform - HSC iTrade. The newly revamped trading platform provides the investors the limitless experience which integrated advanced features developed base on the insightful market information channel. The secure, instant and flexible placing order function combines with Technical and Fundamental Analysis tools that together assist investors in making decision to timely maximize their profits.
With HSC iTrade, investors are able to:
• Conveniently trade on multiple accounts at the same time
• Analyze the information and decide to trade easily
• Easily track real-time market information
• Manage portfolio, track the transaction history, reports.
Data Integrity In the Face of New Threats
IT Governance Project
Formally introduced a few years back, the IT Governance Project is still ongoing and seeks to enhance the robustness of the HSC’s IT framework by improving the maturity levels of the IT systems to preserve data integrity within HSC. This is done through a multi-phase initiative, e.g. procurement of external auditors and Disaster Recovery Site (DRS). By far, HSC is one of the very few securities firm to have its own DR site that is vital to ensure the continuity of its business operations and protect the company’s core assets.
Priority for Cyber Security
Concerns for cyber security are becoming more and more alarming by the day. HSC has taken several steps to curb potential cyber security attacks by upgrading its systems to ISO 27001:2013 standards. HSC’s security infrastructure was strengthened with penetration tests, checkpoints for monthly vulnerability reports and the adoption of key security enhancement tools. Information Protection was rigidly enforced across all HSC’s operations to uphold solid data integrity. In addition, coordination between the IT function and the other functions motivated development of the Authorization Matrix which intricately designs the delegation of authority and information access across functions in HSC. All in all, cyber security remains the focal point in the strategy implementation of the IT division of the coming year.
INFORMATION TECHNOLOGY DEPARTMENT
Strategy for 2017
The focus of this function lies in the technological development of new derivative products to promote superior market-making and hedging opportunities. The IT function also extended its preparations to implement the two new derivatives products, Index Futures and Covered Warrants, within HSC. The necessary IT setups and procedures to integrate the specifications and requirements of the new products into HSC’s central system will take approximately twelve months of preparation with its completion expected to take place by mid-2017. The IT function also looks to improve the centralization of the risk management activities to manage material risks more effectively.
Apart from that, the function also aims for the digitalization of all services to be made available on the client portal. Service digitalization synergizes the
execution of the different business functionalities including cash management, account management, investors’ education and product distribution. Should the digitalization of all services be realized, HSC can expect major cost reductions in the years.
The enhancement of IT systems through the extensive application of technology allowed HSC to optimize cost-cuts with the delivery of automated systems that put forth better customer service with high standards of service offered to all clients. With this, HSC is able to make solid investments for technological advancements and industry know-hows to spur business product developments and elevate operational efficiency that can be sustained more systematically. This reaffirms the strategy of HSC to be at forefront of technological capabilities in the financial services sector in Vietnam.
4746 HSC ANNUAL REPORT 2016 OPPORTUNITIES

RISK MANAGEMENT DEPARTMENT
In 2016, the Risk Management Department brought an amendment to its internal structure with the consolidation of its Executive Committee (EXCO) and reporting lines. The roles of Investment Committee (IC) and Risk Management Executive Committee (RMEC) were centralized under one board of EXCO. The EXCO’s term of reference and the guideline for the delegation of authority alongside with its appendices were ironed out in a detailed manner to ensure that risks are more effectively managed throughout HSC.
The new Risk Oversight Structure can be seen below
Introduction
The Risk Management Department is principally governed through the Enterprise Risk Management (ERM) Manual. Since its establishment in 2012, the ERM Manual has evolved to be an integral part of HSC in achieving effective risk management. The ERM lays the foundation for the documentation process of other business functions within HSC.
To date, the ERM framework is in full compliance with the COSO standards of internal control. Subsequently, the Risk Management Department is further divided into two separate units namely, Internal Control & Compliance and Legal.
Internal Control & Compliance Unit
This unit supports HSC by committing to the following key objectives:
• To enhance the quality of oversight process of HSC activities throughout multiple departments by adding value, working paper or through audit program;
• To identify, source and assess various company risks;
• To ensure that critical risks are effectively managed and controlled with policies that highlight clarity in terms of responsibilities, authorities and accountabilities.
Legal Unit
This unit forms a part of the 2nd Line of Risk Defense to achieve the core objectives set out in Risk Management Department and HSC through the following procedures:
• To identify potential legal and regulatory issues on a timely manner;
• To develop a profile of potential legal risks by quickly and efficiently assessing the identified risk issues;
• To avoid and mitigate legal risks through proactive initiatives such as compliance programs and dialogue with government officials who are responsible for promulgation and/or law and regulatory enforcements;
• To manage legal risks as a means to minimize the risk impact onto the company when they materialize.
The risk culture at HSC fortifies its risk infrastructure by upholding integrity, professionalism and ethics embedded in policy statements, oral and written communications, decision-making, general behaviors and day-to-day operations. We highly emphasize on the cultivation of robust risk culture across the ERM Framework to ensure continued effectiveness of HSC’s ERM. The risk culture is at the heart of how risk shall be managed across HSC. In relation, the division’s modus operandi is to be objective and impartial when embracing the risk management framework in accordance to HSC’s Code of Conduct.
Board Risk Management Committee (BRMC)
CEO
Management (Including RMD)
Board of Directors (BOD) Internal Audit
Selected BOD
EXCOCRO = Secretariat Risk Owner
Action Owners
Ultimate Risk Owner
ERM Oversight
Day-to-day Management of Risks
Independent
Improved functionality in 2016
Following improved IT systems, quality of key securities services were enhanced across HSC’s revamped trading platform. These services may include account management services, OTC and trading transaction services, custodial services and tax services. HSC’s trading channels were further developed with added functionalities, providing more convenient, centralized, informative and responsive financial services that substantially add value to clients’ trading performance, thereby, heightening HSC’s level of customer service to a much higher degree.
New Procurement of Services
The department is in the process of introducing new services to cater for the upcoming products, Index Futures and Covered Warrants that will soon be launched in the Vietnam securities market. One such service is the offering of new clearing services and the Securities Services Department plans to immediately digitalize the new services into the central system to give HSC a competitive edge over its competitors. Additionally, HSC could expand its securities market presence to include mutual funds. Considering the very few number of mutual fund products available in the Vietnamese market, currently both domestic and foreign clients have limited alternatives to have exposure in Vietnamese mutual funds. As such, HSC may look into distributing mutual fund products and services in future to gain the upper hand of securing a lead in the market share.
Standardization of Services
The standardization of all financial services at HSC offers great potential for improved operational efficiency and corporate governance. The standardization process extends to incorporate all functional activities, particularly in providing products and reports to clients. We adopt the ISO 20000 that emulates best practices within the ITIL framework in the IT Service Management System and ISO 27001 in the Security Management System. The department coordinated with the IT and Private Client Division to support the introduction of HSC’s revamped web-based trading platform across the mobile and application channels. The department has also partnered with VSD to achieve standardization and automation of all day-to-day business operations and procedures in compliance with ISO 15022. This standardization process speeds up business operations and procedures, limits risk exposures and promotes operational efficiency.
Implementation of Best Practices
The implementation of international best practices remains one of the core objectives of the Securities Services Department. The function continues to regularly upgrade services involved in front and back office operations at HSC in adherence to local laws and regulations such as account management, custodian and cash transfer services. New products have also been introduced. Confidentiality and integrity of services are governed through a structured framework. Standardization of business processes and procedures has advanced throughout the company to contribute improved efficiency, transparency and safety of all business operations as outlined in the BPI project.
Strategy for 2017
Ahead of 2017, the Security Services Function plans to expand into two dimensions, one being the expansion of the derivatives portfolio, the other being the development of market-making activities. The division presents a strong market vision to be pioneers within various market areas (e.g. digitalized services, ETFs, index futures, covered warrants etc.).
SECURITIES SERVICES DEPARTMENT
49OPPORTUNITIES48 HSC ANNUAL REPORT 2016

Project / Initiative Description
Risk Assessment Risks and strengths of new or existing products (e.g., Index Futures, Covered Warrants) are consistently reviewed and assessed .
Risk Evaluation Unbiased, independent evaluations are given to validate the business prospects of key products.
Risk Coordination Risk Management Department works closely with relevant departments and stakeholders (i.e. Private Client Department, Institutional Sales Department, Corporate Finance Division) to ensure that risks are collected, prioritized and mitigated.
Risk Review / Control
Some of the reported Initiatives in the 2015 Annual Report were re-organized during 2016 in order to further enhance the risk management practices at HSC. We continue to monitor the newly introduced policies mentioned above. The team will immediately address any findings or deviations found and record them in the on-going Monthly Risk Register that is regularly circulated to the relevant Business Functions and to the EXCO members.
Risk Reporting Tools
Monthly Risk Register
The Risk Register is one of the leading tools used to manage current and potential risks. The risk register assists risk owners in identifying, monitoring and resolving ongoing and residual risks. Through this, the risk report containing individual risks, current responses, residual risk and required risk responses are communicated to all risk owners (departmental levels), EXCO and the Board on a monthly basis. This bolsters the process of risk management to drive strong corporate governance. We vigorously strive to minimize the impact of certain material risks such as Credit Risk on Margin Lending, Counterparty Risk and Equity Risk to bring maximum shareholders’ return. These risks are managed with regular internal control and compliance audits done to sustain an effective and efficient control environment within HSC.
Quarterly Risk Awareness Reports
Risk Awareness Reports channels more effective communication with regards to key risk issues that pose greater threats to risk owners. This risk assessment is represented through the Risk Dashboard or Risk Heat Map that prioritizes the monitoring of risks that has hit significant levels, especially when the Risk Register contains too many risks. This allows HSC to optimize the use of capital and human resources to effectively combat risks. Risk Awareness Reports are delivered quarterly in the form of ERM newsletters.
Weekly Audit Reports
Internal Control and Compliance Audit Reports are generated for both Margin Lending and Principal Investment that carry risks that materially impact HSC’s business. Audit reports are forwarded to the EXCO on a weekly basis and to the Board Risk Management Committee (BRMC) on “as need” basis in which the auditing process is accentuated by the objectivity and independence of a third-party evaluation.
Policy Focus
With stringent supervision and inspection carried out by the Risk Management Department, HSC continues to be relentless in practice of the following policies in the daily operations and procedures at HSC. These policies are paramount to creating a solid and robust risk management framework.
Conducted Risk Awareness Training to selected and relevant staff
Risk Awareness Training reinforces the risk culture at HSC as it sets the benchmark of the risk appetite (i.e. degree of risk that the management is prepared and willing to accept) and the risk tolerance (i.e. variance of risk that is acceptable) in line with the pursuit of business objectives.
Conducted Risk Management on Client’s Transaction training at HCMC and Hanoi offices
The training ensures that employees are well-versed about the risk parameters and risk environment that revolve around HSC’s products in order to protect the interests of the clients .
RISK MANAGEMENT DEPARTMENT
2016 Risk Management Initiatives
Risk Policies & Procedures
The risk management initiatives that were pioneered in 2016 are as follows:
Project / Initiative Description
Conducted Risk Survey The Risk Survey involves a systematic, quantified risk assessment that considers HSC’s exposure to both existing and potential risks. The risk analysis provides measures for HSC to mitigate the risks surrounding HSC’s various business functionalities more effectively through the enhancement of the Risk Management Framework. This minimizes the risk impact towards HSC’s business operations.
Completed and Updated Risk Profile
The Risk Profile is crucial to assess and review associated portfolio risks to enhance HSC’s internal controls. Legacy and Ongoing Risks are periodically monitored and updated to ensure that all relevant risks are accounted for.
Identified Top Ten Risks Ten key risk categories were identified in order to better manage the residual risk held by old portfolios better. This involves documenting the aspects of strategic, financial and operational risks.
Updated / Developed New Risk Policies
• Updated the previous Limits of Authority into a comprehensive Delegation of Authority Policy which covered both financial and non-financial limit of authority
• Updated the Executive Committee’s (EXCO) new Terms of Reference (following the consolidation of the Investment Committee and the Risk Management Executive Committee into EXCO)
• Margin Lending Risk Management and Escalation Policy to control risk exposures in margin lending operations
• Incentive Scheme and Payment Process Policy to encourage and reward commercial mindset of employees
• Purchasing Policy to improve the procurement process and offer guarantees • Budget Process Policy to limit financial risks in order to sustain HSC’s capital, liquidity and
funding • Bad Debt and Provisioning Policy to combat the new risks undertaken with the growth in
HSC’s margin lending business, i.e. reduce risk of incurring bad debts
Introduced three new Risk Reporting tools
• HSC ERM Quarterly Newsletter • Ongoing Quarterly Risk Dashboard / Heat Map• On-going Monthly Risk Register
Project / Initiative Description
Conducted Anti-Money Laundering (AML) Training at HCMC and Hanoi offices
AML training sessions strengthen the risk culture across HSC by instilling knowledge of current AML policies among its employees and promoting the practice of such risk policies, thereby, bringing improved corporate governance.
Conducted face-to-face training sessions to introduce the new risk management policies at every branch and transaction office
Face-to-face training sessions support the implementation of the newly introduced risk policies with employees being the predominant factor influencing the risk culture at HSC. Improved risk culture propels internal controls to higher standards, especially in the day-to-day operations.
Risk Training
51OPPORTUNITIES50 HSC ANNUAL REPORT 2016

HSC’s Board of Directors and the Board Audit Committee understand the significance of Internal Audit’s role in ensuring consistent adherence to policies and practices. Subsequently the management would take appropriate actions to strengthen the control environment. IA function supports the Board by carrying out independent review of HSC’s systems and ensure that internal controls for daily business operations are adequately maintained in order to mitigate any identified risks. In line with the establishment of the IA department in 2014, KPMG was appointed as HSC’s internal audit partner. KPMG assisted HSC with the provision of internal audit services along with the establishment of IA function. The provision of co-sourced IA services from KPMG lasted for a 3 year period up to 31 Dec 2016.
HSC’s Head of the Internal Audit Department reports directly to the Board Audit Committee, and to the CEO on administrative aspect, thereby enabling the function to have sufficient standing and allowing internal auditors to execute their duties with objectivity and independence. The Board of Directors fully commits to strengthen the Internal Audit Department and has therefore selectively recruited specialist internal auditors who have rich experiences in the financial services sector. This can be evidenced by the recent appointment of Mr. Dang Thanh Bach to the position of Director, Head of Internal Audit. Mr. Dang joined HSC having 18 years of experience as he held several senior local and regional roles in external audit, risk management, compliance, internal control and internal audit across Asia, including his most recent
role as Head of Internal Audit for a major international financial services company based in Vietnam.
In just its fourth year of operations, the Internal Audit Department has taken significant steps in 2016 to help strengthen HSC’s internal control, risk management and governance systems and processes. The 2016 Internal Audit Plan included the review of several materials and high risk processes of projects that were carried forward and new projects such as Accounting and Financial Reporting, Treasury and Investment review, Institutional Brokerage and Private Client Brokerage reviews, Human Resource Management review and other projects. Some of these initiatives were undertaken with our outsourced Internal Audit Partner, KPMG, and have significantly contributed to the sustainability of HSC.
HSC has garnered the success in conducting reviews of some material processes without reliance on external support. With the end of the 3-year contract with KPMG as HSC’s outsourced auditor in 2016, the new Head of Internal Audit and other members are ready to conduct audit reviews that are 100% in-house (except for IT audit review) starting from 2017. This evidently demonstrates the developing maturity of our Internal Audit Department. This development could not have been accomplished without the support of senior management and the cooperation of divisional stakeholders.
Item # Internal Audit Review Audit team
Closed projects1 Anti-money laundering review report in 2016 HSC
2 Institutional brokerage (1st time review) HSC & KPMG
3 IT Internal Audit Follow-up (1st time review) KPMG
4 Treasury management / Proprietary Investment (1st time review) HSC & KPMG
5 Accounting and Financial reporting (1st time review) HSC & KPMG
6 Private brokerage Internal Audit Follow-up (1st time review) HSC
In-progress projects carried forwarded to 20177 Margin lending Internal Audit Follow-up (1st time review) HSC
8 HR Management (1st time review) HSC
9 Private Brokerage Review (2nd review) HSC
10 Institutional brokerage Internal Audit Follow-up (1st time review) HSC
2016 Internal Audit Projects
INTERNAL AUDIT DEPARTMENTAML Policy
HSC’s AML Policy closely follows AML guidelines set by the State Bank of Vietnam. This policy streamlines the reporting requirements for KYC procedures within HSC in which retail and institutional clients of HSC are required to disclose certain financial information for KYC checks. We rigidly enforce our AML policy with the objective of affirming that our clients are only engaged in legal business transactions. AML policy significantly contributes to a solid and robust risk management framework as we work towards controlling the occurrence of untoward events or circumstances.
Personal Account Dealing Policy
Personal Account Dealing Policy ensures that fairness and integrity for market participants is preserved at all times. In compliance with local laws, we incorporate The Personal Account Dealing and Insider Trading Policies into HSC’s Code of Conduct, carrying a clear statement that HSC’s clients’ interests should take precedence over personal interests. Disclosures of personal trading are mandatory and closely monitored.
Fraud & Anti-Bribery Policy
Fraud & Anti-Bribery Policy covers the policies and procedures taken by HSC to enforce employee compliance, and detect and prevent HSC employees from taking advantage of their fiduciary responsibilities to clients. This policy imposes the practice of proper and accurate accounting disclosures administered through HSC’s internal control system.
Insider Trading Policy
Insider Trading Policy promotes the ethical conduct that forbids HSC employees to divulge any sensitive information to a third party. We are in strict compliance with Article 9 of the Law on Securities “to protect the rights of investors in a free market”. This article prohibits the following:
• Using inside information to purchase or sell securities for that him or herself or for a third party;
• Disclosing or giving inside information to another person;
• Advising another person to purchase or sell securities on the basis of inside information.
Evolving Regulations
Several new regulations were introduced in 2016 whereby HSC fully conformed to these regulatory requirements listed below:
• Circular No. 11/2016/TT-BTC providing guidelines on the Derivatives and the Derivatives Market (issued in 2016);
• Circular No. 23/2017/TT-BTC amending the Circular No. 11/2016/TT-BTC;
• Decree 86/2016/ND-CP establishing requirements for investment and trading in securities;
• Circular 07/2016/TT-BTC amending and supplementing the Circular 210/2012/TT-BTC dated 18/01/2016 on the establishment and operation of securities companies;
• Circular 203/2015/TT-BTC to replace Circular 74/2011/TT-BTC providing guidelines on securities trading, effected from date 01 Jul 2016.
Moreover, HSC is in compliance with the regulations outlined in the Decision 87/2017/QD-UBCK dated 25/01/2017 on Margin Lending. HSC expects the establishment and operation for the two new products, Index Futures and Covered Warrants to come to fruition in the second half of 2017. As such, HSC anticipates for the announcement of the detailed Implementation Guidelines for these products and has made adequate preparations to adopt these regulations.
Strategy for 2017
HSC is both a pioneer and leader in terms of risk management within the financial services industry in Vietnam. Looking ahead in 2017, the Risk Management Department is well-positioned to continue its leadership in risk management practices. Succeeding this, the division will emphasize the adoption of Best Practices for Risk Management to maintain high quality standards of work practices for greater corporate governance.
Meanwhile, shareholders can look forward to the establishment and completion of the Disaster Recovery Plan. The Disaster Recovery Plan is pivotal to safeguard the business continuity of HSC’s business operations though at a limited scale. The Disaster Recovery Plan is currently in the midst of its developmental phase. This strategic initiative will significantly contribute to a more robust risk management framework for HSC in time to come.
While HSC is constantly improving on its risk mitigation measures, it is important for HSC to note that risk management is not the task of one dedicated department or function, but lies in the responsibility of every individual within HSC.
RISK MANAGEMENT DEPARTMENT
53OPPORTUNITIES52 HSC ANNUAL REPORT 2016

STRONG GOVERNANCESUPPORTS OPPORTUNITIES
The reviews undertaken by Internal Audit in 2016, an independent evaluation are made with respect to:
• The effectiveness and efficiency of internal control, risk management and governance systems in the context of both current and potential future risks;
• The reliability, effectiveness and integrity of management information systems and processes (including relevance, accuracy, completeness, availability, confidentiality and comprehensiveness of data);
• Monitoring of compliance with laws and regulations, including any requirements from regulators; and
• The safeguarding of HSC’s assets.
For 2016, the Internal Audit Department noted that whilst controls are in place to mitigate risks, formal policies and procedures have yet to be developed for certain key processes. The documentation of these policies and procedures have been earmarked for improvement in 2017.
HSC’s 2017 Internal Audit Plan
HSC’s 2017 Internal Audit Plan is a risk based approach that was carefully constructed with the aim of focusing on key risk areas that impact HSC’s business. The 2017 Plan is designed to ultimately enhance the company’s control environment and corporate governance as well as to reduce and manage risk effectively, thereby, adding value to our shareholders. HSC’s 2017 Internal Audit Plan encompasses the following:
Item # Internal Audit Review Audit team
Carried forward projects from 2016
1 HR Management (1st time review) HSC
2 Private Brokerage Review (2nd review) HSC
3 Margin lending Internal Audit Follow-up (1st time review) HSC
4 Institutional brokerage Internal Audit Follow-up (1st time review) HSC
New projects in 2017
5 Anti-money laundering review (AML) HSC
6 Accounting and Financial reporting Internal Audit Follow-up HSC
7 Treasury management / Proprietary Investment Internal Audit Follow-up HSC
8 Margin lending Internal Audit (2nd review) HSC
9 IT & Security Management (2nd review) HSC & KPMG
Within the 2017 Internal Audit Plan, cybersecurity and AML are among the pivotal focus areas of the Board and management in combating financial crimes. AML is annually reviewed by the internal audit team in which AML Review Report is generated in accordance with Circular 31/2014/TT-NHNN and Circular 35/2013/TT-NHNN about regulations of AML. HSC Cybersecurity review plan will be outsourced and reviewed by HSC’s internal audit partner, KPMG, in 2017. It forms a part of a larger-scaled project called IT and security management audit review. Weaknesses in internal control system have been identified and internal auditors have recommended solutions to solve those weaknesses. These initiatives are taken in response with some key audit findings which included vulnerabilities in client account management process, cash management process, limitation of authorities, user access rights in IT system and client due diligence process.
INTERNAL AUDIT DEPARTMENT
55OPPORTUNITIES54 HSC ANNUAL REPORT 2016

SECRETARY OF THE BOARD OF DIRECTORS
Date of appointment: 16 March 2006Duration: 10 years and 8 monthsAge: 42 years oldEducation level: Bachelor of Economics Employment history:2006 – present Secretary of the BOD of HSC2005 – 2006 Secretary of the Board of Directors of Saigon
Health Investment Corporation2000 – 2005 Assistant to CEO at Hoang Lan Ltd. CompanyPresent positions:At listed companies: Secretary of the Board of Directors of HSCAt other companies: None
Date of 1st appointment: 30 June 2007Date of 1st reappointment: 08 April 2011Date of 2nd reappointment: 21 April 2016Duration: 9 years 6 monthsAge: 51 years oldEducation level: Bachelor of Banking and FinanceEmployment history:2007 – present CEO of HSC2005 – 2007 Branch Manager of HSBC in Hanoi1998 – 2005 Director of Global Banking at HSBC in HCMC1990 – 1998 Director of International Banking at Corestates –
First Union Bank, Philadelphia, USAPresent positions:At listed companies: CEO of HSCAt other companies: None
Mr. LE THANG CAN
Mr. LE HOANG ANH Ms. THAN THI THU DUNG
• Member• Non-executive member of
the Board of Directors
• Member • Executive member of
the Board of Directors• Secretary of the Board of Directors
Mr. JOHAN NYVENE • Member • Executive member of
the Board of Directors
Date of 1st appointment: 16 April 2015Date of 1st reappointment: 21 April 2016Duration: 1 yearAge: 40 years oldEducation level: Bachelor of EconomicsEmployment history:2/2016 – present Head of Investment of HCMC Finance and
Investment State-owned Corporation (HFIC)
2013 – 02/2016 Deputy Manager of Finance – Accounting of HCMC Finance and Investment State-owned Corporation (HFIC)
2006 – 2013 Finance – Accounting Specialist of HCMC Finance and Investment Stated-owned Corporation (HFIC)
2004 – 2005 CFO of Viet Huy Ltd. Company1999 – 2004 Chief Accountant of Ruby Ltd. CompanyPresent positions:At listed companies Member of the Board of Directors of HSCAt other companies Head of Investment of HCMC Finance and
Investment State-owned
Date of 1st appointment: 21 April 2016
Duration: 8 months
Age: 48 years old
Education level: Doctor of Economics
Employment history:
2008 – present Director of Dragon Capital Markets Limited (DC)2004 – 2007 Associate Director of Dragon Capital Markets
Limited (DC)2000 – 2004 Senior Analyst of Dragon Capital Markets Limited
(DC)1998 – 2000 Economic specialist of Department of Planning
and Investment of HCMC1994 – 1998 Financial Analyst of NLN Trading Company,
Hungary
Present positions:
At listed companies • Member of the Board of Directors of HSC• Member of the Board of Directors of VietFund
Management (VFM)
At other companies Director of Dragon Capital Markets Limited (DC)
BOARD OF DIRECTORS
Date of 1st appointment: 30 June 2007Date of 1st reappointment: 08 April 2011Date of 2nd reappointment: 21 April 2016Duration: 9 years 6 monthsAge: 62 years oldEducation level: Bachelor of Economics – Faculty of Banking
Employment history:
2011 – present Chairman of the Board of Directors of HSC
2010 – present Vice Chairman of Vietnam Association of Securities Business (VASB)
2007 – 2011 Vice Chairman of the Board of Directors of HSC2006 – 2010 Member of the Supervisory Board of VASB2003 – 2006 Director of HSC1998 – 2002 Fund Manager of HCMC Investment Fund for
Urban Development (HIFU)
Present positions:
At listed companies: Chairman of the Board of Directors of HSCAt other companies: None
Date of 1st appointment: 08 April 2011Date of 1st reappointment: 21 Arpil 2016Duration: 5 years 8 monthsAge: 58 years oldEducation level: Master of Business Administration
Employment history:
2010 – present Deputy Director of HCMC Finance and Investment State-owned Corporation (HFIC)
2007 – 2009 Deputy Director of HCMC Investment and Fund for Urban Development (HIFU)
2006 – 2007 Head of Pricing, Department of Finance2005 – 2006 Director of Property Evaluation and Auction Center1994 – 2004 Head of district budget management, Head of
Asset, Head of Budget, State Department of Finance
Present positions:
At listed companies: Vice chairman of the Board of Directors of HSCAt other companies: Deputy Director of HCMC Finance and Investment
State-owned Corporation (HFIC)
Date of 1st appointment: 30 June 2007Date of 1st reappointment: 08 April 2011Date of 2nd reappointment: 21 April 2016Duration: 9 years 6 monthsAge: 47 years oldEducation level: Master of Business AdministrationEmployment history:2010 – present CEO of Dragon Capital Group (DCG)2010 – present Deputy CEO cum CFO CEO of Dragon Capital Group (DCG)2002 – 2010 Director of Dragon Capital Group (DCG)1998 – 2002 CFO of Coca Cola South East Asia Inc.1993 – 1996 Deputy Managing Director of Dai Nam Commercial J.S
Bank1991 – 1993 Project Director of Peregrine Vietnam CompanyPresent positions:At listed companies: • Vice chairman of the Board of Directors of HSC
• Member of the Board of Directors of Vietnam Dairy Products JSC (Vinamilk)
At other companies: CEO of Dragon Capital Group (DCG)
Date of 1st appointment: 02 December 2002Date of 1st reappointment: 30 June 2007Date of 2nd reappointment: 08 April 2011Date of 3rd reappointment: 21 April 2016Duration: 14 years and 1 monthAge: 55 years oldEducation level: Master of Business Administration, Bachelor
of LawEmployment history:1999 – present CEO of Vision & Associates Company1989 – 1999 Deputy Director of Invest Consult Group VietnamPresent positions:At listed companies: • Member of the Board of Directors of HSC
• Member of the Board of Directors of Southern Waterborne Transport Corporation (Sowatco)
At other companies: • CEO of Vision & Associates Company • Chairman of the Board of Managing Partners of Vision
& Associates Legal• Chairman of the Board of Directors of
Cong Huong JSC
Mr. DO HUNG VIET
Mr. NGUYEN THANH LIEM
Mr. LE ANH MINH
Mr. PHAM NGHIEM XUAN BAC
• Chairman• Independent member of
the Board of Directors
• Vice chairman• Non-executive member of
the Board of Directors
• Vice chairman • Non-executive member of
the Board of Directors
• Member • Independent member of
the Board of Directors
5756 HSC ANNUAL REPORT 2016 OPPORTUNITIES

relating to the state of the markets and general economy which was used to help develop business plans for the subsequent quarter. Regular communication by the Board with the CEO and Management Team helped to oversee the implementation of these plans to meet HSC’s strategic objectives.
Results of supervision
Business results in 2016 with the basic financial indicators are as follows:
C. Plans and strategies of the Board of Directors
In the context of potentially turbulent world economy and unresolved internal issues of Vietnam, 2017 is expected to be difficult and challenging.
HSC aims to review its existing strategy and corporate enterprise values in a sustainable manner through strong financial status, improving competitiveness and sustainable, effective growth. The BOD aims to focus on the following activities in 2017:
• Develop strategic business development plans;
• Strengthen and promote core business activities of the Company through diversifying product ranges, improving the quality of service to customers and seizing new opportunities in the stock market as a basis for research, development and diversification of products which maximize customers’ benefits and experience;
• Enhance corporate governance as well as risk management and risk control responsibilities in financial management, accounting and auditing, and enterprise risk management by upgrading the capabilities and competencies of the committees under the BOD;
• Continue to enhance transparency in business operations, and ensuring fulfillment of the Board of Directors’ independent members‘ responsibilities;
• Commit to standardizing our procedures to improve operational efficiency, aligning our current processes with applicable laws, especially relating to information security, risk management, internal controls, internal audit and margin lending;
Target FY2016 FY2015 % Change 2016 Plan % Plan
Revenue 824,245 591,139 39% 734,593 112%
Profit before tax 385,383 271,500 42% 376,357 102%
Profit after tax 304,531 213,310 43% 301,086 101%
Unit: VND million
Conclusion
In accordance with our Company Charter and policies & procedures, the Board of Directors delegated the Management Team to carry out the daily operational activities of the Company and to implement strategic decisions aligned with our business plans. Through quarterly reports on business performance, the Company’s daily operation reports, and ad-hoc management reports, the Board of Directors evaluates that the CEO and the Management Team have executed their duties in compliance with prevailing laws; the Company Charter and the AGM shareholders’ resolutions. Additionally, the Board of Directors has conducted and performed their duties with due care, professionalism and integrity, thus protecting the interests of the Company and its shareholders. CEO and the Management Team had fulfilled to the best of their efforts the business plan adopted by the AGM 2015. They also contributed to building the business environment based on sustainable development, improving corporate governance; enhance the role of risk management and control.
REPORT OF THE BOARD OF DIRECTORS
ASSESSMENT OF THE BOARD OF DIRECTORS ON THE HSC’S PERFORMANCE IN 2016
A. Assessment of the BOD on the corporation’s operations
Vietnam's economy in 2016
2016 is considered a challenging year for Vietnam’s economy given unresolved internal issues and a turbulent international financial and political context. China’s deteriorating economic health with huge debt burden, plunge in oil price and the Bank of Japan’s adoption of negative interest rate policy also led to a sharp drop in interest rates of developed countries; Brexit shock also caused the British pound to slump and 10-year bond yields to fall below 1%, triggering market turbulence. Immediately after the seismic shock, U.S. presidential election results worsened the investor sentiment and added to market volatility.
Against such a backdrop of turbulent world economy with potential risk and less likelihood of an early recovery, Vietnam’s economy managed to show improvements in terms of production, business and macroeconomic stability. Vietnam’s 6% GDP growth rate is viewed as a decent outcome given the world context and more importantly, it stems from improving internal factors.
These improving factors drove the growth in Vietnamese securities market in 2016, which was rated as top 5 markets with the highest growth rate in Southeast Asia. The VN-Index rose by 16%, the market capitalization reached VND 1,923 trillion, equivalent to 46% of GDP or an increase of 40% compared to 2015. Liquidity market strongly improved as the daily average transaction value reached VND 3,047 billion, an increase of 19% compared to VND 2,570 billion / day of 2015.
Business results in 2016
Relatively positive movements of the stock market last year, shareholders’ backing particularly the major and strategic ones, and relentless efforts of HSC team led to improved business results compared to the peers. Specifically, the profit after tax in 2016 reached VND 305 billion, increasing by 43% compared to 2015 and representing 101% of the target set by the General Meeting of Shareholders (AGM) 2015.
HSC’s brokerage market share in 2016 represents 11.2% of the total market, higher than that of 10.4% in 2015 but still falls short of the planned target of 11.8%. However, the firm is striving to grasp every opportunity to increase market share without compromising sustainable development strategy. Private client brokerage market share rose to 7.1% from 6.9% in 2015 while institutional client brokerage market share also increased to 3.9% from 3.4%, exceeding the target.
B. The BOD’s supervision over the Chief Executive Officer and Board of Management
In 2016, the BOD continued to supervise the implementation of resolutions passed by AGM and t as follows:
Methods of supervision
The Board of Directors and the Supervisory Board has a deep understanding of the operations of the Company, enabling them to assist the CEO and the Management Team in fulfilling their respective responsibilities.
Representatives of the Board sub-committees regularly reported at the meetings of the Board of Directors as follows:
• The Board Risk Management Committee reported all significant risks arising in each quarter, and proposed recommended action plans to mitigate these risks; and
• The Board Audit Committee reported on the number of internal audits conducted in the quarter, including audit findings and recommendations for strengthening the internal control environment;
• The Board Remuneration Committee reported on the Employee Stock Ownership Plan (ESOP 2016) and approved the remuneration plan for 2016.
The Board of Directors and the Supervisory Board assessed the feasibility of all action plans and all recommendations, seeking to provide more practical solutions where applicable.
The Board of Directors issued resolutions after each periodic meeting and upon request, to approve the business results for each quarter. The Board also provided strategic guidance, oversight and input
5958 HSC ANNUAL REPORT 2016 OPPORTUNITIES

2. Shareholders’ equal rights
2.1. Appoint a proxy in the Annual General Meeting of Shareholders
HSC creates all favorable conditions for shareholders to attend the Annual General Meeting. Where a shareholder is absent and cannot delegate a proxy to attend the AGM, that shareholder has the right to delegate a member of the Board of Directors or Supervisory Board on their behalf and to make decision on all the resolutions and issues discussed at the AGM.
2.2. Voting at AGM
Each shareholder or proxy attending the AGM was given voting cards and voting forms using HSC templates. The voting card and voting form have barcodes so the vote count can be conducted efficiently and accurately. Shareholders use voting cards to vote for resolutions raised at the AGM. Key content for the AGM was sent to shareholders prior to the meeting. Shareholders must confirm their voting by crossing in one (1) of three (3) boxes provided. These boxes are termed “approved”, “fail” and “no comment” and the shareholders are required to sign the form to confirm and validate the vote.
2.3 Election, discharge, dismissal and addition of members into the BOD and Supervisory Board
Election, discharge, dismissal and addition of members into the Board of Directors and Supervisory Board must be approved at the AGM.
The selection and appointment of new members to the Board are made in accordance with formal procedures stated clearly and transparently in the Company Charter and Corporate Governance Policies. In the event of composition changes to the Board of Directors during the middle of member’s term, the Board will nominate and appoint the temporary member according to the Company Charter and Corporate Governance Policies. The nomination and appointment will be submitted at the next AGM for ratification.
At AGM 2015, HSC dismissed all members of the BOD/Supervisory Board third term (2010-2015) and elected new BOD/Supervisory Board members of fourth term (2016-2020) in the form of a secret ballot and cumulative voting whereby each individual shareholder
or authorized representative thereof has a number of votes equal to the number of shares outstanding held times the number of positions up in the BOD/Supervisory Board for vote or they can dedicate all their votes to one or a number of candidates. The list of candidates with attached resumes were posted on the website of the Company seven (07) working days before the date of AGM 2015 so as to give shareholders adequate time to consider qualified candidates for the BOD/Supervisory Board of the upcoming term.
3. Roles of stakeholders
3.1. Relations with stakeholders
Customers
HSC is committed to creating the most favorable conditions and optimal products and services to our customers. To maintain the brand of financial service trust and grasp the opportunity to obtain permission to develop the derivatives market and other new products, HSC attempted to prepare the trading system, the process of deploying the product and human resource to be among the first securities companies to offer derivative products and services to customers in a short while with the highest quality and credibility being assured. It is hoped that from 2017, Vietnamese capital market for listed instruments will be complete as other markets including the stock market, bond market and the derivatives market and offer customers of HSC in particular and investors in Vietnam more generally additional attractive opportunities to invest their capital. Besides focusing investment in the derivatives market, HSC also constantly developed new products to cater the needs of different customer segments.
Shareholders
Long-term and loyal commitments of all HSC’s shareholders, regardless of whether it is major, strategic or minority shareholder, is the main source of motivation driving HSC’s efforts to bring sustainable investment efficiency to shareholders and maintain the trust “Investing right, investing in HSC” .
HSC ensures equal and non-biased rights without any discrimination whatsoever. All shareholders are entitled to adequate information to make appropriate investment decisions.
• Increase the efficiency of capital utilization through enhancing products and services offerings, as well as investing in research and development activities for new products and services to meet international standards, regulatory requirements and clients’ needs; adopt the development of the process/procedures, trading system and human resource for the derivatives market and new relating products;
• Speed up promotion and enhancement of corporate values by sustainable development through participating in drafting strategic CSR development plan;
• Develop a succession plan for the next generation of management.
CORPORATE GOVERNANCE 2016
Strong corporate governance is an essential element in building a strong foundation and bringing sustainable value to our business. Our approach to corporate governance is derived from a set of values and behaviours that underpin our daily activities, provide transparency and accountability, and maximize value to shareholders and stakeholders. We commit to excellence in corporate governance standards, which we see as fundamental to the sustainability of our business and our performance.
To maximize the corporate values, HSC pursues business development objectives in term of revenue and profits, as well as gradually improves governance capacity in line with international practice, ensures resources and opportunities are optimized to create sustainable values in the long-term.
1. Rights of Shareholders
1.1. Shareholders meeting
On 21/04/2016, HSC held the 2015 Annual General Meeting (2015 AGM). All procedures, laws and regulations at that AGM were followed for the best interest and rights of shareholders.
AGM 2015 invitations were sent to shareholders whose names on the list of Vietnam Securities Depository - HCMC Branch dated 10, 2016. The invitation included information relating to AGM as time, venue, agenda and registration procedures. They were also published
on HSC’s website in both (02) languages (Vietnamese and English) for fifteen (15) days before the date of AGM 2015. In addition, the invitation was also posted on the Securities Investment Review.
To facilitate all shareholders and proxy representatives, the AGM 2015 was held on a working day and the admission desk was opened one (1) hour prior the meeting. HSC used barcodes to confirm shareholders’ ID and supporting documents as well as the voting and election ratios.
Chairman of the Board, Board members, Chairman of the Board Committees and Board of Management chaired the AGM 2015. In addition, representatives of independent auditors also attended the Meeting and representatives of minority shareholders were entitled to nominate themselves to the Vote Tally Committee. The chaired members were available to respond to any questions and encouraged shareholders or proxy representatives to comment in order to jointly build sustainable growth for HSC.
Meeting minutes, voting result report and the AGM 2015 Resolutions were published on the HSC website in two (02) languages (English and Vietnamese) within twenty four (24) hours after the AGM.
1.2 Dividend Payout
In line with current HSC dividend policy, 70% of the profit after tax is used to pay annual dividend to shareholders. Depending on the business result of previous year, the dividend often ranged from 12% to 20%. HSC always pays dividend on time with a higher percent as AGM approved.
At the AGM 2015, shareholders approved an ordinary share dividend as 12% for the year 2016. The execution plan for the dividend payment of 2016 is summarized as follows:
• The company made the 1st cash dividend payment as five percent (5%), which was paid to shareholders on 12/01/2017. This was announced by the Board of Directors in Resolution No. 11/2016/NQ-HĐQT dated 12/12/2016;
• In order to maintain an attractive Return on Investment for shareholders, the Board of Directors proposed a higher rate for 2nd cash dividend payment at AGM 2015 comparing to the approved plan.
REPORT OF THE BOARD OF DIRECTORS
6160 HSC ANNUAL REPORT 2016 OPPORTUNITIES

5.2 Changes in the BOD members
On April 21, 2016 when AGM 2015 was held, out of seven (07) members of the Board elected for IV term (2016-2020), six (06) were reappointed and one (01) new members nominated by strategic shareholder Dragon Capital, i.e. Mr. Le Hoang Anh. Mr. Trinh Hoai Giang, Board member cum Deputy CEO, was no longer a member of the Board as of April 21, 2016.
Changes to the board members of the fourth term (2016 - 2020) were made in line with international practice on BOD structure: minimize the number of part-time executive board members, increase the number of non-executive and independent board members.
Notes:
(*) The percentage of representatives from the HCM Finance and Investment state-owned Company (HFIC), a key state-owned shareholder owning 29.47% of HSC’s charter capital.
(**) The percentage of representatives from the Dragon Capital Markets Limited (DC), a key foreign shareholder accounting for 30.87% HSC’s charter capital.
No. NameBoard of Directors’ Member HCM shares ownership %
Independent Non-executive Executive % Representative %Owned
1 Mr. Do Hung Viet √ 0,01
2 Mr. Le Anh Minh √ 15,43 (**) 0,03
3 Mr. Nguyen Thanh Liem √ 20,63 (*)
4 Mr. Le Thang Can √ 8,84 (*)
5 Mr. Pham Nghiem Xuan Bac √ 0,24
6 Mr. Johan Nyvene √ 15.43 (**) 0.40
7 Mr. Le Hoang Anh √
5.3 Chairman of the Board of Directors and CEO are separate roles
The segreation of duties between Chairman and CEO represents independence and a clear division of responsibilities between the Board of Directors and the Board of Management to ensure the division of powers in decision-making process, increase accountability and improve independence of the Board. Powers and duties of the Board Chairman and CEO are stated in the Company's Charter.
Chairman of the Board is an independent member who served as the Company’s CEO since its establishment. He was appointed in 2007 and is currently on the Board of the fourth term.
professions with a balance between executive, non-executive and independent members. The names of the persons who have been or are Directors in the reporting period are listed below, along with their shareholding and the voting rights of each member including individuals and representative:
Employee
Corporate culture is key to talent development in a company. To foster a culture up to the expectations of the company itself and the majority of employees, we aim to build a corporate culture where professional, qualified and insightful staffs are also men of good moral standards who always give compassion to the community.
HSC aims at building a professional, attractive, friendly, efficient workplace and merit-based assessment mechanism in line with the company’s vision, code of conduct, and corporate culture to maximize the capacity of the employees for the sustainable development of the enterprise.
Besides, the company encourages employees to seize the opportunity for their own professional development and development of the Company. Opportunities are always there for those who seek and try. We encourage individuals to understand the company, learn the products and current needs so that when opportunity knocks, such insightful understanding of the company will open the door. It is capabilities and attitudes that help you seize the opportunities. With that guiding principles, in 2016, HSC launched cross - sale operations to optimize resources and ensure fast and sustainable growth in the future.
Identifying the right corporate values will bring positive value to all stakeholders.
Communities
HSC is dedicated to contributing to all aspects of community development. We endeavour to implement initiatives that have long term positive impacts on all communities in which we live in and work, and also those where we don’t. We believe that whilst giving back to communities enhances our corporate image, our driver in community development is simply one of Humanity. Raising community standards is a core objective which we believe will be an essential component of our future success.
Environment (Market)
We recognize our responsibility to contribute to the development Vietnam's capital markets. We are recognized as a pioneer locally, supporting holistic growth in products, market activities and corporate expansion and therefore fostering goodwill from
domestic and foreign observers. We play an active role in shaping the market and the rules by which we are bound, through our interaction and ongoing dialogue with the Regulator. It is a leadership and supporting role that HSC is obligated to fulfil.
3.2. Communication Channel
The contact point at HSC is the Communication Department. All questions of the stakeholders will be delivered to and processed by related department and Communication Department will then represent HSC in answering questions by phone or email.
4. Information Disclosure
Policy on information disclosure
Information disclosure policies at HSC comply with all regulations and are aligned with our corporate governance policies. The information HSC discloses is in accordance with the following principles:
• The disclosed information should be accurate, complete, clear and must be disclosed within the agreed time frame;
• The disclosed information must comply with current regulations;
• All stakeholders have the right to access disclosed information;
• Information that may have a significant impact on the share price of HCM, or possibly influence investor decisions, affect shareholder rights, or events occur that may adversely affect the legitimate interests of investors, should be disclosed in timely manner and shall be disclosed in HSC’s official website, and to the Ho Chi Minh City Stock Exchanges (HOSE) and the State Securities Commission (SSC).
5. Board of Directors
5.1 Board of Directors members and its structure
In 2016, the Board of Directors has maintained operations in compliance with the Company Charter and corporate governance policies. The Board of Directors consists of seven (7) members. Its structure ensures the balance between members with various skills, knowledge and experience including legal, finance and securities
REPORT OF THE BOARD OF DIRECTORS
6362 HSC ANNUAL REPORT 2016 OPPORTUNITIES

The resolution is only adopted when over one-half (1/2) of the total number of participants agree. The list of members attending Board meetings in 2016 is as follows:
Contents adopted in the Resolution of the Board of Directors
Business results and business plan
• Forecast from business results 2015 (Resolution 01/2016);
• Adjustment of profit after tax in the business plan 2016 (Resolution 03/2016);
• Forecast from business results of first 6 months of 2016 (Resolution 06/2016);
• Review of business results for first 9 months of 2016 (Resolution 09/2016).
Risk management
• Adjustment of the total value used for margin lending (Resolution 01/2016);
• Adjustment of Section 4.2, Article 4 of the Operating Principles of the Risk Management Committee (Resolution 01/2016);
• Approval for increasing credit limit at banks (Resolution 01/2016, Resolution 02/2016, Resolution 03/2016, Resolution 05/2016, Resolution 06/2016, Resolution 07/2016, Resolution 08/2016, Resolution 09/2016).
Corporate governance
• Decide the date to hold AGM 2015 (Resolution 01/2016);
• Approval of the time, venue and agenda for AGM 2015 and the main contents of the report to be submitted to the AGM 2015 (Resolution 02/2016);
• Adjustment of the agenda for AGM 2015 (Resolution 03/2016);
• Approval of the proposal by the Board of Management submitted to the General Meeting of Shareholders regarding HSC’s engagement in the derivative securities market (Resolution 03/2016);
• Approval in principle of the ESOP 2016. Board Executive Board proposal regarding ESOP 2016 plan submitted to the General Meeting of Shareholders for approval (Resolution 03/2016);
• Approval of some basic criteria for ESOP 2016 (Resolution 06/2016);
• Approval of the structure of the Board of Directors (Resolution 06/2016);
• Approval of the structure of the Board Risk Management Committee, Board Audit Committee and Remuneration Committee (Resolution 06/2016);
• Approval of Delegation of Authority Policy (Resolution 09/2016);
• Approval of operating principle of the Board of Management (Resolution 09/2016);
• Agreement on amending and supplementing the Company’s Charter after the Circular replacing Circular No. 121/2012 / TT-BTC is issued (Resolution 03/2016);
• Agreement on raising the foreign investor’s ownership ratio after the Decree regulating “Conditions of Securities Investment and Business Operation” is issued (Resolution 03/2016);
• Approval of the relocation of Hanoi Branch (Resolution 10/2016).
Other issues
• Agreement on the rate of job allowance deductibles for employees in 2015 (Resolution 01/2016);
• Approval of the 1st cash dividend payment in 2016 at 5% (Resolution 11/2016);
• Approval of selecting Ernst & Young Vietnam Ltd. as the audit firm for financial year 2016 (Resolution 04/2016).
5.6 Activities of non-executive, independent members of the Board of Directors
Compliance with regulations on the proportion of independent and non-executive members can ensure objective and independent decision making. The current structure of the HSC board members is balanced between the executive, part-time members and non-executive, independent members, at least 1/3 of who are independent members.
In reference to the current regulations and international best practices on the independence of the Board members, HSC Board found that although the two (02) independent members of the Board, namely Mr. Do Hung Viet and Mr. Pham Nghiem Xuan Bac have been on the Board for over 9 years but have not altered the independence of decision making process and continue to make valuable contributions to the development of the company. Therefore, it is deemed that the two (02) members still comply with current regulations on independent Board members.
5.4 Roles and responsibilities of the Board of Directors
In accordance with the provision of Enterprise Law and the Company Charter, the Board of Directors is the governing body of HSC, which has ultimate decision-making authority, and it is empowered on behalf of the Company to carry out its duties and fulfil its obligations to the shareholders, which are not necessarily under the jurisdiction of the AGM.
In carrying out its duties, the Board of Directors must comply with all laws, the Company Charter and resolutions made at the AGM. In the event decisions made by the Board contradict the law or Company Charter, thereby causing damage to the Company, the members who voted in favour of for these decisions are jointly and individual liable for any damages.
No. Member Position Date of appointment
Date of resignation
Number of Board meetings
attended
Attendance ratio
Reasons for not attending
1 Mr. Do Hung Viet Chairman April 21, 2016 11/11 100% Re-appointed on April 21, 2016
2 Mr. Le Anh Minh Vice Chairman April 21, 2016 11/11 100% Re-appointed on April 21, 2016
3 Mr. Nguyen Thanh Liem Vice Chairman April 21, 2016 11/11 100% Re-appointed on April 21, 2016
4 Mr. Pham Nghiem Xuan Bac
Member April 21, 2016 11/11 100% Re-appointed on April 21, 2016
5 Mr. Le Thang Can Member April 21, 2016 11/11 100% Re-appointed on April 21, 2016
6 Mr. Johan Nyvene Member April 21, 2016 11/11 100% Re-appointed on April 21, 2016
7 Mr. Le Hoang Anh Member April 21, 2016 7/11 64% Appointed on April 21, 2016 and did not attend due to business trip
8 Mr. Trinh Hoai Giang Member April 08, 2011 April 21, 2016 3/11 27% Resigned on April 21, 2016
5.5 Activities of the Board of Directors
The BOD summoned eleven (11) meetings in 2016 including four (04) direct meetings and seven (07) meetings in the form of written consultation. Notice of invitation and the agenda of the direct meetings were emailed to BOD members at least fifteen (15) days and meeting documents to be sent at least five (05) days before the meeting. As for written consultation via email, contents consulted are presented in detail in the proposals and deadline for response is no later than seven (07) days after the date of sending the proposals.
At the meetings, the Board approves business results of previous quarter, makes market commentary and proposes the strategic plan for the next quarter, and approves other issues under their mandate. At the first meeting of the fiscal year annually, the Board assesses the situation of domestic and international market, thereby reviewing the Company’s vision and mission in light of the current context.
REPORT OF THE BOARD OF DIRECTORS
6564 HSC ANNUAL REPORT 2016 OPPORTUNITIES

5.8 Activities of the Committees under the Board of Directors
Board Risk Management Committee
Risk Management Committee is responsible for advising the Board in issuing the strategies, processes, and policies relating to risk management of the Company. Risk Management Committee is also tasked with analyzing and setting early warning signs about the prudential thresholds in the face of potential risks and proposing preventive measures; analyzing and determining the overall risk level of the company, setting risk appetite and risk tolerance in specific business lines as well as the overall business operations of the Company, and overseeing the implementation of policies in the company, reviewing funding, liquidity and capital raising the company. Risk Management Committee shall be responsible for reviewing and deciding on changes to the organizational risk management structure of the company to comply with the requirements for risk management of the authorities. In addition, Risk Management Committee also needs to evaluate the performance of the Chief Risk Officer.
Activities of the Risk Management Committee
• In 2016, the Risk Management Committee reviewed the Delegation of Authority Policy and Terms of Reference for the BoM, which were prepared by the Risk Management Department before submitting to the Board of Directors for approval. The Risk Identification and Escalation Policy for the whole company and the Margin Lending Risk Management & Reporting Escalation Policy have also been issued following the approval of the Board of Management, Risk Management Committee and Board of Directors. On a quarterly basis, the Risk Management Department will send a report on significant risks identified in the quarter along with an action plan and monitoring results to the Risk Management Committee;
• On a monthly basis, the Risk Management Department will send a report on transactions carried out during the month to Risk Management Committee;
• The Risk Management Committee shall summon a meeting to approve the transactions under their mandate;
• Changes to the composition of the Risk Management Committee: Mr. Le Hoang Anh - BOD Member, appointed to the Risk Management Committee from 28/06/2016 in place of Mr. Pham Nghiem Xuan Bac.
Board Audit Committee
The Board Audit Committee was founded in early 2014. It acts in accordance with the Terms of Reference and Charter which have been approved by the Board of Directors.
The Board Audit Committee has completed the joint internal audit contract with KPMG Vietnam Ltd. for the period of three (03) years from 2014 to the end of 2016. From 2017 onwards, HSC will have independent Internal Audit Department, reporting directly to the Board Audit Committee under the Board of Directors.
Activities of internal Audit Department and Follow-up of Internal Audit Findings :
In 2016, the Internal Audit Department has issued the following audit reports:
• Anti-money laundering review report
• Institutional client brokerage
• IT Internal Audit Follow-up
• Treasury management / Proprietary trading
• Accounting and financial reporting
• Private Client brokerage Internal Audit Follow-up
Currently the Internal Audit Department is conducting audits on the following processes:
• Human resource management
• Margin Lending Internal Audit Follow-up
• Institutional client brokerage Internal Audit Follow-up
Audit Projects Progress Report and Follow-up reports on the internal audit findings were reported in the periodic meetings of the Board Audit Committee.
Board Remuneration Committee
The Board Remuneration Committee was officially established under Resolution No. 06/2016 / NQ-HDQT dated June 27, 2016 and is in the process of developing Operating principles and the Charter of the Committee to submit to the Board for approval.
The Board Remuneration Committee is tasked with advising and proposing remuneration and other benefits of the members of BOD, Supervisory Board and Board of Management; reviewing the annual budget plan on staff to be submitted to the Board of Directors for approval and deciding on the ESOP for selected employees of the Company.
Independent and non-executive members are mostly members of the Board Committees. As a matter of fact, besides general duties as the Board members, they also undertake assignments under their Committees.
5.7 The Board Committees
Two Committees namely Board Risk Management Committee and Board Audit Committee are established under the BOD. In 2016, the Board officially established the Board Remuneration Committee.
These committees are tasked with advising and assisting the Board in maintaining and enhancing internal control operations of the Company. All three committees are comprised of independent, non-executive and executive members. They were selected based on qualifications and experience as well as contributions to the committee:
No. Name PositionBoard Risk
Management Committee
Board Internal Audit
Committee
Board Remuneration
Committee
1 Mr. Do Hung Viet Chairman
Independent Board member √
Chairman
√ √
2 Mr. Le Anh Minh Vice Chairman
Non-executive Board member
Chairman
√
Chairman
√
3 Mr. Le Thang Can Member
Non-executive Board member
√
4 Mr. Le Hoang Anh Member
Non-executive Board member
√
5 Mr. Johan Nyvene Member
Executive Board member
√
6 Mr. Vo Van Chau Head of Supervisory Board √
7 Ms. Dang Nguyet Minh Member
Member of Supervisory Board
√
REPORT OF THE BOARD OF DIRECTORS
6766 HSC ANNUAL REPORT 2016 OPPORTUNITIES

No. Name Position Remuneration per month (after tax) (VND)
1 Mr. Vo Van Chau Chairman 10,000,000
2 Mr. Doan Van Hinh Member 6,000,000
3 Ms. Dang Nguyet Minh Member 6,000,000
Based on the remuneration presented above and the prevailing number of members of the Board of Directors and Supervisory Board at certain moments, the payment of remuneration and operating expenses to the members of the Board of Directors and Supervisory Board specifically are detailed as below.
Remuneration of the Supervisory Board members in 2016
Table detailing remuneration and operating expenses of the Board of Directors and Supervisory Board in 2016
No. Content Amount (VND)
1 Operating fund of the Board of Directors and Supervisory Board at the beginning of 2016 697,149,329
2 Operating fund of the Board of Directors and Supervisory Board in 2016 (1.2% of 2015 profit after tax)
2,559,721,203
3 Operating fund spending of Board of Directors and Supervisory Board Include:
1. Remuneration of the Board of Directors & Supervisory Board in 2015
2. Other operating expenses
3,127,116,738
992,666,656 (*)
2,134,450,082
4 Operating fund of the Board of Directors & Supervisory Board carried forward at the end of 2016
129,753,794
(*) Total remuneration of the Board of Directors was VND 633,333,328 and Supervisory Board was VND 293,333,332 (including personal income tax). The spending on remuneration for the Board increased by 13% compared to 2015 due to the appointment of Mr. Le Hoang Anh from April 21, 2016 and incurrence of remuneration from quarter 2/2016. In 2015, Mr. Trinh Hoai Giang concurrently acted like a member of the Board and Deputy CEO so he only received salaries, not remuneration for being a Board member.
6.2 Regulation on bonuses to the Board of Directors and Supervisory Board
Besides the regulation of remuneration to the members of the Board of Directors and Supervisory Board as presented above, the independent and non-executive members of the Board of Directors and Supervisory Board do not receive any amount as bonuses from the Company bonus & welfare funds.
6.3 Regulation on other benefits to the Board of Directors and Supervisory Board
Currently, the Company’ business expenses benefits (including those relating to the use of company cars; telephones; social, medical and other insurance; the annual health check, and other items specified in the Company’s policies) and other benefits in internal policies are only applicable to the Chairman of the Board of Directors. Only business travel expenses from other members of the Board of Directors and Supervisory Board are charged to the Company (if incurred)
5.9 Participation of the Board of Director members in corporate governance programs
All members of the Board of Directors and Supervisory Board participated in “Corporate governance” training course as prescribed in Article 34 of the Circular 121/2012 /TT-BTC dated July 26, 2012 of the Ministry of Finance, except for Mr. Pham Nghiem Xuan Bac due to some constraints. The company will arrange reasonable time for Mr. Pham Nghiem Xuan Bac to join such training course on corporate governance in the near future.
Besides, Chairman and representatives of HSC Board of Directors also attended workshops on corporate governance in 2016, notably the workshop on “Enterprise Law 2014: New regulations on Corporate Governance and applicability for Vietnam enterprises” updating businesses of issues related to Corporate Governance regulations in the new Enterprise Law and introducing regional and international practice on corporate governance jointly held by Deloitte Vietnam Limited and International Finance Corporation (IFC) in collaboration with the Hanoi Stock Exchange (HNX) and Ho Chi Minh City Stock Exchanges (HOSE) In June 2016.
5.10 Briefing Orientation of the Company and necessary information provided to newly appointed board members
The Board of Directors required that each newly appointed board members commits to continue improving knowledge and skills in the area of operations of the Company in order to better understand the operation of the company and contribute effectively to the sustainable development of the company, through the document giving overview of the company’s activities, namely annual reports and direct meetings or email communication with all the members or the Secretary of the Board.
5.11 Assessment of operational effectiveness of the Board of Directors’ performance
The Board of Directors has taken many efforts to improve corporate governance and align our standards with current regulations and international practice. For example:
• Carried out activities appropriate to the Company Charter, ensuring that regular meetings we0re held and that all Board members attended the meetings;
• Clearly defined the roles of independent and non-executive members in order to maximize interests of all shareholders;
• Monitored the implementation of the Board of Directors’ decisions and resolutions at the AGM;
• Directed and monitored the implementation of various important projects at HSC, including those relating to risk management, internal audit, improvements in business processes, developing derivatives market and new products;
• Monitor the Board Committees to ensure compliance with the Operating principles and Company Charter.
6. Transactions, remuneration and benefits of the Board of Directors, Board of Management and Supervisory Board
6.1. Remuneration of the Board of Directors and Supervisory Board
The operating fund of HSC’s Board of Directors and Supervisory Board in 2016 amounts to one pint two percent (1.2%) of profit after tax, as approved at the AGM 2015.
Quarterly remuneration payments to members of the Board of Directors and Supervisory Board comply with Resolution 12/2011/NQ-HDQT, dated 21/12/2011, which covers the approval of remuneration for the Board of Directors and Supervisory Board.
Remuneration of the Board of Directors’ members in 2016
No. Name Position Specialization Executive role
Remuneration per month
(after tax) (VND)
Note
1 Mr. Do Hung Viet Chairman √ Salary employing
2 Mr. Le Anh Minh Vice Chairman 10,000,000
3 Mr. Nguyen Thanh Liem Vice Chairman 10,000,000
4 Mr. Pham Nghiem Xuan Bac Member 10,000,000
5 Mr. Le Thang Can Member 10,000,000
6 Mr. Johan Nyvene Member √ Salaried employee
7 Mr. Le Hoang Anh Member 10,000,000 Appointed 21/04/2016
8 Mr. Trinh Hoai Giang Member √ Salaried employee Resigned 21/04/2016
REPORT OF THE BOARD OF DIRECTORS
69OPPORTUNITIES68 HSC ANNUAL REPORT 2016

Date of 1st appointment: 02 December 2002Date of 1st reappointment: 30 June 2007Date of 2nd reappointment: 08 April 2011Date of 3rd reappointment: 21 April 2016Duration: 14 years 1 monthAge: 63 years oldEducation Level: Bachelor of EconomicsEmployment history:10/2014 – present Member of the Board of Directors,
CEO of Kienlong Bank2013 – 10/2014 Consultant to the Board of Management of
Kienlong Bank2009 – 2013 Consultant to the Board of Management of
TrustBank2002 – 2009 General Director of Phuong Dong Commercial Bank1993 – 2002 Branch Director of Asia Commercial Bank in Danang
and DaklakPresent positions:At listed companies: Chairman of the Supervisory Board of HSCAt other companies: Member of the Board of Directors,
CEO of Kienlong Bank
Date of appointment: 26 April 2013Date of 1st reappointment: 21 April 2016Duration: 3 year 8 monthsAge: 29 years oldEducation level: Bachelor of Economics and Business
AdministrationEmployment history:2014 – present Associate Director of Dragon Capital Markets
Limited (DC)2012 – 2014 Senior Financial Analyst of Dragon Capital Markets
Limited (DC)2009 – 2012 Financial Analyst of Dragon Capital Markets Limited
(DC)Present positions:At listed companies: Member of the Supervisory Board of HSCAt other companies: Associate Director of Dragon Capital Markets
Limited (DC)
Mr. VO VAN CHAU
Ms. DANG NGUYET MINH
• Chairman of the Supervisory Board
• Member of the Supervisory Board
Date of 1st appointment: 30 June 2007Date of 1st reappointment: 08 April 2011Date of 2nd reappointment: 21 April 2016Duration: 9 years 6 monthsAge: 63 years oldEducation level: Bachelor of EconomicsEmployment history:2007 – 08/2014 Chief Financial Officer of Saigon Co-op J.S
Investment and Development Company1997 – 2007 Chief Accountant of Saigon Co-opPresent positions:At listed companies: Member of the Supervisory Board of HSCAt other companies: None
Mr. DOAN VAN HINH • Member of the Supervisory Board
SUPERVISORY BOARD
6.4 Share trading transactions of internal shareholders
In 2016, HSC recorded the following transactions of HCM shares with respect to internal shareholders:
Note: HSC and DC signed a contract on providing consultancy services about business processes, in which DC supports HSC on market research, corporate finance, institutional brokerage, merger and acquisition. The contract term is three (03) years from 2014 to 2016 and consultancy fees for 2016 were VND 9,618,991,691 (VAT included).
No. Name Relationship with internal shareholders
Number of shares owned initially
Number of shares owned at the end period
Reasons for increase, decrease (purchase, sell, convert, reward)
Number of shares
Percentage (%)
Number of shares
Percentage (%)
1 Resonance JSC
Company related to Pham Nghiem Xuan Bac – Member of the Board of Directors
481,672 0.38 481,672 0.38 Registered to buy 200,000 shares from 25/03/2016 to 22/04/2016, but not yet purchase due to inappropriate shares’ price.
2 Mr. Pham Nghiem Xuan Bac
Member of the Board of Directors
360,000 0.28 300,000 0.24 Registered to sell 100,000 shares from 06/09/2016 to 05/10/2016, but sold 60,000 shares due to inappropriate shares’ price.
6.5 Transactions with related parties
No. Related parties
Relationship Headquarter Date of transaction
The Board of Directors resolution No.
Quantity, percentage of shares after transactions
Quantity Percentage
1 Dragon Capital Markets Limited (DC)
Strategic shareholder
Room1501, 15th Floor, Me Linh Point, No 02 Ngo Duc Ke Street, District 1, HCMC
12/2016 No. 08/2014/NQ-HDQT dated 03/10/2014
39,278,810 30.87
REPORT OF THE BOARD OF DIRECTORS
71OPPORTUNITIES70 HSC ANNUAL REPORT 2016

These are areas that HSC need to continue improving next year to ensure its stable growth, as well as generate ROE that meets market’s demand and reflect the company’s capability.
No. Key ratios FY2016 FY2015
1 Liquid Capital Safety Ratio 710% 1,053%
2 Liquidity and Solvency Ratios
a Current Ratio (times) 2.84 2.63
b Total Debt to Total Assets Ratio (times) 0.34 0.37
3 Capital Structure Ratios
a Owner’s Equity to Total Assets Ratio (times) 0.66 0.63
4 Profitability Ratios
a ROAE (Net Profit after Tax to Average Owners’ Equity) 13.04% 9.20%
b ROAA (Net Profit after Tax to Average Total Assets) 9.06% 5.72%
3. Supervising internal audit activities in 2016
In cooperation with the Board Audit Committee, in 2016, the Supervisory Board continued to supervise activities of the Internal Audit Department and evaluate HSC’s operating processes.
In 2016, the Internal Audit Department performed 2 new audits on accounting-financial reporting and HR management processes. In addition, it also completed the Internal Audit Follow-up on Institutional Client Brokerage and Proprietary Investment/Capital Management processes. The audit scope included compliance with regulations, procedures and opportunities for improvement where necessary.
The audit results showed certain gaps compared to international standards and practices, particularly concerning the completion of the policy and procedures, delegation of authority, and IT systems. However, most of the measures being implemented are adequate, and reasonable to control risk and achieve their objectives. The EXCO is fully aware of risk factors and have plans in place to further improve upon the recommendations of the Internal Audit Department.
Some issues should be noted as follows:
• For accounting process: At the time of audit, although no losses have been incurred, it is recommended that HSC add new approval limits to further improve mechanisms of LoA - Limit of Authority and DoA - Delegation of authority to be more comprehensive. With the efforts of the Accounting Department, Risk Management Department and related departments, so far these LoA & DoA processes have been completed. IT systems should be further upgraded with clearly defined accesses to enhance the security of our customers and the company. The Supervisory Board recommends that these policies be communicated and updated on a regular basis to minimize risks in the future;
• For institutional brokerage processes: It is recommended to supervise more closely the opening accounts, fees approval, and customer evaluation processes. At the same time, transaction limits must be articulated in the Department’s policy and approved by the CEO;
Basic financial ratios
The Supervisory Board consists of three members, including two independent members, who act together as shareholders’ representatives to continue examining, supervising, and advising on risk management and corporate governance issues at HSC. In 2016, the main areas overseen by the Supervisory Board were as follows:
• The implementation of resolutions passed at the FY2016 Annual General Meeting (“AGM”); and the activities of the Board of Directors (BOD);
• Business activities and 2016 financial results; and
• Internal audit activities in 2016.
1. Supervising the activities of the BOD, and the implementation of resolutions passed at the FY2015 AGM
The Supervisory Board participated in all BOD meetings, providing insights into HSC’s performances, advising the BOD and the Executive Committee (EXCO) on the implementation of resolutions approved at the FY2015 AGM.
Key issues discussed in the BOD’s meetings included:
• Update on business results and projections;
• Research the operations of derivatives market and construct an implementation planning;
• Issues in raising the limit of foreign ownership to over 51%;
• The BOD’s structure and EXCO’s terms of reference;
• Company’s risk portfolios;
• Policies on Authority.
Inputs from the Supervisory Board in its role as representatives of investors, were all respected by, and considered in the decisions of the BOD.
2. Business activities and 2016 financial results
In 2016, the Supervisory Board organized regular meetings (twice a year) with HSC’s external auditor, Ernst & Young Vietnam Limited, to discuss the audit scope, audit findings and other relevant matters detailed in the Management Letter. Accordingly, HSC’s business operations are conducted in a transparent manner, with no violations relating to the accounting, finance, and operational processes of HSC. This year, Ernst & Young
Vietnam Limited only provided audit services to HSC and they did not provide any other advisory services. The total expenditure related to the 2016 audit was VND 1,049,400,000 which included VAT.
Additionally, the Supervisory Board analyzed all quarterly financial statements, reviewed half year and full year audited reports, as well as any financial information presented by EXCO at BOD meetings. In terms of financial safety, HSC’s ratios all met high standards, and capital adequacy ratio (CAR) was one of the industry’s highest at 710%.
In terms of financial results, HSC has fulfilled the plan approved by the AGM2015. Among HSC’s operations:
• Margin lending revenue increased by VND 121 billion, contributing the most to Company’s growth. This was an increase of 54% compared to last year;
• Brokerage fees revenue increased by VND 87 billion, or a 33% growth compared to 2015, driven by HSC’s market share increasing from 10.4% to 11.2%, and a 19% increase in liquidity in 2016;
• Proprietary investment revenue increased by VND 34.5 billion with a return of 46%/year;
• Investment Banking revenue, while being below target, recorded a 89% increase;
• Expenses are carefully controlled.
Recommendation of the Supervisory Board on business performance:
• Recognizing the efforts of EXCO as well as HSC’s entire staff, the Supervisory Board recommends that HSC needs to adopt competitive remuneration policies to hire, motivate and retain top-quality staff, enhancing its competitiveness given there are significant developments in the market;
• HSC needs to increase its Investment Banking capacity by investing more in human resources to timely and effectively capture opportunities;
• Besides, some business activities could have performed better. Especially, with the vision of leveraging for margin lending activities, HSC needs to continuously assess lending ratio calculation methodology, closely watch stocks performances to identify potential risks, and add pre- and post-transaction checking processes.
REPORT OF THE SUPERVISORY BOARD
7372 HSC ANNUAL REPORT 2016 OPPORTUNITIES

GEN
ERAL
SHAR
EHO
LDER
S
SUPE
RVIS
ORY
BOAR
D
RISK
MAN
AGEM
ENT
DEPA
RTM
ENT
LAN
G H
A 2
BR
ANCH
LAN
G H
A 1
BRA
NCH
RESE
ARCH
ON
LIN
E TR
ADIN
GDE
RIVA
TIVE
SBR
OKE
RAGE
EQU
ITY
BRO
KERA
GEAC
COU
NT
MAN
AGEM
ENT
CORP
ORA
TERE
LATI
ON
VCCI
BR
ANCH
HO
AN K
IEM
1
BRAN
CH
HO
AN K
IEM
2
BRAN
CH
THAI
VAN
LU
NG
BRAN
CH
LE L
AI 3
B
RAN
CH
NGU
YEN
VAN
TRO
IBR
ANH
FIN
ANCE
&AC
COU
NTI
NG
COM
MU
NIC
ATIO
N
HU
MAN
RE
SOU
RCES
ADM
INIS
TRAT
ION
CASH
EQ
UIT
Y
ETF
FUTU
RES
COVE
RED
WAR
RAN
T
STRU
CTU
RED
PRO
DUCT
S
INTE
RNAL
AU
DIT
DEPA
RTM
ENT
BOAR
D
AUDI
T CO
MM
ITTE
EBO
ARD
RISK
M
ANAG
EMEN
T CO
MM
ITTE
E
EXEC
UTI
VE
COM
MIT
TEE
OPE
RATI
ON
AL
FUN
CTIO
NS
INVE
STM
ENT
DIVI
SIO
NPR
IVAT
E CL
IEN
TDI
VISI
ON
CHO
LO
N
BRAN
CH
TRAN
HU
NG
DAO
BRAN
CH
LE L
AI 2
BR
ANCH
SUPP
ORT
ING
FUN
CTIO
NS
INST
ITU
TIO
NAL
CLI
ENT
DIVI
SIO
N
INST
ITU
TIO
NAL
SALE
S
MAR
GIN
LEN
DIN
GM
ANAG
EMEN
T
RESE
ARCH
&
DEVE
LOPM
ENT
IT
CORP
ORA
TE F
INAN
CEDI
VISI
ON
OPE
RATI
ON
S
MAR
GIN
LEN
DIN
GRI
SK M
ANAG
EMEN
T
CEO
FIXE
D IN
COM
EIN
VEST
MEN
T
DERI
VATI
VES
EQU
ITY
INVE
STM
ENT
RESE
ARCH
INTE
RNAL
CO
NTR
OL
AND
COM
PLIA
NCE
LEGA
L
LE L
AI 1
BR
ANCH
BOAR
D O
FDI
RECT
ORS
ORGANISATION STRUCTURE
5. Plan of the Supervisory Board for 2017
The Supervisory Board continues to accompany and supervise the Internal Audit Department in completing the audits started in 2016 and new audits in the following processes:
No. Audit processes
1 Anti-money laundering processes (annually)
2 Human resources management
3 IT and Security Management
4 Margin lending process (2nd review)
5 Retail Client Brokerage (2nd review)
In addition, the Supervisory Board will continue to monitor the improvement of risk management models, and the completion of HSC’s long-term strategic plan. The Supervisory Board commits to continually developing its own operational processes and to strive to maintain international corporate governance standards and practices. We would like to sincerely thank our shareholders for their trust and ongoing support, and we wish HSC new levels of prosperity.
REPORT OF THE SUPERVISORY BOARD
No. Member Position Remuneration per month(after tax) (VND)
Note
1 Mr. Vo Van Chau Chairman 10,000,000
2 Mr. Doan Van Hinh Member 6,000,000
3 Ms. Dang Minh Nguyet Member 6,000,000
• For proprietary investment process: Currently the organizational structure of the Proprietary Investment Department is not up to international corporate governance standards and practices. However, given limitations of Vietnam’s market in terms of size and human resources, the strategic objectives of the Proprietary Investment Department must be clearly defined before conducting any alteration to the current operating model.
The Supervisory Board believes that all departments should strictly adhere to the timelines committed during the audits to improve the risk management processes of their departments. Therefore, in addition to auditing new processes, the Internal Audit Department should follow up on the progress made, remind the departments when needed, and report the results to the Board Audit Committee, as well as the CEO, in a timely manner. In the course of operation since 2014, the Internal Audit Department has fulfilled its role and effectively collaborated with the Supervisory Board. This ensures that HSC’s operations are under adequate control and in line with the best practice and standards.
4. Remuneration of the Supervisory Board in 2016
Total remuneration of the Supervisory Board in 2016 was VND 322,666,664 (inclusive of personal income tax). Specific remuneration to each member is as follows:
75OPPORTUNITIES74 HSC ANNUAL REPORT 2016

Date of appointment: 17 August 2007Age: 42 years oldEducation Level: Bachelor of FinanceEmployment history:2007 – present Managing Director - Head of Northern Region of HSC2000 – 2007 Unit Manager of Northern branch and Branch Manager of
General Agency franchise of Prudential at Nghe An and Ha Tinh1997 – 2000 Sales Manager - Coca Cola Hanoi
Mr. BACH QUOC VINH • Managing Director• Head of Northern Region
Date of appointment: 12 August 2013Age: 52 years oldEducation Level: Bachelor of Business AdministrationEmployment history:2012 – present Managing Director – Head of Risk Management
Department at HSC2010 – 2011 Chief Financial Officer of JSM Indochina Ltd2008 – 2010 Compliance/Risk Manager, Controller of Indochina
Capital Advisors Ltd / Indochina Capital Corporation2003 – 2008 Chief Financial Officer of DHL-VNPT Express Ltd1997 – 2002 Financial Controller/Compliance Manager of HSBC
Vietnam1995 – 1997 Financial Controller/Administration Manager of Ing. G.
Rodio Spa - a leading Italian construction firm
Date of appointment: 17 January 2016Age: 61 years oldEducation Level: Master of Business AdministrationEmployment history:2016 – present Managing Director of Corporate Finance Division of HSC2010 – 2014 Managing Director of Saigon Securities Inc.2007 – 2009 CEO of Prudential / Eastspring Vietnam Fund
Management1994 – 2007 VP then Managing Director of CIBC Global Asset
Management, Canada, Hong Kong1993 – 1994 Assistant VP – Derivative Trading of Credit Lyonnais
Canada
Mr. ARNOLD V. PANGILINAN
Mr. PHAM NGOC BICH
• Managing Director• Head of Risk Management Department
• Managing Director• Head of Corporate Finance Division
Date of appointment: 15 November 2016Age: 41 years oldEducation Level: Bachelor in Modern American HistoryEmployment history:2016 – present Managing Director – Head of Institutional Sales,
Institutional Client Division2013 – present Present Founding Partner of Silver Mountain / Resolute
Trading – Phnom Penh, Cambodia2009 – 2010 Director, Institutional Sales of Horizon Securities – HCMC,
Vietnam2007 – 2008 Head of Trading and Institutional Brokerage of Mekong
Securities – HCMC, Vietnam2000 – 2002 Associate in Equities Division, Pan/Europe Sales Trader -
Goldman Sachs Group Inc. – London, England1997 – 2000 Financial Analyst in Equities Division, US Sales Trader -
Goldman Sachs Group Inc. – Boston, MA
Mr. HENRY DICKON VEREY • Managing Director• Head of Institutional Sales
Institutional Client Division
MANAGEMENT BOARD
Date of appointment: 15 May 2007Age: 47 years oldEducation Level: Master of Business AdministrationEmployment history:2007 – present Deputy CEO – COO of HSC 2010 – present Vice Chairman of Vietnam Bond Market
Association 2005 – 2007 Corporate Finance Associate Director of
Dragon Capital Markets Limited (DC)2003 – 2005 Studied MBA in the US, Fulbright Scholarship2001 – 2003 Credit Officer of Vietcombank1995 – 2001 Foreign Exchange Dealer of Vietcombank
Treasury
Mr. TRINH HOAI GIANG
Date of appointment: 15 May 2007Age: 51 years oldEducation Level: Bachelor of Banking and Finance Employment history:
2007 – present CEO of HSC12/2014 - 12/2015 Managing Director - Head of Corporate Finance
Division2010 – present Vice Chairman of CEO Club2005 – 2007 Branch Manager of HSBC in Hanoi1998 – 2005 Director of Global Banking at HSBC in HCMC1990 – 1998 Director of International Banking at Corestates
– First Union Bank, Philadelphia, USA
Date of appointment: 12 August 2013Age: 48 years oldEducation Level: Master of Business AdministrationEmployment history:2012 – present Deputy CEO - Managing Director - Head of Private
Client Division of HSC2010 – 2012 Managing Director - Head of Brokerage and Sales,
Private Client Division of HSC2008 – 2010 Head of Small to Medium Enterprise Banking of ANZ
Vietnam2007 – 2008 General Director of Cho Lon Securities J.S. Company2004 – 2007 Head of Commodity and Trade Finance/ Chief
Manager of ANZ Vietnam1998 – 2004 Trade Sales Manager/Assistant Vice President;
Relationship Manager of Citigroup/Citibank N.A HCMC, Vietnam
1996 – 1998 Relationship Manager of Deutsche bank AG HCMC, Vietnam
1992 – 1996 Credit officer of Vietcombank HCMC, Vietnam
Mr. JOHAN NYVENE
Mr. LE CONG THIEN
• Chief Executive Officer
• Deputy CEO • Managing Director - Head of
Private Client Division
• Deputy CEO• Chief Operating Officer
Date of appointment: 01 March 2008Age: 52 years oldEducation Level: Bachelor of Commerce Employment history:2008 – present Managing Director of Research Department -
Co-head of Institutional Client Division of HSC2007 – 2008 Head of Research and Brokerage Division of
VinaSecurities2006 – 2007 Head of Research Department of VinaCapital2003 – 2004 Co-founder of JCN network - a leader in
Japanese corporate news1997 – 2003 Head of Research for Japanese Equities at
WestLB AG
Mr. FIACHRA MAC CANA • Managing Director• Co-head of Institutional Client Division
7776 HSC ANNUAL REPORT 2016 OPPORTUNITIES

No. Object Number of stocks
Percentage of ownership (%)
Quantity Shareholder structure (*)
Organization Individual
1 Major Shareholders (above 5% ownership, not classified as Securities Companies)
- - - - -
Domestic - - - - -
Foreign - - - - -
2 Securities Companies (above 5% ownership)
76,778,810 60.33% 2 2 -
Domestic 37,500,000 29.47% 1 1 -
Foreign 39,278,810 30.87% 1 1 -
3 Securities Companies (less than 5% ownership)
23,907,346 18.79% 38 38 -
Domestic 3,625,775 2.85% 20 2,000.00% -
Foreign 20,281,571 15.94% 18 1,800.00% -
Total 100,686,156 79.12% 40 40 -
SHAREHOLDER STRUCTURE WITH MAJOR SHAREHOLDERS AND SECURITIES COMPANIES
OWNERSHIP STRUCTURE
Category Restricted transferable
shares
Transferable shares Total Percentage of ownership
(%)
I. Special Shareholders - 77,946,064 77,946,064 61.25%
II. Treasury shares - 101,390 101,390 0.08%
III. Other Shareholders - 49,209,304 49,209,304 38.67%
1. Domestic - 26,132,308 26,132,308 20.54%
Individual - 21,635,633 21,635,633 17.00%
Organization - 4,496,675 4,496,675 3.53%
In which state-owned - 37,500,000 37,500,000 29.47%
2. Foreign - 23,076,996 23,076,996 18.13%
Individual - 353,379 353,379 0.28%
Organization - 22,723,617 22,723,617 17.86%
Total - 127,256,758 127,256,758 100.00%
SHAREHOLDER’S INFORMATION
No.
Nam
ePo
sitio
n N
umbe
r of s
hare
s ow
ned
as o
f 01
/01/
2016
N
umbe
r of s
hare
s cha
nged
in
shar
ehol
ders
' ter
m
Num
ber o
f sha
res o
wne
d as
of 3
1/12
/201
6
Qua
ntity
P
erce
ntag
e Q
uant
ity
Per
cent
age
Qua
ntity
Perc
enta
ge o
f ow
ners
hip
Perc
enta
ge o
f re
pres
enta
tive
ABO
ARD
OF
DIRE
CTO
RS1
Mr.
Do H
ung
Viet
Chai
rman
17,9
680.
01%
- -
17,9
680.
01%
2M
r. N
guye
n Th
anh
Liem
Depu
ty C
hairm
an 2
6,25
0,00
0 20
.63%
- -
26,
250,
000
0.00
%20
.63%
Qua
ntity
of o
wne
rshi
p -
- -
- -
- Q
uant
ity o
f rep
rese
ntat
ive
HCM
C Fi
nanc
e an
d In
vest
men
t Sta
te-o
wne
d Co
mpa
ny (H
FIC)
(Sta
te-o
wne
d sh
areh
olde
r)
26,2
50,0
0020
.63%
- -
26,
250,
000
20.6
3%
3M
r. Le
Anh
Min
hDe
puty
Cha
irman
19,6
83,3
7315
.47%
- -
19,
683,
373
0.03
%15
.43%
Qua
ntity
of o
wne
rshi
p43
,968
0.03
% -
- 43
,968
0.03
%Q
uant
ity o
f rep
rese
ntat
ive
Drag
on C
apita
l Mar
kets
Lim
ited
(DC)
19
,639
,405
15.4
3% -
- 19
,639
,405
15.4
3%
4M
r. Le
Tha
ng C
anM
embe
r 1
1,25
0,00
0 8.
84%
- -
11,
250,
000
- 8.
84%
Qua
ntity
of o
wne
rshi
p -
- -
- -
- Q
uant
ity o
f rep
rese
ntat
ive
HCM
C Fi
nanc
e an
d In
vest
men
t Sta
te-o
wne
d Co
mpa
ny(H
FIC)
(Sta
te-o
wne
d sh
areh
olde
r)
11,2
50,0
008.
84%
- -
11,
250,
000
8.84
%
5M
r. Ph
am N
ghie
m X
uan
Bac
Mem
ber
360,
000
0.28
% 6
0,00
0 -
300,
000
0.24
%6
Mr.
Joha
n N
yven
eM
embe
r20
,151
,071
15.8
3% -
- 2
0,15
1,07
1 0.
40%
15.4
3%Q
uant
ity o
f ow
ners
hip
511,
666
0.40
% -
- 51
1,66
60.
40%
Qua
ntity
of r
epre
sent
ativ
eDr
agon
Cap
ital M
arke
ts L
imite
d (D
C)
19,6
39,4
0515
.43%
- -
19,6
39,4
0515
.43%
7M
r. Le
Hoa
ng A
nhM
embe
r -
- -
- -
- -
Tota
l77
,712
,412
61.0
7% 6
0,00
0 -
77,6
52,4
120.
69%
60.3
3%B
MAN
AGEM
ENT
TEAM
1
Mr.
Joha
n N
yven
eCE
O S
ame
as A
6 2
Mr.
Trin
h H
oai G
iang
De
puty
CEO
123,
665
0.10
% -
- 12
3,66
50.
10%
3M
r. Le
Con
g Th
ien
Depu
ty C
EO64
,125
0.05
% -
- 64
,125
0.05
%To
tal
187,
790
0.15
% -
- 18
7,79
00.
15%
- C
SUPE
RVIS
ORY
BO
ARD
1M
r. Vo
Van
Cha
uH
ead
of S
uper
viso
ry B
oard
17,3
220.
01%
- -
17,
322
0.01
%2
Mr.
Doan
Van
Hin
hM
embe
r of S
uper
viso
ry B
oard
4,68
70.
004%
- -
4,6
87
0.00
4%3
Ms.
Dan
g N
guye
t Min
hM
embe
r of S
uper
viso
ry B
oard
- -
- -
- -
TOTA
L22
,009
0.02
% -
- 22
,009
0.02
%D
CHIE
F FI
NAN
CIAL
OFF
ICER
- SP
OKE
SPER
SON
1M
r. La
m H
uu H
oCh
ief F
inan
cial
Offi
cer
83,8
530.
07%
- -
83,8
530.
07%
2M
r. H
oang
Con
g Tu
anSp
okes
pers
on -
- -
- -
- To
tal
78,0
06,0
6461
.30%
60,
000
- 77
,946
,064
0.92
%60
.33%
DETA
ILS
OF
INSI
DE S
HAR
EHO
LDER
S AN
D SP
OKE
PERS
ON
Not
es: (
*) M
r. Jo
han
Nyv
ene
- Mem
ber o
f Boa
rd o
f Dire
ctor
s and
CEO
has
dua
l citi
zens
hip:
(1) U
S na
tiona
lity
nam
ed J
ohan
Nyv
ene,
(2) V
ietn
ames
e na
tiona
lity
nam
ed N
guye
n Q
uoc
Hua
n. A
ll sh
ares
of H
CM w
hich
Mr.
Joha
n N
yven
e is
hol
ding
bel
ongs
to a
secu
ritie
s acc
ount
nam
ed N
guye
n Q
uoc
Hua
n
79OPPORTUNITIES78 HSC ANNUAL REPORT 2016
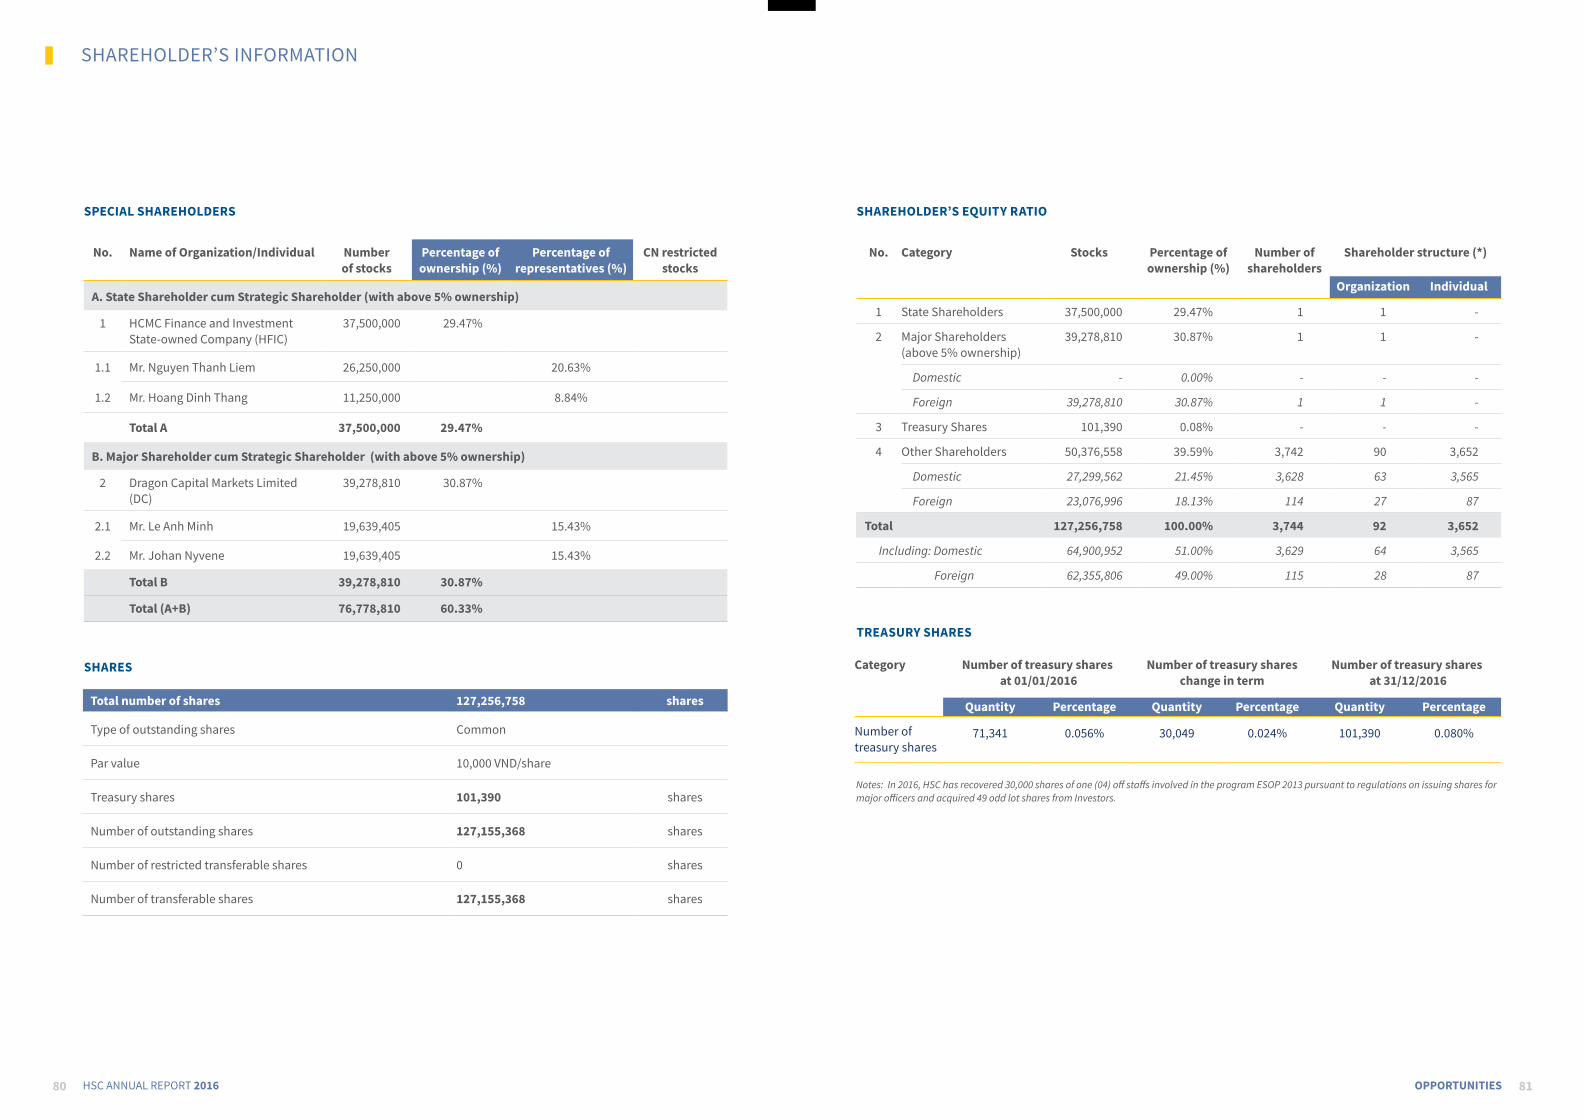
No. Category Stocks Percentage of ownership (%)
Number of shareholders
Shareholder structure (*)
Organization Individual
1 State Shareholders 37,500,000 29.47% 1 1 -
2 Major Shareholders (above 5% ownership)
39,278,810 30.87% 1 1 -
Domestic - 0.00% - - -
Foreign 39,278,810 30.87% 1 1 -
3 Treasury Shares 101,390 0.08% - - -
4 Other Shareholders 50,376,558 39.59% 3,742 90 3,652
Domestic 27,299,562 21.45% 3,628 63 3,565
Foreign 23,076,996 18.13% 114 27 87
Total 127,256,758 100.00% 3,744 92 3,652
Including: Domestic 64,900,952 51.00% 3,629 64 3,565
Foreign 62,355,806 49.00% 115 28 87
Category Number of treasury shares at 01/01/2016
Number of treasury shares change in term
Number of treasury shares at 31/12/2016
Quantity Percentage Quantity Percentage Quantity Percentage
Number of treasury shares
71,341 0.056% 30,049 0.024% 101,390 0.080%
SHAREHOLDER’S EQUITY RATIO
TREASURY SHARES
Notes: In 2016, HSC has recovered 30,000 shares of one (04) off staffs involved in the program ESOP 2013 pursuant to regulations on issuing shares for major officers and acquired 49 odd lot shares from Investors.
No. Name of Organization/Individual Number of stocks
Percentage of ownership (%)
Percentage of representatives (%)
CN restricted stocks
A. State Shareholder cum Strategic Shareholder (with above 5% ownership)
1 HCMC Finance and Investment State-owned Company (HFIC)
37,500,000 29.47%
1.1 Mr. Nguyen Thanh Liem 26,250,000 20.63%
1.2 Mr. Hoang Dinh Thang 11,250,000 8.84%
Total A 37,500,000 29.47%
B. Major Shareholder cum Strategic Shareholder (with above 5% ownership)
2 Dragon Capital Markets Limited (DC)
39,278,810 30.87%
2.1 Mr. Le Anh Minh 19,639,405 15.43%
2.2 Mr. Johan Nyvene 19,639,405 15.43%
Total B 39,278,810 30.87%
Total (A+B) 76,778,810 60.33%
Total number of shares 127,256,758 shares
Type of outstanding shares Common
Par value 10,000 VND/share
Treasury shares 101,390 shares
Number of outstanding shares 127,155,368 shares
Number of restricted transferable shares 0 shares
Number of transferable shares 127,155,368 shares
SHAREHOLDER’S INFORMATION
SPECIAL SHAREHOLDERS
SHARES
81OPPORTUNITIES80 HSC ANNUAL REPORT 2016

SUSTAINABILITY REPORT
A. OUTLINE OF THE SUSTAINABILITY REPORT
1. Introduction
Over recent years, sustainable development has become increasingly important to preserve the longevity and prosperity of businesses. As one of Vietnam’s leading securities firm, HSC places high priority in concentrating its business operations pivoted around the economic, social and environmental aspects, which are crucial for long-term business sustainability. HSC continuously work towards pursuing its sustainable corporate objectives that are aligned with HSC’s vision and mission. HSC’s vision, “To become one of the country’s most admitted, trusted, and valued financial institutions, and be an active contributor to the economy and community of Vietnam.” sets the blueprint for HSC’s sustainability framework. HSC’s sustainability development model is based on delivering positive impacts to three entities: company, market and society.
HSC’s Sustainability Development Model
To ensure that the sustainability credentials are properly communicated to the stakeholders, HSC’s 2016 Sustainability Report strictly adheres to the disclosure requirements listed in the “Sustainability Reporting Handbook for Vietnamese Companies” developed by IFC. The IFC guidelines that are relevant for HSC are Employment, Health and Safety, Capacity Development and Training, Anti-corruption, Labor Management Relations and Community Investment. The adoption of the IFC guidelines – The IFC Sustainability Framework - enhances HSC’s 2016 Sustainability Report with greater transparency, governance and accountability of HSC’s sustainability objectives, performances and impacts. With this, HSC is able to drive innovations and enhancements that contribute to the business sustainability of HSC, thereby, bringing greater business value.
2. Our Sustainability Model
· Delivering stable and steady growth· Offering value-added benefits and compensation to staff · Fostering development of human resources· Overseeing risk and compliance diligently · Improving information transparency
· Optimizing business value for shareholders and professional · Enriching the development of the securities market · Boosting capital capacity and increasing distribution channels· Supporting Vietnam’s economic development
· Fulfilling business and financial commitments to the Government· Contributing to community development · Protecting the environment
POSITIVE IMPACTSCOMPANY
POSITIVE IMPACTSMARKET
POSITIVE IMPACTSSOCIETY
SUSTAINABILITY CREATES OPPORTUNITIES
83OPPORTUNITIES82 HSC ANNUAL REPORT 2016

80%
70%
60%
50%
40%
30%
20%
10%
0
Total Employees by Age Range Employees by Service Length
2012
8%
69%
23%
8%
69%
23%
3%
61%
37%
58%
4%
38%
7%
58%
35%
2013 2014 2015 2016
Under 25 25-age-35 Above 35
26%24%
26%24%
0-2 Years
2-5 Years
5-10 Years
>10 Years
B. REVIEW OF SUSTAINABILITY DEVELOPMENT ACTIVITIES AT HSC
1. Positive Impacts To Company
1.1 Employment
HSC’s steady growth over recent years has strengthened its employment policies in terms of providing competitive salaries, remuneration and other benefits. The Company’s salary payment policy asserts that employees’ salaries are highly dependent on both divisional and individual performances. This policy is in compliance with government regulations. To establish a motivational basis for rewarding employees in a competitive and fair manner, HSC has designed and implemented a management system utilizing a Management by Objective methodology. This involves the identification of objectives and the measurement of results against these objectives to form the basis for important decisions involving salary, remuneration, training and development. The performance of all of HSC’s employees is evaluated on an annual basis. In 2016, HSC incurred over VND 163 billion in employees’ salaries, insurance and remuneration, as detailed below:
Description FY2016 (VND) FY2015 (VND)
Salaries 82,261,510,479 73,357,702,877
Social insurance, health insurance and union fee 11,961,205,002 10,971,071,000
Unemployment insurance expenses 667,208,998 591,940,000
Remuneration 68,928,650,022 54,567,739,809
Total 163,818,574,501 139,488,453,686
This segment focuses on the disclosure of workforce profile and diversity at HSC.
Under the leadership of the Board of Directors, HSC constantly reviews its sustainability matters through proactive communication with its stakeholders. HSC’s active engagement with its stakeholders ensures that effective solutions are implemented in line with HSC’s sustainability strategy and direction. Likewise, sustainability agendas are adopted into the company’s practice through the following governance model:
3. Objectives of sustainability development at HSC
In 2016, HSC invested into various sustainability initiatives to drive growth and development opportunities within the company, securities market and societies in Vietnam. Through this, HSC has made significant contributions in the following aspects:
• Providing job security for employees;
• Contributing to the growth and development of the financial services industry;
• Enriching investors with better investment education and decision-making capabilities;
HSC’s Sustainability Governance Model
• Deploying capital to boost the Vietnam economy;
• Helping the growth of businesses with more efficient use of capital;
• Embracing strong corporate governance and business transparency;
• Developing opportunities for youth development and empowerment;
• Supporting communities towards enhancing quality of life.
In the next segment, we will explore HSC’s positive impacts on company, market and societal aspects in more detail.
SUSTAINABILITY REPORT
· Provide general guidance on the company’s strategic matters regarding sustainability
· Approve objectives and action plans
BOARD OF DIRECTORS
CEO ANDMANAGEMENT
TEAM
DIVISIONAND
FUNCTION
EMPLOYEES
· Set and submit sustainable plans and targets and submit them to the Board of Directors
· Communicate sustainability strategies, targets and plans across the whole company
· Ensure sustainability plans achieve their respective targets
· Implement sustainability plans as per the direction from the CEO and Management Team
· Perform specific daily tasks in line with sustainability plans and targets
85OPPORTUNITIES84 HSC ANNUAL REPORT 2016

Securities certificates Extemal training - Professional and skills development
9
3425 30
4031
1118
1222
3933
69 72
16
2012 2013 2014 2015 2016
Training Types
Internal training
8070605040302010
0
2012
211
1,139
740 759 742
1,200
1,000
800
600
400
200
02013 2014 2015 2016
Number of Training Participants
2012 2013 2014
Number of Training Courses
2015 2016
68
101
41
94
157
No. of Training Participants
No. of Training Courses
200
150
100
50
0
Employees by Education Level
Masters Degree
Bachelors Degree
Others
83%
10%6%
46%54%
Employees by Gender
Female
Male(260) (221)
1.2 Health & Safety
The Health and Safety aspect of the IFC guidelines includes the policies and procedures implemented by HSC in securing the health, safety and wellbeing of its employees.
HSC regularly conducts fire drill trainings to build safety awareness in case of fire emergencies. With HSC’s building located in a skyscraper, it is vital for employees to have knowledge about the various fire exit points and remain calm as they exit the building. Fire drills are present to ensure the safety and security of all employees. Moreover, HSC has developed roadmaps, highlighting safe zones that are useful for back and forth work travels in efforts to curb safety risks of travelling.
In order to alleviate the financial concerns of employees who are unfortunate enough to encounter accidents and/or serious sickness requiring high treatment costs in excess of their ability to pay, HSC partners with reputable insurance companies to provide premium insurance for employees and their relatives.
HSC staffs are entitled to premium benefit packages, including annual health-checks; 24-hour accident coverage and healthcare insurance; travel insurance. The Company’s healthcare programs were substantially enhanced alongside with the Healthcare Insurance Policy prescribed in the Company’s Labor Code. Besides that, HSC provides the opportunities for employees to have annual health-checks at internationally-recognized hospitals.
1.3 Capacity Development & Training
HSC places great importance for staff development opportunities in order to build work competencies and acquire higher skilled capacity in line with laying the foundations for HSC’s future growth.
Over the years, HSC has intensified its investments into the development of employees’ training at all levels, recognizing the value of quality execution in the financial services industry. Focusing on both internal training and securities market certifications, these trainings allow HSC to enhance employees’ skills and credentials for the market and produce more industry experts within the company. At HSC, we have an employee development program in place such that this program encourages employees to pursue their higher education by which reimbursements will be made to employees upon successful completion of professional qualifications (i.e. CPA, ACCA, CFA, Legal, professional licenses as required by the State Securities Commission (SSC)).
Employees’ participation in HSC trainings has been consistently high in recent years. This is because regular trainings in the securities market are proven to be essential for HSC to gain a competitive edge and sustain HSC’s competitive position within the industry.
The age range for HSC employees remained slanted towards the 25 to 35 age group, although the pattern is observed to be gradually diminishing as workers above the age of 35 increases over time. The increase in employees’ age at HSC is primarily attributed to their loyal commitment of staying with the company as seen with the low turnover rate of 10%. To add on, almost half of total employees in HSC have committed more than five years of service to the company. The low turnover rate portrays HSC’s positive working environment and appreciation for its employees.
Consecutively, the company also shows its intent in nurturing the growth of talents through in-house trainings in order to pursue growth in employees’ knowledge and experiences parallel to the company’s growth as a whole.
Majority of HSC employees achieved their highest qualifications at Bachelor’s degree level, while the minority possesses Master’s Degree or other types of education level. High employment of graduates with Bachelor’s degree maintains HSC’s standard of delivering high quality, competent financial services to its clients.
The balanced employment between male and female in HSC reflects the company’s value in supporting gender equality in the workplace. HSC’s recruitment policy is driven by the knowledge skill-set and industry experiences. This is evident whereby at least 93% of HSC’s workforce possesses a Bachelor’s degree or higher. It also mirrors the increasing number of women’s participation in Vietnam’s financial services industry and this is indicative of HSC’s support for women empowerment
SUSTAINABILITY REPORT
87OPPORTUNITIES86 HSC ANNUAL REPORT 2016

1.5 Other policies: Workplace enhancement and employee welfare
HSC also introduced several additional policies to improve the workplace environment and employee welfare to give a greater sense of belonging and appreciation for the company’s staff and they are listed as below:
Policies Results
Emergency Supporting Policy
This policy assists employees who face financial difficulties by providing help for their family members or themselves. This policy is valid under the condition that they are required to perform efficiently at work. There is a considerable number of employees who have applied for this policy.
Working in Distance PolicyThis policy has been effective in supporting employees who has had health problems or difficulties causing them to be physical challenged or having limited mobility for business travels.
Incentive Payment Policy
This policy is in addition to the base salary paid to the sales staff and service fee paid to the relevant external party. Both HSC staff and external party have the opportunity for additional earnings in the form of commission/referral fee as an incentive scheme to retain and attract them to stay and for doing a cross-selling activity for HSC’s business enhancement.
In order to support talent retention within HSC, HSC pioneered the HSC Employee Stock Ownership Plan (ESOP) program, it being one of our many initiatives targeted at attracting and retaining talent. The ESOP program is incorporated based on each individual’s ability and development potential and is designed to inspire dedication and commitment to HSC. This is our fifth ESOP program since its installation in 2007. The ESOP program has been a highly effectively tool in retaining talent, acknowledging and rewarding good work performance and enhancing employee engagement. In early of 2017, HSC issued 2.5 million shares priced at VND 18,000 per share. Through the 2016 ESOP Program, HSC subsidized 31% of its share value (i.e. VND 5,600 per share) to lend support for its employee to obtain ESOP in line with the shareholders’ benefits.
FY 2007 2008 2009 2010 2011 2012 2013 2014 2015 2016
ESOP – Number of total share
1,016,800 836,900 1,610,000 1,200,000 2,500,000
% Headcount 100% 100% 16% 18% 21%
The number of training courses provided by HSC multiplied from 2014 to 2016 in line with the growth of Vietnam’s securities market. With regular training courses, we recognize the need to provide consistent updates to enhance industry knowledge and expertise to achieve global standard practices. The growth in training programs created opportunities for employees to enhance their skillset that is crucial for them to advance through the increasingly competitive brokerage market. Skill enhancement of employees assures that products and services at HSC are equally augmented. In 2016, HSC successfully organized multiple Derivatives Market training courses that resulted in 99.9% of its attendees obtaining professional licenses for Derivatives trading.
1.4 Anti-corruption
Anti-corruption policies support HSC’s internal control system to maintain good governance and integrity of HSC’s business, providing assurance and security for shareholders in the legality of all-related business transactions and operations. The anti-corruption policies ensure that business corruption and malpractice are curbed as much possible. The anti-corruption policies adopted by HSC involve the following:
• Code of Conduct dictates that HSC’s employees are expected to abide by the highest standards of ethical conduct in terms of integrity, skill, care, diligence and good market conduct in their business relationships with each other, customers, competitors and the public. HSC’s Code of Conduct is fundamental to our ability to achieve our corporate sustainability objectives.
• Personal Account Dealing Policy denotes that disclosures of all personal trading transactions are compulsory and that personal interests should not supercede clients’ interests in order to protect the integrity and accountability of HSC.
• Fraud Control Policy has been established to outline the requirements for the development of controls that will assist in detecting, preventing and responding to Fraud. Fraud Control Policy Department BOM (EXCO) promotes consistent organizational behavior by providing guidelines in assigning key responsibilities for the development of controls and conduct of investigations when necessary enforces employee compliance for proper and accurate information disclosures reinforces the internal controls practiced at HSC, delivering better risk management.
• Anti-Bribery and Corruption Policy states HSC’s firm position in combating bribery and corruption. This policy involves providing information and guidance in recognizing and dealing with bribery and corruption. As such, this policy prohibits HSC employees from monopolizing their fiduciary responsibilities against the interest of clients to ensure that financial assets of clients are well-protected.
• Conflict of Interest Policy provides HSC with a framework to identify and manage conflicts of interest arising either from the Company itself. Its outlines detailed and systematic steps to limit the exposure of sensitive information to unauthorized parties in order to ensure that there is no abuse of conflict of interest at any point of time.
• Delegation of Authority Policy (“DoAP”) ensures the maintenance of appropriate expenditure that falls under the control of the management of HSC. The Board of Directors (BOD) Through this policy, Limits of Authority (LoA) has been established to monitor the budgeted and unbudgeted expenditures for the Company.
SUSTAINABILITY REPORT
89OPPORTUNITIES88 HSC ANNUAL REPORT 2016

• Introduction of Derivatives Product: With many investors eagerly waiting for the opening of Vietnam Derivatives Market, HSC took the first step in providing adequate education and knowledge on the upcoming derivatives market and its products. On 26 October, in collaboration with SSC, HSC organized an event to give investors a comprehensive background of the derivatives market, futures contracts and trading mechanisms to investors. This presented the opportunity for investors to receive useful updates on new products which would make investment activities to be more efficient.
At HSC, we believe that the purpose of a business is not concentrated only in reaping profits for shareholders but also involves contributing and participating in building a strong market for the country. In relation to that, we have always been diligent in bringing investment opportunities and expanding capital raising ability of local enterprises. We are and will continue to be a trusted consultant within the financial services industry for many retail and institutional clients.
2.2 Market connection activities
• In March 2016, CLSA, one of the leading securities firms in Asia, hosted an international conference for thousands of investors worldwide in Bangkok, Thailand. HSC connected and brought seven leading Vietnamese companies to the conference. During this conference, the Vietnamese companies were given ample opportunities to build their market presence and share insights of the growing maturity of the Vietnamese market to various large financial institutions and hedge funds. These opportunities enabled the firms to attract foreign investments into the Vietnamese market.
• “Vietnam Conference 2016” was another platform that helped link local companies to foreign investors. This conference was held in September 2016, drawing participation of more than 150 international investment firms while giving investment engagement opportunities to over 12 local companies. The conference gave a broad overview on the Vietnam economy for 2016 and introduced the market potential held by local markets in which bear lucrative benefits to foreign investors. The conference has helped to bridge available funds to investment needs and forge strong connections between international investors and leading Vietnamese companies within many industries (e.g. consumer goods, finance and banking, information technology, real estate etc.)
• With the aim of introducing investment opportunities in Vietnam stock market to foreign investors, in 05th May 2016, HSC and VVinvestor Group co-organized a conference on 5 May 2016, connecting over 50 investors from Thailand with a number of Vietnamese companies. Needless to say, the Thai investors portrayed great enthusiasm and interest for Vietnam stock market and its potential high-growth companies.
2.1 Market development activities
• In January 2016, HSC participated in the Conference - Stock Market in 2016. This conference was hosted by the State Security Commission of Vietnam. At the conference, HSC and representatives from other organizations discussed various market goals for 2016 and then contributed their solutions to develop the stock market in the near future.
• In March 2016, HSC actively participated in a conference hosted by HNX and VSD promulging the development model and strategy for the trading, clearing and settlement system for derivatives. The conference aimed of to help participants understand the model and the roadmap for the implementation of the new derivative system and of serving as a preparation to improve the coordination with HNX and VSD to successfully bring the derivatives into operation.
• On 18 March 2016, in HCMC, HSC hosted the 5th Meeting of Vietnam National Market Practice Group (VN NMPG) - a platform that facilitates information exchange between members of the stock market regarding various business aspects. The meeting is in line with the on-going efforts to standardize processes and services among market members to improve the operation of automatic trades among the parties. As one of the pioneer trading companies joining the new VSD system, Online Interactive Portal from July 2015, HSC shared its expertise on system deployment procedures such as building key processing elements, determining suitable business handling protocols and improving the integration of IT in system deployment. HSC also relayed the potential challenges during the deployment process with solutions that have been successful implemented at HSC.
2. Positive Impacts To Market
As one of the leading securities companies in Vietnam, we are cognizant of the importance of our role in contributing to the market by spearheading innovations and developments of new products. Therefore, HSC is very active in supporting market innovations as the industry’s game changer.
Particularly, as a member of the Market Development Advisory Council of Ho Chi Minh City Stock Exchange, HSC provides insights and expert recommendations on the trends and developments of local and global stock markets. We strongly support HOSE in developing strategic initiatives, effective and efficient policies, and in channeling important investments to develop securities market. HSC also responds to the needs of intermediary institutions, issuers, investors and market participants on technological challenges and new product innovations.
HSC is an active member in associations with State Securities (SSC), the Hanoi Stock Exchange (HNX) and Vietnam Securities Depository (VSD), leading strategic programs to build and develop Vietnam’s derivatives market from its initial stages. HSC has contributed to product design, operational rules and regulations, accounting system and information system.
HSC is part of the “Action Team”, which was formed through the collaboration among HOSE, SSC, VSD and other securities companies. The “Action Team” represents the cornerstone of the launch and incorporation of the Covered Warrant that is expected to be operational by Q3-2017.
In addition to the above, HSC also regularly contributed towards product and system enhancements such as improving ETF products, revising margin lending regulations and initiating administrative governance required by the State Bank of Vietnam (“SBV”) transferring transaction function of government bonds from commercial banks to SBV.
SUSTAINABILITY REPORT
91OPPORTUNITIES90 HSC ANNUAL REPORT 2016

3.3 Community Investment
This aspect covers community investment and corporate social responsibility (CSR) activities, including the support through financial means.
HSC takes great pride in its corporate role to contribute to the development of society, including children. HSC views that education is a long-term investment and that every child in Vietnam should have access to proper education in order to build sustenance in life. Not only that, HSC supports leadership programs that carry the objective of nurturing future business leaders for the future of the country. HSC also participates in various community engagement programs such as visiting students dwelling in poor conditions of remote areas. The CSR initiatives held by HSC for 2016 are listed below:
3.3.1 Investment in the next generation
Donation of electronics to pupils: On 7 January 2016, HSC donated 15 computers and one laptop to teachers and students in An Boi Primary School located in Kien Xuong District, Thai Binh Province. These computers assisted students in the rural area in accessing to information technology, by that, increasing the pace of their learning ability. The contribution allows the students to be better equipped and knowledgeable to contribute to the development of Vietnam in future.
Career Orientation Meeting with Students of Educational Opportunity Vietnam (“SEO”): SEO is a partnership between two non-profit organizations - the local Interns in Vietnam and the US-based SEO which develops leadership potential among young and talented Vietnamese students from universities all around the world. As a partner and sponsors for SEO, HSC has provided internship opportunities and organized talks on career development and the professional finance environment.
HSC is a premium sponsor for AIESEC International Student Organization. AIESEC is a global youth organization that actively contributes to the global development by investing into leadership development experiences for Vietnamese youths. From 2014, HSC officially announced its affiliation with AIESEC Vietnam. As a national partner for AIESEC, HSC extends its internship opportunities to AIESEC Vietnam participants. HSC also directly supports orientations and training activities for the team of leaders as well as the students in Vietnam.
“Training and Practice” is the goal of HSC CSR activities with local universities. On 9 September 2016, HSC signed a MOU with the University of Economy and Finance HCMC (UEF) in order to strengthen internship programs and ensure job security for students. Following this event, 30 students from UEF visited HSC and had the opportunity to engage with our CEO, Mr. Johan Nyvene. Mr. Johan shared HSC’s company background and the prospects and expectations one can gain from the financial sector. He also addressed other concerns and inquiries during the meet up. The UEF students also had the opportunity to learn about the actual operations of a securities broker with their visit to HSC’s trading floor. With this, the UEF students wore great smiles and had expressed their great interest to work in the securities industry, particularly HSC.
Recruiting good human talents has been a top priority at HSC. On 18 September 2016, HSC participated in the FTU Career Day 2016 held at Foreign Trade University, a top university in Vietnam, with the objective of pooling in outstanding candidates into HSC and enhancing the quality of human resource at HSC. During the event, direct interviews were conducted by managers to rope in talents. This event involved over 3,000 students.
3. Positive Impacts To Society
3.1 Financial responsibility to the Government
HSC is committed to the economic, social and environmental development of Vietnam, as evidenced by the significant contribution made through tax payments. This ranked HSC at 108th in the 2015 V1000, listing the 1,000 largest corporate income taxpayers in Vietnam. This list was generated by the Viet Nam Report Company and the Taxation Department.
HSC’s ranking on V1000
3.2 Labour Management Relations
Though it involves the most complicated employment relation matters, labor management relations is paramount to building a conducive and nurturing work environment, free of conflicts and obstacles that will hamper work motivation levels. Employees are at the heart of an organization’s growth and sound management of labor relations helps organizations to effectively achieve its corporate objectives. In the light of this vision, HSC has devoted its resources into nursing good labor-employer relations.
Particularly, HSC has founded various recreational clubs including those involving tennis, soccer, badminton, yoga, books and photograph, all to help improve staff health, wellbeing and fraternity. HSC has organized multiple inter-company competitions to encourage active interactions with various parties from the securities industry. These competitions include HOSE Football, Football Tournament – Le Lai, HOSE Tennis, KPMG Badminton Tournament 2016 and HSC Badminton Tournament. For instance, the Football Tournament – Le Lai itself attracted nearly 300 participants who have greatly shown their spirit of sportsmanship. Through these competitions, HSC brought unity by forming close-knit relations between the management and the employees.
Moreover, HSC has worked closely with the Trade Union to hold meaningful activities for the company employees. Some of the events that were co-organized with the Trade Union are Mid Autumn’s day with participation from 150 kids and employees, Woman’s day with 150 participants, and Children’s day with 150 kids and employees. The close collaboration with the Trade Union has promoted closer understanding and mutual trust between the labor and the management. With respect to this, HSC will continue to perform joint-exercises and initiate programs with the Trade Union to ensure that labor relations are adequately well managed developed.
Besides that, HSC’s labor management relations extend to having large-scale events for its employees, some of which are Year-End Party (400 attendees), Team Briefing (300 attendees) and Cancer Seminar (100 attendees). These initiatives further improved HSC’s labor relations by increasing satisfaction levels among its labor force and subsequently, reinforcing HSC as an employee-oriented corporation.
FY 2010 2011 2013 2014 2015
HSC’s Ranking 221 194 179 145 108
SUSTAINABILITY REPORT
93OPPORTUNITIES92 HSC ANNUAL REPORT 2016

Stakeholders Activities Communication Channels
Employees Quarterly team briefingsDirect meeting to exchange ideas via programs: luncheon with CEO and Happy lunch
Internal communication channels:- Intranet- Telephones and emails- Internal training programs
Shareholders Annual General MeetingFace-to-face meetings Investor relations channel including Q&A via HSC’s Investor Relations page: https://www.hsc.com.vn/en/investor/info-request/ir-contact Regular emails detailing business results
Publications: - Financial statements - Annual report- Quarterly Operation Updates
Clients / Investors
Workshops, seminars and conferences MeetingsCall center with number: (+848) 3823 3298Help Center : https://www.hsc.com.vn/en/help-center
Service supporting departmentsOther communication channels Emails: [email protected] Letterbox for comments and suggestions, located at the transaction offices
Government Offices and Associations
MeetingsConferencesWorkshop
Annual reportMonthly/quarterly reports as prescribedOther communication channels (i.e. website, email, phone)
Media / Press Press conferences and interviews;Forums and workshops organized by the press industry;Quarterly Analyst Briefings to HSC’s financial results and strategic updates
Other communication channels:- Phones and emails- Q&A via HSC’s website, Communication page:
https://www.hsc.com.vn/en/media/contact- Press releases
Professional associations and organizations
Membership in associations & clubs:- Vietnam Private Sector Forum (VPSF)- Vietnam Association of Financial Investor (VAFI)- Vietnam Association of Securities Business (VASB)- Vietnam Bond Market Association (VBMA)- Vietnam Business Council for Sustainable Development
(VBSD)- CEO Club
Bill boards Reports as prescribedOther communication channels (i.e. website, email, phone)
Society Activities supporting the youth through young persons and students organizations and universities; Community development activities, including providing assistance for differently abled people, and activities organized by NGOs and non-profit organizations.
Charity and donation eventsEnvironment and community activities- Coordinators & Action team: Charity Groups- Website: CSR page:
https://www.hsc.com.vn/en/csr/contact
C. TRANSPARENT COMMUNICATION – STAKEHOLDER ENGAGEMENT
HSC practices a 2-way, 360 degree dialogue process in efforts to drive transparent and accountable communication for its stakeholders. HSC engages with stakeholders by collating their perspectives and insights about a diverse range of sustainability matters done through the exchange of feedbacks and questions that are communicated through open channels. This stakeholder engagement process nurtures greater participation and support from stakeholders which adds value to the robustness of HSC’s business.
The dialogue process promotes good corporate governance with more effective and efficient diagnosis of sustainability performances, taking into account the good and the bad elements while immediately delivering swift response strategies. HSC incorporates the following communication channels to build quality interactions with its stakeholders with the aim to nurture its sustainable development process:
3.3.2 Community Investment – Philanthropic investment
HSC Hanoi Share the Love: The 2015 Year End Party of Ha Noi Branch was organized as a charity event with gift auction activities intended to raise funds. In its entirety, HSC managed to raise a total fund of over VND 100 million from this event. These funds were used to purchase Tet gifts (Lunar New Year gifts) for the poor who resided in Chieng Bom commune, Thuan Chau district, Son La province.
In 2016, HSC Charity Team also visited and shared love and affection to poor children in highland areas of Truong Son Mountain, Quang Ninh and Quang Binh.
Humanity Blood Donation 2016: HSC actively participated in the Human Blood Donation activity that took place at Thai Van Lung Branch on 18 November 2016. There were 56 registered people in which 52 were successful blood donors with donation of over 66 units of blood. This activity was highly appreciated due to its humanity cause of donating blood to those in need, knowing that blood can easily become a scarcity. A unit of blood can help save up three lives. HSC will continue to organize this event as its commitment to society.
Humanity Fund: This fund was initiated by employees of HSC in which employees volunteer to donate a part of their monthly salary to this fund. In 2016, there were nearly 20% of our employees participated in this fund. Although it was recently set up in the late of 2016, the Humanity Fund has relayed a big portion of medical funding in support for a case of cancer of a HSC staff. The statement, “We are together, we care for each other” carries a strong message of offering strong support when times are difficult or during emergencies.
SUSTAINABILITY REPORT
95OPPORTUNITIES94 HSC ANNUAL REPORT 2016

INTEGRITY SECURES OPPORTUNITIES
D. FOCUS FOR 2017
The focus for 2017 encompasses two focus areas of the internal aspect and external aspect of business sustainability.
The company’s focus on the internal aspect mainly revolves around talent management within HSC, as we seek to enhance and retain talents. HSC rewards quality talents by providing incentives whether monetary or non-monetary, ensuring high retention rates. The company is also striving to pool in talents from all education levels in order to stay ahead of competitors, securing a sustainable stream of talent pool for the company.
The external aspect of sustainability emphasizes on employee community engagement that functions to enhance the lives of both HSC’s employees and the local communities. HSC does not want to limit its community engagements solely on monetary charity, but instead, cultivate charity acts alongside with interactional activities that allows employees to engage with the community on a more personal and meaningful level. This would significantly increase HSC’s presence in its CSR activities as community awareness is instilled among its staff. Community awareness that strongly ignites within HSC can be developed into a sustainable corporate culture.
E. CONTACT
For further information and comments in relation to HSC’2016 Sustainability Report, please contact:
Ms. Truong Ngoc Quynh Tien - Communication Director
Email: [email protected]
Tel: (+84 8) 3823 3299 (Ext. 124)
Address: Level 6, AB Tower, 76 Le Lai, Ben Thanh Ward, District 1, HCMC
SUSTAINABILITY REPORT
97OPPORTUNITIES96 HSC ANNUAL REPORT 2016

GENERAL INFORMATION GENERAL INFORMATION (continued)
THE COMPANY
Ho Chi Minh City Securities Corporation (“the Company”) is a joint stock company incorporated under the Law on Enterprises of Vietnam pursuant to Business Registration Certificate No. 4103001573 issued by the Ho Chi Minh City Department of Planning and Investment on 23 April 2003, Business License No. 11/UBCK-GPHDKD issued by the State Securities Commission on 29 April 2003, and other amended licenses.
The Company’s head office is located at 5th and 6th Floor, AB Tower, 76 Le Lai Street, Ben Thanh Ward, District 1, Ho Chi Minh City. At 31 December 2016, the Company had branches located in Ho Chi Minh City and Hanoi, and transaction offices in Ho Chi Minh City and Hanoi.
The current principal activities of the Company are brokerage services, securities trading, underwriting for share issues, custodian services, finance and investment advisory services, and margin trading services.
THE BOARD OF DIRECTORS
Members of the Board of Directors during the year and at the date of the financial statements include:
Name Title Date of appointment/Reappointment/Resign
Mr. Do Hung Viet Chairman Reappointed on 21 April 2016
Mr. Le Anh Minh Vice Chairman Reappointed on 21 April 2016
Mr. Nguyen Thanh Liem Vice Chairman Reappointed on 21 April 2016
Mr. Pham Nghiem Xuan Bac Member Reappointed on 21 April 2016
Mr. Johan Nyvene Member Reappointed on 21 April 2016
Mr. Le Thang Can Member Reappointed on 21 April 2016
Mr. Le Hoang Anh Member Appointed on 21 April 2016
Mr. Trinh Hoai Giang Member Resigned on 21 April 2016
THE BOARD OF SUPERVISION
Members of the Board of Supervision during the year and at the date of the financial statements include:
Name Title Date of reappointment
Mr. Vo Van Chau Chief Supervisor Reappointed on 21 April 2016
Mr. Doan Van Hinh Member Reappointed on 21 April 2016
Ms. Dang Nguyet Minh Member Reappointed on 21 April 2016
MANAGEMENT
Members of management during the year and at the date of the financial statements include:
Name Title Date of appointmentMr. Johan Nyvene Chief Executive Officer Appointed on 15 May 2007
Mr. Trinh Hoai Giang Deputy Chief Executive Officer Appointed on 15 May 2007
Mr. Le Cong Thien Deputy Chief Executive Officer Appointed on 12 August 2013
Mr. Fiachra Mac Cana Managing Director Appointed on 1 March 2008
Mr. Bach Quoc Vinh Managing Director Appointed on 1 February 2010
Mr. Arnold V. Pangilinan Managing Director Appointed on 12 November 2012
Mr. Pham Ngoc Bich Managing Director Appointed on 7 January 2016
Mr. Henry Dickon Verey Managing Director Appointed on 15 November 2016
LEGAL REPRESENTATIVE
The legal representative of the Company during the year and at the date of this report is Mr. Johan Nyvene, the Chief Executive Officer.
AUDITOR
The auditor of the Company is Ernst & Young Vietnam Limited.
OPPORTUNITIES98 HSC ANNUAL REPORT 2016 99

Management of Ho Chi Minh City Securities Corporation (“the Company”) is pleased to present its report and the financial statements of the Company for the year ended 31 December 2016.
MANAGEMENT’S RESPONSIBILITY FOR THE FINANCIAL STATEMENTS
Management is responsible for the financial statements of each financial year which give a true and fair view of the financial position of the Company and of the results of its operations, its cash flows and its changes in equity for the year. In preparing those financial statements, management is required to:
` select suitable accounting policies and then apply them consistently;
` make judgments and estimates that are reasonable and prudent;
` state whether applicable accounting standards have been followed, subject to any material departures disclosed and explained in the financial statements; and
` prepare the financial statements on the going concern basis unless it is inappropriate to presume that the Company will continue its business.
Management is responsible for ensuring that proper accounting records are kept which disclose, with reasonable accuracy at any time, the financial position of the Company and to ensure that the accounting records comply with the registered accounting system. It is also responsible for safeguarding the assets of the Company and hence for taking reasonable steps for the prevention and detection of fraud and other irregularities.
Management confirmed that it has complied with the above requirements in preparing the accompanying financial statements.
STATEMENT BY THE MANAGEMENT
Management hereby state that, in its opinion, the accompanying financial statements give a true and fair view of the financial position of the Company as at 31 December 2016 and of the results of its operations, its cash flows and its changes in equity for the year then ended in accordance with Vietnamese Accounting Standards, Vietnamese Enterprise Accounting System,accounting regulations and guidance applicable to securities companies and other statutory requirements relevant to preparation and presentation of financial statements.
For and on behalf of the Management:
Johan NyveneChief Executive Officer
Ho Chi Minh City, Vietnam30 March 2017
To: The Shareholders of Ho Chi Minh City Securities Corporation
We have audited the accompanying financial statements of Ho Chi Minh City Securities Corporation (“the Company”) as prepared on 30 March 2017 and set out on pages 103 to 156, which comprise the statement of financial position as at 31 December 2016, and the income statement, the cash flow statement and the statement of changes in equity for the year then ended and the notes thereto.
Management’s responsibility for the financial statements
Management is responsible for the preparation and fair presentation of these financial statements in accordance with Vietnamese Accounting Standards, Vietnamese Enterprise Accounting System, accounting regulations and guidance applicable to securities companies and other statutory requirements relevant to preparation and presentation of financial statements, and for such internal control as management determines is necessary to enable the preparation and presentation of financial statements that are free from material misstatement, whether due to fraud or error.
Auditors’ responsibility
Our responsibility is to express an opinion on these financial statements based on our audit. We conducted our audit in accordance with Vietnamese Standards on Auditing. Those standards require that we comply with ethical requirements, plan and perform the audit to obtain reasonable assurance about whether the financial statements are free from material misstatement.
An audit involves performing procedures to obtain audit evidence about the amounts and disclosures in the financial statements. The procedures selected depend on the auditor’s judgment, including the assessment of the risks of material misstatement of the financial statements, whether due to fraud or error. In making those risk assessments, the auditor considers internal control relevant to the Company’s preparation and fair presentation of the financial statements in order to design audit procedures that are appropriate in the circumstances, but not for the purpose of expressing an opinion on the effectiveness of the Company’s internal control. An audit also includes evaluating the appropriateness of accounting policies used and the reasonableness of accounting estimates made by management, as well as evaluating the overall presentation of the financial statements.
We believe that the audit evidence we have obtained is sufficient and appropriate to provide a basis for our audit opinion.
REPORT OF THE MANAGEMENT INDEPENDENT AUDITORS’ REPORT
Reference: 60790272/18609063
OPPORTUNITIES100 HSC ANNUAL REPORT 2016 101

Opinion
In our opinion, the financial statements give a true and fair view, in all material respects, of the financial position of the Company as at 31 December 2016, and of the results of its operations, its cash flows, and its changes in equity for the year then ended in accordance with Vietnamese Accounting Standards, Vietnamese Enterprise Accounting System, accounting regulations and guidance applicable to securities companies and other statutory requirements relevant to preparation and presentation of financial statements.
Ernst & Young Vietnam Limited
Saman Bandara Vo Ngoc MinhDeputy General Director AuditorAudit Practicing Registration Audit Practicing RegistrationCertificate No. 2036-2013-004-1 Certificate No. 2105-2013-004-1
Ho Chi Minh City, Vietnam30 March 2017
Code Items NotesEnding balance
VNDBeginning balance
VND
100 A. CURRENT ASSETS 3,472,717,136,729 2,970,427,721,404
110 I. Cash and cash equivalents 3,468,203,146,189 2,965,609,834,770111 1. Cash and cash equivalents 4 60,193,684,900 164,147,260,813
111.1 1.1. Cash 60,193,684,900 164,147,260,813112 2. Financial assets at fair value through profit and
loss (FVTPL)6.1 306,371,695,555 132,174,873,494
114 3. Loans 6.2 2,750,945,233,394 2,609,604,774,530
116 4. Provision for impairment of financial asset at FVTPL
6.4 (19,997,479,770) -
118 5. Advances to suppliers 424,654,405 511,650,108119 6. Receivables from services provided by the
Company7 370,008,403,676 57,145,417,513
122 7. Other receivables 7 35,167,679,780 18,745,163,406129 8. Provision for doubtful debts 7 (34,910,725,751) (16,719,305,094)
130 II. Other current assets 8 4,513,990,540 4,817,886,634131 1. Advances 433,534,797 154,469,078133 2. Short-term prepaid expenses 4,052,697,143 4,637,718,956134 3. Short-term deposits, collaterals and pledges 27,758,600 25,698,600
200 B. NON-CURRENT ASSETS 144,125,197,959 133,146,147,996
220 I. Fixed assets 9,116,376,326 10,305,668,048221 1. Tangible fixed assets 9 5,630,956,930 5,406,970,081222 1.1. Cost 45,772,044,510 43,397,152,620
223a 1.2. Accumulated depreciation (40,141,087,580) (37,990,182,539)227 2. Intangible fixed assets 10 3,485,419,396 4,898,697,967228 1.1. Cost 29,853,565,250 28,463,749,200
229a 1.2. Accumulated amortization (26,368,145,854) (23,565,051,233)
240 II. Constructions in progress 11 11,158,311,542 1,807,447,420
250 III. Other long-term assets 123,850,510,091 121,033,032,528251 1. Long-term deposits, collaterals and pledges 4,718,807,750 4,688,159,350252 2. Long-term prepaid expenses 12 96,160,834,900 99,512,289,868253 3. Deferred tax assets 24 3,638,284,131 -254 4. Deposit to Settlement Supporting Fund 13 19,332,583,310 16,832,583,310
270 TOTAL ASSETS 3,616,842,334,688 3,103,573,869,400
INDEPENDENT AUDITORS’ REPORT (continued) STATEMENT OF FINANCIAL POSITIONas at 31 December 2016
B01-CTCK
OPPORTUNITIES102 HSC ANNUAL REPORT 2016 103

Code Items NotesEnding balance
VNDBeginning balance
VND
300 A. LIABILITIES 1,224,924,883,425 824,024,542,338
310 I. Current liabilities 1,224,924,883,425 824,024,542,338
311 1. Short-term borrowings and financial leases 14 1,000,000,000,000 654,103,204,781
312 1.1. Short-term borrowings 1,000,000,000,000 654,103,204,781
318 2. Payables for securities transaction activities 15 32,610,005,800 33,854,472,337
320 3. Short-term payables to customers 2,936,065,430 2,132,789,448
322 4. Statutory obligations 16 39,140,841,363 27,383,031,945
324 5. Employee benefits 2,681,960,041 2,711,322,446
325 6. Short-term expense payables 17 23,851,769,991 17,970,571,764
329 7. Other current liabilities 18 108,811,108,212 70,582,809,538
331 8. Bonus and welfare fund 14,893,132,588 15,286,340,079
400 B. OWNERS’ EQUITY 2,391,917,451,263 2,279,549,327,062
410 I. Capital 2,391,917,451,263 2,279,549,327,062
411 1. Share capital 1,581,839,121,491 1,582,140,489,041
411.1 1.1. Contributed capital 1,272,567,580,000 1,272,567,580,000
411.1a 1.1.1. Common shares 1,272,567,580,000 1,272,567,580,000
411.2 1.2. Share premium 310,343,798,499 310,343,798,499
411.5 1.3. Treasury shares (1,072,257,008) (770,889,458)
414 2. Capital supplementary reserve 117,012,921,701 101,786,372,631
415 3. Operational risk and financial reserve 117,012,921,702 101,786,372,632
426 4. Other funds belong to owners’ equity 3,961,374,994 3,961,374,994
427 5. Undistributed earnings 19.2 572,091,111,375 489,874,717,764
427.1 5.1.Realizedprofit 21.2 628,246,013,560 547,779,193,929
427.2 5.2.Unrealizedprofit 21.2 (56,154,902,185) (57,904,476,165)
440 TOTAL LIABILITIES AND OWNERS’ EQUITY 3,616,842,334,688 3,103,573,869,400
OFF BALANCE SHEET ITEMS
Code ITEMS Notes Ending balance VND
Beginning balance VND
A. ASSETS OF THE COMPANY AND ASSETS
MANAGED UNDER AGREEMENTS
004 Bad debts handled 20.1 345,059,000 345,059,000
005 Foreign currency (original currency)
20.2
USD 45,182.58 40,192.22Yen 190,755 190,755Singapore Dollar 300 300Pound 100 -Taiwan Dollar 3,200 3,200Canada Dollar 100 100
006 Outstanding shares (shares) 20.3 127,155,368 127,185,417
007 Treasury shares (shares) 20.4 101,390 71,341
008 Financial assets of the Company listed/registered at VSD
20.5 74,178,610,000 43,903,110,000
009 Non-traded financial assets of the Company listed/registered at VSD
20.6 1,010,000 10,000
010 The Company’s awaiting financial assets
20.7 2,099,960,000 1,569,680,000
012 Financial assets of the Company are not deposited at VSD
20.8 60,297,270,000 44,914,770,000
B. ASSETS AND PAYABLES UNDER AGREEMENT WITH INVESTORS
021 Investors’ financial assets listed/registered at VSD 20.9 12,992,363,100,000 10,264,716,910,000
021.1 Unrestrictedandtradedfinancialassets 10,695,622,580,000 9,417,540,880,000
021.2 Restrictedfinancialassets 12,819,940,000 40,833,600,000
021.3 Mortgagedfinancialassets 1,964,810,500,000 561,031,770,000
021.4 Blockedfinancialassets 90,276,820,000 180,000,000
021.5 Financial assets awaiting settlement 228,833,260,000 245,130,660,000
022 Investors’ non-traded financial assets deposited at VSD
20.10 38,878,010,000 14,605,130,000
022.1 Unrestrictedandnon-tradedfinancialassetsdeposited at VSD
22,049,360,000 7,589,070,000
B01-CTCK B01-CTCK
STATEMENT OF FINANCIAL POSITION (continued)as at 31 December 2016
STATEMENT OF FINANCIAL POSITION (continued)as at 31 December 2016
OPPORTUNITIES104 HSC ANNUAL REPORT 2016 105

OFF BALANCE SHEET ITEMS (continued)
Code ITEMS Notes Ending balance VND
Beginning balance VND
B. ASSETS AND PAYABLES UNDER AGREEMENT WITH INVESTORS (continued)
022.2 Restricted and non-traded financialassetsdepositedatVSD
16,828,650,000 7,016,060,000
023 Investors’ awaiting financial assets 20.11 219,655,840,000 241,716,160,000
026 Investors’ deposits 20.12 581,883,723,061 493,009,558,764
027 Investors’ deposits for securities trading activities managed by the Company
581,883,723,061 493,009,558,764
031 Payables to investors relating to deposits for securities trading activities managed by the Company
20.13 581,883,723,061 493,009,558,764
031.1 - Payables to domestic investors relating to deposits for securities trading activities managed by the Company
581,657,003,061 492,931,698,764
031.2 - Payables to foreign investors relating to deposits for securities trading activities managed by the Company
226,720,000 77,860,000
Code ITEMS Notes Current year VND
Previous year VND
I. OPERATING REVENUE
01 1. Revenue from financial assets at fair value through profit and loss (FVTPL)
99,024,690,204 88,926,268,079
01.1 1.1. GainfromsaleoffinancialassetsatFVTPL 21.1 61,894,006,092 28,569,176,193
01.2 1.2. GainfromrevaluationoffinancialassetsatFVTPL
6.3 5,246,169,979 -
01.3 1.3. Dividend,interestincomefromfinancialassetsatFVTPL
21.3 31,884,514,133 60,357,091,886
03 2. Income from loans and receivables 21.3 343,656,813,084 222,636,416,52906 3. Revenue from brokerage services 21.4 348,957,129,710 262,076,234,335
08 4. Revenue from securities investment advisory services
21.4 24,601,902,383 11,154,708,555
09 5. Revenue from custodian services 21.4 5,056,975,249 3,952,302,88111 6. Other operating income 21.4 1,868,685,936 1,574,822,29620 Total revenues from operating activities 823,166,196,566 590,320,752,675
II. OPERATING EXPENSES
21 1. Loss from financial assets at FVTPL (17,764,618,901) (25,154,332,109)21.1 1.1. LossfromsaleoffinancialassetsatFVTPL 21.1 (14,268,022,902) (49,496,478,969)
21.2 1.2. LossfromrevaluationoffinancialassetsatFVTPL
6.3 (3,496,595,999) 24,342,146,860
24 2. Provision expenses for financial assets, bad debts written off and loss from impairment of financial assets and borrowing costs to loan
22 (65,564,043,908) (7,390,345,537)
26 3. Expenses for self-trading activities 22 (23,567,021,196) (11,949,061,177)27 4. Expenses for brokerage services 22 (206,830,545,356) (168,468,781,630)29 5. Expenses for securities investment advisory services 22 (9,996,332,411) (9,705,218,891)30 6. Expenses for securities custodian services 22 (5,096,284,054) (4,025,649,485)32 7. Other operating expenses 22 (18,865,791,047) (4,103,170,938)40 Total operating expenses (347,684,636,873) (230,796,559,767)
III. FINANCIAL INCOME
42 1. Revenue, accrued dividends, non-fixed interest income
1,078,380,134 818,225,135
50 Total financial income 1,078,380,134 818,225,135
INCOME STATEMENTfor the year ended 31 December 2016
B02-CTCK
OPPORTUNITIES 107
B01-CTCK
STATEMENT OF FINANCIAL POSITION (continued)as at 31 December 2016
106 HSC ANNUAL REPORT 2016

Code ITEMS Notes Current year VND
Previous year VND
62 VI. ADMINISTRATIVE EXPENSES 23 (91,966,241,312) (88,870,264,003)
70 VII. OPERATING PROFIT 384,593,698,515 271,472,154,040
VIII. OTHER INCOME EXPENSES
71 1. Other income 789,590,907 28,037,441
80 Total other income 789,590,907 28,037,441
90 IX. PROFIT BEFORE TAX 385,383,289,422 271,500,191,481
91 1. Realized profit 383,633,715,442 247,158,044,621
92 2. Unrealized profit 1,749,573,980 24,342,146,860
100 X. CORPORATE INCOME TAX (CIT) EXPENSES
24 (80,852,308,119) (58,190,091,220)
100.1 1. Current CIT expense (84,490,592,250) (58,190,091,220)
100.2 2. Deferred CIT income 3,638,284,131 -
200 XI. PROFIT AFTER TAX 304,530,981,303 213,310,100,261
400 TOTAL COMPREHENSIVE INCOME 304,530,981,303 213,310,100,261
500 XII. NET INCOME PER SHARE501 1. Basic earnings per share 25.4 2,395 1,598
Code ITEMS Notes Current year VND
Previous year VND
I. CASH FLOWS FROM OPERATING ACTIVITIES
01 1. Net profit before tax 385,383,289,422 271,500,191,481
02 2. Adjustments for:03 - Depreciation and amortization 9, 10 5,921,197,566 5,506,890,305
04 - Provisions 6.4, 7 38,188,900,427 -
07 - Profits from investing activities (789,590,907) (27,909,091)
08 - Accrued interest 7 (1,817,395,834) (2,178,573,612)
10 3. Increase in non-monetary expenses
11 Loss from revaluation of financial assets at FVTPL 6.3 3,496,595,999 -
18 4. Decrease in non-monetary revenues19 Gain from revaluation of financial assets at FVTPL 6.3 (5,246,169,979) (24,342,146,860)
30 5. Changes in operating assets and liabilities 425,136,826,694 250,458,452,223
31 (Increase)/decrease in financial assets at FVTPL (172,447,248,081) 89,641,613,473
33 Increase in loans (141,340,458,864) (1,237,857,244,278)
37 (Increase)/decrease in receivables from services provided by the Company
(312,862,986,163) 583,814,371,138
39 (Increase)/decrease in other receivables (14,518,124,837) 8,795,675,477
41 Increase/(decrease) in accrued expenses (excluding borrowing costs)
5,881,198,227 (6,538,502,831)
42 Decrease in prepaid expense 3,936,476,781 2,170,370,087
43 Corporate income tax paid 16 (74,560,483,150) (54,941,674,651)
45 Decrease in trade payables (441,190,555) (612,245,380,452)
46 (Decrease) /Increase in employees benefit payables (29,362,405) 572,870,453
47 Increase/(decrease) in tax payables (excluding corporate income tax paid)
1,748,741,225 (869,655,577)
50 Increase/(decrease) in other payables 27,223,376,032 (811,413,101)
52 Other payments for business operation (2,811,774,119) (22,686,278,609)
60 Net cash flows used in operating activities (255,085,009,215) (1,000,496,796,648)
INCOME STATEMENT (continued)for the year ended 31 December 2016
B02-CTCK
STATEMENT OF CASH FLOWSfor the year ended 31 December 2016
B02-CTCK
OPPORTUNITIES108 HSC ANNUAL REPORT 2016 109

Code ITEMS Notes Current year VND
Previous year VND
II. CASH FLOWS FROM INVESTING ACTIVITIES
61 Purchase and construction of fixed assets (14,082,769,966) (9,196,409,972)
62 Proceeds from disposals of fixed assets and other long-term assets
868,550,000 30,700,000
70 Net cash flows used in investing activities (13,214,219,966) (9,165,709,972)
III. CASH FLOW FROM FINANCING ACTIVITIES
72 Payments for capital of owners and repurchasing issued shares
(1,367,550) (2,080,620)
73 Principal Borrowings 14 15,916,247,935,548 6,357,985,987,374
73.2 - Other borrowings 15,916,247,935,548 6,357,985,987,374
74 Payments for principal borrowings 14 (15,570,351,140,329) (5,703,882,782,593)
74.3 - Other borrowings (15,570,351,140,329) (5,703,882,782,593)
76 Dividends and profits paid to shareholders (181,549,774,401) (266,685,973,510)
80 Net cash flows from financing activities 164,345,653,268 387,415,150,651
90 Net decrease in cash and cash equivalents during the year
(103,953,575,913) (622,247,355,969)
101 Cash and cash equivalents at the beginning of the year
4 164,147,260,813 786,394,616,782
101.1 Cash 164,147,260,813 786,394,616,782
103 Cash and cash equivalents at the end of the year 4 60,193,684,900 164,147,260,813
103.1 Cash 60,193,684,900 164,147,260,813
CASH FLOWS FROM BROKERAGE AND TRUST ACTIVITIES OF THE CUSTOMERS
Code ITEMS Notes Current year VND
Previous year VND
I. CASH FLOWS FROM BROKERAGE AND TRUST ACTIVITIES OF THE CUSTOMERS
01 1. Cash receipt from disposal of securities on behalf of customers
55,264,325,527,560 44,084,347,704,564
02 2. Cash payment for acquisition of securities on behalf of customers
(55,568,381,170,200) (45,901,003,061,414)
07 3. Cash receipt from investors for trading securities
397,986,782,186 1,593,388,791,200
11 4. Cash payment for securities depository fee of customers
(5,056,975,249) (3,952,302,881)
20 Net increase/(decrease) in cash during the year 88,874,164,297 (227,218,868,531)
30 II. CASH AND CASH EQUIVALENT OF THE CUSTOMERS AT THE BEGINNING OF THE YEAR
493,009,558,764 720,228,427,295
31 Cash at banks at the beginning of the year:
32 Investors’ deposits managed by the Company for securities trading activities
493,009,558,764 720,228,427,295
33 - Investors’ deposits for trading securities 493,009,558,764 720,228,427,295
40 III. CASH AND CASH EQUIVALENT OF THE CUSTOMERS AT THE END OF THE YEAR (40 = 20 + 30)
581,883,723,061 493,009,558,764
41 Cash at banks at the end of the year:
42 Investors’ deposits managed by the Company for securities trading activities
581,883,723,061 493,009,558,764
B03b-CTCK B03b-CTCK
STATEMENT OF CASH FLOWS (continued) for the year ended 31 December 2016
STATEMENT OF CASH FLOWS (continued) for the year ended 31 December 2016
OPPORTUNITIES110 HSC ANNUAL REPORT 2016 111

ITEM
SNo
tes
Begi
nnin
g ba
lanc
eIn
crea
se/(
decr
ease
)En
ding
bal
ance
1 Ja
nuar
y 20
15
VND
1 Ja
nuar
y 20
16
VND
Prev
ious
yea
rCu
rren
t yea
r
31 D
ecem
ber 2
015
VND
31 D
ecem
ber 2
016
VND
Incr
ease
VN
DDe
crea
se
VND
Incr
ease
VN
DDe
crea
se
VND
1.
Shar
e cap
ital
1,58
2,58
3,56
9,66
11,
582,
140,
489,
041
(443
,080
,620
)-
(301
,367
,550
)-
1,58
2,14
0,48
9,04
11,
581,
839,
121,
491
1.1.
Co
mm
on sh
ares
1,27
2,56
7,58
0,00
01,
272,
567,
580,
000
--
--
1,27
2,56
7,58
0,00
01,
272,
567,
580,
000
1.2.
Su
rplu
s equ
ity31
0,34
3,79
8,49
931
0,34
3,79
8,49
9-
--
-31
0,34
3,79
8,49
931
0,34
3,79
8,49
9
1.3.
Tr
easu
ry sh
ares
(327
,808
,838
)(7
70,8
89,4
58)
(443
,080
,620
)-
(301
,367
,550
)-
(770
,889
,458
)(1
,072
,257
,008
)
2.
Oper
atio
nal r
isk a
nd
finan
cial
rese
rve f
und
91,1
20,8
67,6
1910
1,78
6,37
2,63
210
,665
,505
,013
-15
,226
,549
,070
-10
1,78
6,37
2,63
211
7,01
2,92
1,70
2
3.
Capi
tal s
uppl
emen
tary
re
serv
e91
,120
,867
,618
101,
786,
372,
631
10,6
65,5
05,0
13-
15,2
26,5
49,0
70-
101,
786,
372,
631
117,
012,
921,
701
4.
Othe
r fun
ds b
elon
ging
to
owne
rs’ e
quity
3,96
1,37
4,99
43,
961,
374,
994
--
--
3,96
1,37
4,99
43,
961,
374,
994
5.
Undi
strib
uted
pr
ofit
19.2
589,
443,
929,
500
489,
874,
717,
764
213,
310,
100,
261
(312
,879
,311
,997
)30
4,53
0,98
1,30
3(2
22,3
14,5
87,6
92)
489,
874,
717,
764
572,
091,
111,
375
5.1.
Re
alize
dprofi
t67
1,69
0,55
2,52
554
7,77
9,19
3,92
918
8,96
7,95
3,40
1(3
12,8
79,3
11,9
97)
302,
781,
407,
323
(222
,314
,587
,692
)54
7,77
9,19
3,92
962
8,24
6,01
3,56
0
5.2.
Un
real
ized
loss
(82,
246,
623,
025)
(57,
904,
476,
165)
24,3
42,1
46,8
60-
1,74
9,57
3,98
0-
(57,
904,
476,
165)
(56,
154,
902,
185)
TOTA
L2,
358,
230,
609,
392
2,27
9,54
9,32
7,06
223
4,19
8,02
9,66
7(3
12,8
79,3
11,9
97)
334,
682,
711,
893
(222
,314
,587
,692
)2,
279,
549,
327,
062
2,39
1,91
7,45
1,26
3
1. CORPORATE INFORMATION
Ho Chi Minh City Securities Corporation (“the Company”) is a joint stock company incorporated under the Law on Enterprises of Vietnam pursuant to Business Registration Certificate No. 4103001573 issued by the Ho Chi Minh City Department of Planning and Investment on 23 April 2003, Business License No. 11/UBCK-GPHDKD issued by the State Securities Commission on 29 April 2003, and other amended licenses.
The current principal activities of the Company are brokerage services, securities trading, underwriting for share issues, custodian services, finance and investment advisory services, and margin trading services.
The Company’s head office is located at 5th and 6th Floor, AB Tower, 76 Le Lai Street, Ben Thanh Ward, District 1, Ho Chi Minh City. At 31 December 2015, the Company had branches located in Ho Chi Minh City and Hanoi, and transaction offices in Ho Chi Minh City and Hanoi.
The number of the Company’s employees as at 31 December 2016 was 701 persons (31 December 2015: 679 persons).
Main features of operation of the Company
Capital size
As at 31 December 2016, the Company’s share capital amounted to VND1,272,567,580,000, while its owners’ equity was VND2,391,917,451,263 and its total assets were VND3,616,842,334,688.
Investment target
Being a listed securities company in the Vietnamese securities market, the Company’s aims are to contribute to the development of the securities market and bring benefits to customers, investors and shareholders of the Company.
Investment restrictions
The Company complies with regulations at Article 44 of Circular No. 210/2012/TT-BTC dated 30 November 2012 promulgating the establishment and operation of securities companies, Circular No. 07/2016/TT-BTC dated 18 January 2016 amending and supplementing certain articles of Circular No. 210/2012/TT-BTC and current regulations on investment restrictions.
2. BASIS OF PREPARATION
2.1 Accounting Standards and System
The financial statements of the Company (the “Company”) expressed in Vietnam dong (“VND”), are prepared in accordance with the Vietnamese Enterprise Accounting System, the accounting policies applicable to securities companies as set out in Circular No. 210/2014/TT-BTC dated 30 December 2014 providing guidance on accounting policies applicable to securities companies, Circular No. 334/2016/TT-BTC dated 27 December 2016 amending, supplementing and replacing Appendix 2 and Appendix 4 of Circular No. 210/2014/TT-BTC, Circular No. 146/2014/TT-BTC dated 6 October 2014 providing guidance on financial regime applicable to securities companies and Vietnamese Accounting Standards as per:
` Decision No. 149/2001/QD-BTC dated 31 December 2001 on the Issuance and Promulgation of Four Vietnamese Standards on Accounting (Series 1);
` Decision No. 165/2002/QD-BTC dated 31 December 2002 on the Issuance and Promulgation of Six Vietnamese Standards on Accounting (Series 2); ST
ATEM
ENT
OF
CHAN
GES
IN O
WN
ER’S
EQ
UIT
Yfo
r the
yea
r end
ed 3
1 De
cem
ber 2
016
NOTES TO THE FINANCIAL STATEMENTSas at and for the year ended 31 December 2016
B09-CTCK
OPPORTUNITIES112 HSC ANNUAL REPORT 2016 113

2. BASIS OF PREPARATION (continued)
2.1 Accounting Standards and System (continued)
` Decision No. 234/2003/QD-BTC dated 30 December 2003 on the Issuance and Promulgation of Six Vietnamese Standards on Accounting (Series 3);
` Decision No. 12/2005/QD-BTC dated 15 February 2005 on the Issuance and Promulgation of Six Vietnamese Standards on Accounting (Series 4); and
` Decision No. 100/2005/QD-BTC dated 28 December 2005 on the Issuance and Promulgation of Four Vietnamese Standards on Accounting (Series 5).
2.2 Registered accounting documentation system
The Company’s applied accounting documentation system is the General Journal system.
2.3 Fiscal year
The Company’s fiscal year starts on 1 January and ends on 31 December.
2.4 Accounting currency
The financial statements are prepared in VND which is also the Company’s accounting records in VND.
3. SUMMARY OF SIGNIFICANT ACCOUNTING POLICIES
3.1 Change in accounting policies and disclosures
On 30 December 2014, the Ministry of Finance issued Circular No. 210/2014/TT-BTC providing guidance on accounting policies applicable to securities companies (“Circular 210”). This Circular replaces Circular No. 95/2008/TT-BTC dated 24 October 2008 of the Ministry of Finance providing guidance on accounting policies appliable to securities companies and Circular No. 162/2010/TT-BTC dated 20 October 2010 amending and supplementing Circular No. 95/2008/TT-BTC. Circular 210 is applicable to fiscal year beginning on or after 1 January 2016. Circular 210 prescribes contents of accounting vouchers, system of accounting accounts as well as method of preparing and presenting the financial statements of securities companies.
On 27 December 2016, the Ministry of Finance issued Circular No. 334/2016/TT-BTC amending, supplementing and replacing Appendix 02 and 04 of Circular No. 210/2014/TT-BTC dated 30 December 2014 (“Circular 334”).
Circular 210 and Circular 334 leads to the following significant changes:
` Changes in name and content of the financial statements: balance sheet is renamed as statement of financial position, statement of profit or loss is renamed as income statement, statement of cash flows from brokerage and trust activities of investors is separately presented as a part of the basic financial statements.
` Financial assets are categorized into four groups: financial assets at fair value through profit and loss, available-for-sale financial assets, held-to-maturity investments and loans.
` Assets and liabilities of securities companies and investors (including deposits, securities investment and payable accounts) are separately managed.
In addition, Circular 210 and Circular 334 provides the guidance on measurement of financial assets as follows: ` Financial assets at fair value through profit and loss (FVTPL): are recognized at cost or recognized at fair value
if complying with current securities regulations. Changes in fair value of these assets is recognized in the income statement.
` Available-for-sale (AFS) financial assets: are recognized at fair value. Any gain or loss arising from revaluation of AFS financial assets is recognized directly in owners‘ equity (Other comprehensive income), through statement of changes in owners’ equity, except for loss from impairment of AFS financial assets.
Dec. 15
3. SUMMARY OF SIGNIFICANT ACCOUNTING POLICIES (continued)
3.1 Change in accounting policies and disclosures (continued)
` Held-to-maturity (HTM) financial assets: are recognized at amortized cost based on effective interest rate method.
` Loans: are recognized at amortized cost based on effective interest rate method.
Circular 210 and Circular 334 are applied for fiscal year beginning from or after 1 January 2016.
The Company has restated its comparative figures of previous year in accordance with Circular 210 and Circular 334’s requirements as presented in Note 25.6.
3.2 Standards issued but not yet taken effect
On 20 November 2015, the National Assembly of Vietnam passed the Law on Accounting No. 88/2015/QH13 (“the new Accounting Law“). The new Accounting Law extends its governing scope to electronic accounting documents and allows the application of fair value concept for some types of assets and liabilities which their value frequently varies due to market fluctuation, provided that the fair value of these assets and liabilities can be reliably determined. The new Acounting Law takes effect from 1 January 2017.
3.3 Cash and cash equivalents
Cash and cash equivalents comprise cash on hand, cash at banks and short-term, highly liquid investments with an original maturity of three months or less that are readily convertible into known amounts of cash and that are subject to an insignificant risk of change in value.
Cash deposited by customers for securities trading and cash deposited by securities issuers are presented at off-balance sheet.
B09-CTCK B09-CTCK
NOTES TO THE FINANCIAL STATEMENTS (continued)as at and for the year ended 31 December 2016
NOTES TO THE FINANCIAL STATEMENTS (continued)as at and for the year ended 31 December 2016
OPPORTUNITIES114 HSC ANNUAL REPORT 2016 115

3. SUMMARY OF SIGNIFICANT ACCOUNTING POLICIES (continued)
3.4 Financial assets at fair value through profit and loss (FVTPL)
Financial assets recognized at fair value through profit and loss are financial assets that satisfy either of the following conditions:
a) It is classified as held for trading. A financial asset is classified as held for trading if:
- it is acquired or incurred principally for the purpose of selling or repurchasing it in the near term;
- there is evidence of a recent actual pattern of short-term profit-taking; or
- it is a derivative (except derivative that is a financial guarantee contract or effective hedging instrument).
b) Upon initial recognition, a financial asset is designated by the entity at fair value through profit and loss as it meets one of the following criteria:
- The designation eliminates or significantly reduces the inconsistent treatment that would otherwise arise from measuring the asset or recognising gains or losses on a different basis; or
- The assets and liabilities are part of a group of financial assets which are managed and their performance evaluated on a fair value basis, in accordance with a documented risk management or investment strategy.
Financial assets at FVTPL are initially recognized at cost and subsequently recognized at cost less the reduction in the fair value of these financial assets as the prevailing securities regulations does not allow the use of fair value concept.
Transaction costs relating to the purchase of the financial assets at FVTPL are recognized when incurred as expenses for proprietary trading in the income statement.
3.5 Loans
Loans are non-derivative financial assets with fixed or identifiable payments and not listed on the market, with the exceptions of:
a) The amounts the entity has the intent to immediately sell or will sell in a near future which are classified as assets held for trading, and like those which, upon initial recognition, the entity categorized as such recognized at fair value through profit or loss statements;
b) The amounts categorized by the entity as available for sale upon initial recognition; or
c) The amounts whose holders cannot recover most of the initial investment value not due to credit quality impairment and which are categorized as available for sale.
Loans are recognized initially at cost. After initial recognition, loans are subsequently measured at amortized cost using the effective interest rate (“EIR”).
Amortized cost of loans is the amount at which the financial asset is measured at initial recognition minus (-) principal repayments, plus (+) or minus (-) the cumulative amortization using the effective interest rate method of any difference between that initial amount and the maturity amount, and minus any reduction (directly or through the use of an allowance account) for impairment or uncollectibility.
3. SUMMARY OF SIGNIFICANT ACCOUNTING POLICIES (continued)
3.6 Provision for impairment of financial assets
Provisionforimpairmentoffinancialassets
Financial assets are assessed at the reporting date whether there is objective evidence that the assets are impaired.
Provision for impairment of transferable securities is the difference between the book value and market value of the financial assets as at the latest transaction date but not exceed one month compared to making provision date in accordance with Circular No. 146/2014/TT-BTC and Circular No. 228/2009/TT-BTC. Any increase or decrease in balance of provision is recognized in “Provision expense for financial assets, bad debts written off, impairment of financial assets and borrowing costs to finance for loans”.
Market value/fair value of the securities is determined on the following basis:
` For securities listed on Hanoi Stock Exchange and Ho Chi Minh City Stock Exchange, their market prices are their closing prices on the trading day preceding the date of setting up the provision.
` For securities have not listed on Stock Exchange but registered for trading on the unlisted public company market (UPCom), their market prices are their average closing prices on the trading day preceding the date of setting up the provision.
` For the delisted securities and suspended trading securities from the sixth day afterward, their prices are the book value at the latest financial report date.
` The market price for unlisted securities and securities unregistered for trading used as a basis for setting up the provision is the average of actual trading prices quoted by 3 securities companies conducting transactions within one month before the date of setting up the provision.
Provision for loans is made based on the expected loss which is calculated as the difference between market price of securities pledged for loans and outstanding loan balance.
For securities which do not have reference prices from the above sources, the impairment is determined based on the financial performance and the book value of securities issuers as at the assessment date.
3.7 Derecognition of financial assets
A financial asset (part of a group of similar financial assets) is derecognized when:
` The rights to receive cash flows from the asset have expired; or
` The Company has transferred its rights to receive cash flows from the asset or has assumed an obligation to pay the received cash flows in full without material delay to a third party under a “pass-through” arrangement; and either:
- the Company has transferred substantially all the risks and rewards of the asset, or
- the Company has neither transferred nor retained substantially all the risks and rewards of the asset, but has transferred control of the asset.
B09-CTCK B09-CTCK
NOTES TO THE FINANCIAL STATEMENTS (continued)as at and for the year ended 31 December 2016
NOTES TO THE FINANCIAL STATEMENTS (continued)as at and for the year ended 31 December 2016
OPPORTUNITIES116 HSC ANNUAL REPORT 2016 117

3. SUMMARY OF SIGNIFICANT ACCOUNTING POLICIES (continued)
3.7 Derecognition of financial assets (continued)
When the Company has transferred its rights to receive cash flows from an asset or has entered into a pass-through arrangement, and has neither transferred nor retained substantially all the risks and rewards of the asset nor transferred control of the asset, the asset is recognized to the extent of the Company’s continuing involvement in the asset. In that case, the Company also recognizes an associated liability. The transferred asset and the associated liability are measured on a basis that reflects the rights and obligations that the Company has retained.
Continuing involvement that takes the form of a guarantee over the transferred asset is measured at the lower of the original carrying amount of the asset and the maximum amount of consideration that the Company could be required to repay.
3.8 Financial assets reclassification
ReclassificationwhendisposingfinancialassetswhicharenotrecognizedatFVTPL
The Company which disposes financial assets which are not financial assets at FVTPL is required to reclassify financial assets from other related groups to financial assets at FVTPL.
Reclassificationduetochangeinintentionorholdingcapability
The Company is allowed to reclassify financial assets into other groups as the result of change in its attention or holding ability.
Non-derivative FVTPL financial assets which are not required to classify into FVTPL at initial recognition can be reclassified into loans and receivables in certain special circumstances or cash and cash equivalents if it meets the conditions to be classified in this group. Loss recorded from revaluation of financial asset at FVTPL before reclassification will not be reversed.
If the Company changes its intention or holding ability, the classification of an investment into held to maturity is no longer suitable. This investment must be reclassified to financial assets at AFS and revaluated at cost less provision for diminution (if any) as the prevailing Law on Accounting does not allow the use of fair value concept.
3.9 Receivables
Receivables are initially recorded at cost and subsequently presented at cost in the following periods.
Receivables are subject to review for impairment based on their overdue status or estimated loss of undue receivables from economic entities which fall bankruptcy or are undergoing dissolution procedures; or from debtors who are missing, have fled, are prosecuted, detained or tried by law enforcement bodies, are serving sentences or have deceased. Increase or decrease to the provision balance is recorded as “operating expenses” in the income statement.
Provision for overdue receivables is made in accordance with Circular No. 228/2009/TT-BTC dated 7 December 2009 issued by the Ministry of Finance as follows:
Overdue period Provision rateFrom six (6) months to less than one (1) year 30%From one (1) year to less than two (2) years 50%From two (2) years to less than three (3) years 70%From three (3) years and above 100%
3. SUMMARY OF SIGNIFICANT ACCOUNTING POLICIES (continued)
3.10 Tangible fixed assets
Tangible fixed assets are stated at cost less accumulated depreciation.
The cost of a tangible fixed asset comprises of its purchase price and any directly attributable costs of bringing the tangible fixed asset to working condition for its intended use.
Expenditures for additions, improvements and renewals are added to the carrying amount of the assets and expenditures for maintenance and repairs are charged to the income statement as incurred.
When tangible fixed assets are sold or retired, their costs and accumulated depreciation are removed from the statement of financial position and any gain or loss resulting from their disposal is included in the income statement.
3.11 Intangible fixed assets
Intangible fixed assets are stated at cost less accumulated amortization.
The cost of an intangible fixed asset comprises of its purchase price and any directly attributable costs of preparing the intangible fixed asset for its intended use.
Expenditures for additions, improvements are added to the carrying amount of the assets and other expenditures are charged to the income statement as incurred.
When intangible fixed assets are sold or retired, their costs and accumulated amortization are removed from the statement of financial position and any gain or loss resulting from their disposal is included in the income statement.
3.12 Depreciation and amortization
Depreciation and amortization of tangible fixed assets and intangible assets are calculated on a straight-line basis over the estimated useful life of each asset as follows:Transportation vehicles 6 yearsOffice equipment 3 - 5 yearsComputer software 3 - 4 years
3.13 Prepaid expenses
Prepaid expenses are reported as short-term or long-term prepaid expenses on the statement of financial position and amortized over the period for which the amount are paid or the period in which economic benefit are generated in relation to these expenses.
The following types of expenses are recorded as long-term prepaid expense and are amortized to the income statement over two (02) to forty (40) years:
` Office renovation costs; ` Office rentals; and ` Office equipment costs.
B09-CTCK B09-CTCK
NOTES TO THE FINANCIAL STATEMENTS (continued)as at and for the year ended 31 December 2016
NOTES TO THE FINANCIAL STATEMENTS (continued)as at and for the year ended 31 December 2016
OPPORTUNITIES118 HSC ANNUAL REPORT 2016 119

3. SUMMARY OF SIGNIFICANT ACCOUNTING POLICIES (continued)
3.14 Repurchase and reverse repurchase agreements
Securities sold under agreements to repurchase at a specified future date (“repos”) are not derecognized from the financial statements. The corresponding cash received is recognized in the financial statements as a liability. The difference between the sale price and repurchase price is recognized as interest expense and is accrued over the life of the agreement using the straight-line method.
Conversely, securities purchased under agreements to resell at a specified future date (“reverse repos”) are not recognized in the financial statements. The corresponding cash paid is recognized in the statement of financial position as an liability. The difference between the purchase price and resale price is treated as interest income and is accrued over the life of the agreement using the straight-line method.
For overdue commitments, the Company considers to make provision base on the aging of commitments or expected losses in accordance with Circular No. 228/2009/TT-BTC dated 7 December 2009 issued by the Ministry of Finance.
3.15 Payables and accruals
Payables and accruals are recognized for amounts to be paid in the future for interest of convertible bonds goods and services received, whether or not billed to the Company.
3.16 Employee benefits
3.16.1Post-employmentbenefits
Post-employment benefits are paid to retired employees of the Company by the Social Insurance Agency which belongs to the Ministry of Labor and Social Affairs. The Company is required to contribute to these post-employment benefits by paying social insurance premium to the Social Insurance Agency at the rate of 18% of an employee’s basic salary on a monthly basis. The Company has no further obligation to fund the post-employment benefits of its employees, other than the liability to pay the Social Insurance Agency on a monthly basis.
3.16.2 Provision for retrenchment allowance
Retrenchment allowance occurs as a result of a constructive obligation to restructure when the Company has a detailed and formal plan for restructuring and has raised a valid expectation in those affected that it will carry out the restructuring by starting to implement that plan or announcing its main features to those affected by it. Retrenchment allowance is provided at the rate of one month’s salary for each working year up to 31 December 2008 and the minimum amount for each employee is two months’ salary in accordance with the Labor Code and related implementing guidance. From 1 January 2009, the average monthly salary used in this calculation is the average monthly salary of the latest six-month period up to the resignation date. The increase in this provision will be accounted in income statement.
According to current regulation the Company is obliged Provision for retrenchment allowance fund used for payment of unemployment allowance arising termination labor contract.
3.16.3Unemploymentbenefits
According to current regulation the Company is required to pay unemployment insurance at 1% of salary of employees who participate in the unemployment program and deduct 1% from each employee’s basic salary.
3. SUMMARY OF SIGNIFICANT ACCOUNTING POLICIES (continued)
3.17 Foreign currency transactions
Transactions in currencies other than the Company’s reporting currency of VND are recorded at the actual transaction exchange rates of commercial banks at transaction dates. At the end of the year, monetary balances denominated in foreign currencies are determined as follows:
` Monetary assets are translated at buying exchange rate of the commercial bank where the Company conducts transactions regularly.
` Monetary liabilities are translated at selling exchange rate of the commercial bank where the Company conducts transactions regularly.
All foreign exchange differences incurred during the year and arisen from the revaluation of monetary accounts denominated in foreign currencies at the end of the year are taken to the income statement.
3.18 Treasury shares
Own equity instruments which are reacquired (treasury shares) are recognized at cost and deducted from equity. No gain or loss is recognized in profit or loss upon purchase, sale, issue or cancellation of the Company’s own equity instruments.
3.19 Revenue recognition
Revenue is recognized to the extent that it is probable that the economic benefits will flow to the Company and the revenue can be reliably measured. Revenue is determined according to fair value of receivables which ware received or not after deducted trading discounts, price reductions and returned goods. The following specific recognition criteria must also be met before revenue is recognized:
Revenue from brokerage activities
Where the contract outcome can be reliably measured, revenue is recognized by reference to the stage of completion. Where the contract outcome cannot be reliably measured, revenue is recognized only to the extent of the expenses recognized which are recoverable.
Revenue from trading securities
Revenue from securities trading is recognized on the basis of the difference between selling price and cost of securities sold.
Revenue from securities repurchase and reverse repurchase agreements
Revenue from securities repurchase and reverse repurchase agreements is recognized over the life of the agreement using the straight-line method.
Interest income
Revenue is recognized as the interest accrues (taking into account the effective yield on the asset) unless collectability is in doubt.
Dividend
Income is recognized when the Company’s entitlement as an investor to receive the dividend is established, except for dividend received in shares which only changing number of shares is reflected the Company’s investment portfolio.
Rendering of other services
Where the contract outcome can be reliably measured, revenue is recognized by reference to the stage of completion.
Where the contract outcome cannot be reliably measured, revenue is recognized only to the extent of the expenses recognized which are recoverable.
B09-CTCK B09-CTCK
NOTES TO THE FINANCIAL STATEMENTS (continued)as at and for the year ended 31 December 2016
NOTES TO THE FINANCIAL STATEMENTS (continued)as at and for the year ended 31 December 2016
OPPORTUNITIES120 HSC ANNUAL REPORT 2016 121

3. SUMMARY OF SIGNIFICANT ACCOUNTING POLICIES (continued)
3.19 Revenue recognition (continued)
Other income
Revenues from irregular activities other than turnover-generating activities are recorded to other incomes as stipulated by VAS 14 – “Revenue and other income”, including: Revenues from asset liquidation and sale; fines paid by customers for their contract breaches; collected insurance compensation; collected debt which had been written off and included in the preceding period expenses; payable debts which are now recorded as revenue increase as their owners no longer exist; collected tax amounts which now are reduced and reimbursed; and other revenues.
3.20 Borrowing cost
Borrowing cost comprised interest expense and other expense related directly to the Company’s loans.
Borrowings costs are recognized on the accrual basis into the income statement.
3.21 Cost of securities sold
The Company applies the moving weighted average method to calculate cost of equity securities sold and the specific identification method to calculate cost of debt securities sold.
3.22 Taxation
Current income tax
Current income tax assets and liabilities for the current and prior years are measured at the amount expected to be recovered from or paid to the taxation authorities. The tax rates and tax laws used to compute the amount are those that are enacted as at the statement of financial position.
Current income tax is charged or credited to the income statement, except when it relates to items recognized directly to equity, in which case the current income tax is also dealt with in equity.
Current income tax assets and liabilities are offset when there is a legally enforceable right for the Company to set off current tax assets against current tax liabilities and when the Company intends to settle its current tax assets and liabilities on a net basis.
Deferred income tax
Deferred income tax is provided using the liability method on temporary differences at the statement of financial position date between the tax base of assets and liabilities and their carrying amount for financial reporting purposes.
Deferred tax liabilities are recognized for all taxable temporary differences, except where the deferred tax liability arises from the initial recognition of an asset or liability in a transaction which at the time of the transaction affects neither the accounting profit nor taxable profit or loss.
Deferred tax assets are recognized for all deductible temporary differences, carry forward of unused tax credits and unused tax losses, to the extent that it is probable that taxable profits will be available against which deductible temporary differences, carry forward of unused tax credits and unused tax losses can be utilized, except where the deferred tax asset in respect of deductible temporary difference which arises from the initial recognition of an asset or liability which at the time of the related transaction, affects neither the accounting profit nor taxable profit or loss.
3. SUMMARY OFSIGNIFICANT ACCOUNTING POLICIES (continued)
3.22 Taxation (continued)
Deferred income tax(continued)
The carrying amount of deferred income tax assets is reviewed at each statement of financial position date and reduced to the extent that it is no longer probable that sufficient taxable profits will be available to allow all or part of the asset to be recovered. Previously unrecognized deferred income tax assets are re-assessed at each statement of financial position date and are recognized to the extent that it has become probable that future taxable profit will allow the deferred tax assets to be recovered.
Deferred income tax assets and liabilities are measured at the tax rates that are expected to apply in the year when the asset realized or the liability is settled based on tax rates and tax laws that have been enacted at the statement of financial position date.
Deferred tax is charged or credited to the income statement, except when it relates to items recognized directly to equity, in which case the deferred tax is also dealt with in equity.
Deferred tax assets and liabilities are offset when there is a legally enforceable right to set off current tax assets against current tax liabilities and when they relate to income taxes levied by the same taxable entity and the same taxation authority and the Company intends to settle its current tax assets and liabilities on a net basis.
3.23 Owners’ equity
Contributed capital from shareholders
Contributed capital from stock issuance is recorded at account charter capital in par value.
Undistributed profit
Undistributed profit comprises of realized and unrealized undistributed profit.
Unrealized profit of the year is total difference between gain or loss arising from revaluation of financial assets at FVTPL or other financial assets which are in the financial assets portfolio of the Company, charged into the income statement.
Realized profit during the year is the net difference between total revenue, income and total expenses in the income statement of the Company, except for gain or loss arising from revaluation of financial assets recognized in unrealized profit.
Reserve
According to Circular No. 146/2014/TT-BTC issued by the Ministry of Finance on 6 October 2014, securities companies are required to make appropriation of profit after tax to make the following reserves:
B09-CTCK B09-CTCK
NOTES TO THE FINANCIAL STATEMENTS (continued)as at and for the year ended 31 December 2016
NOTES TO THE FINANCIAL STATEMENTS (continued)as at and for the year ended 31 December 2016
OPPORTUNITIES122 HSC ANNUAL REPORT 2016 123

3. SUMMARY OF SIGNIFICANT ACCOUNTING POLICIES (continued)
3.23 Owners’ equity (continued)
Percentage of profitaftertax Maximumlevel
Charter capital supplementary reserve 5% 10% of share capitalFinancial and operational risk reserve 5% 10% of share capital
Other reserves are created in accordance with the Resolution of the General Meeting of Shareholders.
Financial and operational risk reserve is used to compensate for remaining loss, property damage arising in business after receiving indemnity from related organization, individual, insurance company.
3.24 Appropriation of net profits
Net profit after tax is available for appropriation to investors/shareholders after approval by the shareholders at the Annual General Meeting, and after making appropriation to reserve funds as required by the Company’s Charter and Vietnam’s regulatory requirements.
3.25 Item with nil balance
The items those are not presented in the financial statements according to Circular No. 210/2014/TT-BTC dated 30 December 2014, Circular No. 334/2016/TT-BTC dated 27 December 2016 and Circular No.146/2014/TT-BTC dated 6 October 2014 issued by the MOF are items with nil balance.
4. CASH AND CASH EQUIVALENTS
Ending balanceVND
Beginning balanceVND
Cash on hand 614,575,794 720,277,993
Cash at banks for the Company’s operation 59,579,109,106 163,426,982,820
Total 60,193,684,900 164,147,260,813
5. VALUE AND VOLUME OF TRADING RESULTS IN THE YEAR
Trading volume in the year
(units)
Trading value in the year
VND
a. The Company 158,287,247 8,291,248,664,840
- Shares 103,287,247 2,503,711,664,840
- Bonds 55,000,000 5,787,537,000,000
b. Investors 8,340,677,042 281,015,981,320,673
- Shares 7,187,322,623 163,361,646,886,860
- Bonds 1,153,354,419 117,654,334,433,813
Total 8,498,964,289 289,307,229,985,513
B09-CTCK B09-CTCK
NOTES TO THE FINANCIAL STATEMENTS (continued)as at and for the year ended 31 December 2016
NOTES TO THE FINANCIAL STATEMENTS (continued)as at and for the year ended 31 December 2016
OPPORTUNITIES124 HSC ANNUAL REPORT 2016 125

6.
FIN
ANCI
AL A
SSET
S
6.1
Fi
nanc
ial a
sset
s at f
air v
alue
thro
ugh
prof
it an
d lo
ss (F
VTPL
)
Endi
ng b
alan
ceBe
ginn
ing
bala
nce
Cost
VN
DFa
ir va
lue
VND
Cost
VN
DFa
ir va
lue
VND
List
ed sh
ares
116,
041,
876,
192
115,
341,
556,
730
80,4
39,1
56,1
1172
,922
,670
,698
FPT
Corp
orat
ion
(FPT
)28
,077
,095
,326
26,5
98,1
76,0
0072
2,29
8,60
372
4,06
5,30
0Th
e gi
oi D
i don
g Jo
int S
tock
Com
pany
(MW
G)18
,645
,308
,328
19,1
87,2
20,0
0047
0,29
1,85
847
1,62
8,00
0GT
NFO
ODS
Sto
ck C
ompa
ny (G
TN)
17,5
00,0
85,5
0020
,750
,083
,000
--
SaiG
on B
eer A
lcoh
ol a
nd B
ever
ages
Jo
int S
tock
Cor
pora
tion
(SAB
)15
,239
,160
,000
15,6
75,6
33,0
00-
-
ETF
VFM
VN30
Fun
d (V
FMVN
30)
10,6
03,0
43,0
7810
,798
,506
,000
8,45
3,32
3,52
98,
677,
824,
000
Viet
tron
ics T
an B
inh
Join
t Sto
ck C
ompa
ny (V
TB)
8,16
8,46
4,21
25,
532,
492,
800
8,16
8,46
4,26
45,
618,
938,
000
Oth
er sh
ares
17,8
08,7
19,7
4816
,799
,445
,930
62,6
24,7
77,8
5757
,430
,215
,398
Unl
iste
d sh
ares
246,
484,
721,
548
191,
030,
138,
825
109,
640,
193,
548
59,2
52,2
02,7
96Vi
etFu
nd M
anag
ent
21,8
03,6
40,0
0021
,803
,640
,000
21,8
03,6
40,0
0021
,803
,640
,000
HD
Sais
on F
inan
ce C
o., L
td17
,000
,000
,000
17,0
00,0
00,0
0017
,000
,000
,000
17,0
00,0
00,0
00Do
ngA
Join
t Sto
ck C
omm
erci
al B
ank
16,9
67,9
99,5
021,
511,
472,
000
16,9
67,9
99,5
025,
542,
064,
000
Tan
Binh
Rea
l Est
ate
Join
t Sto
ck C
ompa
ny12
,025
,000
,000
6,30
0,00
0,00
012
,025
,000
,000
6,52
0,50
0,00
0Ca
Mau
Sea
food
Joi
nt S
tock
Com
pany
10,9
50,0
00,0
0058
5,00
0,00
010
,950
,000
,000
585,
000,
000
Min
h H
ai E
xpor
t Fro
zen
Seaf
ood
Proc
essi
ng J
oint
-Sto
ck
Com
pany
8,00
0,00
0,00
033
0,00
0,00
08,
000,
000,
000
330,
000,
000
Spec
ial A
quat
ic P
rodu
cts J
oint
-Sto
ck C
ompa
ny7,
550,
000,
000
2,16
0,00
0,00
07,
550,
000,
000
2,16
0,00
0,00
0Ca
n Th
o Im
port
- Ex
port
Sea
food
Joi
nt S
tock
Com
pany
4,90
0,00
0,00
01,
586,
117,
750
4,90
0,00
0,00
01,
586,
117,
750
Oth
er sh
ares
14
7,28
8,08
2,04
613
9,75
3,90
9,07
510
,443
,554
,046
3,72
4,88
1,04
6
Tota
l36
2,52
6,59
7,74
030
6,37
1,69
5,55
519
0,07
9,34
9,65
913
2,17
4,87
3,49
4
6.
FIN
ANCI
AL A
SSET
S (c
ontin
ued)
6.2
Loan
s
Endi
ng b
alan
ceBe
ginn
ing
bala
nce
Cost
VN
DFa
ir va
lue
VND
Cost
VN
DFa
ir va
lue
VND
Rece
ivab
les f
rom
mar
gin
2,66
6,33
0,63
6,11
92,
666,
330,
636,
119
2,51
5,79
7,57
4,07
12,
515,
797,
574,
071
Rece
ivab
les f
rom
adv
ance
to c
usto
mer
s84
,614
,597
,275
84,6
14,5
97,2
7593
,807
,200
,459
93,8
07,2
00,4
59To
tal
2,75
0,94
5,23
3,39
42,
750,
945,
233,
394
2,60
9,60
4,77
4,53
02,
609,
604,
774,
530
(*)
Fair
valu
e in
clud
e ac
crue
d in
tere
st fr
om m
argi
n an
d ex
clud
e pr
ovis
ion.
6.3
Stat
emen
t of c
hang
es in
mar
ket v
alue
s of f
inan
cial
ass
ets
No.
Type
s of
finan
cial
asse
ts
Endi
ng b
alan
ceBe
ginn
ing
bala
nce
Cost
VN
D
Mar
ket v
alue
or
fair
valu
e VN
D
Reva
luat
iondiffe
renc
eRe
valu
atio
n va
lue
VND
Cost
VN
D
Mar
ket v
alue
or
fair
valu
e VN
D
Reva
luat
iondiffe
renc
eRe
valu
atio
n va
lue
VND
Incr
ease
VN
DDe
crea
se
VND
Incr
ease
VND
Decr
ease
VND
IFV
TPL
362,
526,
597,
740
306,
371,
695,
555
5,24
6,16
9,97
9(6
1,40
1,07
2,16
4)30
6,37
1,69
5,55
519
0,07
9,34
9,65
913
2,17
4,87
3,49
4-
(57,
904,
476,
165)
132,
174,
873,
494
1Li
sted
sh
ares
116,
041,
876,
192
115,
341,
556,
730
5,24
6,16
9,97
9(5
,946
,489
,441
)11
5,34
1,55
6,73
080
,439
,156
,111
72,9
22,6
70,6
98-
(7,5
16,4
85,4
13)
72,9
22,6
70,6
98
2Un
liste
d sh
ares
246,
484,
721,
548
191,
030,
138,
825
-(5
5,45
4,58
2,72
3)19
1,03
0,13
8,82
510
9,64
0,19
3,54
859
,252
,202
,796
-(5
0,38
7,99
0,75
2)59
,252
,202
,796
Tota
l36
2,52
6,59
7,74
030
6,37
1,69
5,55
55,
246,
169,
979
(61,
401,
072,
164)
306,
371,
695,
555
190,
079,
349,
659
132,
174,
873,
494
-(5
7,90
4,47
6,16
5)13
2,17
4,87
3,49
4
6.4
Prov
isio
n fo
r im
pair
men
t of f
inan
cial
ass
ets a
nd p
ledg
ed a
sset
Begi
nnin
g pr
ovis
ion
VND
Addi
tion
in y
ear
VND
Reve
rsal
in y
ear
VND
Endi
ng p
rovi
sion
VND
Prov
isio
n fo
r im
pairm
ent o
f loa
ns
-19
,997
,479
,770
-19
,997
,479
,770
B09-
CTCK
B09-
CTCK
NO
TES
TO T
HE
FIN
ANCI
AL S
TATE
MEN
TS (c
ontin
ued)
as a
t and
for t
he y
ear e
nded
31
Dece
mbe
r 201
6
NO
TES
TO T
HE
FIN
ANCI
AL S
TATE
MEN
TS (c
ontin
ued)
as a
t and
for t
he y
ear e
nded
31
Dece
mbe
r 201
6
OPPORTUNITIES126 HSC ANNUAL REPORT 2016 127

7 RECEIVABLES
Ending balanceVND
Beginning balanceVND
1. Receivables from services provided by the Company 370,008,403,676 57,145,417,513In which Receivables from VSD (i) 312,618,075,234 19,796,209,060Receivables from purchasing securities (ii) 51,168,439,301 -Receivables from other activities 6,221,889,141 37,349,208,453
2. Other receivables 35,167,679,780 18,745,163,406In which: Accrued interest 1,817,395,834 2,178,573,612
3. Provision for impairment of financial assets (iii) (34,910,725,751) (16,719,305,094)Total 370,265,357,705 59,171,275,825
(i) This is the receivables from VSD relating to selling securities for last 2 days. This amount is settled in the
subsequent days in 2017.
(ii) This is the receivables relating to securities purchasing of an organization VND 51,168,439,301 and it was paid on 3 January 2017.
(iii) Detailsofimpairmentoffinancialassetsareasbelow:
Beginning provisionVND
Addition in yearVND
Reversal in yearVND
Ending provisionVND
Provision for receivables from margin - individuals
- 18,191,420,657 - 18,191,420,657
Provision for impairment of bad debt
16,719,305,094 - - 16,719,305,094
+ Masan Corporation 1,145,650,000 - - 1,145,650,000 + Individuals (*) 15,573,655,094 - - 15,573,655,094Total 16,719,305,094 18,191,420,657 - 34,910,725,751
(*) Including in ending balance is bad debts amounting to VND15,443,787,994 related to buying securities transaction in which the investors lost settlement ability. These transactions incurred in previous years and fully made provison for bad debts.
8. OTHER CURRENT ASSETS
Ending balanceVND
Beginning balanceVND
Advances 433,534,797 154,469,078Short-term prepaid expense 4,052,697,143 4,637,718,956- Maintenance expenses 1,231,762,818 922,614,939- Used tools expenses 498,091,845 1,250,712,942- Other short-term prepaid expenses 2,322,842,480 2,464,391,075Deposits, collaterals and pledges 27,758,600 25,698,600Total 4,513,990,540 4,817,886,634
9. TANGIBLE FIXED ASSETS
Transportation vehicles VND
Officeequipment VND
Total VND
CostBeginning balance 3,474,189,544 39,922,963,076 43,397,152,620Additions 955,900,000 2,386,189,794 3,342,089,794Disposal (967,197,904) - (967,197,904)Ending balance 3,462,891,640 42,309,152,870 45,772,044,510
Accumulated depreciationBeginning balance 2,797,071,858 35,193,110,681 37,990,182,539Depreciation for the year 201,813,621 2,916,289,324 3,118,102,945Disposal (967,197,904) - (967,197,904)Ending balance 2,031,687,575 38,109,400,005 40,141,087,580
Net carrying amountBeginning balance 677,117,686 4,729,852,395 5,406,970,081Ending balance 1,431,204,065 4,199,752,865 5,630,956,930
Other information of tangible fixed assets:
Ending balance VND
Beginning balance VND
Cost of tangible fixed assets that were fully depreciated but still in use
35,220,524,705 34,583,132,500
10. INTANGIBLE FIXED ASSETS
ComputersoftwareVND
Cost: Beginning balance 28,463,749,200Additions 1,389,816,050Ending balance 29,853,565,250
Accumulated amortization:Beginning balance 23,565,051,233Amortization for the year 2,803,094,621Ending balance 26,368,145,854
Net carrying amount:Beginning balance 4,898,697,967Ending balance 3,485,419,396
B09-CTCK B09-CTCK
NOTES TO THE FINANCIAL STATEMENTS (continued)as at and for the year ended 31 December 2016
NOTES TO THE FINANCIAL STATEMENTS (continued)as at and for the year ended 31 December 2016
OPPORTUNITIES128 HSC ANNUAL REPORT 2016 129

10. INTANGIBLE FIXED ASSETS (continued)
Other information of intangible fixed assets:
Ending balanceVND
Beginning balanceVND
Cost of intangible fixed assets that were fully depreciated but still in use
21,990,858,667 21,494,156,067
11. CONSTRUCTIONS IN PROGRESS
Ending balanceVND
Beginning balanceVND
Software purchase 5,298,570,886 -Building systems 4,052,293,236 -Others assets 1,807,447,420 1,807,447,420Total 11,158,311,542 1,807,447,420
12. LONG-TERM PREPAID EXPENSES
Ending balanceVND
Beginning balanceVND
Prepaid office rentals 95,368,949,432 98,201,690,504Office renovation cost 723,757,334 1,174,321,586Office tools and equipment 68,128,134 136,277,778Total 96,160,834,900 99,512,289,868
13. ADVANCE TO SETTLEMENT ASSISTANCE FUND
Advances to settlement assistance fund represent amounts deposited at Vietnam Securities Depository.
According Decision No. 27/QD-VSD dated 13 March 2015 regarding the regulations on management and usage of the Assistance Fund issued by the General Director of the Vietnam Securities Depository, the Company must deposit an initial amount of VND120 million at the Vietnam Securities Depository and pay an addition of 0.01% of the total amount of brokered securities in the previous year, but not over VND2.5 billion per annum.
Details of the advance to settlement assistance fund are as follows:
Ending balanceVND
Beginning balanceVND
First payment 120,000,000 120,000,000Addition 18,224,666,297 15,898,049,571Received interest during the year 987,917,013 814,533,739
Total 19,332,583,310 16,832,583,310 14.
SH
ORT
-TER
M B
ORR
OW
INGS
AN
D FI
NAN
CIAL
LEA
SES
Inte
rest
rate
Begi
nnin
g ba
lanc
eAd
ditio
n Re
paym
ent
Endi
ng b
alan
ce%
/p.a
VND
VND
VND
VND
Shor
t-ter
m b
orro
win
gs (*
)7.
5-8.
040
0,00
0,00
0,00
06,
874,
899,
500,
000
(6,2
74,8
99,5
00,0
00)
1,00
0,00
0,00
0,00
0
Bank
ove
rdra
ft6.
0-6.
525
4,10
3,20
4,78
19,
041,
348,
435,
548
(9,2
95,4
51,6
40,3
29)
-
Tota
l65
4,10
3,20
4,78
115
,916
,247
,935
,548
(15,
570,
351,
140,
329)
1,00
0,00
0,00
0,00
0
(*) S
hort
-term
bor
row
ings
hav
e te
rm fr
om 1
to 3
mon
ths u
sed
for s
uppl
emen
t wor
king
capi
tal.
B09-
CTCK
NO
TES
TO T
HE
FIN
ANCI
AL S
TATE
MEN
TS (c
ontin
ued)
as a
t and
for t
he y
ear e
nded
31
Dece
mbe
r 201
6
OPPORTUNITIES 131
B09-CTCK
NOTES TO THE FINANCIAL STATEMENTS (continued)as at and for the year ended 31 December 2016
130 HSC ANNUAL REPORT 2016

15. PAYABLES FOR SECURITIES TRADING
Ending balanceVND
Beginning balance VND
Payables to investors for shares deposits 17,170,000,000 17,170,000,000
Payables to investors for selling transactions - 16,585,598,900
Other payables 15,440,005,800 98,873,437
Total 32,610,005,800 33,854,472,337
16. TAXATION AND OTHER STATUTORY OBLIGATIONS
Items
Beginning balance
VND
Payable in the year
VND
Paid in the year
VND
Ending balance
VND
Corporate income tax (Notes 24)
18,924,105,880 84,490,592,250 (74,560,483,150) 28,854,214,980
Personal income tax paid on behalf of investors
3,482,359,321 54,683,049,508 (54,618,360,856) 3,547,047,973
Personal income tax paid on behalf of foreign corporate
2,859,984,809 31,529,226,481 (30,316,080,562) 4,073,130,728
Contractors tax 960,919,772 3,693,121,908 (3,356,786,117) 1,297,255,563Personal income tax of employees
771,004,384 18,180,466,168 (17,918,381,363) 1,033,089,189
VAT tax 384,657,779 2,679,795,006 (2,728,349,855) 336,102,930
Excise tax - 3,000,000 (3,000,000) -
Total 27,383,031,945 195,259,251,321 (183,501,441,903) 39,140,841,363
17. SHORT-TERM ACCRUED EXPENSES
Ending balance
VNDBeginning balance
VND
Allowance for working performance payable to employees
12,000,000,000 12,000,000,000
Brokerage fee payables to SSC 4,733,085,057 3,953,370,562
Interest expenses 3,615,835,487 903,637,272
Others payables 3,502,849,447 1,113,563,930
Total 23,851,769,991 17,970,571,764
18. OTHER CURRENT LIABILITIES
Ending balance
VNDBeginning balance
VND
Dividends payables to shareholders of HSC 67,765,947,688 67,479,807,249Shares purchase right payables 35,453,170,000 214,740,000Dividends payables on behalf 2,566,598,772 1,933,445,349Other payables 3,025,391,752 954,816,940Total 108,811,108,212 70,582,809,538
19. OWNERS’ EQUITY
19.1 Owners’ equity
The Company’s shares are broken as follows:
Ending balanceUnit
Beginning balanceUnit
Authorized shares 127,256,758 127,256,758Common shares 127,256,758 127,256,758
Shares issued and fully paid 127,256,758 127,256,758Common shares 127,256,758 127,256,758
Treasury shares 101,390 71,341Common shares 101,390 71,341
Outstanding shares 127,155,368 127,185,417Common shares 127,155,368 127,185,417
19.2 Undistributed profit
Ending balanceVND
Beginning balanceVND
Realized profit 628,246,013,560 547,779,193,929Unrealized profit (56,154,902,185) (57,904,476,165)Total 572,091,111,375 489,874,717,764
B09-CTCK B09-CTCK
NOTES TO THE FINANCIAL STATEMENTS (continued)as at and for the year ended 31 December 2016
NOTES TO THE FINANCIAL STATEMENTS (continued)as at and for the year ended 31 December 2016
OPPORTUNITIES132 HSC ANNUAL REPORT 2016 133

19. OWNERS’ EQUITY (continued)
19.3 Dividends allocation to shareholders
Ending balanceVND
Beginning balance VND
Realized gain from previous year (01/01/2016 and 01/01/2015) 547,779,193,929 671,690,552,525Unrealized loss in year (at 31/12/2016 and 31/12/2015) (56,154,902,185) (57,904,476,165)Realized gain in year 302,781,407,323 188,967,953,401Undistributed retain earning allocatied to shareholders 794,405,699,067 802,754,029,761Reserves made for current year (40,478,672,852) (45,780,893,097)Dividends distributed to shareholders for current year (181,835,914,840) (267,098,418,900)Total dividens distributed to shareholders 572,091,111,375 489,874,717,764
20. DISCLOSURE OF OFF BALANCE SHEET ITEMS
20.1 Write-off bad debts Ending balance
VNDBeginning balance
VND
Other receivables 345,059,000 345,059,000
20.2 Foreign currencyEnding balance Beginning balance
USD 45,182.58 40,192.22Yen 190,755 190,755Singapore Dollar 300 300Pound 100 -Taiwan Dollar 3,200 3,200Canada Dollar 100 100
20.3 Outstanding shares Ending balance
SharesBeginning balance
Shares
Detail in types <= 1 year 127,155,368 127,185,417
20.4 Treasury sharesEnding balance
SharesBeginning balance
Shares
Detail in types <= 1 year 101,390 71,341
20. DISCLOSURE OF OFF BALANCE SHEET ITEMS (continued)
20.5 Financial assets listed/registered at VSD of company
Ending balance VND
Beginning balance VND
Financial assetUnrestricted trading financial assets 39,289,910,000 40,168,410,000Restricted financial assets 585,000,000 585,000,000Financial assets awaiting for settlement 34,303,700,000 3,149,700,000Total 74,178,610,000 43,903,110,000
20.6 Non-traded financial assets of the Company deposited at VSD
Ending balanceVND
Beginning balanceVND
Financial assetUnrestricted and non-traded financial assets deposited at VSD 1,010,000 10,000
20.7 The Company’s awaiting financial assets
Ending balanceVND
Beginning balanceVND
Financial assetThe Company’s awaiting financial assets 2,099,960,000 1,569,680,000
20.8 Financial assets of the Company are not deposited at VSD
Ending balanceVND
Beginning balanceVND
Financial assetFinancial assets of the Company are not deposited at VSD 60,297,270,000 44,914,770,000
20.9 Financial assets of investors listed/registered at VSD
Ending balanceVND
Beginning balanceVND
Financial assetUnrestricted and traded financial assets 10,695,622,580,000 9,417,540,880,000Restricted financial assets 12,819,940,000 40,833,600,000Mortgaged financial assets 1,964,810,500,000 561,031,770,000Blocked financial assets 90,276,820,000 180,000,000Financial assets awaiting settlement 228,833,260,000 245,130,660,000
Total 12,992,363,100,000 10,264,716,910,000
B09-CTCK B09-CTCK
NOTES TO THE FINANCIAL STATEMENTS (continued)as at and for the year ended 31 December 2016
NOTES TO THE FINANCIAL STATEMENTS (continued)as at and for the year ended 31 December 2016
OPPORTUNITIES134 HSC ANNUAL REPORT 2016 135

20. DISCLOSURE OF OFF BALANCE SHEET ITEMS (continued)
20.10 Investors’ non-traded financial assets deposited at VSD
Ending balanceVND
Beginning balanceVND
Financial asset
Unrestricted and non-traded financial assets deposited at VSD 22,049,360,000 7,589,070,000
Restricted and non-traded financial assets deposited at VSD 16,828,650,000 7,016,060,000
Total 38,878,010,000 14,605,130,000
20.11 Investors’ awaiting financial assets
Ending balanceVND
Beginning balance VND
Financial asset
Investors’ awaiting financial assets 219,655,840,000 241,716,160,000
20.12 Investors’ deposits
Ending balanceVND
Beginning balance VND
Financial assetInvestors’ deposits for securities trading activities managed by the Company
581,883,723,061 493,009,558,764
20.13 Payables to investors relating to deposits for securities trading activities managed by the Company
Ending balanceVND
Beginning balance VND
Liabilities
Payables to investors - Deposits of investors for securities trading activities managed by the Company
581,883,723,061 493,009,558,764
Domestic investors 581,657,003,061 492,931,698,764
Foreign investors 226,720,000 77,860,000
Total 581,883,723,061 493,009,558,76421
. GA
IN, L
OSS
FRO
M F
INAN
CIAL
ASS
ETS
21.1
. Ga
in, l
oss f
rom
sale
of f
inan
cial
ass
ets a
t FVT
PL
Fina
ncia
l ass
ets
Qua
ntity
Selli
ng
pric
e
VND
Proc
eeds
VN
D
Wei
ghte
d av
erag
e co
st
at th
e en
d of
tr
ansa
ctio
n da
te
VND
Gain
from
sale
in th
e cu
rren
t yea
r VN
D
Loss
from
sale
in
the
curr
ent y
ear
VND
Accu
mul
ated
ga
in, l
oss f
rom
sa
le in
the
curr
ent y
ear
VND
Accu
mul
ated
ga
in, l
oss f
rom
sa
le o
ver t
he
prev
ious
yea
r VN
D
List
ed sh
ares
The
gioi
Di d
ong
Join
t St
ock
Com
pany
1,61
1,01
016
0,51
325
8,58
8,49
1,00
014
4,68
125
,506
,364
,093
(1,1
12,8
90)
25,5
05,2
51,2
03-
NoV
a la
nd in
vest
men
t gr
oup
corp
orat
ion
2,10
0,00
055
,800
117,
180,
000,
000
50,0
0012
,180
,000
,000
- 12
,180
,000
,000
-
Viet
nam
Dia
ry p
rodu
cts
Join
t Sto
ck c
ompa
ny86
5,67
097
,603
84,4
92,0
21,0
0011
2,34
04,
390,
011,
158
(109
,880
,946
)4,
280,
130,
212
2,30
2,18
5,33
2
ETF
VFM
VN30
Fun
d42
,023
,410
6,43
327
0,34
6,52
0,72
06,
377
3,86
6,32
7,92
1(1
,520
,162
,592
)2,
346,
165,
329
(5,5
16,6
98,5
56)
Hoa
Sen
gro
up (H
SG)
1,33
9,79
938
,239
51,2
32,6
85,0
0036
,892
2,12
0,99
5,88
1(3
16,6
21,5
03)
1,80
4,37
4,37
8(2
7,59
6,62
9)Sa
iGon
Bee
r Alc
ohol
an
d Be
vera
ges J
oint
St
ock
Corp
orat
ion
427,
600
85,0
0036
,346
,000
,000
80,7
511,
816,
950,
000
- 1,
816,
950,
000
7,25
4,79
2,09
1
Hoa
Pha
t Gro
up4,
318,
550
32,3
8613
9,85
9,71
4,00
032
,259
4,59
1,05
6,16
4(4
,041
,759
,493
)54
9,29
6,67
1(2
,002
,906
,272
)Th
anh
Cong
text
ile
garm
ent i
nves
tmen
t tr
adin
g jo
int s
tock
co
mpa
ny
570,
890
27,7
8515
,862
,263
,000
34,0
6553
6(3
,585
,110
,959
)(3
,585
,110
,423
)11
6,56
5,79
3
Oth
er sh
ares
29,3
09,6
0714
,546
426,
328,
949,
105
14,4
467,
189,
800,
339
(4,2
58,7
36,4
32)
2,93
1,06
3,90
7(3
7,76
0,53
4,96
4)
Unl
iste
d sh
ares
168,
547
6,57
41,
108,
000,
000
7,81
522
5,50
0,00
0(4
34,6
38,0
87)
(209
,138
,087
)13
,160
,990
,429
Bond
1,00
0,00
099
,902
99,9
01,5
00,0
0099
,895
7,00
0,00
0-
7,00
0,00
01,
545,
900,
000
Tota
l83
,735
,083
1,50
1,24
6,14
3,82
561
,894
,006
,092
(14,
268,
022,
902)
47,6
25,9
83,1
90(2
0,92
7,30
2,77
6)
B09-
CTCK
NO
TES
TO T
HE
FIN
ANCI
AL S
TATE
MEN
TS (c
ontin
ued)
as a
t and
for t
he y
ear e
nded
31
Dece
mbe
r 201
6
OPPORTUNITIES 137
B09-CTCK
NOTES TO THE FINANCIAL STATEMENTS (continued)as at and for the year ended 31 December 2016
136 HSC ANNUAL REPORT 2016

21.2
. Ga
in, l
oss f
rom
reva
luat
ion
of fi
nanc
ial a
sset
s
No.
Fina
ncia
l ass
ets
Cost
Mar
ket v
alue
or F
air v
alue
Reva
luat
ion
diffe
renc
eas
at
31 D
ecem
ber 2
016
Reva
luat
ion
diffe
renc
eas
at
31 D
ecem
ber 2
015
Adju
stm
ent
diffe
renc
ein
th
is y
ear
VND
VND
VND
VND
VND
IFV
TPL
1Li
sted
shar
es
FPT
Corp
orat
ion
28,0
77,0
95,3
2626
,598
,176
,000
(1,4
78,9
19,3
26)
- (1
,478
,919
,326
)
Hoa
ng H
uy In
vest
men
t Ser
vice
s Joi
nt st
ock
com
pany
2,24
0,04
2,39
076
4,42
9,12
0(1
,475
,613
,270
)(2
,381
,604
)(1
,473
,231
,666
)
Viet
tron
ics T
an B
inh
Join
t Sto
ck C
ompa
ny8,
168,
464,
212
5,53
2,49
2,80
0(2
,635
,971
,412
)(2
,549
,526
,264
)(8
6,44
5,14
8)
GTN
FOO
DS S
tock
Com
pany
17,5
00,0
85,5
0020
,750
,083
,000
3,24
9,99
7,50
0-
3,24
9,99
7,50
0
Oth
er sh
ares
60,0
56,1
88,7
6461
,696
,362
,839
1,64
0,17
4,07
5(4
,964
,577
,545
)6,
604,
751,
620
2U
nlis
ted
shar
es
Dong
A C
omm
erci
al J
oint
Sto
ck B
ank
16,9
67,9
99,5
02
1,51
1,47
2,00
0 (1
5,45
6,52
7,50
2)(1
1,42
5,93
5,50
2)(4
,030
,592
,000
)
Ca M
au S
eafo
od J
oint
Sto
ck C
ompa
ny10
,950
,000
,000
585,
000,
000
(10,
365,
000,
000)
(10,
365,
030,
000)
30,0
00
Min
h H
ai E
xpor
t Fro
zen
Seaf
ood
Proc
essi
ng
Join
t-Sto
ck C
ompa
ny8,
000,
000,
000
330,
000,
000
(7,6
70,0
00,0
00)
(7,6
70,0
00,0
00)
-
Tan
Binh
Rea
l-Est
ate
Join
t Sto
ck C
ompa
ny12
,025
,000
,000
6,30
0,00
0,00
0(5
,725
,000
,000
)(5
,715
,000
,000
)(1
0,00
0,00
0)
Spec
ial A
quat
ic P
rodu
cts J
oint
-Sto
ck
Com
pany
7,55
0,00
0,00
0 2,
160,
000,
000
(5,3
90,0
00,0
00)
(5,3
89,9
83,0
00)
(17,
000)
VASS
Insu
ranc
e Co
pora
tion
5,44
2,60
0,00
0
114
,000
,000
(5
,328
,600
,000
)
(4,3
02,6
00,0
00)
(1,0
26,0
00,0
00)
Can
Tho
Impo
rt -
Expo
rt S
eafo
od J
oint
Sto
ck
Com
pany
4,9
00,0
00,0
00
1,
586,
117,
750
(3,3
13,8
82,2
50)
(3
,313
,882
,250
)-
Saig
on P
oste
l Cor
pora
tion
4,
406,
400,
000
2,2
00,8
40,0
00
(2,2
05,5
60,0
00)
(
2,20
5,56
0,00
0)-
Oth
ers
176,
242,
722,
046
176,
242,
722,
046
- -
Tota
l36
2,52
6,59
7,74
030
6,37
1,69
5,55
5(5
6,15
4,90
2,18
5)(5
7,90
4,47
6,16
5)1,
749,
573,
980
21. GAIN, LOSS FROM FINANCIAL ASSETS (continued)
21.3 Dividend, interest income from financial assets at FVTPL, loans and receivables
Current yearVND
Previous yearVND
From financial assets at FVTPL 31,884,514,133 60,357,091,886From loans and receivables 343,656,813,084 222,636,416,529Total 375,541,327,217 282,993,508,415
21.4 Revenue other than gain from financial assets
Current yearVND
Previous yearVND
Revenue from brokerage services 348,957,129,710 262,076,234,335Revenue from financial advisory services 24,601,902,383 11,154,708,555Revenue from securities custodian services 5,056,975,249 3,952,302,881Other operating incomes 1,868,685,936 1,574,822,296Total 380,484,693,278 278,758,068,067
22. OPERATING EXPENSES
Current yearVND
Previous yearVND
Expenses for brokerage services 206,830,545,356 168,468,781,630Borrowing costs to loan 45,566,564,138 7,390,345,537Provision for impairment of loans 19,997,479,770 -Expenses for propriety trading activities 23,567,021,196 11,949,061,177Expenses for investment advisory services 9,996,332,411 9,705,218,891Expenses for securities custodian services 5,096,284,054 4,025,649,485Other operating expenses 18,865,791,047 4,103,170,938Total 329,920,017,972 205,642,227,658
23. GENERAL AND ADMINISTRATIVE EXPENSES
Current yearVND
Previous yearVND
Payroll expenses for administration 47,531,725,142 45,672,125,665- Salary and bonus 42,165,802,383 40,591,862,373- Social insurance, health insurance, union fee and
unemployment insurance5,365,922,759 5,080,263,292
External service expenses 14,385,518,961 13,952,908,556Depreciation and amortization expenses 3,307,473,096 3,330,712,864Tools and equipment expense 666,139,870 933,546,395Tax and fee expenses 360,014,678 352,792,601Other expenses 25,715,369,565 24,628,177,922Total 91,966,241,312 88,870,264,003
B09-CTCK
NOTES TO THE FINANCIAL STATEMENTS (continued)as at and for the year ended 31 December 2016
OPPORTUNITIES 139
B09-
CTCK
NO
TES
TO T
HE
FIN
ANCI
AL S
TATE
MEN
TS (c
ontin
ued)
as a
t and
for t
he y
ear e
nded
31
Dece
mbe
r 201
6
138 HSC ANNUAL REPORT 2016

24. CORPORATE INCOME TAX
The statutory CIT rate applicable to the Company is 20% of taxable profits from 00202016 (2015: 22%).
The tax returns filed by the Company are subject to examination by the tax authorities. As the application of tax laws and regulations is susceptible to varying interpretations, the amounts reported in the financial statements could change later upon final determination by the tax authorities.
24.1 Corporate income tax expense
Current yearVND
Previous yearVND
Current income tax expense (84,490,592,250) (58,810,888,290)Adjustment for reverse of impairment of unlisted securities in previous years.
- 620,797,070
Deferred income tax income 3,638,284,131 -Total (80,852,308,119) (58,190,091,220)
The estimated current corporate income tax in this year and prior year is represented in the table below:
Current yearVND
Previous yearVND
Profit before tax 385,383,289,422 271,500,191,481Estimated CIT with current tax rate 77,076,657,884 59,730,042,126Adjustment to increase- Non-deductible expenses 228,719,299 254,048,930- Provision for bad debts 7,637,780,085 -Adjustment to decreaseReceived dividend (452,565,018) (1,173,202,766)CIT adjustment due to reversal provision for decrease in OTC securities in previous years
- (620,797,070)
CIT expense 84,490,592,250 58,190,091,220
24.2. Current corporate income tax
The current tax payable is based on taxable profit for the year. The taxable profit of the Company for the year differs from the profit as reported in the income statement because it excludes items of income or expense that are taxable or deductible in other years and it further excludes items that are not taxable or deductible. The Company’s liability for current tax is calculated using tax rates that have been enacted by the reporting date.
24.3. Deferred corporate income tax
Details of deferred income tax in the year are as follows:Current year
VNDPrevious year
VND
Deferred tax assetBeginning Balance - -Deferred income tax in the year 3,638,284,131 -Ending balance 3,638,284,131 -
24. CORPORATE INCOME TAX (continued)
24.3. Deferred corporate income tax (continued)
The following are the deferred tax assets and deferred tax liabilities recognized by the Company for the provision of bad debts which are not yet deductible.
Statementoffinancialposition Income statement
Ending balance
Beginning balance
Current year
Previous balance
VND VND VND VND
Provision for doubtful debts 3,638,284,131 - 3,638,284,131 -
3,638,284,131 -Net deferred tax credit to income statement
3,638,284,131 -
B09-CTCK B09-CTCK
NOTES TO THE FINANCIAL STATEMENTS (continued)as at and for the year ended 31 December 2016
NOTES TO THE FINANCIAL STATEMENTS (continued)as at and for the year ended 31 December 2016
OPPORTUNITIES140 HSC ANNUAL REPORT 2016 141

25 OTHER INFORMATION
25.1 Related party transactions
List of the related parties and the relationship with the Company are as follows:
Related parties Relationship
Dragon Capital Markets Limited (DC) Strategic shareholder – holding 30.87% of share capital.The Company’s Vice Chairman of the Board of Directors is the Deputy General Director of DC Group.The Company’s member of the Board of Directors, cum Chief Executive Officer is representative for DC’s shares.
Ho Chi Minh Finance and Investment State-owned Company (HFIC)
Strategic shareholder – holding 29.47% of share capital.The Company’s Vice Chairman of the Board of Directors is the Deputy Director of HFIC.The Company’s member of the Board of Directors is Deputy Head of Finance and accounting Department at HFIC.
Vietnam Debt Fund SPC (VDF) DC’s subsidiary
Vietnam Enterprise Investments DC’s subsidiary
Amersham Industries Limited DC’s subsidiary
Vietnam Property Fund Limited DC’s subsidiary
Cam Vietnam Mother Fund DC’s subsidiary
DC Developing Markets Strategies Public Limited Company
DC’s subsidiary
Significant transactions with related parties during the year are as follows:
Related parties TransactionsCurrent year
VNDPrevious year
VND
Dragon Capital Markets Limited
Brokerage service - Purchasing securities 292,355,597,000 -
Brokerage service - Selling securities 15,870,000,000 70,436,770,000
Brokerage income 392,876,146 105,655,155
Paid dividend 56,168,698,300 82,485,501,000
Advisory expenses 8,783,430,000 9,618,991,691
Ho Chi Minh City Fund and Investment Corporation
Paid dividend 53,625,000,000 78,750,000,000
Vietnam Debt Fund SPC Brokerage service - Purchasing securities - 312,443,000,000
Brokerage service - Selling securities - 305,571,036,000
Brokerage income - 164,906,482
25.1 Related party transactions
Significant transactions with related parties during the year are as follows: (continued)
Related parties TransactionsCurrent year
VNDPrevious year
VND
Vietnam Enterprise Investments Limited
Brokerage service - Purchasing securities 124,900,609,000 295,550,719,600
Brokerage service - Selling securities 369,626,470,740 852,530,825,880
Brokerage income 741,790,624 1,722,122,409
Cam Vietnam Mother Fund
Brokerage service - Purchasing securities 756,183,382,010 198,587,753,000
Brokerage service - Selling securities 593,140,632,250 298,402,500,000
Brokerage income 1,949,211,849 723,417,899
DC Developing Markets Strategies Public Limited Company
Brokerage service - Purchasing securities 180,559,543,020 47,363,399,000
Brokerage service - Selling securities 61,205,063,300 85,969,849,300
Brokerage income 362,636,637 199,999,952
Amersham Industries Limited
Brokerage service - Purchasing securities 291,458,104,000 177,658,936,820Brokerage service - Selling securities 894,831,199,210 573,694,428,940Brokerage income 1,779,433,967 1,127,030,325
Vietnam Property Fund Limited
Brokerage service - Selling securities 72,177,700,000 64,959,176,200Brokerage income 108,266,550 97,438,764
The Board of Directors, the Board of Supervisors and the Board of Management
Remuneration and salary 17,849,168,003 17,546,041,623
Amounts due to related parties at the statement of financial position date are as follows:
Related parties TransactionsEnding balance
VND
Beginning balance
VND
Dragon Capital Markets Limited Dividend payable (19,639,405,000) (19,639,405,000)
Ho Chi Minh City Fund and Investment Corporation
Dividend payable (18,750,000,000) (18,750,000,000)
Deposits for trading securities (24,829,079) (24,630,766)
B09-CTCK B09-CTCK
NOTES TO THE FINANCIAL STATEMENTS (continued)as at and for the year ended 31 December 2016
NOTES TO THE FINANCIAL STATEMENTS (continued)as at and for the year ended 31 December 2016
OPPORTUNITIES142 HSC ANNUAL REPORT 2016 143

25
OTH
ER IN
FORM
ATIO
N (c
ontin
ued)
25.2
. Se
gmen
t inf
orm
atio
n
Bu
sine
ss se
gmen
t
Info
rmat
ion
of b
usin
ess s
egm
ent’s
reve
nue,
pro
fit, a
sset
s and
liab
ilitie
s of d
epar
tmen
ts in
diff
eren
t bus
ines
s seg
men
ts o
f the
Com
pany
as b
elow
:
Brok
erag
e an
d cu
stom
er se
rvic
esVN
DTr
adin
gVN
D
Advi
sory
se
rvic
esVN
D
Trea
sury
ac
tiviti
esVN
D
Oth
er
segm
ents
VND
Una
lloca
ted
VND
Tota
l VN
D
Forthe
fina
ncialy
eare
nded
31De
cembe
r201
61.
Re
venu
e fro
m
oper
atin
g ac
tiviti
es35
4,01
4,10
4,95
969
,534
,501
,163
24,6
01,9
02,3
8337
4,22
5,38
2,25
91,
868,
685,
936
-82
4,24
4,57
6,70
0
2.
Dire
ct c
osts
(209
,280
,361
,869
)(2
3,56
4,58
0,44
2)(9
,986
,822
,868
)(1
90,2
23,5
45,0
50)
(674
,370
,390
)-
(433
,729
,680
,619
)3.
De
prec
iatio
n an
d am
ortiz
atio
n(2
,646
,467
,541
)(2
,440
,754
)(9
,509
,543
)(2
,507
,941
,174
)(7
54,8
38,5
54)
-(5
,921
,197
,566
)
4.
Oth
er p
rofit
--
--
789,
590,
907
-78
9,59
0,90
7
Prof
it be
fore
tax
142,
087,
275,
549
45,9
67,4
79,9
6714
,605
,569
,972
181,
493,
896,
035
1,22
9,06
7,89
9-
385,
383,
289,
422
As a
t 31
Dece
mbe
r 201
6
1.
Segm
ent a
sset
s2,
609,
803,
706,
178
306,
371,
695,
555
-58
9,08
8,35
6,87
456
2,88
4,69
8-
3,50
5,82
6,64
3,30
5
2.
Allo
cate
d as
sets
85,0
23,6
36,2
3774
8,44
7,50
21,
796,
274,
005
4,19
1,30
6,01
213
,172
,676
,036
-10
4,93
2,33
9,79
2
3.
Una
lloca
ted
asse
ts-
--
--
6,08
3,35
1,59
16,
083,
351,
591
Tota
l ass
ets
2,69
4,82
7,34
2,41
530
7,12
0,14
3,05
71,
796,
274,
005
593,
279,
662,
886
13,7
35,5
60,7
346,
083,
351,
591
3,61
6,84
2,33
4,68
8
1.
Segm
ent l
iabi
litie
s73
,227
,381
,323
--
1,00
8,49
1,17
0,00
01,
221,
786,
220
-1,
082,
940,
337,
543
2.
Una
lloca
ted
liabi
litie
s-
--
--
141,
984,
545,
882
141,
984,
545,
882
Tota
l lia
bilit
ies
73,2
27,3
81,3
23-
-1,
008,
491,
170,
000
1,22
1,78
6,22
014
1,98
4,54
5,88
21,
224,
924,
883,
425
Geog
raph
ical
segm
ent
All o
pera
tions
of t
he C
ompa
ny a
re ta
ken
plac
e w
ithin
Vie
tnam
terr
itory
.
25 OTHER INFORMATION (continued)
25.3. Operating lease commitments
The Company leases its offices under operating lease agreements as at 31 December 2016, the operating lease commitment payables under the operating lease agreements as follow:
Ending balanceVND
Beginning balanceVND
Less than 1 year 10,316,776,453 14,971,363,980
From 1 - 5 years 19,649,844,390 32,425,760,135
TOTAL 29,966,620,843 47,397,124,115
25.4. Earnings per share
Basic earnings per share amounts are calculated by dividing net profit after tax for the year attributable to ordinary shareholders of the Company (after adjusting for the bonus and welfare fund) by the weighted average number of ordinary shares outstanding during the year.
Diluted earnings per share amounts are calculated by dividing the net profit after tax attributable to ordinary equity holders of the Company (after adjusting for interest on the convertible preference shares) by the weighted average number of ordinary shares outstanding during the year plus the weighted average number of ordinary shares that would be issued on conversion of all the dilutive potential ordinary shares into ordinary shares.
The following reflects the income and share data used in the basic and diluted earnings per share computations.
Current year Previous year
Net profit after tax - VND 304,530,981,303 213,310,100,261
Bonus and welfare fund - VND - (10,025,574,712)
Net profit attributable to ordinary equity holders for calculation of basic earnings per share - VND
304,530,981,303 203,284,525,549
Weighted average number of ordinary shares for basic earnings per share calculation(number of shares)
127,167,449 127,201,122
Basic earnings per share - VND 2,395 1,598
According to resolution of shareholders meeting No.01/2015/NQ-DHCD at 21 April 2016, the Company has made an adjustment and restatement of profit used to calculate earnings per share in the 2015 financial statements to reflect the creation of actual bonus and welfare fund for the year ended 31 December 2015. Profit used to compute earning per share for 2016 was not adjusted for the creation of 2016 bonus and welfare as resolution of the shareholders meeting on the distribution of the profit after tax of the current year is not yet avaiable.
B09-CTCK
NOTES TO THE FINANCIAL STATEMENTS (continued)as at and for the year ended 31 December 2016
OPPORTUNITIES 145
B09-
CTCK
NO
TES
TO T
HE
FIN
ANCI
AL S
TATE
MEN
TS (c
ontin
ued)
as a
t and
for t
he y
ear e
nded
31
Dece
mbe
r 201
6
144 HSC ANNUAL REPORT 2016

25 OTHER INFORMATION (continued)
25.5. Financial risk management objectives and policies
Financial liabilities of the Company mainly comprised of loans and borrowings, trade payables and other payables. Primary purpose of financial liabilities is to finance main business operation of the Company. The Company possesses loans, receivables from customers and other receivables, cash on hand and short-term deposit incurring directly from business operation of the Company. The Company does not hold or issue any derivative instruments.
The Company is exposed to market risk, credit risk and liquidity risk in its daily operation.
Risk management is integral to the whole business of the Company. The Company has a system of control in place to achieve an acceptable balance between the cost of risks occurring and the cost of managing the risks. The management continually monitors the Company’s risk management process to ensure that an appropriate balance between risk and control is achieved.
Management reviews and agrees policies for managing each of these risks which are summarized below.
Market risk
Market risk is the risk that the fair value of future cash flows of a financial instrument will fluctuate because of changes in market prices. Market prices comprise four types of risks: interest rate risk, currency risk, commodity price risk and other price risk, such as equity price risk. Financial instruments affected by market risk include loans and borrowings, deposits and available-for-sale investments.
Interest rate risk
Interest rate risk is the risk that the fair value or future cash flows of a financial instrument will fluctuate because of changes in market interest rates. The Company’s exposure to market risk for changes in interest rate relates primarily to the Company’s cash and short-term deposits. These investments are mainly short term in nature and they are not held for speculative purposes.
The Company manages interest rate risk by looking at the competitive structure of the market to obtain rates which are favorable for its purposes within its risk management limits.
A sensitivity analysis is not performed for interest rate risk as the Company’s exposure to interest-rate risk is minimal or debts bear fixed interest rate at reporting date.
Foreign currency risk
Foreign currency risk is the risk that the fair value or future cash flows of a financial instrument will fluctuate because of changes in foreign exchange rates. The Company’s exposure to the risk of changes in foreign exchange rates relates primarily to the Company’s Operating activities (when revenue or expense is denominated in a different currency from the Company’s accounting currency).
Foreign currency risk is low since most of all the Company’s assets and liabilities are in Vietnam dong.
25 OTHER INFORMATION (continued)
25.5. Financial risk management objectives and policies(continued)
Equity price risk
The Company’s listed and unlisted equity securities are susceptible to market price risk arising from uncertainty about future values of the investment securities. The Company manages the stock price risk by setting limits on stock investments. The Board of Directors of the Company also reviews and approves all investment decisions on stocks.
As at reporting date, the exposure to listed and unlisted equity securities. A decrease or increase on the stock market index would result in a decrease or increase in the profit after tax of the Company depending on the significance or prolong decrease/increase. Credit risk
Credit risk is the risk that counterparty will not meet its obligations under a financial instrument or customer contract, leading to a financial loss. The Company is exposed to credit risk from its operating activities (primarily for trade receivables from margin trading transactions) and from its financing activities, including deposits with banks and other financial instruments.
Trade receivables
Customer credit risk is managed by the Company based on its established policy, procedures and control relating to customer credit risk management.
Outstanding customer receivables are regularly monitored. The requirement for impairment is analyzed at each reporting date on an individual basis for major clients. The analysis of the possibility provision is made at the reporting date for each large customers.
In view of the aforementioned and the fact that the Company’s trade receivables relate to a large number of diversified customers, there is no significant concentration of credit risk.
Bank deposits
The Company’s bank balances are mainly maintained with well-known banks in Vietnam. Credit risk from balances with banks is managed by the Company’s treasury department in accordance with the Company’s policy. The Company’s maximum exposure to credit risk for the components of the statement of financial position at each reporting dates are the carrying amounts as illustrated in Note 4. The Company evaluates the concentration of credit risk in respect to bank deposit as low.
Loans and advances to customers
The analysis of the possibility provision is made at the reporting date for each large customers. The Company has maintained strict control over its outstanding receivables and has a credit control department to minimize credit risk. The margin call is conducted on time and complies with the nature of the margin product.
Apart from financial assets that the Company made provision as mentioned in Note 7, the Company’s management assessed that all financial assets are neither past due nor impaired as they are related to recognized and credit worthy counterparties.
B09-CTCK B09-CTCK
NOTES TO THE FINANCIAL STATEMENTS (continued)as at and for the year ended 31 December 2016
NOTES TO THE FINANCIAL STATEMENTS (continued)as at and for the year ended 31 December 2016
OPPORTUNITIES146 HSC ANNUAL REPORT 2016 147

25 OTHER INFORMATION (continued)
25.5. Financial risk management objectives and policies (continued)
Liquidity risk
The liquidity risk is the risk that the Company will encounter difficulty in meeting financial obligation due to shortage of funds. The Company’s exposure to liquidity risk arises primarily from mismatches of maturities of financial assets and liabilities.
The Company monitors its liquidity risk by maintain a level of cash and cash equivalents and bank loans deemed adequate by management to finance the Company’s operations and to mitigate the effects of fluctuations in cash flows.
25
OTH
ER IN
FORM
ATIO
N (c
ontin
ued)
25.5
. Fi
nanc
ial r
isk
man
agem
ent o
bjec
tives
and
pol
icie
s(co
ntin
ued)
Liqu
idity
risk
(con
tinue
d)
The
tabl
e be
low
sum
mar
izes
the
mat
urity
pro
file
of th
e Co
mpa
ny’s
finan
cial
liab
ilitie
s bas
ed o
n co
ntra
ctua
l dis
coun
ted
paym
ents
:
31 D
ecem
ber 2
016
Ove
rdue
VND
On
dem
and
VND
Up
to 1
yea
rVN
D1
- 5 y
ears
VN
DTo
tal
VND
FIN
ANCI
AL A
SSET
S
Fina
ncia
l ass
ets a
t FVT
PL
List
ed sh
ares
-11
5,34
1,55
6,73
0-
-11
5,34
1,55
6,73
0
Unl
iste
d sh
ares
-19
1,03
0,13
8,82
5-
-19
1,03
0,13
8,82
5
Loan
s and
rece
ivab
les
--
2,75
0,94
5,23
3,39
4-
2,75
0,94
5,23
3,39
4
Oth
er fi
nanc
ial a
sset
s
Rece
ivab
les f
rom
serv
ices p
rovi
ded
by th
e Co
mpa
ny1,
145,
650,
000
-36
8,86
2,75
3,67
6-
370,
008,
403,
676
Depo
sits
, col
late
rals
and
ple
dges
--
27,7
58,6
004,
718,
807,
750
4,74
6,56
6,35
0
Oth
er re
ceiv
able
s 33
,765
,075
,751
2,35
8,19
51,
400,
245,
834
-35
,167
,679
,780
Cash
and
cas
h eq
uiva
lent
s-
60,1
93,6
84,9
00-
-60
,193
,684
,900
34,9
10,7
25,7
5136
6,56
7,73
8,65
03,
121,
235,
991,
504
4,71
8,80
7,75
03,
527,
433,
263,
655
FIN
ANCI
AL L
IABI
LITI
ES
Shor
t-ter
m b
orro
win
gs-
-1,
000,
000,
000,
000
-1,
000,
000,
000,
000
Secu
ritie
s tra
de p
ayab
les
--
32,6
10,0
05,8
00-
32,6
10,0
05,8
00
Oth
er p
ayab
les
--
17,3
24,3
27,7
72-
17,3
24,3
27,7
72
--
1,04
9,93
4,33
3,57
2-
1,04
9,93
4,33
3,57
2
Net
liqu
idity
gap
34,9
10,7
25,7
5136
6,56
7,73
8,65
02,
071,
301,
657,
932
4,71
8,80
7,75
02,
477,
498,
930,
083
B09-
CTCK
NO
TES
TO T
HE
FIN
ANCI
AL S
TATE
MEN
TS (c
ontin
ued)
as a
t and
for t
he y
ear e
nded
31
Dece
mbe
r 201
6
OPPORTUNITIES 149
B09-CTCK
NOTES TO THE FINANCIAL STATEMENTS (continued)as at and for the year ended 31 December 2016
148 HSC ANNUAL REPORT 2016

25 OTHER INFORMATION (continued)
25.5. Financial risk management objectives and policies (continued)
Liquidity risk (continued)
The Company assessed the concentration of risk with respect to refinancing its debt and concluded it to be low. Access to sources of funding is sufficiently available and debt maturing within 12 months can be rolled over with existing lenders.
Collateral
The Company used its receivables to guarantee for the loans (Note 14).
The Company holds the securities of customers as the collateral assets for its receivables at 31 December 2016 and 31 December 2015.
25.6 Corresponding figures
During the year of 2016, due to the effects of changes in accounting policies and requirements for financial statement preparation and presentation in accordance with Circular 334, certain corresponding figures on the financial statements for the previous year have been reclassified to conforming with the current year’s presentation.
25
OTH
ER IN
FORM
ATIO
N (c
ontin
ued)
25.6
Co
rres
pond
ing
figur
es (c
ontin
ued)
a.
Extrac
tfromst
atem
ento
ffina
ncialp
osition
ASSE
TSDe
scrip
tion
Begi
nnin
g ba
lanc
e(r
epor
ted)
VN
DRe
clas
sific
ation
VND
Begi
nnin
g ba
lanc
e (Rec
lassifica
tion)
VND
A.
CURR
ENT
ASSE
TSI.
Cash
and
cash
equ
ival
ents
Cash
[1]
657,
156,
819,
577
(493
,009
,558
,764
)16
4,14
7,26
0,81
3Sh
ort-t
erm
inve
stm
ents
(**)
[2]
190,
079,
349,
659
(190
,079
,349
,659
)-
Prov
isio
n fo
r sho
rt-te
rm in
vest
men
ts (*
*)[2
](5
7,90
4,47
6,16
5)57
,904
,476
,165
- Fi
nanc
ial a
sset
s at f
air v
alue
thro
ugh
prof
it an
d lo
ss (F
VTPL
) (*)
[2]
- 13
2,17
4,87
3,49
413
2,17
4,87
3,49
4Tr
ade
rece
ivab
les (
**)
[3]
1,51
7,33
6,51
3(1
,517
,336
,513
)-
Rece
ivab
les f
rom
secu
ritie
s tra
ding
act
iviti
es (*
*)[3
]
2,68
0,28
1,65
4,03
7 (2
,680
,281
,654
,037
)-
Oth
er re
ceiv
able
s[3
]3,
696,
364,
899
15,0
48,7
98,5
0718
,745
,163
,406
Prov
isio
n fo
r dou
btfu
l deb
ts (*
*)[3
](1
6,71
9,30
5,09
4)16
,719
,305
,094
-
Loan
s (*)
[3]
- 2,
609,
604,
774,
530
2,60
9,60
4,77
4,53
0Re
ceiv
able
s fro
m se
rvic
es p
rovi
ded
by th
e Co
mpa
ny (*
)[3
]-
57,1
45,4
17,5
1357
,145
,417
,513
Prov
isio
n fo
r dou
btfu
l deb
ts (*
)[3
]-
(16,
719,
305,
094)
(16,
719,
305,
094)
V.
Oth
er c
urre
nt a
sset
sAd
vanc
e (*
)[4
]-
154,
469,
078
154,
469,
078
Shor
t-ter
m d
epos
its, c
olla
tera
ls a
nd p
ledg
es (*
)[4
]-
25,6
98,6
0025
,698
,600
Oth
er c
urre
nt a
sset
s[4
]18
0,16
7,67
8(1
80,1
67,6
78)
- B.
N
ON
-CU
RREN
T AS
SETS
V.
Oth
er lo
ng-t
erm
ass
ets
Oth
er lo
ng-te
rm a
sset
s (**
)[4
]4,
688,
159,
350
(4,6
88,1
59,3
50)
- Sh
ort-t
erm
dep
osits
, col
late
rals
and
ple
dges
(*)
[4]
- 4,
688,
159,
350
4,68
8,15
9,35
0TO
TAL
ASSE
TS3,
596,
583,
428,
164
(493
,009
,558
,764
)3,
103,
573,
869,
400
B09-
CTCK
NO
TES
TO T
HE
FIN
ANCI
AL S
TATE
MEN
TS (c
ontin
ued)
as a
t and
for t
he y
ear e
nded
31
Dece
mbe
r 201
6
OPPORTUNITIES 151
B09-CTCK
NOTES TO THE FINANCIAL STATEMENTS (continued)as at and for the year ended 31 December 2016
150 HSC ANNUAL REPORT 2016

25
OTH
ER IN
FORM
ATIO
N (c
ontin
ued)
25.6
Co
rres
pond
ing
figur
es (c
ontin
ued)
a.
Extrac
tfromst
atem
ento
ffina
ncialp
osition
(con
tinue
d)
RESO
URC
ESDe
scrip
tion
Begi
nnin
g ba
lanc
e(r
epor
ted)
VN
DRe
clas
sific
ation
VND
Begi
nnin
g ba
lanc
e (Rec
lassifica
tion)
VND
C.
LIAB
ILIT
IES
I. Cu
rren
t lia
bilit
ies
Shor
t-ter
m e
xpen
se p
ayab
les
[3]
17,0
66,3
19,7
9890
4,25
1,96
617
,970
,571
,764
Pa
yabl
es fo
r sec
uriti
es tr
adin
g [1
]52
6,86
4,03
1,10
1(4
93,0
09,5
58,7
64)
33,8
54,4
72,3
37
Di
vide
nd, p
rinci
pal a
nd c
oupo
n pa
yabl
es (*
*)[1
]2,
148,
185,
349
(2,1
48,1
85,3
49)
-
O
ther
cur
rent
liab
ilitie
s[1
], [5
]72
,050
,198
,601
(1,4
67,3
89,0
63)
70,5
82,8
09,5
38
Bo
nus a
nd w
elfa
re fu
nd (*
) [5
]-
2,71
1,32
2,44
6 2,
711,
322,
446
TOTA
L LI
ABIL
ITIE
S AN
D O
WN
ERS’
EQ
UIT
Y 3
,596
,583
,428
,164
(
493,
009,
558,
764)
3,1
03,5
73,8
69,4
00
(*)
New
item
s in
the
inco
me
stat
emen
t as r
equi
red
by C
ircul
ar 3
34(**)
Itemsw
hich
wereno
long
erprese
nted
inth
estatem
ento
ffina
ncialp
osition
inaccorda
ncewith
Circ
ular
334
Deta
ils a
djus
tmen
ts in
mai
n ite
ms a
re a
s fol
low
s:
[1]
Reclas
sifyin
vestors’dep
osittooffstatem
ento
ffina
ncialp
osition
[2
] Re
clas
sify
inve
stm
ent i
n ac
cord
ance
with
Circ
ular
334
[3]
Recl
assi
fy re
ceiv
able
s in
acco
rdan
ce w
ith C
ircul
ar 3
34[4
] Re
clas
sify
ass
ets i
n ac
cord
ance
with
Circ
ular
334
[5]
Recl
assi
fy b
onus
and
wel
fare
fund
in a
ccor
ding
with
Circ
ular
334
25
OTH
ER IN
FORM
ATIO
N (c
ontin
ued)
25.6
Co
rres
pond
ing
figur
es (c
ontin
ued)
b.
Extr
act f
rom
the
inco
me
stat
emen
t
ITEM
SDe
scrip
tion
Prev
ious
yea
r (r
epor
ted)
VN
DRe
clas
sific
ation
VND
Prev
ious
yea
r (Rec
lassifica
tion)
VN
D
1.
Reve
nue
[1]
In w
hich
:[1
]-
Reve
nue
from
bro
kera
ge se
rvic
es[1
]26
2,07
6,23
4,33
5-
262,
076,
234,
335
- Re
venu
e fro
m se
curit
ies i
nves
tmen
ts a
nd c
apita
l co
ntrib
utio
n (*
*)[1
]35
,025
,916
,039
(35,
025,
916,
039)
-
- Ex
pens
es fo
r adv
isor
y se
rvic
es[1
]11
,154
,708
,555
-11
,154
,708
,555
- Ex
pens
es fo
r sec
uriti
es c
usto
dian
serv
ices
[1]
3,95
2,30
2,88
1-
3,95
2,30
2,88
1-
Reve
nue
from
oth
er a
ctiv
ities
(**)
[1]
278,
929,
816,
000
(278
,929
,816
,000
) -
Ga
in fr
om fi
nanc
ial a
sset
s at f
air v
alue
th
roug
h pr
ofit
and
loss
(FVT
PL) (
*)[1
]-
88,9
26,2
68,0
7988
,926
,268
,079
Ga
in fr
om sa
le o
f fin
anci
al a
sset
s at F
VTPL
(*)
[1]
-28
,569
,176
,193
28,5
69,1
76,1
93
Di
vide
nd, i
nter
est i
ncom
e fro
m
finan
cial
ass
ets a
t FVT
PL (*
)[1
]-
60,3
57,0
91,8
8660
,357
,091
,886
Ga
in fr
om lo
ans a
nd re
ceiv
able
s (*)
[1]
-22
2,63
6,41
6,52
922
2,63
6,41
6,52
9
Oth
er re
venu
e[1
]-
1,57
4,82
2,29
61,
574,
822,
296
2.
Ope
ratin
g ex
pens
es[2
](2
23,7
13,9
00,6
87)
(7,0
82,6
59,0
80)
(230
,796
,559
,767
)
Loss
from
fina
ncia
l ass
ets a
t FVT
PL (*
)[2
]-
(25,
154,
332,
109)
(25,
154,
332,
109)
Lo
ss fr
om sa
le o
f fin
anci
al a
sset
s at F
VTPL
[2]
-(4
9,49
6,47
8,96
9)(4
9,49
6,47
8,96
9)
Dow
nwar
d di
ffere
nce
from
reva
luat
ion
of fr
om
finan
cial
ass
ets a
t FVT
PL[2
]-
24,3
42,1
46,8
6024
,342
,146
,860
B09-
CTCK
B09-
CTCK
NO
TES
TO T
HE
FIN
ANCI
AL S
TATE
MEN
TS (c
ontin
ued)
as a
t and
for t
he y
ear e
nded
31
Dece
mbe
r 201
6
NO
TES
TO T
HE
FIN
ANCI
AL S
TATE
MEN
TS (c
ontin
ued)
as a
t and
for t
he y
ear e
nded
31
Dece
mbe
r 201
6
OPPORTUNITIES152 HSC ANNUAL REPORT 2016 153

25
OTH
ER IN
FORM
ATIO
N (c
ontin
ued)
25.6
Co
rres
pond
ing
figur
es (c
ontin
ued)
b.
E
xtra
ct fr
om th
e in
com
e st
atem
ent (
inco
me
stat
emen
t)
ITEM
SDe
scrip
tion
Prev
ious
yea
r (r
epor
ted)
VN
DRe
clas
sific
ation
VND
Prev
ious
yea
r (Rec
lassifica
tion)
VN
D
Pr
ovis
ion
expe
nses
for f
inan
cial
ass
ets,
bad
deb
ts w
ritte
n off
and
loss
fro
m im
pairm
ent o
f fin
anci
al a
sset
s and
bor
row
ing
cost
s to
finan
ce fo
r lo
an (*
)
[2]
-(7
,390
,345
,537
)(7
,390
,345
,537
)
Ex
pens
es fo
r sel
f tra
ding
[2]
-(1
1,94
9,06
1,17
7)(1
1,94
9,06
1,17
7)
Ex
pens
es fo
r bro
kera
ge se
rvic
es[2
]-
(168
,468
,781
,630
)(1
68,4
68,7
81,6
30)
Ex
pens
es fo
r adv
isor
y se
rvic
es[2
]-
(9,7
05,2
18,8
91)
(9,7
05,2
18,8
91)
Expe
nses
for s
ecur
ities
cus
todi
an se
rvic
es[2
]-
(4,0
25,6
49,4
85)
(4,0
25,6
49,4
85)
O
ther
exp
ense
s[2
]-
(4,1
03,1
70,9
38)
(4,1
03,1
70,9
38)
3.
Fina
ncia
l ope
ratio
n re
venu
es
Reve
nue,
acc
rued
div
iden
ds, i
nter
est i
ncom
e fro
m d
eman
d de
posi
ts in
th
e ye
ar[2
]-
818.
225.
135
818.
225.
135
4.
Gene
ral a
nd a
dmin
istr
ativ
e ex
pens
es(9
5,95
2,92
3,08
0)7,
082,
659,
077
(88,
870,
264,
003)
(*)
New
item
s in
the
inco
me
stat
emen
t as r
equi
red
by C
ircul
ar 3
34(*
*)
Item
s whi
ch w
ere
no lo
nger
pre
sent
ed in
the
inco
me
stat
emen
t in
acco
rdan
ce w
ith C
ircul
ar 3
34
Deta
ils a
djus
tmen
ts in
mai
n ite
ms a
re a
s fol
low
s:
[1]
Recl
assi
fy o
pera
ting
reve
nues
in a
ccor
danc
e w
ith C
ircul
ar 3
34[2
] Re
clas
sify
ope
ratin
g ex
pens
es in
acc
orda
nce
with
Circ
ular
334
25.
OTH
ER IN
FORM
ATIO
N (c
ontin
ued)
25.6
Co
rres
pond
ing
figur
es (c
ontin
ued)
c.
Extrac
tfromth
eca
shflow
sstatemen
t
The
Com
pany
’s ca
sh fl
ows s
tate
men
t
ITEM
SN
otes
Prev
ious
yea
r (r
epor
ted)
VN
DRe
clas
sific
ation
VND
Prev
ious
yea
r (Rec
lassifica
tion)
VN
D
CASH
AND
CAS
H EQ
UIVA
LENT
S AT
THE
BEG
INNI
NG O
F
THE
PERI
OD
[1]
1,50
6,62
3,04
4,07
7(7
20,2
28,4
27,2
95)
786,
394,
616,
782
Cash
at b
anks
at t
he b
egin
ning
of t
he p
erio
d:1,
506,
623,
044,
077
(720
,228
,427
,295
)78
6,39
4,61
6,78
2
CASH
AND
CAS
H EQ
UIVA
LENT
S AT
THE
END
OF
THE
PERI
OD
[1]
657,
156,
819,
577
(493
,009
,558
,764
)16
4,14
7,26
0,81
3
Cash
at b
anks
for o
pera
tions
of c
ompa
ny65
7,15
6,81
9,57
7(4
93,0
09,5
58,7
64)
164,
147,
260,
813
CASH
AND
CAS
H EQ
UIVA
LENT
S AT
THE
BEG
INNI
NG O
F
THE
PERI
OD
[1]
-72
0,22
8,42
7,29
572
0,22
8,42
7,29
5
Cash
at b
anks
at t
he b
egin
ning
of t
he p
erio
d-
The
inve
stor
s’ de
posit
s man
aged
by t
he C
ompa
ny fo
r sec
uriti
es tr
adin
g ac
tiviti
es-
720,
228,
427,
295
720,
228,
427,
295
CASH
AND
CAS
H EQ
UIVA
LENT
S AT
THE
END
OF
THE
PERI
OD
-49
3,00
9,55
8,76
449
3,00
9,55
8,76
4
Cash
at b
anks
at t
he e
nd o
f the
per
iod
- In
vest
ors’
depo
sits m
anag
ed b
y the
Com
pany
for s
ecur
ities
tra
ding
act
iviti
es-
493,
009,
558,
764
493,
009,
558,
764
[1]
Recl
assi
fy in
vest
ors’
dep
osits
to o
ff ba
lanc
e sh
eet
B09-
CTCK
B09-
CTCK
NO
TES
TO T
HE
FIN
ANCI
AL S
TATE
MEN
TS (c
ontin
ued)
as a
t and
for t
he y
ear e
nded
31
Dece
mbe
r 201
6
NO
TES
TO T
HE
FIN
ANCI
AL S
TATE
MEN
TS (c
ontin
ued)
as a
t and
for t
he y
ear e
nded
31
Dece
mbe
r 201
6
OPPORTUNITIES154 HSC ANNUAL REPORT 2016 155

26. EVENTS AFTER THE STATEMENT OF FINANCIAL POSITION DATE
On 17 January 2017, the Company received Notification No. 383/UBCK-QLKD from SSC announced on being received the issuance of share report under Employees Stock Ownership Plan sufficiently. Base on that, the Company issued 2,500,000 shares and record in equity VND45,000,000,000, of which, amount contributed from bonus and welfare fund is VND14,000,000,000 and from employees is VND31,000,000,000.
On 7 February 2017, the Company accomplished Employees Stock Ownership Plan, accordingly its chartered capital increase to VND1,297,567,580,000.
Except for the above event, there is no other matter or circumstance that has arisen since the statement of financial position date that requires adjustments or disclosures to be in the financial statements of the Company.
OPERATION NETWORK
HO CHI MINH CITY
1. HEAD OFFICELevel 5&6, AB Tower, 76 Le Lai, Ben Thanh Ward, District 1, Ho Chi Minh CityTel: +84-8 3823 3299Fax: +84-8 3823 3301
2. LE LAI TRANSACTION OFFICELevel 5, AB Tower, 76 Le Lai, Ben Thanh Ward, District 1, Ho Chi Minh CityTel: +84-8 3829 3296Fax: +84-8 3823 2621
3. THAI VAN LUNG TRANSACTION OFFICELevel 1, Capital Place Building, 6 Thai Van Lung, District 1, Ho Chi Minh CityTel: +84-8 3823 2981Fax: +84-8 3823 2982
4. TRAN HUNG DAO TRANSACTION OFFICELevel 1&2, 569-571-573 Tran Hung Dao, District 1, Ho Chi Minh CityTel: +84-8 3836 4189Fax: +84-8 3836 4198
5. CHO LON TRANSACTION OFFICE633 Nguyen Trai, District 5, Ho Chi Minh City Tel: +84-8 38552907Fax: +84-8 38552917
6. NGUYEN VAN TROI TRANSACTION OFFICEGround Floor, Centre Point Building, 106 Nguyen Van Troi, Phu Nhuan District, Ho Chi Minh CityTel: +84-8 3997 2836Fax: +84-8 3997 2837
HA NOI
7. HA NOI MAIN OFFICELevel 2, CornerStone Building, 16 Phan Chu Trinh, Hoan Kiem District, HanoiTel: +84-4 3933 4693Fax: +84-8 3933 4822
8. KIM LIEN TRANSACTION OFFICELevel 18, VCCI Building, 9 Dao Duy Anh, Dong Da District, HanoiTel: +84-4 3574 5599Fax: +84-4 3574 5959
9. LANG HA TRANSACTION OFFICELevel 6, Vinaconex Building, 34 Lang Ha, Dong Da District, HanoiTel: +84-4 3776 7100Fax: +84-4 3776 7101
10. HOAN KIEM TRANSACTION OFICELevel 4&5, 66A Tran Hung Dao Building, Hoan Kiem District, HanoiTel: +84-4 3941 6240Fax: +84-4 3941 6242
B09-CTCK
NOTES TO THE FINANCIAL STATEMENTS (continued)as at and for the year ended 31 December 2016
156 HSC ANNUAL REPORT 2016