An improved method for predicting heat exchanger network area
Opportunities for improved heat
integration in average Scandinavian
kraftliner mills:
A pinch analysis of a model mill Master’s Thesis within the Sustainable Energy Systems programme
ERIKA AXÉN
Department of Energy and Environment
Division of Heat and Power Technology
CHALMERS UNIVERSITY OF TECHNOLOGY
Göteborg, Sweden 2010


MASTER’S THESIS
Opportunities for improved heat integration in average
Scandinavian kraftliner mills:
A pinch analysis of a model mill
Master’s Thesis within the Sustainable Energy Systems programme
ERIKA AXÉN
SUPERVISOR:
Elin Svensson
EXAMINER:
Thore Berntsson
Department of Energy and Environment
Division of Heat and Power Technology
CHALMERS UNIVERSITY OF TECHNOLOGY
Göteborg, Sweden 2010
Opportunities for improved heat integration in Scandinavian kraftliner mills: A pinch
analysis of a model mill.
Master’s Thesis within the Sustainable Energy Systems programme
ERIKA AXÉN
© ERIKA AXÉN 2010
Department of Energy and Environment
Division of Heat and Power Technology
Chalmers University of Technology
SE-412 96 Göteborg
Sweden
Telephone: + 46 (0)31-772 1000
Chalmers Reproservice
Göteborg, Sweden 2010


I
Acknowledgements
I would like to thank Elin Svensson for her continuous help throughout this work and
for being both a guide and a sounding board. Also, many thanks to Erik Axelsson who
helped me with the pinch analysis, which has been a large part of this work. Last but
not least, many thanks to my dear friend Therese who has been a great support in
aspects regarding my texts.

II

III
Opportunities for improved heat integration in Scandinavian kraftliner mills: A pinch
analysis of a model mill
Master’s Thesis in the Sustainable Energy Systems programme
ERIKA AXÉN
Department of Energy and Environment
Division of Heat and Power Technology
Chalmers University of Technology
Abstract
Energy savings and increased efficiency is important to a large energy consuming
industry such as the pulp and paper industry. To give industries incentives to do
something about their energy consumption, policy instruments are used and research
in the pulp and paper field show that large savings can be achieved. One way to save
steam is process integration and a tool to find steam saving opportunities is pinch
analysis. The method is used in this thesis where a pinch analysis of a modelled
average Scandinavian Kraftliner mill has been done. The mill is modelled within the
national research program FRAM (Future Resource Adapted Pulp Mill) and the
results in this thesis might act as a guideline for possible steam saving opportunities
for a mill of this size and type.
The pinch analysis shows that theoretically, 20 MW of steam can be saved through
improved heat exchanging, which is about 11% of today’s steam demand. By making
a retrofit analysis, two steam saving proposals with possibility to save 13.7 and 19.6
MW of low pressure steam were worked out.
Other investigated steam saving alternatives were flue gas heat recovery, upgrading of
the evaporation plant, and energy savings in the paper machine. The steam saving
opportunities were put together to eight different investment alternatives with steam
savings between 120 and 420 GWh/yr. The economic evaluation of those alternatives
shows an investment cost in the range 1–15 M€, depending on the investment. The
largest investment cost is an upgrade of the evaporation plant, 10.4 M€.
The steam surplus can be used for fuel savings and thereby achieve annual earnings.
To analyze this, two levels of bark and electricity prices were used and the resulting
earnings lie between 2.5–10 M€/yr depending on investment alternative, bark and
electricity prices.
An interesting concept within process integration and the biorefinery field is lignin
separation. In this thesis it is investigated what lignin price is required for lignin to be
equally profitable as saving fuel. The same levels of fuel and electricity prices as for
the fuel savings were used and consequently two lignin price levels were achieved.
The achieved lignin prices vary between 30 and 51 €/MWh. Depending on the
investment alternative and thereby achieved lignin price, this is comparable to the
price of high-grade biofuels as well as the oil price.
Conclusions that can be drawn are; considerable savings can be achieved in the mill, it
is clearly profitable to save fuel and the estimated lignin price implies that lignin
separation can be an interesting alternative to fuel saving.
Key words: pinch analysis, steam savings, retrofit, lignin separation, kraft pulp
mill, fuel savings

IV

V
Contents
ACKNOWLEDGEMENTS I
ABSTRACT III
CONTENTS V
NOTATIONS VII
1 INTRODUCTION 1
1.1 Background 1
1.2 Objectives 1
2 SCOPE AND DELIMITATIONS 3
2.1 Scope 3
2.2 Delimitations 3
3 THEORY 5
3.1 Basic pinch analysis 5
3.2 Lignin separation 6
4 PROCESSES AND THE STUDIED MILL 7
4.1 The kraft process and paper production in general 7
4.2 The studied mill 8
4.2.1 Kraftliner mill FRAM 11 8
4.2.2 Fibre line 8
4.2.3 Chemical recovery 9
4.2.4 Energy system 9
4.2.5 Steam system 9
4.2.6 Liner machine 10
5 METHODOLOGY 11
5.1 Stream data 11
5.2 Pinch analysis 11
5.3 Steam saving opportunities 11
5.4 Fuel savings 11
5.5 Lignin separation 12
5.6 Economic evaluation of the investment alternatives 12
6 RESULTS KRAFTLINER MILL 13
6.1 Steam saving opportunities 13
6.1.1 New heat exchanger networks 14
6.1.2 Evaporation plant 16
VI
6.1.3 Flue gas heat recovery 16
6.1.4 Paper machine 16
6.2 Investment alternatives 16
6.3 Fuel savings 17
6.4 Lignin separation 18
6.5 Economic evaluation 18
6.5.1 Costs for the investment alternatives 19
6.5.2 Investment costs for lignin separation 20
6.5.3 Annual earnings from saving fuel 20
6.5.4 Lignin price 21
7 DISCUSSION 23
7.1 Steam savings 23
7.1.1 The GCC 23
7.1.2 Turbine 24
7.1.3 The evaporation plant upgrade and retrofits 24
7.2 The economic investigation 25
7.2.1 Lignin price and annual earnings from bark savings 25
8 CONCLUSIONS 27
9 FUTURE WORK 29
10 REFERENCES 31
APPENDIX I – STEAM CONSUMPTION 33
APPENDIX II – STREAM DATA 35
APPENDIX III – PAPER MACHINE SAVINGS 37
APPENDIX IV – EVAPORATION PLANT UPGRADE 39
APPENDIX V – INVESTMENT COSTS FOR THE EVAPORATION PLANT 41
Evaporation plant upgrade, investment alternative I-IV 41
Least cost to allow lignin separation, investment alternative V-VIII 41
APPENDIX VI – STEAM SAVINGS FROM FGHR 43
APPENDIX VII – EXISTING NETWORK 45
APPENDIX VIII – RETROFIT PROPOSAL NN1 47
APPENDIX IX – RETROFIT PROPOSAL NN2 49
VII
Notations
a Annuity factor
ADt Air dry tonne (90% dryness)
BDt Bone dry tonne (100% dryness)
FG Flue gases
FGHR Flue Gas Heat Recovery
FRAM Future Resource Adapted Pulp Mill, Swedish national research program
GCC Grand Composite Curve
HW Hot Water (production)
HP High Pressure steam
i Interest rate
LP Low Pressure steam
MP Medium Pressure steam
NCG Non Condensable Gas
NOx Nitrogen Oxides
STFI STFI - Packforsk which is Innventia since 2003

0
1
1 Introduction
1.1 Background
The energy usage is a topic with high priority for the political agenda and therefore
also the media coverage. With this in mind, energy savings in industries become more
and more important since industrial processes are large energy consumers. Policy
instruments and environmental regulations are also used to stimulate a lowered
environmental impact. Therefore, it is important to analyze the current energy system
and consider the future, to be prepared for what might come and increase efficiency,
to avoid high costs in the future.
The pulp and paper industry is a large energy consumer and the importance of
efficient process integration is high. Research with purpose to make the industry less
energy consuming is an ongoing process. The Future Recourse Adapted Pulp Mill,
FRAM, is a national Swedish research program with the aim to investigate how the
pulp and paper industry can have less environmental impact. Several pulp and paper
mills have been modelled within FRAM and a central part in the research has been to
investigate the energy saving potentials in those theoretical mills [1] [2] [3]. This
thesis contains an investigation of the energy system of one of those modelled mills,
the Kraftliner mill, which is the only type that has not been investigated before. The
energy saving potential is individual for each real mill but the energy savings found in
the study of this modelled mill may act as a guideline for possible energy saving
potentials.
An interesting concept within process integration and the biorefinery field is lignin
separation. A lot of research has been done during the last years and several methods
to separate the lignin from the black liquor have been developed. One efficient
method to separate lignin is the LignoBoost process where the lignin is separated from
the evaporation plant. The lignin can be utilized as fuel or as raw material for high-
grade chemicals [4].
One objective for this thesis is a pinch analysis of an integrated pulp and paper
kraftliner mill. A pinch analysis is an analysis of the processes in order to save energy.
Since not many pinch studies have been made on this type of mill, it is of interest to
find the energy saving potential. Compared to a market pulp kraft mill, this integrated
mill does not have the same possibility to become a net energy exporter or to be self-
sufficient in energy supply from the wood. In this thesis it is also investigated how the
energy savings can be used. What are the benefits of decreasing the import of wood
waste or alternatively what lignin price is required for lignin separation to be equally
profitable as saving fuel?
1.2 Objectives
The main purpose of the thesis is to identify possible steam saving opportunities in a
modelled average Scandinavian kraftliner mill. A secondary purpose is to
economically evaluate possible investment alternatives, based on the possible steam
saving opportunities. An important part of this economic evaluation is to identify the
price for lignin which makes lignin separation equally profitable as saving fuel.

2
3
2 Scope and Delimitations
2.1 Scope
This thesis addresses the possible steam saving potential of a modelled kraftliner mill,
which represents an average Scandinavian mill of that type.
The study covers the production process in an integrated pulp and paper mill, though
the focus is on the pulping process. Since the model represents an average
Scandinavian mill, the results in this thesis are not applicable on any specific
Scandinavian site. However, the level of the steam saving potential indicates the
possible steam savings for a typical mill of this size and type. The optimal solutions
for each mill are naturally individual for each site.
To make a relevant analysis of the economy of the proposed measures, two levels of
energy prices are taken into account.
2.2 Delimitations
The modelled FRAM mill is based on a large amount of information but some data is
not known; for example distances between streams. This can lead to that a possible
retrofit of a system cannot be viable while the distance between the streams are too far
and too much heat would be lost or the costs too high. Further, as the distances are
unknown, an exact piping cost calculation is impossible, which in turn, makes the
economic calculations/evaluations rough estimations. Pumps have been held intact
and supposed to work at the same capacity; consequently costs for those are
neglected.
The investigation of the heat integration potential at the mill is originally divided in
two parts; the paper machine and the pulp process. This is because the liner machine
has to work independently of the pulp process and the liner machine was modelled as
a black box and no information about the energy recovery system was known.
Probably, the distances also make the piping costs too high for integration.
A further delimitation lie in the rough economic investment calculation for an upgrade
of the evaporation plant, where the calculation is based on scaling and assumptions.
The focus has been to find heat integration opportunities and increase the energy
efficiency in that way. Therefore, no attention has been put into other energy saving
options such as electricity saving possibilities. The standpoint has also been to keep as
much existing equipment as possible instead of buying new and thereby increase
investment costs. An exception is the evaporation plant which is one of the major
steam consumers in the mill.

4
5
3 Theory
In this section, the basic in pinch analysis and lignin separation is presented. All
information in section 3.1 is from the course material in the course Industrial Energy
Systems [5].
3.1 Basic pinch analysis
Pinch technology is a useful method to analyze an industrial process in order to save
energy and money. The system analysis is done by answering the questions: How
much heat must be added? How much heat must be removed or extracted? How much
heat can be heat exchanged internally and how should the heat exchanger network be
designed to maximize the heat recovery? To answer these questions the process
streams are divided into hot and cold streams where hot streams are streams with a
cooling demand and cold streams represent a heating demand.
A minimum temperature difference for heat exchange is set to each individual stream.
The minimum temperature difference is chosen, for example, with regards to heat
transfer characteristics and purpose of the stream.
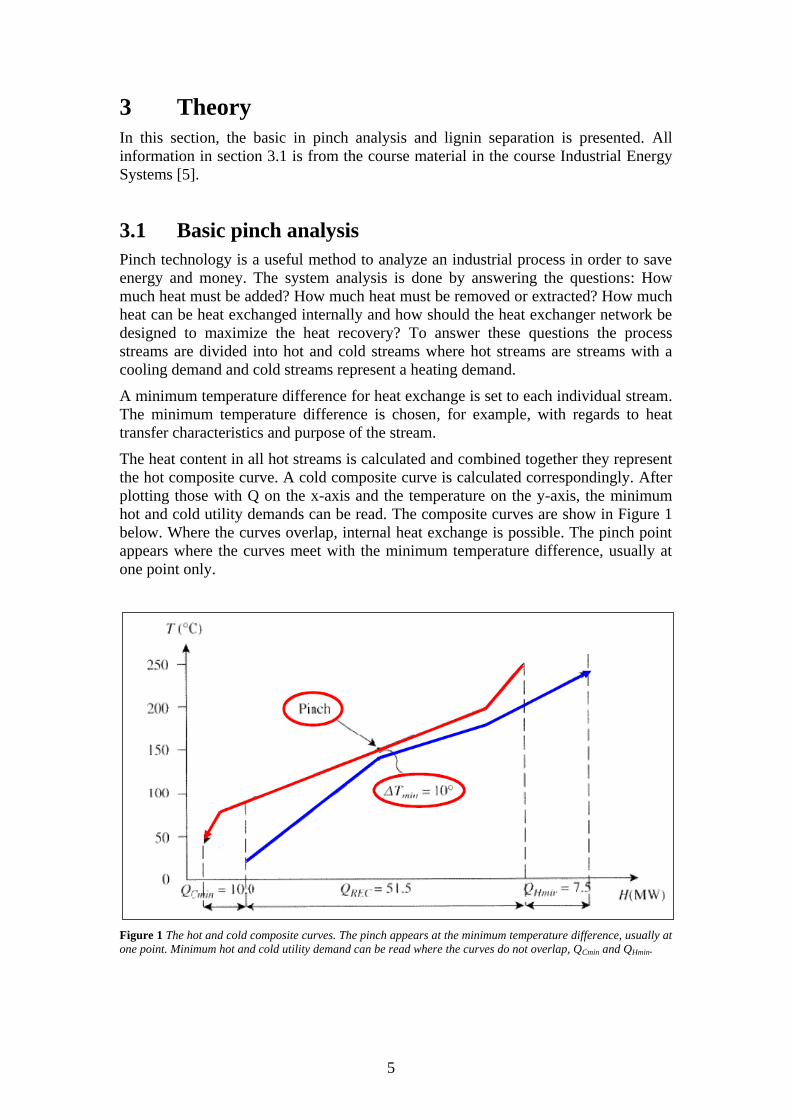
The heat content in all hot streams is calculated and combined together they represent
the hot composite curve. A cold composite curve is calculated correspondingly. After
plotting those with Q on the x-axis and the temperature on the y-axis, the minimum
hot and cold utility demands can be read. The composite curves are show in Figure 1
below. Where the curves overlap, internal heat exchange is possible. The pinch point
appears where the curves meet with the minimum temperature difference, usually at
one point only.
Figure 1 The hot and cold composite curves. The pinch appears at the minimum temperature difference, usually at
one point. Minimum hot and cold utility demand can be read where the curves do not overlap, QCmin and QHmin.
6
The pinch decomposes the process in two separate parts. Above the pinch there is a
heat deficit and below the pinch there is a heat surplus. To reach as efficient internal
heat exchange as possible the following rules shall be followed;
Do not transfer heat through the pinch.
Do not heat below the pinch.
Do not cool above the pinch.
The energy system is analyzed by checking whether these rules are obeyed or not and
at the same time looking for improvements in the heat exchange. A retrofit of the
existing system can be done to solve violations to the above rules – so called pinch
violations – and improve the internal heat exchange, whereby substantial energy
savings can be achieved.
3.2 Lignin separation
In the field of process integration and biorefineries, lignin separation is of interest.
Lignin is part of the raw material in the wood and is separated from the fibres in the
cooking process. Usually, it is then burned in the recovery boiler together with other
cooking chemicals and thereby satisfying the mill’s steam demand. If the steam
demand is reduced, lignin separation is possible.
The separated lignin is promising for use as a fuel since it has a higher heating value
than for example bark, which is a common fuel in mills. The heating value for bark
lies between 7 and 10 MJ/kg [6] depending on the fuel whereas it for lignin lies
around 23.7 MJ/kg. Though, the sulfur content of lignin is about 1–3% [7]. Lignin
also has the possibility of being used as a raw material for high-grade chemicals.
Separation of lignin affects the energy balance of the mill and the possible separation
rate is restricted to the recovery boilers need of a certain amount of fuel. A decreased
steam demand is a way to reduce the fuel demand in the recovery boiler. The
separation of lignin also increases the steam demand of the evaporation plant, which
has to be accounted for.
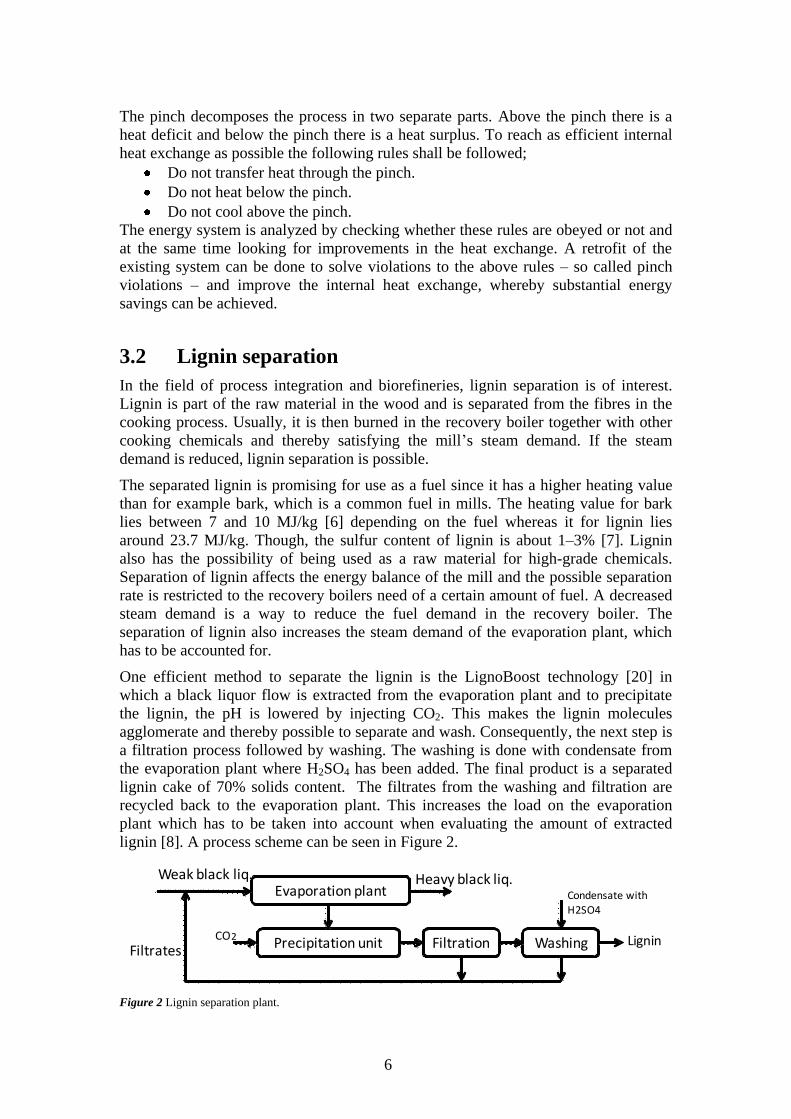
One efficient method to separate the lignin is the LignoBoost technology [20] in
which a black liquor flow is extracted from the evaporation plant and to precipitate
the lignin, the pH is lowered by injecting CO2. This makes the lignin molecules
agglomerate and thereby possible to separate and wash. Consequently, the next step is
a filtration process followed by washing. The washing is done with condensate from
the evaporation plant where H2SO4 has been added. The final product is a separated
lignin cake of 70% solids content. The filtrates from the washing and filtration are
recycled back to the evaporation plant. This increases the load on the evaporation
plant which has to be taken into account when evaluating the amount of extracted
lignin [8]. A process scheme can be seen in Figure 2.
Figure 2 Lignin separation plant.
Precipitation unit Filtration Washing
Weak black liq.Evaporation plant
Heavy black liq.
CO2
Condensate with H2SO4
FiltratesLignin

7
4 Processes and the studied mill
Below is a description of the kraft process and paper production in general terms
presented, followed by a more detailed description of the studied mill.
4.1 The kraft process and paper production in general
The logs are debarked and chopped into small pieces, chips. This is followed by a
steaming of the chips with the purpose to heat them and to force air out. The pre-
steamed chips enter the digester where the delignification process takes place. Two
main streams leave the digester; one stream with the delignificated chips for further
processing and one with the cooking chemicals, the lignin, and so on – the so called
black liquor – to the evaporation plant.
In the evaporation plant, the dry solid content of the weak black liquor is increased.
The strong black liquor leaves the evaporation plant to be burned in the recovery
boiler.
The recovery boiler produces the steam that is used in the plant. Usually high pressure
steam of around 60–80 bar, medium pressure steam of ~ 10 bar and low pressure
steam of ~4.5 bar is produced. The steam pressure is reduced in a back pressure
turbine to suitable levels. The electricity produced in the turbine is used in the mill
and reduces the purchased power demand.
Figure 3 A picture of the mill. To simplify the understanding, some parts are marked with arrows.
Liner is a certain paper quality that is used, for example, in cardboard. In the paper
mill, this liner is produced, which is a large energy consumer in the mill. Generally, a
paper machine consists of a head box where the pulp is spread out, a press section and
a drying section. The head box is pressurized, letting water disappear and in the press
section, a more efficient water removal appears by letting the pulp pass between
pressing rolls. The liner is then dried in the drying section, where a large amount of
Evaporation plant
Recovery and Bark boiler
Liner machine
Digester
Delignificatedchips
Black liqour
Recycled fibreplant

8
heat is needed [9]. A simplified picture of the liner machine can be found below. As
the liner does not have to be white, recycled fibres are commonly used in the kraft
process. The recycled paper is mechanically treated and then further processed to
become pulp again. This is then mixed with the pulp from the pulp mill before
entering the liner machine.
Figure 4 A simplified picture of the liner machine. Pulp is distributed in the pressurized head box where part of
the water disappears. Further water removal is performed in the press section followed by drying in the drying
section.
4.2 The studied mill
A more detailed description of the mill is represented below. Those parts of the mill
that is of interest from an energy perspective are emphasized. If not referred to
something else all information in this is section is from the report ‘’Kraftliner Mill’’
which is written within the research program FRAM [10].
4.2.1 Kraftliner mill FRAM 11
The Kraftliner mill is modeled within the FRAM project. The FRAM program was a
Swedish national research program between 2003 and 2005. The main focus in the
project was to reduce process disturbing chemicals and become less resource
demanding. The model of the mill is developed by STFI (now Innventia) and modeled
in WinGEMS. All data is representing steady state conditions. To represent an
average Scandinavian mill of today all processes and technologies chosen are based
on configurations and technologies of today. A more deltailed description follows
below.
4.2.2 Fibre line
After the logs have been debarked and cut to chips these are fed to the chip bin to be
presteamed. The presteaming of the chips is done with steam from the black liquor
flash and LP steam. Cooking and delignification then takes place in a continuous
digester with a conventional two flash system.
Head Box(pressurized)
Press Drying
Liner machine
47 % Dryness 92 % Dryness
Pulp Liner

9
4.2.3 Chemical recovery
Evaporation
The evaporation plant is a 6-effect plant, though it is assumed to have an average
efficiency of 5.5 effects. The effects are of the falling film type and operate with
counter current flow. LP steam is fed to the first effect and weak liquor to the sixth
effect. The dry solids content of the strong black liquor is 72% after the evaporation
and the plant is designed with a separate stripper.
Lime Kiln
The lime kiln is fired with oil and the lime mud has a dryness of 70%.
4.2.4 Energy system
Recovery and bark boiler
The energy system consists of a recovery boiler and a bark boiler. The recovery
boiler is designed to burn black liquor and thereby produce 105.8 MW of high
pressure steam at 60 bar, 450°C. The black liquor has a dry solids content of 72%
when it is distributed at a low level in the boiler house.
The bark boiler is designed with a bubbling fluid bed and produces 65.8 MW high
pressure steam. The bark is fired at 38% dryness and to cover the steam demand
supplementary bark is purchased.
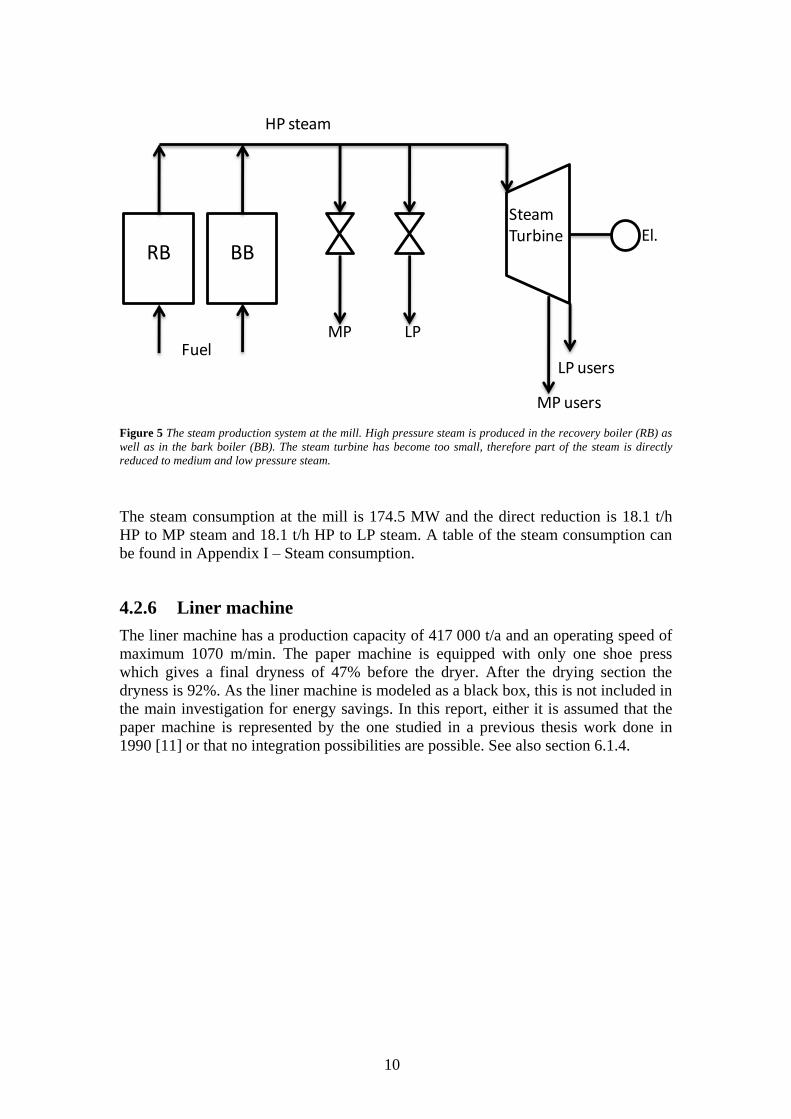
4.2.5 Steam system
Steam is produced in the recovery boiler and the bark boiler. Due to increased
production over the years the turbine has become too small and part of the produced
high pressure steam is directly reduced. The produced HP steam is 60 bar/450°C, MP
is 10 bar/200°C and LP steam 4.5 bar/150°C. An overview of the steam production
system can be seen in Figure 5.
10
Figure 5 The steam production system at the mill. High pressure steam is produced in the recovery boiler (RB) as
well as in the bark boiler (BB). The steam turbine has become too small, therefore part of the steam is directly
reduced to medium and low pressure steam.
The steam consumption at the mill is 174.5 MW and the direct reduction is 18.1 t/h
HP to MP steam and 18.1 t/h HP to LP steam. A table of the steam consumption can
be found in Appendix I – Steam consumption.
4.2.6 Liner machine
The liner machine has a production capacity of 417 000 t/a and an operating speed of
maximum 1070 m/min. The paper machine is equipped with only one shoe press
which gives a final dryness of 47% before the dryer. After the drying section the
dryness is 92%. As the liner machine is modeled as a black box, this is not included in
the main investigation for energy savings. In this report, either it is assumed that the
paper machine is represented by the one studied in a previous thesis work done in
1990 [11] or that no integration possibilities are possible. See also section 6.1.4.
RB BB
MP LP
LP users
MP users
Steam Turbine El.
Fuel
HP steam
11
5 Methodology
A literature study was done to increase the knowledge and reach a higher
understanding within the field of the work. This was followed by the procedure
below; pick the right stream data, make a pinch analysis, find steam saving
opportunities, followed by calculation of possible fuels savings and separation of
lignin.
5.1 Stream data
Stream data was given in an Excel file and the processes was represented on a flow
sheet. The streams of interest were picked with regard to their heat content and
purpose of the stream. The selected streams were compiled in an Excel file, see
Appendix II – Stream Data.
5.2 Pinch analysis
Start and target temperatures and heat loads were put into Pro-PI, an Excel software
for pinch analysis. The streams were given individual ΔTmin with regards to their heat
transfer capability. The ΔTmin values were chosen to be the same as those used in the
work ‘’Energy Export Opportunities from Kraft Pulp and Paper Mills and Resulting
Reductions in Global CO2 emissions’’ [12]. After construction of the hot and cold
composite curves, the minimum hot and cold utility demand could be read and
compared with today’s demand. The construction of the Grand Composite Curve gave
the information about possible process integration opportunities. Due to lack of
information about the paper machine this is not included in the pinch analysis, just the
pulp mill.
5.3 Steam saving opportunities
To save steam and to use available heat in an efficient way, a retrofit was done of the
existing network. Two different approaches in the retrofit were used 1) to solve pinch
violations practically and 2) to solve the pinch violations as far as possible.
Moreover, the following opportunities were evaluated; flue gas heat recovery, energy
recovery in the paper machine, and evaporation plant upgrade. The proposals were
then mixed into eight investment alternatives.
5.4 Fuel savings
The power boiler is supposed to work at full load and the steam savings could result
in a decreased fuel demand in the bark boiler. The quantity of saved fuel was
calculated from an energy balance over the bark boiler and the steam system.

12
5.5 Lignin separation
Each investment alternative corresponds to a possible lignin separation rate. This
requires extra investments and reduces electricity production. However, it could
become more valuable than bark if lignin prices are high enough.
5.6 Economic evaluation of the investment alternatives
The steam savings were compiled into eight investment alternatives, each
corresponding to a certain amount of saved steam. The investment costs for the
different alternatives were calculated as well as the annual earnings from fuel savings,
i.e. saved money from not burning the fuel. Furthermore, the investment costs for a
lignin separation plant were calculated as well as the required price for lignin in order
to make lignin separation profitable.
The annual earnings from fuel savings will depend on future costs for bark and
electricity prices. This means that the earnings for each investment will vary
depending on the future prices. An illustration of this can be seen in Figure 6 below.
Also, the needed minimum lignin prices follow this behaviour.
Figure 6 An illustration of the annual earnings from saving fuel. The different investments lead to certain annual
earnings, which in turn depend on future bark and electricity prices.

13
6 Results Kraftliner mill
In this section the results from the pinch analysis are presented as well as the other
steam saving opportunities. A summation of the investment alternatives is followed
by fuel saving and lignin separation evaluation. Furthermore, the economic evaluation
of the investment alternatives is presented in Section 6.5.
6.1 Steam saving opportunities
The major work in this project has been to analyze the energy system of the mill and
primarily to make the pinch analysis of the heat exchanger system. The results from
the energy system analysis are presented in the next sections. Below the grand
composite curve is presented.
Figure 7 The grand composite curve (with individual ∆Tmin) for the mill. The minimum hot utility demand is
154.3 MW which is 20.2 MW less than today’s usage. The Pinch temperature is 125°C.
Today’s hot utility demand is 174.5 MW (see Appendix I – Steam consumption). The
GCC shows a minimum hot utility demand of 154.3 MW and a cold utility demand of
32.3 MW. Theoretically is it possible to save 20.2 MW.

14
6.1.1 New heat exchanger networks
The sum of the pinch violations was 20.1 MW (see Table 1 below) and all was of the
character ‘heating below pinch’. All of this heating is LP steam except 0.5 MW which
is MP steam.
Table 1 Pinch violations
The major sources among the pinch violations were the chip steaming that accounts
for 5.9 MW, almost 30% of the pinch violations, and the white water 6.6 MW
accounting for 31%. The white water is used to keep the temperature in the liner
machine. Only by reducing those two one could achieve more than 60% less pinch
violation.
The retrofit of the existing network ended up in two steam saving proposals, NN1 and
NN2. Those are represented in Table 2 and Table 3. Even though the chip steaming is
a large part of the pinch violations, it is not included in the first proposal. The reason
for this is that a change in the way of presteaming the chips also includes additional
investments such as a new chip bin in addition to the new heat exchanger network.
The table below shows the solved pinch violation for proposal NN1.
Table 2 Solved pinch violations in proposal 1, NN1.
In NN1, 68% of the pinch violations are solved. As too large amounts of hot water are
produced, the production was reduced to the amount actually needed. Thereby the
black liquor heat exchanger could be used in another way. Further, by changing the
hot water production together with the caustisicing, pinch violations were reduced by
3.4 MW and 0.5 MW respectively. The water to the wood yard is heat exchanged with
Pinch violations [MW]
Hot water production 3.4
Causticising 0.5
Chip steaming 5.9
Heating etc 1.8
Wood yard 1.4
White water 6.6
Digester hi-heat zone 0.5
Total 20.1
NN1
Stream with heat demand Heated with Replaced by Load [MW] Steam saving [kg/s]
Wood yard LP Effl RCF plant 1.4 0.5
Whitewater LP Surf cond 6.6 2.83
Office heating LP Surf cond 1.8 0.69
Hot water production LP Surf cond 3.4 1.56
Causticising LP Surf cond 0.5 0.19
13.7 5.78

15
the effluent from the recycled fibre plant instead of with LP steam. The heat from the
surface condenser is used to heat the white water for the liner machine, for office
heating and for hot water production as well as for the water used in the causticising
process. The existing network and the proposed retrofit are represented in Appendix
VII – existing network and Appendix VIII – Retrofit proposal NN1.
In NN2, the changes in the chip steaming are added and the LP steam is replaced by
flash steam that earlier was used for producing hot water. In this proposal 98% of the
pinch violations are solved. A figure of the network can be found in Appendix IX –
Retrofit proposal NN2.
Table 3 Solved pinch violations in proposal 2, NN2.
A striking result is that large energy savings can be achieved in the mill, though it
requires some changes in the heat exchanger system.
The differences between the two proposed retrofits of the heat exchanger systems are
small. In proposal NN2 98% of the pinch violations are solved. The only further
modification compared to NN1 is the chip presteaming. Before, LP steam was used
which is now replaced by a flash steam of a lower temperature. Thereby a new chip
bin is required and an investment in such is needed.
In both proposals above, the condensation temperature in the surface condenser is
supposed to be 76°C. This is according to a six effect evaporation plant and if the
plant is upgraded with one effect the temperature will probably have to be lower. For
a more profound discussion about this, see section 7.1.3.
NN2
Stream with heat demand Heated with Replaced by Load [MW] Steam saving [kg/s]
Presteaming of chips LP Flash steam 5.9 2.22
Wood yard LP Effl RCF plant 1.4 0.5
Whitewater LP Surf cond 6.6 2.83
Office heating LP Surf cond 1.8 0.69
Hot water production LP Surf cond 3.4 1.56
Causticising LP Surf cond 0.5 0.19
19.6 8
16
6.1.2 Evaporation plant
The calculated steam savings in the evaporation plant are approximations. By adding
one extra effect the steam requirement is lowered. It is also assumed that the dry
solids content in the black liquor stream will increase 3%, from 72% to 75%, which
increases the steam production. This has been taken into account in the calculations.
The evaporation plant was modelled as a black box and no information was given
about the streams within the plant. Therefore, to make a rough steam saving
approximation, the heat demand was supposed not to change between the effects and
boiling point changes was not taken into consideration.
With more information this calculation could be more exact.
Today the live steam demand is 38.8 MW. With an upgrade to a 7-effect plant this is
changed to 23 MW. This results in a steam saving potential of 15.8 MW, see
Appendix IV – Evaporation plant upgrade. Since an upgrade of an evaporation plant
is a quite large investment, the option not to take this investment was also considered.
6.1.3 Flue gas heat recovery
The hot flue gases from the recovery boiler are an unused but potential heat source.
The flue gas heat recovery is approximated for the flue gases from the recovery boiler
and the steam saving potential was found to be 4.3 MW. Other flue gas heat recovery
options such as heat exchanging the flue gases from the limekiln are possible, but not
as large as those of the recovery boiler.
6.1.4 Paper machine
In FRAM, the paper machine was modeled as a black box and no details were given
about its energy recovery. A potential increase in the energy efficiency is therefore
approximated with the help of a previous thesis work done on the same type of liner
machine [11].
An upper estimate of the possible energy savings in the paper machine is
approximated to 9.6 MW. This is the largest amount that can be saved and is based on
a scaling from the thesis work mentioned above. The purpose in that work was to
reduce the steam demand for the heating of ventilation air in the paper machine and at
the same time decrease the mills waste water temperature. The steam use in the paper
machines energy saving system was 6 MW whereof all could be saved.
A lower estimate is that no steam savings are possible in the paper machine, assuming
that several efficiency measures have already been implemented. The savings
probably lie somewhere in between 0 and 9.6 MW. Of course, the investment costs
for the liner machine will differ in the same way.
6.2 Investment alternatives
The steam saving opportunities were compiled into eight different investment options,
see Table 4 below. The options are assorted so that you choose to invest in either of
the two heat exchanger network proposals together with a heat exchanger for the flue

17
gases and upgrading of the evaporation plant in one ‘package’, alternative I and II. In
alternatives III and IV the upper energy saving estimation in the paper machine is
added. In alternative V-VIII the evaporation plant upgrade is excluded; i.e. the same
first four investment alternatives but the evaporation plant upgrade investment is
omitted.
Table 4 Investment alternatives for the mill and total amount saved steam. NN1 and NN2 are the two new
proposed heat exchanger networks.
6.3 Fuel savings
The reduced steam demand makes it possible to decrease the fuel consumption and
thereby decrease the steam production in the bark boiler. It is assumed that the bark
boiler works at full load and has an efficiency of 0.9. In Table 5 below, the fuel
savings are presented for each investment alternative. A consequence of the reduced
steam flow to the turbine is a decrease in electricity production. This is also included
in the table below.
Table 5 Fuel saved according to each investment option.
The bark savings can reduce the fuel costs in the mill. The economical aspects of the
bark savings are treated in section 6.5.3.
Saved HP steam
No. [kg/s] [kg/s] [MW] [GWh/yr]
I NN1, Evap, FGHR 11.6 14.9 33.8 288
II NN2, Evap, FGHR 14.4 17.2 39.7 340
III NN1, Evap, FGHR,Paperm 14.7 19.1 43.4 370
IV NN2, Evap, FGHR,Paperm 17.5 21.3 49.3 420
V NN1, FGHR 5.0 7.6 14.1 120
VI NN2, FGHR 7.8 9.9 21.8 186
VII NN1, FGHR,Paperm 8.1 11.8 22.7 193
VIII NN2, FGHR,Paperm 10.9 14 30.4 259
Investment alternatives Saved LP steam
Reduced electricity prod
No. [MW] [GWh/yr] [MW]
I 35.7 287 0.4
II 44.2 360 1.4
III 45.3 370 1.5
IV 53.8 442 2.6
V 15.7 134 0.0
VI 24.2 206 0.2
VII 25.2 215 0.2
VIII 33.8 288 0.7
Fuel savings

18
The electricity production is not largely affected in any of the investment options.
This is because of the small turbine, which cannot swallow all the produced steam.
Hence, 10 kg steam/s reaches suitable steam levels by direct reduction. Naturally, the
steam savings are mainly withdrawn from the direct reduction leaving the turbine
unaffected as far as possible.
6.4 Lignin separation
The steam savings in the investment alternatives in Section 6.2 above can be used for
lignin separation and the result for each investment option is represented in Table 6
below.
When lignin is separated with the LignoBoost technology, a black liquor stream is
extracted from the evaporation. The separation process is assumed to increase the
steam demand of the evaporation plant with 0.45 x 3 MJ/(kg separated lignin) [13].
Therefore, a certain amount of steam was saved in the investment alternatives but at
the same time an increased steam demand appears with the separation that has to be
satisfied. The results from the calculations can be seen in the table below. A decrease
in electricity production follows from the reduced steam flow to the turbine.
Table 6 Lignin separation and reduced electricity production for the investment alternatives.
6.5 Economic evaluation
The investment costs for the steam saving opportunities, the different investment
alternatives, and the lignin separation plant are represented in this section.
Furthermore, the annual earnings from fuel savings are compiled to make the different
options more comparable. Moreover, the lignin price required to make lignin
separation profitable is evaluated in Section 6.5.4.
No. [kg/s] [t/ADt] [MW] [GWh/yr]
I 1.39 0.14 0.4 3.2
II 1.73 0.17 1.1 9.7
III 1.77 0.18 1.3 10.7
IV 2.11 0.21 2.2 19.1
V 0.61 0.06 0.0 0.0
VI 0.95 0.09 0.2 1.8
VII 0.98 0.10 0.2 2.0
VIII 1.32 0.13 0.7 6.0
Reduced electricity productionLignin separation rate
19
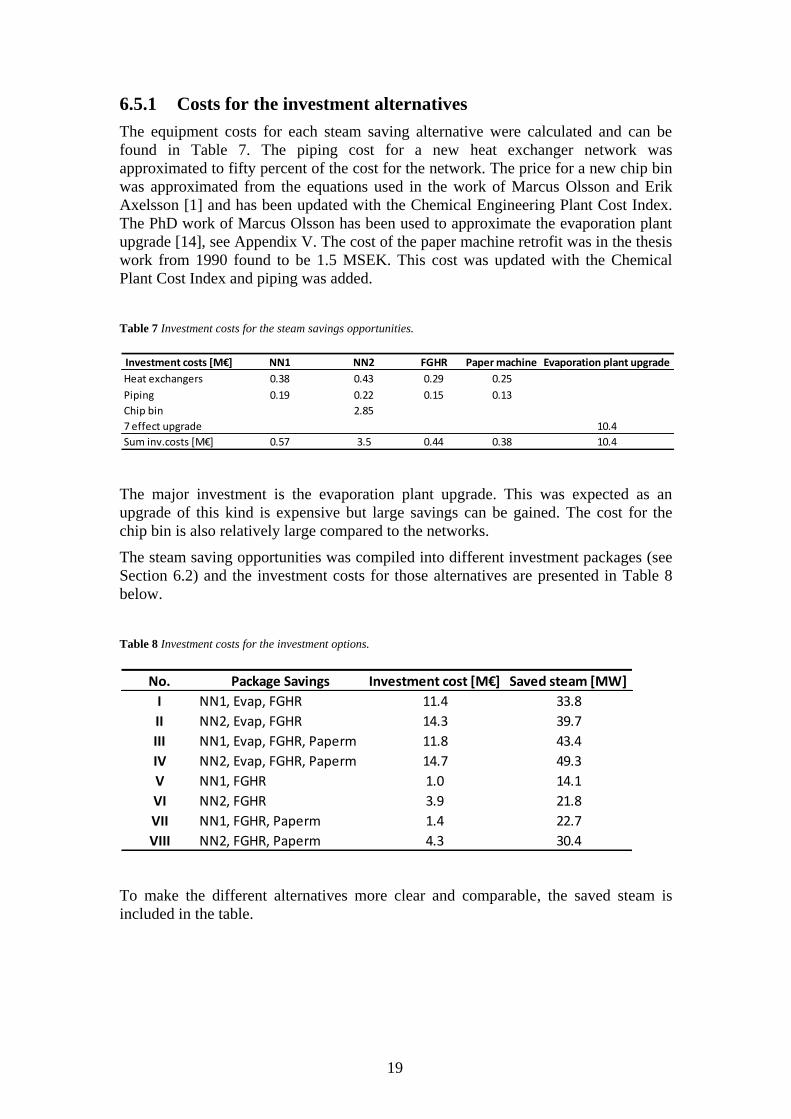
6.5.1 Costs for the investment alternatives
The equipment costs for each steam saving alternative were calculated and can be
found in Table 7. The piping cost for a new heat exchanger network was
approximated to fifty percent of the cost for the network. The price for a new chip bin
was approximated from the equations used in the work of Marcus Olsson and Erik
Axelsson [1] and has been updated with the Chemical Engineering Plant Cost Index.
The PhD work of Marcus Olsson has been used to approximate the evaporation plant
upgrade [14], see Appendix V. The cost of the paper machine retrofit was in the thesis
work from 1990 found to be 1.5 MSEK. This cost was updated with the Chemical
Plant Cost Index and piping was added.
Table 7 Investment costs for the steam savings opportunities.
The major investment is the evaporation plant upgrade. This was expected as an
upgrade of this kind is expensive but large savings can be gained. The cost for the
chip bin is also relatively large compared to the networks.
The steam saving opportunities was compiled into different investment packages (see
Section 6.2) and the investment costs for those alternatives are presented in Table 8
below.
Table 8 Investment costs for the investment options.
To make the different alternatives more clear and comparable, the saved steam is
included in the table.
Investment costs [M€] NN1 NN2 FGHR Paper machine Evaporation plant upgrade
Heat exchangers 0.38 0.43 0.29 0.25
Piping 0.19 0.22 0.15 0.13
Chip bin 2.85
7 effect upgrade 10.4
Sum inv.costs [M€] 0.57 3.5 0.44 0.38 10.4
No. Package Savings Investment cost [M€] Saved steam [MW]
I NN1, Evap, FGHR 11.4 33.8
II NN2, Evap, FGHR 14.3 39.7
III NN1, Evap, FGHR, Paperm 11.8 43.4
IV NN2, Evap, FGHR, Paperm 14.7 49.3
V NN1, FGHR 1.0 14.1
VI NN2, FGHR 3.9 21.8
VII NN1, FGHR, Paperm 1.4 22.7
VIII NN2, FGHR, Paperm 4.3 30.4

20
6.5.2 Investment costs for lignin separation
Lignin separation requires an investment in a separation plant. The cost for the plant
depends on the lignin separation rate. The investment costs are approximated with the
cost equation below [8] and can be found in Table 9.
LR is the separation rate [kg/s]
Lignin separation also requires rebuilding of the evaporation plant. In alternative V-
VIII, no steam savings are made but smaller changes to allow lignin separation, see
Appendix V. In alternative I-IV an evaporation plant upgrade is already included in
the steam savings investment. No additional investment is assumed to be necessary to
enable lignin separation.
Table 9 Investment costs for the separation plant and the extra costs needed to allow lignin separation in
alternative V-VIII.
6.5.3 Annual earnings from saving fuel
The annual earnings from saving fuel are represented below. The results are divided
into two cases; one based on low bark and electricity prices and the other based on
high bark and electricity prices [15]. Case I is calculated for a bark price of 20 €/MWh
and 66 €/MWh electricity price. Case II is based on a bark price of 34 €/MWh and an
electricity price of 94 €/MWh. Both cases include a cost for electricity certificates of
20 €/MWh and an annuity factor of 0.1.
Lignin separation Investment cost Investment cost Operational cost
No. [t/ADt] Separation plant [M€] evaporation plant[M€] [M€/yr]
I 0.14 9.4 - 1.6
II 0.17 10.8 - 2.0
III 0.18 10.9 - 2.1
IV 0.21 12.1 - 2.5
V 0.1 5.7 4.4 0.7
VI 0.1 7.5 4.4 1.1
VII 0.1 7.7 4.4 1.2
VIII 0.1 9.1 4.4 1.6

21
Table 10 Annual earnings from fuel savings. Case I calculated with a bark price of 20€/MWh and electricity price
of 66 €/MWh and Case II calculated with a bark price of 34 €/MWh and electricity price 94 €/MWh.
It is clearly profitable to save fuel. Comparing the two cases in €/MWh the largest
gains can be found for the lowest investment costs, i.e. alternatives V-VIII in which
the evaporation plant is omitted. The most obvious reason for that is the annualized
investment cost. Consequently the investment for the evaporation plant upgrade has a
large influence on the annual earnings.
6.5.4 Lignin price
The aim was to locate the breakeven point where the lignin separation becomes
equally profitable as saving fuel. This was done by setting the annual fuel earnings
equal to the earnings for lignin. Like in Section 6.5.3 above, both low and high bark
and electricity prices were used for the calculations giving two cases. Further, an
investment in a lignin separation plant is seen as a strategic investment with an
annuity factor of 0.1. The resulting lignin prices follow in the table below.
Table 11 Resulting required lignin prices for the investments based on low and high bark and electricity prices.
For case I the required lignin price vary between 30–36 €/MWh and in case II
between 44-51 €/MWh. The results are discussed in Section 7.2.2.
Fuel savings Investment cost
No. [GWh/yr] [ M€/yr] [€/MWh] [ M€/yr] [€/MWh] [M€]
I 287 2.9 10 6.8 24 11.4
II 360 3.5 10 8.2 23 14.3
III 370 3.9 11 8.7 24 11.8
IV 442 4.5 10 10 23 14.7
V 134 2.6 19 4.4 33 1.0
VI 206 3.6 18 6.4 31 3.9
VII 215 4.0 19 7.0 32 1.4
VIII 288 4.9 17 8.8 31 4.3
Case I Case II
Annual earnings
Lignin separation
No. [t/ADt] [€/t.Lignin] [€/MWh] [€/t.Lignin] [€/MWh]
II 0.14 200 30 297 45
II 0.17 196 30 292 44
III 0.18 197 30 293 45
IV 0.21 196 30 292 44
V 0.06 234 36 333 51
VI 0.09 213 32 313 48
VII 0.10 221 34 324 49
VIII 0.13 209 32 311 47
Case I Case II
Lignin price Lignin price

22

23
7 Discussion
7.1 Steam savings
The theoretical steam savings from the pinch analysis were found to be ~ 20 MW.
This is in the same range as the saving potential Axelsson has found [1] and
correspond to ~ 12% of today’s steam demand in the mills.
7.1.1 The GCC
The construction of the GCC is done with regard to how the system is constructed
today but also with a thought of how one would like to make changes. For example,
today a too large amount of hot water is produced and therefore reduced in the curve,
making the GCC a little bit different.
The GCC below shows today’s minimum hot utility demand without any changes
except for the hot and warm water consumption. The minimum hot utility demand is
160 MW and the cold utility demand 38 MW.
Figure 8 The grand composite curve without changes except for the hot and warm water consumption. Minimum
hot utility demand 160 MW and cold utility demand is 38 MW.
However, the focus is to make changes to achieve better energy efficiency. A large
pinch violation is the chip steaming that uses LP steam for pre-steaming the chips. As
the chips can be seen as a cold stream that needs to be heated to a certain temperature
(120°C) it is not necessary to heat it with LP steam as it is in the GCC above.
Therefore, the pre steaming is not a steam demand at 150°C and can instead be
represented as a cold stream at ~ 120°C. This lowers the hot and cold utility demand
with 6 MW respectively in the GCC, see GCC below. Constructing the curve this way

24
requires a change in the pre steaming (which would be desirable) which in turn
requires an investment in a new chip bin. LP steam entered the old chip bin and a
change means a change in chip bin construction if steam of a lower temperature is
used, flash steam for example. The new GCC below shows the same pinch
temperature (125°C) but a reduced hot and cold utility demand. The new demands are
154 MW and 32 MW respectively.
Figure 9 The grand composite curve with a hot utility demand of 154 MW and a cold utility demand 32 MW. In
GCC it is planned to make a change in the chip steaming, therefore the hot utility demand is 6MW less than in
Figure 8.
7.1.2 Turbine
Another investment option not considered would be a condensing turbine which could
produce electricity from the saved steam. This is neglected as quick calculations, not
presented here, show small gains. One could also invest in a larger back pressure
turbine and reach higher electricity production which in turn would reduce the
purchased electricity.
7.1.3 The evaporation plant upgrade and retrofits
I the evaporation plant, 15.8 MW could be saved by adding one effect. In the pinch
analysis, the surface condenser is represented as a hot stream with a condensation
temperature of 76ºC. As the evaporation plant was modelled as a black box, the
possible savings were calculated after the retrofit. Therefore, the retrofits have been
done on a six effect basis.
By adding an extra effect, the condensation temperature in the surface condenser
would be lower. The minimum temperature difference between the effects and the
boiling point increase has to be handled whereby the total ΔT over the plant increases.

25
This results in a lower temperature in the surface condenser, which might affect the
retrofit and it is possible that those would change. With a temperature of 60ºC in the
surface condenser, the same theoretical savings can be achieved. Though, with a
lower temperature (50ºC), the theoretical savings also decreases.
7.2 The economic investigation
In this section, the annual earnings from fuel savings are commented and the required
lignin price is compared with the annual earnings from saving fuel.
7.2.1 Lignin price and annual earnings from bark savings
To analyze this part, two levels of electricity and bark prices were used. The prices are
picked from ‘’Scenarios for assessing profitability and carbon balances of energy
investments in industry’’ [15]. The prices are based on a future energy scenario for the
year 2020 and the results can therefore not be seen as valid today.
The annual earnings from bark savings vary between 134–440 GWh/yr whereas the
earnings do not differ that much; 2.6–4.9 M€/yr for the lower electricity and bark
prices and 4.4–10 M€ for the higher, see Section 6.3 and 6.5.3. These annual earnings
can be compared with those found by Olsson et al.[8] where investments in new
turbines are proposed and thereby the electricity production is increased. The annual
earnings in their paper lie in the range of 2–4 M€ for an electricity price of 40 to 60
€/MWh. The results in this thesis, where an electricity price of 46 and 74 €/MWh is
used (the electricity certificates withdrawn), are in the same magnitude or even
higher. Another positive aspect by saving fuel is that no further investments than
those for the steam savings are required.
For the lignin separation to be profitable, the lignin price has to be equal or higher
than the required value of lignin. In alternative I-IV, the required lignin price is
between 1.3 and 1.5 times the bark price, which is comparable with the price of lignin
as a biofuel accordning to Erik Axelsson and Berntsson [12] where the lignin price is
~30% higher than the bark price. For the alternatives V-VIII and low bark prices, the
required lignin price vary between 1.6 and 1.8 times the bark price making it less
suitable as biofuel. However, for high bark prices, the lignin price vary between 1.4
and 1.5 times the bark price and might thereby be interesting for use as a biofuel. The
required value is also interesting to compare with the oil price since one possible way
to use the lignin is to replace oil as fuel. The heavy oil price in the future scenario
report mentioned above is 27 €/MWh, representing the same level as the low
electricity and bark prices whereas the higher heavy oil price is 51 €/MWh.
With low bark, electricity and oil prices, the required lignin value for alternatives I-
IV, VI and VIII (30–32 €/MWh) is comparable with the oil price. Though, the 3–5
€/MWh price difference suggests to save bark and not to extract lignin to replace the
oil in the mill. Still, to replace oil by lignin might be profitable in this case depending
on for example taxes not considered here. For alternative V and VII, the required
lignin price is far too high to suggest lignin separation as an interesting option if lignin
is priced relative to the oil price.
For the higher price level, the required lignin value for investment I-IV is lower than
the oil price, which promotes lignin as a replacement for oil as fuel. To burn lignin

26
instead of oil lowers the spending with 51 €/MWh minus the lignin production cost.
The required lignin price in alternative V-VIII (47–51 €/MWh) is a less clear case as
the price approaches the oil price.
The lignin separation requires a larger investment than the bark savings but on the
other hand it is more adaptable to future demands then the bark savings. If one
believes in lignin as a raw material for chemicals or materials in the future, it is of
interest to invest in a separation plant.

27
8 Conclusions
Large energy savings, between 14 and 49 MW, can be achieved in the mill. This
corresponds to 8–28% of today’s steam demand. The savings will of course be
individual for each mill and will probably lie somewhere in between.
The investment costs for the different investment alternatives vary between 1–15 M€
depending on chosen investment. The largest investment is the evaporation plant
upgrade, 10.4 M€.
The results show that it is clearly profitable to save fuel. From the investment
alternatives it is possible to make an annual profit of 2.5–10 M€/yr depending on the
bark and electricity prices.
By an investment in a lignin separation plant, it is possible to extract lignin for use
either as a fuel or as a high-grade chemical depending on the future situation. The mill
will be adaptable to future demands. The results show that a lignin price span of 30–
51 €/MWh will be required to make lignin profitable depending on chosen investment
and the bark and electricity prices. This is, for low bark and electricity prices and
alternatives I-IV, comparable with the price assumed in other studies where the price
for lignin as biofuel is ~ 30% higher than the bark price or equal to the oil price. This
is also true for alternatives V-VIII for high bark and oil prices.
With a bark price of 20 €/MWh and an oil price of 27 €/MWh, the required lignin
price in the investment alternatives is 30–36 €/MWh. With this price needed for the
lignin it is not beneficial to extract lignin for use as fuel. This mill would rather
choose not to separate the lignin but to save bark. Though, if other taxes for fossil
fuels than those considered here were in place lignin extraction could be interesting
for the required lignin price of 30 €/MWh. Another possibility is to sell lignin as a
high-grade chemical. It all depends on the future situation.
On the other hand, with an oil price of 51 €/MWh, the required lignin price vary in the
investment alternatives between 44–51 €/MWh depending on investment alternative
and lignin could thereby be interesting as a replacement for oil.

28

29
9 Future Work
A more exact analysis of the lignin price would be preferable. In this thesis the bark
and electricity prices are supposed to follow each other. If one goes up, the other also
does. It would be an interesting object to separate the bark and electricity prices and
make a deeper sensitivity analysis of the lignin price; to which of those, or other
parameters included, is the lignin price most sensitive.
Also, extreme bark and electricity prices are used in this thesis, and to analyze what
happens in between them would be of interest, e.g. how is the lignin price affected
between these values?

30
31
10 References
[1.] Axelsson E., Olsson M.R., Berntsson T. Heat integration opportunities in average
Scandinavian kraft pulp mills: A pinch analysis of model mills. Vol. 21(4), 2006, Nordic Pulp
and Paper Research Journal, pp. 466-475.
[2.] Stenberg Å., Mehmood Iqbal A. Heat Integration Opportunities in an Average
Scandinavian Integrated Pulp & Paper Mill using Pinch Analysis. Göteborg : Chalmers
University of Technology, 2007. Master thesis.
[3.] Axelsson E., Berntsson T. Pinch analysis of a model mill: Economic and environmental
gains from thermal processintegration in a state-of-the-art magazine paper mill. Vol. 20 (4)
2005, Nordic Pulp and Paper Research Journal, , pp. 308-315.
[4.] Axegård P. Overview of Pulp Mill Biorefinery Concepts at Innventia. Stockholm :
Innventia, 2009.
[5.] Division of Heat and Power Technology. Industrial Energy Systems. Göteborg : Chalmers
University of Technology, 2008. Course material.
[6.] Novator. Bränsleutredning In: Bränslehandboken.
http://www.novator.se/bioenergy/facts/fuelinvest.pdf. [Online] April 06, 2010. In Swedish.
[7.] Axelsson E. Energy Export Opportunities from Kraft Pulp and Paper Mills and Resulting
Reductions in Global CO2 Emissions. Department of Energy and Environment, Heat and
Power Technology. Göteborg : Chalmers University of Technology, 2008. PhD Thesis.
[8.] Olsson M.R., Axelsson E., Berntsson T. Exporting lignin or power from heat-integrated
kraft pulp mills: A techno economic comparison using model mills. Vol. 21 (4) 2006, Nordic
Pulp and Paper Research Journal, pp. 476-484.
[9.] Brännvall E. Wood Chemistry and Cellulose Technology II. Göteborg : Chalmers
University of Technology, 2006. pp. 1-24. Chapter 19.
[10.] Delin L., Berglin N., Samuelsson Å., Lundström A., Backlund B., Sivard Å., Andersson
R., Åberg M. Kraftliner Mill, FRAM 11. Stockholm: STFI 2005. (Confidential)
[11.] Swärd P. Tillämpning av pinchteknik på ASSI kraftliner, Piteå. Departement of Energy
and Environment, Heat and Power Technology. Göteborg : Chalmers University of
Technology, 1990. p. 33. Master thesis (In Swedish).
[12.] Axelsson E., Berntsson T. Profitability and off-site CO2 reduction from energy savings in
the pulp and paper industry in different future energy markets. Paper VIII in Ph.D thesis
Axelsson E. Energy Export Opportunities from Kraft Pulp and Paper Mills and Resulting
Reductions in Global CO2 Emissions. Department of Energy and Environment, Heat and
Power Technology. Göteborg : Chalmers University of Technology, 2008. PhD Thesis.
[13.] Lundström A., Persson J. System analysis at the Mörrum mill, FRAM 2. Stockholm:
STFI-Packforsk 2008. s. 23, Report no. B2. (confidential)

32
[14.] Olsson M. Simulations of Evaporation Plants in Kraft Pulp Mills. Departement of Energy
and Environment, Heat and Power Technology. Göteborg : Chalmers University of
Technology, 2009. PhD thesis
[15.] Axelsson E., Harvey S. Scenarios for assessing profitability and carbon balances of
energy investments in industry. Göteborg : AGS, the alliance for global sustainability, 2010. p.
33, AGS, Pathways report 2010: EU1.
[16.] Lundqvist F, Öhman F, Sjögren S, Jensen A. Separartion of lignin and hemicelluloses
from alkaline process liquors. Stockholm : Innventia, 2009.
[17.] Theliander H., Paulsson M., Brelid H. Introduktion tll massa- och pappersframställning.
Göteborg : Chalmers Tekniska Högskola, 2000. Course material in the course Cellulosateknik,
(In Swedish).
[18.] Olsson M., Berntsson T. Extracting lignin from back liqour: Consequences for the
evaporation plant , Paper V in PhD thesis Olsson M. Simulations of Evaporation Plants in
Kraft Pulp Millls. Department of Energy and Environment, Heat and Power Technology.
Göteborg : Chalmers University of Technology, 2009.
[19.] Olsson M. Comparing conventional evaporation plants with plants using excess heat: A simulation study, Paper VI in PhD thesis Olsson M. Simulations of Evaporation Plants in Kraft Pulp Mills. Department of Energy and Environment, Heat and Power Technology. Göteborg : Chalmers University of Technology, 2009.
[20.] Metso. In: Pulp and Paper. http://www.metso.com/pulpandpaper/recovery_boiler_prod.nsf/WebWID/WTB-090513-
22575-6FE87?OpenDocument . [Online] Maj 12, 2010.

33
Appendix I – Steam consumption
HP steam MW
Back pressure turbine 21.9
Blow down recovery boiler 0.2
Blow down bark boiler 0.1
Soot blowing recovery boiler 10.4
Soot blowing bark boiler 1.0
Total HP steam 33.6
MP steam MW
Digesting 17.2
Linerboard 51.4
RCF 1.9
Miscellaneous, losses 3.6
Total MP steam 74.1
LP steam MW
Woodyard 1.4
Stripper 5.4
Causticising 0.5
Linerboard 6.6
Hot water prod 3.4
Heating etc 1.8
Digesting-chip steaming 5.9
Evaporation 38.8
Miscellaneous, losses 3.1
Total LP steam 66.8
Sum steam consumption 174.5

34

35
Appendix II – Stream Data
Stream nr. Hot streams Tstart [° C] Ttarget [° C] Load [MW]
2 General cooling 40 35 7.1
3 Cooling in recycled fibre plant 52.9 45 6.4
4 Smelt dissolver condensor 100 99.9 1.8
5 Digester bottom 87.3 81 2.4
6 Black liquor 105.5 90 4.2
7 Flash steam 191 105 104 6.2
8 Flash steam 302 - hx with chip steaming 127 126 10.6
9 Excess steam 127 126 2.8
10 Stripper condenser 100 99 3.7
11 Stripper sec. cond. 90 89 0.4
12 Effluent recycled fibre plant 45 37 3.6
13 Effluent pulpwashing 71.8 37 1.3
14 Effluent liq steam condensate (evap.plant) 75 37 0.9
15 Surface condensor 76 75 38.3
Cold streams Tstart [° C] Ttarget [° C] Load [MW]
18 WW production 50 18 50 16.9
19 HW production 85 50 85 7.9
22 Digester top (MP 8bar) 160.7 165.6 8.3
23 Digester down (MP 8bar) 119.5 155 8.8
LP to evaporation 150 151 38.8
LP to stripper 150 151 5.4
26 Chip steaming (flash 302) 99 100 10.6
27 Chip steaming (LP-str 305) 119 121 5.9
MP to recycled fibre plant 200 201 1.9
MP to linerboard 200 201 51.4
HP blow down recovery boiler 450 451 0.2
HP blow down bark boiler 450 451 0.1
HP soot blowing recovery boiler 450 451 10.4
HP soot blowing bark boiler 450 451 1
34 Make up water to boiler 18 100 5.6
35 Wood yard (LP) 18 35 1.4
36 Office heating 45 50 1.8
37 White water/pick up water (LP) 60 70 6.6
Turbine 450 451 21.9
Miscellaneous,losses MP 200 201 3.6
Miscellaneous,losses LP 150 151 3.1

36

37
Appendix III – Paper machine savings
The steam savings in the paper machine are scaled from a thesis work written 1990 by
Per Swärd for Smurfit Kappa in Piteå [4].
In 1989 the liner production in the investigated liner machine was 257 871 t/yr and the
steam saving potential was found to be 6 MW.
For the FRAM 11 type mill, the liner production is 417 000 t/yr.
The possible savings in the paper machine were therefore scaled with a factor of 1.62
(= 257 871/417 000).
This represents a maximum steam saving potential of 9.6 MW.

38

39
Appendix IV – Evaporation plant upgrade
The existing plant is a 6-effect evaporation plant but today the efficiency is equivalent
to 5.5 effects. A natural choice would be to add one more effect and thereby reduce
the live steam demand.
The dry solids content is supposed to increase from 72% to 75% which increases the
heating value and thereby also the steam production. The dry solids content before the
evaporation is 12.6%.
The evaporation plant is modeled as a black box and no information is given about the
streams within the plant. To make a steam saving approximation the change in total
steam demand is estimated according to the following calculations:
for water in the temperature span 90 – 130ºC.
The expression within brackets is the water separated from the black liquor stream
This gives
This result is to be compared with today’s 38.8 MW. The potential savings are

40

41
Appendix V – Investment costs for the evaporation plant
Evaporation plant upgrade, investment alternative I-IV
The calculations are approximated from Marcus Olssons PhD work, ’’Simulations of
Evaporation Plants in Kraft Pulp Mills’’ [14] and based on keeping 4 old effects and
investing in 3 new effects. The net increase is therefore from 6 to 7 effects.
The capacity in the pulp mill is 359 ton water per hour [18] and for the mill in this
thesis 293 ton water per hour [10]. The area of the 7-effect evaporation plant is
26 300 m2 [19] and to fit this mill, the area was scaled: 26300 m
2*(293/359) = 21465
m2 ~ 21500 m
2. The area per effect was approximated to 21500/7.
To calculate the investment cost, the equation Ievap= C1(1.3 n1 + n2-6) + C2 (1.3A1 + A2-6)
was used where C1 = 1.82 M€ and C2= 17.3*10^-3 M€/m2
whereas n1 is the first effect
(n1=1) and n2-6 is the new effects 2 and 3 (n2-6=2) [14]. The approximated investment
cost is 10.4 M€, which is included in alternative I-IV.
Least cost to allow lignin separation, investment alternative V-VIII
In investment alternatives V – VIII, steam savings in the evaporation plant are
omitted, though, to allow lignin separation an area extension is needed in the
evaporation plant. Below, the basis of calculations is presented:
According to Olsson and Berntsson, an area extension of 39% is needed to allow
lignin separation and the separation rate in his work is 0.292 t/ADt [18]. For
investment alternative V-VIII in this mill, the separation rate is around 0.1 t/ADt.
To allow lignin separation, the area extension was scaled to fit this mill:
Aextension = 0.1/0.292*0.39 = 0.134 giving an area increase in %. The total area of the
mill was scaled: Atot = 20200 m2
* (293/359) = 16 486 m2. Consequently, the final
area extension for the evaporation plant is approximately
Atot*Aextension=16490*0.134=2210 m2.
To calculate the cost for the area extension, the equation
Ievap = C1(1.3 n1 + n2-6) + C2 (1.3A1 + A2-6) has been used [14]. The cost for the area
extension was thereby approximated to 4,4 M€.

42

43
Appendix VI – Steam savings from FGHR
The hot flue gases are supposed to be cooled from 175ºC to 100ºC without any acid
precipitation [13]. A heat exchanger is placed in the chimney and a closed circulating
water system transfer the heat from the flue gases to preheat the air to the recovery
boiler.
By heat exchanging this way is 4.3 MW saved.
The air to the boiler requires a ΔTmin of 18 K and the temperature of the air to the heat
exchanger is 35ºC. Thereby, the water temperature leaving the heat exchanger needs
to be 53ºC. This gives for the water.
An illustration of the system can be seen in the figure below.
Figure VI 1 An illustration of the FGHR. Possible savings are 4.3 MW.
Air to recovery boiler, 128 °C
Heat exchanger
Air 35°C
Flue gas, 175 °C
4,3 MW saved steam
Flue gas, 100 °C Water, 53 °C
Water, 157 °C

44

45
Appendix VII – Existing network

46

47
Appendix VIII – Retrofit proposal NN1

48

49
Appendix IX – Retrofit proposal NN2