OPG REPORTS 2018 FIRST QUARTER FINANCIAL … · OPG REPORTS 2018 FIRST QUARTER FINANCIAL RESULTS ....
74
1 May 15, 2018 OPG REPORTS 2018 FIRST QUARTER FINANCIAL RESULTS Strong results attributable to former Lakeview generating station land sale and continued strong nuclear generation performance [Toronto]: – Ontario Power Generation Inc. (OPG or Company) today reported net income attributable to the Shareholder of $535 million for the first quarter of 2018, inclusive of a one-time after-tax gain of $205 million related to the sale of the former Lakeview generating station (GS) property, compared to $64 million for the same period in 2017. “As Ontario’s publicly-owned electricity generator, we are pleased to report our strong first quarter results that have resulted in significant net income to our shareholder, the Province of Ontario. We remain focused on continuing to supply Ontario with safe, reliable, and low-cost power that is more than 99 per cent free of greenhouse gas emissions to help moderate customer’s electricity bills, and are investing in our assets for the benefit of Ontarians for years to come,” said Jeff Lyash, OPG President and CEO. “Canada’s single largest investment in low-cost, clean energy, the refurbishment of the Darlington Nuclear Station, remains on time and on budget due to the hard work and dedication of our employees and partners. Refurbishing this public asset will ensure OPG remains Ontario’s largest provider of low-cost electricity for another 30 years, generating clean power that is virtually free of carbon emissions.” Lyash continued, “In addition to investing in the Darlington Nuclear Station, OPG has begun the relicensing process to keep the Pickering Nuclear Station operating until 2024. Running Pickering until 2024 will save electricity customers up to $600 million and benefit Ontario by contributing over $12 billion to the economy. Pickering remains a safe, efficient and reliable public asset that can continue to supply low-cost electricity for up to 1.5 million homes each day, with almost no carbon emissions.” “Major contributors to the strong financial results for the quarter include the one-time gain on the sale of OPG’s former Lakeview generating station lands in Mississauga, Ontario in March, the net proceeds of which will be transferred to our shareholder, and the continued strong nuclear generation performance,” added Lyash. “In the same month as the Lakeview sale, a special dividend of $283 million from last year’s sale of our head office premises was transferred to the Province.” The increase in net income in the first quarter of 2018 is also attributable to the impact of the new regulated prices for OPG’s nuclear and most of its hydroelectric generation,
Transcript of OPG REPORTS 2018 FIRST QUARTER FINANCIAL … · OPG REPORTS 2018 FIRST QUARTER FINANCIAL RESULTS ....
1
May 15, 2018
OPG REPORTS 2018 FIRST QUARTER FINANCIAL RESULTS
Strong results attributable to former Lakeview generating station land sale and continued strong nuclear generation performance
[Toronto]: – Ontario Power Generation Inc. (OPG or Company) today reported net income attributable to the Shareholder of $535 million for the first quarter of 2018, inclusive of a one-time after-tax gain of $205 million related to the sale of the former Lakeview generating station (GS) property, compared to $64 million for the same period in 2017. “As Ontario’s publicly-owned electricity generator, we are pleased to report our strong first quarter results that have resulted in significant net income to our shareholder, the Province of Ontario. We remain focused on continuing to supply Ontario with safe, reliable, and low-cost power that is more than 99 per cent free of greenhouse gas emissions to help moderate customer’s electricity bills, and are investing in our assets for the benefit of Ontarians for years to come,” said Jeff Lyash, OPG President and CEO. “Canada’s single largest investment in low-cost, clean energy, the refurbishment of the Darlington Nuclear Station, remains on time and on budget due to the hard work and dedication of our employees and partners. Refurbishing this public asset will ensure OPG remains Ontario’s largest provider of low-cost electricity for another 30 years, generating clean power that is virtually free of carbon emissions.” Lyash continued, “In addition to investing in the Darlington Nuclear Station, OPG has begun the relicensing process to keep the Pickering Nuclear Station operating until 2024. Running Pickering until 2024 will save electricity customers up to $600 million and benefit Ontario by contributing over $12 billion to the economy. Pickering remains a safe, efficient and reliable public asset that can continue to supply low-cost electricity for up to 1.5 million homes each day, with almost no carbon emissions.” “Major contributors to the strong financial results for the quarter include the one-time gain on the sale of OPG’s former Lakeview generating station lands in Mississauga, Ontario in March, the net proceeds of which will be transferred to our shareholder, and the continued strong nuclear generation performance,” added Lyash. “In the same month as the Lakeview sale, a special dividend of $283 million from last year’s sale of our head office premises was transferred to the Province.” The increase in net income in the first quarter of 2018 is also attributable to the impact of the new regulated prices for OPG’s nuclear and most of its hydroelectric generation,
2
resulting from the Ontario Energy Board’s (OEB) decision on OPG’s application for new regulated prices for the 2017-2021 period issued in December 2017. The OEB issued the final payment amounts order on the application in March 2018, allowing OPG to begin collecting revenues based on the new regulated prices. Taking into account the impact of the OEB’s decision, OPG continues to provide electricity at a price that is approximately 40 per cent less than the average of other generators. OPG is the only electricity generator in Ontario that has its prices set through a public hearing process by the OEB. Generating and Operating Performance
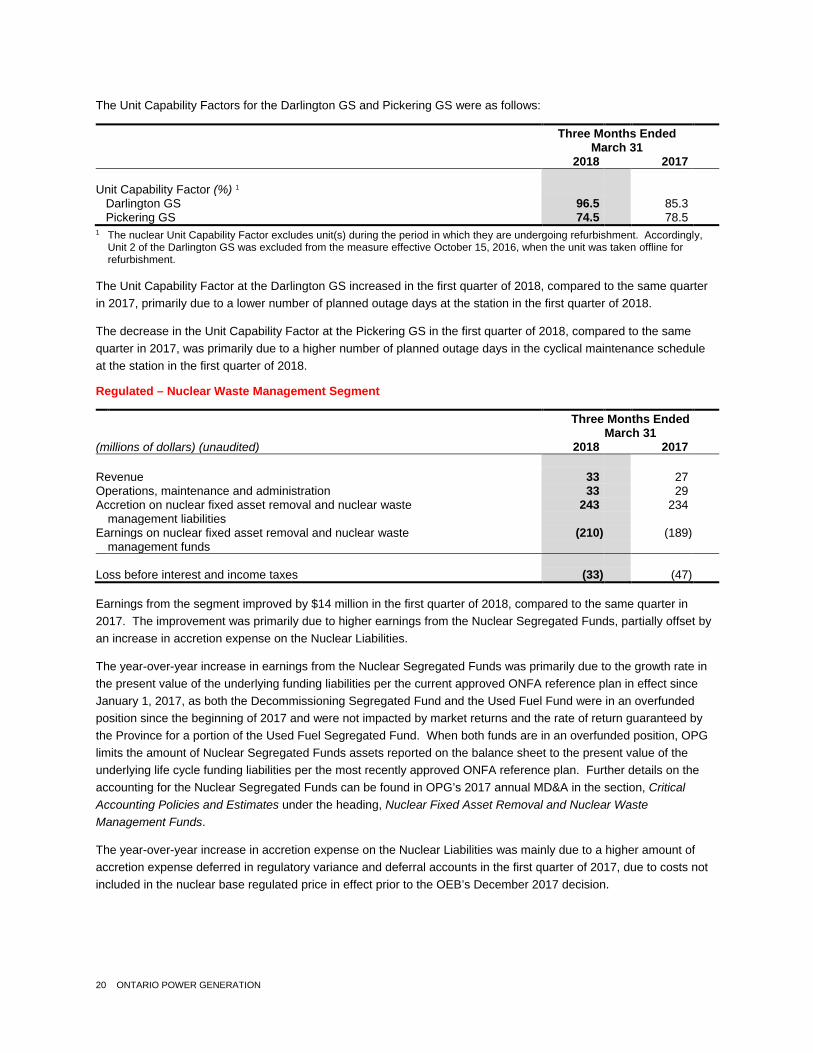
Electricity generated during the three months ended March 31, 2018 increased to 18.8 terawatt hours (TWh) from 18.6 TWh for the same quarter in 2017. Regulated – Nuclear Generation Segment Higher nuclear generation of 0.4 TWh during the three months ended March 31, 2018 was primarily due to fewer planned outage days at the Darlington GS. For the three months ended March 31, 2018, the unit capability factor for the operating units at the Darlington GS was 96.5 per cent, compared to 85.3 per cent for the same quarter in 2017. The increase was primarily due to a lower number of planned outage days at the station. At the Pickering GS, the unit capability factor decreased to 74.5 per cent for 2018, compared to 78.5 per cent for the same quarter in 2017, primarily due to a higher number of planned outage days in the cyclical maintenance schedule at the station in the first quarter of 2018. Regulated – Hydroelectric Segment Lower generation from the regulated hydroelectric stations of 0.3 TWh during the three months ended March 31, 2018, compared to the same quarter in 2017, was primarily due to lower water flows on the northwestern and eastern Ontario river systems. The availability of 87.3 per cent at these stations in 2018 was lower than 89.5 per cent for the same quarter in 2017. The decrease in the availability was primarily due to a higher number of unplanned outage days at the eastern and northeastern Ontario regions’ regulated hydroelectric stations. Contracted Generation Portfolio Segment Generation from the Contracted Generation Portfolio during the three months ended March 31, 2018 increased by 0.1 TWh compared to the same quarter in 2017. The availability of these hydroelectric stations for the three months ended March 31, 2018 was 80.1 per cent, compared to 83.6 per cent for the same quarter in 2017. The decrease in the availability was primarily due to a higher number of planned outage days at the Little Long GS on the Lower Mattagami River.
3
Total Generating Cost The Enterprise Total Generating Cost per megawatt hour (MWh) was $49.84 for the three months ended March 31, 2018, compared to $47.86 for the same quarter in 2017. The increase was mainly a result of higher operations, maintenance and administration expenses and higher sustaining capital expenditures, partially offset by higher nuclear electricity generation. Generation Development OPG is undertaking a number of generation development and life extension projects in support of Ontario’s electricity planning initiatives. Significant developments during the first quarter of 2018 were as follows:
Darlington Refurbishment The Darlington Refurbishment project is expected to extend the operating life of the four-unit Darlington GS by approximately 30 years. In early May 2018, OPG completed the removal of the existing reactor components, signifying the completion of the second major segment of the Unit 2 refurbishment. The refurbishment of Unit 2 has now transitioned into the third major segment, the installation and reassembly of reactor components. The Darlington Refurbishment project continues to track on schedule and to the $12.8 billion budget.
In addition to the execution of refurbishment activities on Unit 2, OPG is progressing with planning activities on the refurbishment of Unit 3 and ensuring that lessons learned from the Unit 2 refurbishment are being incorporated. OPG is also entering into commitments to procure major components that require long lead times. Execution of the prerequisite activities for the Unit 3 refurbishment have commenced. The Unit 3 refurbishment is expected to commence upon the return to service of Unit 2. As of March 31, 2018, $137 million has been invested in planning and prerequisite activities related to the refurbishment of Unit 3. In February 2018, the Government of Ontario confirmed its commitment to proceed with the refurbishment of Unit 3.
Total life-to-date capital expenditures on the project were approximately $4.7 billion as at March 31, 2018.
Ranney Falls Hydroelectric GS In 2017, OPG began construction work on a 10 MW single-unit powerhouse on the existing Ranney Falls GS site. The new unit will replace an existing unit that reached its end of life in 2014. Construction continues in the expanded forebay, powerhouse and spillway area. Fabrication of the sectional gates and two head gates has been completed, with assembly and site delivery in progress. Turbine and generator unit fabrication is also in progress. The project’s expected in-service date is in the fourth quarter of 2019, with a budget of $77 million. The project is tracking on schedule and on budget. The Ranney Falls GS is included in the Regulated – Hydroelectric segment.
Nanticoke Solar Facility The project encompasses the construction of a 44 MW solar facility at OPG’s Nanticoke GS site and adjacent lands under a contract with the Independent Electricity

4
System Operator, through Nanticoke Solar LP, a partnership between OPG and a subsidiary of the Six Nations of Grand River Development Corporation. Significant contracts for equipment and engineering construction services were executed and site preparation commenced in the first quarter of 2018. The facility is expected to be completed in the first quarter of 2019, with a budget of $107 million. The project is included in the Contracted Generation Portfolio segment.
5
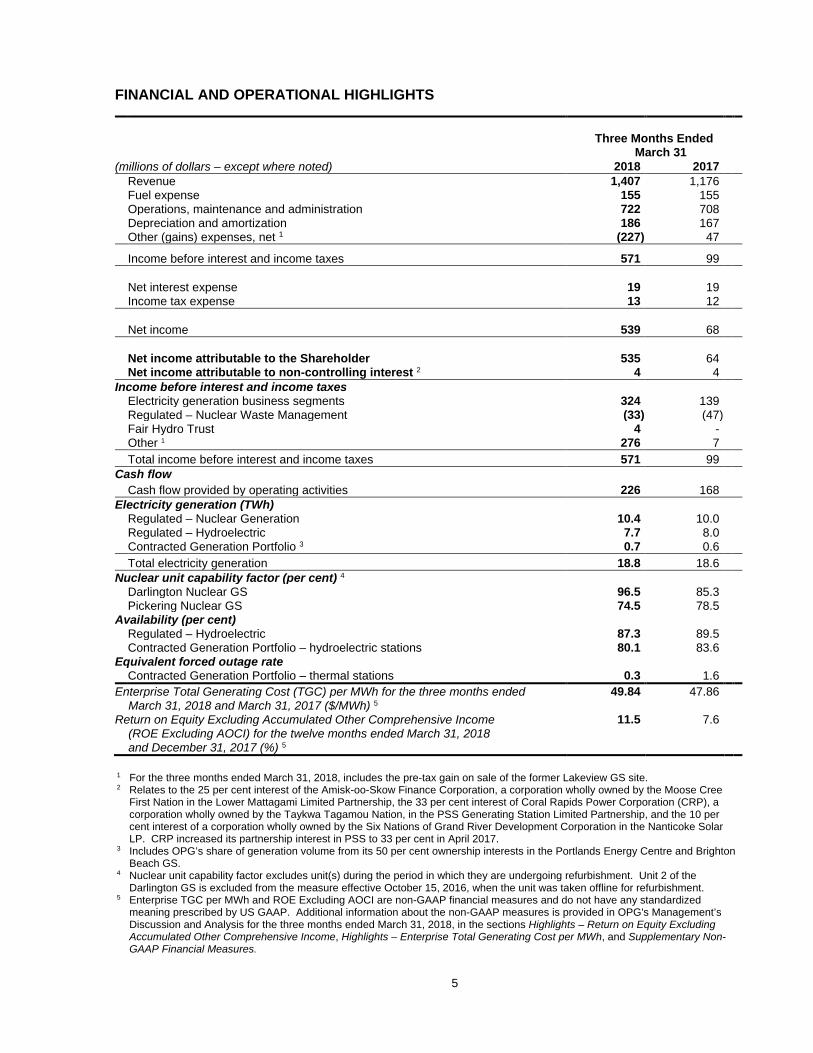
FINANCIAL AND OPERATIONAL HIGHLIGHTS Three Months Ended March 31 (millions of dollars – except where noted) 2018 2017 Revenue 1,407 1,176 Fuel expense 155 155 Operations, maintenance and administration 722 708 Depreciation and amortization 186 167 Other (gains) expenses, net 1 (227) 47
Income before interest and income taxes 571 99 Net interest expense 19 19 Income tax expense 13 12 Net income 539 68 Net income attributable to the Shareholder 535 64 Net income attributable to non-controlling interest 2 4 4 Income before interest and income taxes Electricity generation business segments 324 139 Regulated – Nuclear Waste Management (33) (47) Fair Hydro Trust 4 - Other 1 276 7 Total income before interest and income taxes 571 99 Cash flow Cash flow provided by operating activities 226 168 Electricity generation (TWh) Regulated – Nuclear Generation 10.4 10.0 Regulated – Hydroelectric 7.7 8.0 Contracted Generation Portfolio 3 0.7 0.6 Total electricity generation 18.8 18.6 Nuclear unit capability factor (per cent) 4 Darlington Nuclear GS 96.5 85.3 Pickering Nuclear GS 74.5 78.5 Availability (per cent) Regulated – Hydroelectric 87.3 89.5 Contracted Generation Portfolio – hydroelectric stations 80.1 83.6 Equivalent forced outage rate Contracted Generation Portfolio – thermal stations 0.3 1.6 Enterprise Total Generating Cost (TGC) per MWh for the three months ended 49.84 47.86 March 31, 2018 and March 31, 2017 ($/MWh) 5 Return on Equity Excluding Accumulated Other Comprehensive Income 11.5 7.6 (ROE Excluding AOCI) for the twelve months ended March 31, 2018 and December 31, 2017 (%) 5
1 For the three months ended March 31, 2018, includes the pre-tax gain on sale of the former Lakeview GS site. 2 Relates to the 25 per cent interest of the Amisk-oo-Skow Finance Corporation, a corporation wholly owned by the Moose Cree
First Nation in the Lower Mattagami Limited Partnership, the 33 per cent interest of Coral Rapids Power Corporation (CRP), a corporation wholly owned by the Taykwa Tagamou Nation, in the PSS Generating Station Limited Partnership, and the 10 per cent interest of a corporation wholly owned by the Six Nations of Grand River Development Corporation in the Nanticoke Solar LP. CRP increased its partnership interest in PSS to 33 per cent in April 2017.
3 Includes OPG’s share of generation volume from its 50 per cent ownership interests in the Portlands Energy Centre and Brighton Beach GS.
4 Nuclear unit capability factor excludes unit(s) during the period in which they are undergoing refurbishment. Unit 2 of the Darlington GS is excluded from the measure effective October 15, 2016, when the unit was taken offline for refurbishment.
5 Enterprise TGC per MWh and ROE Excluding AOCI are non-GAAP financial measures and do not have any standardized meaning prescribed by US GAAP. Additional information about the non-GAAP measures is provided in OPG's Management’s Discussion and Analysis for the three months ended March 31, 2018, in the sections Highlights – Return on Equity Excluding Accumulated Other Comprehensive Income, Highlights – Enterprise Total Generating Cost per MWh, and Supplementary Non-GAAP Financial Measures.
6
Ontario Power Generation Inc. is an Ontario-based electricity generation company whose principal business is the generation and sale of electricity in Ontario. Our mission is providing low cost power in a safe, clean, reliable and sustainable manner for the benefit of our customers and shareholder.
Ontario Power Generation Inc.’s unaudited interim financial statements and Management’s Discussion and Analysis as at and for the three months ended March 31, 2018 can be accessed on OPG’s web site (www.opg.com), the Canadian Securities Administrators’ web site (www.sedar.com), or can be requested from the Company.
For further information, please contact: Investor Relations 416-592-6700 [email protected]
Media Relations 416-592-4008 1-877-592-4008
- 30 -
ONTARIO POWER GENERATION INC.
MANAGEMENT’S DISCUSSION AND ANALYSIS
2018 FIRST QUARTER REPORT
TABLE OF CONTENTS
Forward-Looking Statements 2 The Company 3 Highlights 4 Core Business, Strategy, and Outlook 10 Environmental, Social, Governance, and Sustainability 18 Discussion of Operating Results by Business Segment 19
Regulated – Nuclear Generation Segment 19 Regulated – Nuclear Waste Management Segment 20 Regulated – Hydroelectric Segment 21 Contracted Generation Portfolio Segment 22 Fair Hydro Trust Segment 22
Liquidity and Capital Resources 23 Balance Sheet Highlights 25 Changes in Accounting Policies and Estimates 26 Risk Management 26 Related Party Transactions 28 Internal Controls over Financial Reporting and Disclosure Controls 30 Quarterly Financial Highlights 30 Supplementary Non-GAAP Financial Measures 32
2 ONTARIO POWER GENERATION
ONTARIO POWER GENERATION INC. MANAGEMENT’S DISCUSSION AND ANALYSIS
This Management’s Discussion and Analysis (MD&A) should be read in conjunction with the unaudited interim consolidated financial statements and accompanying notes of Ontario Power Generation Inc. (OPG or Company) as at and for the three months ended March 31, 2018. OPG’s unaudited interim consolidated financial statements are prepared in accordance with United States generally accepted accounting principles (US GAAP) and are presented in Canadian dollars.
For a complete description of OPG’s corporate strategies, risk management, corporate governance, and the effect of critical accounting policies and estimates on OPG’s results of operations and financial condition, this MD&A should also be read in conjunction with OPG’s audited consolidated financial statements, accompanying notes, Annual Information Form, and MD&A as at and for the year ended December 31, 2017.
As required by Ontario Regulation 395/11, as amended, a regulation under the Financial Administration Act (Ontario) (FAA), OPG adopted US GAAP for the presentation of its consolidated financial statements, effective January 1, 2012. Since January 1, 2012, OPG also has received exemptive relief from the Ontario Securities Commission (OSC) that allows OPG to apply US GAAP instead of International Financial Reporting Standards (IFRS). In April 2018, the OSC approved an exemption which allows the Company to continue to apply US GAAP up to January 1, 2024. The term of the exemption is subject to certain conditions, which may result in the expiry of the exemption prior to January 1, 2024. For details, refer to the section, Changes in Accounting Policies and Estimates under the heading, Exemptive Relief for Reporting under US GAAP. This MD&A is dated May 15, 2018.
FORWARD-LOOKING STATEMENTS
The MD&A contains forward-looking statements that reflect OPG’s current views regarding certain future events and circumstances. Any statement contained in this document that is not current or historical is a forward-looking statement. OPG generally uses words such as “anticipate”, “believe”, “foresee”, “forecast”, “estimate”, “expect”, “schedule”, “intend”, “plan”, “project”, “seek”, “target”, “goal”, “strategy”, “may”, “will”, “should”, “could”, and other similar words and expressions to indicate forward-looking statements. The absence of any such word or expression does not indicate that a statement is not forward-looking.
All forward-looking statements involve inherent assumptions, risks, and uncertainties, including those set out in the section, Risk Management, and forecasts discussed in the section, Core Business, Strategy, and Outlook. All forward-looking statements could be inaccurate to a material degree. In particular, forward-looking statements may contain assumptions such as those relating to OPG’s generating station performance and availability, fuel costs, surplus baseload generation (SBG), cost of fixed asset removal and nuclear waste management, performance and earnings of investment funds, refurbishment of existing facilities, development and construction of new facilities, pension and other post-employment benefit (OPEB) obligations and funds, income taxes, proposed new legislation, the ongoing evolution of Ontario’s electricity industry, environmental and other regulatory requirements, operating licence applications to the Canadian Nuclear Safety Commission (CNSC), health, safety and environmental developments, business continuity events, the weather, financing and liquidity, applications to the Ontario Energy Board (OEB) for regulatory prices, the impact of regulatory decisions by the OEB, Ontario’s Fair Hydro Plan and forecasts of earnings, cash flows, Return on Equity Excluding Accumulated Other Comprehensive Income (ROE Excluding AOCI), Total Generating Cost (TGC), Operations, Maintenance and Administration (OM&A) expenditures, retention of critical talent, supplier and third party performance, and project expenditures. Accordingly, undue reliance should not be placed on any forward-looking statement. The forward-looking statements included in this
ONTARIO POWER GENERATION 3
MD&A are made only as of the date of this MD&A. Except as required by applicable securities laws, OPG does not undertake to publicly update these forward-looking statements to reflect new information, future events, or otherwise.
THE COMPANY
OPG is an Ontario-based electricity generation company whose principal business is the generation and sale of electricity in Ontario. OPG was established under the Business Corporations Act (Ontario) and is wholly owned by the Province of Ontario (Province or Shareholder).
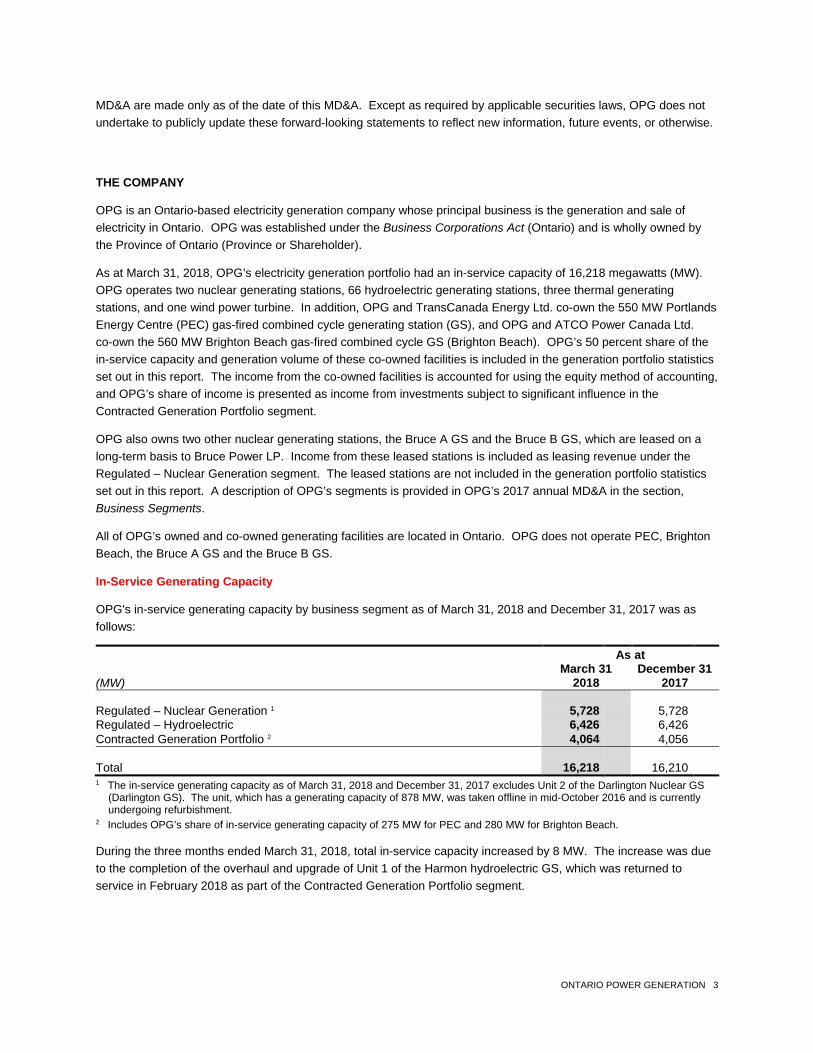
As at March 31, 2018, OPG’s electricity generation portfolio had an in-service capacity of 16,218 megawatts (MW). OPG operates two nuclear generating stations, 66 hydroelectric generating stations, three thermal generating stations, and one wind power turbine. In addition, OPG and TransCanada Energy Ltd. co-own the 550 MW Portlands Energy Centre (PEC) gas-fired combined cycle generating station (GS), and OPG and ATCO Power Canada Ltd. co-own the 560 MW Brighton Beach gas-fired combined cycle GS (Brighton Beach). OPG’s 50 percent share of the in-service capacity and generation volume of these co-owned facilities is included in the generation portfolio statistics set out in this report. The income from the co-owned facilities is accounted for using the equity method of accounting, and OPG’s share of income is presented as income from investments subject to significant influence in the Contracted Generation Portfolio segment.
OPG also owns two other nuclear generating stations, the Bruce A GS and the Bruce B GS, which are leased on a long-term basis to Bruce Power LP. Income from these leased stations is included as leasing revenue under the Regulated – Nuclear Generation segment. The leased stations are not included in the generation portfolio statistics set out in this report. A description of OPG’s segments is provided in OPG’s 2017 annual MD&A in the section, Business Segments.
All of OPG’s owned and co-owned generating facilities are located in Ontario. OPG does not operate PEC, Brighton Beach, the Bruce A GS and the Bruce B GS.
In-Service Generating Capacity
OPG's in-service generating capacity by business segment as of March 31, 2018 and December 31, 2017 was as follows:
As at March 31 December 31 (MW) 2018 2017 Regulated – Nuclear Generation 1 5,728 5,728 Regulated – Hydroelectric 6,426 6,426 Contracted Generation Portfolio 2 4,064 4,056 Total 16,218 16,210 1 The in-service generating capacity as of March 31, 2018 and December 31, 2017 excludes Unit 2 of the Darlington Nuclear GS
(Darlington GS). The unit, which has a generating capacity of 878 MW, was taken offline in mid-October 2016 and is currently undergoing refurbishment.
2 Includes OPG’s share of in-service generating capacity of 275 MW for PEC and 280 MW for Brighton Beach.
During the three months ended March 31, 2018, total in-service capacity increased by 8 MW. The increase was due to the completion of the overhaul and upgrade of Unit 1 of the Harmon hydroelectric GS, which was returned to service in February 2018 as part of the Contracted Generation Portfolio segment.
4 ONTARIO POWER GENERATION
HIGHLIGHTS
Overview of Results
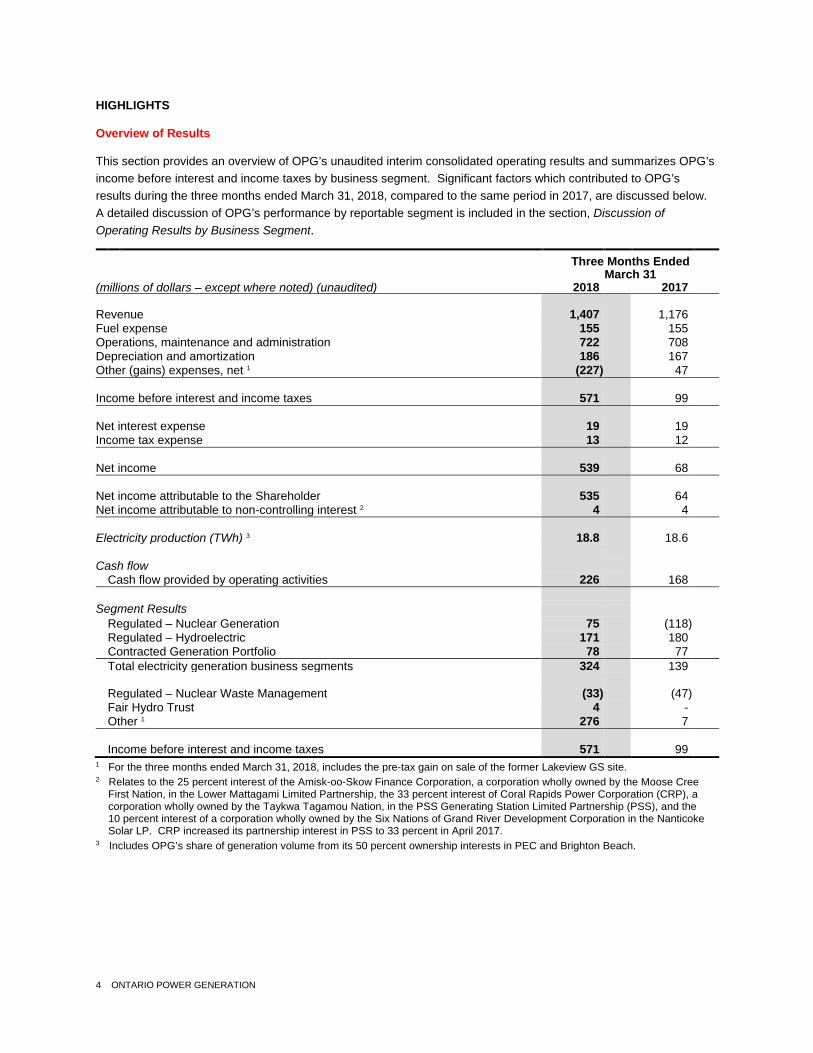
This section provides an overview of OPG’s unaudited interim consolidated operating results and summarizes OPG’s income before interest and income taxes by business segment. Significant factors which contributed to OPG’s results during the three months ended March 31, 2018, compared to the same period in 2017, are discussed below. A detailed discussion of OPG’s performance by reportable segment is included in the section, Discussion of Operating Results by Business Segment.
Three Months Ended March 31 (millions of dollars – except where noted) (unaudited) 2018 2017 Revenue 1,407 1,176 Fuel expense 155 155 Operations, maintenance and administration 722 708 Depreciation and amortization 186 167 Other (gains) expenses, net 1 (227) 47 Income before interest and income taxes 571 99 Net interest expense 19 19 Income tax expense 13 12 Net income 539 68 Net income attributable to the Shareholder 535 64 Net income attributable to non-controlling interest 2 4 4 Electricity production (TWh) 3 18.8 18.6 Cash flow Cash flow provided by operating activities 226 168 Segment Results Regulated – Nuclear Generation 75 (118) Regulated – Hydroelectric 171 180 Contracted Generation Portfolio 78 77 Total electricity generation business segments 324 139 Regulated – Nuclear Waste Management (33) (47) Fair Hydro Trust 4 - Other 1 276 7 Income before interest and income taxes 571 99 1 For the three months ended March 31, 2018, includes the pre-tax gain on sale of the former Lakeview GS site. 2 Relates to the 25 percent interest of the Amisk-oo-Skow Finance Corporation, a corporation wholly owned by the Moose Cree
First Nation, in the Lower Mattagami Limited Partnership, the 33 percent interest of Coral Rapids Power Corporation (CRP), a corporation wholly owned by the Taykwa Tagamou Nation, in the PSS Generating Station Limited Partnership (PSS), and the 10 percent interest of a corporation wholly owned by the Six Nations of Grand River Development Corporation in the Nanticoke Solar LP. CRP increased its partnership interest in PSS to 33 percent in April 2017.
3 Includes OPG’s share of generation volume from its 50 percent ownership interests in PEC and Brighton Beach.
ONTARIO POWER GENERATION 5
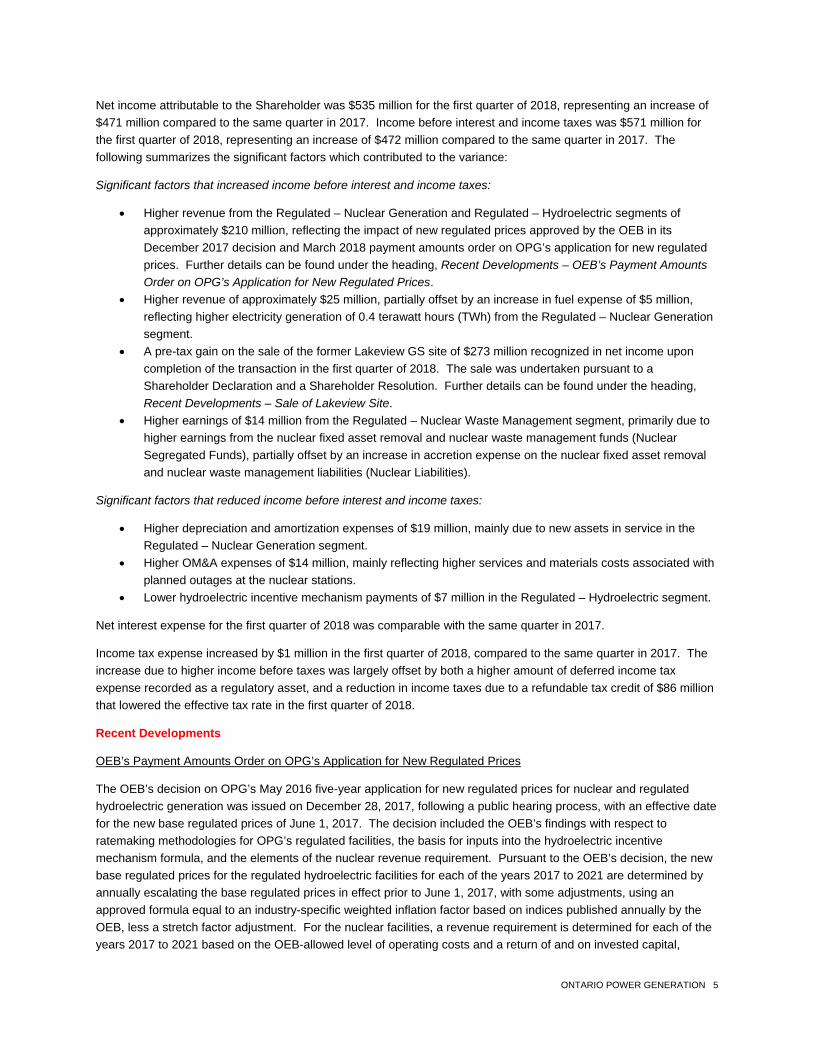
Net income attributable to the Shareholder was $535 million for the first quarter of 2018, representing an increase of $471 million compared to the same quarter in 2017. Income before interest and income taxes was $571 million for the first quarter of 2018, representing an increase of $472 million compared to the same quarter in 2017. The following summarizes the significant factors which contributed to the variance:
Significant factors that increased income before interest and income taxes:
• Higher revenue from the Regulated – Nuclear Generation and Regulated – Hydroelectric segments of approximately $210 million, reflecting the impact of new regulated prices approved by the OEB in its December 2017 decision and March 2018 payment amounts order on OPG’s application for new regulated prices. Further details can be found under the heading, Recent Developments – OEB’s Payment Amounts Order on OPG’s Application for New Regulated Prices.
• Higher revenue of approximately $25 million, partially offset by an increase in fuel expense of $5 million, reflecting higher electricity generation of 0.4 terawatt hours (TWh) from the Regulated – Nuclear Generation segment.
• A pre-tax gain on the sale of the former Lakeview GS site of $273 million recognized in net income upon completion of the transaction in the first quarter of 2018. The sale was undertaken pursuant to a Shareholder Declaration and a Shareholder Resolution. Further details can be found under the heading, Recent Developments – Sale of Lakeview Site.
• Higher earnings of $14 million from the Regulated – Nuclear Waste Management segment, primarily due to higher earnings from the nuclear fixed asset removal and nuclear waste management funds (Nuclear Segregated Funds), partially offset by an increase in accretion expense on the nuclear fixed asset removal and nuclear waste management liabilities (Nuclear Liabilities).
Significant factors that reduced income before interest and income taxes:
• Higher depreciation and amortization expenses of $19 million, mainly due to new assets in service in the Regulated – Nuclear Generation segment.
• Higher OM&A expenses of $14 million, mainly reflecting higher services and materials costs associated with planned outages at the nuclear stations.
• Lower hydroelectric incentive mechanism payments of $7 million in the Regulated – Hydroelectric segment.
Net interest expense for the first quarter of 2018 was comparable with the same quarter in 2017.
Income tax expense increased by $1 million in the first quarter of 2018, compared to the same quarter in 2017. The increase due to higher income before taxes was largely offset by both a higher amount of deferred income tax expense recorded as a regulatory asset, and a reduction in income taxes due to a refundable tax credit of $86 million that lowered the effective tax rate in the first quarter of 2018.
Recent Developments
OEB’s Payment Amounts Order on OPG’s Application for New Regulated Prices
The OEB’s decision on OPG’s May 2016 five-year application for new regulated prices for nuclear and regulated hydroelectric generation was issued on December 28, 2017, following a public hearing process, with an effective date for the new base regulated prices of June 1, 2017. The decision included the OEB’s findings with respect to ratemaking methodologies for OPG’s regulated facilities, the basis for inputs into the hydroelectric incentive mechanism formula, and the elements of the nuclear revenue requirement. Pursuant to the OEB’s decision, the new base regulated prices for the regulated hydroelectric facilities for each of the years 2017 to 2021 are determined by annually escalating the base regulated prices in effect prior to June 1, 2017, with some adjustments, using an approved formula equal to an industry-specific weighted inflation factor based on indices published annually by the OEB, less a stretch factor adjustment. For the nuclear facilities, a revenue requirement is determined for each of the years 2017 to 2021 based on the OEB-allowed level of operating costs and a return of and on invested capital,
6 ONTARIO POWER GENERATION
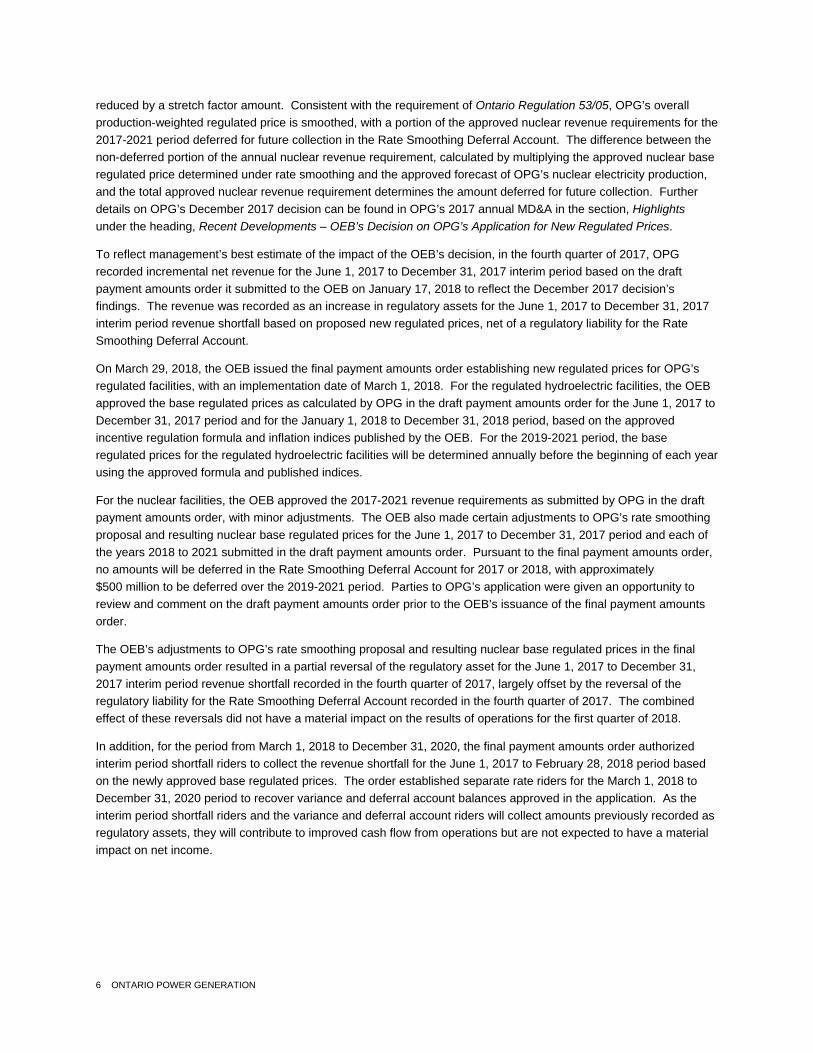
reduced by a stretch factor amount. Consistent with the requirement of Ontario Regulation 53/05, OPG’s overall production-weighted regulated price is smoothed, with a portion of the approved nuclear revenue requirements for the 2017-2021 period deferred for future collection in the Rate Smoothing Deferral Account. The difference between the non-deferred portion of the annual nuclear revenue requirement, calculated by multiplying the approved nuclear base regulated price determined under rate smoothing and the approved forecast of OPG’s nuclear electricity production, and the total approved nuclear revenue requirement determines the amount deferred for future collection. Further details on OPG’s December 2017 decision can be found in OPG’s 2017 annual MD&A in the section, Highlights under the heading, Recent Developments – OEB’s Decision on OPG’s Application for New Regulated Prices.
To reflect management’s best estimate of the impact of the OEB’s decision, in the fourth quarter of 2017, OPG recorded incremental net revenue for the June 1, 2017 to December 31, 2017 interim period based on the draft payment amounts order it submitted to the OEB on January 17, 2018 to reflect the December 2017 decision’s findings. The revenue was recorded as an increase in regulatory assets for the June 1, 2017 to December 31, 2017 interim period revenue shortfall based on proposed new regulated prices, net of a regulatory liability for the Rate Smoothing Deferral Account.
On March 29, 2018, the OEB issued the final payment amounts order establishing new regulated prices for OPG’s regulated facilities, with an implementation date of March 1, 2018. For the regulated hydroelectric facilities, the OEB approved the base regulated prices as calculated by OPG in the draft payment amounts order for the June 1, 2017 to December 31, 2017 period and for the January 1, 2018 to December 31, 2018 period, based on the approved incentive regulation formula and inflation indices published by the OEB. For the 2019-2021 period, the base regulated prices for the regulated hydroelectric facilities will be determined annually before the beginning of each year using the approved formula and published indices.
For the nuclear facilities, the OEB approved the 2017-2021 revenue requirements as submitted by OPG in the draft payment amounts order, with minor adjustments. The OEB also made certain adjustments to OPG’s rate smoothing proposal and resulting nuclear base regulated prices for the June 1, 2017 to December 31, 2017 period and each of the years 2018 to 2021 submitted in the draft payment amounts order. Pursuant to the final payment amounts order, no amounts will be deferred in the Rate Smoothing Deferral Account for 2017 or 2018, with approximately $500 million to be deferred over the 2019-2021 period. Parties to OPG’s application were given an opportunity to review and comment on the draft payment amounts order prior to the OEB’s issuance of the final payment amounts order.
The OEB’s adjustments to OPG’s rate smoothing proposal and resulting nuclear base regulated prices in the final payment amounts order resulted in a partial reversal of the regulatory asset for the June 1, 2017 to December 31, 2017 interim period revenue shortfall recorded in the fourth quarter of 2017, largely offset by the reversal of the regulatory liability for the Rate Smoothing Deferral Account recorded in the fourth quarter of 2017. The combined effect of these reversals did not have a material impact on the results of operations for the first quarter of 2018.
In addition, for the period from March 1, 2018 to December 31, 2020, the final payment amounts order authorized interim period shortfall riders to collect the revenue shortfall for the June 1, 2017 to February 28, 2018 period based on the newly approved base regulated prices. The order established separate rate riders for the March 1, 2018 to December 31, 2020 period to recover variance and deferral account balances approved in the application. As the interim period shortfall riders and the variance and deferral account riders will collect amounts previously recorded as regulatory assets, they will contribute to improved cash flow from operations but are not expected to have a material impact on net income.
ONTARIO POWER GENERATION 7
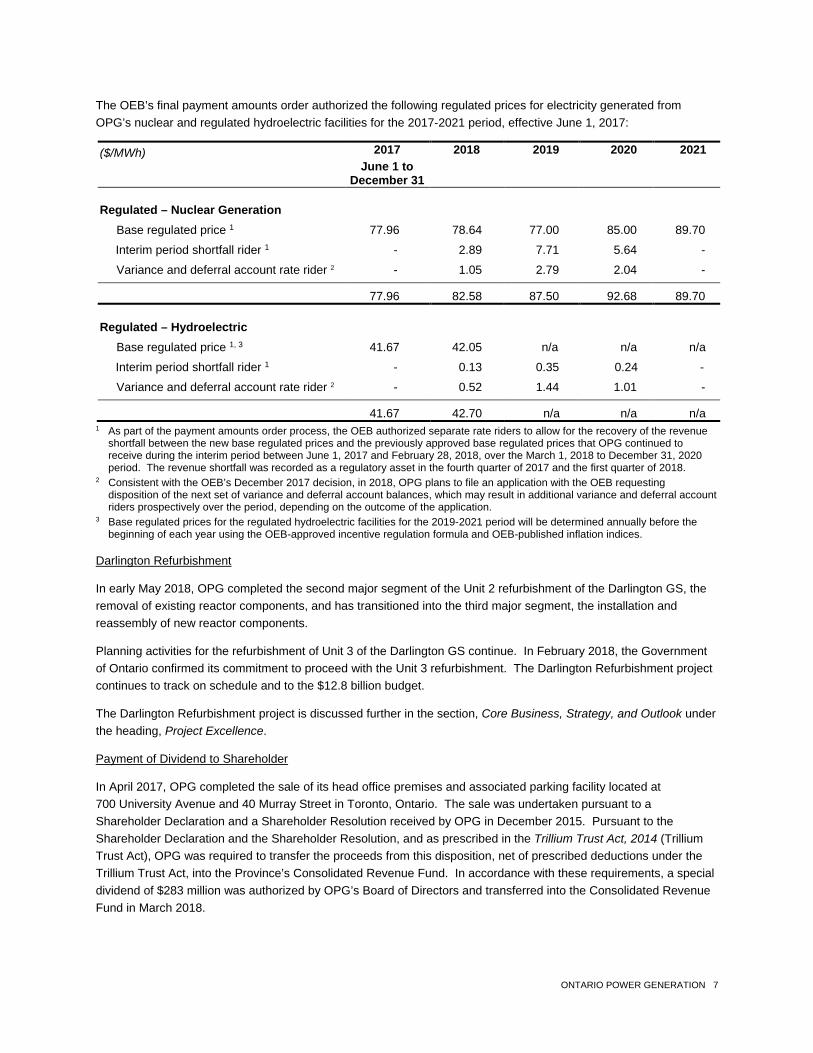
The OEB’s final payment amounts order authorized the following regulated prices for electricity generated from OPG’s nuclear and regulated hydroelectric facilities for the 2017-2021 period, effective June 1, 2017:
($/MWh) 2017 2018 2019 2020 2021
June 1 to December 31
Regulated – Nuclear Generation
Base regulated price 1 77.96 78.64 77.00 85.00 89.70 Interim period shortfall rider 1 - 2.89 7.71 5.64 -
Variance and deferral account rate rider 2 - 1.05 2.79 2.04 -
77.96 82.58 87.50 92.68 89.70
Regulated – Hydroelectric Base regulated price 1, 3 41.67 42.05 n/a n/a n/a
Interim period shortfall rider 1 - 0.13 0.35 0.24 - Variance and deferral account rate rider 2 - 0.52 1.44 1.01 -
41.67 42.70 n/a n/a n/a 1 As part of the payment amounts order process, the OEB authorized separate rate riders to allow for the recovery of the revenue
shortfall between the new base regulated prices and the previously approved base regulated prices that OPG continued to receive during the interim period between June 1, 2017 and February 28, 2018, over the March 1, 2018 to December 31, 2020 period. The revenue shortfall was recorded as a regulatory asset in the fourth quarter of 2017 and the first quarter of 2018.
2 Consistent with the OEB’s December 2017 decision, in 2018, OPG plans to file an application with the OEB requesting disposition of the next set of variance and deferral account balances, which may result in additional variance and deferral account riders prospectively over the period, depending on the outcome of the application.
3 Base regulated prices for the regulated hydroelectric facilities for the 2019-2021 period will be determined annually before the beginning of each year using the OEB-approved incentive regulation formula and OEB-published inflation indices.
Darlington Refurbishment
In early May 2018, OPG completed the second major segment of the Unit 2 refurbishment of the Darlington GS, the removal of existing reactor components, and has transitioned into the third major segment, the installation and reassembly of new reactor components.
Planning activities for the refurbishment of Unit 3 of the Darlington GS continue. In February 2018, the Government of Ontario confirmed its commitment to proceed with the Unit 3 refurbishment. The Darlington Refurbishment project continues to track on schedule and to the $12.8 billion budget.
The Darlington Refurbishment project is discussed further in the section, Core Business, Strategy, and Outlook under the heading, Project Excellence.
Payment of Dividend to Shareholder
In April 2017, OPG completed the sale of its head office premises and associated parking facility located at 700 University Avenue and 40 Murray Street in Toronto, Ontario. The sale was undertaken pursuant to a Shareholder Declaration and a Shareholder Resolution received by OPG in December 2015. Pursuant to the Shareholder Declaration and the Shareholder Resolution, and as prescribed in the Trillium Trust Act, 2014 (Trillium Trust Act), OPG was required to transfer the proceeds from this disposition, net of prescribed deductions under the Trillium Trust Act, into the Province’s Consolidated Revenue Fund. In accordance with these requirements, a special dividend of $283 million was authorized by OPG’s Board of Directors and transferred into the Consolidated Revenue Fund in March 2018.
8 ONTARIO POWER GENERATION
Sale of Lakeview Site
In March 2018, OPG completed the sale of its former Lakeview GS site property located in Mississauga, Ontario, with an after-tax gain on sale of $205 million recognized in net income in the first quarter of 2018. The sale was undertaken pursuant to a Shareholder Declaration and a Shareholder Resolution received by OPG in June 2016. Pursuant to the Shareholder Declaration and the Shareholder Resolution, and as prescribed in the Trillium Trust Act, OPG is required to transfer the proceeds from this disposition, net of prescribed deductions under the Trillium Trust Act, into the Province’s Consolidated Revenue Fund. OPG expects that the amount of designated proceeds to be transferred into the Consolidated Revenue Fund will be largely consistent with the after-tax gain on sale, and is working with the Ontario Ministry of Finance to finalize the amount. In accordance with the Shareholder Resolution, approximately 67 acres of the site will be transferred to the City of Mississauga by the purchaser, for parkland, institutional, and cultural uses.
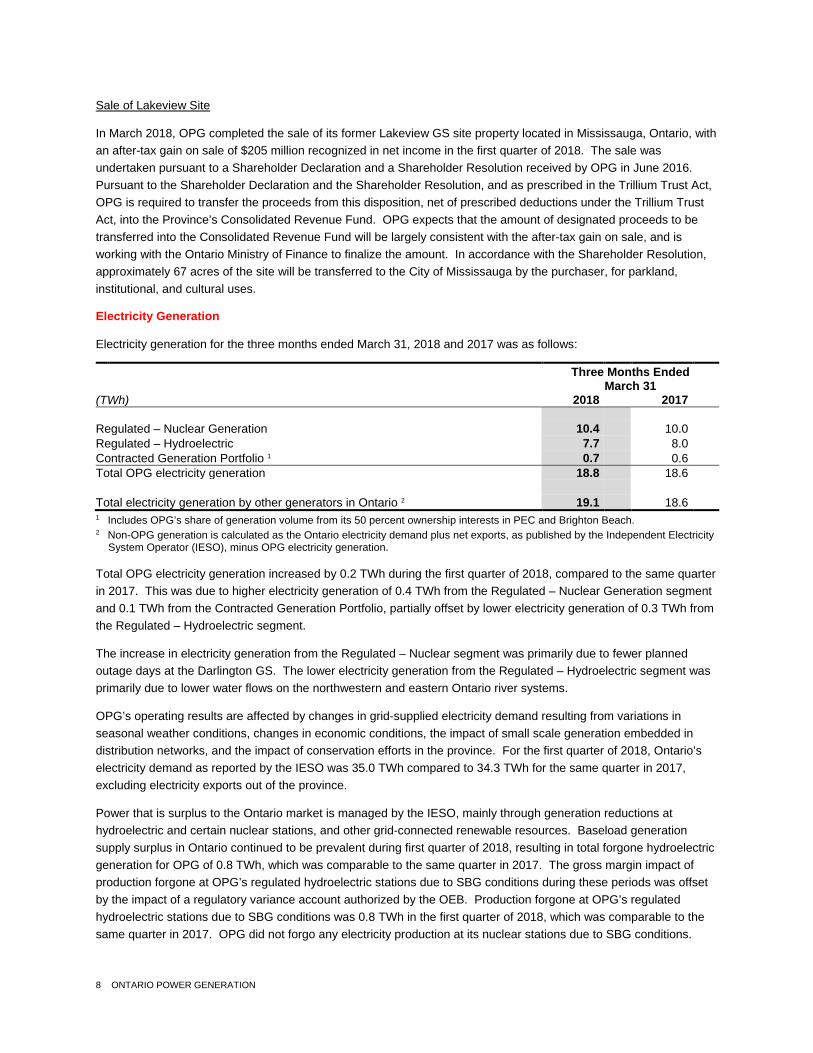
Electricity Generation Electricity generation for the three months ended March 31, 2018 and 2017 was as follows: Three Months Ended March 31 (TWh) 2018 2017 Regulated – Nuclear Generation 10.4 10.0 Regulated – Hydroelectric 7.7 8.0 Contracted Generation Portfolio 1 0.7 0.6 Total OPG electricity generation 18.8 18.6 Total electricity generation by other generators in Ontario 2 19.1 18.6 1 Includes OPG’s share of generation volume from its 50 percent ownership interests in PEC and Brighton Beach. 2 Non-OPG generation is calculated as the Ontario electricity demand plus net exports, as published by the Independent Electricity
System Operator (IESO), minus OPG electricity generation.
Total OPG electricity generation increased by 0.2 TWh during the first quarter of 2018, compared to the same quarter in 2017. This was due to higher electricity generation of 0.4 TWh from the Regulated – Nuclear Generation segment and 0.1 TWh from the Contracted Generation Portfolio, partially offset by lower electricity generation of 0.3 TWh from the Regulated – Hydroelectric segment.
The increase in electricity generation from the Regulated – Nuclear segment was primarily due to fewer planned outage days at the Darlington GS. The lower electricity generation from the Regulated – Hydroelectric segment was primarily due to lower water flows on the northwestern and eastern Ontario river systems.
OPG’s operating results are affected by changes in grid-supplied electricity demand resulting from variations in seasonal weather conditions, changes in economic conditions, the impact of small scale generation embedded in distribution networks, and the impact of conservation efforts in the province. For the first quarter of 2018, Ontario’s electricity demand as reported by the IESO was 35.0 TWh compared to 34.3 TWh for the same quarter in 2017, excluding electricity exports out of the province.
Power that is surplus to the Ontario market is managed by the IESO, mainly through generation reductions at hydroelectric and certain nuclear stations, and other grid-connected renewable resources. Baseload generation supply surplus in Ontario continued to be prevalent during first quarter of 2018, resulting in total forgone hydroelectric generation for OPG of 0.8 TWh, which was comparable to the same quarter in 2017. The gross margin impact of production forgone at OPG’s regulated hydroelectric stations due to SBG conditions during these periods was offset by the impact of a regulatory variance account authorized by the OEB. Production forgone at OPG’s regulated hydroelectric stations due to SBG conditions was 0.8 TWh in the first quarter of 2018, which was comparable to the same quarter in 2017. OPG did not forgo any electricity production at its nuclear stations due to SBG conditions.
ONTARIO POWER GENERATION 9
Average Sales Prices
The majority of OPG’s generation is from the Regulated – Nuclear Generation and Regulated – Hydroelectric segments. The regulated prices authorized by the OEB for electricity generated from OPG’s nuclear and regulated hydroelectric generating stations are discussed further in the section, Highlights under the heading, Recent Developments – OEB’s Payment Amounts Order on OPG’s Application for New Regulated Prices and OPG’s 2017 annual MD&A in the section, Revenue Mechanisms for Regulated and Non-Regulated Generation.
The average sales price for the Regulated – Nuclear Generation segment was 7.2 cents per kilowatt hour (¢/kWh) during the first quarter of 2018, compared to 5.8 ¢/kWh during the same quarter in 2017. The increase in the average sales price primarily reflected the impact of the new base regulated prices approved by the OEB in its December 2017 decision and March 2018 payment amounts order, partially offset by a partial reversal of the regulatory asset for the June 1, 2017 to December 31, 2017 interim period revenue shortfall to reflect the March 2018 payment amounts order. While the reversal of the regulatory liability for the Rate Smoothing Deferral Account that also resulted from the issuance of the March 2018 payment amounts order largely offset the revenue and income impact of the partial reversal of the June 1, 2017 to December 31, 2017 revenue shortfall regulatory asset, it did not impact the average sales price for the first quarter of 2018, as amounts deferred under rate smoothing are not included in the calculation of the average sales price until the period they are settled with ratepayers.
The average sales price for the Regulated – Hydroelectric segment was 4.2 ¢/kWh during each of the first quarters of 2018 and 2017. The average sales price was comparable in these periods as the impact of the new base regulated prices approved by the OEB in its December 2017 decision and March 2018 payment amounts order was offset by lower revenue under the hydroelectric incentive mechanism in the first quarter of 2018.
Cash Flow from Operations
Cash flow provided by operating activities for the three months ended March 31, 2018 was $226 million, compared to $168 million for the same period in 2017. The increase was mainly due to higher non-generation revenue cash receipts, lower expenditures on fixed asset removal and nuclear waste management activities, and lower income tax instalments.
Return on Equity Excluding Accumulated Other Comprehensive Income
ROE Excluding AOCI is an indicator of OPG’s performance consistent with the Company’s strategy to provide value to the Shareholder. ROE Excluding AOCI is measured over a 12-month period. ROE Excluding AOCI for the twelve months ended March 31, 2018 was 11.5 percent, compared to 7.6 percent for the twelve months ended December 31, 2017. The increase in ROE Excluding AOCI was primarily due to higher net income attributable to the Shareholder as a result of increased revenue reflecting the impact of the new base regulated prices approved by the OEB in its December 2017 decision and March 2018 payment amounts order, and the gain on the sale of the former Lakeview GS site recorded in the first quarter of 2018. ROE Excluding AOCI for these periods also reflected the after-tax gain of $283 million on the sale of the Company’s head office premises and associated parking facility recorded in the second quarter of 2017. The gains on the sale of the former Lakeview GS site and the head office premises and associated parking facility, including the effect of the associated special dividend authorized in March 2018, together with the associated income tax effects of these transactions, contributed approximately 4.9 percent to ROE Excluding AOCI for the twelve months ended March 31, 2018 and approximately 2.5 percent for the twelve months ended December 31, 2017.
Enterprise Total Generating Cost per Megawatt Hour
The Enterprise TGC per megawatt hour (MWh) was $49.84 for the three months ended March 31, 2018, compared to $47.86 for the same period in 2017. The increase was mainly a result of higher OM&A expenses before the impact of regulatory variance and deferral accounts and higher sustaining capital expenditures, partially offset by higher nuclear electricity generation.
10 ONTARIO POWER GENERATION
Nuclear Total Generating Cost per Megawatt Hour
The Nuclear TGC per MWh was $70.90 for the three months ended March 31, 2018, compared to $69.87 for the same period in 2017. The increase in Nuclear TGC per MWh was primarily due to higher OM&A expenses before the impact of regulatory variance and deferral account and higher sustaining capital expenditures, partially offset by higher nuclear electricity generation.
Hydroelectric Total Generating Cost per Megawatt Hour
The Hydroelectric TGC per MWh was $20.42 for the three months ended March 31, 2018, compared to $19.79 for the same period in 2017. The increase in the Hydroelectric TGC per MWh was primarily due to the decrease in hydroelectric electricity generation.
ROE Excluding AOCI, Enterprise TGC per MWh, Nuclear TGC per MWh and Hydroelectric TGC per MWh are not measurements in accordance with US GAAP, and should not be considered alternative measures to net income or any other performance measure under US GAAP. OPG believes that these non-GAAP financial measures are effective indicators of its performance and are consistent with the Company’s strategic imperatives and related objectives. The definition and calculation of ROE Excluding AOCI, Enterprise TGC per MWh, Nuclear TGC per MWh and Hydroelectric TGC per MWh are found in the section, Supplementary Non-GAAP Financial Measures.
CORE BUSINESS, STRATEGY, AND OUTLOOK
The discussion in this section is qualified in its entirety by the cautionary statements included in the section, Forward-Looking Statements, at the beginning of the MD&A.
OPG’s mission is to provide low cost power in a safe, clean, reliable and sustainable manner for the benefit of its customers and its Shareholder. OPG also seeks to pursue, on a commercial basis, generation development projects and other business growth opportunities to the benefit of the Shareholder.
The following sections provide an update to OPG’s disclosures in the 2017 annual MD&A related to its four key strategic imperatives – operational excellence, project excellence, financial strength, and social licence. A detailed discussion of these strategic imperatives is included in the 2017 annual MD&A in the section, Core Business, Strategy, and Outlook.
Operational Excellence
Operational excellence at OPG is accomplished by the safe and environmentally responsible generation of reliable and cost-effective electricity from the Company’s generating assets through a highly trained and engaged workforce.
Public Safety
To ensure continued public safety, radiation exposure to members of the public resulting from the operation of OPG’s nuclear generating stations is estimated on an annual basis for individuals living or working near the stations. The annual dose to the public resulting from operations of each nuclear facility is expressed in microsieverts (μSv), which is an international unit of radiation dose measurement. For 2017, the annual public doses resulting from the Darlington GS operations and the Pickering Nuclear GS (Pickering GS) operations were 0.7 μSv and 1.8 μSv, respectively, which is approximately 0.1 percent and 0.2 percent of the annual legal limit of 1,000 μSv, respectively.
ONTARIO POWER GENERATION 11
Electricity Generation Production and Reliability
The status updates for OPG’s electricity generation portfolio as of March 31, 2018 are summarized below:
• OPG’s current five-year operating licence for the Pickering GS was approved by the CNSC in 2013 and expires on August 31, 2018. This current licence was issued assuming that the station would shut down in 2020. As previously announced, OPG is continuing to execute on a plan to extend safe and reliable operation of the Pickering GS to 2024. In June 2017, OPG confirmed to the CNSC that it intends to cease commercial operation of all Pickering units on December 31, 2024. In August 2017, OPG submitted a ten-year licence renewal application to the CNSC in line with the plan to extend commercial operation to December 31, 2024 and place the station in a safe storage state in 2028. The first public hearing for the Pickering GS licence renewal application took place on April 4, 2018 and provided an opportunity for OPG to present its submission to the CNSC that outlined how the Pickering GS meets technical requirements and is qualified to continue operations. The final set of public hearings will take place between June 26 and June 28, 2018. Based on the evidence and documentation submitted to the CNSC, OPG continues to believe it is well positioned to obtain a licence renewal that would support its extended operations plan for the Pickering GS to 2024.
• In 2016, OPG submitted applications with the CNSC seeking a ten-year licence renewal for the Pickering Waste Management Facility (PWMF) to August 31, 2028. On February 7, 2018, following public hearings in April 2017, the CNSC announced that the PWMF licence was renewed for a ten-year period and will be valid until August 31, 2028.
• During the first quarter of 2018, OPG completed the overhaul and rehabilitation of Unit 1 of the Sir Adam Beck Pump hydroelectric GS to ensure reliable unit operation for approximately the next 20 years, as well as the overhaul and upgrade of Unit 1 of the Harmon hydroelectric GS, which increased the station’s generating capacity by 8 MW.
• Definition phase work for the frequency conversion of Units 1 and 2 of the Sir Adam Beck 1 hydroelectric GS and the overhaul and upgrade of the R.H. Saunders hydroelectric GS units commenced during the first quarter of 2018.
• As part of the process to decommission the Nanticoke GS, OPG safely demolished the station’s stacks in February 2018. The removal of the powerhouse and associated structures is in progress. A competitive bidding process for the demolition of the Lambton GS is continuing, with a contract for the removal of the powerhouse and associated structures expected to be issued during 2018. The costs of the decommissioning activities are charged to a previously established decommissioning provision.
Environmental Performance
In February 2018, the CNSC released sampling results from its 2017 independent environmental monitoring program, which confirmed that the public and environment around the Pickering GS are protected and that there are no expected health impacts. Samples were collected in publicly accessible areas outside the Pickering GS site perimeter and included air, lake water, soil, and wild vegetation. Samples of food were also taken from a local farm near the Pickering GS.
In the first quarter of 2018, the Government of Canada introduced legislation to amend the Fisheries Act (Bill C-68) and to replace the Canadian Environmental Assessment Act, 2012 with a more comprehensive Impact Assessment Act (Bill C-69). If passed by Parliament, this legislation could introduce new regulatory requirements to further protect fish and fish habitat, and for assessing designated projects. OPG is reviewing the proposed changes and exploring opportunities to mitigate any associated risks.

12 ONTARIO POWER GENERATION
Disclosures related to the Company’s environmental policy and environmental risks can be found in OPG’s 2017 annual MD&A.
People and Culture
A well trained and engaged workforce is fundamental to the achievement of OPG’s strategic imperatives. To succeed in a demanding business environment, OPG is focused on building a diverse, healthy, engaged workforce and fostering a culture of collaboration, accountability and innovation. OPG also continues to communicate and implement the values and behaviours expected from its employees in order to maintain a strong focus on safety, performance excellence, continuous improvement, and corporate citizenship.
In March 2018, the Employee Assistance Society of North America awarded OPG the annual Corporate Award of Excellence. These awards are given to organizations that showcase the excellence, innovation and impact of employee assistance programs in the workplace with a view to enhance employee well-being and support a healthy and productive working environment. OPG was recognized for its commitment to an organizational culture that values safety and good mental health as critical components of the organization’s success.
ONTARIO POWER GENERATION 13
Project Excellence
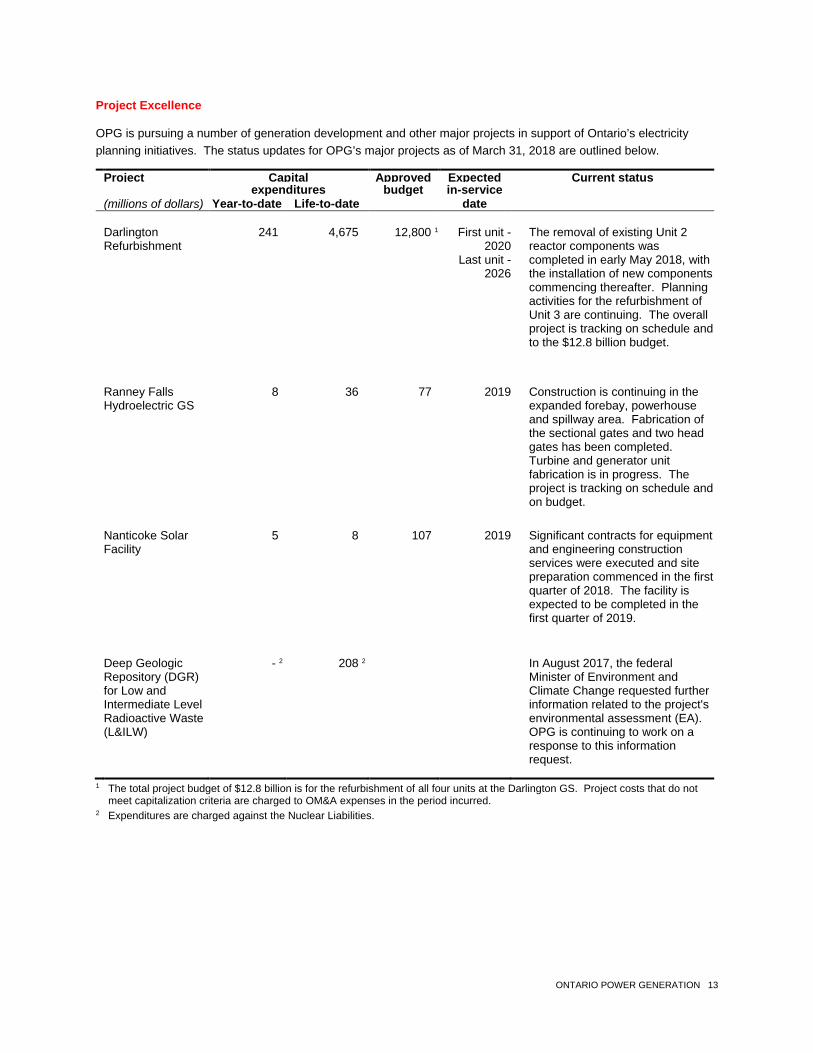
OPG is pursuing a number of generation development and other major projects in support of Ontario’s electricity planning initiatives. The status updates for OPG’s major projects as of March 31, 2018 are outlined below.
Project Capital Approved Expected Current status expenditures budget in-service (millions of dollars) Year-to-date Life-to-date date
Darlington Refurbishment
241 4,675 12,800 1 First unit - 2020
Last unit - 2026
The removal of existing Unit 2 reactor components was completed in early May 2018, with the installation of new components commencing thereafter. Planning activities for the refurbishment of Unit 3 are continuing. The overall project is tracking on schedule and to the $12.8 billion budget.
Ranney Falls Hydroelectric GS
8 36 77 2019 Construction is continuing in the expanded forebay, powerhouse and spillway area. Fabrication of the sectional gates and two head gates has been completed. Turbine and generator unit fabrication is in progress. The project is tracking on schedule and on budget.
Nanticoke Solar Facility
5 8 107 2019 Significant contracts for equipment and engineering construction services were executed and site preparation commenced in the first quarter of 2018. The facility is expected to be completed in the first quarter of 2019.
Deep Geologic Repository (DGR) for Low and Intermediate Level Radioactive Waste (L&ILW)
- 2 208 2 In August 2017, the federal Minister of Environment and Climate Change requested further information related to the project's environmental assessment (EA). OPG is continuing to work on a response to this information request.
1 The total project budget of $12.8 billion is for the refurbishment of all four units at the Darlington GS. Project costs that do not meet capitalization criteria are charged to OM&A expenses in the period incurred.
2 Expenditures are charged against the Nuclear Liabilities.
14 ONTARIO POWER GENERATION
Darlington Refurbishment
The Darlington generating units are approaching their originally designed end-of-life. Refurbishment of the four generating units is expected to extend the operating life of the station by approximately 30 years. The approved budget for the four-unit refurbishment is $12.8 billion, which includes the costs of the prerequisite projects in support of the execution phase of the refurbishment. The first refurbished unit is scheduled to be returned to service in the first quarter of 2020 and the last unit is scheduled to be completed by 2026.
OPG commenced the refurbishment of the first unit, Unit 2, in October 2016. The de-fuelling of the reactor and islanding of Unit 2, the physical separation of the unit under refurbishment from the three operating units, was completed in the first half of 2017, signifying the completion of the first major segment of the Unit 2 refurbishment.
The second major segment included the disassembly and removal of the existing reactor components. In early May 2018, OPG completed the removal of the reactor components, which included end fittings, pressure tubes, and calandria tubes, signifying the completion of the second major segment of the Unit 2 refurbishment.
The Unit 2 refurbishment has now transitioned into the third major segment, the installation and reassembly of reactor components, including new feeder tubes and fuel channel assemblies. Construction activities on the Heavy Water Storage and Drum Handling Facility are continuing.
In February 2018, the Government of Ontario confirmed its commitment to proceed with the refurbishment of the second unit at the Darlington GS, Unit 3. In March 2018, OPG’s Board of Directors approved the funding to complete planning and prerequisite activities for the Unit 3 refurbishment. The planning activities are progressing in accordance with the overall project schedule. OPG is ensuring that lessons learned from the Unit 2 refurbishment are appropriately incorporated into the Unit 3 refurbishment. OPG is also entering into commitments to procure major components that require long lead times. The prerequisite activities have commenced, with the Unit 3 refurbishment execution expected to commence upon the return to service of Unit 2. As of March 31, 2018, $137 million has been invested in planning and prerequisite activities related to the Unit 3 refurbishment.
The Darlington Refurbishment project continues to track on schedule and to the $12.8 billion budget.
Ranney Falls Hydroelectric GS
In 2017, OPG began construction work on a 10 MW single-unit powerhouse on the existing Ranney Falls GS site. The new unit will replace an existing unit that reached its end of life in 2014. Construction continues in the expanded forebay, powerhouse and spillway area. Fabrication of the sectional gates and two head gates has been completed, with assembly and site delivery in progress. Turbine and generator unit fabrication is also in progress. The project’s expected in-service date is in the fourth quarter of 2019, with a budget of $77 million. The project is tracking on schedule and on budget. The Ranney Falls GS is included in the Regulated – Hydroelectric segment.
Nanticoke Solar Facility
The project encompasses the construction of a 44 MW solar facility at OPG’s Nanticoke GS site and adjacent lands under a contract with the IESO, through Nanticoke Solar LP, a partnership between OPG and a subsidiary of the Six Nations of Grand River Development Corporation. Significant contracts for equipment and engineering construction services were executed and site preparation commenced in the first quarter of 2018. The facility is expected to be completed in the first quarter of 2019, with a budget of $107 million. The project is included in the Contracted Generation Portfolio segment.
Deep Geologic Repository for Low and Intermediate Level Waste
OPG has proposed a deep geologic repository as the preferred solution for the safe long-term management of the L&ILW produced from the continued operation of OPG-owned nuclear generating stations. Agreement has been
ONTARIO POWER GENERATION 15
reached with local municipalities for OPG to develop the L&ILW DGR on lands adjacent to OPG’s Western Waste Management Facility (WWMF) in Kincardine, Ontario.
Before the CNSC can make licensing decisions for the proposal, an EA must be conducted. The environmental effects of the proposed L&ILW DGR were examined by the CNSC and Canadian Environmental Assessment Agency (CEAA)-appointed Joint Review Panel (JRP) to meet the requirements of the Canadian Environmental Assessment Act as well as the project specific Environmental Impact Statement Guidelines. The JRP submitted its report on the EA to the federal Minister of Environment in May 2015, concluding that, given mitigation, there is unlikely to be significant environmental impact from the project and recommending that the Minister approve the EA. In December 2016, at the request of the federal Minister of Environment and Climate Change, OPG submitted additional information on certain aspects of the EA, with further information provided in May 2017 at the request of the CEAA. In June 2017, the CEAA notified OPG that it had sufficient and adequate information to proceed with the next step of the EA process and advised that a draft report and updated terms and conditions would be prepared for public review.
In August 2017, the federal Minister of Environment and Climate Change requested OPG to update its analysis of potential cumulative effects of the project on the Saugeen Ojibway Nation’s (SON) physical and cultural heritage, including a description of the potential effects of the project on the SON’s spiritual and cultural connection to the land, taking into account the results of the SON Community Process. OPG continues its engagement with the SON towards securing support for the project and to formulate a response to the information request.
The L&ILW DGR at the WWMF site remains OPG’s preferred solution for the safe long-term management of the L&ILW. The in-service date of the L&ILW DGR is expected to be approximately six to seven years from the start of construction.
Financial Strength
As a commercial enterprise, OPG’s financial priority is to achieve a consistent level of strong financial performance that delivers an appropriate level of return on the Shareholder’s investment and positions the Company for future expansion.
Increasing Revenue, Reducing Costs and Achieving Appropriate Return
In line with its commercial mandate, OPG is focused on increasing revenue and net income and achieving an appropriate rate of return on the Shareholder’s investment, while taking into account the impact on Ontario electricity customers by seeking further efficiencies in the Company’s cost structure.
For the regulated operations, achievement of the above objectives is largely dependent on outcomes of applications for regulated prices to the OEB and growth of the asset base earning a return as part of the regulated prices.
The OEB’s December 2017 decision and March 2018 payment amounts order establishing new regulated prices effective June 1, 2017 provide substantial price certainty for the regulated business up to 2021. While the OEB set costs for determining the new regulated prices below OPG’s forecasted levels, including through the use of stretch factors under incentive ratemaking, the new regulated prices will result in a substantial increase in revenue and net income compared to the previously approved prices.
To further improve the financial strength of the regulated operations, OPG continues to focus on optimizing operational performance and outage plans across the generating fleet and pursue further efficiency improvements in the Company’s cost structure and operating model. This includes continuing to progress the multi-year OPG25 initiative, which involves identifying and implementing a coordinated set of plans and targets to ensure the optimization of the Company’s longer-term operating model, business strategies and organizational design between now and the planned end of Pickering commercial operation in 2024.
16 ONTARIO POWER GENERATION
OPG’s capital structure currently reflects lower levels of debt than the deemed capital structure of 45 percent equity and 55 percent debt maintained by the OEB’s December 2017 decision on new regulated prices. OPG continues to evaluate strategies to enhance Shareholder returns by optimizing the Company’s capital structure through better alignment with the deemed capital structure, taking into account the overall financial strength of the Company and the potential impact on the Company’s investment grade credit rating.
Consistent with the OEB’s December 2017 decision, later in 2018, OPG plans to file an application with the OEB requesting disposition of the Pension & OPEB Cash Versus Accrual Differential Deferral Account balance as at December 31, 2017 and the balances accumulated between December 31, 2015 and December 31, 2017 in other variance and deferral account balances. If approved by the OEB, recovery of these balances would contribute to improved cash flow from operations.
Ensuring Availability of Cost Effective Funding
In April 2018, DBRS Limited (DBRS) re-affirmed the long-term credit rating on OPG’s debt at ‘A (low)’ and OPG’s commercial paper rating at ‘R-1 (low)’. All ratings from DBRS have a stable outlook.
Social Licence
As the largest electricity generator in Ontario with diverse operations across the province, OPG holds itself accountable to the public and its employees, and continues to focus on maintaining public trust. OPG is committed to maintaining high standards of public safety and corporate citizenship, including environmental stewardship, transparency, community engagement, and Indigenous relations.
OPG is focused on building long-term, mutually beneficial working relationships with Indigenous communities, businesses and organizations across Ontario, and continues to support procurement, employment and educational opportunities with Indigenous communities. OPG seeks to establish these relationships based on a foundation of respect for the languages, customs, and political, social and cultural organizations of Indigenous communities. In the first quarter of 2018, the Dictionary of Moose Cree, an OPG-supported project that preserves the unique language and culture of the Moose Cree First Nation, was recognized by the Lieutenant Governor of Ontario. The language initiative was funded by OPG as a cultural project under the 2010 Amisk-oo-skow Agreement between OPG and the Moose Cree First Nation.
OPG’s commitment in the area of Indigenous relations includes pursuing generation-related development partnerships on the basis of long-term commercial arrangements and other joint projects. In addition to the development of the Nanticoke solar facility in partnership with the Six Nations of the Grand River, OPG is currently working with the Kiashke Zaaging Anishinaabek (KZA), also known as the Gull Bay First Nation, to construct a new renewable micro grid that will utilize solar generation, battery storage, and micro grid control technology to reduce the community’s reliance on diesel generation. As the lead developer of the project, OPG will work with several collaborators to construct the micro grid on KZA reserve land. Upon completion, the micro grid will be transferred to KZA for ownership and operation. The micro grid project is OPG’s fifth development project in partnership with an Indigenous community.
OPG is committed to improving Indigenous access to procurement and employment opportunities, including increasing the profile of the nuclear generation industry in Indigenous communities. In 2018, this includes continuing to track the implementation of the Indigenous Business Engagement Initiative launched in 2017 to increase access to procurement opportunities for Indigenous businesses interested in supplying materials and services to OPG, and continuing to identify ways to increase the Indigenous representation in OPG’s workforce. Recruitment initiatives include the launch of the Indigenous Opportunities in Nuclear program in the first quarter of 2018 using the Darlington Refurbishment project as a catalyst, and the continuing development of a dedicated Indigenous recruitment and retention strategy.
ONTARIO POWER GENERATION 17
Outlook
The financial performance of OPG’s regulated operations is driven, in large part, by the outcome of the Company’s applications for regulated prices to the OEB.
In 2018, the full-year effect of the new regulated prices established by the OEB’s December 2017 decision and March 2018 payment amounts order will contribute to an improvement in net income and ROE Excluding AOCI over the 2017 results. An improvement in cash flow from operating activities during the remainder of 2018, compared to 2017, is also expected, as OPG begins to collect revenue from the IESO based on new regulated prices as of March 1, 2018. The Fair Hydro Trust segment will also modestly improve cash flow from operating activities in 2018. OPG expects to continue to have the necessary financial capacity and sufficient access to cost effective financing sources to continue to fund its capital requirements and other disbursements, including purchases of subordinated debt issued by the Fair Hydro Trust (the Trust) to fund a portion of the Trust’s acquisition of Investment Interests from the IESO, being the irrevocable right to recover Global Adjustment costs deferred by the IESO under the Ontario Fair Hydro Plan Act, 2017 (Fair Hydro Act or the Act) and associated financing and other costs.
Several OEB-authorized regulatory variance and deferral accounts will continue to contribute to reducing the relative variability of the Company’s net income and ROE Excluding AOCI. Among others, these accounts include those related to the revenue impact of variability in water flows and forgone production due to SBG conditions at the regulated hydroelectric stations. As there are no variance or deferral accounts in place related to the impact of generation performance of the nuclear stations on revenue from base regulated prices, the Regulated – Hydroelectric segment generally is expected to produce overall more predictable earnings. OPG continues to operate and maintain its nuclear facilities with a view to optimize their performance and availability, while focusing on improving the overall reliability and predictability of the fleet.
Electricity generated from most of OPG’s non-regulated assets is subject to ESAs with the IESO or other long-term contracts. Based on these agreements, OPG expects the Contracted Generation Portfolio segment to continue to contribute a generally stable level of earnings and cash flow from operating activities going forward.
Lower nuclear generation due to the Darlington Refurbishment outages will continue, as planned, to negatively impact the Enterprise TGC and Nuclear TGC measures for the duration of the refurbishment project. Lower hydroelectric generation due to outages related to various refurbishment and operational projects may negatively impact Enterprise TGC and Hydroelectric TGC for the duration of these projects. Variability in sustaining capital investment expenditures and nuclear outage profile may also impact TGC measures in future periods.
OPG’s total forecast capital expenditures for the 2018 year are approximately $2.1 billion. This includes amounts for the Darlington Refurbishment project, hydroelectric and other development projects including the Ranney Falls GS redevelopment and construction of the Nanticoke solar facility, and sustaining capital investments across the generating fleet. OPG’s major projects are discussed in the section, Project Excellence.
In addition to the operating and financial performance of the electricity generation business, OPG’s results are affected by earnings on the Nuclear Segregated Funds established under the Ontario Nuclear Funds Agreement (ONFA) between OPG and the Province, which are reported in the Regulated – Nuclear Waste Management segment. Variations in rates of return for the funds based on financial market conditions, including changes in the Ontario consumer price index (CPI) that affect earnings on the portion of the Used Fuel Segregated Fund guaranteed by the Province, can be volatile and cause fluctuations in the Company’s income in the near term. This volatility is reduced by the impact of the OEB-authorized Bruce Lease Net Revenues Variance Account and during periods when the funds are in a fully funded or overfunded position. As at March 31, 2018, the Decommissioning Segregated Fund was overfunded by approximately 26 percent, and the Used Fuel Segregated Fund was marginally overfunded, by less than one percent, based on the current ONFA reference plan. Variability in asset performance due to volatility inherent in financial markets and changes in Ontario CPI, or changes in funding liability estimates, may result in either or both funds becoming underfunded in the future.

18 ONTARIO POWER GENERATION
OPG’s results include the earnings from the Fair Hydro Trust segment, primarily related to interest income from the Trust. Management expects that these earnings will increase in 2018 as additional Investment Interests are acquired. OPG’s involvement as the Financial Services Manager under the Fair Hydro Act is expected to put downward pressure on ROE Excluding AOCI as a result of increases in shareholder’s equity through future issuances of Class A shares to partially fund OPG’s purchases of the Trust’s subordinated debt, partially offset by the impact of incremental earnings from the Trust.
ENVIRONMENTAL, SOCIAL, GOVERNANCE, AND SUSTAINABILITY
OPG’s Darlington and Pickering nuclear generating stations and renewable fleet of hydroelectric generating stations produce clean, reliable electricity with virtually no greenhouse gas emissions. However, OPG recognizes that efforts are required to plan for the impacts of climate change and has identified climate change adaptation as a strategic priority for the Company. OPG monitors developments in climate science, adaptation activities, and potential changes to policy and regulatory requirements, and is continuing to work with stakeholders to better define adaptation requirements.
OPG has established an Environmental, Social, Governance (ESG), and Sustainability steering committee consisting of a diverse group of representatives from various disciplines within the Company. The mandate of the committee is to evaluate the potential impact of environmental issues on the Company, oversee the development of a formal climate change strategy, assess and monitor the evolution of climate-related risks, and develop associated financial reporting disclosures.
OPG is in the process of developing its ESG and Sustainability framework to best reflect and disclose information that is meaningful to stakeholders. OPG plans to structure its ESG and Sustainability framework around four core themes:
• Metrics and targets to assess and manage relevant climate-related risks and opportunities; • Risk management processes to identify, assess and manage climate-related risks; • Strategy for incorporating climate change impacts into business planning and decision-making; and • Governance for integrating the climate change strategy in the business.
In developing its ESG and Sustainability framework, OPG expects to leverage industry-specific and other emerging guidance on best practices related to ESG and Sustainability reporting and continues to monitor the Canadian Securities Administrators’ project to review the disclosures of risks and financial impacts associated with climate change.
ONTARIO POWER GENERATION 19
DISCUSSION OF OPERATING RESULTS BY BUSINESS SEGMENT
Regulated – Nuclear Generation Segment
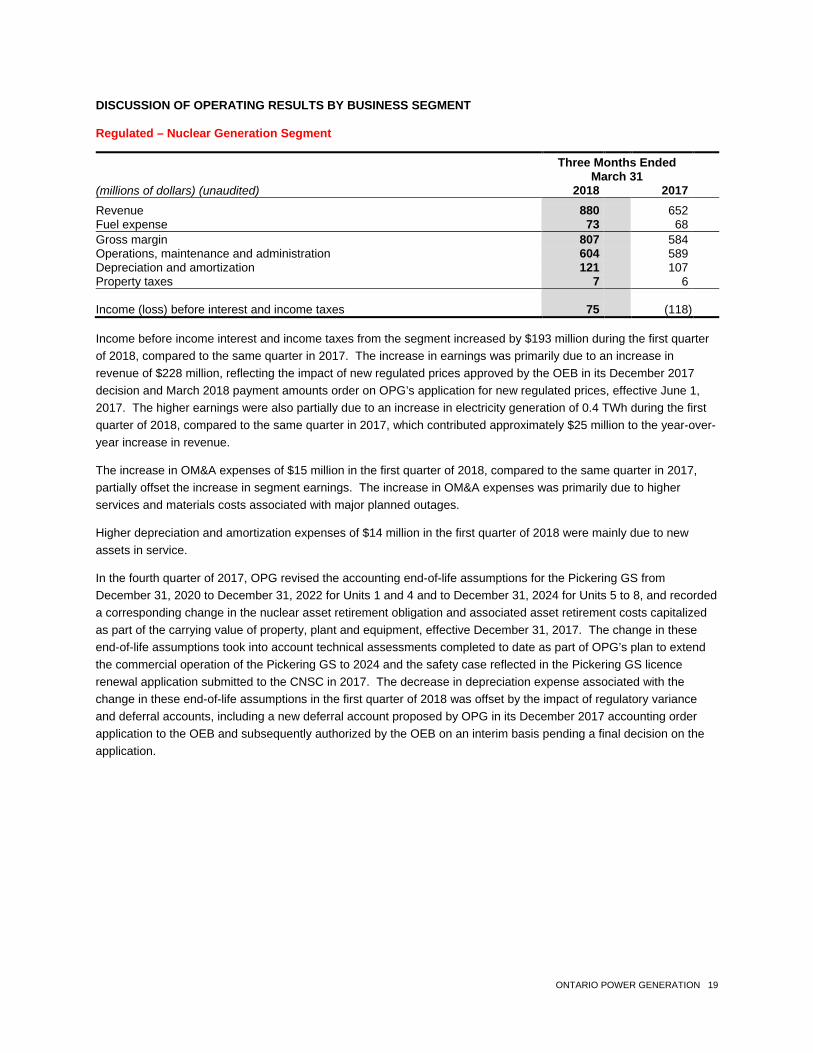
Three Months Ended March 31 (millions of dollars) (unaudited) 2018 2017 Revenue 880 652 Fuel expense 73 68 Gross margin 807 584 Operations, maintenance and administration 604 589 Depreciation and amortization 121 107 Property taxes 7 6 Income (loss) before interest and income taxes 75 (118)
Income before income interest and income taxes from the segment increased by $193 million during the first quarter of 2018, compared to the same quarter in 2017. The increase in earnings was primarily due to an increase in revenue of $228 million, reflecting the impact of new regulated prices approved by the OEB in its December 2017 decision and March 2018 payment amounts order on OPG’s application for new regulated prices, effective June 1, 2017. The higher earnings were also partially due to an increase in electricity generation of 0.4 TWh during the first quarter of 2018, compared to the same quarter in 2017, which contributed approximately $25 million to the year-over-year increase in revenue.
The increase in OM&A expenses of $15 million in the first quarter of 2018, compared to the same quarter in 2017, partially offset the increase in segment earnings. The increase in OM&A expenses was primarily due to higher services and materials costs associated with major planned outages.
Higher depreciation and amortization expenses of $14 million in the first quarter of 2018 were mainly due to new assets in service.
In the fourth quarter of 2017, OPG revised the accounting end-of-life assumptions for the Pickering GS from December 31, 2020 to December 31, 2022 for Units 1 and 4 and to December 31, 2024 for Units 5 to 8, and recorded a corresponding change in the nuclear asset retirement obligation and associated asset retirement costs capitalized as part of the carrying value of property, plant and equipment, effective December 31, 2017. The change in these end-of-life assumptions took into account technical assessments completed to date as part of OPG’s plan to extend the commercial operation of the Pickering GS to 2024 and the safety case reflected in the Pickering GS licence renewal application submitted to the CNSC in 2017. The decrease in depreciation expense associated with the change in these end-of-life assumptions in the first quarter of 2018 was offset by the impact of regulatory variance and deferral accounts, including a new deferral account proposed by OPG in its December 2017 accounting order application to the OEB and subsequently authorized by the OEB on an interim basis pending a final decision on the application.
20 ONTARIO POWER GENERATION
The Unit Capability Factors for the Darlington GS and Pickering GS were as follows:
Three Months Ended March 31 2018 2017 Unit Capability Factor (%) 1 Darlington GS 96.5 85.3 Pickering GS 74.5 78.5 1 The nuclear Unit Capability Factor excludes unit(s) during the period in which they are undergoing refurbishment. Accordingly,
Unit 2 of the Darlington GS was excluded from the measure effective October 15, 2016, when the unit was taken offline for refurbishment.
The Unit Capability Factor at the Darlington GS increased in the first quarter of 2018, compared to the same quarter in 2017, primarily due to a lower number of planned outage days at the station in the first quarter of 2018.
The decrease in the Unit Capability Factor at the Pickering GS in the first quarter of 2018, compared to the same quarter in 2017, was primarily due to a higher number of planned outage days in the cyclical maintenance schedule at the station in the first quarter of 2018.
Regulated – Nuclear Waste Management Segment Three Months Ended March 31 (millions of dollars) (unaudited) 2018 2017 Revenue 33 27 Operations, maintenance and administration 33 29 Accretion on nuclear fixed asset removal and nuclear waste 243 234 management liabilities Earnings on nuclear fixed asset removal and nuclear waste (210) (189) management funds Loss before interest and income taxes (33) (47)
Earnings from the segment improved by $14 million in the first quarter of 2018, compared to the same quarter in 2017. The improvement was primarily due to higher earnings from the Nuclear Segregated Funds, partially offset by an increase in accretion expense on the Nuclear Liabilities.
The year-over-year increase in earnings from the Nuclear Segregated Funds was primarily due to the growth rate in the present value of the underlying funding liabilities per the current approved ONFA reference plan in effect since January 1, 2017, as both the Decommissioning Segregated Fund and the Used Fuel Fund were in an overfunded position since the beginning of 2017 and were not impacted by market returns and the rate of return guaranteed by the Province for a portion of the Used Fuel Segregated Fund. When both funds are in an overfunded position, OPG limits the amount of Nuclear Segregated Funds assets reported on the balance sheet to the present value of the underlying life cycle funding liabilities per the most recently approved ONFA reference plan. Further details on the accounting for the Nuclear Segregated Funds can be found in OPG’s 2017 annual MD&A in the section, Critical Accounting Policies and Estimates under the heading, Nuclear Fixed Asset Removal and Nuclear Waste Management Funds.
The year-over-year increase in accretion expense on the Nuclear Liabilities was mainly due to a higher amount of accretion expense deferred in regulatory variance and deferral accounts in the first quarter of 2017, due to costs not included in the nuclear base regulated price in effect prior to the OEB’s December 2017 decision.
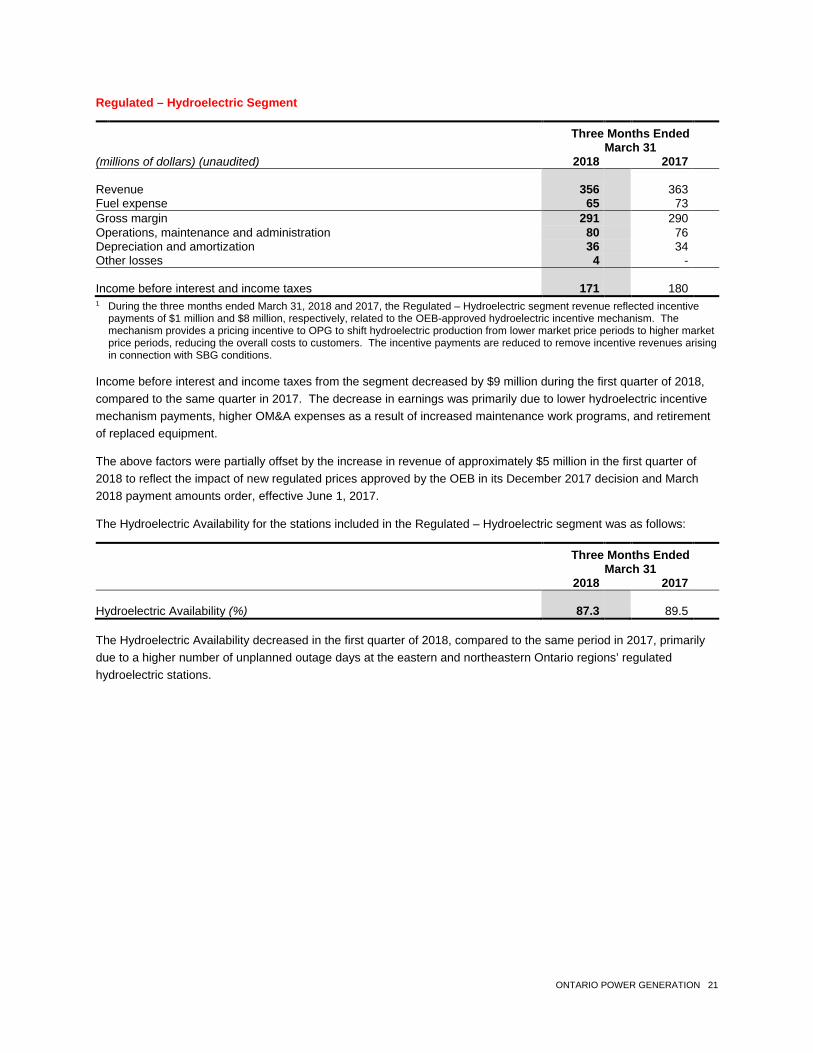
ONTARIO POWER GENERATION 21
Regulated – Hydroelectric Segment Three Months Ended March 31 (millions of dollars) (unaudited) 2018 2017 Revenue 356 363 Fuel expense 65 73 Gross margin 291 290 Operations, maintenance and administration 80 76 Depreciation and amortization 36 34 Other losses 4 - Income before interest and income taxes 171 180 1 During the three months ended March 31, 2018 and 2017, the Regulated – Hydroelectric segment revenue reflected incentive
payments of $1 million and $8 million, respectively, related to the OEB-approved hydroelectric incentive mechanism. The mechanism provides a pricing incentive to OPG to shift hydroelectric production from lower market price periods to higher market price periods, reducing the overall costs to customers. The incentive payments are reduced to remove incentive revenues arising in connection with SBG conditions.
Income before interest and income taxes from the segment decreased by $9 million during the first quarter of 2018, compared to the same quarter in 2017. The decrease in earnings was primarily due to lower hydroelectric incentive mechanism payments, higher OM&A expenses as a result of increased maintenance work programs, and retirement of replaced equipment.
The above factors were partially offset by the increase in revenue of approximately $5 million in the first quarter of 2018 to reflect the impact of new regulated prices approved by the OEB in its December 2017 decision and March 2018 payment amounts order, effective June 1, 2017.
The Hydroelectric Availability for the stations included in the Regulated – Hydroelectric segment was as follows:
Three Months Ended March 31 2018 2017 Hydroelectric Availability (%) 87.3 89.5
The Hydroelectric Availability decreased in the first quarter of 2018, compared to the same period in 2017, primarily due to a higher number of unplanned outage days at the eastern and northeastern Ontario regions’ regulated hydroelectric stations.
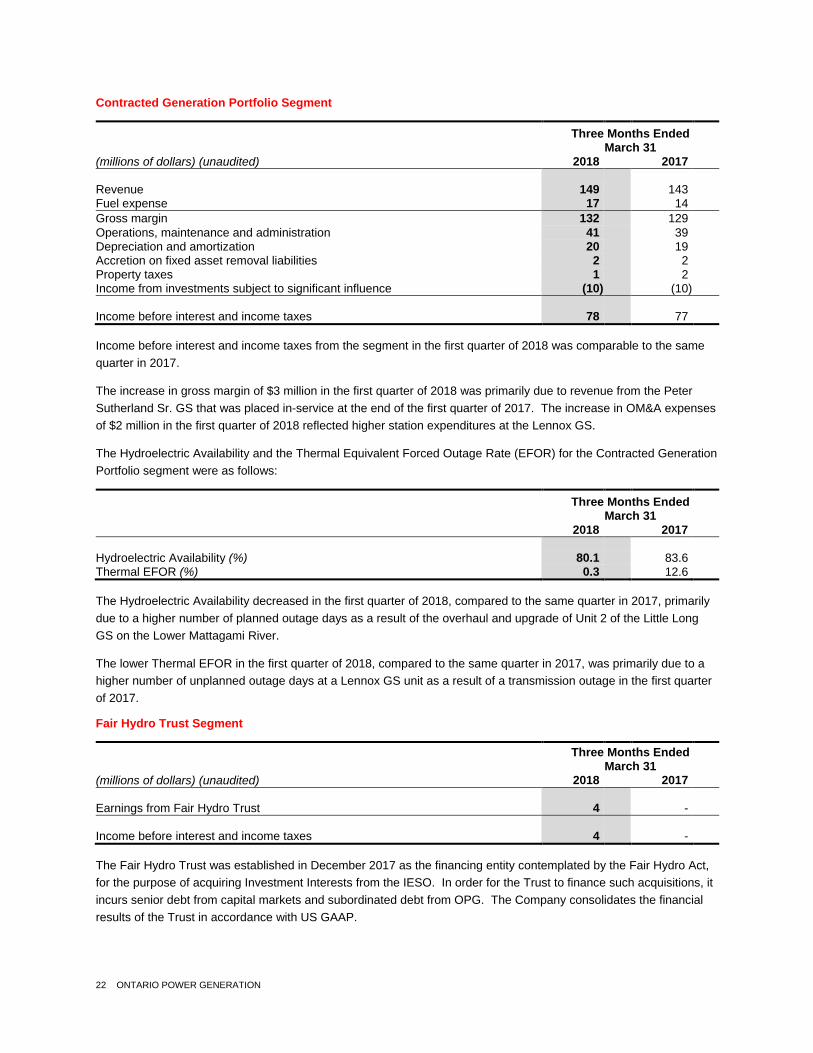
22 ONTARIO POWER GENERATION
Contracted Generation Portfolio Segment Three Months Ended March 31 (millions of dollars) (unaudited) 2018 2017 Revenue 149 143 Fuel expense 17 14 Gross margin 132 129 Operations, maintenance and administration 41 39 Depreciation and amortization 20 19 Accretion on fixed asset removal liabilities 2 2 Property taxes 1 2 Income from investments subject to significant influence (10) (10) Income before interest and income taxes 78 77
Income before interest and income taxes from the segment in the first quarter of 2018 was comparable to the same quarter in 2017.
The increase in gross margin of $3 million in the first quarter of 2018 was primarily due to revenue from the Peter Sutherland Sr. GS that was placed in-service at the end of the first quarter of 2017. The increase in OM&A expenses of $2 million in the first quarter of 2018 reflected higher station expenditures at the Lennox GS.
The Hydroelectric Availability and the Thermal Equivalent Forced Outage Rate (EFOR) for the Contracted Generation Portfolio segment were as follows:
Three Months Ended March 31 2018 2017 Hydroelectric Availability (%) 80.1 83.6 Thermal EFOR (%) 0.3 12.6
The Hydroelectric Availability decreased in the first quarter of 2018, compared to the same quarter in 2017, primarily due to a higher number of planned outage days as a result of the overhaul and upgrade of Unit 2 of the Little Long GS on the Lower Mattagami River.
The lower Thermal EFOR in the first quarter of 2018, compared to the same quarter in 2017, was primarily due to a higher number of unplanned outage days at a Lennox GS unit as a result of a transmission outage in the first quarter of 2017.
Fair Hydro Trust Segment Three Months Ended March 31 (millions of dollars) (unaudited) 2018 2017 Earnings from Fair Hydro Trust 4 - Income before interest and income taxes 4 -
The Fair Hydro Trust was established in December 2017 as the financing entity contemplated by the Fair Hydro Act, for the purpose of acquiring Investment Interests from the IESO. In order for the Trust to finance such acquisitions, it incurs senior debt from capital markets and subordinated debt from OPG. The Company consolidates the financial results of the Trust in accordance with US GAAP.
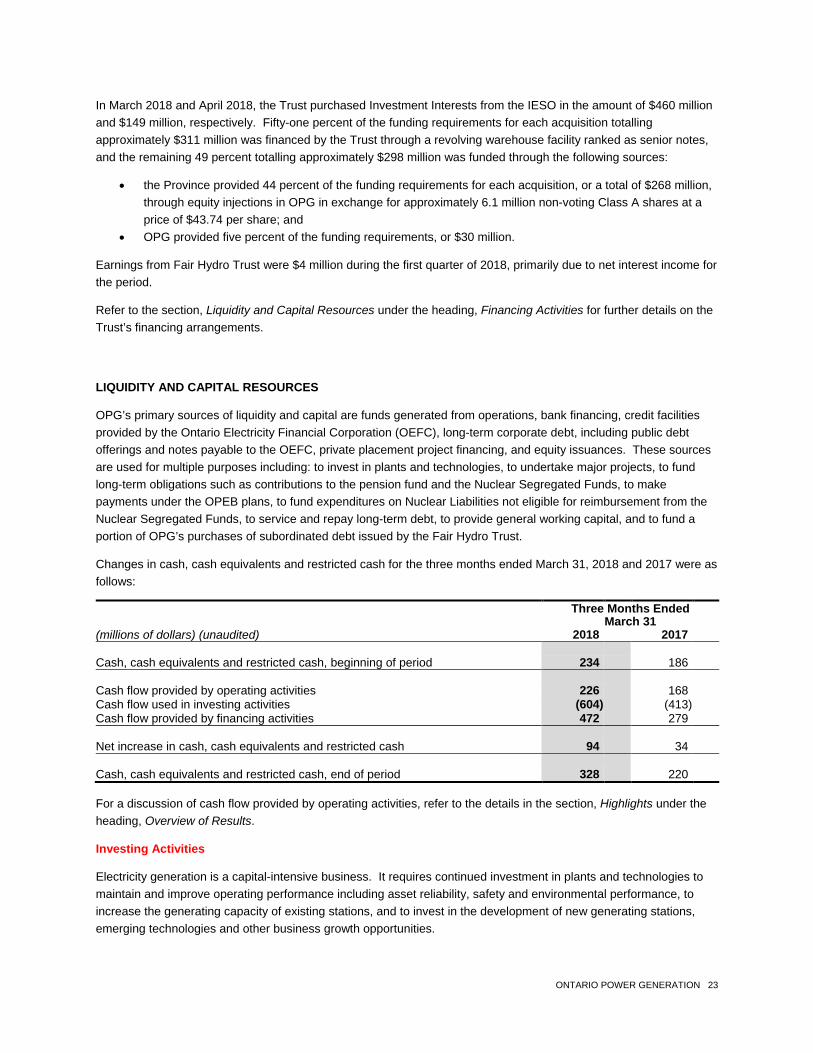
ONTARIO POWER GENERATION 23
In March 2018 and April 2018, the Trust purchased Investment Interests from the IESO in the amount of $460 million and $149 million, respectively. Fifty-one percent of the funding requirements for each acquisition totalling approximately $311 million was financed by the Trust through a revolving warehouse facility ranked as senior notes, and the remaining 49 percent totalling approximately $298 million was funded through the following sources:
• the Province provided 44 percent of the funding requirements for each acquisition, or a total of $268 million, through equity injections in OPG in exchange for approximately 6.1 million non-voting Class A shares at a price of $43.74 per share; and
• OPG provided five percent of the funding requirements, or $30 million.
Earnings from Fair Hydro Trust were $4 million during the first quarter of 2018, primarily due to net interest income for the period.
Refer to the section, Liquidity and Capital Resources under the heading, Financing Activities for further details on the Trust’s financing arrangements.
LIQUIDITY AND CAPITAL RESOURCES
OPG’s primary sources of liquidity and capital are funds generated from operations, bank financing, credit facilities provided by the Ontario Electricity Financial Corporation (OEFC), long-term corporate debt, including public debt offerings and notes payable to the OEFC, private placement project financing, and equity issuances. These sources are used for multiple purposes including: to invest in plants and technologies, to undertake major projects, to fund long-term obligations such as contributions to the pension fund and the Nuclear Segregated Funds, to make payments under the OPEB plans, to fund expenditures on Nuclear Liabilities not eligible for reimbursement from the Nuclear Segregated Funds, to service and repay long-term debt, to provide general working capital, and to fund a portion of OPG’s purchases of subordinated debt issued by the Fair Hydro Trust.
Changes in cash, cash equivalents and restricted cash for the three months ended March 31, 2018 and 2017 were as follows:
Three Months Ended March 31 (millions of dollars) (unaudited) 2018 2017 Cash, cash equivalents and restricted cash, beginning of period 234 186 Cash flow provided by operating activities 226 168 Cash flow used in investing activities (604) (413) Cash flow provided by financing activities 472 279 Net increase in cash, cash equivalents and restricted cash 94 34 Cash, cash equivalents and restricted cash, end of period 328 220
For a discussion of cash flow provided by operating activities, refer to the details in the section, Highlights under the heading, Overview of Results.
Investing Activities
Electricity generation is a capital-intensive business. It requires continued investment in plants and technologies to maintain and improve operating performance including asset reliability, safety and environmental performance, to increase the generating capacity of existing stations, and to invest in the development of new generating stations, emerging technologies and other business growth opportunities.
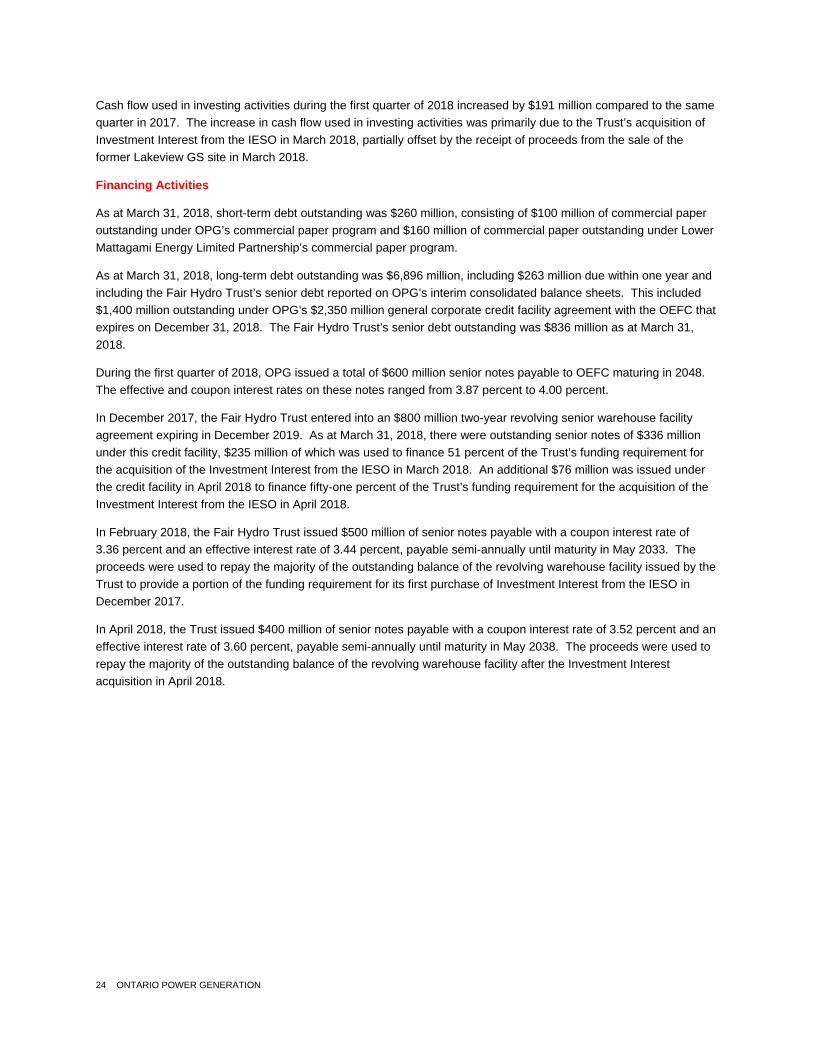
24 ONTARIO POWER GENERATION
Cash flow used in investing activities during the first quarter of 2018 increased by $191 million compared to the same quarter in 2017. The increase in cash flow used in investing activities was primarily due to the Trust’s acquisition of Investment Interest from the IESO in March 2018, partially offset by the receipt of proceeds from the sale of the former Lakeview GS site in March 2018.
Financing Activities
As at March 31, 2018, short-term debt outstanding was $260 million, consisting of $100 million of commercial paper outstanding under OPG’s commercial paper program and $160 million of commercial paper outstanding under Lower Mattagami Energy Limited Partnership’s commercial paper program.
As at March 31, 2018, long-term debt outstanding was $6,896 million, including $263 million due within one year and including the Fair Hydro Trust’s senior debt reported on OPG’s interim consolidated balance sheets. This included $1,400 million outstanding under OPG’s $2,350 million general corporate credit facility agreement with the OEFC that expires on December 31, 2018. The Fair Hydro Trust’s senior debt outstanding was $836 million as at March 31, 2018.
During the first quarter of 2018, OPG issued a total of $600 million senior notes payable to OEFC maturing in 2048. The effective and coupon interest rates on these notes ranged from 3.87 percent to 4.00 percent.
In December 2017, the Fair Hydro Trust entered into an $800 million two-year revolving senior warehouse facility agreement expiring in December 2019. As at March 31, 2018, there were outstanding senior notes of $336 million under this credit facility, $235 million of which was used to finance 51 percent of the Trust’s funding requirement for the acquisition of the Investment Interest from the IESO in March 2018. An additional $76 million was issued under the credit facility in April 2018 to finance fifty-one percent of the Trust’s funding requirement for the acquisition of the Investment Interest from the IESO in April 2018.
In February 2018, the Fair Hydro Trust issued $500 million of senior notes payable with a coupon interest rate of 3.36 percent and an effective interest rate of 3.44 percent, payable semi-annually until maturity in May 2033. The proceeds were used to repay the majority of the outstanding balance of the revolving warehouse facility issued by the Trust to provide a portion of the funding requirement for its first purchase of Investment Interest from the IESO in December 2017.
In April 2018, the Trust issued $400 million of senior notes payable with a coupon interest rate of 3.52 percent and an effective interest rate of 3.60 percent, payable semi-annually until maturity in May 2038. The proceeds were used to repay the majority of the outstanding balance of the revolving warehouse facility after the Investment Interest acquisition in April 2018.
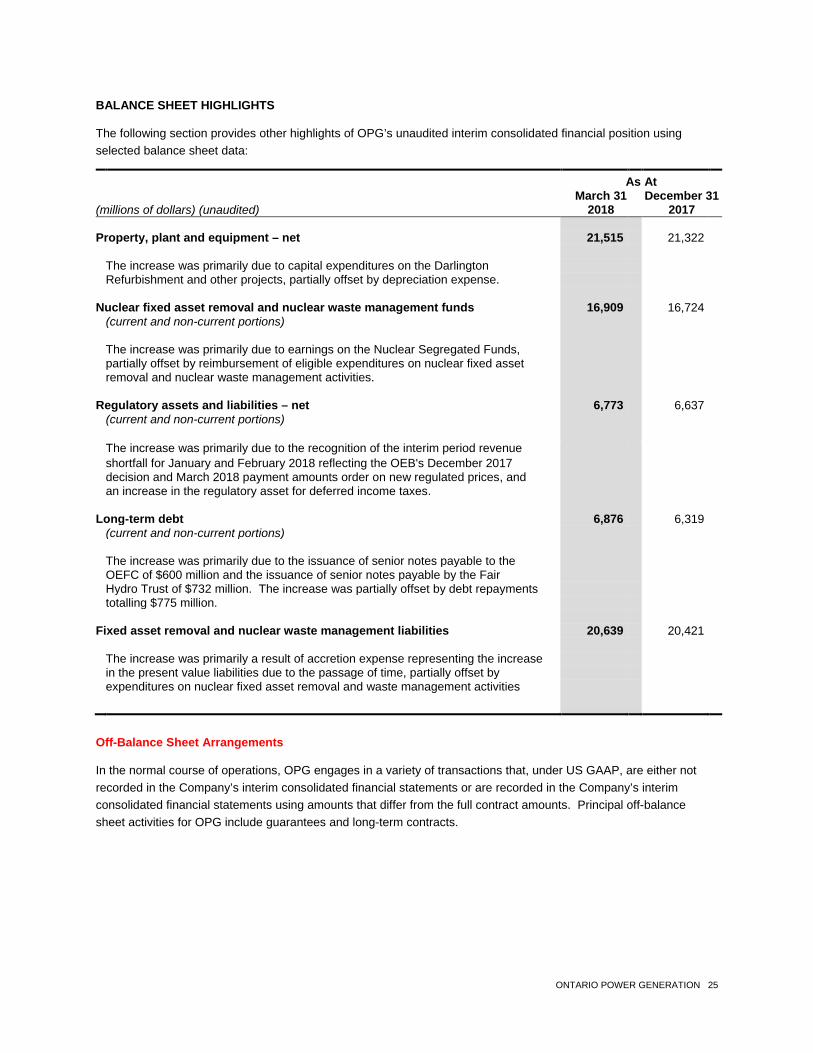
ONTARIO POWER GENERATION 25
BALANCE SHEET HIGHLIGHTS
The following section provides other highlights of OPG’s unaudited interim consolidated financial position using selected balance sheet data:
As At March 31 December 31 (millions of dollars) (unaudited) 2018 2017 Property, plant and equipment – net 21,515 21,322 The increase was primarily due to capital expenditures on the Darlington Refurbishment and other projects, partially offset by depreciation expense. Nuclear fixed asset removal and nuclear waste management funds 16,909 16,724 (current and non-current portions) The increase was primarily due to earnings on the Nuclear Segregated Funds, partially offset by reimbursement of eligible expenditures on nuclear fixed asset removal and nuclear waste management activities. Regulatory assets and liabilities – net 6,773 6,637 (current and non-current portions) The increase was primarily due to the recognition of the interim period revenue shortfall for January and February 2018 reflecting the OEB's December 2017 decision and March 2018 payment amounts order on new regulated prices, and an increase in the regulatory asset for deferred income taxes. Long-term debt 6,876 6,319 (current and non-current portions) The increase was primarily due to the issuance of senior notes payable to the OEFC of $600 million and the issuance of senior notes payable by the Fair Hydro Trust of $732 million. The increase was partially offset by debt repayments totalling $775 million. Fixed asset removal and nuclear waste management liabilities 20,639 20,421 The increase was primarily a result of accretion expense representing the increase in the present value liabilities due to the passage of time, partially offset by expenditures on nuclear fixed asset removal and waste management activities Off-Balance Sheet Arrangements
In the normal course of operations, OPG engages in a variety of transactions that, under US GAAP, are either not recorded in the Company’s interim consolidated financial statements or are recorded in the Company’s interim consolidated financial statements using amounts that differ from the full contract amounts. Principal off-balance sheet activities for OPG include guarantees and long-term contracts.
26 ONTARIO POWER GENERATION
CHANGES IN ACCOUNTING POLICIES AND ESTIMATES
OPG’s significant accounting policies are outlined in Note 3 to the audited consolidated financial statements as at and for the year ended December 31, 2017. A discussion of new accounting policies resulting from the adoption of new accounting standards effective January 1, 2018, recent accounting pronouncements, and changes in accounting estimates are included in Note 2 to OPG’s unaudited interim consolidated financial statements as at and for the three months ended March 31, 2018 under the heading, Significant Accounting Policies and Estimates. Disclosure regarding OPG’s critical accounting policies is included in OPG’s 2017 annual MD&A.
Exemptive Relief for Reporting under US GAAP
In April 2018, OPG received an extension to its exemptive relief from the OSC requirements of section 3.2 of National Instrument 52-107 Acceptable Accounting Policies and Auditing Standards. The exemption allows OPG to file consolidated financial statements based on US GAAP, rather than IFRS, without becoming a Securities and Exchange Commission registrant. This exemption replaces the exemptive relief received by OPG from the OSC in February 2014. The exemption will terminate on the earliest of the following:
• January 1, 2024; • the financial year that commences after OPG ceases to have activities subject to rate regulation; and • the effective date prescribed by the International Accounting Standards Board (IASB) for the mandatory
application of a standard within IFRS specific to entities with rate-regulated activities.
As a result of adopting US GAAP in 2011 as required by the FAA regulation, OPG’s plan to convert to IFRS, effective January 1, 2012, was discontinued. OPG had substantively completed the IFRS conversion project when it suspended the project. If a future transition to IFRS for the purposes of OPG’s consolidated financial statements is required, conversion work can be effectively restarted with sufficient lead time to evaluate and conclude on changes that occurred subsequent to the decision to suspend the project. OPG continues to monitor the IASB’s current standard-setting project related to entities with rate-regulated activities.
RISK MANAGEMENT
The following provides an update to the discussion of the Company’s risks and risk management activities included in OPG’s 2017 annual MD&A. As such, the disclosure in this section should be read in conjunction with the Risk Management section included in the annual MD&A.
Risks to Achieving Operational Excellence
Proposed Asbestos Regulations
The Government of Canada is in the final stages of developing new regulations to prohibit the use of asbestos and products containing asbestos. The proposed Prohibition of Asbestos and Asbestos Products Regulations are expected to come into effect in 2018. The proposed regulations would prohibit the import, sale and use of asbestos and the manufacture, import, sale and use of products containing asbestos, with a limited number of exclusions. The use of asbestos and products containing asbestos that were installed prior to the proposed regulations coming into force would not be prohibited.
OPG is assessing the impact of the proposed regulations, particularly affecting the use of certain critical spare parts and existing inventory within the nuclear fleet which contain asbestos. These spare parts may be required to address an emergent condition or to complete a maintenance outage to return a unit to operation. OPG has provided submissions to Environment and Climate Change Canada and to the CNSC outlining the impacts of the proposed regulations on the Company’s nuclear operations.
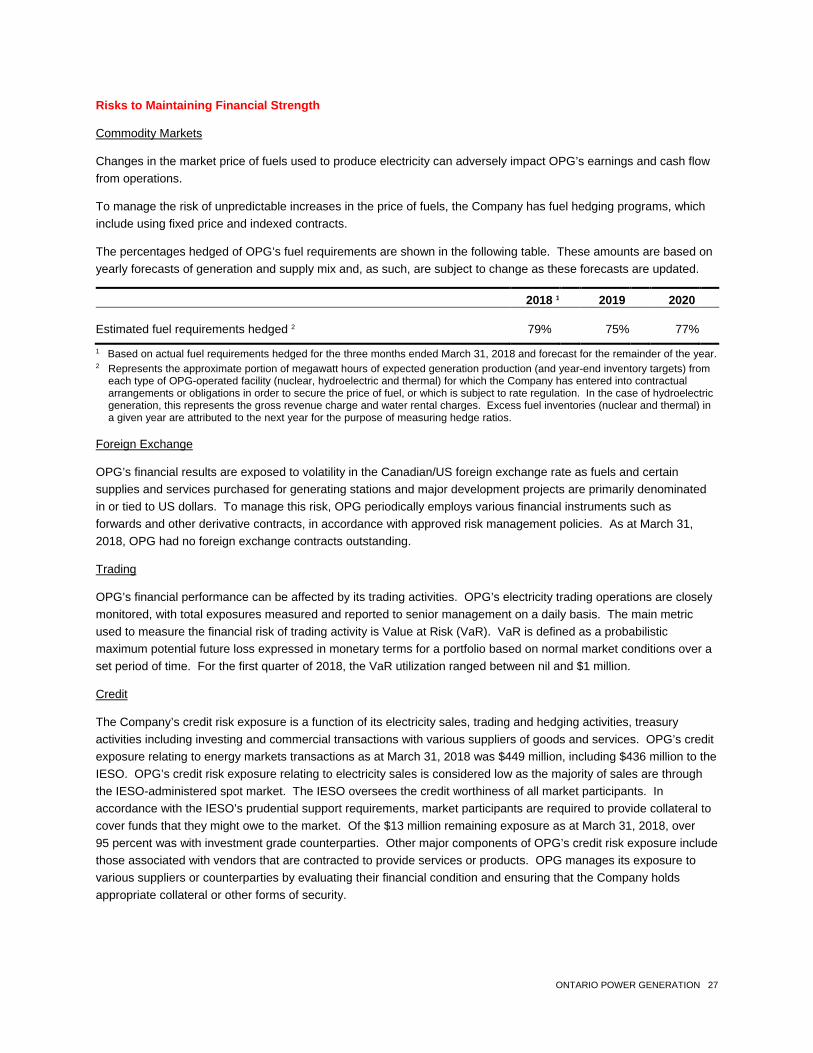
ONTARIO POWER GENERATION 27
Risks to Maintaining Financial Strength
Commodity Markets
Changes in the market price of fuels used to produce electricity can adversely impact OPG’s earnings and cash flow from operations.
To manage the risk of unpredictable increases in the price of fuels, the Company has fuel hedging programs, which include using fixed price and indexed contracts.
The percentages hedged of OPG’s fuel requirements are shown in the following table. These amounts are based on yearly forecasts of generation and supply mix and, as such, are subject to change as these forecasts are updated.
2018 1 2019 2020 Estimated fuel requirements hedged 2 79% 75% 77% 1 Based on actual fuel requirements hedged for the three months ended March 31, 2018 and forecast for the remainder of the year. 2 Represents the approximate portion of megawatt hours of expected generation production (and year-end inventory targets) from
each type of OPG-operated facility (nuclear, hydroelectric and thermal) for which the Company has entered into contractual arrangements or obligations in order to secure the price of fuel, or which is subject to rate regulation. In the case of hydroelectric generation, this represents the gross revenue charge and water rental charges. Excess fuel inventories (nuclear and thermal) in a given year are attributed to the next year for the purpose of measuring hedge ratios.
Foreign Exchange
OPG’s financial results are exposed to volatility in the Canadian/US foreign exchange rate as fuels and certain supplies and services purchased for generating stations and major development projects are primarily denominated in or tied to US dollars. To manage this risk, OPG periodically employs various financial instruments such as forwards and other derivative contracts, in accordance with approved risk management policies. As at March 31, 2018, OPG had no foreign exchange contracts outstanding.
Trading
OPG’s financial performance can be affected by its trading activities. OPG’s electricity trading operations are closely monitored, with total exposures measured and reported to senior management on a daily basis. The main metric used to measure the financial risk of trading activity is Value at Risk (VaR). VaR is defined as a probabilistic maximum potential future loss expressed in monetary terms for a portfolio based on normal market conditions over a set period of time. For the first quarter of 2018, the VaR utilization ranged between nil and $1 million.
Credit
The Company’s credit risk exposure is a function of its electricity sales, trading and hedging activities, treasury activities including investing and commercial transactions with various suppliers of goods and services. OPG’s credit exposure relating to energy markets transactions as at March 31, 2018 was $449 million, including $436 million to the IESO. OPG’s credit risk exposure relating to electricity sales is considered low as the majority of sales are through the IESO-administered spot market. The IESO oversees the credit worthiness of all market participants. In accordance with the IESO’s prudential support requirements, market participants are required to provide collateral to cover funds that they might owe to the market. Of the $13 million remaining exposure as at March 31, 2018, over 95 percent was with investment grade counterparties. Other major components of OPG’s credit risk exposure include those associated with vendors that are contracted to provide services or products. OPG manages its exposure to various suppliers or counterparties by evaluating their financial condition and ensuring that the Company holds appropriate collateral or other forms of security.
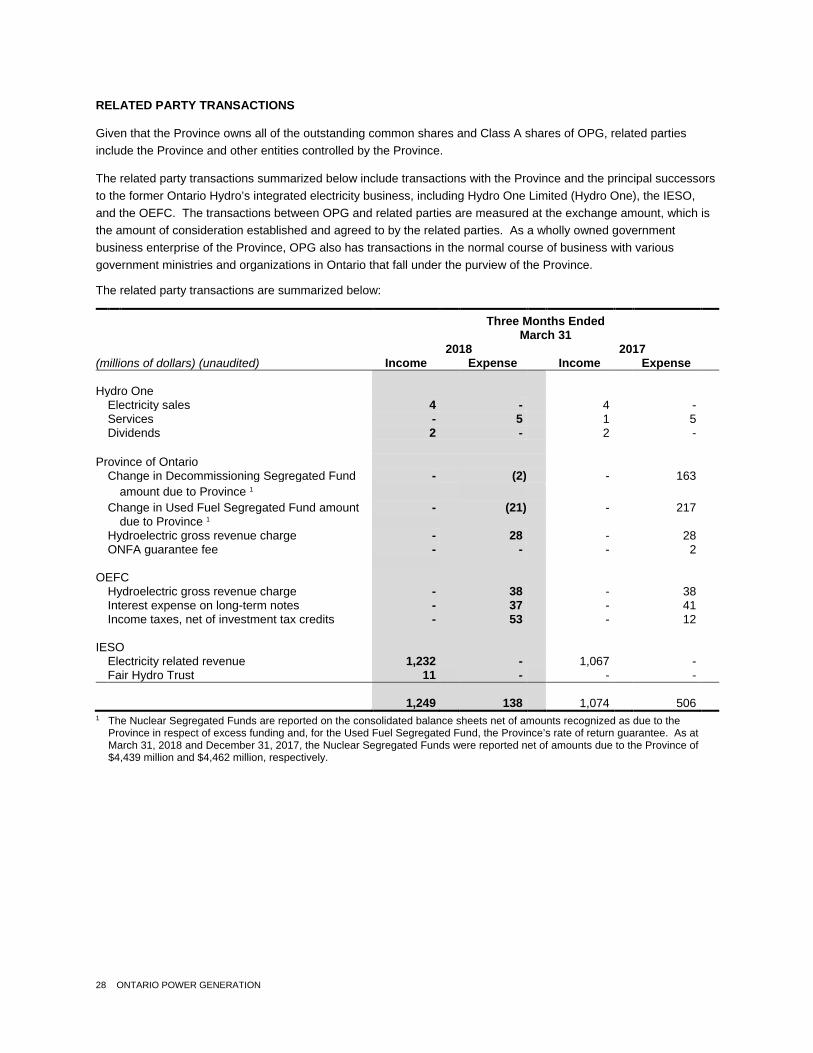
28 ONTARIO POWER GENERATION
RELATED PARTY TRANSACTIONS
Given that the Province owns all of the outstanding common shares and Class A shares of OPG, related parties include the Province and other entities controlled by the Province.
The related party transactions summarized below include transactions with the Province and the principal successors to the former Ontario Hydro’s integrated electricity business, including Hydro One Limited (Hydro One), the IESO, and the OEFC. The transactions between OPG and related parties are measured at the exchange amount, which is the amount of consideration established and agreed to by the related parties. As a wholly owned government business enterprise of the Province, OPG also has transactions in the normal course of business with various government ministries and organizations in Ontario that fall under the purview of the Province.
The related party transactions are summarized below: Three Months Ended March 31 2018 2017 (millions of dollars) (unaudited) Income Expense Income Expense Hydro One Electricity sales 4 - 4 - Services - 5 1 5 Dividends 2 - 2 - Province of Ontario Change in Decommissioning Segregated Fund - (2) - 163 amount due to Province 1 Change in Used Fuel Segregated Fund amount - (21) - 217 due to Province 1 Hydroelectric gross revenue charge - 28 - 28 ONFA guarantee fee - - - 2 OEFC Hydroelectric gross revenue charge - 38 - 38 Interest expense on long-term notes - 37 - 41 Income taxes, net of investment tax credits - 53 - 12 IESO Electricity related revenue 1,232 - 1,067 - Fair Hydro Trust 11 - - - 1,249 138 1,074 506 1 The Nuclear Segregated Funds are reported on the consolidated balance sheets net of amounts recognized as due to the
Province in respect of excess funding and, for the Used Fuel Segregated Fund, the Province’s rate of return guarantee. As at March 31, 2018 and December 31, 2017, the Nuclear Segregated Funds were reported net of amounts due to the Province of $4,439 million and $4,462 million, respectively.
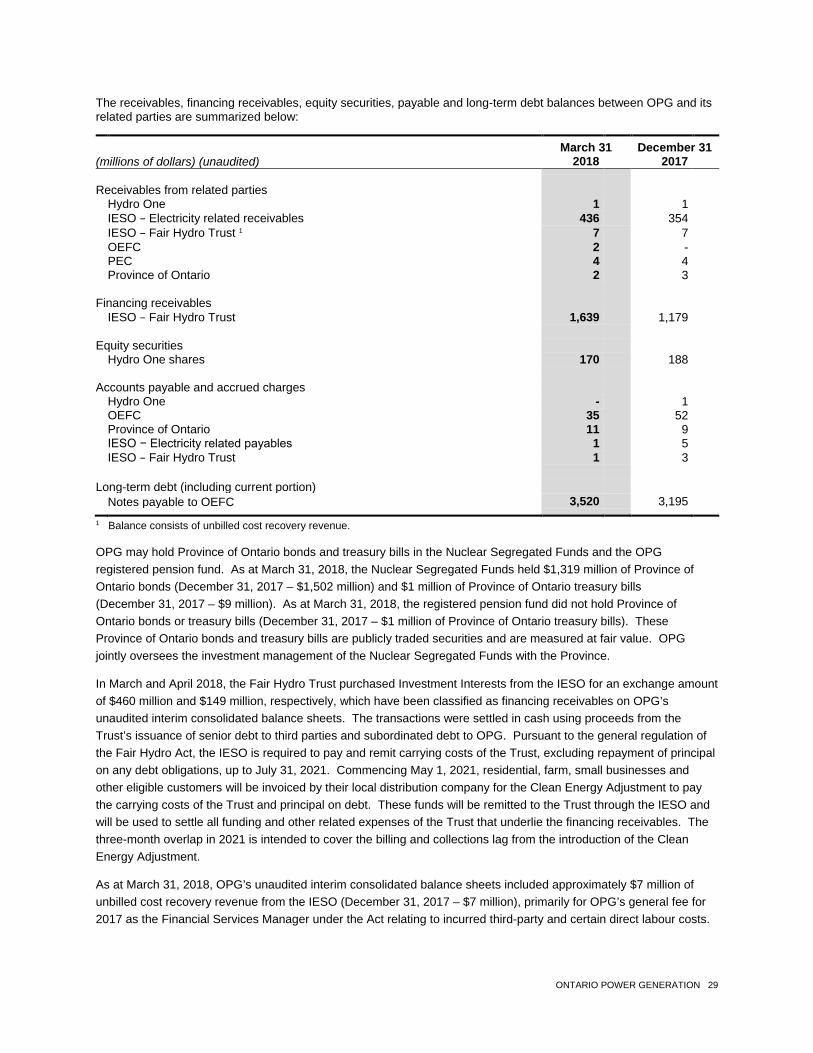
ONTARIO POWER GENERATION 29
The receivables, financing receivables, equity securities, payable and long-term debt balances between OPG and its related parties are summarized below: March 31 December 31 (millions of dollars) (unaudited) 2018 2017 Receivables from related parties Hydro One 1 1 IESO − Electricity related receivables 436 354 IESO − Fair Hydro Trust 1 7 7 OEFC 2 - PEC 4 4 Province of Ontario 2 3 Financing receivables IESO − Fair Hydro Trust 1,639 1,179 Equity securities Hydro One shares 170 188 Accounts payable and accrued charges Hydro One - 1 OEFC 35 52 Province of Ontario 11 9 IESO − Electricity related payables 1 5 IESO − Fair Hydro Trust 1 3 Long-term debt (including current portion) Notes payable to OEFC 3,520 3,195 1 Balance consists of unbilled cost recovery revenue.
OPG may hold Province of Ontario bonds and treasury bills in the Nuclear Segregated Funds and the OPG registered pension fund. As at March 31, 2018, the Nuclear Segregated Funds held $1,319 million of Province of Ontario bonds (December 31, 2017 – $1,502 million) and $1 million of Province of Ontario treasury bills (December 31, 2017 – $9 million). As at March 31, 2018, the registered pension fund did not hold Province of Ontario bonds or treasury bills (December 31, 2017 – $1 million of Province of Ontario treasury bills). These Province of Ontario bonds and treasury bills are publicly traded securities and are measured at fair value. OPG jointly oversees the investment management of the Nuclear Segregated Funds with the Province.
In March and April 2018, the Fair Hydro Trust purchased Investment Interests from the IESO for an exchange amount of $460 million and $149 million, respectively, which have been classified as financing receivables on OPG’s unaudited interim consolidated balance sheets. The transactions were settled in cash using proceeds from the Trust’s issuance of senior debt to third parties and subordinated debt to OPG. Pursuant to the general regulation of the Fair Hydro Act, the IESO is required to pay and remit carrying costs of the Trust, excluding repayment of principal on any debt obligations, up to July 31, 2021. Commencing May 1, 2021, residential, farm, small businesses and other eligible customers will be invoiced by their local distribution company for the Clean Energy Adjustment to pay the carrying costs of the Trust and principal on debt. These funds will be remitted to the Trust through the IESO and will be used to settle all funding and other related expenses of the Trust that underlie the financing receivables. The three-month overlap in 2021 is intended to cover the billing and collections lag from the introduction of the Clean Energy Adjustment.
As at March 31, 2018, OPG’s unaudited interim consolidated balance sheets included approximately $7 million of unbilled cost recovery revenue from the IESO (December 31, 2017 – $7 million), primarily for OPG’s general fee for 2017 as the Financial Services Manager under the Act relating to incurred third-party and certain direct labour costs.
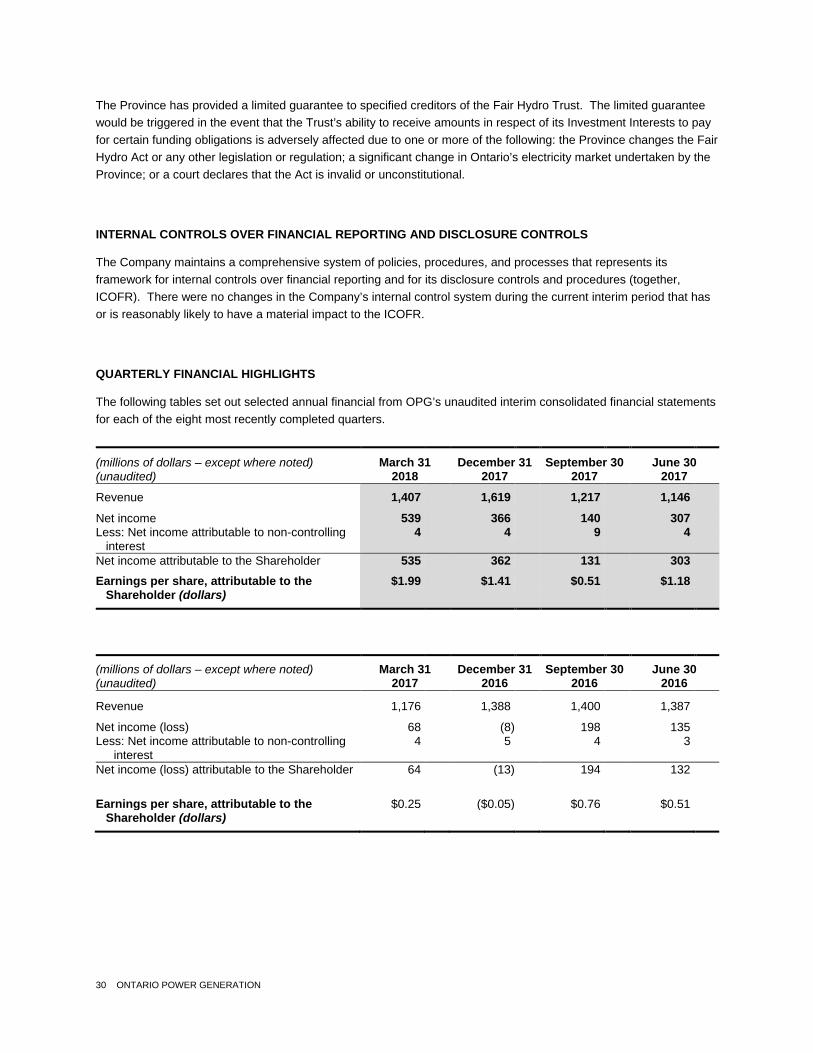
30 ONTARIO POWER GENERATION
The Province has provided a limited guarantee to specified creditors of the Fair Hydro Trust. The limited guarantee would be triggered in the event that the Trust’s ability to receive amounts in respect of its Investment Interests to pay for certain funding obligations is adversely affected due to one or more of the following: the Province changes the Fair Hydro Act or any other legislation or regulation; a significant change in Ontario’s electricity market undertaken by the Province; or a court declares that the Act is invalid or unconstitutional.
INTERNAL CONTROLS OVER FINANCIAL REPORTING AND DISCLOSURE CONTROLS
The Company maintains a comprehensive system of policies, procedures, and processes that represents its framework for internal controls over financial reporting and for its disclosure controls and procedures (together, ICOFR). There were no changes in the Company’s internal control system during the current interim period that has or is reasonably likely to have a material impact to the ICOFR.
QUARTERLY FINANCIAL HIGHLIGHTS
The following tables set out selected annual financial from OPG’s unaudited interim consolidated financial statements for each of the eight most recently completed quarters.
(millions of dollars – except where noted) March 31 December 31 September 30 June 30 (unaudited) 2018 2017 2017 2017 Revenue 1,407 1,619 1,217 1,146 Net income 539 366 140 307 Less: Net income attributable to non-controlling 4 4 9 4 interest Net income attributable to the Shareholder 535 362 131 303 Earnings per share, attributable to the $1.99 $1.41 $0.51 $1.18 Shareholder (dollars) (millions of dollars – except where noted) March 31 December 31 September 30 June 30 (unaudited) 2017 2016 2016 2016 Revenue 1,176 1,388 1,400 1,387 Net income (loss) 68 (8) 198 135 Less: Net income attributable to non-controlling 4 5 4 3
interest Net income (loss) attributable to the Shareholder 64 (13) 194 132 Earnings per share, attributable to the $0.25 ($0.05) $0.76 $0.51 Shareholder (dollars)
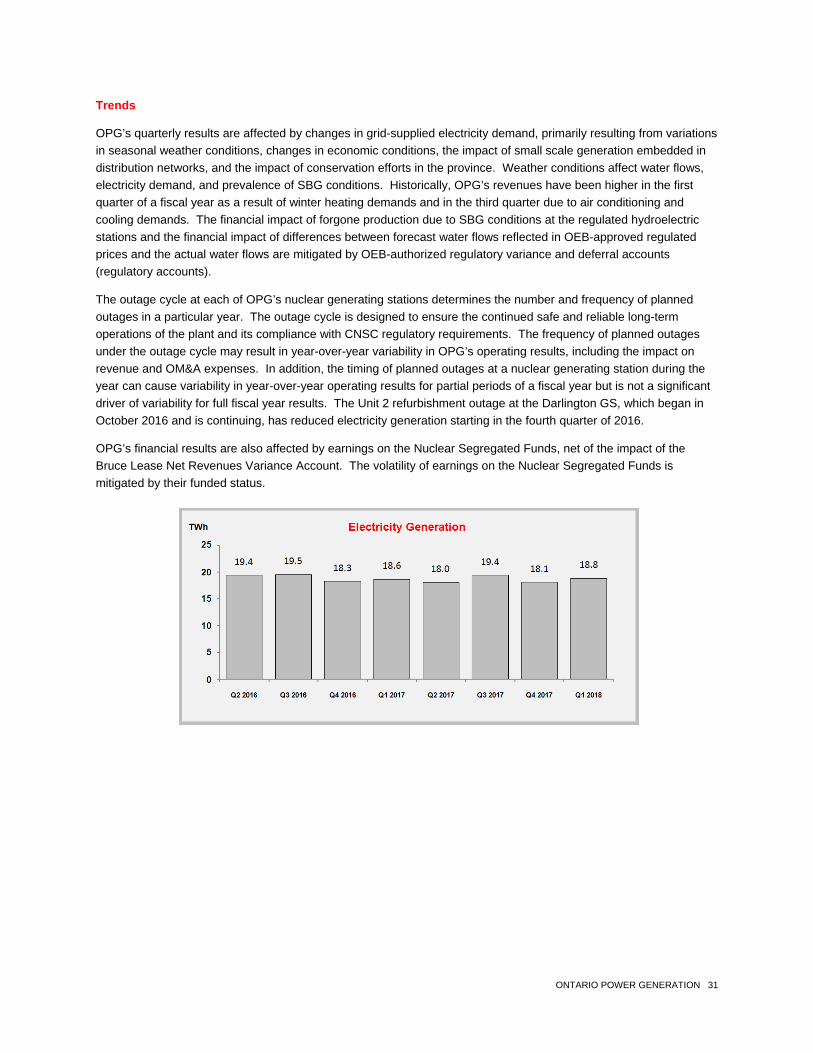
ONTARIO POWER GENERATION 31
Trends
OPG’s quarterly results are affected by changes in grid-supplied electricity demand, primarily resulting from variations in seasonal weather conditions, changes in economic conditions, the impact of small scale generation embedded in distribution networks, and the impact of conservation efforts in the province. Weather conditions affect water flows, electricity demand, and prevalence of SBG conditions. Historically, OPG’s revenues have been higher in the first quarter of a fiscal year as a result of winter heating demands and in the third quarter due to air conditioning and cooling demands. The financial impact of forgone production due to SBG conditions at the regulated hydroelectric stations and the financial impact of differences between forecast water flows reflected in OEB-approved regulated prices and the actual water flows are mitigated by OEB-authorized regulatory variance and deferral accounts (regulatory accounts).
The outage cycle at each of OPG’s nuclear generating stations determines the number and frequency of planned outages in a particular year. The outage cycle is designed to ensure the continued safe and reliable long-term operations of the plant and its compliance with CNSC regulatory requirements. The frequency of planned outages under the outage cycle may result in year-over-year variability in OPG’s operating results, including the impact on revenue and OM&A expenses. In addition, the timing of planned outages at a nuclear generating station during the year can cause variability in year-over-year operating results for partial periods of a fiscal year but is not a significant driver of variability for full fiscal year results. The Unit 2 refurbishment outage at the Darlington GS, which began in October 2016 and is continuing, has reduced electricity generation starting in the fourth quarter of 2016.
OPG’s financial results are also affected by earnings on the Nuclear Segregated Funds, net of the impact of the Bruce Lease Net Revenues Variance Account. The volatility of earnings on the Nuclear Segregated Funds is mitigated by their funded status.

32 ONTARIO POWER GENERATION
SUPPLEMENTARY NON-GAAP FINANCIAL MEASURES
In addition to providing net income and other financial information in accordance with US GAAP, certain non-GAAP financial measures are also presented in OPG’s MD&A. These non-GAAP measures do not have any standardized meaning prescribed by US GAAP, and therefore, may not be comparable to similar measures presented by other issuers. OPG utilizes these measures to make operating decisions and assess performance. Readers of the MD&A would utilize these measures in assessing the Company’s financial performance from ongoing operations. The Company believes that these indicators are important since they provide additional information about OPG’s performance, facilitate comparison of results over different periods, and present measures consistent with the Company’s strategies to provide value to the Shareholder, improve cost performance, and ensure availability of cost effective funding. These non-GAAP financial measures have not been presented as an alternative to net income or any other measure in accordance with US GAAP, but as indicators of operating performance.
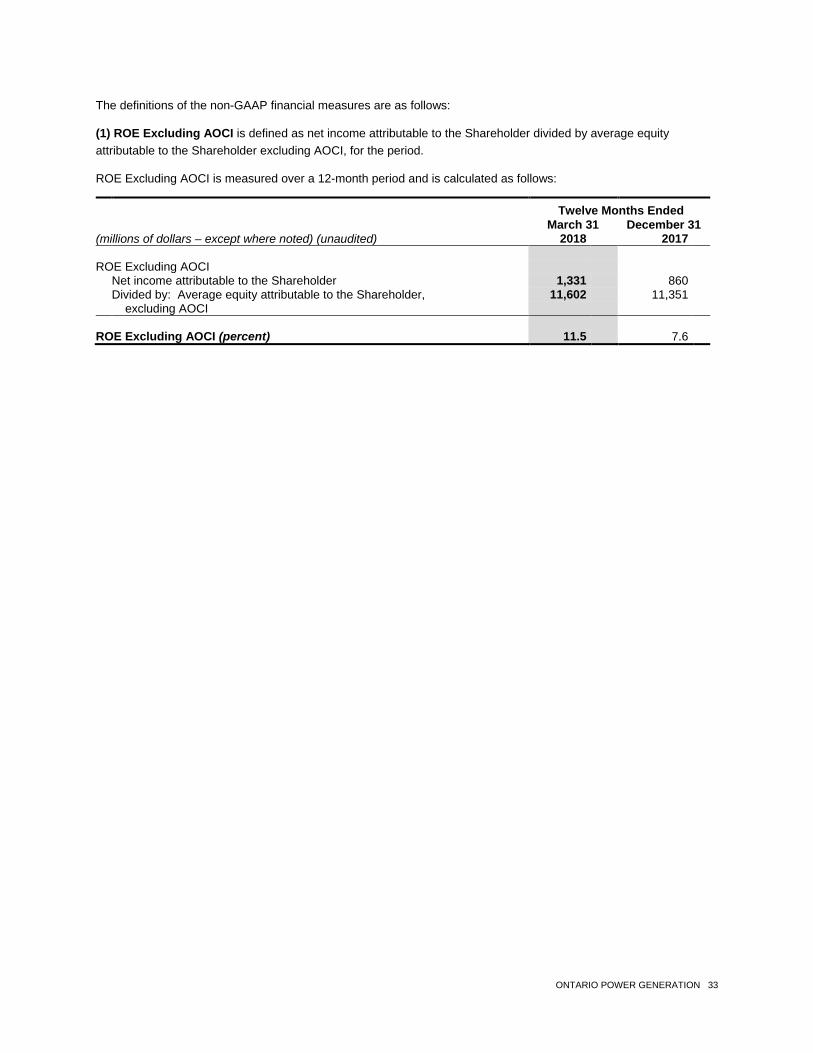
ONTARIO POWER GENERATION 33
The definitions of the non-GAAP financial measures are as follows:
(1) ROE Excluding AOCI is defined as net income attributable to the Shareholder divided by average equity attributable to the Shareholder excluding AOCI, for the period.
ROE Excluding AOCI is measured over a 12-month period and is calculated as follows:
Twelve Months Ended March 31 December 31
(millions of dollars – except where noted) (unaudited) 2018 2017 ROE Excluding AOCI Net income attributable to the Shareholder 1,331 860 Divided by: Average equity attributable to the Shareholder, 11,602 11,351 excluding AOCI ROE Excluding AOCI (percent) 11.5 7.6
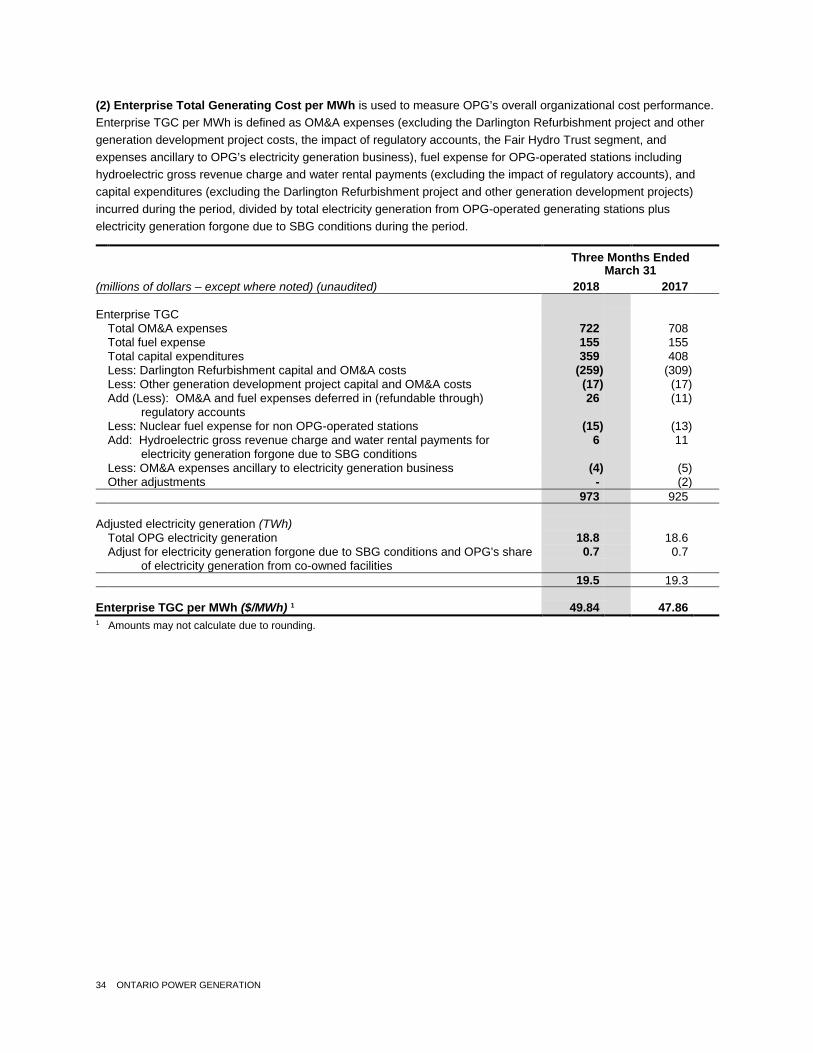
34 ONTARIO POWER GENERATION
(2) Enterprise Total Generating Cost per MWh is used to measure OPG’s overall organizational cost performance. Enterprise TGC per MWh is defined as OM&A expenses (excluding the Darlington Refurbishment project and other generation development project costs, the impact of regulatory accounts, the Fair Hydro Trust segment, and expenses ancillary to OPG’s electricity generation business), fuel expense for OPG-operated stations including hydroelectric gross revenue charge and water rental payments (excluding the impact of regulatory accounts), and capital expenditures (excluding the Darlington Refurbishment project and other generation development projects) incurred during the period, divided by total electricity generation from OPG-operated generating stations plus electricity generation forgone due to SBG conditions during the period.
Three Months Ended March 31 (millions of dollars – except where noted) (unaudited) 2018 2017 Enterprise TGC Total OM&A expenses 722 708 Total fuel expense 155 155 Total capital expenditures 359 408 Less: Darlington Refurbishment capital and OM&A costs (259) (309) Less: Other generation development project capital and OM&A costs (17) (17) Add (Less): OM&A and fuel expenses deferred in (refundable through) 26 (11) regulatory accounts Less: Nuclear fuel expense for non OPG-operated stations (15) (13) Add: Hydroelectric gross revenue charge and water rental payments for 6 11 electricity generation forgone due to SBG conditions Less: OM&A expenses ancillary to electricity generation business (4) (5) Other adjustments - (2) 973 925 Adjusted electricity generation (TWh) Total OPG electricity generation 18.8 18.6 Adjust for electricity generation forgone due to SBG conditions and OPG's share 0.7 0.7 of electricity generation from co-owned facilities 19.5 19.3 Enterprise TGC per MWh ($/MWh) 1 49.84 47.86 1 Amounts may not calculate due to rounding.
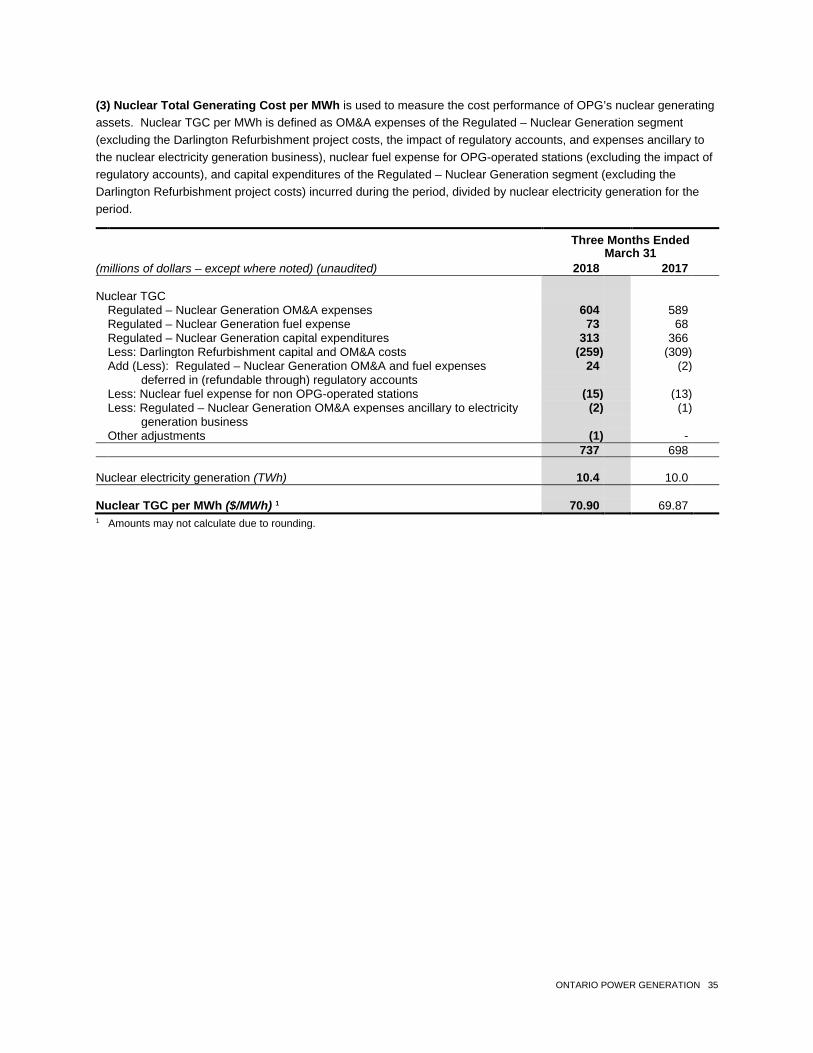
ONTARIO POWER GENERATION 35
(3) Nuclear Total Generating Cost per MWh is used to measure the cost performance of OPG’s nuclear generating assets. Nuclear TGC per MWh is defined as OM&A expenses of the Regulated – Nuclear Generation segment (excluding the Darlington Refurbishment project costs, the impact of regulatory accounts, and expenses ancillary to the nuclear electricity generation business), nuclear fuel expense for OPG-operated stations (excluding the impact of regulatory accounts), and capital expenditures of the Regulated – Nuclear Generation segment (excluding the Darlington Refurbishment project costs) incurred during the period, divided by nuclear electricity generation for the period.
Three Months Ended March 31 (millions of dollars – except where noted) (unaudited) 2018 2017 Nuclear TGC Regulated – Nuclear Generation OM&A expenses 604 589 Regulated – Nuclear Generation fuel expense 73 68 Regulated – Nuclear Generation capital expenditures 313 366 Less: Darlington Refurbishment capital and OM&A costs (259) (309) Add (Less): Regulated – Nuclear Generation OM&A and fuel expenses 24 (2) deferred in (refundable through) regulatory accounts Less: Nuclear fuel expense for non OPG-operated stations (15) (13) Less: Regulated – Nuclear Generation OM&A expenses ancillary to electricity (2) (1) generation business Other adjustments (1) - 737 698 Nuclear electricity generation (TWh) 10.4 10.0 Nuclear TGC per MWh ($/MWh) 1 70.90 69.87 1 Amounts may not calculate due to rounding.
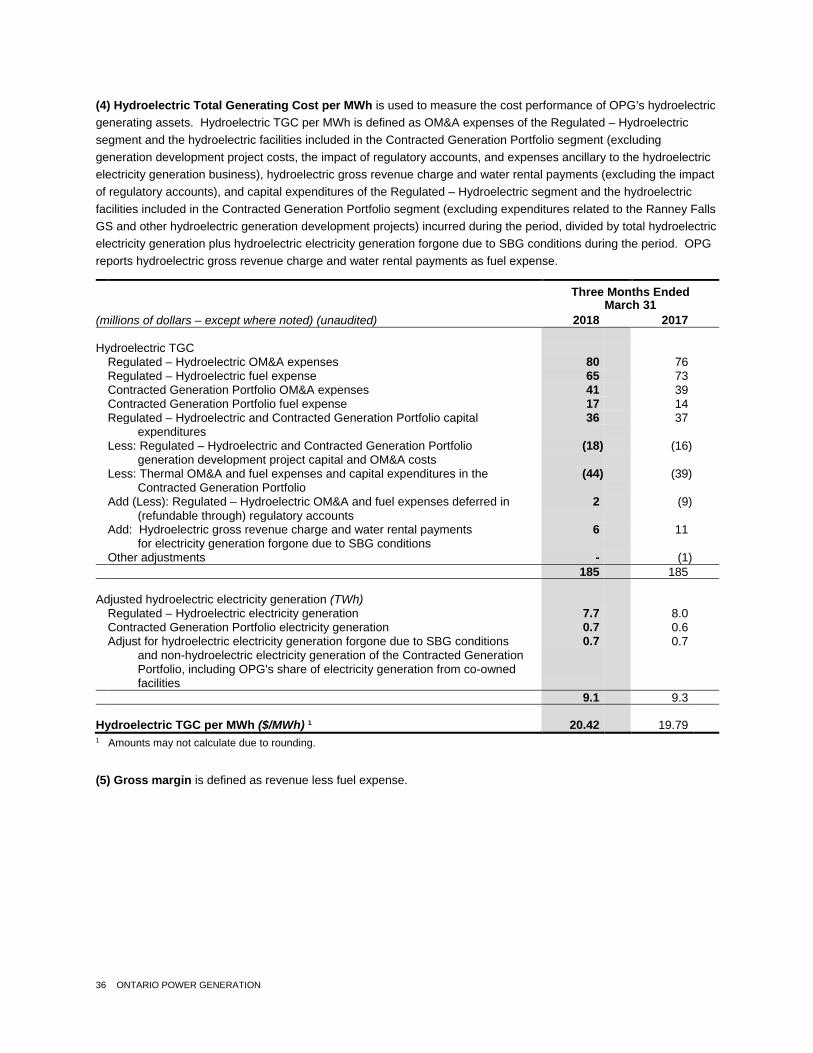
36 ONTARIO POWER GENERATION
(4) Hydroelectric Total Generating Cost per MWh is used to measure the cost performance of OPG’s hydroelectric generating assets. Hydroelectric TGC per MWh is defined as OM&A expenses of the Regulated – Hydroelectric segment and the hydroelectric facilities included in the Contracted Generation Portfolio segment (excluding generation development project costs, the impact of regulatory accounts, and expenses ancillary to the hydroelectric electricity generation business), hydroelectric gross revenue charge and water rental payments (excluding the impact of regulatory accounts), and capital expenditures of the Regulated – Hydroelectric segment and the hydroelectric facilities included in the Contracted Generation Portfolio segment (excluding expenditures related to the Ranney Falls GS and other hydroelectric generation development projects) incurred during the period, divided by total hydroelectric electricity generation plus hydroelectric electricity generation forgone due to SBG conditions during the period. OPG reports hydroelectric gross revenue charge and water rental payments as fuel expense.
Three Months Ended March 31 (millions of dollars – except where noted) (unaudited) 2018 2017 Hydroelectric TGC Regulated – Hydroelectric OM&A expenses 80 76 Regulated – Hydroelectric fuel expense 65 73 Contracted Generation Portfolio OM&A expenses 41 39 Contracted Generation Portfolio fuel expense 17 14 Regulated – Hydroelectric and Contracted Generation Portfolio capital 36 37 expenditures Less: Regulated – Hydroelectric and Contracted Generation Portfolio (18) (16) generation development project capital and OM&A costs Less: Thermal OM&A and fuel expenses and capital expenditures in the (44) (39) Contracted Generation Portfolio Add (Less): Regulated – Hydroelectric OM&A and fuel expenses deferred in 2 (9) (refundable through) regulatory accounts Add: Hydroelectric gross revenue charge and water rental payments 6 11 for electricity generation forgone due to SBG conditions Other adjustments - (1) 185 185 Adjusted hydroelectric electricity generation (TWh) Regulated – Hydroelectric electricity generation 7.7 8.0 Contracted Generation Portfolio electricity generation 0.7 0.6 Adjust for hydroelectric electricity generation forgone due to SBG conditions 0.7 0.7 and non-hydroelectric electricity generation of the Contracted Generation Portfolio, including OPG's share of electricity generation from co-owned facilities 9.1 9.3 Hydroelectric TGC per MWh ($/MWh) 1 20.42 19.79 1 Amounts may not calculate due to rounding.
(5) Gross margin is defined as revenue less fuel expense.

ONTARIO POWER GENERATION 37
For further information, please contact: Investor Relations 416-592-6700
Media Relations 416-592-4008
1-877-592-4008
www.opg.com
www.sedar.com
ONTARIO POWER GENERATION INC.
INTERIM CONSOLIDATED FINANCIAL STATEMENTS (unaudited)
MARCH 31, 2018
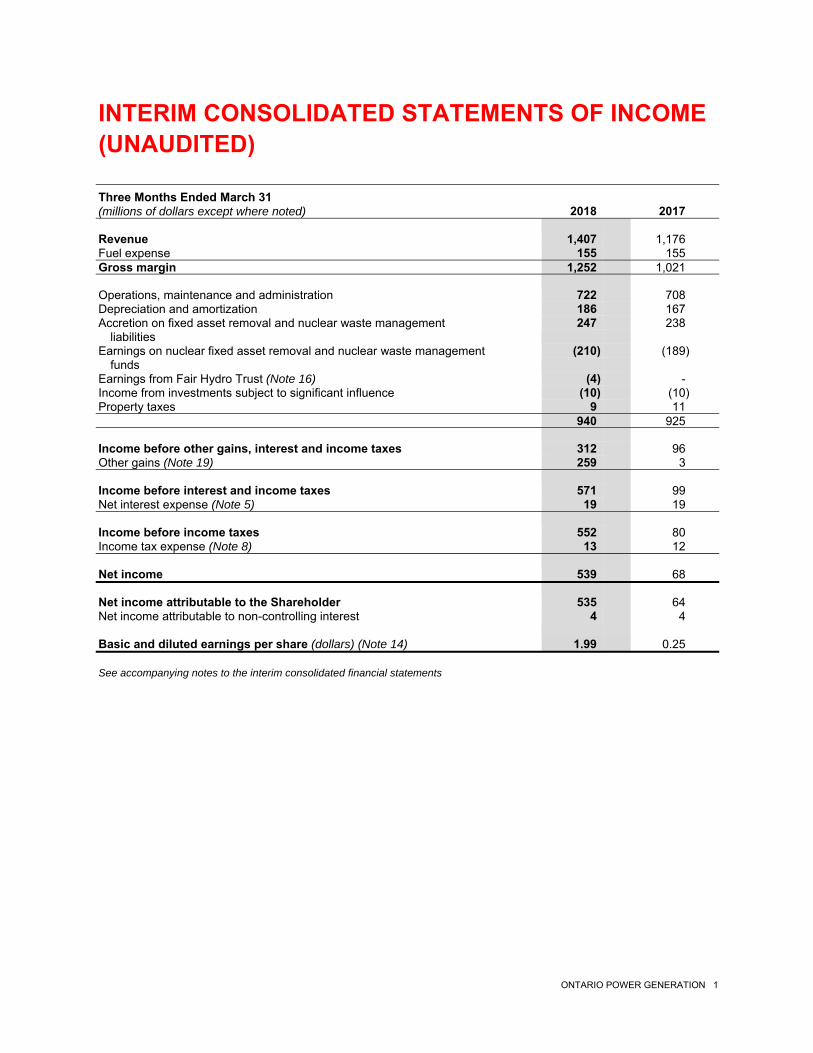
ONTARIO POWER GENERATION 1
INTERIM CONSOLIDATED STATEMENTS OF INCOME (UNAUDITED) Three Months Ended March 31 (millions of dollars except where noted) 2018 2017 Revenue 1,407 1,176 Fuel expense 155 155 Gross margin 1,252 1,021 Operations, maintenance and administration 722 708 Depreciation and amortization 186 167 Accretion on fixed asset removal and nuclear waste management 247 238 liabilities Earnings on nuclear fixed asset removal and nuclear waste management (210) (189) funds Earnings from Fair Hydro Trust (Note 16) (4) - Income from investments subject to significant influence (10) (10) Property taxes 9 11 940 925 Income before other gains, interest and income taxes 312 96 Other gains (Note 19) 259 3 Income before interest and income taxes 571 99 Net interest expense (Note 5) 19 19 Income before income taxes 552 80 Income tax expense (Note 8) 13 12 Net income 539 68 Net income attributable to the Shareholder 535 64 Net income attributable to non-controlling interest 4 4 Basic and diluted earnings per share (dollars) (Note 14) 1.99 0.25 See accompanying notes to the interim consolidated financial statements
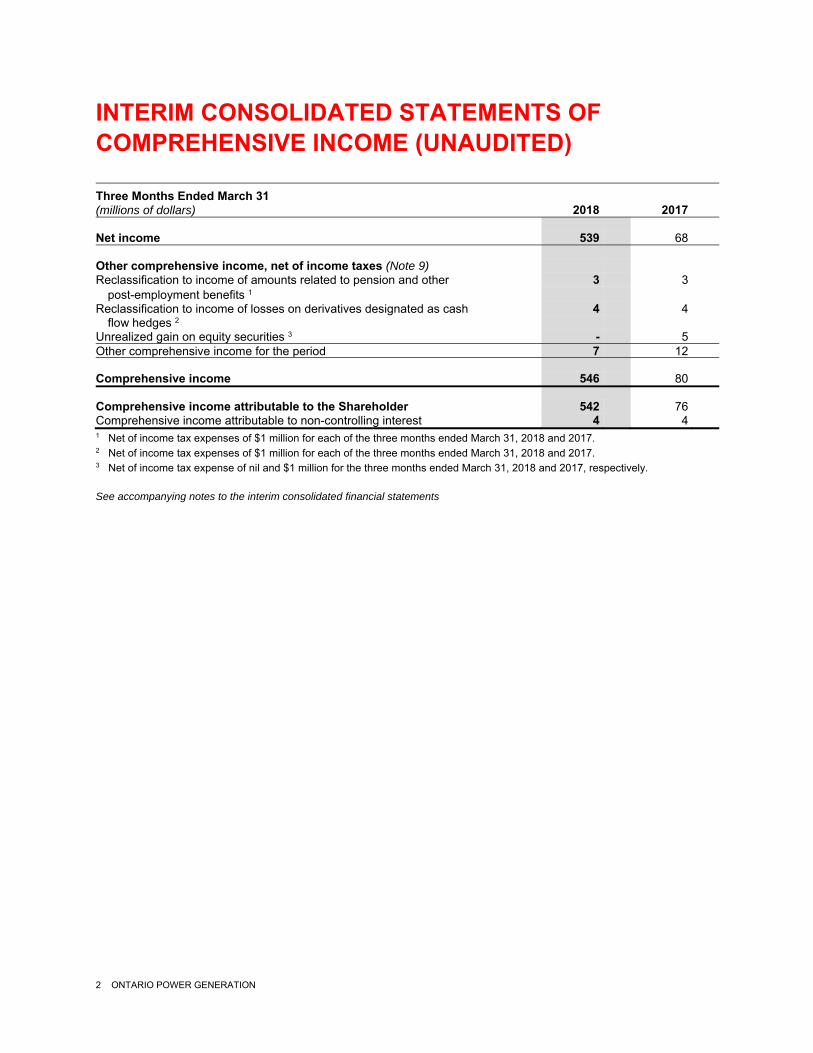
2 ONTARIO POWER GENERATION
INTERIM CONSOLIDATED STATEMENTS OF COMPREHENSIVE INCOME (UNAUDITED) Three Months Ended March 31 (millions of dollars) 2018 2017 Net income 539 68 Other comprehensive income, net of income taxes (Note 9) Reclassification to income of amounts related to pension and other 3 3 post-employment benefits 1 Reclassification to income of losses on derivatives designated as cash 4 4 flow hedges 2 Unrealized gain on equity securities 3 - 5 Other comprehensive income for the period 7 12 Comprehensive income 546 80 Comprehensive income attributable to the Shareholder 542 76 Comprehensive income attributable to non-controlling interest 4 4 1 Net of income tax expenses of $1 million for each of the three months ended March 31, 2018 and 2017. 2 Net of income tax expenses of $1 million for each of the three months ended March 31, 2018 and 2017. 3 Net of income tax expense of nil and $1 million for the three months ended March 31, 2018 and 2017, respectively. See accompanying notes to the interim consolidated financial statements
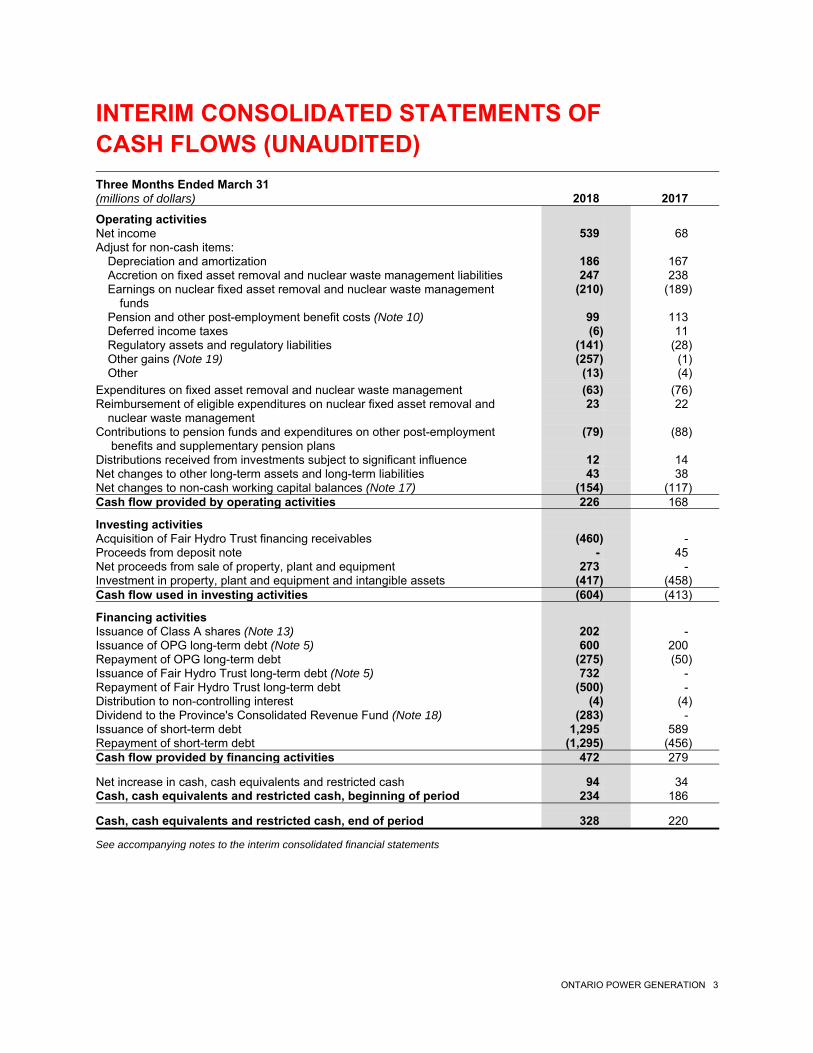
ONTARIO POWER GENERATION 3
INTERIM CONSOLIDATED STATEMENTS OF CASH FLOWS (UNAUDITED)
Three Months Ended March 31 (millions of dollars) 2018 2017
Operating activities Net income 539 68 Adjust for non-cash items: Depreciation and amortization 186 167 Accretion on fixed asset removal and nuclear waste management liabilities 247 238 Earnings on nuclear fixed asset removal and nuclear waste management (210) (189) funds Pension and other post-employment benefit costs (Note 10) 99 113 Deferred income taxes (6) 11 Regulatory assets and regulatory liabilities (141) (28) Other gains (Note 19) (257) (1) Other (13) (4) Expenditures on fixed asset removal and nuclear waste management (63) (76) Reimbursement of eligible expenditures on nuclear fixed asset removal and 23 22 nuclear waste management Contributions to pension funds and expenditures on other post-employment (79) (88) benefits and supplementary pension plans Distributions received from investments subject to significant influence 12 14 Net changes to other long-term assets and long-term liabilities 43 38 Net changes to non-cash working capital balances (Note 17) (154) (117) Cash flow provided by operating activities 226 168
Investing activities Acquisition of Fair Hydro Trust financing receivables (460) - Proceeds from deposit note - 45 Net proceeds from sale of property, plant and equipment 273 - Investment in property, plant and equipment and intangible assets (417) (458) Cash flow used in investing activities (604) (413)
Financing activities Issuance of Class A shares (Note 13) 202 - Issuance of OPG long-term debt (Note 5) 600 200 Repayment of OPG long-term debt (275) (50) Issuance of Fair Hydro Trust long-term debt (Note 5) 732 - Repayment of Fair Hydro Trust long-term debt (500) - Distribution to non-controlling interest (4) (4) Dividend to the Province's Consolidated Revenue Fund (Note 18) (283) - Issuance of short-term debt 1,295 589 Repayment of short-term debt (1,295) (456) Cash flow provided by financing activities 472 279
Net increase in cash, cash equivalents and restricted cash 94 34 Cash, cash equivalents and restricted cash, beginning of period 234 186
Cash, cash equivalents and restricted cash, end of period 328 220
See accompanying notes to the interim consolidated financial statements
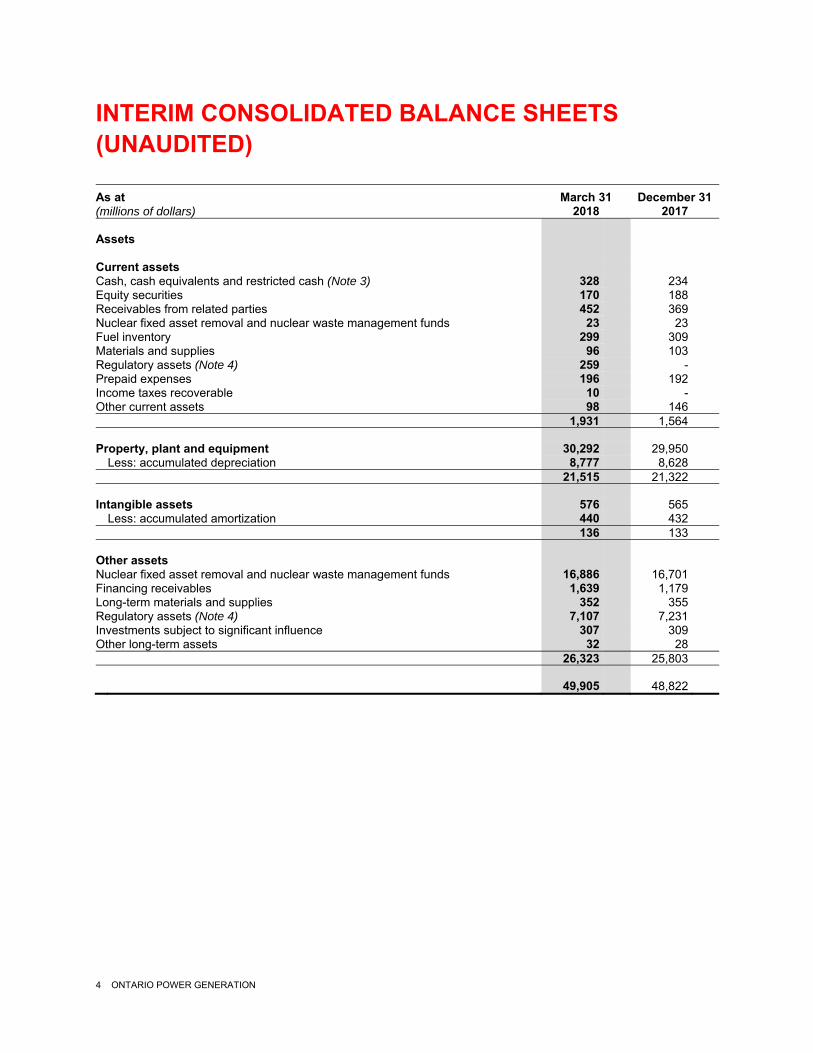
4 ONTARIO POWER GENERATION
INTERIM CONSOLIDATED BALANCE SHEETS (UNAUDITED) As at March 31 December 31 (millions of dollars) 2018 2017 Assets Current assets Cash, cash equivalents and restricted cash (Note 3) 328 234 Equity securities 170 188 Receivables from related parties 452 369 Nuclear fixed asset removal and nuclear waste management funds 23 23 Fuel inventory 299 309 Materials and supplies 96 103 Regulatory assets (Note 4) 259 - Prepaid expenses 196 192 Income taxes recoverable 10 - Other current assets 98 146 1,931 1,564 Property, plant and equipment 30,292 29,950 Less: accumulated depreciation 8,777 8,628 21,515 21,322 Intangible assets 576 565 Less: accumulated amortization 440 432 136 133 Other assets Nuclear fixed asset removal and nuclear waste management funds 16,886 16,701 Financing receivables 1,639 1,179 Long-term materials and supplies 352 355 Regulatory assets (Note 4) 7,107 7,231 Investments subject to significant influence 307 309 Other long-term assets 32 28 26,323 25,803 49,905 48,822
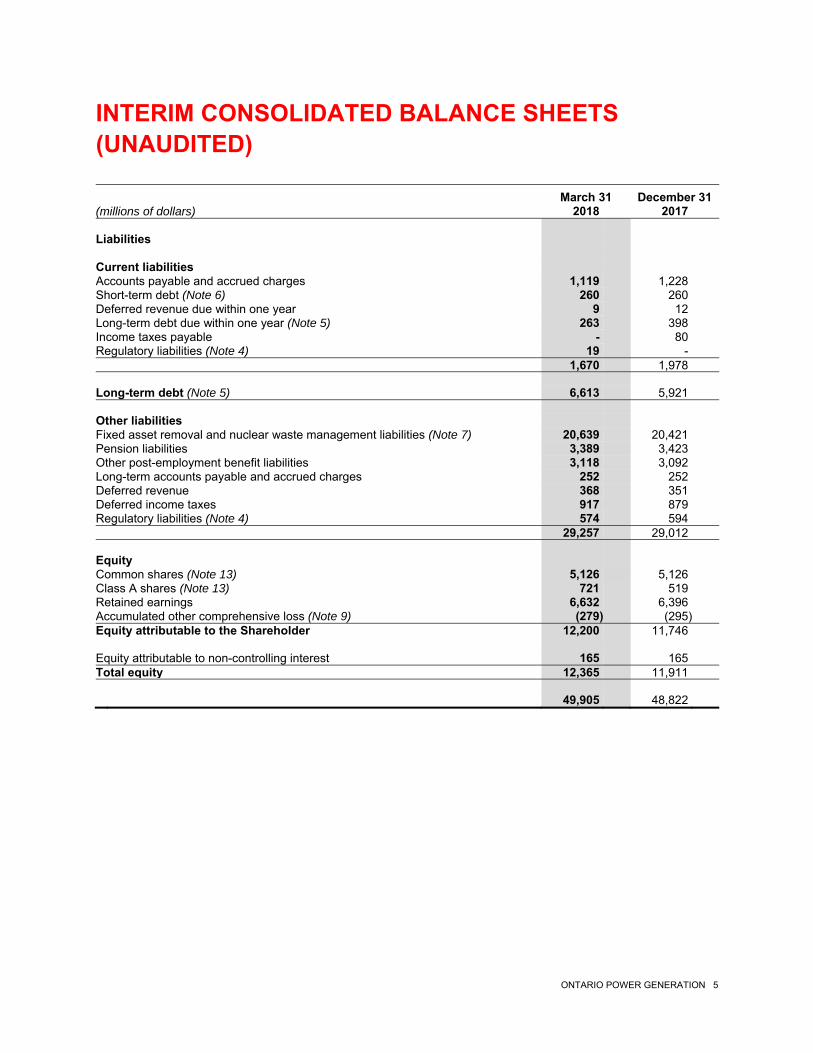
ONTARIO POWER GENERATION 5
INTERIM CONSOLIDATED BALANCE SHEETS (UNAUDITED) March 31 December 31 (millions of dollars) 2018 2017 Liabilities Current liabilities Accounts payable and accrued charges 1,119 1,228 Short-term debt (Note 6) 260 260 Deferred revenue due within one year 9 12 Long-term debt due within one year (Note 5) 263 398 Income taxes payable - 80 Regulatory liabilities (Note 4) 19 - 1,670 1,978 Long-term debt (Note 5) 6,613 5,921 Other liabilities Fixed asset removal and nuclear waste management liabilities (Note 7) 20,639 20,421 Pension liabilities 3,389 3,423 Other post-employment benefit liabilities 3,118 3,092 Long-term accounts payable and accrued charges 252 252 Deferred revenue 368 351 Deferred income taxes 917 879 Regulatory liabilities (Note 4) 574 594 29,257 29,012 Equity Common shares (Note 13) 5,126 5,126 Class A shares (Note 13) 721 519 Retained earnings 6,632 6,396 Accumulated other comprehensive loss (Note 9) (279) (295) Equity attributable to the Shareholder 12,200 11,746 Equity attributable to non-controlling interest 165 165 Total equity 12,365 11,911 49,905 48,822
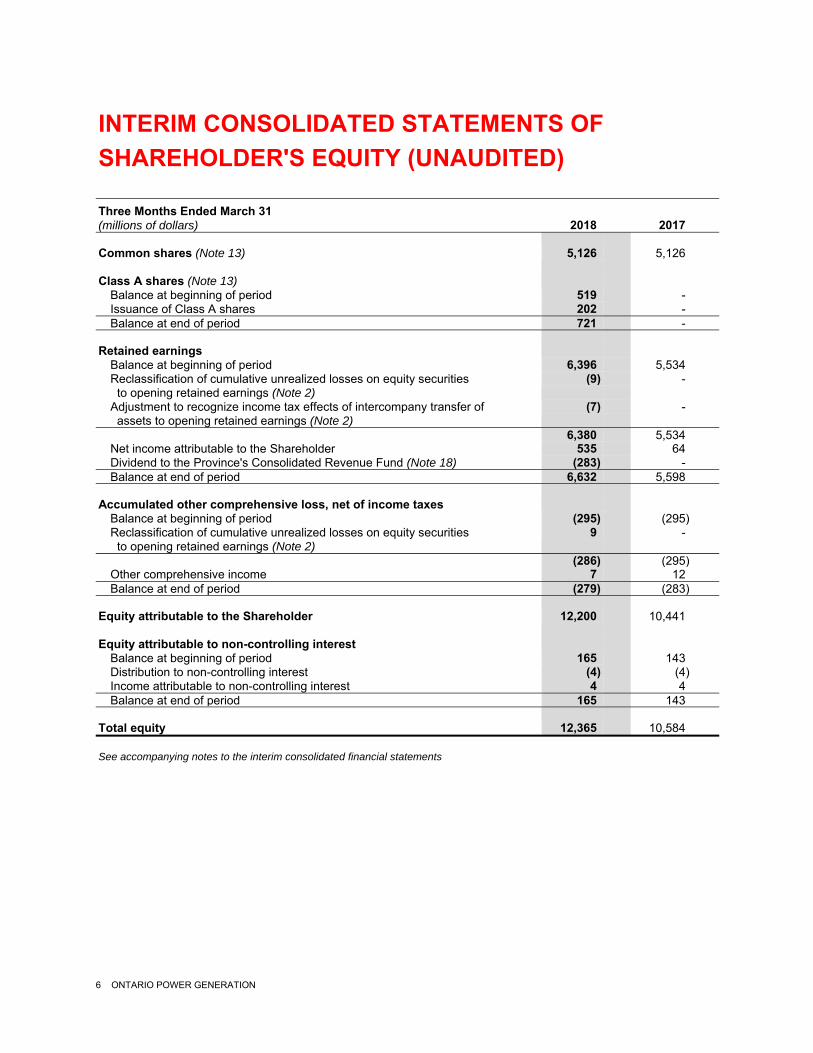
6 ONTARIO POWER GENERATION
INTERIM CONSOLIDATED STATEMENTS OF
SHAREHOLDER'S EQUITY (UNAUDITED) Three Months Ended March 31 (millions of dollars) 2018 2017 Common shares (Note 13) 5,126 5,126 Class A shares (Note 13) Balance at beginning of period 519 - Issuance of Class A shares 202 - Balance at end of period 721 - Retained earnings Balance at beginning of period 6,396 5,534 Reclassification of cumulative unrealized losses on equity securities (9) - to opening retained earnings (Note 2) Adjustment to recognize income tax effects of intercompany transfer of (7) - assets to opening retained earnings (Note 2) 6,380 5,534 Net income attributable to the Shareholder 535 64 Dividend to the Province's Consolidated Revenue Fund (Note 18) (283) - Balance at end of period 6,632 5,598 Accumulated other comprehensive loss, net of income taxes Balance at beginning of period (295) (295) Reclassification of cumulative unrealized losses on equity securities 9 - to opening retained earnings (Note 2) (286) (295) Other comprehensive income 7 12 Balance at end of period (279) (283) Equity attributable to the Shareholder 12,200 10,441 Equity attributable to non-controlling interest Balance at beginning of period 165 143 Distribution to non-controlling interest (4) (4) Income attributable to non-controlling interest 4 4 Balance at end of period 165 143 Total equity 12,365 10,584 See accompanying notes to the interim consolidated financial statements
ONTARIO POWER GENERATION 7
NOTES TO THE INTERIM CONSOLIDATED FINANCIAL
STATEMENTS (UNAUDITED) For the three months ended March 31, 2018 and 2017
1. BASIS OF PRESENTATION
These interim consolidated financial statements for the three months ended March 31, 2018 and 2017 include the accounts of Ontario Power Generation Inc. (OPG or the Company) and its subsidiaries. The Company consolidates its interest in entities over which it is able to exercise control and attributes the results to its sole shareholder, the Province of Ontario (Province). Interests owned by other parties are reflected as non-controlling interest. These interim consolidated financial statements have been prepared and presented in accordance with United States generally accepted accounting principles (US GAAP). These interim consolidated financial statements do not contain all of the disclosures required by US GAAP for annual financial statements. Accordingly, they should be read in conjunction with the annual consolidated financial statements of the Company as at and for the year ended December 31, 2017. All dollar amounts are presented in Canadian dollars.
As required by Ontario Regulation 395/11, as amended, under the Financial Administration Act (Ontario), OPG adopted US GAAP for the presentation of its consolidated financial statements, effective January 1, 2012. Since January 1, 2012, OPG also has received exemptive relief from the Ontario Securities Commission (OSC) from the requirements of section 3.2 of National Instrument 52-107, Acceptable Accounting Policies and Auditing Standards. The exemption allows OPG to file consolidated financial statements based on US GAAP, rather than International Financial Reporting Standards (IFRS), without becoming a US Securities and Exchange Commission registrant.
In April 2018, OPG received an extension to its previous exemptive relief from the OSC. The exemptive relief will now terminate on the earliest of the following:
January 1, 2024 The financial year that commences after OPG ceases to have activities subject to rate regulation The effective date prescribed by the International Accounting Standards Board for the mandatory application
of a standard within IFRS specific to entities with rate regulated activities.
All dollar amounts are presented in Canadian dollars, unless otherwise noted. Certain 2017 comparative amounts have been reclassified from financial statements previously presented to conform to the 2018 interim consolidated financial statement presentation.
Use of Management Estimates
The preparation of interim consolidated financial statements in conformity with US GAAP requires management to make estimates and assumptions that affect the reported amounts of assets and liabilities at the date of the interim consolidated financial statements, and the reported amounts of revenues and expenses for the reporting periods. Management evaluates these estimates on an ongoing basis based upon historical experience, current conditions, and assumptions believed to be reasonable at the time the assumption is made, with any adjustments recognized in the period incurred. Significant estimates are included in the determination of pension and other post-employment benefit (OPEB) balances, asset retirement obligations and associated asset retirement costs capitalized as part of property, plant and equipment, income taxes (including deferred income taxes), contingencies, regulatory assets and regulatory liabilities, valuation of derivative instruments and investments in segregated funds, depreciation and amortization expenses, and inventories. Actual results may differ significantly from these estimates.
8 ONTARIO POWER GENERATION
2. SIGNIFICANT ACCOUNTING POLICIES AND ESTIMATES
New Accounting Standards Effective in 2018
Revenue from Contracts with Customers
In May 2014, the Financial Accounting Standards Board (FASB) issued Accounting Standards Update (ASU) No. 2014-09, Revenue from Contracts with Customers (Topic 606), which supersedes nearly all existing revenue recognition guidance, including industry-specific guidance, under US GAAP. The core principle of Topic 606 is to recognize revenues when promised goods or services are transferred to customers in an amount that reflects the consideration to which an entity expects to be entitled for those goods or services.
Effective January 1, 2018, OPG adopted Topic 606, including relevant practical expedients, utilizing the modified retrospective approach to implement the transition. No differences in the timing or amount of revenue recognition were identified as a result of the adoption of the new standard. The adoption of Topic 606 has required OPG to amend its accounting policy with respect to revenue recognition, as described below.
Revenue from Contracts with Customers – Regulated Generation
Energy revenue generated from OPG’s regulated facilities is based on regulated prices determined by the Ontario Energy Board (OEB) that include base regulated prices and, as applicable, rate riders for the recovery or repayment of approved variance and deferral account balances. The revenues from the regulated hydroelectric facilities are also subject to the OEB-approved hydroelectric incentive mechanism. This mechanism provides a pricing incentive to OPG to shift hydroelectric production from lower market price periods to higher market price periods, reducing the overall costs to customers.
All of OPG’s electricity generation is offered into the real-time energy spot market administered by the Independent Electrical System Operator (IESO). For electricity generated from its regulated nuclear and regulated hydroelectric facilities, OPG receives payment from the IESO on a monthly basis based on regulated prices authorized by the OEB. OPG’s performance obligation with respect to regulated generation is to supply electricity generated from its regulated nuclear and regulated hydroelectric facilities to the wholesale electricity market in Ontario. The Company has determined that this performance obligation is satisfied over time; OPG utilizes the output method under Topic 606 to recognize revenue by applying the relevant base regulated price and rate riders as applicable to each unit of electricity generated and metered to the IESO. This methodology reflects the real-time nature of electricity generation and the underlying performance obligation, of which no portion remains unsatisfied at the end of the applicable reporting period. During interim rate periods authorized by the OEB, revenue is recognized on the basis of interim regulated prices set by the OEB. In instances where a subsequent OEB decision results in a difference between final regulated prices retroactively effective for the interim period and the interim regulated prices, OPG records the resulting adjustment to revenue in connection with that period based on the OEB’s decision. Any resulting revenue shortfall in connection with the interim rate period is collected prospectively from the IESO in the manner authorized by the OEB. OPG’s receivables in connection with electricity generated from its regulated nuclear and regulated hydroelectric facilities are part of the Company’s electricity related receivables from the IESO, representing OPG’s unconditional right to payment for satisfying its performance obligation wherein only the passage of time is required before payment is received. For further discussion, refer to Note 11.
Regulated prices currently in effect for OPG’s regulated nuclear and regulated hydroelectric generation were established by the OEB’s December 2017 decision and March 2018 payment amounts order on OPG’s 2016 application for new regulated prices for the 2017-2021 period. In the decision, the OEB set an effective date for the new base regulated prices of June 1, 2017. Pursuant to the decision, the new base regulated prices are determined on an incentive ratemaking methodology for the hydroelectric facilities and under a custom incentive regulation framework for the nuclear facilities. For the hydroelectric facilities, the new base regulated prices are determined using a formula that annually escalates the previously approved regulated prices, subject to some adjustments,
ONTARIO POWER GENERATION 9
based on an industry-specific weighted inflation factor reflecting indices published annually by the OEB, less a stretch factor adjustment. For the nuclear facilities, the new base regulated prices are determined under a rate smoothing approach that defers a portion of the approved nuclear revenue requirement for future collection in the Rate Smoothing Deferral Account authorized by the OEB pursuant to Ontario Regulation 53/05, with the objective of making changes in OPG’s production-weighted average nuclear and hydroelectric regulated price more stable year over year. The nuclear revenue requirement for each of the years is based on the OEB-allowed level of operating costs including depreciation and amortization expenses and a return on rate base, less a stretch factor adjustment. Rate base is a regulatory construct that, for OPG, represents the average net level of investment in regulated fixed and intangible assets in-service and an allowance for working capital. The difference between the non-deferred portion of the nuclear revenue requirement, calculated by multiplying the nuclear base regulated price determined under rate smoothing and the OEB-approved forecast of OPG’s nuclear electricity production for the year, and the total approved nuclear revenue requirement for that year determines the portion of the revenue requirement deferred for future collection in the Rate Smoothing Deferral Account. See Note 4 for further information on the March 2018 payment amounts order and the Rate Smoothing Deferral Account.
Base regulated prices in effect during the period January 1, 2017 to May 31, 2017 were established by the OEB’s November 2014 decision and December 2014 order, using a forecast cost-of-service rate-setting methodology based on the OEB-approved revenue requirements, taking into account the OEB-approved forecasts of production and operating costs (including depreciation and amortization expenses) for the regulated facilities for 2014 and 2015 and a return on rate base.
Revenue from Contracts with Customers – Non-regulated Generation and Other Contract Revenue
The electricity generation from OPG’s non-regulated assets receives the Ontario electricity spot market price, except where an energy supply agreement (ESA) with the IESO or another contractual agreement is in place. The IESO is the counterparty to all ESAs and other contractual arrangements that are currently in effect. As at December 31, 2017, most of OPG’s operating non-regulated generating assets are subject to an ESA. As permitted by the practical expedient within Topic 606, revenue from the generating stations subject to an ESA is recognized in the amount that OPG has a right to invoice on a monthly basis to the IESO as the Company satisfies its performance obligation in accordance with the terms of the agreement to supply energy and capacity from the applicable facilities to Ontario’s wholesale energy market. No portion of OPG’s performance obligation remains unsatisfied at the end of any applicable reporting period. OPG estimates revenues for variable or conditional amounts under each ESA using a most likely amount approach on a contract-by-contract basis. Variable consideration under each ESA is included in revenue only to the extent that it is probable that the amount will not be subject to significant reversal when the underlying uncertainty is resolved. OPG’s receivables in connection with electricity generated from its non-regulated assets are part of the Company’s electricity related receivables from the IESO, representing OPG’s unconditional right to payment for satisfying its performance obligation wherein only the passage of time is required before payment is received. For further discussion, refer to Note 11.
OPG also sells into, and purchases from, interconnected markets of other provinces and the northeast and mid-west regions of the United States. Under these arrangements, OPG’s performance obligation is to either physically supply energy or provide capacity, depending on the contract, to a counterparty in a control area outside of Ontario. All contracts that are not designated as hedges are recorded on the consolidated balance sheets at market value, with gains or losses recorded in the consolidated statements of income. Gains and losses on energy trading contracts (including those to be physically settled) are recorded on a net basis in the consolidated statements of income.
OPG also derives non-energy revenue under the terms of a lease arrangement and associated, non-lease agreements with Bruce Power L.P. (Bruce Power) related to the Bruce nuclear generating stations. The associated agreements include revenue from heavy water sales, detritiation services and nuclear waste management services. Revenues under these associated agreements are recognized as services are provided or when products are delivered, therein satisfying OPG’s performance obligation.
10 ONTARIO POWER GENERATION
In addition, non-energy revenue includes isotope sales and other service revenues. Revenues from these activities are recognized as the respective performance obligations are satisfied, in accordance with the terms stipulated in the respective contracts.
Revenue Recognition – Leasing Revenue
The minimum lease payments stemming from OPG’s lease arrangement with Bruce Power related to the Bruce nuclear generating stations are recognized in revenue on a straight-line basis over the term of the lease. Similarly, revenue from real estate rentals is recognized over the term of the lease as the Company renders the requisite services outlined in the respective contracts.
Recognition and Measurement of Financial Assets and Financial Liabilities
In January 2016, the FASB issued ASU No. 2016-01, Financial Instruments – Overall: Recognition and Measurement
of Financial Assets and Financial Liabilities. Under the updated guidance, entities are required to measure equity investments at fair value and recognize any changes in fair value in net income. The update is effective for OPG’s 2018 fiscal year, including interim periods. As a result of this update, effective January 1, 2018, the available-for-sale (AFS) classification for securities is no longer available. Effective January 1, 2018, any unrealized gains and losses related to equity securities are recognized in net income instead of other comprehensive income.
As a result of the adoption of the new guidance, the unrealized cumulative after-tax loss of $9 million on AFS securities reported by OPG in Accumulated Other Comprehensive Income as at December 31, 2017 was reclassified to opening retained earnings as of January 1, 2018. There were no other impacts on OPG’s consolidated financial statements upon adoption of the new guidance, other than to replace the accounting policy for AFS securities with a new policy for holdings of equity securities as described below.
Equity Securities
Equity securities held by OPG are measured at fair value, with gains and losses due to changes in fair value recognized within other gains and losses in the consolidated statement of income. Related transaction costs are expensed as incurred, and dividend income is included in net income in the period in which dividends are declared. Equity securities are initially measured at the transaction price.
Restricted Cash Disclosures
In November 2016, the FASB issued ASU No. 2016-18, Statement of Cash Flows (Topic 230): Restricted Cash (a consensus of the FASB Emerging Issues Task Force), which clarifies how entities should present restricted cash and restricted cash equivalents in the statement of cash flows. The guidance is effective for OPG’s 2018 fiscal year, including interim periods, and is applied retrospectively. The changes in disclosures required under this update are reflected in the interim consolidated statements of cash flows and Note 3.
Improving the Presentation of Net Periodic Pension Cost and Net Periodic Postretirement Benefit Cost
In March 2017, the FASB issued ASU No. 2017-07, Compensation – Retirement Benefits (Topic 715): Improving the
Presentation of Net Periodic Pension Cost and Net Periodic Postretirement Benefit Cost. Under the new guidance, employers that sponsor defined benefit plans for pensions and/or other postretirement benefits are required to present the service cost component of net periodic benefit cost in the same statement of income line item as other employee compensation costs arising from services rendered during the period. The other components of the net periodic benefit cost are to be presented separately from the line item that includes the service cost and outside of any subtotal of income from operations, if such a subtotal is presented. In addition, the new guidance requires that only the service cost component of net benefit cost be eligible for capitalization.
Effective January 1, 2018, OPG adopted the new provisions of Topic 715. Adoption of these provisions did not impact OPG’s consolidated financial statements, as OPG capitalized only the service cost component of
ONTARIO POWER GENERATION 11
postretirement benefits costs prior to the adoption of the new guidance. Additionally, OPG previously included the service cost component of postretirement benefit costs with other compensation costs within Operating, maintenance and administration expenses in the consolidated statements of income, and did not show a subtotal of income from operations prior to the adoption of the new guidance. As such, the new guidance did not affect the presentation of OPG’s consolidated financial statements nor result in changes in OPG’s accounting policies.
Intra-entity Transfers of Assets Other than Inventory
In October 2016, the FASB issued ASU 2016-16, Income Taxes (Topic 740): Intra-Entity Transfers of Assets Other
than Inventory, to amend existing guidance with respect to accounting for the income tax effects of intra-entity asset transfers within the consolidated group. Effective January 1, 2018, entities are required to recognize the income tax effects of all intra-entity asset transfers, with the exception of inventory, as soon as the transfer occurs. Previously, entities were required to defer recognition of such income tax effects until the asset was sold to a third party.
The update is effective for OPG beginning January 1, 2018 and is required to be applied on a modified retrospective basis. On adoption of the update, the Company recorded an adjustment reducing opening retained earnings by $7 million to reflect the associated deferred income tax liability resulting from the cumulative effect of OPG’s transfer of assets, other than inventory, to the UMH Energy Limited Partnership (UMH) and the Lower Mattagami Energy Limited Partnership (LME) in prior years. Adoption of this update did not otherwise impact the Company’s consolidated financial statements, other than through an addition to OPG’s accounting policy for income taxes as described below.
Income Taxes – Intra-entity Transfers of Non-inventory Assets
The income tax impact of any intra-entity transfers of non-inventory assets is recognized upon the occurrence of the transfer.
Recent Accounting Pronouncements Not Yet Adopted
Lease Accounting
In February 2016, the FASB issued ASU No. 2016-02, Leases (Topic 842) to replace existing lease accounting guidance under Leases (Topic 840). The update includes comprehensive changes to existing guidance, particularly for lessees, and aims to increase transparency and comparability among organizations by requiring the recognition of lease assets and lease liabilities on the balance sheet. The standard is effective for annual periods beginning after December 15, 2018, including interim periods within that year.
Under the current guidance related to the new leasing standard, entities are required to use a modified retrospective approach for leases that exist, or are entered into, after the beginning of the earliest comparative period presented in the financial statements of the period of adoption. Under this method, Topic 842 would effectively be implemented by recognizing any adjustments stemming from the transition as of the beginning of the earliest comparative period presented in the entity’s financial statements. Full retrospective application is prohibited. In January 2018, the FASB issued a proposed ASU (ASU No. 2018-200) wherein entities would be able to utilize an additional optional transition method of recording the cumulative impact of adopting the new lease standard as an adjustment to opening balances in the initial period of adoption, with comparative periods continuing to be presented in accordance with Topic 840, including disclosures. The Company continues to monitor the status of this proposed ASU.
The FASB also issued ASU No. 2018-01, Land Easement Practical Expedient for Transition to Topic 842 in January 2018. The amendments therein allow an entity to choose not to evaluate under Topic 842 land easements that exist or have expired before the entity’s adoption of the new leasing standard and that were not previously accounted for as leases under Topic 840.
The Company has implemented a comprehensive project governance framework to oversee the transition to the new
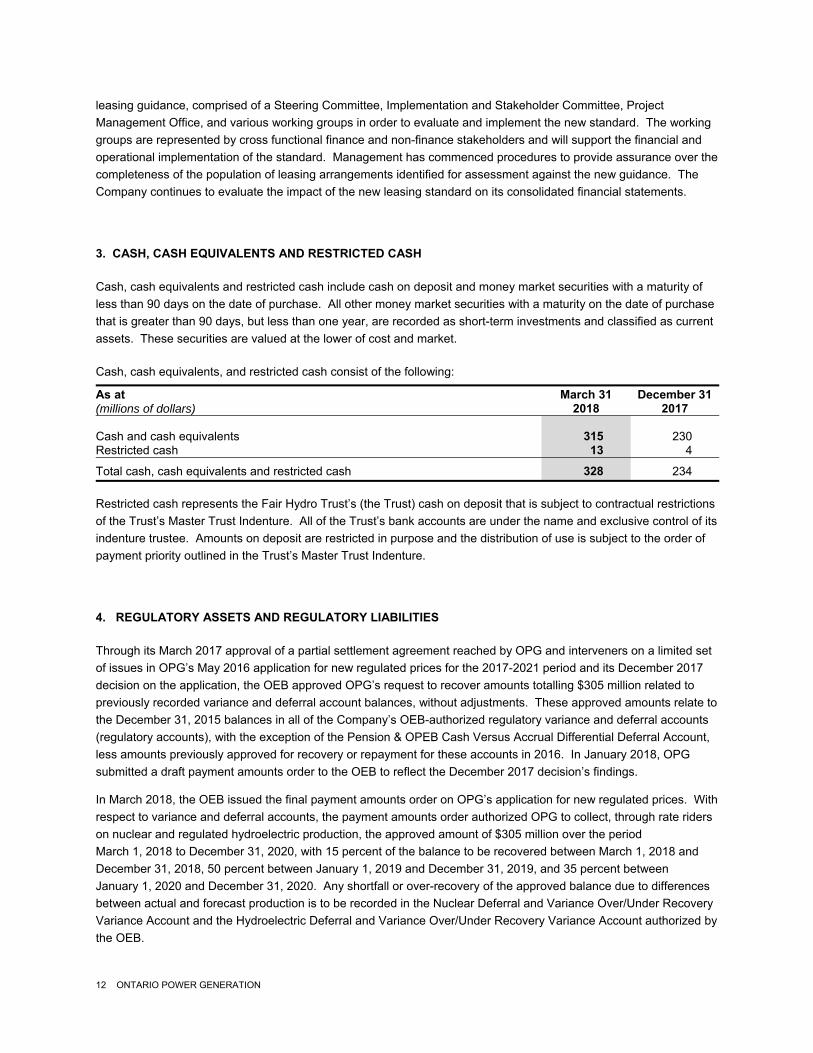
12 ONTARIO POWER GENERATION
leasing guidance, comprised of a Steering Committee, Implementation and Stakeholder Committee, Project Management Office, and various working groups in order to evaluate and implement the new standard. The working groups are represented by cross functional finance and non-finance stakeholders and will support the financial and operational implementation of the standard. Management has commenced procedures to provide assurance over the completeness of the population of leasing arrangements identified for assessment against the new guidance. The Company continues to evaluate the impact of the new leasing standard on its consolidated financial statements.
3. CASH, CASH EQUIVALENTS AND RESTRICTED CASH
Cash, cash equivalents and restricted cash include cash on deposit and money market securities with a maturity of less than 90 days on the date of purchase. All other money market securities with a maturity on the date of purchase that is greater than 90 days, but less than one year, are recorded as short-term investments and classified as current assets. These securities are valued at the lower of cost and market. Cash, cash equivalents, and restricted cash consist of the following:
As at March 31 December 31 (millions of dollars) 2018 2017 Cash and cash equivalents 315 230 Restricted cash 13 4
Total cash, cash equivalents and restricted cash 328 234 Restricted cash represents the Fair Hydro Trust’s (the Trust) cash on deposit that is subject to contractual restrictions of the Trust’s Master Trust Indenture. All of the Trust’s bank accounts are under the name and exclusive control of its indenture trustee. Amounts on deposit are restricted in purpose and the distribution of use is subject to the order of payment priority outlined in the Trust’s Master Trust Indenture.
4. REGULATORY ASSETS AND REGULATORY LIABILITIES
Through its March 2017 approval of a partial settlement agreement reached by OPG and interveners on a limited set of issues in OPG’s May 2016 application for new regulated prices for the 2017-2021 period and its December 2017 decision on the application, the OEB approved OPG’s request to recover amounts totalling $305 million related to previously recorded variance and deferral account balances, without adjustments. These approved amounts relate to the December 31, 2015 balances in all of the Company’s OEB-authorized regulatory variance and deferral accounts (regulatory accounts), with the exception of the Pension & OPEB Cash Versus Accrual Differential Deferral Account, less amounts previously approved for recovery or repayment for these accounts in 2016. In January 2018, OPG submitted a draft payment amounts order to the OEB to reflect the December 2017 decision’s findings.
In March 2018, the OEB issued the final payment amounts order on OPG’s application for new regulated prices. With respect to variance and deferral accounts, the payment amounts order authorized OPG to collect, through rate riders on nuclear and regulated hydroelectric production, the approved amount of $305 million over the period March 1, 2018 to December 31, 2020, with 15 percent of the balance to be recovered between March 1, 2018 and December 31, 2018, 50 percent between January 1, 2019 and December 31, 2019, and 35 percent between January 1, 2020 and December 31, 2020. Any shortfall or over-recovery of the approved balance due to differences between actual and forecast production is to be recorded in the Nuclear Deferral and Variance Over/Under Recovery Variance Account and the Hydroelectric Deferral and Variance Over/Under Recovery Variance Account authorized by the OEB.
ONTARIO POWER GENERATION 13
Amortization of regulatory assets and regulatory liabilities for variance and deferral account balances approved for disposition in the OEB’s March 2018 payment amounts order is recorded on a straight-line basis, effective March 1, 2018, based on the portion of the balances authorized to be collected during the applicable period.
The payment amount order set a rate smoothing approach and resulting nuclear base regulated prices effective June 1, 2017 such that no amounts are to be deferred in the Rate Smoothing Deferral Account for 2017 or 2018. Pursuant to the payment amounts order, approximately $500 million is to be deferred in the Rate Smoothing Deferral Account over the 2019-2021 period.
The approved rate smoothing approach and resulting nuclear base regulated prices represented an adjustment to the proposal in OPG’s draft payment amounts order, which was the basis for management’s best estimate of the increase in net revenue and corresponding increase in net regulatory assets recorded in the fourth quarter of 2017 related to the impact of the new regulated prices on the June 1, 2017 to December 31, 2017 period. To reflect the adjustment arising from the final payment amounts order, in the first quarter of 2018, OPG recorded a reduction of $67 million in the Interim Period Revenue Shortfall regulatory asset previously recognized as of December 31, 2017 and a reversal of the $63 million regulatory liability for the Rate Smoothing Deferral Account regulatory liability previously recognized as of December 31, 2017.
For the regulated hydroelectric facilities, the payment amounts order set base regulated prices for the June 1, 2017 to December 31, 2017 period and for the January 1, 2018 to December 31, 2018 period as calculated by OPG in the draft payment amounts order, based on the incentive regulation formula approved in the December 2017 decision and inflation indices published by the OEB. For the 2019-2021 period, the base regulated prices for the regulated hydroelectric facilities will be determined annually before the beginning of each year using the approved formula and published indices.
The payment amounts order authorized separate rate riders on nuclear and regulated hydroelectric production for the collection of the June 1, 2017 to February 28, 2018 interim period revenue shortfall over the period March 1, 2018 to December 31, 2020, with 15 percent of the balance to be recovered between March 1, 2018 and December 31, 2018, 50 percent between January 1, 2019 and December 31, 2019, and 35 percent between January 1, 2020 and December 31, 2020. The Interim Period Revenue Shortfall regulatory asset is reversed as these riders are collected.
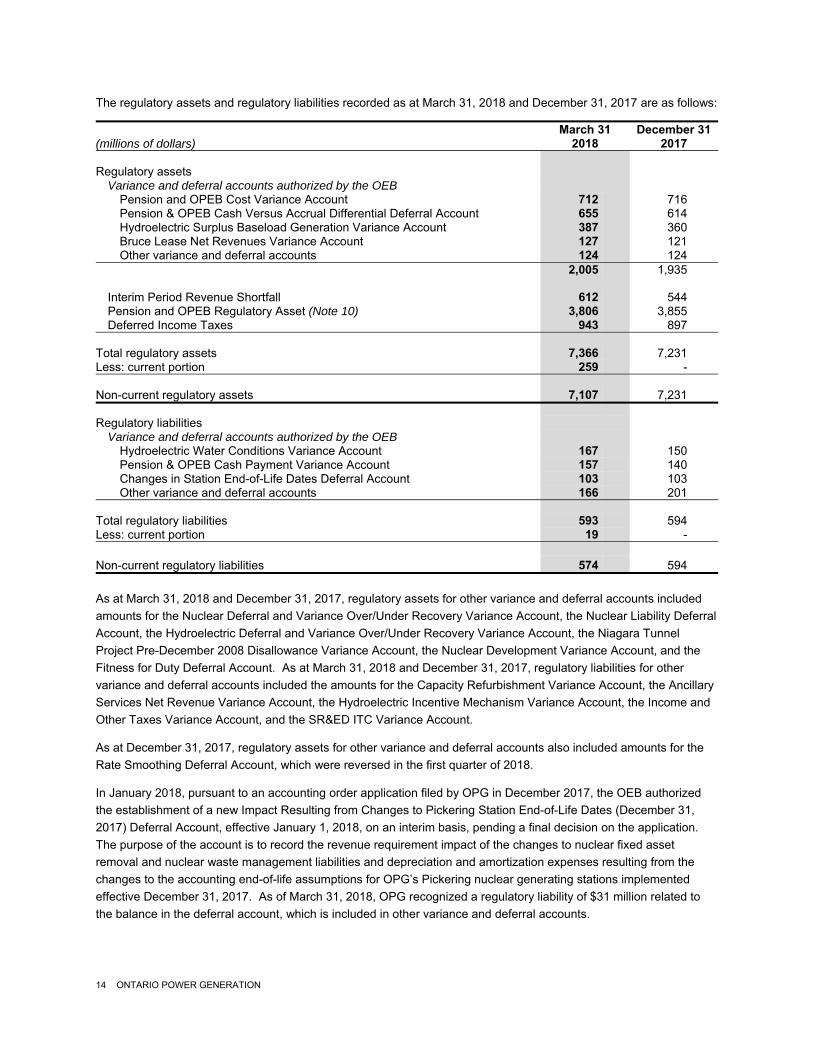
14 ONTARIO POWER GENERATION
The regulatory assets and regulatory liabilities recorded as at March 31, 2018 and December 31, 2017 are as follows:
March 31 December 31 (millions of dollars) 2018 2017 Regulatory assets Variance and deferral accounts authorized by the OEB Pension and OPEB Cost Variance Account 712 716 Pension & OPEB Cash Versus Accrual Differential Deferral Account 655 614 Hydroelectric Surplus Baseload Generation Variance Account 387 360 Bruce Lease Net Revenues Variance Account 127 121 Other variance and deferral accounts 124 124 2,005 1,935 Interim Period Revenue Shortfall 612 544 Pension and OPEB Regulatory Asset (Note 10) 3,806 3,855 Deferred Income Taxes 943 897 Total regulatory assets 7,366 7,231 Less: current portion 259 - Non-current regulatory assets 7,107 7,231 Regulatory liabilities Variance and deferral accounts authorized by the OEB Hydroelectric Water Conditions Variance Account 167 150 Pension & OPEB Cash Payment Variance Account 157 140 Changes in Station End-of-Life Dates Deferral Account 103 103 Other variance and deferral accounts 166 201 Total regulatory liabilities 593 594 Less: current portion 19 - Non-current regulatory liabilities 574 594 As at March 31, 2018 and December 31, 2017, regulatory assets for other variance and deferral accounts included amounts for the Nuclear Deferral and Variance Over/Under Recovery Variance Account, the Nuclear Liability Deferral Account, the Hydroelectric Deferral and Variance Over/Under Recovery Variance Account, the Niagara Tunnel Project Pre-December 2008 Disallowance Variance Account, the Nuclear Development Variance Account, and the Fitness for Duty Deferral Account. As at March 31, 2018 and December 31, 2017, regulatory liabilities for other variance and deferral accounts included the amounts for the Capacity Refurbishment Variance Account, the Ancillary Services Net Revenue Variance Account, the Hydroelectric Incentive Mechanism Variance Account, the Income and Other Taxes Variance Account, and the SR&ED ITC Variance Account.
As at December 31, 2017, regulatory assets for other variance and deferral accounts also included amounts for the Rate Smoothing Deferral Account, which were reversed in the first quarter of 2018.
In January 2018, pursuant to an accounting order application filed by OPG in December 2017, the OEB authorized the establishment of a new Impact Resulting from Changes to Pickering Station End-of-Life Dates (December 31, 2017) Deferral Account, effective January 1, 2018, on an interim basis, pending a final decision on the application. The purpose of the account is to record the revenue requirement impact of the changes to nuclear fixed asset removal and nuclear waste management liabilities and depreciation and amortization expenses resulting from the changes to the accounting end-of-life assumptions for OPG’s Pickering nuclear generating stations implemented effective December 31, 2017. As of March 31, 2018, OPG recognized a regulatory liability of $31 million related to the balance in the deferral account, which is included in other variance and deferral accounts.
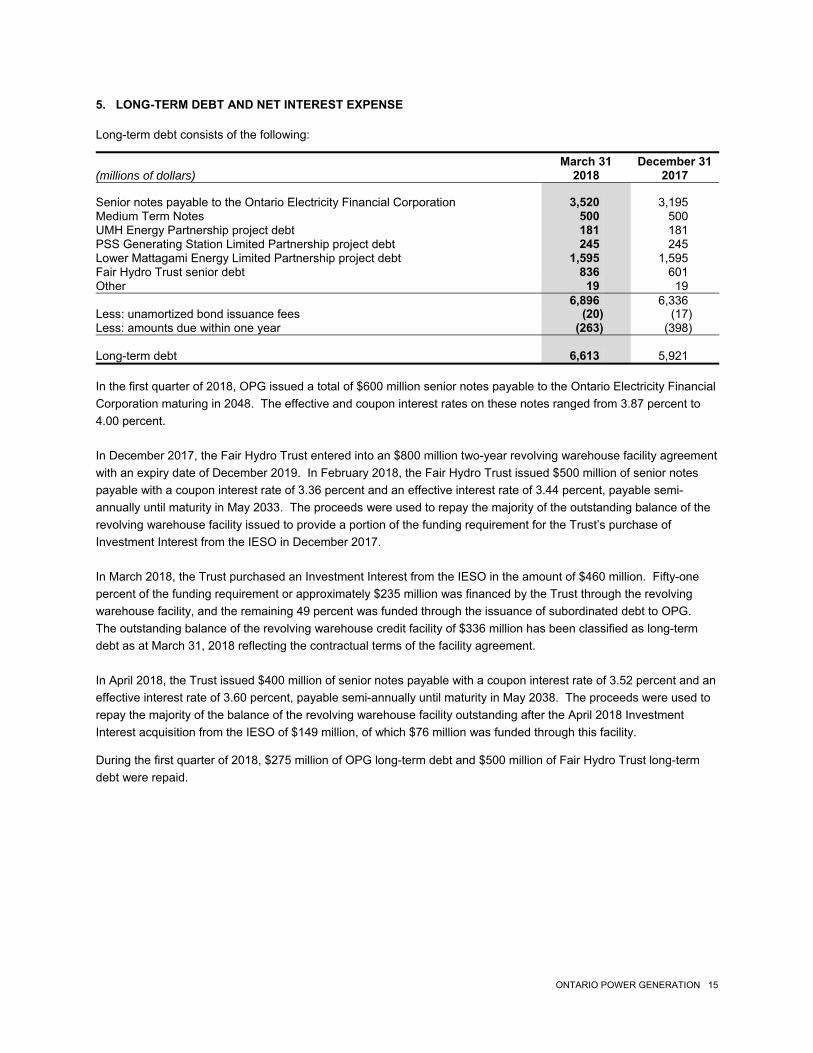
ONTARIO POWER GENERATION 15
5. LONG-TERM DEBT AND NET INTEREST EXPENSE Long-term debt consists of the following:
March 31 December 31 (millions of dollars) 2018 2017 Senior notes payable to the Ontario Electricity Financial Corporation 3,520 3,195 Medium Term Notes 500 500 UMH Energy Partnership project debt 181 181 PSS Generating Station Limited Partnership project debt 245 245 Lower Mattagami Energy Limited Partnership project debt 1,595 1,595 Fair Hydro Trust senior debt 836 601 Other 19 19 6,896 6,336 Less: unamortized bond issuance fees (20) (17) Less: amounts due within one year (263) (398) Long-term debt 6,613 5,921 In the first quarter of 2018, OPG issued a total of $600 million senior notes payable to the Ontario Electricity Financial Corporation maturing in 2048. The effective and coupon interest rates on these notes ranged from 3.87 percent to 4.00 percent. In December 2017, the Fair Hydro Trust entered into an $800 million two-year revolving warehouse facility agreement with an expiry date of December 2019. In February 2018, the Fair Hydro Trust issued $500 million of senior notes payable with a coupon interest rate of 3.36 percent and an effective interest rate of 3.44 percent, payable semi-annually until maturity in May 2033. The proceeds were used to repay the majority of the outstanding balance of the revolving warehouse facility issued to provide a portion of the funding requirement for the Trust’s purchase of Investment Interest from the IESO in December 2017. In March 2018, the Trust purchased an Investment Interest from the IESO in the amount of $460 million. Fifty-one percent of the funding requirement or approximately $235 million was financed by the Trust through the revolving warehouse facility, and the remaining 49 percent was funded through the issuance of subordinated debt to OPG. The outstanding balance of the revolving warehouse credit facility of $336 million has been classified as long-term debt as at March 31, 2018 reflecting the contractual terms of the facility agreement. In April 2018, the Trust issued $400 million of senior notes payable with a coupon interest rate of 3.52 percent and an effective interest rate of 3.60 percent, payable semi-annually until maturity in May 2038. The proceeds were used to repay the majority of the balance of the revolving warehouse facility outstanding after the April 2018 Investment Interest acquisition from the IESO of $149 million, of which $76 million was funded through this facility.
During the first quarter of 2018, $275 million of OPG long-term debt and $500 million of Fair Hydro Trust long-term debt were repaid.
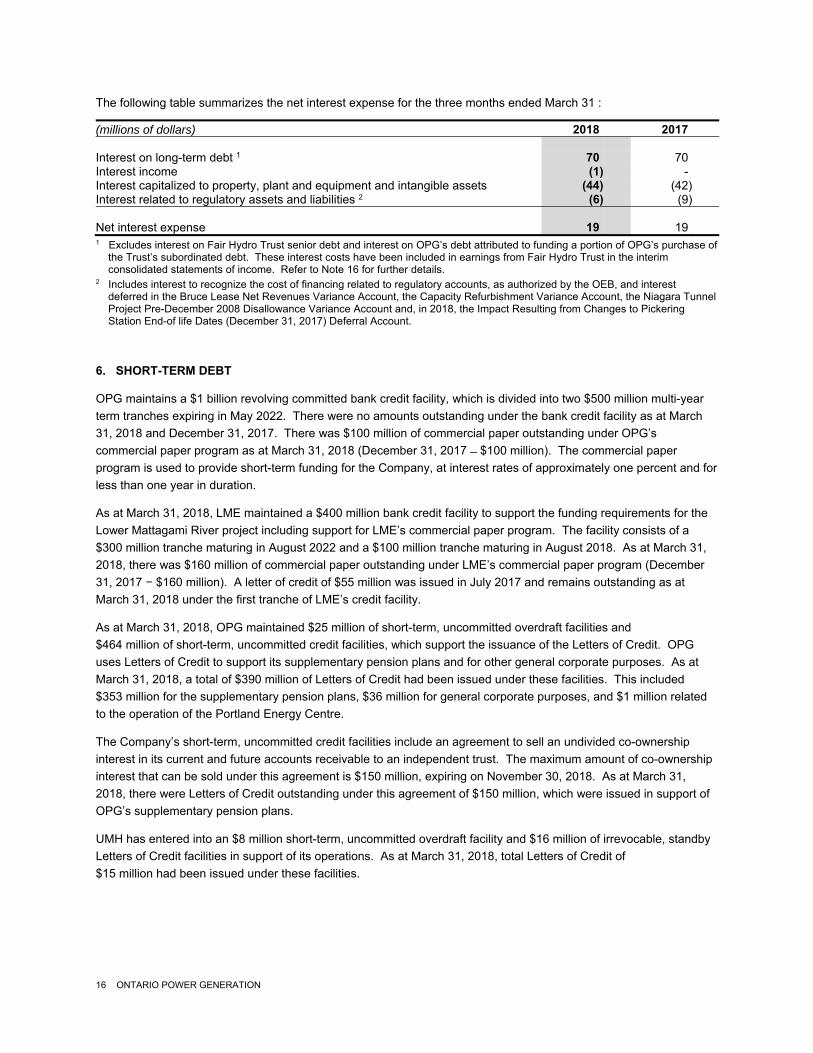
16 ONTARIO POWER GENERATION
The following table summarizes the net interest expense for the three months ended March 31 :
(millions of dollars) 2018 2017 Interest on long-term debt 1 70 70 Interest income (1) - Interest capitalized to property, plant and equipment and intangible assets (44) (42) Interest related to regulatory assets and liabilities 2 (6) (9) Net interest expense 19 19 1 Excludes interest on Fair Hydro Trust senior debt and interest on OPG’s debt attributed to funding a portion of OPG’s purchase of
the Trust’s subordinated debt. These interest costs have been included in earnings from Fair Hydro Trust in the interim consolidated statements of income. Refer to Note 16 for further details.
2 Includes interest to recognize the cost of financing related to regulatory accounts, as authorized by the OEB, and interest deferred in the Bruce Lease Net Revenues Variance Account, the Capacity Refurbishment Variance Account, the Niagara Tunnel Project Pre-December 2008 Disallowance Variance Account and, in 2018, the Impact Resulting from Changes to Pickering Station End-of life Dates (December 31, 2017) Deferral Account.
6. SHORT-TERM DEBT
OPG maintains a $1 billion revolving committed bank credit facility, which is divided into two $500 million multi-year term tranches expiring in May 2022. There were no amounts outstanding under the bank credit facility as at March 31, 2018 and December 31, 2017. There was $100 million of commercial paper outstanding under OPG’s commercial paper program as at March 31, 2018 (December 31, 2017 ̶ $100 million). The commercial paper program is used to provide short-term funding for the Company, at interest rates of approximately one percent and for less than one year in duration.
As at March 31, 2018, LME maintained a $400 million bank credit facility to support the funding requirements for the Lower Mattagami River project including support for LME’s commercial paper program. The facility consists of a $300 million tranche maturing in August 2022 and a $100 million tranche maturing in August 2018. As at March 31, 2018, there was $160 million of commercial paper outstanding under LME’s commercial paper program (December 31, 2017 − $160 million). A letter of credit of $55 million was issued in July 2017 and remains outstanding as at March 31, 2018 under the first tranche of LME’s credit facility.
As at March 31, 2018, OPG maintained $25 million of short-term, uncommitted overdraft facilities and $464 million of short-term, uncommitted credit facilities, which support the issuance of the Letters of Credit. OPG uses Letters of Credit to support its supplementary pension plans and for other general corporate purposes. As at March 31, 2018, a total of $390 million of Letters of Credit had been issued under these facilities. This included $353 million for the supplementary pension plans, $36 million for general corporate purposes, and $1 million related to the operation of the Portland Energy Centre.
The Company’s short-term, uncommitted credit facilities include an agreement to sell an undivided co-ownership interest in its current and future accounts receivable to an independent trust. The maximum amount of co-ownership interest that can be sold under this agreement is $150 million, expiring on November 30, 2018. As at March 31, 2018, there were Letters of Credit outstanding under this agreement of $150 million, which were issued in support of OPG’s supplementary pension plans.
UMH has entered into an $8 million short-term, uncommitted overdraft facility and $16 million of irrevocable, standby Letters of Credit facilities in support of its operations. As at March 31, 2018, total Letters of Credit of $15 million had been issued under these facilities.
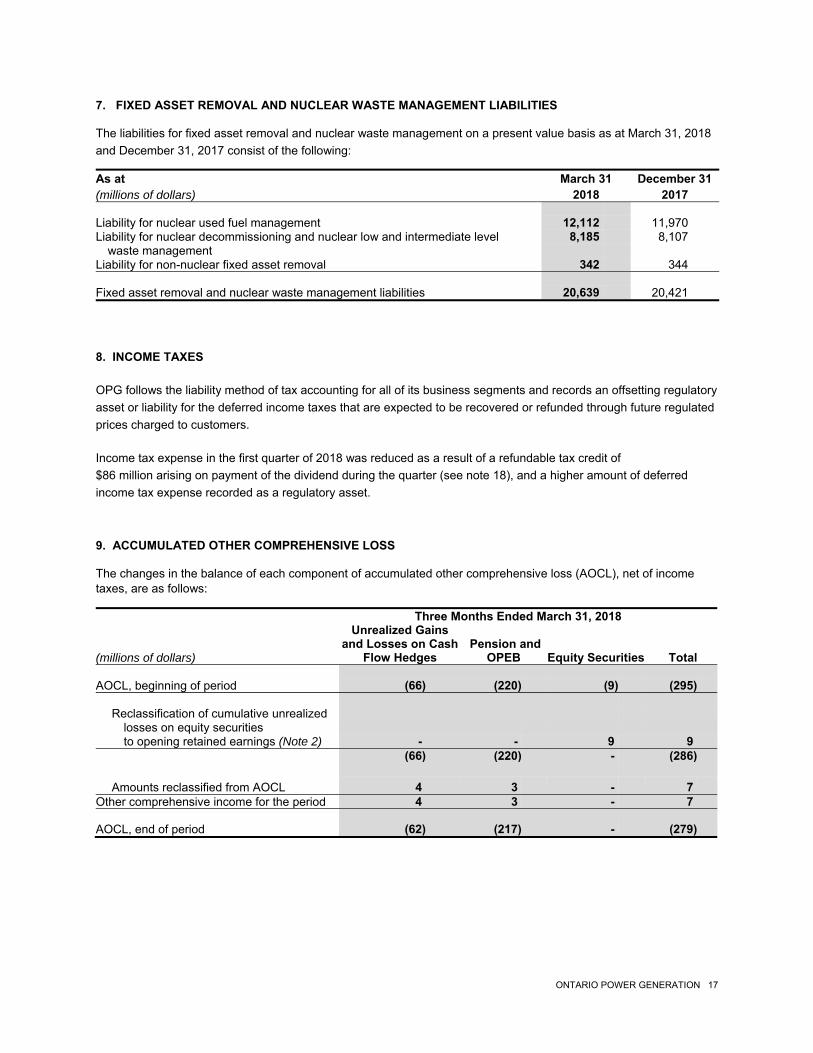
ONTARIO POWER GENERATION 17
7. FIXED ASSET REMOVAL AND NUCLEAR WASTE MANAGEMENT LIABILITIES
The liabilities for fixed asset removal and nuclear waste management on a present value basis as at March 31, 2018 and December 31, 2017 consist of the following:
As at March 31 December 31 (millions of dollars) 2018 2017 Liability for nuclear used fuel management 12,112 11,970 Liability for nuclear decommissioning and nuclear low and intermediate level 8,185 8,107 waste management Liability for non-nuclear fixed asset removal 342 344 Fixed asset removal and nuclear waste management liabilities 20,639 20,421
8. INCOME TAXES
OPG follows the liability method of tax accounting for all of its business segments and records an offsetting regulatory asset or liability for the deferred income taxes that are expected to be recovered or refunded through future regulated prices charged to customers.
Income tax expense in the first quarter of 2018 was reduced as a result of a refundable tax credit of $86 million arising on payment of the dividend during the quarter (see note 18), and a higher amount of deferred income tax expense recorded as a regulatory asset.
9. ACCUMULATED OTHER COMPREHENSIVE LOSS The changes in the balance of each component of accumulated other comprehensive loss (AOCL), net of income taxes, are as follows: Three Months Ended March 31, 2018
(millions of dollars)
Unrealized Gains and Losses on Cash
Flow Hedges Pension and
OPEB Equity Securities Total AOCL, beginning of period (66) (220) (9) (295) Reclassification of cumulative unrealized losses on equity securities to opening retained earnings (Note 2) - - 9 9 (66) (220) - (286) Amounts reclassified from AOCL 4 3 - 7 Other comprehensive income for the period 4 3 - 7 AOCL, end of period (62) (217) - (279)
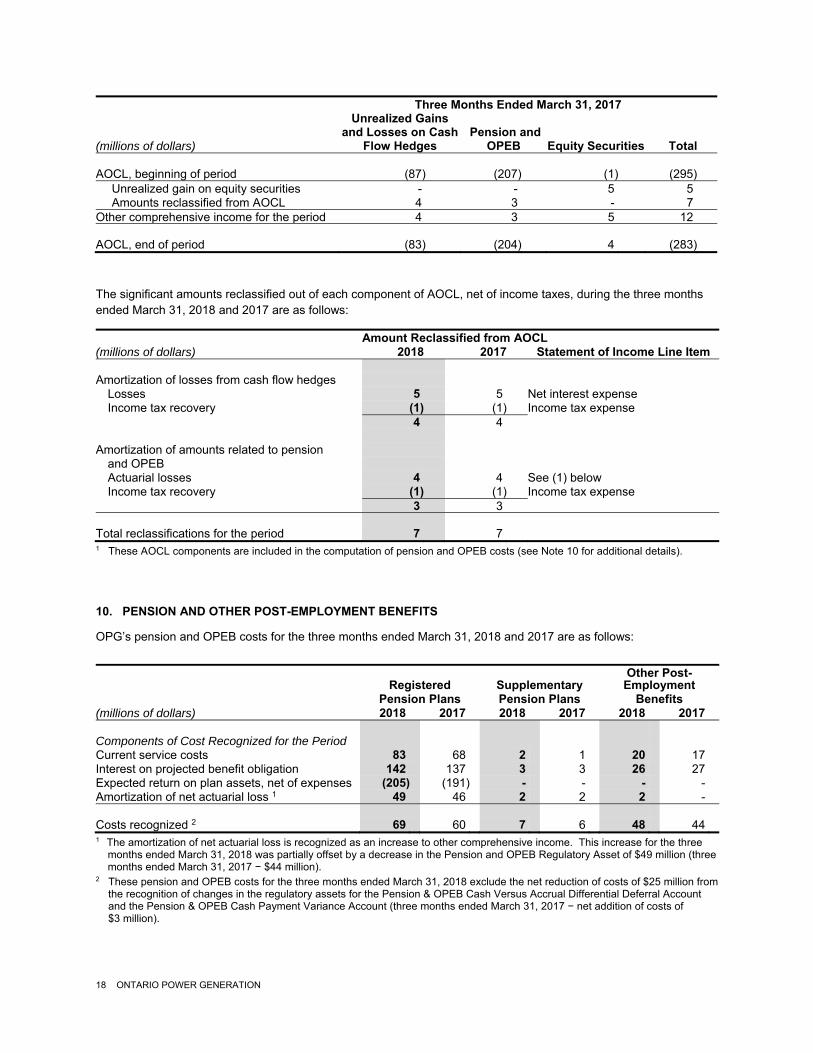
18 ONTARIO POWER GENERATION
Three Months Ended March 31, 2017
(millions of dollars)
Unrealized Gains and Losses on Cash
Flow Hedges Pension and
OPEB Equity Securities Total AOCL, beginning of period (87) (207) (1) (295) Unrealized gain on equity securities - - 5 5 Amounts reclassified from AOCL 4 3 - 7 Other comprehensive income for the period 4 3 5 12 AOCL, end of period (83) (204) 4 (283)
The significant amounts reclassified out of each component of AOCL, net of income taxes, during the three months ended March 31, 2018 and 2017 are as follows:
Amount Reclassified from AOCL (millions of dollars) 2018 2017 Statement of Income Line Item Amortization of losses from cash flow hedges Losses 5 5 Net interest expense Income tax recovery (1) (1) Income tax expense 4 4 Amortization of amounts related to pension and OPEB Actuarial losses 4 4 See (1) below Income tax recovery (1) (1) Income tax expense 3 3 Total reclassifications for the period 7 7 1 These AOCL components are included in the computation of pension and OPEB costs (see Note 10 for additional details).
10. PENSION AND OTHER POST-EMPLOYMENT BENEFITS
OPG’s pension and OPEB costs for the three months ended March 31, 2018 and 2017 are as follows:
Other Post- Registered Supplementary Employment Pension Plans Pension Plans Benefits (millions of dollars) 2018 2017 2018 2017 2018 2017 Components of Cost Recognized for the Period Current service costs 83 68 2 1 20 17 Interest on projected benefit obligation 142 137 3 3 26 27 Expected return on plan assets, net of expenses (205) (191) - - - - Amortization of net actuarial loss 1 49 46 2 2 2 - Costs recognized 2 69 60 7 6 48 44 1 The amortization of net actuarial loss is recognized as an increase to other comprehensive income. This increase for the three
months ended March 31, 2018 was partially offset by a decrease in the Pension and OPEB Regulatory Asset of $49 million (three months ended March 31, 2017 − $44 million).
2 These pension and OPEB costs for the three months ended March 31, 2018 exclude the net reduction of costs of $25 million from the recognition of changes in the regulatory assets for the Pension & OPEB Cash Versus Accrual Differential Deferral Account and the Pension & OPEB Cash Payment Variance Account (three months ended March 31, 2017 − net addition of costs of $3 million).
ONTARIO POWER GENERATION 19
11. RISK MANAGEMENT AND DERIVATIVES
OPG is exposed to risks related to changes in market interest rates on debt expected to be issued in the future and movements in foreign currency that affect the Company’s assets, liabilities, and forecasted transactions. Select derivative instruments are used to manage such risks. Derivatives are used as hedging instruments, as well as for trading purposes.
Interest rate risk is the risk that the value of assets and liabilities can change due to movements in related interest rates. Interest rate risk for OPG arises with the need to refinance existing debt and/or undertake new financing. The management of these risks includes using derivatives to hedge the exposure in accordance with corporate risk management policies. OPG periodically uses interest rate swap agreements to mitigate elements of interest rate risk exposure associated with anticipated financing.
OPG’s financial results are exposed to volatility in the Canadian/US foreign exchange rate as fuels and certain supplies and services purchased for generating stations and major development projects are denominated in, or tied to, US dollars. OPG enters into foreign exchange derivatives and agreements with major financial institutions, when appropriate, in order to manage the Company’s exposure to foreign currency movements.
The majority of OPG’s revenues are derived from sales through the IESO administered spot market. Market participants in the IESO spot market provide collateral in accordance with the IESO prudential support requirements to cover funds that they might owe to the market. Although the credit exposure to the IESO represents a significant portion of OPG’s accounts receivable, the Company’s management accepts this risk due to the IESO’s primary role in the Ontario electricity market. OPG’s electricity related accounts receivable from the IESO constituted of $436 million as at March 31, 2018 (December 31, 2017 − $354 million). The remaining receivables exposure is to a diverse group of generally high quality counterparties. OPG’s allowance for doubtful accounts as at March 31, 2018 was less than $1 million.
The fair value of the outstanding derivatives totalled a net liability of $14 million as at March 31, 2018 (December 31, 2017 − $20 million). Existing pre-tax net losses of $19 million deferred in AOCL as at March 31, 2018 are expected to be reclassified to net income within the next 12 months.
12. FAIR VALUE MEASUREMENTS
The fair value of financial instruments traded in active markets is based on quoted market prices as at the interim consolidated balance sheet dates. A market is regarded as active if quoted prices are readily and regularly available from an exchange, dealer, broker, industry group, pricing service, or regulatory agency, and those prices represent actual and regularly occurring market transactions on an arm’s length basis. The quoted market price used for financial assets held by OPG is the current bid price. These instruments are included in Level 1 and are comprised primarily of equity investments and fund investments. The fair value hierarchy groups financial instruments into three levels, based on the significance of inputs used in measuring the fair value of the assets and liabilities.
For financial instruments for which quoted market prices are not directly available, fair values are estimated using forward price curves developed from observable market prices or rates. The estimation of fair value may include the use of valuation techniques or models, based wherever possible on assumptions supported by observable market prices or rates prevailing as at the interim consolidated balance sheet dates. This is the case for over-the-counter derivatives and securities, which include energy commodity derivatives, foreign exchange derivatives, interest rate swap derivatives, and fund investments. Valuation models use general assumptions and market data and therefore do not reflect the specific risks and other factors that would affect a particular instrument’s fair value. The

20 ONTARIO POWER GENERATION
methodologies used for calculating the fair value adjustments are reviewed on an ongoing basis to ensure that they remain appropriate. If all significant inputs required to fair value an instrument are observable, the instrument is included in Level 2.
If one or more of the significant inputs is not based on observable market data, the instrument is included in Level 3. Specific valuation techniques are used to value these instruments. Significant Level 3 inputs include: recent comparable transactions, comparable benchmark information, bid/ask spread of similar transactions, and other relevant factors. The process of valuing investments for which no published market price exists is based on inherent uncertainties and the resulting values may differ from values that would have been used had a ready market existed for these investments. The values may also differ from the prices at which the investments may be sold.
Transfers into, out of, or between fair value hierarchy levels are deemed to occur on the date of the event or change in circumstances that causes the transfer to occur.
The fair value of the investments within the Nuclear Segregated Funds’ real assets portfolio is determined using appropriate valuation techniques, such as recent arm’s length market transactions, references to current fair values of other investments that are substantially the same, discounted cash flow analyses, third-party independent appraisals, valuation multiples, or other valuation methods. Any control, size, liquidity or other discount premiums on the investments are considered in the determination of fair value. Pooled funds are valued at the unit values supplied by the pooled fund administrators. The unit values represent the underlying net assets at fair values, determined using closing market prices.
Certain investments within the Nuclear Segregated Funds’ real assets portfolio are measured at fair value by their investment managers using net asset value (NAV). Investments measured at NAV as a practical expedient for determining their fair value are excluded from the fair value hierarchy.
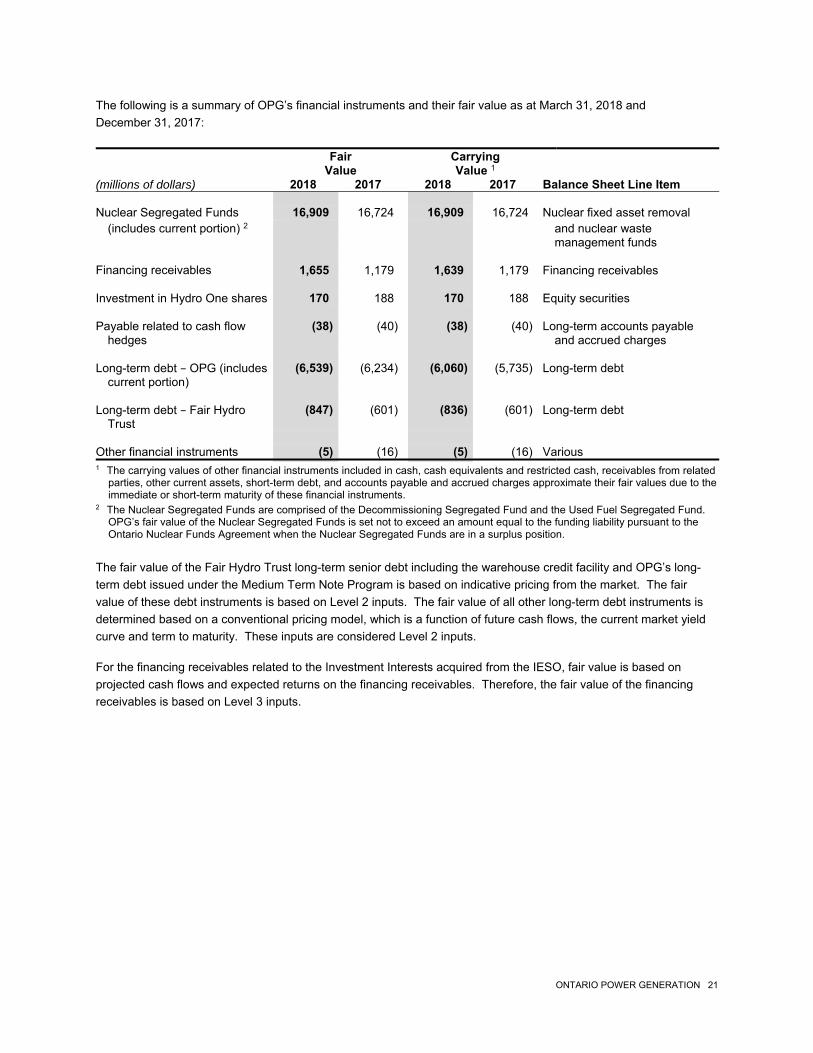
ONTARIO POWER GENERATION 21
The following is a summary of OPG’s financial instruments and their fair value as at March 31, 2018 and December 31, 2017: Fair Carrying Value Value 1 (millions of dollars) 2018 2017 2018 2017 Balance Sheet Line Item Nuclear Segregated Funds 16,909 16,724 16,909 16,724 Nuclear fixed asset removal (includes current portion) 2 and nuclear waste management funds Financing receivables 1,655 1,179 1,639 1,179 Financing receivables Investment in Hydro One shares 170 188 170 188 Equity securities Payable related to cash flow (38) (40) (38) (40) Long-term accounts payable hedges and accrued charges Long-term debt − OPG (includes (6,539) (6,234) (6,060) (5,735) Long-term debt current portion) Long-term debt − Fair Hydro (847) (601) (836) (601) Long-term debt Trust Other financial instruments (5) (16) (5) (16) Various 1 The carrying values of other financial instruments included in cash, cash equivalents and restricted cash, receivables from related
parties, other current assets, short-term debt, and accounts payable and accrued charges approximate their fair values due to the immediate or short-term maturity of these financial instruments.
2 The Nuclear Segregated Funds are comprised of the Decommissioning Segregated Fund and the Used Fuel Segregated Fund. OPG’s fair value of the Nuclear Segregated Funds is set not to exceed an amount equal to the funding liability pursuant to the Ontario Nuclear Funds Agreement when the Nuclear Segregated Funds are in a surplus position.
The fair value of the Fair Hydro Trust long-term senior debt including the warehouse credit facility and OPG’s long-term debt issued under the Medium Term Note Program is based on indicative pricing from the market. The fair value of these debt instruments is based on Level 2 inputs. The fair value of all other long-term debt instruments is determined based on a conventional pricing model, which is a function of future cash flows, the current market yield curve and term to maturity. These inputs are considered Level 2 inputs.
For the financing receivables related to the Investment Interests acquired from the IESO, fair value is based on projected cash flows and expected returns on the financing receivables. Therefore, the fair value of the financing receivables is based on Level 3 inputs.
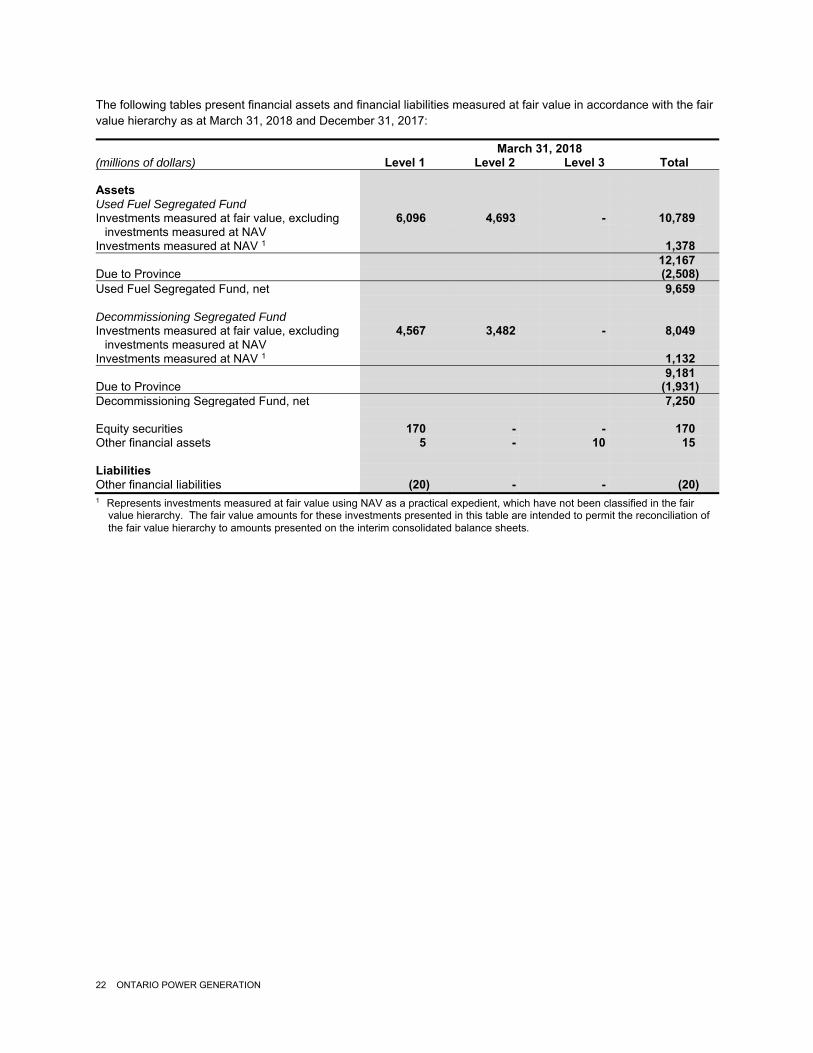
22 ONTARIO POWER GENERATION
The following tables present financial assets and financial liabilities measured at fair value in accordance with the fair value hierarchy as at March 31, 2018 and December 31, 2017:
March 31, 2018 (millions of dollars) Level 1 Level 2 Level 3 Total Assets Used Fuel Segregated Fund Investments measured at fair value, excluding 6,096 4,693 - 10,789
investments measured at NAV Investments measured at NAV 1 1,378 12,167 Due to Province (2,508) Used Fuel Segregated Fund, net 9,659 Decommissioning Segregated Fund Investments measured at fair value, excluding 4,567 3,482 - 8,049
investments measured at NAV Investments measured at NAV 1 1,132 9,181 Due to Province (1,931) Decommissioning Segregated Fund, net 7,250 Equity securities 170 - - 170 Other financial assets 5 - 10 15 Liabilities Other financial liabilities (20) - - (20) 1 Represents investments measured at fair value using NAV as a practical expedient, which have not been classified in the fair
value hierarchy. The fair value amounts for these investments presented in this table are intended to permit the reconciliation of the fair value hierarchy to amounts presented on the interim consolidated balance sheets.
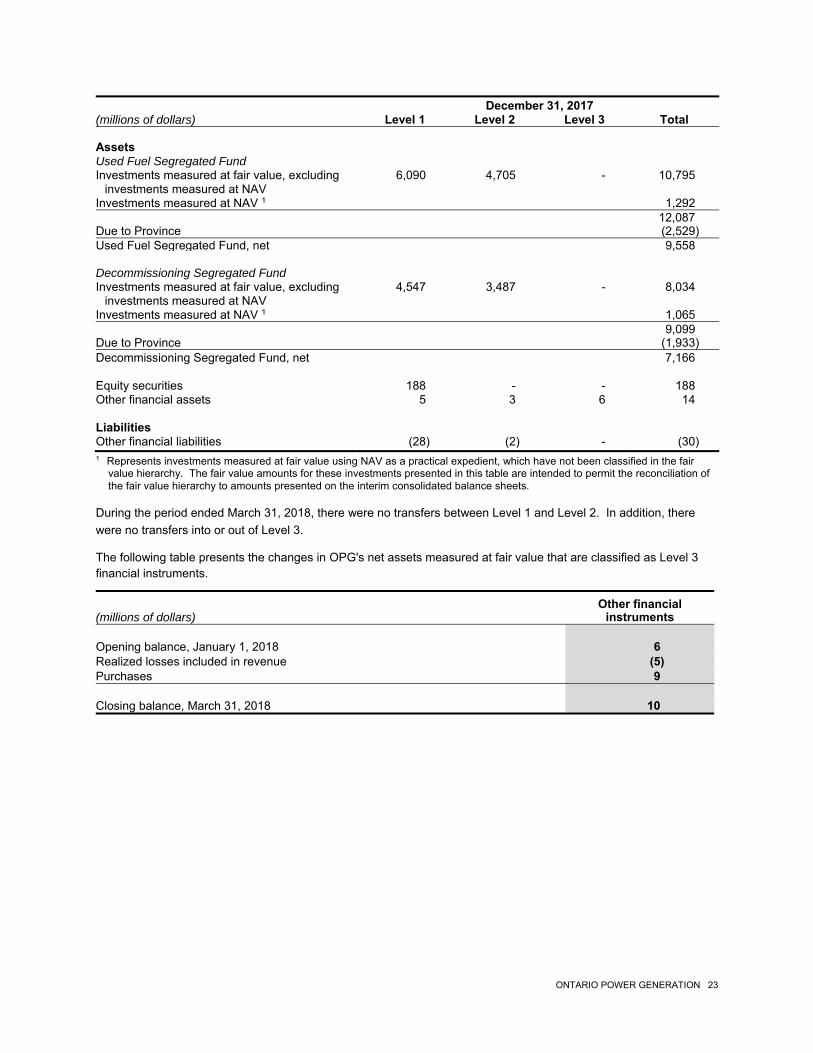
ONTARIO POWER GENERATION 23
December 31, 2017 (millions of dollars) Level 1 Level 2 Level 3 Total Assets Used Fuel Segregated Fund Investments measured at fair value, excluding 6,090 4,705 - 10,795
investments measured at NAV Investments measured at NAV 1 1,292 12,087 Due to Province (2,529) Used Fuel Segregated Fund, net 9,558 Decommissioning Segregated Fund Investments measured at fair value, excluding 4,547 3,487 - 8,034
investments measured at NAV Investments measured at NAV 1 1,065 9,099 Due to Province (1,933) Decommissioning Segregated Fund, net 7,166 Equity securities 188 - - 188 Other financial assets 5 3 6 14 Liabilities Other financial liabilities (28) (2) - (30) 1 Represents investments measured at fair value using NAV as a practical expedient, which have not been classified in the fair
value hierarchy. The fair value amounts for these investments presented in this table are intended to permit the reconciliation of the fair value hierarchy to amounts presented on the interim consolidated balance sheets.
During the period ended March 31, 2018, there were no transfers between Level 1 and Level 2. In addition, there were no transfers into or out of Level 3.
The following table presents the changes in OPG's net assets measured at fair value that are classified as Level 3 financial instruments.
Other financial (millions of dollars) instruments Opening balance, January 1, 2018 6 Realized losses included in revenue (5) Purchases 9 Closing balance, March 31, 2018 10
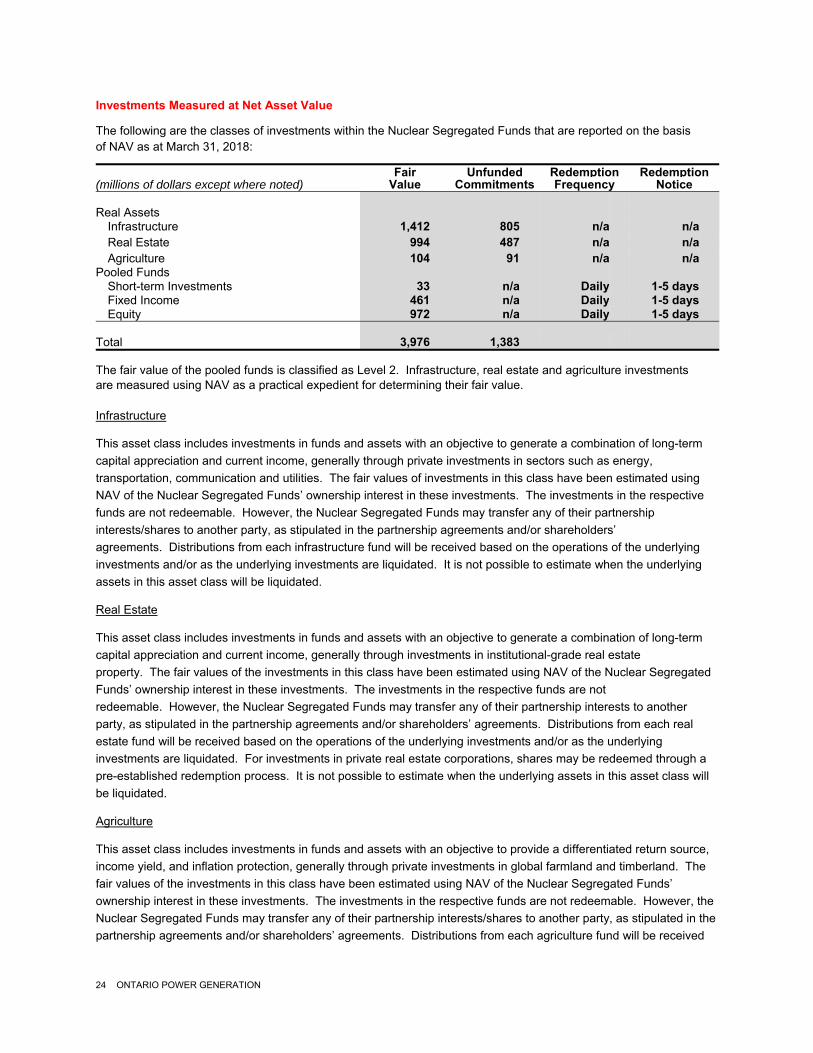
24 ONTARIO POWER GENERATION
Investments Measured at Net Asset Value
The following are the classes of investments within the Nuclear Segregated Funds that are reported on the basis of NAV as at March 31, 2018:
Fair Unfunded Redemption Redemption (millions of dollars except where noted) Value Commitments Frequency Notice Real Assets Infrastructure 1,412 805 n/a n/a Real Estate 994 487 n/a n/a Agriculture 104 91 n/a n/a Pooled Funds Short-term Investments 33 n/a Daily 1-5 days Fixed Income 461 n/a Daily 1-5 days Equity 972 n/a Daily 1-5 days Total 3,976 1,383 The fair value of the pooled funds is classified as Level 2. Infrastructure, real estate and agriculture investments are measured using NAV as a practical expedient for determining their fair value. Infrastructure
This asset class includes investments in funds and assets with an objective to generate a combination of long-term capital appreciation and current income, generally through private investments in sectors such as energy, transportation, communication and utilities. The fair values of investments in this class have been estimated using NAV of the Nuclear Segregated Funds’ ownership interest in these investments. The investments in the respective funds are not redeemable. However, the Nuclear Segregated Funds may transfer any of their partnership interests/shares to another party, as stipulated in the partnership agreements and/or shareholders’ agreements. Distributions from each infrastructure fund will be received based on the operations of the underlying investments and/or as the underlying investments are liquidated. It is not possible to estimate when the underlying assets in this asset class will be liquidated.
Real Estate
This asset class includes investments in funds and assets with an objective to generate a combination of long-term capital appreciation and current income, generally through investments in institutional-grade real estate property. The fair values of the investments in this class have been estimated using NAV of the Nuclear Segregated Funds’ ownership interest in these investments. The investments in the respective funds are not redeemable. However, the Nuclear Segregated Funds may transfer any of their partnership interests to another party, as stipulated in the partnership agreements and/or shareholders’ agreements. Distributions from each real estate fund will be received based on the operations of the underlying investments and/or as the underlying investments are liquidated. For investments in private real estate corporations, shares may be redeemed through a pre-established redemption process. It is not possible to estimate when the underlying assets in this asset class will be liquidated.
Agriculture
This asset class includes investments in funds and assets with an objective to provide a differentiated return source, income yield, and inflation protection, generally through private investments in global farmland and timberland. The fair values of the investments in this class have been estimated using NAV of the Nuclear Segregated Funds’ ownership interest in these investments. The investments in the respective funds are not redeemable. However, the Nuclear Segregated Funds may transfer any of their partnership interests/shares to another party, as stipulated in the partnership agreements and/or shareholders’ agreements. Distributions from each agriculture fund will be received
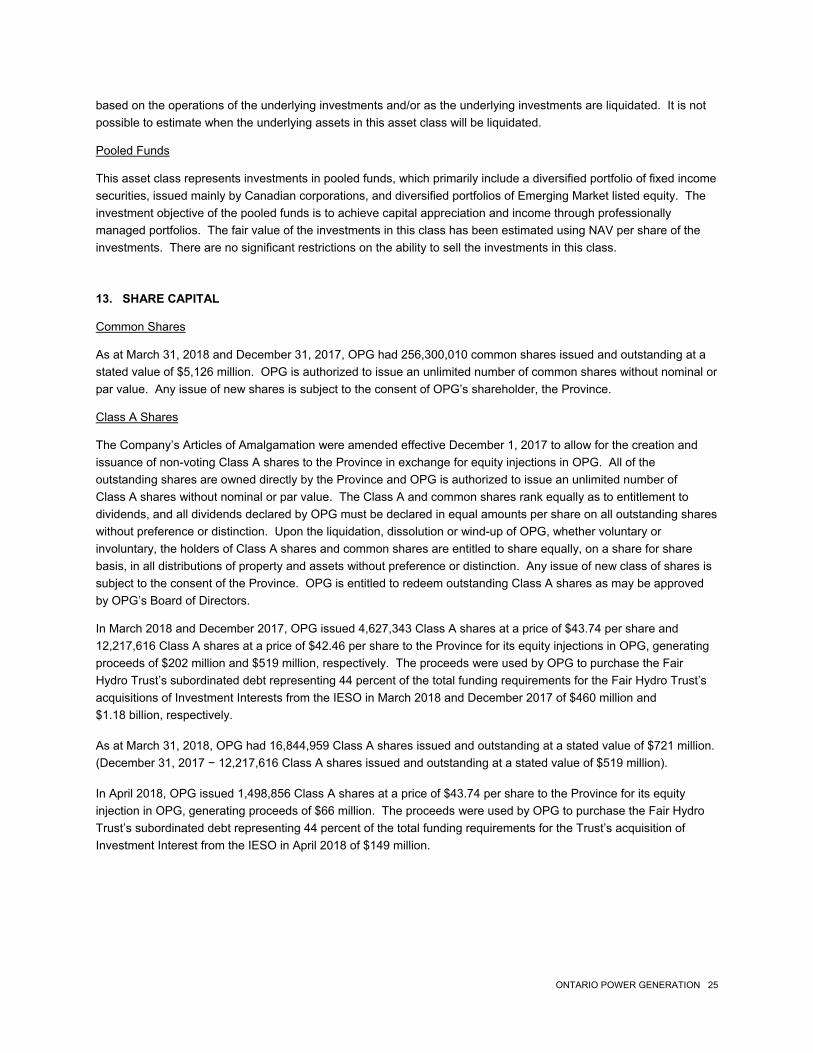
ONTARIO POWER GENERATION 25
based on the operations of the underlying investments and/or as the underlying investments are liquidated. It is not possible to estimate when the underlying assets in this asset class will be liquidated.
Pooled Funds
This asset class represents investments in pooled funds, which primarily include a diversified portfolio of fixed income securities, issued mainly by Canadian corporations, and diversified portfolios of Emerging Market listed equity. The investment objective of the pooled funds is to achieve capital appreciation and income through professionally managed portfolios. The fair value of the investments in this class has been estimated using NAV per share of the investments. There are no significant restrictions on the ability to sell the investments in this class.
13. SHARE CAPITAL
Common Shares
As at March 31, 2018 and December 31, 2017, OPG had 256,300,010 common shares issued and outstanding at a stated value of $5,126 million. OPG is authorized to issue an unlimited number of common shares without nominal or par value. Any issue of new shares is subject to the consent of OPG’s shareholder, the Province.
Class A Shares
The Company’s Articles of Amalgamation were amended effective December 1, 2017 to allow for the creation and issuance of non-voting Class A shares to the Province in exchange for equity injections in OPG. All of the outstanding shares are owned directly by the Province and OPG is authorized to issue an unlimited number of Class A shares without nominal or par value. The Class A and common shares rank equally as to entitlement to dividends, and all dividends declared by OPG must be declared in equal amounts per share on all outstanding shares without preference or distinction. Upon the liquidation, dissolution or wind-up of OPG, whether voluntary or involuntary, the holders of Class A shares and common shares are entitled to share equally, on a share for share basis, in all distributions of property and assets without preference or distinction. Any issue of new class of shares is subject to the consent of the Province. OPG is entitled to redeem outstanding Class A shares as may be approved by OPG’s Board of Directors.
In March 2018 and December 2017, OPG issued 4,627,343 Class A shares at a price of $43.74 per share and 12,217,616 Class A shares at a price of $42.46 per share to the Province for its equity injections in OPG, generating proceeds of $202 million and $519 million, respectively. The proceeds were used by OPG to purchase the Fair Hydro Trust’s subordinated debt representing 44 percent of the total funding requirements for the Fair Hydro Trust’s acquisitions of Investment Interests from the IESO in March 2018 and December 2017 of $460 million and $1.18 billion, respectively.
As at March 31, 2018, OPG had 16,844,959 Class A shares issued and outstanding at a stated value of $721 million. (December 31, 2017 − 12,217,616 Class A shares issued and outstanding at a stated value of $519 million).
In April 2018, OPG issued 1,498,856 Class A shares at a price of $43.74 per share to the Province for its equity injection in OPG, generating proceeds of $66 million. The proceeds were used by OPG to purchase the Fair Hydro Trust’s subordinated debt representing 44 percent of the total funding requirements for the Trust’s acquisition of Investment Interest from the IESO in April 2018 of $149 million.
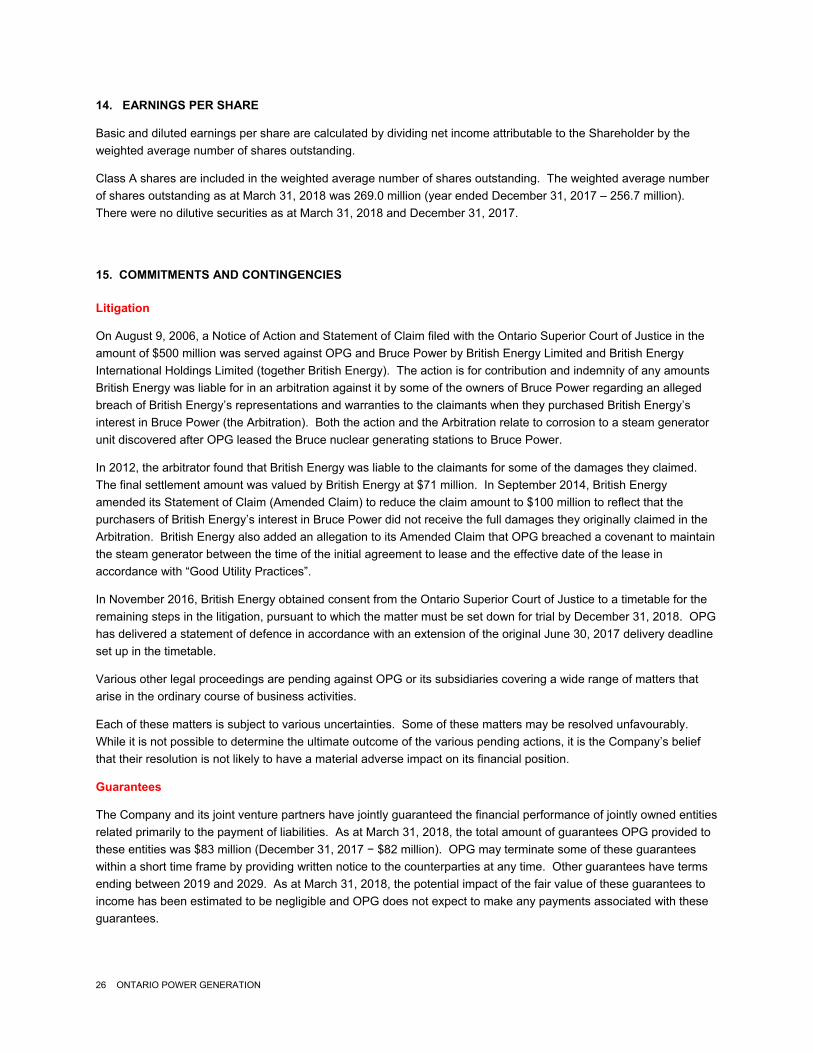
26 ONTARIO POWER GENERATION
14. EARNINGS PER SHARE
Basic and diluted earnings per share are calculated by dividing net income attributable to the Shareholder by the weighted average number of shares outstanding.
Class A shares are included in the weighted average number of shares outstanding. The weighted average number of shares outstanding as at March 31, 2018 was 269.0 million (year ended December 31, 2017 – 256.7 million). There were no dilutive securities as at March 31, 2018 and December 31, 2017.
15. COMMITMENTS AND CONTINGENCIES
Litigation
On August 9, 2006, a Notice of Action and Statement of Claim filed with the Ontario Superior Court of Justice in the amount of $500 million was served against OPG and Bruce Power by British Energy Limited and British Energy International Holdings Limited (together British Energy). The action is for contribution and indemnity of any amounts British Energy was liable for in an arbitration against it by some of the owners of Bruce Power regarding an alleged breach of British Energy’s representations and warranties to the claimants when they purchased British Energy’s interest in Bruce Power (the Arbitration). Both the action and the Arbitration relate to corrosion to a steam generator unit discovered after OPG leased the Bruce nuclear generating stations to Bruce Power.
In 2012, the arbitrator found that British Energy was liable to the claimants for some of the damages they claimed. The final settlement amount was valued by British Energy at $71 million. In September 2014, British Energy amended its Statement of Claim (Amended Claim) to reduce the claim amount to $100 million to reflect that the purchasers of British Energy’s interest in Bruce Power did not receive the full damages they originally claimed in the Arbitration. British Energy also added an allegation to its Amended Claim that OPG breached a covenant to maintain the steam generator between the time of the initial agreement to lease and the effective date of the lease in accordance with “Good Utility Practices”.
In November 2016, British Energy obtained consent from the Ontario Superior Court of Justice to a timetable for the remaining steps in the litigation, pursuant to which the matter must be set down for trial by December 31, 2018. OPG has delivered a statement of defence in accordance with an extension of the original June 30, 2017 delivery deadline set up in the timetable.
Various other legal proceedings are pending against OPG or its subsidiaries covering a wide range of matters that arise in the ordinary course of business activities.
Each of these matters is subject to various uncertainties. Some of these matters may be resolved unfavourably. While it is not possible to determine the ultimate outcome of the various pending actions, it is the Company’s belief that their resolution is not likely to have a material adverse impact on its financial position.
Guarantees
The Company and its joint venture partners have jointly guaranteed the financial performance of jointly owned entities related primarily to the payment of liabilities. As at March 31, 2018, the total amount of guarantees OPG provided to these entities was $83 million (December 31, 2017 − $82 million). OPG may terminate some of these guarantees within a short time frame by providing written notice to the counterparties at any time. Other guarantees have terms ending between 2019 and 2029. As at March 31, 2018, the potential impact of the fair value of these guarantees to income has been estimated to be negligible and OPG does not expect to make any payments associated with these guarantees.
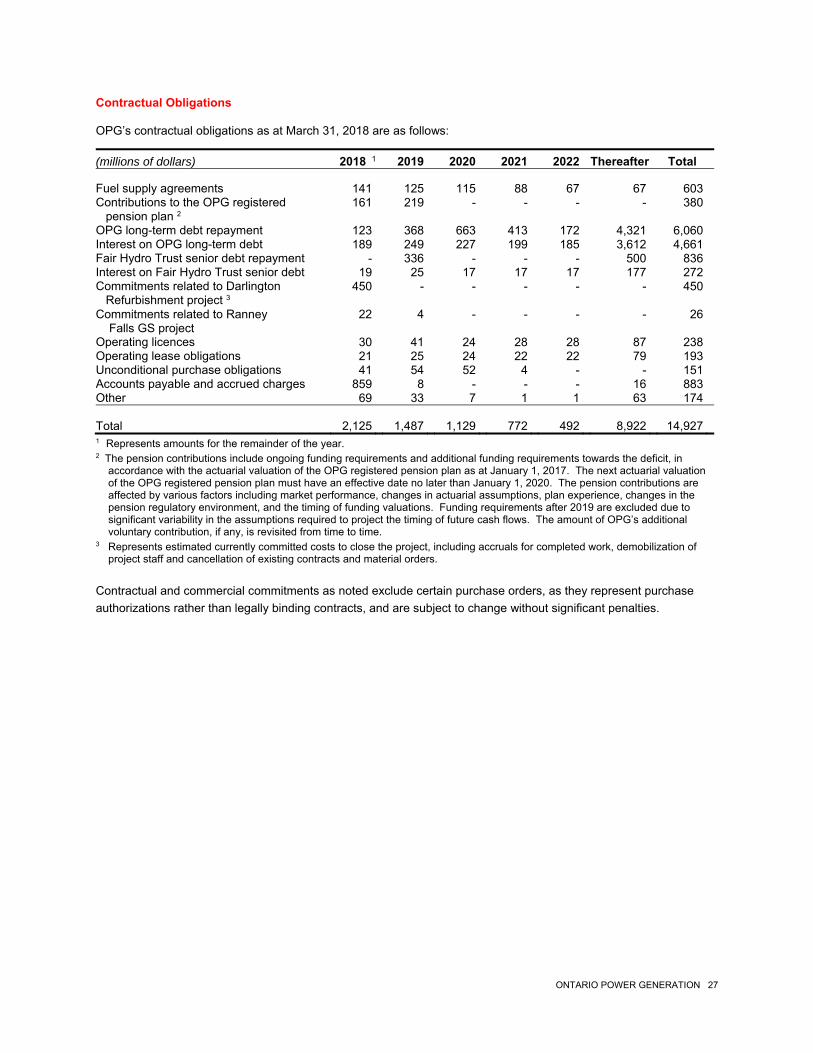
ONTARIO POWER GENERATION 27
Contractual Obligations OPG’s contractual obligations as at March 31, 2018 are as follows:
(millions of dollars) 2018 1 2019 2020 2021 2022 Thereafter Total
Fuel supply agreements 141 125 115 88 67 67 603 Contributions to the OPG registered 161 219 - - - - 380 pension plan 2 OPG long-term debt repayment 123 368 663 413 172 4,321 6,060 Interest on OPG long-term debt 189 249 227 199 185 3,612 4,661 Fair Hydro Trust senior debt repayment - 336 - - - 500 836 Interest on Fair Hydro Trust senior debt 19 25 17 17 17 177 272 Commitments related to Darlington 450 - - - - - 450 Refurbishment project 3 Commitments related to Ranney 22 4 - - - - 26 Falls GS project Operating licences 30 41 24 28 28 87 238 Operating lease obligations 21 25 24 22 22 79 193 Unconditional purchase obligations 41 54 52 4 - - 151 Accounts payable and accrued charges 859 8 - - - 16 883 Other 69 33 7 1 1 63 174 Total 2,125 1,487 1,129 772 492 8,922 14,927 1 Represents amounts for the remainder of the year. 2 The pension contributions include ongoing funding requirements and additional funding requirements towards the deficit, in
accordance with the actuarial valuation of the OPG registered pension plan as at January 1, 2017. The next actuarial valuation of the OPG registered pension plan must have an effective date no later than January 1, 2020. The pension contributions are affected by various factors including market performance, changes in actuarial assumptions, plan experience, changes in the pension regulatory environment, and the timing of funding valuations. Funding requirements after 2019 are excluded due to significant variability in the assumptions required to project the timing of future cash flows. The amount of OPG’s additional voluntary contribution, if any, is revisited from time to time.
3 Represents estimated currently committed costs to close the project, including accruals for completed work, demobilization of project staff and cancellation of existing contracts and material orders.
Contractual and commercial commitments as noted exclude certain purchase orders, as they represent purchase authorizations rather than legally binding contracts, and are subject to change without significant penalties.
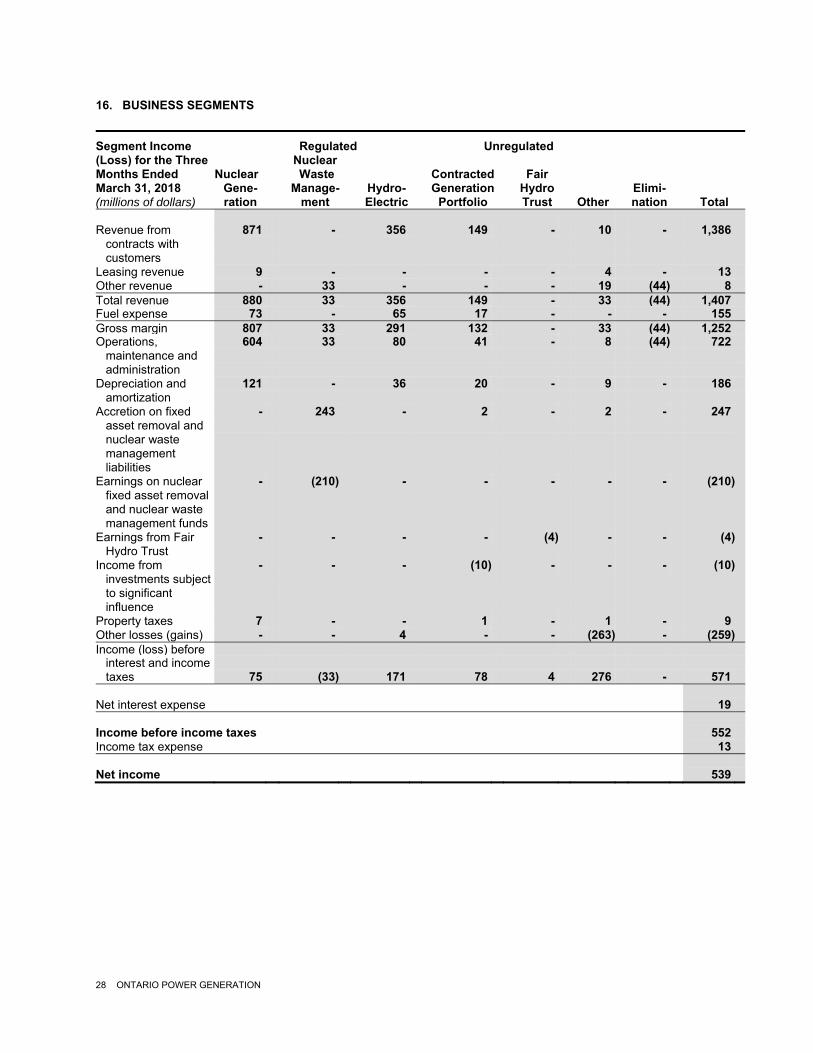
28 ONTARIO POWER GENERATION
16. BUSINESS SEGMENTS
Segment Income Regulated Unregulated (Loss) for the Three Nuclear Months Ended Nuclear Waste Contracted Fair March 31, 2018 Gene- Manage- Hydro- Generation Hydro Elimi- (millions of dollars) ration ment Electric Portfolio Trust Other nation Total Revenue from 871 - 356 149 - 10 - 1,386 contracts with customers Leasing revenue 9 - - - - 4 - 13 Other revenue - 33 - - - 19 (44) 8 Total revenue 880 33 356 149 - 33 (44) 1,407 Fuel expense 73 - 65 17 - - - 155 Gross margin 807 33 291 132 - 33 (44) 1,252 Operations, 604 33 80 41 - 8 (44) 722 maintenance and administration Depreciation and 121 - 36 20 - 9 - 186 amortization Accretion on fixed - 243 - 2 - 2 - 247 asset removal and nuclear waste management liabilities Earnings on nuclear - (210) - - - - - (210) fixed asset removal and nuclear waste management funds Earnings from Fair - - - - (4) - - (4) Hydro Trust Income from - - - (10) - - - (10) investments subject to significant influence Property taxes 7 - - 1 - 1 - 9 Other losses (gains) - - 4 - - (263) - (259) Income (loss) before interest and income taxes 75 (33) 171 78 4 276 - 571 Net interest expense 19 Income before income taxes 552 Income tax expense 13 Net income 539
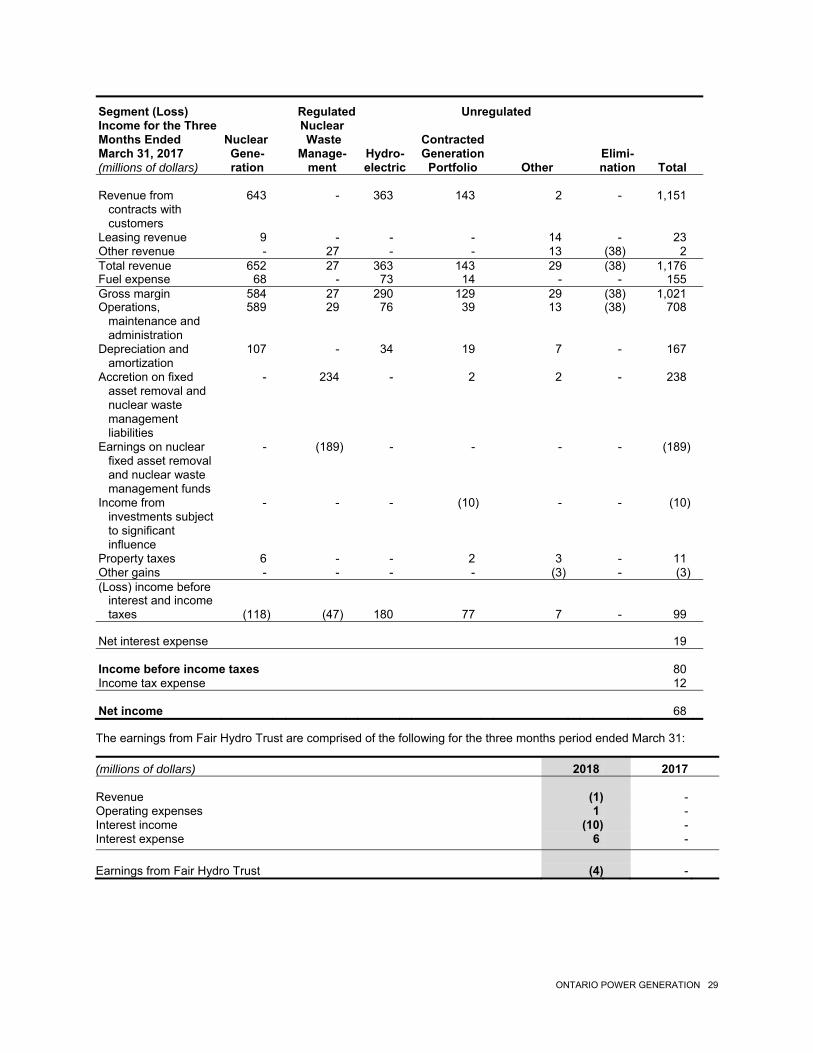
ONTARIO POWER GENERATION 29
Segment (Loss) Regulated Unregulated Income for the Three Nuclear Months Ended Nuclear Waste Contracted March 31, 2017 Gene- Manage- Hydro- Generation Elimi- (millions of dollars) ration ment electric Portfolio Other nation Total Revenue from 643 - 363 143 2 - 1,151 contracts with customers Leasing revenue 9 - - - 14 - 23 Other revenue - 27 - - 13 (38) 2 Total revenue 652 27 363 143 29 (38) 1,176 Fuel expense 68 - 73 14 - - 155 Gross margin 584 27 290 129 29 (38) 1,021 Operations, 589 29 76 39 13 (38) 708 maintenance and administration Depreciation and 107 - 34 19 7 - 167 amortization Accretion on fixed - 234 - 2 2 - 238 asset removal and nuclear waste management liabilities Earnings on nuclear - (189) - - - - (189) fixed asset removal and nuclear waste management funds Income from - - - (10) - - (10) investments subject to significant influence Property taxes 6 - - 2 3 - 11 Other gains - - - - (3) - (3) (Loss) income before interest and income taxes (118) (47) 180 77 7 - 99 Net interest expense 19 Income before income taxes 80 Income tax expense 12 Net income 68
The earnings from Fair Hydro Trust are comprised of the following for the three months period ended March 31:
(millions of dollars) 2018 2017 Revenue (1) - Operating expenses 1 - Interest income (10) - Interest expense 6 - Earnings from Fair Hydro Trust (4) -
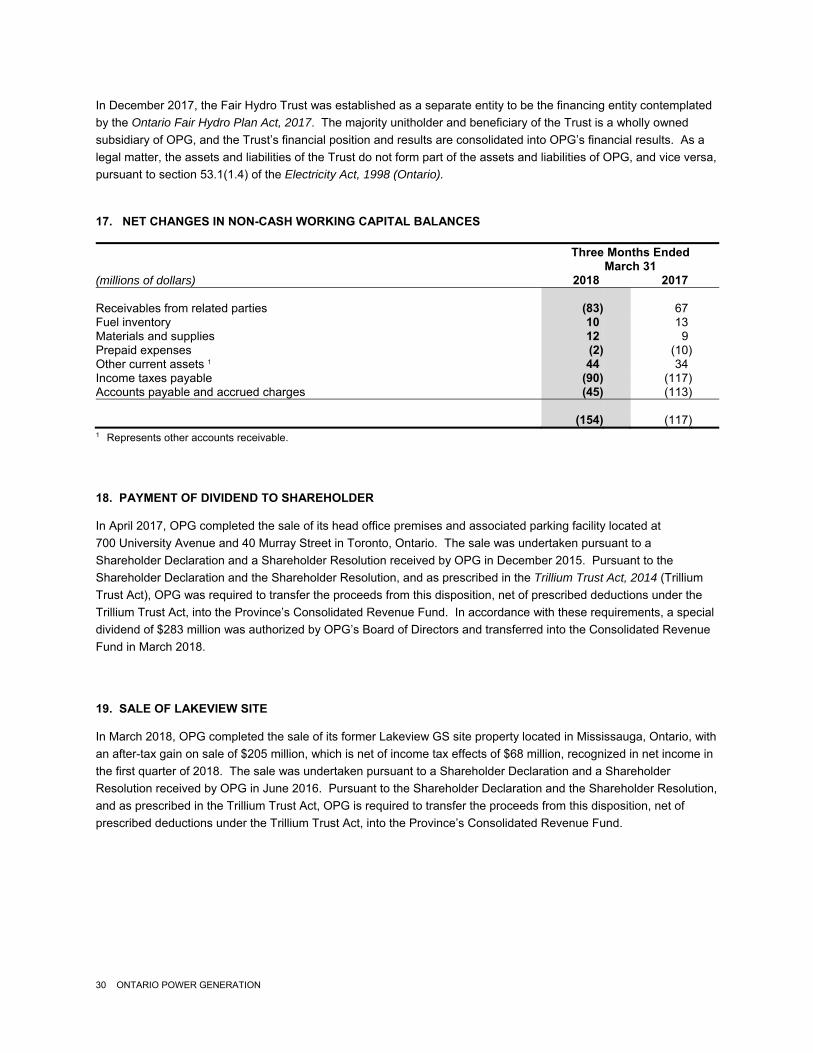
30 ONTARIO POWER GENERATION
In December 2017, the Fair Hydro Trust was established as a separate entity to be the financing entity contemplated by the Ontario Fair Hydro Plan Act, 2017. The majority unitholder and beneficiary of the Trust is a wholly owned subsidiary of OPG, and the Trust’s financial position and results are consolidated into OPG’s financial results. As a legal matter, the assets and liabilities of the Trust do not form part of the assets and liabilities of OPG, and vice versa, pursuant to section 53.1(1.4) of the Electricity Act, 1998 (Ontario). 17. NET CHANGES IN NON-CASH WORKING CAPITAL BALANCES Three Months Ended March 31 (millions of dollars) 2018 2017 Receivables from related parties (83) 67 Fuel inventory 10 13 Materials and supplies 12 9 Prepaid expenses (2) (10) Other current assets 1 44 34 Income taxes payable (90) (117) Accounts payable and accrued charges (45) (113) (154) (117) 1 Represents other accounts receivable.
18. PAYMENT OF DIVIDEND TO SHAREHOLDER
In April 2017, OPG completed the sale of its head office premises and associated parking facility located at 700 University Avenue and 40 Murray Street in Toronto, Ontario. The sale was undertaken pursuant to a Shareholder Declaration and a Shareholder Resolution received by OPG in December 2015. Pursuant to the Shareholder Declaration and the Shareholder Resolution, and as prescribed in the Trillium Trust Act, 2014 (Trillium Trust Act), OPG was required to transfer the proceeds from this disposition, net of prescribed deductions under the Trillium Trust Act, into the Province’s Consolidated Revenue Fund. In accordance with these requirements, a special dividend of $283 million was authorized by OPG’s Board of Directors and transferred into the Consolidated Revenue Fund in March 2018.
19. SALE OF LAKEVIEW SITE
In March 2018, OPG completed the sale of its former Lakeview GS site property located in Mississauga, Ontario, with an after-tax gain on sale of $205 million, which is net of income tax effects of $68 million, recognized in net income in the first quarter of 2018. The sale was undertaken pursuant to a Shareholder Declaration and a Shareholder Resolution received by OPG in June 2016. Pursuant to the Shareholder Declaration and the Shareholder Resolution, and as prescribed in the Trillium Trust Act, OPG is required to transfer the proceeds from this disposition, net of prescribed deductions under the Trillium Trust Act, into the Province’s Consolidated Revenue Fund.