
OPG Power Ventures Plc. Annual Report 2011
72
OPG Power Ventures Plc Annual Report and Accounts 2011 A platform for growth OPG Power Ventures Plc Annual Report and Accounts 2011
-
Upload
hugo-pickering -
Category
Documents
-
view
219 -
download
3
description
OPG power Ventures Plc. Annual Report 2011 - year ended 31st March 2011
Transcript of OPG Power Ventures Plc. Annual Report 2011

OP
G P
ower Ventures P
lcA
nnual Rep
ort and A
ccounts 2011
A platformfor growth
OPG Power Ventures Plc
Annual Report and Accounts 2011
www.opgpower.com
OPG Power Ventures Plc117 Sir P S Sivasamy SalaiSt Ebba’s AvenueMylaporeChennai 600 004India
T: +91(0) 44 42911214/42911222F: +91(0) 44 42911209E: [email protected]
Registered officeIoma HouseHope StreetDouglasIsle of Man IM1 1AP

OPG Power Ventures Plc is developing and operating power plants in India. The company is committed to building shareholder value and to being the first choice provider of reliable, uninterrupted power at competitive rates to its customers. OPG is listed on the Alternative Investment Market (AIM).
Overview01 Highlights02 Our Markets04 Our Operations and Projects06 Our Strategy and KPIs08 Capacity Growth Profile10 Chairman’s Statement
Business Review12 Principal Risks14 Chief Executive’s Statement16 Operational Review20 Financial Review22 Responsible Growth24 Board of Directors
Corporate Governance 26 Corporate Governance 30 Directors’ Remuneration Report34 Directors’ Report36 Statement of Directors’ Responsibilities
in Respect of the Accounts
Financial Statements37 Independent Auditors’ Report to the
Members of OPG Power Ventures Plc38 Consolidated and Company Statement
of Comprehensive Income39 Consolidated and Company Statement
of Financial Position40 Consolidated Statement of changes
in Equity42 Company Statement of changes in Equity44 Consolidated and Company Statement of
Cash Flows45 Notes to the Consolidated and Company
Financial Statements67 Corporate Directory68 Definitions and Glossary
Certain statements included in this Annual Report and Accounts contain forward-looking information concerning the Group’s strategy, operations, financial performance or condition, outlook, growth opportunities or circumstances in the countries, sectors or markets in which the Group operates. By their nature, forward-looking statements involve uncertainty because they depend on future circumstances, and relate to events, not all of which are within the Group’s control or can be predicted by the Group. Although the Group believes that the expectations reflected in such forward-looking statements are reasonable, no assurance can be given that such expectations will prove to have been correct. Actual results could differ materially from those set out in the forward-looking statements. For a detailed analysis of the factors that may affect our business, financial performance or results of operations, please refer to the Principal Risks and Uncertainties included in this Annual Report and Accounts. No part of these results constitutes, or shall be taken to constitute, an invitation or inducement to invest in the Group or any other entity, and must not be relied upon in any way in connection with any investment decision. The Group undertakes no obligation to update any forward-looking statements.
Cover: Covered coal shed at Chennai with 40,000t capacity
09
10
110 10 20 30 40
09
10
110 5 10 15 20
09
10
110 20 40 60 80 120100
09
10
110 0.5 1.0 1.5 2.0 2.5
OPG Power Ventures Plc Annual Report and Accounts 2011_01
Overview
Business Review
Corporate Governance
Financial Statements
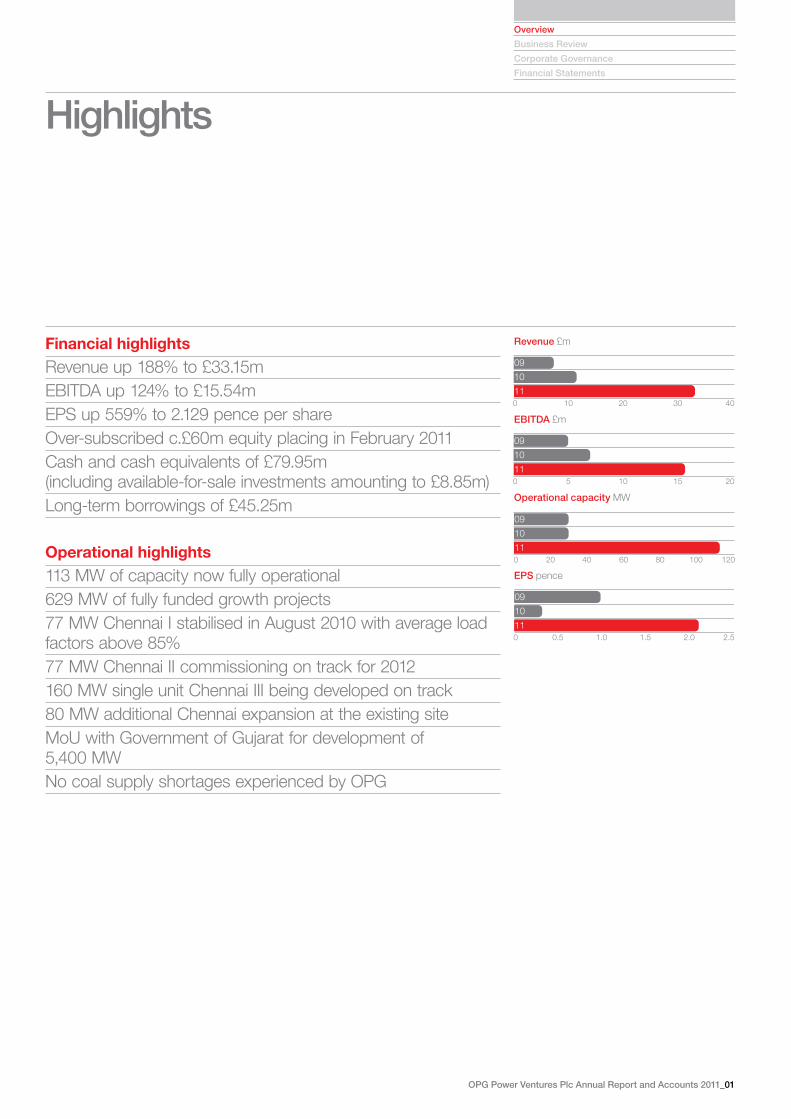
Highlights
Revenue £m
EBITDA £m
Operational capacity MW
EPS pence
Financial highlightsRevenue up 188% to £33.15mEBITDA up 124% to £15.54mEPS up 559% to 2.129 pence per shareOver-subscribed c.£60m equity placing in February 2011Cash and cash equivalents of £79.95m (including available-for-sale investments amounting to £8.85m)Long-term borrowings of £45.25m Operational highlights113 MW of capacity now fully operational629 MW of fully funded growth projects 77 MW Chennai I stabilised in August 2010 with average load factors above 85%77 MW Chennai II commissioning on track for 2012160 MW single unit Chennai III being developed on track80 MW additional Chennai expansion at the existing siteMoU with Government of Gujarat for development of 5,400 MWNo coal supply shortages experienced by OPG

Target Achieved De�cit %
Xthplan
2007–08
2008–09
2009–10
2010–11
2011–12e
IXthplan
VIIIthplan
0
10,000
20,000
30,000
40,000
50,000
0
20
40
60
80
100
MW %
0
2,000
4,000
6,000
8,000
10,000
12,000
14,000
IndiaBrazilChinaSouthAfrica
RussiaUKFranceGermanyAustraliaUS
Peak demand Peak supply
10/1109/1008/0907/0806/0705/0604/0503/0402/030
20,000
40,000
60,000
80,000
100,000
120,000
140,000
02_OPG Power Ventures Plc Annual Report and Accounts 2011
Trends and conditions
Our MarketsDemand for power in India is expected to grow at 10% every year and with capacity addition lagging behind targets, the power deficit across the country is expected to continue in the future.
In the last five years peak deficit has remained above the 10% levels, while at the same time increasing in absolute terms from 10.2 GW to 12.0 GW
Target vs achieved capacity additions
Electricity consumption per capita (KWh)
Peak deficit (MW)Market opportunity
India’s GDP forecast to continue to grow –at 8%Demand for power expected to continue –to grow at 10–12% pa to 2020Per capita consumption is a fraction of –China, the rest of Asia and Western EuropePower deficit continues, ranges between –9% and 13%Trend of capacity additions 40–50% below –planned capacityCoal based generation over 50% of total –installed capacityCoal based generation expected to –continue to be the biggest constituent and Indian coal mining activities being expanded
Investment rationaleHighly profitable, cash generative –operationsLeading returns in sector due to group –captive modelIndustry leading group captive, brownfield, –projects portfolio of 629 MW fully-funded and on track for 2013Pricing independent of tariff set by State –Electricity BoardsFlexibility to use local or imported coal –Experienced Management team –Strong partners include debt providers, –equipment suppliers, engineering and operating companies and shareholders
Source: CEA, Ministry of Power
Source: CIA World Book 2010
1999–2000 Coal 61% Gas 10% Oil 1% Hydro 24% Nuclear 3% Renewable 1%
2010–11 Coal 55% Gas 10% Oil 1% Hydro (Renewable) 21% Nuclear 3% RES (MNRE) 10%
High latent demand – India still has very low per capita consumption compared to other developing countries
Power generation by fuel
Source: CEA, Ministry of Power
Source: CEA, Ministry of Power
Annual capacity addition has been much less than the planned targets for the sector resulting in power deficits
Thermal power forms a major portion of the installed capacity in India, accounting for over two thirds of the total installed capacity

OPG Power Ventures Plc Annual Report and Accounts 2011_03
Overview
Business Review
Corporate Governance
Financial Statements
Group captive model
OPG’s business modelOPG is one of the pioneers of the Group –captive power plant modelIt supplies to broad base industrial and –commercial customersIn addition, flexibility is retained to supply –to State Electricity Board (“SEB”)OPG retains the option to supply as a –Group Captive Plant or as a merchant plantThe model provides leading industry –returns
ParticularsRegulated PPA Based* Competitive Bidding Merchant Group Captive
Concession type Long-term PPA (25 years)
Long-term PPA (25 years)
No long-term PPA. Rolling PSA with traders/direct sale
Bilateral arrangements with consumers/traders/utilities
Tariff determination Regulated cost plus basis – 15.5% RoE
Competitive bidding based on minimal pass through
PSA with trader/spot price Discount to prevailing industrial tariffs
Opportunities Limited. Policy thrust towards competitive biding
Multiple bids announced by state
Small to medium sized plants (less than 500 MW)
Small to medium sized plants (less than 500 MW)
Risk sharing No market risk. No cost risk. Fuel cost – pass through
Cost risk on developer. Fuel cost not on pass through. Restricted indexation
Off take risk and price risk borne by the developer
Off take risk and price risk borne by the developer
Risk return Low risk – fixed return Varying risk profiles for different projects. High risk for imported coal projects. Lower risk for captive mine projects
Fuel security key to reduce risks. High returns
Fuel Security key to reduce risks. High returns
Equity returns Assured 15.5% Variable depending upon the risk profile
Equity returns linked to tariff Equity returns linked to tariff may be 30% plus
* Government of India has discontinued policy of awarding regulated PPA’s.
Flexibility to determine pricing Supply assured power to corporate and –industrial customers at tariffs mutually agreed, without approval of the regulators.Tariffs are set at a discount to the industrial –tariff set by the SEB Balance power (49%) may be sold to a –distribution utility or trading licensee or to any other consumer
Electricity act 2003 and captive power plants (“CPP”)
Legislation allowing captive power plants –to be set up to generate electricity Captive consumers to take up 51% of –aggregate electricity generated annuallyCompulsory access to grid allowed –Allows power to be sold on a pan-India –basis

04_OPG Power Ventures Plc Annual Report and Accounts 2011
Development
Our Operations and Projects
Operating
Our main plants are located in the states of Tamil Nadu and Gujarat, amongst the most industrialised states of India.
Current operationsThe current operations comprise the 77 MW Chennai I plant, 25.4 MW Mayavaram natural gas plant and the 10 MW waste heat plant.
Development projectsThe Group has 629 MW of projects under construction which are fully funded and are expected to be commissioned by 2013.
113 MW 629 MW
1. 77 MW Chennai IThermal coal plant –Commissioned in April 2010 –Commercial generation from –August 2010Located 55km from Chennai –In close proximity to Ennore and –Chennai portO&M contract awarded to Tata Power –CompanyPlant operating smoothly at output levels –of 85%
2. 25.4 MW MayavaramNatural gas plant in Tamil Nadu –6 MW expansion commissioned –
Registered for Carbon Credit –CertificationOutput levels at c.80% of capacity –O&M contract with Wärtsilä –ISO 14001 certified –
3. 10 MW waste heatWaste heat plant in Chennai –Waste heat from sponge iron plant, coal –and dolochar usedPlant performing at c.63% capacity level –Carbon Credit Registration in progress –
4. 77 MW Chennai IILand and environment approvals in place –Project fully funded –Infrastructure shared with Chennai I –Coal linkage obtained from Coal India Ltd –Civil works complete and main –equipment construction underwayCompletion expected in 2012 –
5. 160 MW Chennai IIIRevised configuration of 160 MW from –2 x 80 MWSingle unit expected to improve –fuel efficiencyLand and environmental permits in place –Project fully funded –Completion expected in 2013 –
Chennai I Air Cooled Condenser
Mayavaram
Chennai

Bellary
OPG Power Ventures Plc Annual Report and Accounts 2011_05
Overview
Business Review
Corporate Governance
Financial Statements
PipelineDevelopment
Projects in the pipelineThe Group’s aim is to have a portfolio of power plants of 1,250 MW by 2015. In addition, it has a MoU with the Gujarat state to install 5,400 MW.
6. 80 MW Chennai IVLand, equity and environment approvals –in placeEquity funding from internal resources –Shares infrastructure with Chennai I & II –Equipment delivery commenced –Civil works in progress –Coal linkage obtained from CIL –Completion expected in 2013 –
7. 12 MW BellaryAcquired part completed plant in 2011 –120 acre brownfield site well located in –industrial heartland of Karnataka stateCompletion of 12 MW expected in 2013 –Potential to develop 250 MW plant –
8. 300 MW GujaratLand, debt and equity in place –2 x 150 MW modular plants –7,000 tonnes of equipment ready for –delivery with BHELEngineering by TATA Consulting –Civil construction by Gannon Dunkerley –Completion expected in 2013 –
9. MoU with Gujarat State GovernmentMoU signed with Gujarat State to –develop 5,400 MW of generating capacity by 20184,000 MW thermal coal and 1,400 MW –gas plantsGovernment of Gujarat to facilitate –approvalsAwarded to OPG owing to strength of –team and project execution capabilities
10. 508 MW pipeline expansionPlans to develop c.508 MW capacity –Increasing capacity to 1,250 MW by 2015 –
Chennai ll Boiler under construction Chennai ll Power House under construction
Chennai
Gujarat

06_OPG Power Ventures Plc Annual Report and Accounts 2011
Our Strategy
Maximising performance of generation assets
Customers Maximise plant availability and output –Assured reliable and uninterrupted supply –Ability to supply power direct to customers, not via state utilities –Pricing competitive compared with utility tariffs and negotiated –directly with customers
Profitability Secure best available tariff through flexibility of supplying power –either under Group captive model or as a merchant operatorMaintain ability to use domestic, imported and blended fuel –sources of a broad range of specifications Implement optimisation of generation assets and work with –development partners to incorporate performance improvement measures in subsequent projectsMinimise exposure to complex logistics –
De-risking our projects
Responsible growth
Seek to identify and maximise any brownfield development –opportunitiesEvaluate and work with long-term, top tier financing, technical –and consulting partnersEnsure all environmental norms are met or exceeded –Take cognisance of the needs of local communities –
Financing Maximise cash generation to provide liquidity support and –potential project equityMaintain liquidity and manageable gearing levels –Regular, open dialogue with shareholders and financing partners –
Team Promote a safe working environment –Continually enhance development skills through internal mobility –of senior employees with project development experienceEvolve reward structures to align with value creation –
The Company aims to build shareholder value by being the first choice provider of reliable and uninterrupted power at competitive rates to its customers. Our strategy is to maximise the performance of existing generation assets and to continually de-risk our project portfolio.

10
11–30% –20% –10% 0% 10% 20%
10
110 5 10 15 20
11
10
11
10
110% 20% 40% 60% 80% 100%
25.4 MW Mayavaram
77 MW Chennai
10 MW waste heat
10
110 0.5 1 1.5 2 2.5
10
110% 20% 40% 60% 80% 100%
10
110 5 10
OPG Power Ventures Plc Annual Report and Accounts 2011_07
Overview
Business Review
Corporate Governance
Financial Statements
Key Performance Indicators
Gearing
Gearing is a measure of net debt to shareholders equity plus net debt. The Group has net cash of £29.64m (2010: net debt £10.18m) and negative gearing of 24% (2010: positive gearing of 10%). As development of projects proceeds the gearing turns positive.
EBITDA £m
Earnings Before Interest, Taxes, Depreciation and Amortisation is a factor of volumes, prices and cost of production. This measure is calculated by adjusting non operational and exceptional items and, depreciation and net finance cost. It is a measure of the company’s operating profitability. EBITDA for the year was £15.54m, up 124%.
Plant Load Factor
Plant load factor measures the output of a power plant compared to the maximum output it could produce. A higher load factor represents a more efficient plant and means fixed costs are spread over more KWh of output resulting in a lower price per unit of electricity. Operationally, all plants performed well with average PLF of the 77MW Chennai plant at 75%.
EPS pence
This represents net profit after tax attributable to equity shareholders. EPS growth also demonstrates the management of our capital structure. Earnings per share of 2.129 pence in 2011 represents an increase of 559% over 2010 on account of higher net earnings attributable to shareholders from Chennai I in which the Group has an economic interest of 99%.
CAGR
It measures the compound average year on year growth rate of the plant operating capacity of the Group. The Group has added the 77 MW Chennai I in this year and hence the CAGR of Capacity in 2011 is 94%.
Average tariff realisation Rs/KWh
This is the average price realised per unit of power sold. Revenue for the Company is calculated by multiplying number of units sold by the average price realised. The average tariff achieved for 2011 was Rs 4.95/KWh, amongst the highest in the sector due to the Group Captive model.

08_OPG Power Ventures Plc Annual Report 2011
Capacity Growth Profile
0
Calendar year
500
1,000
1,500
2,000
2,500
Capacity Added Existing Capacity
2008
MW
2009
2010
2011
30 107
113
The Company lists on AIM with 20 MW operational capacity
In September 2008, 10 MW waste heat plant in Chennai is commissioned
The Group announces plans to extend development capacity by 600 MW to 1,250 MW by 2015
77 MW Chennai I is commissioned in April 2010 increasing total operational capacity to 107 MW
6 MW expansion at Mayavaram gas plant in 2011 bringing total capacity to 113 MW
The Company raises £60m equity for its development pipeline

OPG Power Ventures Plc Annual Report 2011_09
Overview
Business Review
Corporate Governance
Financial Statements
0
Calendar year
500
1,000
1,500
2,000
2,500
MW
2012
2013
2014
2015
190
742
1,25
0
552 MW of projects expected to commission multiplying current capacity 5 times to 742 MW
77 MW Chennai II is expected to commission increasing operational capacity to 190 MW
508 MW of pipeline capacity to be commissioned achieving the target of 1,250 MW

10_OPG Power Ventures Plc Annual Report and Accounts 2011
Chairman’s Statement
I am pleased to report on a landmark year for your Company that witnessed the commissioning and optimisation of our first major project, the 77 MW Chennai I.
Revenue of £33.15m compared with £11.52m in 2010 whilst earnings per share grew by over 500% in line with the dramatic change in our generation capacity from 30 MW in 2010 to 113 MW in 2011. Notably, for a company that focuses on building shareholder value, our margins have been amongst the highest in our Indian peer group of independent electricity generators despite the highly publicised inflationary pressures affecting our industry. Consequently the Company’s cash position of £79.95m has enabled us to maintain gearing levels at just -24% and to look forward with confidence to investing in growth.
We progressed the development of all our projects during the year and have recently announced an acceleration of Chennai II as well as the addition of another replica 80 MW unit at Chennai such that we now have 317 MW of brownfield projects under development at Chennai out of a total of 629 MW Company-wide projects under full-swing development for commissioning by 2013. On this basis, we continue to maintain our targeted capacity of 1,250 MW by 2015.
The Company continues to benefit from a structural shortage in supply of reliable power in India. With the planned additional supply likely to fall acutely short of the 300–315 GW by 2017 required in the next five years, we believe this dynamic will prevail and prices will remain firm.
The demand outlook for power in India has its foundation in the Government’s projected economic growth for the country of c8% pa. India emerged from the 2008–2009 global financial crisis with a strong domestic economy and rapidly accelerating industrial production. As a result, demand or more realistically, the need, for infrastructure development has been and we expect shall continue to be a key area of policy focus.
This development needs to weather the compounding challenges of raw material inflation, consumer price inflation leading to the tightening of monetary policy and the accumulated losses of State electricity boards.
Chennai Plant Switch Yard
Overview of the 10 MW waste heat plant in Chennai
With this backdrop, our strategy needs to continue unabated with a focus on optimising the performance of our generation assets, migrating the learning experience from building these assets in upcoming developments and to continually de-risk and deliver our largely brownfield growth portfolio. One important aspect of this is the need to retain our ability to be flexible with regard to fuel procurement rather than to be greatly exposed to a small number of possible fuel sources. We embrace the challenges of developing projects in such a fast-growth economy as we believe our model of operating flexible, high-margin, standalone units positions us well in doing so.
The Board wishes to record its thanks to the Company’s shareholders for their support during our over-subscribed £60m equity raising earlier this calendar year as well as to its financing and technical partners and customers for their vital contribution to the Company’s continued progress.
I’d like to make a special mention of the dedication and hard work of our team since our IPO in May 2008. We are now beginning to taste the fruit of all this effort. As I’ve no doubt such commitment will continue I am able to conclude that the Company’s profitability and cash generation now provide an excellent platform for our long-term growth. I remain confident of the Company’s continued success.
M C Gupta12 August 2011
Mr Munish GuptaNon-executive Chairman

OPG Power Ventures Plc Annual Report 2011_11
Overview
Business Review
Corporate Governance
Financial Statements
Overview
Business Review
Corporate Governance
Financial Statements

12_OPG Power Ventures Plc Annual Report and Accounts 2011
Principal RisksThe Group faces a number of risks to its business and strategy. Management of these risks is an integral part of the management of the Group. The Group has in place a process for identifying and managing risks.
The list of principal risks and uncertainties facing the Group’s business set out below cannot be exhaustive because of the very nature of risk. New risks emerge and the severity and probability associated with these change over time.
Sector-related risks
Risk Potential impact Monitoring and mitigation
Power sale in the group captive model
The Group’s power plants derive their revenue from the Group captive model selling power to captive consumers and partly from sale on short-term, medium-term, or long-term sale basis and would, for this purpose, enter into power purchase agreements with counterparties such as captive consumers, power trading companies and State utilities.
Contracts with customers may impose restrictions on the Company’s ability to, amongst other things, increase prices at short notice and undertake expansion initiatives with other customers. This could affect the revenue in the short to medium term.
Review contracts periodically to obtain best –possible tariffs Flexibility to sell to captive consumers or in the –open market Benchmarking captive consumer prices to State –utility prices to benefit from any price increases
Availability of fuel supply and costs
The Group has coal linkages with domestic companies and agreements for imported coal.
The dependence on third parties for coal exposes the Group’s power plants to vulnerabilities such as non-supply, price increases in the international market, foreign exchange fluctuations and increases in shipping costs. This could impact the operations and profitability of the Group.
Seeking long-term supplies –Maintaining adequate storage facility to keep appropriate –levels of surplus stocks Maintaining relationship with suppliers and mitigating –any potential disruption Developing different sources for fuel supply especially in –the imports market
Timely execution of projects
The length of the construction period and the cost to complete any given project is dependent on third party suppliers and EPC contractors.
Factors such as disputes with contractors, price increases, and shortages of construction materials, delays in supply from various contractors, accidents, unforeseen difficulties, changes in government policies and delays in receipt of necessary approvals can lead to cost over-runs and delays impacting the timely completion and ultimately the profitability of projects.
Close monitoring of projects by the project team and –addressing issues causing delays Ordering key equipment and long lead items ahead of –scheduleIncluding liquidated damages clauses in its contracts in –relation to such matters as delays and inferior workmanship
Funding of projects
The development of power plants is a capital intensive business and the Group’s projects require access to both equity and debt markets.
Delay in raising finance or the terms of debt funding could affect the timely completion and cost of its projects and servicing of debt.
Assessing financial viability of projects –Financing projects with an optimum mix of debt and –equity including internal accrualsObtaining in-principle project finance from banks before –commencement of projectsMonitoring cashflows to ensure repayment of debt and –interest in line with schedule
Health, safety and environmental and local stakeholder management
The Group’s plants are located in different states and in areas where there is adequate land to set up projects, water availability and connectivity to ports. Setting up power projects in such areas may affect the environment and health and safety.
Changes in legislation and standards, the Group’s failure to control adequately environmental and health and safety risks or activism by local groups could have an adverse impact the operations of the Company.
The Group has management systems to monitor the –health, safety and environmental aspects of business. These are communicated to the relevant businesses and employees with training provided on a regular basisSetting up a formal committee responsible for heath, –safety and environmental issues at Board level is under considerationThe Group proactively engages with local stakeholders –prior to and during project commissioning to address concerns Working with local communities and implementing –sustainable programs to aid the development of these communities

OPG Power Ventures Plc Annual Report and Accounts 2011_13
Overview
Business Review
Corporate Governance
Financial Statements
India-specific risks
Risk Potential impact Monitoring and mitigation
Government policy and regulatory
The power industry is heavily regulated with permits and licences issued by the Indian Government. Further, the regulatory environment is continuously changing. Obtaining these licences is critical to the Group’s development plans.
Failure or delays in receiving permits or approvals could have an adverse impact on projects and affect the profitability of the Group.
The Group monitors and reviews changes in the –regulatory environment and its commitments under licenses previously grantedIt continually ensures compliance with the conditions –contained within individual licenses and is mindful of the importance of complying with national and local legislation and standardsThe Group maintains an open and proactive relationship –with the Indian Government and its various agencies
Ability to retain fiscal and tax incentives
The Group’s existing and planned power plants are based on the various fiscal and tax benefits that will be available to the Company by the Federal and State government. A change in government policy to withdraw these incentives can have an adverse impact on the profitability of the Group.
The Group continues to monitor changes and –developments in respect of incentives provided by the Indian Federal and State authoritiesProject investment returns are evaluated based on the –expected incentives available to the Company and are revised based on the most up to date guidance available
Exchange Rate Fluctuations
As a consequence of the international nature of its business, the Company is exposed to risks associated with changes in foreign currency exchange rates. The Group’s operations are based in India and its functional currency is the Indian Rupee although the presentational currency is Great Britain Pound Sterling.
The Group’s financial results may be affected by appreciation or depreciation of the value of the foreign exchange rates relative to the Indian Rupee.
Putting in place, where appropriate, forward contracts or –hedging mechanismsMonitoring our risk on a regular basis where no hedging –mechanism is in place and taking steps to minimise potential losses
Global financial instability
The Indian market and Indian economy are influenced by global economic and market conditions, particularly emerging market countries in Asia. Financial instability in recent years has inevitably affected the Indian economy.
Continuing uncertainty and concerns about contagion in the wake of the financial crises could have a negative impact on the availability of funding.
The Group continues to monitor changes and –developments in the global markets to assess the impact on its financing plans

14_OPG Power Ventures Plc Annual Report and Accounts 2011
Chief Executive’s Statement
Milestone year provides solid platform for growthThe year ended 31 March 2011 was a landmark year for OPG, with the successful commissioning of the Group’s first major project of 77 MW. The Chennai I plant is now operating consistently at load factors of around 90%, providing strong cash flow to the Group and underpinning our track record of successful project delivery.
The over-subscribed equity raising of c.£60m (gross of transaction fees) in February 2011 demonstrated support from the Company’s stakeholders and provides capital to fund a 629 MW pipeline of projects under construction and development. Combined with the 113 MW of existing operational capacity, this total pipeline has increased substantially from the initial 377 MW that we committed to at our IPO in May 2008. We remain on track to deliver our target of 1,250 MW of capacity by 2015.
Profitable operations and strong cash generationOutput levels and operations at Chennai I were successfully stabilised in August 2010 and the plant’s operational performance has been in line with expectations. In the six months to June this year, the plant performed at an average monthly output level of c.85%.
Profit before tax was up 105% to £11.16m, benefiting from a partial contribution from Chennai I which began commercial operations in August 2010. OPG’s strong results for the year ended March 2011 are reflective of the Group captive/open market sales strategy and the profit from continuing operations at 39% of Revenue is among the highest in the industry. Average price realised for the year was Rs 4.95/KWh.
In line with our stated strategy, we intend to continue to utilise cash generated from operations principally to fund growth and optimisation opportunities.
Projects remain on-track despite local challengesThe Group’s current total capacity stands at 113 MW (inclusive of the additional 6 MW of capacity recently added to the gas fired power station at Mayavaram), a significant increase from the 19.4 MW of operating capacity at the time of the IPO in May 2008. The Chennai development projects are progressing well; the accelerated commissioning of the second 77 MW unit (Chennai II) for 2012 is set to increase the Group’s total operating capacity to 190 MW and further progressive increases are expected thereafter to achieve 742 MW by 2013. Some local objections faced in the wake of environmental clearances for the 300 MW Kutch project are now under resolution and we are awaiting formal approval from the Ministry of Environment and Forests, New Delhi. The project, which is fully funded, remains on track for commissioning in 2013.
Also during the year, OPG signed an MoU with the Government of Gujarat to build 5,400 MW of capacity by 2018. Details of specific projects and an implementation schedule are currently in development and we look forward to reporting on further progress in due course.
During the year and since then, the Group continues to operate in an environment of elevated coal prices, administrative challenges in obtaining key approvals and higher interest costs. However, relative to our peer group we believe our margins and our continued growth demonstrate that the Group is well positioned to deal with such challenges through our local relationships and the flexibility incorporated into our business model and plant configurations. We have also incorporated key lessons from previous developments into subsequent projects and as a result we continue to be confident that the Company can deliver a profitable growth pipeline on time and within budget.
Mr Arvind GuptaManaging Director and CEO
Project commissioning schedule (MW)
Calendar Year Total MW 2012 2013 2014 2015
Operations
Mayavaram 26Waste heat 10Chennai I 77
Development
Chennai II 77 77Chennai III 160 160Chennai IV 80 80Bellary 12 12Gujarat 300 300
Pipeline
Pipeline 508 508
Cumulative capacity 1,250 190 742 742 1,250

OPG Power Ventures Plc Annual Report and Accounts 2011_15
Overview
Business Review
Corporate Governance
Financial Statements
Indian power market remains in deficitDespite volatility elsewhere in the global economy, India’s GDP is expected to continue to grow at around 8% in the coming years, resulting in annual power demand growth of 10%. India’s total planned capacity additions as at 31 March 2011 were only 52% of the targeted 78,000 MW and there remains an expected shortfall of 30–35% versus the target by March 2012. This trend points towards continuing and increasing power production deficits which currently run at about 10%.
With the planned additional supply likely to fall acutely short of the 300–315 GW required over the next five years and given the imperative for a correction in pricing by state utilities, we believe this supply constrained environment will prevail and power prices will remain firm.
OPG maintains flexibility in its procurement of coal70% of OPG’s projects under development have committed supplies of Indian coal, with the remaining 30% utilising imported coal. This balance of supply has enabled OPG to establish close working relationships with both domestic and imported coal suppliers, thereby mitigating the threat of coal not being available from any one source.
SummaryOPG has made significant progress in the year, successfully commissioning the 77 MW Chennai I facility, producing significant increases in both revenue and profits. In the current year we expect to benefit from its full year contribution albeit in an environment of high coal prices and borrowing costs. We expect our operating model to provide flexibility with regards to these challenges. Most importantly we believe the profitable operation of Chennai I in 2011 creates a firm platform for the Company’s long-term growth. Accordingly, we feel confident about the delivery of our 2015 target of 1,250 MW.
Arvind Gupta12 August 2011
With coal in relatively short supply, the Indian power sector has unsurprisingly experienced upward price pressure for this key input to the power business. Most Indian power producers, unlike OPG, are reliant on obtaining coal either from the development of coal blocks or entirely on imported coal. In addition, the design of OPG’s boilers allows the use of both high moisture imported and higher ash domestic grades of coal either exclusively or in a blended fuel source. We expect coal prices to remain firm in the short term given the current economic growth rates in Asia, although prices should eventually stabilise in the medium term as coal supplies and demand fall more into line. The Company continues to look for additional opportunities to enhance profitability by optimising its fuel procurement.
TeamOur priority is to provide a safe, healthy working environment for employees and be responsible towards the communities in which we operate.
Our talented team is central to achieving the objectives of the Company. Over the last year the team has built upon its significant experience and knowledge in developing and operating power plants as evidenced by the high load factors being achieved at Chennai I and the continued progression and expansion of the Company’s growth pipeline. We value their commitment and contribution and would like to thank them for their continued efforts.
16_OPG Power Ventures Plc Annual Report and Accounts 2011
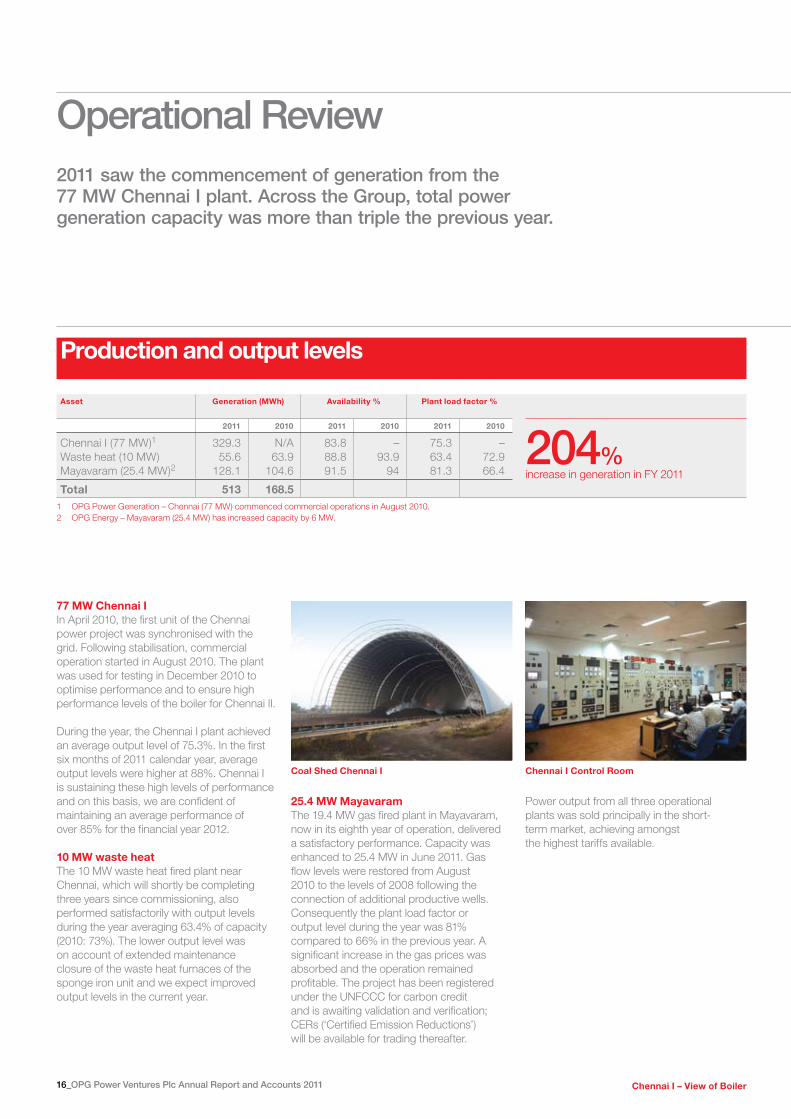
Asset Generation (MWh) Availability % Plant load factor %
2011 2010 2011 2010 2011 2010
Chennai I (77 MW)1 329.3 N/A 83.8 – 75.3 –Waste heat (10 MW) 55.6 63.9 88.8 93.9 63.4 72.9Mayavaram (25.4 MW)2 128.1 104.6 91.5 94 81.3 66.4
Total 513 168.51 OPG Power Generation – Chennai (77 MW) commenced commercial operations in August 2010.2 OPG Energy – Mayavaram (25.4 MW) has increased capacity by 6 MW.
Operational Review
Production and output levels
2011 saw the commencement of generation from the 77 MW Chennai I plant. Across the Group, total power generation capacity was more than triple the previous year.
77 MW Chennai IIn April 2010, the first unit of the Chennai power project was synchronised with the grid. Following stabilisation, commercial operation started in August 2010. The plant was used for testing in December 2010 to optimise performance and to ensure high performance levels of the boiler for Chennai II.
During the year, the Chennai I plant achieved an average output level of 75.3%. In the first six months of 2011 calendar year, average output levels were higher at 88%. Chennai I is sustaining these high levels of performance and on this basis, we are confident of maintaining an average performance of over 85% for the financial year 2012.
10 MW waste heatThe 10 MW waste heat fired plant near Chennai, which will shortly be completing three years since commissioning, also performed satisfactorily with output levels during the year averaging 63.4% of capacity (2010: 73%). The lower output level was on account of extended maintenance closure of the waste heat furnaces of the sponge iron unit and we expect improved output levels in the current year.
25.4 MW MayavaramThe 19.4 MW gas fired plant in Mayavaram, now in its eighth year of operation, delivered a satisfactory performance. Capacity was enhanced to 25.4 MW in June 2011. Gas flow levels were restored from August 2010 to the levels of 2008 following the connection of additional productive wells. Consequently the plant load factor or output level during the year was 81% compared to 66% in the previous year. A significant increase in the gas prices was absorbed and the operation remained profitable. The project has been registered under the UNFCCC for carbon credit and is awaiting validation and verification; CERs (‘Certified Emission Reductions’) will be available for trading thereafter.
Power output from all three operational plants was sold principally in the short-term market, achieving amongst the highest tariffs available.
204%increase in generation in FY 2011
Chennai I Control RoomCoal Shed Chennai I
Chennai I – View of Boiler

OPG Power Ventures Plc Annual Report 2011_17
Overview
Business Review
Corporate Governance
Financial Statements

18_OPG Power Ventures Plc Annual Report 2011

OPG Power Ventures Plc Annual Report and Accounts 2011_19
Overview
Business Review
Corporate Governance
Financial Statements
Development projectsWe are currently developing total capacity at the Chennai site of 317 MW (previously 237 MW) through the following projects:
Chennai II Planning permissions and financial closure are complete for second phase of expansion of 77 MW at the Chennai site and the unit is now under active construction. The civil works for Chennai II have been completed and the construction of main equipment has already commenced and is on course for commissioning by 2012.
Chennai IIIA 160 MW facility, in place of the earlier 2 x 80 MW unit, is under development. This revised configuration will result in savings in coal consumption given the lower turbine/boiler heat rate for a 160 MW unit. At the same time, the reduced footprint of a 160 MW unit makes available space on site for the newly committed Chennai IV. The targeted commissioning date for Chennai III remains 2013. Debt financing is in place, equipment orders are being finalised and equity is available from existing resources. Planning permissions have been obtained and construction will commence shortly.
Chennai IVAn additional 80 MW unit will be added at the present site taking the total expansion of capacity at this location to 317 MW as against 237 MW initially envisaged. The equity component of the required capital expenditure is to be financed from the Group’s internal resources. Planning permission for the development has been obtained and equipment delivery has commenced. The civil works for Chennai IV are in progress. The Company is targeting commissioning in 2013.
GujaratThe Gujarat 2 x 150 MW project has received environmental clearance and construction is to commence once additional clearance from the Ministry of Environment and Forests, New Delhi is received for sea water intake and outfall. The proposal has been cleared by the Expert Committee constituted by the Ministry and the Company is awaiting formal approval shortly. In the meantime, the Company has undertaken the required preparation to ensure this project moves into construction promptly, given its targeted commissioning in 2013.
BellaryDuring the year OPG acquired a partially constructed 12 MW thermal power plant in the industrial area of Bellary, Karnataka. The plant is on a 120-acre site and has the potential to expand/build up to 250 MW of capacity. The 12 MW is expected to commission in 2013.
Operational Review continued
Turbine of Chennai I Coal conveyor belt for Chennai l
Construction of Chennai II and III underway

20_OPG Power Ventures Plc Annual Report and Accounts 2011
Financial ReviewProfitable operations and strong cashflow
Mr V Narayan SwamiFinance Director
Income statement summary
Year ended 31 March 2011 2010 Change
£m £m %
Revenue 33.15 11.52 188%EBITDA 15.54 6.95 124%Net finance costs 1.32 (1.51) –187%Income from continuing operations (before tax,
non-operational and/or exceptional items) 13.01 7.83 66%Pre-operative expenditure on projects
under construction 0.40 1.17 –66%ESOP charge 1.45 1.21 20%
Profit before tax 11.16 5.45 105%Taxation 2.41 1.43 69%
Profit after tax 8.75 4.02 118%
RevenueOPG’s revenue increased to £33.15m, 188% growth year on year, primarily due to the commencement of commercial operations at Chennai I (77 MW) in August 2010.
Gross profitGross profit increased to £14.4m in 2011 (2010: £7.3m). Gross profit was also driven by the contribution of Chennai I since August 2010 and offset by the increase in gas prices and the difference in average exchange rate used in the income statement (1 GBP = Rs 70.96 (2011) and Rs 76.19 (2010)).
Particulars £m
Gross profit in 2011 14.48Gross profit in 2010 7.35Increase in gross profit 7.12
EBITDAEBITDA3 for the year was £15.54m, up 124%, and reconciled with profit after tax as follows:
Year ended 31 March 2011 2010 Change
£m £m %
Profit after tax 8.75 4.02 118%Tax 2.41 1.43 69%Depreciation 1.21 0.63 92%ESOP expenses 1.45 1.21 20%Pre-operating expense 0.40 1.17 –66%Net finance cost 1.32 (1.51) –187%
Total 15.54 6.95 124%3 Excludes exceptional or non-operational items such as the annual charge for stock options which is a non-cash item
or expenses relating to projects under construction.
TaxationThe income tax charge of £2.41m in 2011 (2010: £1.43m) comprises current tax of £2.11m (2010: £1.41m) and deferred tax of £0.30m (2010: £0.02m). The current tax charge has increased by £1m primarily due to the increase in profits which are subject to corporate income tax or Minimum Alternate Tax (‘MAT’) as appropriate. The majority of profits derived from OPG’s operations in India are subject to MAT. MAT is charged on book profits in India at a rate of 19.93% but is available as a credit against corporate income tax in the following 10 years. The deferred tax charge of £0.30m (2010: £0.02m) in 2011 is mainly on account of property, plant and equipment and the impact of depreciation unabsorbed due to timing differences as between book and tax depreciation. The Groups’ 2011 effective tax rate for the year was 22% (2010: 26%).
Non-operational itemsPre-operating expenses represent expenses pertaining to projects under construction charged to the income statement. These expenses in 2010–11 were lower at £0.40m in 2011 (2010: £1.17m) as one major project commenced commercial operation during the year.
Employee stock option charges are linked to share-based payments to certain Directors and are non-cash in nature.
Profits after taxProfits after tax increased by £4.73m representing 118% year on year growth, from £4.02m in 2010 to £8.75m in 2011, as a result of the contribution from the 77 MW Chennai I.
Earnings per shareEPS of 2.129p in 2011 represents an increase of 559% over 2010 on account of higher net earnings attributable to shareholders from Chennai I in which the Group has an economic interest of 99%.

OPG Power Ventures Plc Annual Report and Accounts 2011_21
Overview
Business Review
Corporate Governance
Financial Statements
Property, plant and equipmentProperty, plant and equipment increased during the period by £11.36m, an 18% year on year growth, mainly reflecting the increase in capital work in progress on account of additional power plants in Chennai and Gujarat. Total property, plant and equipment at £73.99m (2010: £62.63m) includes assets under construction amounting to £18.42m (2010: £47.46m) and property, plant and equipment (net of depreciation) amounting to £55.57m (2010: £15.17m). During the year an amount of £40.30m has been capitalised in the Chennai I 77 MW plant.
Current assetsCurrent assets have increased by £68.81m to £132.13m year on year primarily as a result of:
a. An increase of £57m in cash and cash equivalent following the equity placement in February 2011.
b. An increase of £8.9m in inventories and trade and other receivables due to the commencement of operations in the 77 MW power plant.
c. An increase of £2.91m net in investments and other current assets.
Current liabilitiesCurrent liabilities have increased by £5.43m primarily due to the commencement of operations in the 77 MW power plant.
Other non-current liabilitiesOther non-current liabilities have increased by £13.7m primarily on account of an increase in bank borrowing to meet the capital project expenses.
Cash flow
Cash flow 2011 2010
£m £m
Operating cash 15.15 5.77Tax paid (1.97) (1.06)Change in working capital assets and liabilities (9.43) 7.16Purchase of property, plant and equipment (net of disposals) (19.76) (29.02)Other investments 1.41 (10.32)Net cash used in investing activities (18.35) (39.34)Net interest paid (2.65) (0.61)Free cash flow (17.25) (28.07)Equity issued (net) 57.38 –
Total cash change before net borrowings 40.14 (28.07)
Operating cash flow increased from £5.77m in 2010 to £15.15m in 2011, an increase of £9.38m, or 162%. The increase is primarily driven by an increase in operational activity. Net proceeds of £57.4m were from the equity raising February 2011.
Debt and liquidity
2011 2010
£m £m
Gross debt (50.31) (37.33)Cash and cash equivalent 71.10 14.17Investments and other financial assets 8.85 12.98Net cash/(debt) 29.64 (10.18)Total equity 151.03 88.59Gearing % (net debt/(net debt + total equity)) (24%) 10%
The Group has net cash of £29.64m (2010: net debt £10.18m) and negative gearing of 24% (2010: positive gearing of 10%). As development of projects proceeds it is expected that the gearing may turn positive. The borrowings are in respect of the construction of power stations. The Group is in a position to raise borrowings for its power station developments. All of the Group’s debt is denominated in Indian Rupees being the functional currency of its Indian operations.

22_OPG Power Ventures Plc Annual Report and Accounts 2011
Responsible Growth
Health and safetyThe Board is committed to ensuring that the Group’s activities do not result in injury or illness to any employee, contractor or member of the public and strives hard to prevent work-related incidents, illnesses and injuries.
All operating units must comply with our health and safety policies in addition to meeting requirements relevant to their businesses. Specifically, the Group aims to obtain OHSAS 18001 certification for the Chennai plant in the near future. The Board is committed to ensuring that these principles are articulated to all employees and that they are effectively implemented.
Safety policy is implemented at all project sites and operating plants by identifying potential risk areas and taking appropriate steps to mitigate them. These measures include a programme of training for staff and contractors, regular safety meetings and a process to encourage employees to raise their concerns and make suggestions for improving workplace safety.
EnvironmentThe Group’s operations strive to achieve continuous improvements in environmental performance and seek to prevent, mitigate, reduce or offset the environmental impact of our activities. The Group continues to monitor the level of environmental incidents and workplace accidents.
The following environmental initiatives have either been completed during the year or currently being implemented or under review:
1. Fossil fuel in the form of coal or gas is the key natural resource used to generate power at our plants. We constantly strive to improve the efficiency of our power stations by minimising the amount of fuel used for each unit of electricity generated. For example, a 160 MW facility currently under construction in Chennai will result in savings of up to 11% in coal consumption. Recycling of waste materials is another important focus. The Chennai plant has achieved 100% utilisation of fly
ash and bottom ash by disposing these to cement and brick manufacturers;
2. The Chennai Plant and Kutch Plants are located in areas where fresh water resources are limited and therefore dry cooling and sea water systems respectively have been installed which dramatically reduce the quantity of fresh water utilised, hence saving scarce resources;
3. Green initiatives are being implemented at the Chennai plant with an emphasis on harvesting rain water, recharging ground water and energy conservation in the non-process area. This process is anticipated to take between 12 and 18 months after which the Group expects that the plant will be certified by the Indian Green Building Council; and
4. The Maruthur plant has received ISO 14001 certification (environmental management standards) and the Chennai plant is currently undertaking the same process.
We understand that our approach to tackling global warming and reducing carbon emissions is important to future business competitiveness. With this in mind, we have registered under the United Nations Framework Convention on Climate Change and are awaiting the validation and verification of the Carbon Emissions Reduction registration for the Mayavaram gas plant and the Voluntary Emissions Reductions registration for the 10 MW waste heat plant.
EmployeesThe Group is committed to investing in the training and development of our people in order to attract and retain staff with the necessary talent to help the business achieve its growth potential and competitive edge.
Effective internal communication is essential to ensure employees receive accurate information on the Group’s strategy, major initiatives, corporate developments and industry-specific issues.
Our people priorities include building the Group’s reputation as an “Employer of
Choice”. This involves establishing a clear link between performance and rewards, helping employees achieve their desired level of work/life balance and continuing to invest time and effort in building strong relations with employees at all levels.
CommunityThe Group recognises the importance of engaging with the communities in which we operate. As the case study opposite illustrates, it encourages operating units to develop their own corporate social involvement plans in consultation with stakeholders in order to identify programmes with tangible and sustainable community benefits in line with our corporate social involvement policy.
We recognise that we owe a duty of care towards the environment and society. We have a responsibility to conduct our business with sensitivity for the environment, specifically where our business has a direct impact. We follow fair and ethical principles to govern the way we manage and conduct our business.
The Company takes seriously its responsibilities to the environment and the communities in which it operates. We believe that these responsibilities can have a positive impact on shareholder returns as well as on our reputation and growth prospects.

OPG Power Ventures Plc Annual Report and Accounts 2011_23
Overview
Business Review
Corporate Governance
Financial Statements
OPG Outreach, in collaboration with the Bhadreshwar local council and Welspun Company, launched an initiative to empower women and contribute to the sustainable development of the area.
The main purpose of the program, ‘Shree Sakhi Swarnim Talim Kendra’ is two-fold. First, to provide women with vocational training and ensure that they have self-employment opportunities. After training, they will be provided with employment and the programme will monitor the quality of the goods they produce. Second, the programme will be responsible for fair marketing of the goods produced, ensuring that the income generated has a significant impact on livelihood of the women’s families.
Launch of OPG Outreach
OPG has provided the entire infrastructure for the training centres along with all the required equipment, utilities and supplies. In the short time since commencement of the programme, 32 women have completed their training at our centre and have started producing goods. Presently, 210 women are enrolled at the centre and we expect that, going forward, the centre will be a strong advocate for the socio-economic development of the surrounding community and families.

24_OPG Power Ventures Plc Annual Report and Accounts 2011
Board of Directors
Mr V Narayan Swami (6) Mr P Michael Grasby (4) Mr Arvind Gupta (2) Mr Ravi Gupta (5) Mr Martin Gatto (3) Mr Munish C Gupta (1)

OPG Power Ventures Plc Annual Report and Accounts 2011_25
Overview
Business Review
Corporate Governance
Financial Statements
1. Mr Munish C GuptaNon-executive Chairman
Mr Munish C Gupta is a retired senior civil servant of the Indian Administrative Service, the premier civil service of India. During his service, Mr Gupta held a number of senior appointments, notably those of Secretary, Ministry of Industry, Government of India and Chief Secretary to the Government of Haryana State. As Secretary to the Ministry of Industry, Mr Gupta was one of the civil service officers responsible for initiating and implementing the process of economic reforms which began in the 1990s in India and which continue to this day.
Mr Gupta serves on the boards of a number of public companies in India including Bhansali Engineering Polymers Ltd and Lumax Industries Ltd as an independent director. Mr Gupta is not related to either Arvind or Ravi Gupta.
3. Mr Martin GattoSenior Independent Non-executive Director
Mr Martin Gatto has considerable experience as a senior financial professional and has worked at a number of large UK quoted public companies . During his career, Mr Gatto gained international experience at Hilton International Company where he was responsible for business development and property. Later, as Chief Financial Officer of British Energy plc, Midlands Electricity plc and Somerfield plc, he was responsible for the successful execution of turnaround strategies. Until recently, Mr Gatto was Non-Executive Chairman of Neutrahealth plc, an AIM-listed company.
He is a graduate of Brunel University and is a Fellow of the Chartered Institute of Management Accountants.
2. Mr Arvind GuptaManaging Director and Chief Executive Officer
Mr Arvind Gupta graduated with a degree in Commerce at the University of Madras and joined the OPG family business, OPG Enterprises, in 1979. Mr Gupta gained experience in various divisions of the business including flour milling, steel production and logistics, becoming President of Kanishk Steel, listed on the Bombay Stock Exchange. Having identified the opportunities in power generation, Mr Gupta developed this division within Kanishk Steel with initial projects in wind power generation in 1994. He was the pioneer of the Group Captive power producer concept in Tamil Nadu State and developed the 18MW gas fired plant of OPG Energy, a Group entity, through to successful operation in 2004.
Since then, Mr Gupta has been responsible for the construction and development of the power plants of the OPG Group as well as its overall strategy, growth and direction.
4. Mr P Michael GrasbyIndependent Non-executive Director
Mr P Michael Grasby is a Chartered Engineer and has been associated with the UK and international power industry for many years. He was manager of the Drax Power Station between 1991 and 1995 and Director of Operations for National Power, with responsibilities for over 16,000 MW of generating capacity, until 1998. Following the demerger of National Power in 1999, he joined International Power as Senior Vice-President for global operations and retired in 2002.
Mr Grasby has held power company directorships in the Czech Republic, Portugal, Turkey and Pakistan. Mr Grasby was formerly a Non-executive Director of Drax plc until April 2011 where he chaired the Health and Safety Committee and sat on the Audit, Remuneration and Nominations Committees.
5. Mr Ravi GuptaNon-executive Director
Mr Ravi Gupta is the brother of Mr Arvind Gupta and throughout his career has been involved with family businesses. He is one of the founders of Kanishk Steel and is Chairman of that company. Mr Gupta has also been associated with the flour milling industry, setting up a new flour mill in 1988 in Tamil Nadu State, Salem Food Products Limited, where he is Managing Director.
6. Mr V Narayan SwamiFinance Director
Mr V Narayan Swami has over 30 years’ experience of finance and management. Mr Swami started his career with the State Bank of India before moving to Ashok Leyland Limited in 1976. For ten years until 1992, he held a variety of positions within Standard Chartered Bank including as Senior Manager, Corporate Division for Southern India. Later Mr Swami joined Essar Global, subsequently becoming CFO of Essar Telecom Group where he played a key role in the entry and planned exit of Swisscom from the venture along with the simultaneous investment by Hutchinson Whampoa.
Mr Swami was group CFO of Best & Crompton Engineering, listed on the Bombay Stock Exchange, before joining the Group in 2007 as Finance Director.

26_OPG Power Ventures Plc Annual Report and Accounts 2011
Corporate Governance
IntroductionThe Board is committed to good corporate governance practices. The Company was admitted to trading on AIM in May 2008. Accordingly, compliance with the governance framework contained in the UK Corporate Governance Code published by the Financial Reporting Council (the ‘Code’) is not mandatory. Nevertheless, the Company remains committed to high standards of corporate governance and seeks to comply with the Code the extent practicable for a public company of its size.
This report describes how the Company has applied, or how it intends to apply, the principles set out in the Code.
Statement of complianceSince admission to AIM, the Board has taken a number of steps to comply with the Code with the longer term objective of achieving full compliance in all material respects. The Board continues to make progress in this regard and is, during the current financial year, considering the following initiatives:
1. Schedule of Matters Reserved (A.1.1)The Board has agreed to establish a formal schedule of matters specifically reserved to it for decision which will set out those matters requiring Board approval.
2. Non-executive Directors (A.4.2)The Board is currently considering the requirements that the Chairman holds formal meetings with the Non-executive Directors without the executives present and the Non-executive Directors meet without the Chairman to appraise the Chairman’s performance.
3. Nominations Committee (B.1)The Board, at an appropriate time, will establish a Nominations Committee, which will meet as and when required, its primary function being to provide a formal and transparent procedure for the appointment of new directors to the Board and to advise generally on issues relating to Board composition and balance. In appropriate cases, recruitment consultants may be used to assist in the process.
4. Development and evaluation (B.4/B.6)Upon the establishment of a Nominations Committee there will be a formal process by which directors receive a full, formal and tailored induction on joining the Board. A full evaluation of the Board, its committees and the individual directors will take place during the current financial year.
5. Audit and Remuneration Committees: independence (C.3.1 and D.2.1)The Code states that audit and remuneration committees should comprise at least three or, in the case of smaller companies, two independent non-executive directors. Munish Gupta, Michael Grasby and Martin Gatto are considered to be independent under the Code. However, Ravi Gupta does not meet the independence criteria set down in the Code. Mr Gupta is the brother of Arvind Gupta, Managing Director and CEO. Nevertheless, the Board considers him to be of an independent cast of mind and, as a founder and chairman of Kanishk Steel (listed on the Bombay Stock Exchange since 1991), his industry experience to be of particular relevance and value to the deliberations of the Board and its committees.
Operation of the BoardBoard of DirectorsThe Board comprises the following individuals:
Executive1. Arvind Gupta (Managing Director and Chief Executive Officer); and2. V Narayan Swami (Finance Director).
Non-executive1. Munish Gupta (Non-executive Chairman);2. Martin Gatto (Senior Independent Director);3. Michael Grasby; and4. Ravi Gupta.
The Board considers that, as at the date of this report, it complies with Code provision B.1.2, which requires that, in the case of smaller companies, there should be a minimum of two independent non-executive directors. The Chairman, Michael Grasby and Martin Gatto are considered to be independent under the Code.
Biographical details of all the Directors at the date of this report are set out on page 25. The Board is responsible for setting the Company’s objectives and policies, and providing effective leadership and the controls required for a publicly listed company. Directors receive reports on the Group’s operations to ensure that they remain briefed on the latest developments and are able to make fully informed decisions. The Board met four times during the year under review. Board meetings were held in the Isle of Man, Chennai and Sri Lanka.

OPG Power Ventures Plc Annual Report and Accounts 2011_27
Overview
Business Review
Corporate Governance
Financial Statements
All Directors have access to the advice and services of the Company Secretary, who is responsible for ensuring that Board procedures are followed and that applicable rules and regulations are complied with.
Directors have the right to request that any concerns they have are recorded in the appropriate committee or Board minutes.
The Company maintains Directors’ and Officers’ Liability Insurance and indemnity cover, the level of which is reviewed annually.
Chairman and Chief Executive OfficerThe roles of the Chairman and Chief Executive Officer are held by different individuals and there is a clear separation of roles. The Chairman’s key responsibilities are the effective running of the Board, ensuring that the Board plays a full and constructive part in the development and determination of the Group’s strategy, and overseeing the Board’s decision-making process. The Chairman’s other current responsibilities are set out in the biographical notes on page 25. The key responsibilities of the Chief Executive Officer are managing the Group’s business, proposing and developing the Group’s strategy and overall commercial objectives in consultation with the Board and, as leader of the executive team, implementing the decisions of the Board and its Committees.
Re-election of DirectorsAt every AGM, one-third of the Directors for the time being (excluding any Director appointed since the previous AGM) or, if their number is not three or a multiple of three, the number nearest to one-third, shall retire from office by rotation. On this basis, Ravi Gupta and Munish Gupta will offer themselves for re-election at the AGM on Tuesday 27 September 2011.
Information and professional developmentPreliminary to the Company’s admission to AIM in May 2008, all Directors received a briefing from the Company’s nominated advisor of their duties, responsibilities and liabilities as a director of an AIM company. Directors are encouraged to keep abreast of developments and attend training courses to assist them with their duties.
In addition to the formal meetings of the Board, the Chairman maintains contact with the other Non-executive Directors to discuss any issues of concern they may have relating to the Group or as regards their area of responsibility and to keep them fully briefed on ongoing matters relating to the Group’s operations.
The Company Secretary, in consultation with the Chairman and Chief Executive Officer will in due course develop an induction process for each new director tailored to their individual knowledge and experience.
Board performanceSince the Company’s admission to AIM in May 2008, the Board has had an opportunity to develop a working relationship to the extent that a meaningful evaluation of the Board, its committees and the individual directors can now take place. Accordingly, the Board has agreed to establish a procedure for evaluating the performance of the Board, its committees and the individual directors and the results of the appraisal, together with any recommendations for improving effectiveness, to be presented by the Chairman to the whole Board for discussion.

28_OPG Power Ventures Plc Annual Report and Accounts 2011
Corporate Governance continued
Meetings of the Board and its CommitteesThe following table sets out the number of meetings of the Board and its Committees during the year under review and individual attendance by the relevant members at these meetings:
Board meetings Board committee meetings
Audit Remuneration
Number Attended Number Attended Number Attended
Arvind Gupta 4 4 – – – –
Narayan Swami 4 4 – – – –
Munish Gupta 4 4 2 2 – –
Martin Gatto 4 4 2 2 – –
Michael Grasby 4 3 2 1 – –
Ravi Gupta 4 4 2 1 – –
Number of meetings held during the year 4 2 0
Board committeesAudit CommitteeThe members of the Audit Committee are Munish Gupta, Martin Gatto, Michael Grasby and Ravi Gupta. Martin Gatto is considered to have recent, relevant financial experience. The Chief Executive and Finance Director and a representative of the auditors are normally invited to attend meetings of the Committee.
The primary duty of the Audit Committee is to oversee the accounting and financial reporting process of the Group, the external audit arrangements, the internal accounting standards and practice, the independence of the external auditor, the integrity of the Group’s external financial reports and the effectiveness of the Group’s risk management and internal control system. At least once a year the Audit Committee will also meet the Group’s external auditors without management present.
The Audit Committee has considered the following matters during the year under review:
the appointment of Grant Thornton as auditors to the Company; and –reviewing the integrity of the Group’s preliminary and interim results –announcements and any other formal announcement relating to its financial performance.
The terms of reference of the Audit Committee are available on the Company’s website, www.opgpower.com.
Remuneration CommitteeThe members of the Remuneration Committee are Munish Gupta, Martin Gatto, Michael Grasby and Ravi Gupta.
The primary duty of the Remuneration Committee is to determine and agree with the Board the framework or broad policy for the remuneration of the Executive Directors, senior managers and such other members of the executive management team of the Group as is deemed appropriate. The remuneration of the Non-executive Directors is a matter for the Chairman and the executive members of the Board. No Director may be involved in any decisions as to their own remuneration. The Remuneration Committee did not meet during the year under review.
Full details of the role and composition of the Remuneration Committee, the remuneration policy of the Company and its compliance with the Code Provisions relating to remuneration are set out in the Directors’ Remuneration Report on pages 30 to 33.
The terms of reference of the Remuneration Committee may be found on the Company’s website, www.opgpower.com.
Accountability and auditRisk management and internal controlThe Board has overall responsibility for the Group’s system of internal control which includes risk management. The Board and Audit Committee are responsible for reviewing the effectiveness of its internal control systems. The Audit Committee will review these systems, authorisation of expenditure, fraud and the internal audit plan, on an annual basis.
The system of internal control is designed to manage, rather than eliminate, the risk of failure to achieve business objectives and can only provide reasonable and not absolute assurance against material misstatement or loss.
The Board plans to establish a formal process for identifying, evaluating and managing the significant risks the Group faces since admission to AIM and which is in accordance with the current guidance on internal control. The Audit Committee will assist the Board in discharging its review responsibilities. A summary of the key risks facing the Group and mitigating actions is described on pages 12 and 13.

OPG Power Ventures Plc Annual Report and Accounts 2011_29
Overview
Business Review
Corporate Governance
Financial Statements
AssuranceWith Grant Thornton only having been appointed during the year, the Committee considered it too early to review their independence and effectiveness but will do so during the current financial year. The Committee considers that, at this early stage in the Group’s development, it is more efficient to use a single audit firm to provide certain non-audit services for transactions and tax matters. However, to regulate the position, the Committee will establish a policy on the provision of non-audit services by the external auditor.
Going concernThe Group closely monitors and manages its liquidity risk. In assessing the Group’s going concern status, the Directors have taken account of financial position of the Group, anticipated future trading performance, its bank and other facilities, its capital investment plans and forecast gross operating margins.
The Group requires funds both for short-term operational needs as well as for long-term investment programmes mainly in growth projects. The Group generates sufficient cash flows from its current operations which, together with the available cash and cash equivalents and liquid financial asset investments, provide liquidity both in the short-term as well as in the long-term. The IPO in 2008 and our recent equity raising of c.£60 million in February 2011 have further strengthened the Group’s financial position and, are expected to be sufficient to meet the ongoing capital investment programme and liquidity requirement of the Group in the foreseeable future ability to meet its financial obligations as they fall due.
On this basis, after making appropriate enquiries, the Directors consider that the Group has adequate resources to continue in operational existence for the foreseeable future. Accordingly, they continue to adopt the going concern basis in preparing the 2011 accounts.
Shareholder relations and the AGMThe Chief Executive and Finance Director met with a number of key investors during the year, accompanied by Non-executive Directors as appropriate.
The Chairman will be primarily responsible for ensuring the effective communication of shareholders’ views to the Board as a whole and will update the Board accordingly. Board members will continue to keep in touch with shareholder opinion.
The AGM of the Company will be an opportunity to communicate with shareholders and the Board welcomes their participation. The chairmen of the Remuneration and Audit Committees will be present at the Annual General Meeting to answer questions. The voting results will be made available on the Company’s website following the meeting.
Corporate information including the Annual Report and other financial information and announcements will be made available on the Company’s website at www.opgpower.com.

30_OPG Power Ventures Plc Annual Report and Accounts 2011
Directors’ Remuneration Report
IntroductionThis report sets out information about the remuneration of the Directors of the Company for the year ended 31 March 2011. This report has been substantially prepared in accordance with Schedule 8 of the Large and Medium-sized Companies and Groups (Accounts and Reports) Regulations 2008 (the ‘Regulations’) in line with the relevant requirements of the Financial Services Authority’s Listing Rules. Part II of this report has been audited by Grant Thornton in accordance with the Regulations.
Part 1 – unaudited informationRemuneration CommitteeThe members of the Remuneration Committee are Martin Gatto (Chairman), Munish Gupta, Ravi Gupta and Michael Grasby who, with the exception of Ravi Gupta, are all independent Non-executive Directors.
Terms of reference have been approved for the Remuneration Committee and its primary duty is to determine and agree with the Board the framework or broad policy for the remuneration of the Executive Directors, senior managers and such other members of the executive management team of the Group as is deemed appropriate. The remuneration of the Non-executive Directors is a matter for the Chairman and the executive members of the Board.
The main responsibilities of the Committee are to:assess and set compensation levels for Executive Directors and –senior managers;review the ongoing appropriateness and relevance of the –remuneration policy to ensure that members of the executive team are provided with incentives that encourage enhanced performance;approve the design of, and determine targets for, any performance- –related pay schemes operated by the Group and to approve the amounts paid annually under such schemes;review the design of share incentive plans for the approval of the –Board and shareholders;determine the policy for, and scope of, pension arrangements for –each Executive Director and senior manager; andensure that contractual terms on termination are such that failure is –not rewarded and that the duty to mitigate losses is fully recognised in the drafting of directors’ service agreements and letters of appointment.
In fulfilling these duties, the Committee shall be cognisant of remuneration trends across the Group and within the sector in which the Group operates.
The Chairman of the Board and the Chief Executive Officer and external advisors may be invited to attend meetings of the Remuneration Committee but do not take part in the decision making.
The terms of reference of the Remuneration Committee are available on the Company’s website, www.opgpower.com.
AdvisorsThe Remuneration Committee has not, to date, appointed any advisors to assist it in formulating the Group’s remuneration policy.
Remuneration policyThe Remuneration Committee has agreed a remuneration policy to ensure that the Company is able to attract, retain, and motivate its Executive Directors and senior management.
The retention of key management and the alignment of management incentives with the creation of shareholder value are key objectives of this policy.
The Group operates in a highly competitive environment. For the Group to continue to compete successfully, it is essential that the level of remuneration and benefits offered achieve the objectives of attracting, retaining, motivating and rewarding the necessary high calibre of individuals at all levels across the Group.
The Group therefore sets out to provide competitive remuneration to all its employees, appropriate to the business environment in the market in which it operates. To achieve this, the remuneration package is based upon the following principles:
total rewards should be set to provide a fair and attractive –remuneration package;appropriate elements of the remuneration package should be –designed to reinforce the link between performance and reward; andExecutive Directors’ incentives should be aligned with the interests –of shareholders.
The remuneration strategy is designed to be in line with the Group’s fundamental values of fairness, competitiveness and equity and also to support the Group’s corporate strategy. A cohesive reward structure consistently applied and with links to corporate performance, is seen as critical in ensuring attainment of the Group’s strategic goals.
The Group also seeks to align the interests of shareholders with those of Executive Directors and senior employees by giving the latter opportunities and encouragement to build up a shareholding interest in the Company through the stock option plan approved by the Board on 16 July 2009 (the ‘Stock Option Plan’).

OPG Power Ventures Plc Annual Report and Accounts 2011_31
Overview
Business Review
Corporate Governance
Financial Statements
Long-Term IncentivesThe Remuneration Committee believes that it is appropriate to operate share incentive schemes to encourage Executive Directors and senior employees to meet the Group’s long-term strategic and financial objectives set by the Board.
Stock Option PlanThe Executive Directors, excluding the Chairman and other senior management, may be granted awards under the stock option plan approved by the Board on 16 July 2009. Options granted must be exercised within 10 years of the date of grant and vesting depends on achievement of the following performance conditions:1. The power plant at Kutch in the state of Gujarat must have been in commercial operation for three months; and2. The closing share price must be at least £1 for three consecutive business days.
Annual bonusNo bonuses were paid during the year.
Service agreements, notice periods and termination paymentsThe service agreements for the Executive Directors are for no fixed term and may in normal circumstances be terminated on the notice periods set out in the table below. The Company reserves the right and discretion to pay the Executive Directors in lieu of notice. If the Company terminates the employment of an Executive Director by exercising its right to pay in lieu of notice, the Company is required to make a payment equal to the aggregate of basic salary and the cost to the Company of providing other contractual benefits for the unexpired portion of the duration of any entitlement to notice.
The key terms of the Executive Directors’ service agreements are as follows:
Name Position Date of contract Current salary (p.a.) £
Arvind Gupta Managing Director and Chief Executive Officer 23 May 2008 169,109
V Narayan Swami Finance Director 23 May 2008 50,734
Benefits-in-kindUnder their service agreements, Mr Gupta and Mr Swami are entitled to medical, travel and related insurance and accommodation allowances in connection with work activities.
PensionsThe Group does not operate a pension scheme. In the event, that the Group establishes a scheme, it will be matter for the Committee to determine the level of contribution payable by the executives and Group respectively based on actuarial advice.
Chairman and Non-executive DirectorsThe remuneration of the Chairman of the Company and the Non-executive Directors consists of fees that are paid monthly in arrears. The Chairman and Non-executive Directors do not participate in any long-term incentive or annual bonus schemes, nor do they accrue any pension entitlement. Neither the Chairman nor any of the Non-executive Directors has a contract of employment with the Company. Each has instead entered into a contract for services with the Company.
Non-executive Directors’ contracts for servicesNon-executive Directors were appointed for an initial term of 12 months. Munish Gupta, Martin Gatto, Michael Grasby and Ravi Gupta have each signed a contract for services with the Company. They were each appointed for an initial period of 12 months and, under the terms of their contracts for services, their appointments were renewable for a further period by mutual agreement, subject to re-election, when appropriate, by the Company in general meeting. Following a formal process for evaluating the performance of the Board as noted in the report on corporate governance, its committees and the individual directors, this will be addressed during the current year.

32_OPG Power Ventures Plc Annual Report and Accounts 2011
Directors’ Remuneration Report continued
The Non-executive Directors’ fees have been set at a level to reflect the time commitment and level of involvement that they are required to make in the activities of the Board and its committees.
The key terms of the Non-executive Directors’ letters of appointment are as follows:
Director Date of appointment Fees p.a. £
Munish Gupta Non-executive Chairman 6 May 2008 25,000
Martin Gatto Non-executive Director 6 May 2008 25,000
Michael Grasby Non-executive Director 6 May 2008 25,000
Ravi Gupta Non-executive Director 12 May 2008 25,000
The remuneration of the Non-executive Directors consists of fees that are paid quarterly. The Non-executive Directors do not participate in the Employee Share Plan nor do they accumulate any pension entitlements.
External appointmentsIt is the Board’s policy to allow the Executive Directors to accept directorships of other companies provided that they have obtained the consent of the Board. Any such directorships must be formally notified to the Board.
Directors’ interests in ordinary sharesThe interests of Directors in the ordinary share capital of the Company during the year were as follows:
31 March 2011
1 April 2010
Gita Investments Limited* 153,061,225 153,061,225
Gita Power Inc* 17,006,802 17,006,802
Sri Hari Vallabha Enterprises & Investments Private Limited* 3,401,361 3,401,361
Dhanvarsha Enterprise & Investments Private Limited* 2,551,020 2,551,020
Goodfaith Vinimay Private Limited* 2,551,020 2,551,020
Michael Grasby 5,000 5,000
Martin Gatto 50,000 50,000
Total 178,626,428 178,626,428
Note:* Beneficial interest in these shareholdings vests with Arvind Gupta.
There were no changes to Directors’ interests between 31 March 2011 and the date of this report.
No Director had any interest in any contract of significance with the Group during the year ended 31 March 2011 other than their service contracts.
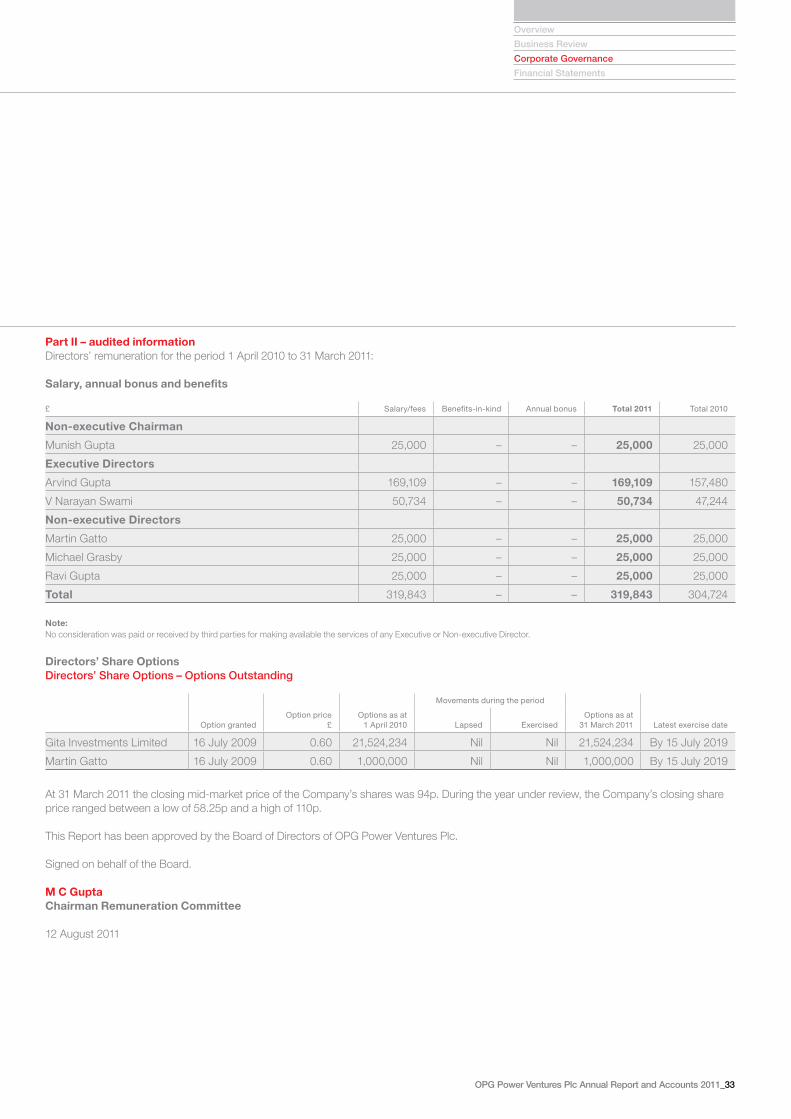
OPG Power Ventures Plc Annual Report and Accounts 2011_33
Overview
Business Review
Corporate Governance
Financial Statements
Part II – audited informationDirectors’ remuneration for the period 1 April 2010 to 31 March 2011:
Salary, annual bonus and benefits
£ Salary/fees Benefits-in-kind Annual bonus Total 2011 Total 2010
Non-executive Chairman
Munish Gupta 25,000 – – 25,000 25,000
Executive Directors
Arvind Gupta 169,109 – – 169,109 157,480
V Narayan Swami 50,734 – – 50,734 47,244
Non-executive Directors
Martin Gatto 25,000 – – 25,000 25,000
Michael Grasby 25,000 – – 25,000 25,000
Ravi Gupta 25,000 – – 25,000 25,000
Total 319,843 – – 319,843 304,724
Note:No consideration was paid or received by third parties for making available the services of any Executive or Non-executive Director.
Directors’ Share OptionsDirectors’ Share Options – Options Outstanding
Movements during the period
Option grantedOption price
£Options as at
1 April 2010 Lapsed ExercisedOptions as at
31 March 2011 Latest exercise date
Gita Investments Limited 16 July 2009 0.60 21,524,234 Nil Nil 21,524,234 By 15 July 2019
Martin Gatto 16 July 2009 0.60 1,000,000 Nil Nil 1,000,000 By 15 July 2019
At 31 March 2011 the closing mid-market price of the Company’s shares was 94p. During the year under review, the Company’s closing share price ranged between a low of 58.25p and a high of 110p.
This Report has been approved by the Board of Directors of OPG Power Ventures Plc.
Signed on behalf of the Board.
M C GuptaChairman Remuneration Committee
12 August 2011

34_OPG Power Ventures Plc Annual Report and Accounts 2011
Directors’ Report
The Directors present their report, together with the audited financial statements of the Group, for the year ended 31 March 2011.
1 IncorporationThe Company is incorporated and domiciled in the Isle of Man.
2 Principal activitiesThe principal activities of the Group are developing, owning and operating power stations in India. Electricity generated from its plants is sold principally to captive consumers or in the open market in India and to the State Electricity Board.
The subsidiary and associated undertakings principally affecting the results or net assets of the Group in the year are listed in note 3.3 to the financial statements.
3 Business reviewA review of the Company’s business, its principal activities and future development can be found in the pages listed below and are incorporated into this report by reference:i. Key performance indicators on page 7;ii. Chairman’s and CEOs’ statements on pages 10, 14 and 15;iii. The Operational Review, including details of the main trends and
factors likely to affect the future development, performance and position of the business, on pages 16 to 19; and
iv. The Responsible Growth Report on pages 22 and 23.
The Business Review has been prepared to provide the Company’s shareholders with a fair review of its business and a description of the principal risks and uncertainties facing it. It may not be relied upon by anyone, including the Company’s shareholders, for any other purpose.
Information about the use of financial instruments by the Group is given in note 25 to the consolidated financial statements.
Details of significant events since the year end date are contained in note 28 to the financial statements.
4 DividendsThe Financial Statements for the year ended 31 March 2011 are set out on pages 37 to 66. The Board does not recommend the payment of a final dividend, considering the need to conserve cash for the continuing expansion of the business. No dividend was paid for the half year to 30 September 2010 (no dividend was paid for the year ended 31 March 2010).
5 DirectorsDetails of changes to the Board during the period and of the directors offering themselves for re-election at the forthcoming AGM are set out in the Corporate Governance Report on page 27.
Details of Directors’ service agreements are set out in the Directors’ Remuneration Report on pages 31 and 32.
The interests of the Directors in the shares of the Company are shown in the Directors’ Remuneration Report on page 32.
Biographies of all the Directors at the date of this report are set out on page 25.
6 Directors’ indemnitiesAs at the date of this report, indemnities are in force under which the Company has agreed to indemnify the Directors to the extent permitted by applicable law and the Company’s Articles of Association in respect of all losses arising out of, or in connection with, the execution of their powers, duties and responsibilities as Directors of the Company or any of its subsidiaries.
7 Supplier payment policyThe Group’s policy is to agree terms of payment with suppliers when agreeing the terms of each transaction and ensure that suppliers are made aware of, and abide by, the terms of payment.
8 Fixed assetsIn the opinion of the Directors, there is no material difference between the book value and the current open market value of the Group’s interests in land and buildings.
9 Substantial shareholdingsThe Company has been notified of the following interests in 3% or more of the Company’s total voting rights at 31 March 2011:
Percentage of voting rights
and issued share capital
Number of ordinary shares
Gita Investments Limited 50.80% 178,576,428
M&G Investment Management Limited 10.04% 35,286,469
Audley Capital Advisors LLP 8.66% 30,435,650
Legal & General Investment Management Limited 6.09% 21,411,465
FOUR Capital Partners Limited 4.18% 14,680,777

OPG Power Ventures Plc Annual Report and Accounts 2011_35
Overview
Business Review
Corporate Governance
Financial Statements
10 AGMThis year’s AGM will be held at our registered offices on Tuesday 27 September 2011 at 11.30am. The notice convening the meeting, together with details of the special business to be considered is contained in a separate document sent to shareholders. It is also available on the Company’s website, www.opgpower.com, where a copy can be viewed and downloaded in a pdf format which may be printed or saved by following the link to the Investor Centre/Shareholder Circulars.
11 EmployeesThe number of employees within the Group as at 31 March 2011 were 122.
12 Audit informationEach Director serving at the date of approval of the financial statements confirms that:1. to the best of their knowledge and belief, there is no information
relevant to the preparation of their report of which the Company’s auditors are unaware; and
2. each Director has taken all the steps a director might reasonably be expected to have taken to be aware of relevant audit information and to establish that the Company’s auditors are aware of that information.
13 AuditorsGrant Thornton, have expressed their willingness to continue in office as auditors and a resolution proposing their re-appointment will be proposed at the forthcoming AGM.
14 Additional informationArticles of AssociationThe following narrative summarises information relating to certain provisions in the Company’s Articles and applicable Isle of Man law concerning companies (the Companies Act 2006 as amended by the Isle of Man Companies (Amendment) Act 2009 (the ‘Act’). This is a summary only and the relevant provisions of the Act or the Articles should be consulted if further information is required.
Share capital structureDetails of the issued share capital, together with fresh issued share capital are shown in note 16 to the consolidated financial statements.
The Company has one class of ordinary share which carries no right to fixed income. Each share carries the right to one vote at general meetings of the Company. Under its Articles, the Directors have authority to issue on a non-pre-emptive basis up to 15% of the Company’s share capital in each financial year.
There are no specific restrictions on the size of a holding nor on the transfer of shares, which are both governed by the general provisions of the Articles and prevailing legislation. The directors are not aware of any agreements between the holders of the Company’s shares that may result in restrictions on the transfer of securities or on voting rights. No person has any special rights of control over the Company’s share capital and all issued shares are fully paid.
The Company made no purchases of its own ordinary shares during the year.
A resolution will be proposed at the forthcoming AGM seeking shareholder approval to authorise the Company to make market purchases of its own shares. Such authority will be exercised having regard to applicable guidelines of the Investor Protection Committees.
Details of share schemes are set out in note 17 to the consolidated financial statements and in the Directors’ Remuneration Report on pages 31 and 33.
Powers of the directorsWith regard to the appointment and replacement of directors, the Company is governed by its Articles, the Act and related legislation. The Articles themselves may be amended by special resolution of the shareholders. The powers of the directors are described in the Corporate Governance Report on page 26.
By order of the Board
Philip ScalesCompany SecretaryOPG Power Ventures PlcIOMA HouseHope StreetDouglasIsle of ManIM1 1AP
12 August 2011

36_OPG Power Ventures Plc Annual Report and Accounts 2011
Statement of Directors’ Responsibilities in Respect of the Accounts
The Directors are responsible for preparing the Annual Report, the Directors’ Remuneration Report and the Group and the Parent Company financial statements. The Directors are required to prepare financial statements for the Group in accordance with International Financial Reporting Standards (‘IFRS’) as adopted for use in the European Union and have also elected to prepare financial statements for the Company in accordance with IFRS as adopted for use in the European Union. Company law requires the Directors to prepare such financial statements in accordance with IFRS and the Companies Act 2006.
International Accounting Standard 1 requires that financial statements present fairly for each financial year the Group’s and Company’s financial position, financial performance and cash flows. This requires the fair presentation of the effects of transactions, other events and conditions in accordance with the definitions and recognition criteria for assets, liabilities, income and expenses set out in the International Accounting Standards Board’s ‘Framework for the Preparation and Presentation of Financial Statements’. In virtually all circumstances, a fair presentation will be achieved by compliance with all applicable International Financial Reporting Standards. Directors are also required to:
select suitable accounting policies and apply them consistently; –make judgements and estimates that are reasonable and prudent; –state whether applicable accounting standards have been followed, –subject to any material departures disclosed and explained in the financial statements;present information, including accounting policies, in a manner that –provides relevant, reliable, comparable and understandable information; andprovide additional disclosures when compliance with specific –requirements in IFRS is insufficient to enable users to understand the impact of particular transactions, other events and conditions on the entity’s financial position and financial performance.
The Directors are responsible for keeping adequate accounting records which disclose with reasonable accuracy at any time the financial position of the Group and of the Company, for safeguarding the assets, for taking reasonable steps for the prevention and detection of fraud and other irregularities.
The Directors are responsible for the maintenance and integrity of the Group website. Legislation in the United Kingdom governing the preparation and dissemination of the financial statements may differ from legislation in other jurisdictions.

OPG Power Ventures Plc Annual Report and Accounts 2011_37
Overview
Business Review
Corporate Governance
Financial Statements
Independent Auditors’ Report to the Members of OPG Power Ventures Plc
We have audited the accompanying Group and Company financial statements of OPG Power Ventures Plc for the year ended 31 March 2011 which comprise the Consolidated and Company Statement of Comprehensive Income, the Consolidated and Company Statement of Financial Position, the Consolidated and Company Statement of Changes in Equity, the Consolidated and Company Statements of Cash Flow and the related notes. The financial reporting framework that has been applied in their preparation is applicable law and International Financial Reporting Standards (IFRS) (as adopted by the European Union).
This report is made solely to the Company’s members, as a body, in accordance with our engagement with them. Our audit work has been undertaken so that we might state to the Company’s members those matters we are required to state to them in an auditors’ report and for no other purpose. To the fullest extent permitted by law, we do not accept or assume responsibility to anyone other than the Company and the Company’s members as a body, for our audit work, for this report, or for the opinions we have formed.
Respective responsibilities of directors and auditorsAs explained more fully in the directors’ responsibilities statement (set out on page 36), the directors are responsible for the preparation of the financial statements and for being satisfied that they give a true and fair view. Our responsibility is to audit and express an opinion on the financial statements in accordance with applicable law and International Standards on Auditing (UK and Ireland). Those standards require us to comply with the Auditing Practices Board’s Ethical Standards for Auditors.
Scope of the auditAn audit involves obtaining evidence about the amounts and disclosures in the financial statements sufficient to give reasonable assurance that the financial statements are free from material misstatement, whether caused by fraud or error. This includes an assessment of: whether the accounting policies are appropriate to the Group’s and Company’s circumstances and have been consistently applied and adequately disclosed; the reasonableness of significant accounting estimates made by the directors; and the overall presentation of the financial statements. In addition, we read all the non-financial information in the Business Review and Corporate Governance Statement to identify material inconsistencies with the audited financial statements. If we become aware of any apparent material misstatements or inconsistencies we consider the implications for our report.
Opinion on financial statementsIn our opinion the financial statements give a true and fair view, in accordance with International Financial Reporting Standards (IFRS) (as adopted by the European Union), of the state of the Group’s and Company’s affairs as at 31 March 2011 and of their profit and loss for the year then ended.
Grant ThorntonChartered AccountantsThird FloorExchange House54/58 Athol StreetDouglasISLE OF MANIM1 1JD
12 August 2011

38_OPG Power Ventures Plc Annual Report and Accounts 2011
Consolidated and Company Statement of Comprehensive IncomeFor the year ended 31 March 2011 (All amounts in £, unless otherwise stated)
Consolidated Company
Particulars Notes 2011 2010 2011 2010
Revenue 33,147,184 11,515,409 – –Cost of revenue 6 (18,669,898) (4,161,175) – –
Gross profit 14,477,286 7,354,234 – –Other income 7 2,537,869 242,765 – –Distribution cost (865,832) (501,021) – –General and administrative expenses 6 (3,666,390) (3,153,982) (3,834,811) (4,286,092)
Operating profit 12,482,933 3,941,996 (3,834,811) (4,286,092)Financial costs 8 (2,647,296) (608,209) (1,133) (1,230)Financial income 9 1,326,695 2,116,056 393,779 145,399
Profit/(loss) before tax 11,162,332 5,449,843 (3,442,165) (4,141,923)Tax expense 10 (2,408,443) (1,432,338) – –
Profit/(loss) for the year attributable to: 8,753,889 4,017,505 (3,442,165) (4,141,923)
Owners of the parent 6,227,842 926,473 (3,442,165) (4,141,923)Non-controlling interest 2,526,047 3,091,032 – –Earnings per share 21Basic earnings per share (in pence) 2.129 0.323 (1.177) (1.443)Diluted earnings per share (in pence) 2.093 0.318 (1.157) (1.422)Other comprehensive incomeAvailable-for-sale financial assets – Reclassification to profit and loss 185,459 124,334 – – – Current year losses on remeasurement (255,542) (68,293) – –Currency translation differences on translation of foreign
operations (5,076,545) 6,497,808 – –
Other comprehensive income (5,146,628) 6,553,849 – –
Total comprehensive income for the year attributable to: 3,607,261 10,571,354 (3,442,165) (4,141,923)
Owners of the parent 1,627,114 6,750,867 (3,442,165) (4,141,923)Non-controlling interest 1,980,147 3,820,487 – –
3,607,261 10,571,354 (3,442,165) (4,141,923)
The financial statements were authorised for issue by the Board of Directors on 12 August 2011 and were signed on behalf by:
Arvind Gupta V Narayan Swami Chief Executive Officer Chief Financial Officer

Overview
Business Review
Corporate Governance
Financial Statements
OPG Power Ventures Plc Annual Report and Accounts 2011_39
Consolidated and Company Statement of Financial PositionAs at 31 March 2011 (All amounts in £, unless otherwise stated)
Consolidated Company
Notes 2011 2010 2011 2010
ASSETS Non-current Property, plant and equipment 11 73,995,296 62,629,258 – –Investments and other financial assets 12 6,941,814 5,470,257 11,164 10,297Deferred tax asset 10 155,512 51,505Restricted cash 15 1,214,699 1,333,253 – –
Total non-current assets 82,307,321 69,484,273 11,164 10,297
Current Inventories 14 5,605,523 1,867,915 – –Trade and other receivables 13 8,576,366 3,348,207 271,580 274,265Cash and cash equivalents 15 71,104,280 14,168,453 64,598,301 7,072,048Restricted cash 15 1,080,877 148,641 – –Current tax assets 272,105 404,196 – –Investments and other financial assets 12 45,486,243 43,379,680 59,043,372 61,145,096
Total current assets 132,125,394 63,317,092 123,913,253 68,491,409
Total assets 214,432,715 132,801,365 123,924,417 68,501,706
Equity and liabilities Equity Equity attributable to owners of the parent: Share capital 51,671 42,187 51,671 42,187Share premium 124,316,524 66,943,323 124,316,524 66,943,323Other components of equity 7,803,844 10,950,324 2,661,206 1,206,959Retained earnings/(accumulated deficit) 9,050,027 2,822,186 (3,177,675) 264,490
Total 141,222,066 80,758,020 123,851,726 68,456,959
Non-controlling interest 9,807,809 7,827,662 – –
Total equity 151,029,876 88,585,682 123,851,726 68,456,959
Liabilities Non-current Borrowings 18 45,254,399 30,800,245 – –Trade and other payables 19 1,231,509 2,261,141 – –Deferred tax liability 10 849,446 514,235 – –
Total non-current liabilities 47,335,354 33,575,621 – –
Current Borrowings 18 5,064,797 6,531,797 – –Trade and other payables 19 10,716,961 3,918,117 72,691 44,747Other liabilities 241,113 190,000 – –Current tax liabilities 44,615 148 – –
Total current liabilities 16,067,486 10,640,062 72,691 44,747
Total liabilities 63,402,840 44,215,683 72,691 44,747
Total equity and liabilities 214,432,715 132,801,365 123,924,417 68,501,706
The financial statements were authorised for issue by the Board of Directors on 12 August 2011 and were signed on behalf by:
Arvind Gupta V Narayan Swami Chief Executive Officer Chief Financial Officer

40_OPG Power Ventures Plc Annual Report and Accounts 2011
Consolidated Statement of Changes in EquityFor the year ended 31 March 2011(All amounts in £, unless otherwise stated)
Group
Issued capital (number of
shares) Share capital Share premium Other reserves
Foreign currency translation
reserve Retained earnings Total of parent
equity Non-controlling
interest Total equity
Balance as at 1 April 2010 286,989,795 42,187 66,943,323 3,228,892 7,721,432 2,822,186 80,758,020 7,827,662 88,585,682 Issue of equity shares 64,515,000 9,484 57,373,201 57,382,685 – 57,382,685 Employee share-based payment options 1,454,247 1,454,247 – 1,454,247
Transactions with owners 351,504,795 51,671 124,316,524 4,683,139 139,594,952 7,827,662 147,422,614
Profit for the year 6,227,842 6,227,842 2,526,048 8,753,889 Currency translation differences (4,531,791) (4,531,791) (544,754) (5,076,545)Gains/(losses) on sale/re-measurement of available-for-sale financial assets (68,936) (68,936) (1,147) (70,083)
Total comprehensive income for the year – – – (68,936) 3,189,641 9,050,027 1,627,114 1,980,147 3,607,262
Balance as at 31 March 2011 351,504,795 51,671 124,316,524 4,614,203 3,189,641 9,050,027 141,222,066 9,807,809 151,029,876
Balance as at 1 April 2009 as previously reported 286,989,795 42,187 66,943,323 (151,716) 2,667,855 3,309,434 72,811,084 3,996,285 76,807,369 Restatement (refer note 26) 2,125,121 (722,289) (1,413,721) (10,890) 10,890
Balance as at 1 April 2009 (as restated) 286,989,795 42,187 66,943,323 1,973,405 1,945,566 1,895,713 72,800,194 4,007,175 76,807,369
Employee share-based payment options 1,206,959 1,206,959 1,206,959
Transactions with owners 286,989,795 42,187 66,943,323 3,180,364 74,007,153 4,007,175 78,014,328
Profit for the year 926,473 926,473 3,091,032 4,017,505 Currency translation differences 5,775,866 5,775,866 721,942 6,497,808 Gains/(losses) on sale/re-measurement of available-for-sale financial assets 48,528 48,528 7,513 56,041
Total comprehensive income for the year – – – 48,528 7,721,432 2,822,186 6,750,867 3,820,487 10,571,354
Balance as at 31 March 2010 286,989,795 42,187 66,943,323 3,228,892 7,721,432 2,822,186 80,758,020 7,827,662 88,585,682

Overview
Business Review
Corporate Governance
Financial Statements
OPG Power Ventures Plc Annual Report and Accounts 2011_41
Group
Issued capital (number of
shares) Share capital Share premium Other reserves
Foreign currency translation
reserve Retained earnings Total of parent
equity Non-controlling
interest Total equity
Balance as at 1 April 2010 286,989,795 42,187 66,943,323 3,228,892 7,721,432 2,822,186 80,758,020 7,827,662 88,585,682 Issue of equity shares 64,515,000 9,484 57,373,201 57,382,685 – 57,382,685 Employee share-based payment options 1,454,247 1,454,247 – 1,454,247
Transactions with owners 351,504,795 51,671 124,316,524 4,683,139 139,594,952 7,827,662 147,422,614
Profit for the year 6,227,842 6,227,842 2,526,048 8,753,889 Currency translation differences (4,531,791) (4,531,791) (544,754) (5,076,545)Gains/(losses) on sale/re-measurement of available-for-sale financial assets (68,936) (68,936) (1,147) (70,083)
Total comprehensive income for the year – – – (68,936) 3,189,641 9,050,027 1,627,114 1,980,147 3,607,262
Balance as at 31 March 2011 351,504,795 51,671 124,316,524 4,614,203 3,189,641 9,050,027 141,222,066 9,807,809 151,029,876
Balance as at 1 April 2009 as previously reported 286,989,795 42,187 66,943,323 (151,716) 2,667,855 3,309,434 72,811,084 3,996,285 76,807,369 Restatement (refer note 26) 2,125,121 (722,289) (1,413,721) (10,890) 10,890
Balance as at 1 April 2009 (as restated) 286,989,795 42,187 66,943,323 1,973,405 1,945,566 1,895,713 72,800,194 4,007,175 76,807,369
Employee share-based payment options 1,206,959 1,206,959 1,206,959
Transactions with owners 286,989,795 42,187 66,943,323 3,180,364 74,007,153 4,007,175 78,014,328
Profit for the year 926,473 926,473 3,091,032 4,017,505 Currency translation differences 5,775,866 5,775,866 721,942 6,497,808 Gains/(losses) on sale/re-measurement of available-for-sale financial assets 48,528 48,528 7,513 56,041
Total comprehensive income for the year – – – 48,528 7,721,432 2,822,186 6,750,867 3,820,487 10,571,354
Balance as at 31 March 2010 286,989,795 42,187 66,943,323 3,228,892 7,721,432 2,822,186 80,758,020 7,827,662 88,585,682

42_OPG Power Ventures Plc Annual Report and Accounts 2011
Company Statement of Changes in EquityFor the year ended 31 March 2011(All amounts in £, unless otherwise stated)
Company
Share capital (number of
shares) Share capital Share premium Other reserves
Foreign currency translation
reserve Retained earningsTotal shareholders
equity
Balance at 1 April, 2010 as previously reported 286,989,795 42,187 66,943,323 1,206,959 541,456 (276,966) 68,456,959Restatement (refer note 26) (541,456) 541,456 –
Balance at 1 April, 2010 (as restated) 286,989,795 42,187 66,943,323 1,206,959 – 264,490 68,456,959Issue of equity shares 64,515,000 9,484 57,373,201 – – – 57,382,685Employee Share based payment options – – – 1,454,247 – – 1,454,247
Transactions with owners 351,504,795 51,671 124,316,524 2,661,206 – – 127,293,891
Loss for the year (3,442,165) (3,442,165)Other comprehensive income – – – – – – –
Total comprehensive income for the period – – – – – (3,177,675) (3,442,165)
Balance as at 31 March 2011 351,504,795 51,671 124,316,524 2,661,206 – (3,177,675) 123,851,727
Balance at 1 April, 2009 as previously reported 286,989,795 42,187 66,943,323 – 3,135,891 1,270,522 71,391,922Restatement (refer note 26) (3,135,891) 3,135,891 –
Balance at 1 April, 2009 (as restated) 286,989,795 42,187 66,943,323 – – 4,406,413 71,391,922Employee Share based payment options – – – 1,206,959 – – 1,206,959
Transactions with owners 286,989,795 42,187 66,943,323 1,206,959 – 72,598,881
Loss for the year – – – – (4,141,923) (4,141,923)Other comprehensive income – – – – – –
Total comprehensive income for the period – – – – – 264,490 (4,141,923)
Balance as at 31 March 2010 (as restated) 286,989,795 42,187 66,943,323 1,206,959 – 264,490 68,456,959

Overview
Business Review
Corporate Governance
Financial Statements
OPG Power Ventures Plc Annual Report and Accounts 2011_43
Company
Share capital (number of
shares) Share capital Share premium Other reserves
Foreign currency translation
reserve Retained earningsTotal shareholders
equity
Balance at 1 April, 2010 as previously reported 286,989,795 42,187 66,943,323 1,206,959 541,456 (276,966) 68,456,959Restatement (refer note 26) (541,456) 541,456 –
Balance at 1 April, 2010 (as restated) 286,989,795 42,187 66,943,323 1,206,959 – 264,490 68,456,959Issue of equity shares 64,515,000 9,484 57,373,201 – – – 57,382,685Employee Share based payment options – – – 1,454,247 – – 1,454,247
Transactions with owners 351,504,795 51,671 124,316,524 2,661,206 – – 127,293,891
Loss for the year (3,442,165) (3,442,165)Other comprehensive income – – – – – – –
Total comprehensive income for the period – – – – – (3,177,675) (3,442,165)
Balance as at 31 March 2011 351,504,795 51,671 124,316,524 2,661,206 – (3,177,675) 123,851,727
Balance at 1 April, 2009 as previously reported 286,989,795 42,187 66,943,323 – 3,135,891 1,270,522 71,391,922Restatement (refer note 26) (3,135,891) 3,135,891 –
Balance at 1 April, 2009 (as restated) 286,989,795 42,187 66,943,323 – – 4,406,413 71,391,922Employee Share based payment options – – – 1,206,959 – – 1,206,959
Transactions with owners 286,989,795 42,187 66,943,323 1,206,959 – 72,598,881
Loss for the year – – – – (4,141,923) (4,141,923)Other comprehensive income – – – – – –
Total comprehensive income for the period – – – – – 264,490 (4,141,923)
Balance as at 31 March 2010 (as restated) 286,989,795 42,187 66,943,323 1,206,959 – 264,490 68,456,959

44_OPG Power Ventures Plc Annual Report and Accounts 2011
Consolidated and Company Statement of Cash FlowsFor the year ended 31 March 2011 (All amounts in £, unless otherwise stated)
Consolidated Company
Particulars 2011 2010 2011 2010
Cash flows from operating activities Profit/(loss) for the year after Tax 8,753,889 4,017,505 (3,442,165) (4,141,923)Income tax expense 2,408,443 1,432,338 – –Financial expenses 2,647,296 608,209 – –Financial income (1,326,695) (2,116,056) (393,779) (145,399)Share-based compensation costs 1,454,247 1,206,959 1,454,247 1,206,959Depreciation 1,208,461 625,324 – –
15,145,641 5,774,279 (2,381,697) (3,080,363)Movements in working capital (Increase)/decrease in trade and other receivables (5,706,441) (1,418,191) 2,684 (261,052)(Increase)/decrease in inventories (3,948,601) (1,636,191) – –(Increase)/decrease in other current assets (2,048,059) 988,313 (60,681) (4,346)Increase/(decrease) in trade and other payables 5,258,094 5,139,417 27,945 (10,135)Increase/(decrease) in other liabilities (2,981,158) 4,086,706 – –
Cash (used in)/generated from operations 5,719,477 12,934,333 (2,411,749) (3,355,896)Interest paid (2,647,296) (608,209) – –Income taxes paid, net of refunds (1,964,628) (1,056,450) – –
Net cash generated by/(used in) operating activities 1,107,552 11,269,674 (2,411,749) (3,355,896)
Cash flow from investing activities Acquisition of property, plant and equipment (19,758,114) (29,017,680) – –Sale of property, plant and equipment – 2,493 – –(Increase)/decrease in advances – (9,610,586) 2,163,269 6,242,553Finance income 782,508 1,171,217 393,779 145,399Dividend income 544,187 944,839 – –Movement in restricted cash (931,303) 385,765 – –Net cash outflow on acquisition of subsidiaries – (1,732) –Sale/(purchase) of investments, net 3,124,948 (3,222,067) – –(Increase)/decrease in land lease deposits (2,115,283) 1,260 – –
Net cash (used)/generated by investing activities (18,353,056) (39,344,759) 2,555,317 6,387,952
Cash flows from financing activities Proceeds from issue of ordinary shares 57,382,685 – 57,382,685 –Proceeds from borrowings 16,985,286 14,249,387 – –Repayment of borrowings – (5,205,136) – –
Net cash provided by financing activities 74,367,971 9,044,251 57,382,685 –
Net increase/(decrease) in cash and cash equivalents 57,122,467 (19,030,834) 57,526,253 3,032,056
Cash and cash equivalents at the beginning of the year/period 14,168,453 32,319,842 7,072,048 4,039,992Effect of exchange rate changes on the balance of cash held in foreign
currencies (186,639) 879,445 – –
Cash and cash equivalents at the end of the year/period 71,104,280 14,168,453 64,598,301 7,072,048

Overview
Business Review
Corporate Governance
Financial Statements
OPG Power Ventures Plc Annual Report and Accounts 2011_45
1. Corporate information1.1. Nature of operationsOPG Power Ventures Plc (‘the Company’ or ‘OPG’), its subsidiaries (collectively referred to as ‘the Group’) are primarily engaged in the development, owning, operation and maintenance of private sector power projects In India. The electricity generated from its plants is sold principally to public sector undertakings and heavy industrial companies in India or in the short-term market. The business objective of the Group is to focus on the power generation business within India and thereby provide reliable, cost effective power to the industrial consumers and other users under the ‘open access’ provisions mandated by the Government of India.
1.2. Statement of compliance The consolidated and Company financial statements have been prepared in accordance with International Financial Reporting Standards (‘IFRS’) and its interpretations as adopted by the European Union (‘EU’) and the provisions of the Isle of Man, Companies Act 2006 applicable to companies reporting under IFRS.
1.3 General informationOPG, a limited liability corporation, is the Group’s ultimate parent company and is incorporated and domiciled in the Isle of Man. The address of the Company’s registered office, which is also the principal place of business, is Ioma House, Hope Street, Douglas, Isle of Man IM1 1JA. The Company’s equity shares are listed on the Alternative Investment Market (‘AIM’) of the London Stock Exchange.
The Financial statements were approved by the Board of Directors on 12 August 2011.
2. Changes in accounting policies The Group has adopted the following revision and amendments to IAS 27 Consolidated and Separate Financial Statements (Revised 2008) issued by the International Accounting Standards Board, which are relevant to and effective for the Group’s financial statements for the annual period beginning 1 April 2010:
IAS 27R introduced changes to the accounting requirements for transactions with non-controlling (formerly called ‘minority’) interests and the loss of control of a subsidiary. The Group had already made an accounting policy decision to treat such transactions in a similar manner as suggested by the revised standard. Hence there was no financial impact on these financial statements.
2.1. Standards, amendments and interpretations to existing standards that are not effective and have not been early adopted by the Group At the date of authorisation of these financial statements, certain new standards, amendments and interpretations to existing standards have been published but are not yet effective, and have not been adopted early by the Group.
Management anticipates that all of the relevant pronouncements will be adopted in the Group’s accounting policies for the first period beginning after the effective date of the pronouncement. Information on new standards, amendments and interpretations that are expected to be relevant to the Group’s financial statements is provided below. Certain other new standards and interpretations have been issued but are not expected to have a material impact on the Group’s financial statements.
Standards and interpretations adopted by the EU as at 31 March 2011:
Standard Description Effective for reporting periods starting on or after
IAS 24 (R) Related Party Disclosures 1 January 2011IFRIC 14 Prepayments of a Minimum Funding Requirement – Amendment 1 January 2011IFRIC 19 Extinguishing Financial Liabilities with Equity Instruments 1 July 2010
The management does not expect the application of the other standards to have any material impact on its financial statements when those standards become effective. The Group does not intend to apply any of these pronouncements early.
3. Summary of significant accounting policies3.1. Basis of preparationThe consolidated financial statements have been prepared on a historical cost basis, except for financial assets and liabilities at fair value through profit or loss and available-for-sale financial assets measured at fair value.
The consolidated financial statements are presented in accordance with IAS 1 Presentation of Financial Statements (Revised 2007) and have been presented in Great Britain Pound (‘£’), which is the functional and presentation currency of the Company.
Notes to the Consolidated and Company Financial StatementsFor the year ended 31 March 2011 (All amounts in £, unless otherwise stated)

46_OPG Power Ventures Plc Annual Report and Accounts 2011
3. Summary of significant accounting policies continued3.2. Basis of consolidationThe consolidated financial statements incorporate the financial information of OPG and its subsidiaries for the year ended 31 March 2011.
A subsidiary is defined as an entity controlled by the Company. Control is achieved where the Company has the power to govern the financial and operating policies of an entity so as to obtain benefits from its activities. Subsidiaries are fully consolidated from the date of acquisition, being the date on which control is acquired by the Group, and continue to be consolidated until the date that such control ceases. All subsidiaries have a reporting date of 31 March and use consistent accounting policies adopted by the Group.
All intra-Group balances, income and expenses and any resulting unrealised gains arising from intra-Group transactions are eliminated in full on consolidation.
Non-controlling interest represents the portion of profit or loss and net assets that is not held by the Group and is presented separately in the consolidated statement of comprehensive income and within equity in the consolidated statement of financial position, separately from parent shareholders’ equity. Acquisitions of additional stake or dilution of stake from/to minority interests/other venturer in the Group where there is no loss of control are accounted for using the equity method, whereby, the difference between the consideration paid or received and the book value of the share of the net assets is recognised in ‘other reserve’ within statement of changes in equity.
3.3. List of subsidiaries Details of the Group’s subsidiary which are consolidated into the Group’s consolidated financial statement, are as follows:
% Voting right % Economic interest
Subsidiaries Immediate parentCountry of
incorporation 2011 2010 2011 2010
Caromia Holdings Limited (‘CHL’) OPG Cyprus 100 100 – –Gita Energy Private Limited (‘GEPL’)1, 2 CHL Cyprus 100 100 100 100Gita Holdings Private Limited (‘GHPL’)1 CHL Cyprus 100 100 100 100OPG Power Generation Private Limited (‘OPGPG’) GEPL and
GHPLIndia 71.76 71.76 99 99
OPG Power Gujarat Private Limited (‘OPGG’) GEPL and GHPL
India 65.90 65.90 99 99
OPG Renewable Energy Private Limited (‘OPGRE’)2
GEPL and GHPL
India 22 22 33 33
OPG Energy Private Limited (‘OPGE’)3 OPGPG India 29.78 29.78 44.22 44.22Gita Power and Infrastructure Private Limited,
(‘GPIPL’) GHPL India 100 100 97.91 97.91
1. As of 10 February 2011 pursuant to agreement for assignment of debt between CHL and OPGPV the entire shares held in GEPL and GHPL have been transferred by ‘OPGPV’ to ‘CHL’. 2. Pursuant to the voting rights agreement entered by GEPL with Tamil Nadu Properties and Salem Food Products Limited (hereinafter collectively referred as ‘investors’), the investors
agreed that in consideration of GEPL agreeing to subscribe for shares in OPGRE, the investors will exercise all voting rights in accordance of the directions of GEPL. The total voting rights held by the investors amount to 56.35%. Further the investors have also appointed GEPL as the lawful attorney to exercise their voting rights. Therefore the combination of the directly held interests together with the voting rights of the investors controlled by the Group via contracts, have the effect that the Group controls a majority of voting rights in OPGE. Accordingly this is considered to be a subsidiary of the Group.
3. Pursuant to the voting rights agreement entered by OPGPG with Tamil Nadu Properties and Salem Food Products Limited (hereinafter collectively referred as ‘investors’), the investors agreed that in consideration of OPGPG agreeing to subscribe for shares in OPGE, all voting rights in OPGE will be exercised in accordance with the directions of OPGPG. The total voting rights held by the investors amount to 36.88%. Further the investors also appointed OPGPG as the lawful attorney to exercise their voting rights. Therefore the combination of the directly held interests together with the voting rights of the investors controlled by the Group via contracts, have the effect that the Group controls a majority of voting rights in OPGE. Accordingly this is considered to be a subsidiary of the Group.
3.4. Foreign currency translationThe functional currency of the Company is the Great Britain Pound Sterling (£). The Cypriot entities are an extension of the parent and pass through investment entities. Accordingly the functional currency of the subsidiaries in Cyprus is the £. The functional currency of the Company’s subsidiaries operating in India, determined based on evaluation of the individual and collective economic factors is Indian Rupees (Rs). The presentation currency of the Group is the Great Britain Pound (£) as submitted to the AIM market where the shares of the Company are listed.
At the reporting date the assets and liabilities of the Group are translated into the presentation currency which is Great Britain Pound Sterling (£) at the rate of exchange ruling at the statement of financial position date and the statement of comprehensive income is translated at the average exchange rate for the year. Exchange differences are charged/credited to other comprehensive income and recognised in the currency translation reserve in equity.
Transactions in foreign currencies are translated at the foreign exchange rate ruling at the date of the transaction. Monetary assets and liabilities denominated in foreign currencies at the statement of financial position date are translated into functional currency at the foreign exchange rate ruling at that date. Aggregate gains and losses resulting from foreign currencies are included in finance income or costs within the profit or loss. Non-monetary assets and liabilities that are measured in terms of historical cost in a foreign currency are translated using the exchange rate at the date of the transaction. Non-monetary assets and liabilities denominated in foreign currencies that are stated at fair value are translated to functional currency at foreign exchange rates ruling at the dates the fair value was determined.
Notes to the Consolidated and Company Financial Statements continuedFor the year ended 31 March 2011 (All amounts in £, unless otherwise stated)

Overview
Business Review
Corporate Governance
Financial Statements
OPG Power Ventures Plc Annual Report and Accounts 2011_47
3. Summary of significant accounting policies continued3.5. Revenue recognitionRevenue is recognised to the extent that it is probable that the economic benefits associated with the transaction will flow to the Group, and revenue can be reliably measured. Revenue is measured at the fair value of the consideration received or receivable in accordance with the relevant agreements, net of discounts, rebates and other applicable taxes and duties.
Sale of electricityRevenue comprises revenue from sale of electricity. Revenue from the sale of electricity is recognised when earned on the basis of contractual arrangement with the customers and reflects the value of units supplied including an estimated value of units supplied to the customers between the date of their last meter reading and the reporting date.
Interest and dividendRevenue from interest is recognised as interest accrues (using the effective interest rate method). Revenue from dividends is recognised when the right to receive the payment is established.
3.6. TaxesTax expense recognised in profit or loss comprises the sum of deferred tax and current tax not recognised in other comprehensive income or directly in equity.
Current income tax assets and/or liabilities comprise those obligations to, or claims from, taxation authorities relating to the current or prior reporting periods, that are unpaid at the reporting date. Current tax is payable on taxable profit, which differs from profit or loss in the financial statements. Calculation of current tax is based on tax rates and tax laws that have been enacted or substantively enacted by the end of the reporting period.
Deferred income taxes are calculated using the liability method on temporary differences between the carrying amounts of assets and liabilities and their tax bases. However, deferred tax is not provided on the initial recognition of goodwill, nor on the initial recognition of an asset or liability unless the related transaction is a business combination or affects tax or accounting profit. Deferred tax on temporary differences associated with investments in subsidiaries is not provided if reversal of these temporary differences can be controlled by the Group and it is probable that reversal will not occur in the foreseeable future.
Deferred tax assets and liabilities are calculated, without discounting, at tax rates that are expected to apply to their respective period of realisation, provided they are enacted or substantively enacted by the end of the reporting period. Deferred tax liabilities are always provided for in full.
Deferred tax assets are recognised to the extent that it is probable that they will be able to be utilised against future taxable income. For management’s assessment of the probability of future taxable income to utilise against deferred tax assets. Deferred tax assets and liabilities are offset only when the Group has a right and intention to set off current tax assets and liabilities from the same taxation authority. Changes in deferred tax assets or liabilities are recognised as a component of tax income or expense in profit or loss, except where they relate to items that are recognised in other comprehensive income or directly in equity, in which case the related deferred tax is also recognised in other comprehensive income or equity, respectively.
3.7. Financial assetsFinancial assets are derecognised when the contractual rights to the cash flows from the financial asset expire, or when the financial asset and all substantial risks and rewards are transferred. A financial liability is derecognised when it is extinguished, discharged, cancelled or expires.
Financial assets and financial liabilities are measured initially at fair value adjusted by transaction costs, except for financial assets and financial liabilities carried at fair value through profit or loss, which are measured initially at fair value.
Financial assets and financial liabilities are measured subsequently as described below.
For the purpose of subsequent measurement, financial assets are classified into the following categories upon initial recognition:
loans and receivables; and –available-for-sale financial assets. –
The category determines subsequent measurement and whether any resulting income and expense is recognised in profit or loss or in other comprehensive income.
Loans and receivablesLoans and receivables are non-derivative financial assets with fixed or determinable payments that are not quoted in an active market. After initial recognition these are measured at amortised cost using the effective interest method, less provision for impairment. Discounting is omitted where the effect of discounting is immaterial. The Group’s cash and cash equivalents, trade and most other receivables fall into this category of financial instruments.

48_OPG Power Ventures Plc Annual Report and Accounts 2011
3. Summary of significant accounting policies continued3.7. Financial assets continuedIndividually significant receivables are considered for impairment when they are past due or when other objective evidence is received that a specific counterparty will default. Receivables that are not considered to be individually impaired are reviewed for impairment in groups, which are determined by reference to the industry and region of a counterparty and other shared credit risk characteristics. The impairment loss estimate is then based on recent historical counterparty default rates for each identified group.
Investment in subsidiariesIn the parent company’s financial statements, the investments in subsidiaries are accounted for using the cost method with income from the investment being recognised only to the extent that the parent company receives distributions from accumulated profits of the investee arising after the date of acquisition.
Available-for-sale financial assetsAvailable-for-sale financial assets are non-derivative financial assets that are either designated to this category or do not qualify for inclusion in any of the other categories of financial assets. The Group’s available-for-sale financial assets include mutual funds and listed securities. Available-for-sale financial assets are measured at fair value. Gains and losses are recognised in other comprehensive income and reported within the available-for-sale reserve within equity, except for impairment losses and foreign exchange differences on monetary assets, which are recognised in profit or loss. When the asset is disposed of or is determined to be impaired the cumulative gain or loss recognised in other comprehensive income is reclassified from the equity reserve to profit or loss and presented as a reclassification adjustment within other comprehensive income.
Reversals of impairment losses are recognised in other comprehensive income, except for financial assets that are debt securities which are recognised in profit or loss only if the reversal can be objectively related to an event occurring after the impairment loss was recognised.
3.8. Financial liabilitiesThe Group’s financial liabilities include borrowings, trade and other payables. Financial liabilities are measured subsequently at amortised cost using the effective interest method, except for financial liabilities held for trading or designated at fair value through profit or loss, that are carried subsequently at fair value with gains or losses recognised in profit or loss.
All interest-related charges and, if applicable, changes in an instrument’s fair value that are reported in profit or loss are included within ‘finance costs’ or ‘finance income’.
3.9. Fair value of financial instrumentsThe fair value of financial instruments that are actively traded in organised financial markets is determined by reference to quoted market bid prices at the close of business on the statement of financial position date. For financial instruments where there is no active market, fair value is determined using valuation techniques. Such techniques may include using recent arm’s length market transactions; reference to the current fair value of another instrument that is substantially the same; discounted cash flow analysis or other valuation models.
3.10. Property, plant and equipmentProperty, plant and equipment are stated at cost, net of accumulated depreciation and/or impairment losses, if any. The cost includes expenditures that are directly attributable to property, plant and equipment such as employee cost, borrowing costs for long-term construction projects etc, if recognition criteria are met. Likewise, when a major inspection is performed, its costs are recognised in the carrying amount of the plant and equipment as a replacement if the recognition criteria are satisfied. All other repairs and maintenance costs are recognised in the profit or loss as incurred.
The present value of the expected costs of decommissioning of the asset after its use is included in the costs of the respective asset, if the recognition of the criteria for a provision is met.
Land is not depreciated. Depreciation on other assets is computed on straight-line basis over the useful life of the asset based on management’s estimate as follows:
Nature of asset Useful life (years)
Buildings 30–40Power stations 15–40Other plant and equipment 3–10Vehicles 5–11
Assets in the course of construction are stated at cost and not depreciated until commissioned.
An item of property, plant and equipment is derecognised upon disposal or when no future economic benefits are expected from its use or disposal. Any gain or loss arising on derecognition of the asset (calculated as the difference between the net disposal proceeds and the carrying amount of the asset) is included in the profit or loss in the year the asset is derecognised.
Notes to the Consolidated and Company Financial Statements continuedFor the year ended 31 March 2011 (All amounts in £, unless otherwise stated)

Overview
Business Review
Corporate Governance
Financial Statements
OPG Power Ventures Plc Annual Report and Accounts 2011_49
3. Summary of significant accounting policies continuedThe assets’ residual values, useful lives and methods of depreciation are reviewed at each financial year end and adjusted prospectively if appropriate.
3.11. Leases The determination of whether an arrangement is, or contains a lease is based on the substance of the arrangement at inception date whether fulfilment of the arrangement is dependent on the use of a specific asset or assets or the arrangement conveys a right to use the asset.
Group as a lesseeContracts to lease assets are classified as finance leases if they transfer substantially all the risks and rewards of ownership of the asset to the Group. Leases where the Group does not acquire substantially all the risks and benefits of ownership of the asset are classified as operating leases.
Operating lease payments are recognised as an expense in the profit or loss on a straight-line basis over the lease term. Lease of land is classified separately and is amortised over the period of lease.
3.12. Borrowing costsBorrowing costs directly attributable to the acquisition, construction or production of qualifying assets, that necessarily take a substantial period of time to get ready for their intended use or sale, are added to the cost of those assets. Interest income earned on the temporary investment of specific borrowing pending its expenditure on qualifying assets is deducted from the costs of these assets.
Gains and losses on extinguishment of liability, including those arising from substantial modification from terms of loans are not treated as borrowing costs and are charged to profit or loss.
All other borrowing costs including transaction costs are recognised in the profit or loss in the period in which they are incurred, the amount being determined using the effective interest rate method.
3.13. Impairment of non-financial assetsThe Group assesses at each reporting date whether there is an indication that an asset may be impaired. If any indication exists, or when annual impairment testing for an asset is required, the Group estimates the asset’s recoverable amount. An asset’s recoverable amount is the higher of an asset’s or cash-generating unit’s (‘CGU’) fair value less costs to sell and its value in use and is determined for an individual asset, unless the asset does not generate cash inflows that are largely independent of those from other assets or Groups of assets. Where the carrying amount of an asset or CGU exceeds its recoverable amount, the asset is considered impaired and is written down to its recoverable amount. In assessing value in use, the estimated future cash flows are discounted to their present value using a pre-tax discount rate that reflects current market assessments of the time value of money and the risks specific to the asset. In determining fair value less costs to sell, an appropriate valuation model is used. These calculations are corroborated by valuation multiples, quoted share prices for publicly traded subsidiaries or other available fair value indicators.
For assets excluding goodwill, an assessment is made at each reporting date as to whether there is any indication that previously recognised impairment losses may no longer exist or may have decreased. If such indication exists, the Group estimates the asset’s or CGU recoverable amount. A previously recognised impairment loss is reversed only if there has been a change in the assumptions used to determine the asset’s recoverable amount since the last impairment loss was recognised. The reversal is limited so that the carrying amount of the asset does not exceed its recoverable amount, nor exceed the carrying amount that would have been determined, net of depreciation, had no impairment loss been recognised for the asset in prior years. Such reversal is recognised in the profit or loss unless the asset is carried at revalued amount, in which case the reversal is treated as a revaluation increase.
3.14. Cash and cash equivalentsCash and cash equivalents in the statement of financial position comprise cash at banks and on hand and short-term deposits.
For the purpose of the consolidated cash flow statement, cash and cash equivalents consist of cash and short-term deposits, net of restricted cash and outstanding bank overdrafts.
3.15. InventoriesInventories are stated at the lower of cost and net realisable value.
Costs incurred in bringing each product to its present location and condition is accounted based on weighted average price.
Net realisable value is the estimated selling price in the ordinary course of business, less estimated selling expenses.
3.16. Earnings per shareThe earnings considered in ascertaining the Group’s earning per share (‘EPS’) comprise the net profit for the year attributable to ordinary equity holders of the parent. The number of shares used for computing the basic EPS is the weighted average number of shares outstanding during the year.

50_OPG Power Ventures Plc Annual Report and Accounts 2011
3. Summary of significant accounting policies continued3.17. Other provisions and contingent liabilities Provisions are recognised when present obligations as a result of a past event will probably lead to an outflow of economic resources from the Group and amounts can be estimated reliably. Timing or amount of the outflow may still be uncertain. A present obligation arises from the presence of a legal or constructive commitment that has resulted from past events, for example, product warranties granted, legal disputes or onerous contracts. Restructuring provisions are recognised only if a detailed formal plan for the restructuring has been developed and implemented, or management has at least announced the plan’s main features to those affected by it. Provisions are not recognised for future operating losses.
Provisions are measured at the estimated expenditure required to settle the present obligation, based on the most reliable evidence available at the reporting date, including the risks and uncertainties associated with the present obligation. Where there are a number of similar obligations, the likelihood that an outflow will be required in settlement is determined by considering the class of obligations as a whole. Provisions are discounted to their present values, where the time value of money is material.
Any reimbursement that the Group can be virtually certain to collect from a third party with respect to the obligation is recognised as a separate asset. However, this asset may not exceed the amount of the related provision. All provisions are reviewed at each reporting date and adjusted to reflect the current best estimate.
In those cases where the possible outflow of economic resources as a result of present obligations is considered improbable or remote, no liability is recognised, unless it was assumed in the course of a business combination. In a business combination, contingent liabilities are recognised on the acquisition date when there is a present obligation that arises from past events and the fair value can be measured reliably, even if the outflow of economic resources is not probable. They are subsequently measured at the higher amount of a comparable provision as described above and the amount recognised on the acquisition date, less any amortisation.
3.18. Share-based paymentsThe Group operates equity-settled share-based remuneration plans for its employees. None of the Group’s plans feature any options for a cash settlement.
All goods and services received in exchange for the grant of any share-based payment are measured at their fair values. Where employees are rewarded using share-based payments, the fair values of employees’ services are determined indirectly by reference to the fair value of the equity instruments granted. This fair value is appraised at the grant date and excludes the impact of non-market vesting conditions (for example profitability and sales growth targets and performance conditions).
All share-based remuneration is ultimately recognised as an expense in profit or loss with a corresponding credit to ‘other reserves’.
If vesting periods or other vesting conditions apply, the expense is allocated over the vesting period, based on the best available estimate of the number of share options expected to vest. Non-market vesting conditions are included in assumptions about the number of options that are expected to become exercisable. Estimates are subsequently revised if there is any indication that the number of share options expected to vest differs from previous estimates. Any cumulative adjustment prior to vesting is recognised in the current period. No adjustment is made to any expense recognised in prior periods if share options ultimately exercised are different to that estimated on vesting.
Upon exercise of share options, the proceeds received net of any directly attributable transaction costs up to the nominal value of the shares issued are allocated to share capital with any excess being recorded as share premium.
3.19. Employee benefits Gratuity In accordance with applicable Indian laws, the Group provides for gratuity, a defined benefit retirement plan (‘the Gratuity Plan’) covering eligible employees. The Gratuity Plan provides a lump-sum payment to vested employees at retirement, death, incapacitation or termination of employment, of an amount based on the respective employee’s salary and the tenure of employment.
Liabilities with regard to the gratuity plan are determined by actuarial valuation, performed by an independent actuary, at each statement of financial position date using the projected unit credit method.
The Group recognises the net obligation of a defined benefit plan in its statement of financial position as an asset or liability, respectively in accordance with IAS 19, Employee benefits. The discount rate is based on the Government securities yield. Actuarial gains and losses arising from experience adjustments and changes in actuarial assumptions are charged or credited to profit or loss in the statement of comprehensive income in the period in which they arise.
3.20. Business combinationsBusiness combinations arising from transfers of interests in entities that are under the control of the shareholder that controls the Group are accounted for as if the acquisition had occurred at the beginning of the earliest comparative period presented or, if later, at the date that common control was established using pooling of interest method. The assets and liabilities acquired are recognised at the carrying amounts recognised previously in the Group controlling shareholder’s consolidated financial statements. The components of equity of the acquired entities are added to the same components within Group equity. Any excess consideration paid is directly recognised in equity.
Notes to the Consolidated and Company Financial Statements continuedFor the year ended 31 March 2011 (All amounts in £, unless otherwise stated)

Overview
Business Review
Corporate Governance
Financial Statements
OPG Power Ventures Plc Annual Report and Accounts 2011_51
4. Significant accounting judgements, estimates and assumptionsThe preparation of financial statements in conformity with IFRS requires management to make certain critical accounting estimates and assumptions that affect the reported amounts of assets and liabilities and the disclosure of contingent assets and liabilities at the date of the financial statements and the reported amounts of revenues and expenses during the reporting period.
The principal accounting policies adopted by the Group in the consolidated financial statements are as set out above. The application of a number of these policies require the Group to use a variety of estimation techniques and apply judgement to best reflect the substance of underlying transactions.
The Group has determined that a number of its accounting policies can be considered significant, in terms of the management judgement that has been required to determine the various assumptions underpinning their application in the consolidated financial statements presented which, under different conditions, could lead to material differences in these statements.
The following are significant management judgements in applying the accounting policies of the Group that have the most significant effect on the financial statements.
Leases – In applying the classification of leases in IAS 17, management considers its leases of a power plant by OPGRE as an operating lease
arrangement. In some cases, the lease transaction is not always conclusive, and management uses judgement in determining whether the lease is an operating lease arrangement that transfers substantially all the risks and rewards incidental to ownership.Deferred tax assets –
The assessment of the probability of future taxable income in which deferred tax assets can be utilised is based on the Group’s latest approved budget forecast, which is adjusted for significant non-taxable income and expenses and specific limits to the use of any unused tax loss or credit. The tax rules in India in which the Group operates are also carefully taken into consideration. If a positive forecast of taxable income indicates the probable use of a deferred tax asset, especially when it can be utilised without a time limit, that deferred tax asset is usually recognised in full. The recognition of deferred tax assets that are subject to certain legal or economic limits or uncertainties is assessed individually by management based on the specific facts and circumstances.
Estimates and uncertaintiesWhen preparing the financial statements management undertakes a number of judgements, estimates and assumptions about recognition and measurement of assets, liabilities, income and expenses. The actual results may differ from the judgements, estimates and assumptions made by management, and will seldom equal the estimated results. Information about significant judgements, estimates and assumptions that have the most significant effect on recognition and measurement of assets, liabilities, income and expenses is provided below.
The key assumptions concerning the future and other key sources of estimation uncertainty at the statement of financial position date, that have a significant risk of causing material adjustments to the carrying amounts of assets and liabilities within the next financial year are discussed below:
Recoverability of deferred tax assets: –The recognition of deferred tax assets requires assessment of future taxable profit. (see note 3.6).Estimation of fair value of acquired financial assets and financial liabilities: –While preparing the financial statements the Group makes estimates and assumptions that affect the reported amount of financial assets and financial liabilities. Specifically, the Group make estimates relating to:
• Otherfinancialliabilities: Borrowings held by the Group are measured at amortised cost except where designated at fair value through profit or loss. Further,
liabilities associated with financial guarantee contracts in the Company financial statements are initially measured at fair value and re-measured at each Statement of financial position date. (see note 3.9 and note 28).
Impairment tests: –The determination of recoverable amounts of the CGUs assessed in the annual impairment test requires the Group to estimate of their fair value net of disposal costs as well as their value in use. The assessment of value in use requires assumptions to be made with respect to the operating cash flows of the CGUs as well as the discount rates;Useful life of depreciable assets: –Management reviews the useful lives of depreciable assets at each reporting date, based on the expected utility of the assets to the Group.Provisions: –The Group is currently defending a lawsuit where the actual outcome may vary from the amount recognised in the financial statements. Refer note on contingent liabilities for details.Uncollectability of trade receivables: –Analysis of historical payment patterns, customer concentrations, customer credit-worthiness and current economic trends. If the financial condition of a customer deteriorates, additional allowances may be required (see note 19).Claims by the Group: –These accounts include an amount of £2,064,455 recognised as claim for loss of profit and disclosed as other income. This is a provisional amount based on what is reliably measurable at 31 March 2011 for recoverability of loss of revenue from operations due to delay in commissioning and non-achievement of guaranteed performance parameters at a plant owned by OPGPG. The claims have been recognised where such payments are certain to be recovered under the agreements with the contractor.
Actual results can differ from estimates.

52_OPG Power Ventures Plc Annual Report and Accounts 2011
5. Segment informationThe Group has adopted the ‘management approach’ in identifying the operating segments as outlined in IFRS 8. Operating segments are reported in a manner consistent with the internal reporting provided to the chief operating decision maker. The chief operating decision maker, who is responsible for allocating resources and assessing performance of the operating segment has been identified as the steering committee that makes strategic decisions. Management has analysed the information that the chief operating decision maker reviews and concluded on the segment disclosure. In identifying its operating segments, management generally follows the Group’s service lines, which represent the generation of the power and other related services provided by the Group. The activities undertaken by the power generation segment includes sale of power and other related services. The accounting policies used by the Group for segment reporting are the same as those used for consolidated financial statements.
For management purposes, the Group is organised into only a single business unit of power generation and distribution of the same to customers. There are no geographical segments as all revenues arise from India.
Revenue on account of sale of power to one party amounts to £25,790,162 (2010: £4,312,446).
6. Depreciation, costs of inventories and employee benefit expenses included in the consolidated and Company’s statements of comprehensive income
(a) Depreciation and costs of inventories included in the consolidated statements of comprehensive income:
Consolidated Company
2011 2010 2011 2010
Included in cost of revenue:Fuel costs 14,931,913 2,809,587 – –Depreciation 1,145,380 429,683 – –
For the Group depreciation included in general and administrative expenses amount to £63,081 (2010: £195,461).
For the Company depreciation included in general and administrative expenses amount to £nil (2010: £nil).
(b) Employee benefit expenses forming part of general and administrative expenses are as follows:
Consolidated Company
2011 2010 2011 2010
Salaries and wages 781,534 676,553 148,153 122,724Employee benefit costs 60,083 58,205 – –Employee stock option 1,454,247 1,206,959 1,454,247 1,206,959
Total 2,295,864 1,941,717 1,602,400 1,329,683
(c) Auditor’s remuneration for audit services amounting to £35,000 (2010: £35,612) is included in general and administrative expenses.
(d) Foreign exchange (loss)/gain included in the general and administrative expenses/other income is as follows:
Consolidated Company
2011 2010 2011 2010
Foreign exchange (loss)/gain 113,052 (114,430) (1,903,425) (2,795,092)
Total 113,052 (114,430) (1,903,425) (2,795,092)
7. Other incomea) Other income comprises of:
Consolidated Company
2011 2010 2011 2010
Sale of coal 206,203 160,274 – –Compensation for loss of profit 1,888,294 – – –Miscellaneous income/expense 443,372 82,491 – –
Total 2,537,869 242,765 – –
The item ‘compensation for loss of profit’ includes £1,021,691, due to OPGPG, a subsidiary, from the EPC contractor for delay in guaranteed commissioning date of their 77 MW plant, non-achievement of guaranteed performance parameters at the plant and consequent loss of revenue to OPGPG. This amount represents loss of profits which is reliably measurable as at the reporting date and has been recognised based on the terms and conditions as specified in the EPC contract.
Notes to the Consolidated and Company Financial Statements continuedFor the year ended 31 March 2011 (All amounts in £, unless otherwise stated)

Overview
Business Review
Corporate Governance
Financial Statements
OPG Power Ventures Plc Annual Report and Accounts 2011_53
8. Finance costsFinance costs comprises of:
Consolidated Company
2011 2010 2011 2010
Interest expenses on loans and borrowings 2,271,354 362,302 – –Loss on disposal of financial instruments 255,542 131,334 – –Other finance costs 120,400 114,573 1,133 1,230
Total 2,647,296 608,209 1,133 1,230
Interest expenses on loans and borrowings, includes interest expenses on financial liability at amortised cost of £2,271,354 (2010: £362,302) in consolidated financial statement.
9. Finance incomeThe finance income comprises of:
Consolidated Company
2011 2010 2011 2010
Interest income– Bank deposit 239,872 953,859 7,850 10,660– Loans and receivables 162,340 210,818 13,827 134,739Dividend income 544,187 944,524 – –Other finance income 372,106 – 372,102 –Unwinding of discount on security deposits 8,190 6,855 – –
Total 1,326,695 2,116,056 393,779 145,399
10. Tax expense/(income)The major components of income tax expense for the years ended 31 March 2011 and 2010:
Consolidated statement of comprehensive income2011 2010
Current tax 2,105,976 1,416,412Deferred tax 302,467 15,926
Tax expense reported in the statement of comprehensive income 2,408,443 1,432,338
Consolidated statement of changes in equity: tax reconciliationReconciliation between tax expense and the product of accounting profit multiplied by India’s domestic tax rate for the years ended 31 March 2011 and 2010 is as follows:
2011 2010
Accounting profit before taxes 11,162,332 5,449,843 Enacted tax rates 32.45% 33.99%Tax on profit at enacted tax rate 3,621,619 1,852,402 Differences on account MAT Rate (1,596,807) (420,064) Items taxed at zero rate 417,480 – Others (33,849) –
Actual tax expense 2,408,443 1,432,338
The Company is subject to Isle of Man corporate tax at the standard rate of zero percent. As such, the Company’s tax liability is zero. Additionally, Isle of Man does not levy tax on capital gains. However, considering that the Company’s operations are entirely based in India, the effective tax rate of the Group has been computed based on the current tax rates prevailing in India. Further, a substantial portion of the profits of the Group’s India operations are exempt from Indian income taxes being profits attributable to generation of power in India. Under the tax holiday the taxpayer can utilise an exemption from income taxes for a period of any 10 consecutive years out of the 15 years from the date of commencement of the operations.
The Group is subject to the provisions of MAT under the Indian income taxes for the year ended 31 March 2011 and 2010. Accordingly, the Group calculated the tax liability for current taxes in India after considering MAT.
The Group has carried forward credit in respect of MAT tax liability paid to the extent it is probable that future taxable profit will be available against which such tax credit can be utilised.

54_OPG Power Ventures Plc Annual Report and Accounts 2011
10. Tax expense/(income) continuedDeferred income tax for the Group at 31 March 2011 and 2010 relates to the following:
2011 2010
Deferred income tax assetsLease transactions and others 30,294 –Mark-to-market of available-for-sale financial assets 125,218 51,505
155,512 51,505Deferred income tax liabilitiesDifference in depreciation on property, plant and equipment 849,446 514,235
849,446 514,235
Deferred income tax liabilities, net 693,934 462,730
Movement in temporary differences during the year
ParticularsAs at
1 April 2010
Recognised in income statement
Recognised in equity
Translation adjustment
As at 31 March 2011
Property, plant and equipment and others (514,235) (302,467) – (2,450) (819,152)Mark-to-market gain/(loss) on available-for-sale financial assets 51,505 – 73,712 – 125,218
(462,730) (302,467) 73,712 (2,450) (693,934)
ParticularsAs at
1 April 2009
Recognised in Income
Statement Recognised in
Equity Translation Adjustment
As at 31 March 2010
Property, plant and equipment and others (446,451) (15,926) – (51,857) (514,235)Mark-to-market gain/ (loss) on available-for-sale financial assets 60,909 – (7,482) (1,922) 51,505
(385,542) (15,926) (7,482) (53,779) (462,730)
In assessing the reliability of deferred income tax assets, management considers whether it is more likely than not that some portion or all of the deferred income tax assets will be realised. The ultimate realisation of deferred income tax assets is dependent upon the generation of future taxable income during the periods in which the temporary differences become deductible. The amount of the deferred income tax assets considered realisable, however, could be reduced in the near term if estimates of future taxable income during the carry forward period are reduced.
Shareholders resident outside the Isle of Man will not suffer any income tax in the Isle of Man on any income distributions to them. Further, dividends are not taxable in India in the hands of the recipient. However, the Company will be subject to a ‘dividend distribution tax’ currently at the rate of 15% (plus applicable surcharge and education cess) on the total amount distributed as dividend.
As at 31 March 2011 and 31 March 2010, there was no recognised deferred tax liability for taxes that would be payable on the unremitted earnings of certain of the Group’s subsidiaries, the Group has determined that undistributed profits of its subsidiaries will not be distributed in the foreseeable future.
11. Property, plant and equipment, netThe property, plant and equipment comprises of:
(a) Gross block
Particulars Land and buildings Power stations
Other plant and equipment Vehicles
Assets under construction Total
As at 1 April 2009 7,744,639 7,675,718 47,282 124,063 29,174,655 44,766,356 – Additions 974,219 30,664 43,231 25,414 15,581,342 16,654,870 – Disposals/transfers – (145,870) – (17,983) – (163,854)– Exchange adjustments 709,877 710,692 4,381 11,497 2,703,627 4,140,074
As at 31 March 2010 9,428,735 8,271,204 94,894 142,991 47,459,624 65,397,446
As at 1 April 2010 9,428,735 8,271,204 94,894 142,991 47,459,624 65,397,446 – Additions 444,197 42,059,353 49,460 71,375 9,635,644 52,260,030 – Disposals/transfers (53,270) – – – (35,578,462) (35,631,732) – Exchange adjustments (614,406) (538,929) (6,233) (9,318) (3,092,620) (4,261,505)
As at 31 March 2011 9,205,256 49,791,628 138,121 205,048 18,424,186 77,764,239
Notes to the Consolidated and Company Financial Statements continuedFor the year ended 31 March 2011 (All amounts in £, unless otherwise stated)
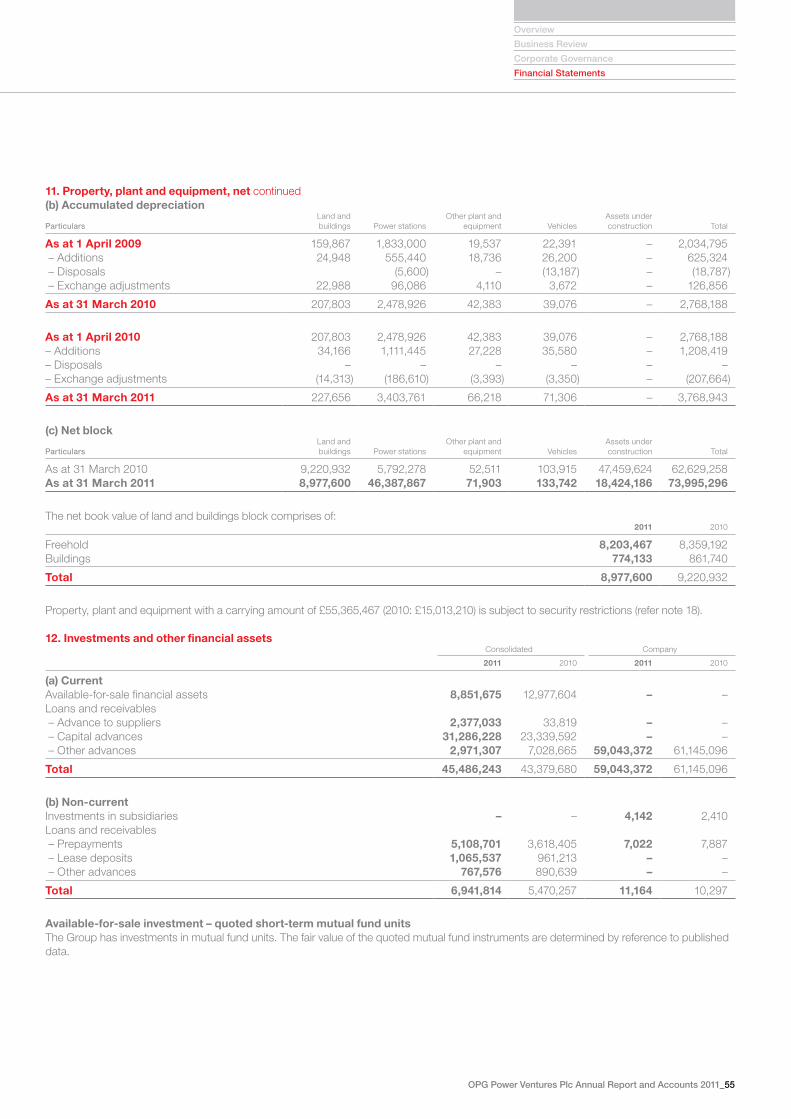
Overview
Business Review
Corporate Governance
Financial Statements
OPG Power Ventures Plc Annual Report and Accounts 2011_55
11. Property, plant and equipment, net continued(b) Accumulated depreciation
Particulars Land and buildings Power stations
Other plant and equipment Vehicles
Assets under construction Total
As at 1 April 2009 159,867 1,833,000 19,537 22,391 – 2,034,795 – Additions 24,948 555,440 18,736 26,200 – 625,324 – Disposals (5,600) – (13,187) – (18,787) – Exchange adjustments 22,988 96,086 4,110 3,672 – 126,856
As at 31 March 2010 207,803 2,478,926 42,383 39,076 – 2,768,188
As at 1 April 2010 207,803 2,478,926 42,383 39,076 – 2,768,188 – Additions 34,166 1,111,445 27,228 35,580 – 1,208,419 – Disposals – – – – – – – Exchange adjustments (14,313) (186,610) (3,393) (3,350) – (207,664)
As at 31 March 2011 227,656 3,403,761 66,218 71,306 – 3,768,943
(c) Net block
Particulars Land and buildings Power stations
Other plant and equipment Vehicles
Assets under construction Total
As at 31 March 2010 9,220,932 5,792,278 52,511 103,915 47,459,624 62,629,258 As at 31 March 2011 8,977,600 46,387,867 71,903 133,742 18,424,186 73,995,296
The net book value of land and buildings block comprises of:2011 2010
Freehold 8,203,467 8,359,192Buildings 774,133 861,740
Total 8,977,600 9,220,932
Property, plant and equipment with a carrying amount of £55,365,467 (2010: £15,013,210) is subject to security restrictions (refer note 18).
12. Investments and other financial assetsConsolidated Company
2011 2010 2011 2010
(a) CurrentAvailable-for-sale financial assets 8,851,675 12,977,604 – –Loans and receivables – Advance to suppliers 2,377,033 33,819 – – – Capital advances 31,286,228 23,339,592 – – – Other advances 2,971,307 7,028,665 59,043,372 61,145,096
Total 45,486,243 43,379,680 59,043,372 61,145,096
(b) Non-current Investments in subsidiaries – – 4,142 2,410Loans and receivables – Prepayments 5,108,701 3,618,405 7,022 7,887 – Lease deposits 1,065,537 961,213 – – – Other advances 767,576 890,639 – –
Total 6,941,814 5,470,257 11,164 10,297
Available-for-sale investment – quoted short-term mutual fund units The Group has investments in mutual fund units. The fair value of the quoted mutual fund instruments are determined by reference to published data.

56_OPG Power Ventures Plc Annual Report and Accounts 2011
12. Investments and other financial assets continuedLoans and receivables (current)Advance to Suppliers include the amounts paid as advance for supply of fuel to the Group. Other advances of the Group primarily includes duty drawback receivable and transmission charges receivable amounting to £2,169,718 (2010: £157,383). For the previous year GEPL and GHPL (step down subsidiaries of the Company) had advanced an amount of £3,438,102 as inter corporate loan. Also, an amount of £2,806,644 was receivable from the bank on sale of available-for-sale investments. Capital advances comprise of payment made to EPC contractors for construction of assets and advances paid for purchase of capital equipments. The management expects to realise these in the next one year.
Loans and receivables of the Company primarily includes non-interest-bearing inter-corporate deposits of £58,981,826 (2010: £61,145,096) being the loan advanced by the Company to Caromia Holdings Limited by the Company which is repayable on demand.
Investment in subsidiariesInvestment refers investments in subsidiaries in the Company financial statements. CHL is a 100% held subsidiary of the Company. In the previous year GEPL and GHPL were 100% subsidiaries of the Company. The carrying amounts disclosed above are maximum possible credit risk exposure in relation to these financial assets.
13. Trade and other receivablesConsolidated Company
2011 2010 2011 2010
CurrentTrade receivables 6,518,201 2,478,584 – –Unbilled revenues 99,425 255,216 – –Other receivables 1,958,740 614,407 271,580 274,265
Total 8,576,366 3,348,207 271,580 274,265
Trade receivables are non-interest bearing and are generally due within 14 days terms. Out of the above, £8,576,366 (2010: £3,348,207) has been pledged for security as borrowings (refer note 18). As at 31 March 2011, trade receivables of £nil (2010: £nil) were collectively impaired and provided for.
The age analysis of the overdue trade receivables is as follows: Past due but not impaired
Total Neither past due
nor impaired < 90 days 90–180 days > 180 days
2011 6,518,201 5,376,841 392,754 142,336 606,2702010 2,478,584 986,454 300,530 754,066 437,534
14. InventoriesConsolidated Company
2011 2010 2011 2010
Coal and fuel 5,368,042 1,738,189 – –Stores and spares 237,481 129,726 – –
Total 5,605,523 1,867,915 – –
Out of the above, £4,708,191 (2010: £129,725) has been pledged for security as borrowings (refer note 18).
15. Cash and cash equivalentsCash and short-term deposits comprise of the following:
Consolidated Company
2011 2010 2011 2010
Cash at banks and on hand 69,884,386 7,359,657 64,598,301 7,072,048Short-term deposits 1,219,894 6,808,796 – –
Total 71,104,280 14,168,453 64,598,301 7,072,048
Short-term deposits are made for varying periods, depending on the immediate cash requirements of the Group. They are recoverable on demand.
Restricted cash represents deposits which have been pledged by the Group in order to fulfil collateral requirements (refer note 18).
Notes to the Consolidated and Company Financial Statements continuedFor the year ended 31 March 2011 (All amounts in £, unless otherwise stated)

Overview
Business Review
Corporate Governance
Financial Statements
OPG Power Ventures Plc Annual Report and Accounts 2011_57
16. Issued share capitalShare capitalThe Company presently has only one class of ordinary shares. For all matters submitted to vote in the shareholders meeting, every holder of ordinary shares, as reflected in the records of the Group on the date of the shareholders’ meeting, has one vote in respect of each share held. All shares are equally eligible to receive dividends and the repayment of capital in the event of liquidation of the Group.
The Company has an authorised share capital of 351,504,795 equity shares (2010: 286,989,795) at par value of £0.000147 (2010: £0.000147) per share amounting to £51,671 (2010: £42,187).
The Company has issued share capital at par value of £51,671 (£0.000147) per share.
ReservesShare premium represents the amount received by the Group over and above the par value of shares issued and the excess of the fair value of share issued in business combination over the par value of such shares. Any transaction costs associated with the issuing of shares are deducted from securities premium, net of any related income tax benefits.
Translation reserve is used to record the exchange differences arising from the translation of the financial statements of the foreign subsidiaries.
Other reserve represents the difference between the consideration paid and the adjustment to net assets on change of controlling interest, without change in control, Other reserves also includes any costs related with share options granted and gain/losses on remeasurement or of available-for-sale financial assets.
Retained earnings include all current and prior period results as disclosed in the statement of comprehensive income less dividend distribution.
17. Share-based paymentsThe Board has granted share options to Directors and nominees of Directors which are limited to 10% of the Group’s share capital. Once granted, the share must be exercised within 10 years of the date of grant otherwise the options would lapse.
The vesting conditions are as follows:
The 300 MW power plant of Kutch in the state of Gujarat must have been in commercial operation for three months. –The closing share price being at least £1 for three consecutive business days. –
The related expense has been amortised over the estimated vesting period of 4.21 years (expected completion of the Kutch plant) and an expense amounting to £1,454,207 (2010: £1,206,959) was recognised in the profit or loss with a corresponding credit to other reserves.
Movement in the number of share options outstanding and their related weighted average exercise price are as follows:
Particulars 2011 2010
At 1 April 22,524,234 –Granted – 22,524,234Forfeited – –Exercised – –Expired – –
At 31 March 22,524,234 22,524,234
Assumptions on valuation of optionsThe weighted average price fair value of options granted during the previous period was determined using the Black-Scholes valuation model was £0.28 per option. The significant inputs into the model were weighted average share price of £0.66 (2011) at the grant date, exercise price shown above, volatility of £0.60 (2010: £0.60), dividend yield of nil (2010: nil), an expected option life of 4.21 years (2010: 3.71 years) and annual risk free rate of 3%. The volatility measured at the standard deviation of continuously compounded share returns is based on daily share prices of the last three years.

58_OPG Power Ventures Plc Annual Report and Accounts 2011
18. BorrowingsThe borrowings comprise of the following:
Interest rate (range %) Final maturity 2011 2010
Financial liabilities measured at amortised cost 12.30–14.62 March 2023 45,254,399 30,800,245Short-term loans 12.30–14.62 March 2012 3,367,529 3,882,815Cash credit and working capital arrangements 1,294,930 2,648,982LC bills discounting and buyers’ credit facility March 2012 402,338 –
Total 50,319,196 37,332,042
Total debt of £50,319,196 (2010: £37,332,042) is secured as follows:
Financial liabilities measured at amortised cost of the Group is fully secured on the property, plant and other movable current assets of –subsidiaries which have availed such loans and by a personal guarantee by the promoter.The short-term loan and cash credits taken by the Group is secured against hypothecation of deposits and margin money as collateral. In –addition to the same, a Director has given personal guarantee for the same.Letter of Credit (‘LC’) bills discounting, buyers’ credit facility, cash credit and other working capital facilities is fully secured against margin –money deposits and other fixed deposits of the respective entities availing the loan facilities.
Long-term project finance loan contains certain restrictive covenants for the benefit of the facility providers and primarily requires the Group to maintain specified levels of certain financial ratios and operating results. The terms of the other borrowings arrangements also contain certain restrictive covenants primarily requiring the Group to maintain certain financial ratios. As of 31 March 2011, the Group has met all the relevant covenants.
The fair value of borrowings at 31 March 2011 was £50,319,196 (2010: £37,332,042). The fair values have been calculated by discounting cash flows at prevailing interest rates.
The borrowings mature as follows:Consolidated
2011 2010
Current liabilities Amounts falling due within one year 5,064,797 6,531,797Non-current liabilitiesAmounts falling due after one year but not more than five years 24,694,855 29,735,967Amounts falling due in more than five years 20,559,544 1,064,278
Total 50,319,196 37,332,042
19. Trade and other payables Consolidated Company
2011 2010 2011 2010
CurrentTrade payables 9,499,104 3,224,109 72,691 44,747 Creditors for capital goods 314,977 504,283Other payables 902,880 189,725
Total 10,716,961 3,918,117 72,691 44,747
Non-current Trade Payables 1,231,509 2,261,141 – –
Total 1,231,509 2,261,141 – –
With the exception of certain trade payables, all amounts are short-term.Trade payables are non-interest bearing and are normally settled on 45 days terms. –Creditors for capital goods are non-interest bearing and are usually settled within a year. –Other payables include provision for gratuity and other provision for expenses. –Non-current trade payable comprises retention money which will be settled after completion and successful installation of the projects. –
Notes to the Consolidated and Company Financial Statements continuedFor the year ended 31 March 2011 (All amounts in £, unless otherwise stated)

Overview
Business Review
Corporate Governance
Financial Statements
OPG Power Ventures Plc Annual Report and Accounts 2011_59
20. Related party transactionsWhere control exists:
Name of the party Nature of relationship
Gita investments Limited Ultimate parentCaromia Holdings Limited SubsidiaryGita Energy Private Limited SubsidiaryGita Holdings Private Limited SubsidiaryOPG Power Generation Private Limited SubsidiaryOPG Power Gujarat Private Limited SubsidiaryOPG Renewable Energy Private Limited SubsidiaryOPG Energy Private Limited SubsidiaryGita Power and Infrastructure Private Limited Subsidiary
Key management personnel:
Name of the party Nature of relationship
Arvind Gupta Chief ExecutiveV Narayan Swami Finance DirectorMunish C Gupta ChairmanMartin Gatto Non-executive DirectorRavi Gupta Non-executive DirectorP Michael Grasby Non-executive Director
Related parties with whom the Group had transactions during the period
Name of the related party Nature of relationship
Sri Hari Vallabhaa Enterprises & Investments (P) Limited Entity in which key management personnel has control/significant influence Dhanvarsha Enterprises & Investments Private Limited Entity in which key management personnel has control/significant influence Goodfaith Vinimay (P) Ltd Entity over which key management personnel exercises control/significant
influence through relatives Salem Food Products Limited Entity in which key management personnel has control/significant influence Sri Rukmani Rolling Mill Private Limited Entity in which key management personnel has control/significant Influence Kanishk Steel Industries Limited Entity in which key management personnel has control/significant influence Gita Energy and Generation Private Limited Entity in which key management personnel has control/significant influence Gita Devi Relative of key management personnel Rajesh Gupta Relative of key management personnel Ravi Gupta Relative of key management personnel

60_OPG Power Ventures Plc Annual Report and Accounts 2011
20. Related party transactions continuedRelated party transactions during the year The following table provides the total amount of transactions that have been entered into with related parties and the outstanding balances as the end of the relevant financial years:Name of the party 2011 2010
Summary of transactions with related parties Kanishk Steel Industries Limited (a) Sharing of power 495,323 790,753(b) Cost of power generated 24,607 8,946(c) Lease deposit 1,308,553 –(d) Lease rent paid 148,478 236,226(e) Reimbursement of expenses 10,851 16,015Salem Food Products Limited (a) Sharing of power 23,757 –(b) Interest received 66,130 89,660(c) Receipt on account of repayment of loan 137,742 –Sri Rukmani Rolling Mill Private Limited (a) Sharing of power 35,469 (b) Sale of coal 1,889 –Gita devi (a) Rent paid – 2,100(b) Reimbursement of expenses 1,043 –Ravi Gupta (a) Remuneration 25,000 25,000Gita Energy and Generation Private Limited (a) Advance paid 2,403,604 1,719,051Gita Power and Infrastructure Private Limited (a) Advance paid – 3,394,260
Name of the party 2011 2010)
Summary of balances with related parties Salem Food Products Limited (a) Loan outstanding 759,494 890,639(b) Trade and other receivables – 970Kanishk Steel Industries Limited (a) Trade and other receivables 331,769 632,955(b) Lease deposit outstanding 4,611,201 3,532,783Sri Rukmani Rolling Mill Private Limited (a) Trade and other receivables 28,028 –
1 Outstanding balances at the year-end are unsecured, interest-bearing in case of loans and inter-corporate deposits and other loans and advances are repayable on demand. The interest rates charged closely approximate to the market rates. There have been no guarantees provided or received for any related party receivables or payables. For the year ended 31 March 2011, the Group has not recorded any impairment of receivables relating to amounts owed by related parties (2010: £nil). This assessment is undertaken each financial year through examining the financial position of the related party and the market in which the related party operates.
2 There are no other long-term benefits and termination benefits which are payable to the key management personnel.3 The short-term loan and cash credits taken by the Group is secured against hypothecation of deposits and margin money as collateral. In addition to the same, a Director has given
personal guarantee for the same.
21. Earnings per shareBoth the basic and diluted EPS have been calculated using the profit attributable to shareholders of the parent company as the numerator (no adjustments to profit were necessary in 2010 or 2011).
The weighted average number of shares for the purposes of diluted EPS can be reconciled to the weighted average number of ordinary shares used in the calculation of basic EPS (for the Group and the Company) as follows:
Particulars 2011 2010
Weighted average number of shares used in basic EPS 292,469,151 286,989,795Shares deemed to be issued for no consideration in respect of share-based payments 5,104,499 4,383,911
Weighted average number of shares used in diluted EPS 297,573,650 291,373,706
Notes to the Consolidated and Company Financial Statements continuedFor the year ended 31 March 2011 (All amounts in £, unless otherwise stated)

Overview
Business Review
Corporate Governance
Financial Statements
OPG Power Ventures Plc Annual Report and Accounts 2011_61
22. Director’s remuneration
Name of Directors 2011 2010
Arvind Gupta 169,109 157,480Narayan Swami 50,734 47,244Martin Gatto 25,000 25,000Michael Grasby 25,000 25,000Munish C Gupta 25,000 25,000Ravi Gupta 25,000 25,000
Total 319,843 304,724
23. Commitments and contingenciesOperating lease commitmentsThe Group leases land and a functional plant under operating leases. The leases typically run for a period of 15 to 30 years, with an option to renew the lease after that date. None of the leases includes contingent rentals.
Non-cancellable operating lease rentals are payable as follows:2011 2010
Not later than one year 339,703 236,537Later than one year and not later than five years 1,358,810 946,149Later than five years 2,813,221 2,427,833
Total 4,511,734 3,610,519
During the year ended 31 March 2011, £339,703 (2010: £236,537) was recognised as an expense in the statement of comprehensive income in respect of operating leases.
Capital commitmentsDuring the year ended 31 March 2011, the Group entered into a contract to purchase property, plant and equipment for £92,009,451 (2010: £142,629,414).
GuaranteesLC and Bank Guarantee are as disclosed below
Particulars
As at 31 March 2011
Group
As at 31 March 2010
Group
Towards outstanding LC 9,185,515 5,674,858Towards outstanding bank guarantees 3,293,417 7,814,483
Contingent liabilities1. As per Tamil Nadu Tax on Consumption or Sale of Electricity Act, 2003, every licensee shall collect and pay every month to the Government
in the prescribed manner, a tax on the electricity sold during the previous month at the rates specified. The operating companies of the Group have during the year made sales to non-government customers amounting to £ 10,067,052 which is liable to electricity tax. However, no tax has been collected/remitted by the Company to the Government. The Company, based on a legal opinion, is advised that it is the obligation of the consumer to pay the tax to the Government on such sales. In addition, the Company is advised that in case of any claim by the Government on such sales, the same would be charged back to the customers. However, considering the uncertainty, the Company has disclosed this as a contingent liability.
2. OPGE had entered into a power sharing agreement with Precot Meridian Ltd (‘PML’) on 30 November 2002 and further had entered into a Memorandum of Understanding on 30 March 2003, in terms of which PML had invested £46,832 in OPGE towards Equity investment and £152,894 towards 13% cumulative redeemable preference shares. Under this MoU OPGE had agreed to supply 2 MW of pro rata power of 17.5 MW. On 29 July 2005, OPGE redeemed the preference share in full and subsequently with approval of PML, converted the equity shares into Class – C shares, which have no voting rights. Subsequently, from April 2008, OPGE stopped its power supply to PML, since in the opinion of OPGE, the obligation of the Company to supply power to PML ceased with the redemption of the preference shares and subsequent re-classification of its shares into non-voting shares. However, PML has raised a demand through arbitration for an amount of £786,068 towards the additional cost incurred by PML in getting power through other sources for the period from April 2008 to October 2010 and £275,485 for litigation fee along with 18% interest against the Company vide its claim on December 26, 2010 under the Arbitration & Conciliation Act 1996 and the matter is pending before the Arbitration Tribunal. OPGE has sought the opinion of its legal counsel and believes that there is no merit in the claim of PML. However, considering the uncertainty, the claim by PML is disclosed as contingent liability.

62_OPG Power Ventures Plc Annual Report and Accounts 2011
24. Financial risk management objectives and policiesThe Group’s principal financial liabilities, comprises of loans and borrowings, trade and other payables, and other current liabilities. The main purpose of these financial liabilities is to raise finance for the Group’s operations. The Group has loans and receivables, trade and other receivables, and cash and short-term deposits that arise directly from its operations. The Group also hold investments designated at fair value through profit or loss and available-for-sale categories.
The Group is exposed to market risk, credit risk and liquidity risk.
The Group’s senior management oversees the management of these risks. The Group’s senior management is supported by a Financial Risk Committee that advises on financial risks and the appropriate financial risk governance framework for the Group. The Financial Risk Committee provides assurance to the Group’s senior management that the Group’s financial risk-taking activities are governed by appropriate policies and procedures and that financial risks are identified, measured and managed in accordance with Group policies and group risk appetite.
The Board of Directors reviews and agrees policies for managing each of these risks which are summarised below:
Market riskMarket risk is the risk that the fair values of future cash flows of a financial instrument will fluctuate because of changes in market prices. Market prices comprise three types of risk: interest rate risk; currency risk; and other price risk, such as equity risk. Financial instruments affected by market risk include loans and borrowings, deposits, available-for-sale investments and investment at fair value through profit or loss.
The sensitivity analyses in the following sections relate to the position as at 31 March 2011 and 31 March 2010.
The following assumptions have been made in calculating the sensitivity analyses:(i) The sensitivity of the statement of comprehensive income is the effect of the assumed changes in interest rates on the net interest income for
one year, based on the floating rate borrowings held at 31 March 2011, all other variables being held constant. These changes are considered to be reasonably possible based on observation of current market conditions.
Interest rate risk Interest rate risk is the risk that the fair value or future cash flows of a financial instrument will fluctuate because of changes in market interest rates. The Group’s exposure to the risk of changes in market interest rates relates primarily to the Group’s long-term debt obligations with floating interest rates.
At 31 March 2011 and 31 March 2010, the Group had no interest rate derivatives.
The sensitivity analyses have been prepared on the basis that the amount of net debt, the ratio of fixed to floating interest rates of the debt as at 31 March 2011.
If interest rates increase or decrease by 100 basis points with all other variables being constant, the Group’s profit after tax for the year ended 31 March 2011 would decrease or increase by £143,355 (2010: £162,315). Increase/decrease in interest rates would have an immaterial impact on the Group’s equity.
Increase/decrease in interest rates would have no impact on the Company’s equity as there are no borrowings.
Foreign currency risk Foreign currency risk is the risk that the fair value or future cash flows of a financial instrument will fluctuate because of changes in foreign exchange rate. The Group’s presentation currency is the Great Britain Pound. A majority of our assets are located in India where the Indian Rupee is the functional currency for our subsidiaries. Currency exposures also exist in the nature of capital expenditure and services denominated in currencies other than the Indian Rupee.
Currency fluctuations may have a large impact on our Group financial results. We are subject to currency risks affecting the underlying cost base in the operating subsidiary companies and also the translation of unit cash costs, profit or loss and the statement of financial position (including non-£ denominated borrowings) in the consolidated financial statements, where the functional currency is not the £.
The Group’s exposure to foreign currency arises where a Group company holds monetary assets and liabilities denominated in a currency different to the functional currency of that entity with Indian Rupee being the major foreign currency exposure of the Group’s main operating subsidiaries:
As at 31 March 2011 As at 31 March 2010
Currency Financial assets Financial liabilities Financial assets Financial liabilities
Rs 4,428,878,407 3,969,312,333 3,333,877,427 2,538,659,229US$ – 11,897,358 – –
Notes to the Consolidated and Company Financial Statements continuedFor the year ended 31 March 2011 (All amounts in £, unless otherwise stated)

Overview
Business Review
Corporate Governance
Financial Statements
OPG Power Ventures Plc Annual Report and Accounts 2011_63
24. Financial risk management objectives and policies continuedSet out below is the impact of a 10% change in the Rs and US$ on profit arising as a result of the revaluation of the Group’s foreign currency financial instruments:
As at 31 March 2011 As at 31 March 2010
Currency Closing rate
Effect of 10% strengthening
of £ on net earnings Closing rate
Effect of 10% strengthening
of £ on net earnings
Rs 72.60 (642,936) 67.87 (1,065,162)US$ 45.29 (742,124) – –
The impact on total equity is the same as the impact on net earnings as disclosed above.
Credit risk analysisCredit risk is the risk that the counterparty will not meet its obligations under a financial instrument or customer contract, leading to a financial loss. The Group is exposed to credit risk from its operating activities (primarily for trade and other receivables) and from its financing activities, including short-term deposits with banks and financial institutions, and other financial assets.
The maximum exposure for credit risk at the reporting date is the carrying value of each class of financial assets amounting to £122,022,795 (2010: £55,266,730).
The Group has exposure to credit risk from a limited customer group on account of supply of power. However, the Group ensures concentration of credit does not significantly impair the financial assets since the customers to whom the exposure of credit is taken are well established and reputed industries engaged in their respective field of business. The credit worthiness of customers to which the Group grants credit in the normal course of the business is monitored regularly. The credit risk for liquid funds and other short-term financial assets is considered negligible, since the counterparties are reputable banks with high quality external credit ratings.
The Group’s/Company’s maximum exposure for financial guarantees are noted in note 23. The Group’s management believes that all the above financial assets, except as mentioned in note 12 and 13, are not impaired for each of the reporting dates under review and are of good credit quality.
Liquidity risk analysisThe Group’s main source of liquidity is its operating businesses. The treasury department uses regular forecasts of operational cash flow, investment and trading collateral requirements to ensure that sufficient liquid cash balances are available to service ongoing business requirements. The Group manages its liquidity needs by carefully monitoring scheduled debt servicing payments for long-term financial liabilities as well as cash-outflows due in day-to-day business. Liquidity needs are monitored in various time bands, on a day-to-day and week-to-week basis, as well as on the basis of a rolling 90-day projection. Long-term liquidity needs for a 90-day and a 30-day lookout period are identified monthly.
The Group maintains cash and marketable securities to meet its liquidity requirements for up to 60-day periods. Funding for long-term liquidity needs is additionally secured by an adequate amount of committed credit facilities and the ability to sell long-term financial assets.
The following is an analysis of the Group contractual undiscounted cash flows payable under financial liabilities at 31 March 2011:
Current Non-current
On demand Within 12 months 1–5 years Later than 5 years Total
Borrowings 9,644,576 37,494,296 17,733,219 64,872,091Trade and other payables 10,544,783 1,231,509 – 11,776,292Other current liabilities 241,113 – – 241,113
Total 20,430,472 38,725,805 17,733,219 76,889,496
The Company’s contractual undiscounted cash flows payable under financial liabilities as at 31 March 2011 is £72,691 (2010: £44,747).
Capital managementCapital includes equity attributable to the equity holders of the parent and debt.
The primary objective of the Group’s capital management is to ensure that it maintains a strong credit rating and healthy capital ratios in order to support its business and maximise shareholder value. Objectives include, among others:
ensure the Group’s ability to meet both its long-term and short-term capital needs as a going concern; and –to provide an adequate return to shareholders by pricing products and services commensurately with the level of risk. –
The Group manages its capital structure and makes adjustments to it, in light of changes in economic conditions. To maintain or adjust the capital structure, the Group may adjust the dividend payment to shareholders, return capital to shareholders or issue new shares.
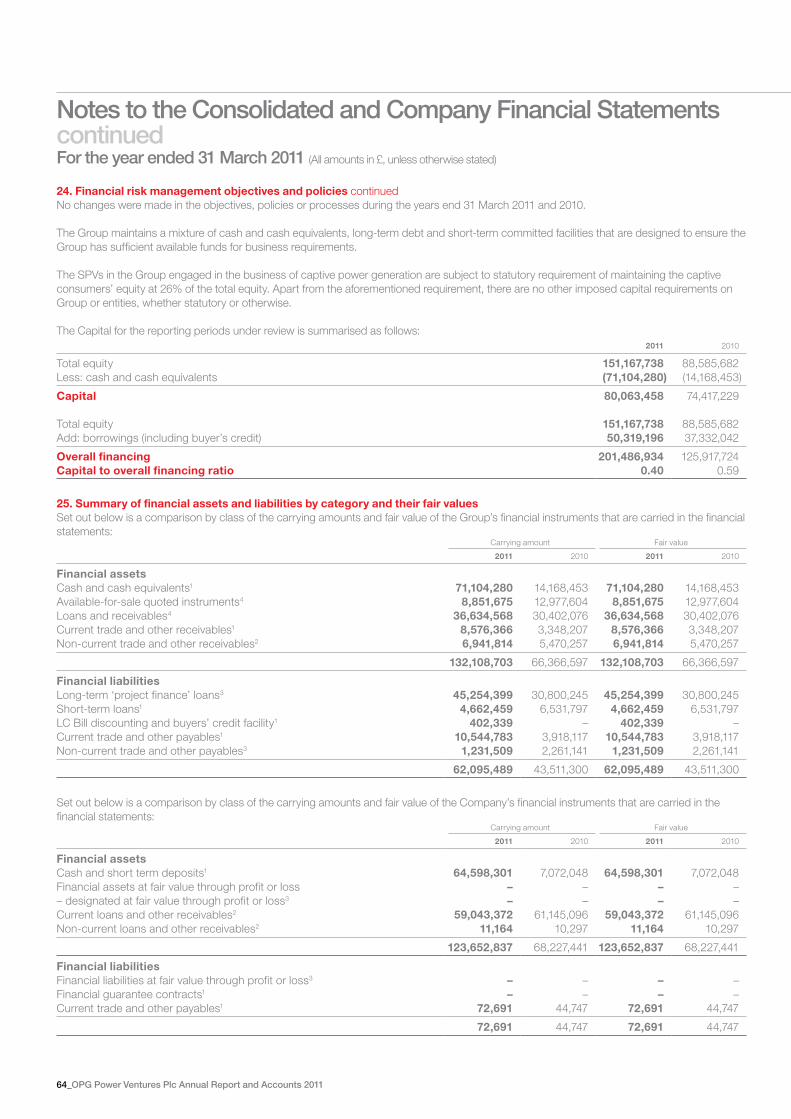
64_OPG Power Ventures Plc Annual Report and Accounts 2011
24. Financial risk management objectives and policies continuedNo changes were made in the objectives, policies or processes during the years end 31 March 2011 and 2010.
The Group maintains a mixture of cash and cash equivalents, long-term debt and short-term committed facilities that are designed to ensure the Group has sufficient available funds for business requirements.
The SPVs in the Group engaged in the business of captive power generation are subject to statutory requirement of maintaining the captive consumers’ equity at 26% of the total equity. Apart from the aforementioned requirement, there are no other imposed capital requirements on Group or entities, whether statutory or otherwise.
The Capital for the reporting periods under review is summarised as follows:2011 2010
Total equity 151,167,738 88,585,682 Less: cash and cash equivalents (71,104,280) (14,168,453)
Capital 80,063,458 74,417,229
Total equity 151,167,738 88,585,682 Add: borrowings (including buyer’s credit) 50,319,196 37,332,042
Overall financing 201,486,934 125,917,724 Capital to overall financing ratio 0.40 0.59
25. Summary of financial assets and liabilities by category and their fair valuesSet out below is a comparison by class of the carrying amounts and fair value of the Group’s financial instruments that are carried in the financial statements:
Carrying amount Fair value
2011 2010 2011 2010
Financial assetsCash and cash equivalents1 71,104,280 14,168,453 71,104,280 14,168,453Available-for-sale quoted instruments4 8,851,675 12,977,604 8,851,675 12,977,604Loans and receivables4 36,634,568 30,402,076 36,634,568 30,402,076Current trade and other receivables1 8,576,366 3,348,207 8,576,366 3,348,207Non-current trade and other receivables2 6,941,814 5,470,257 6,941,814 5,470,257
132,108,703 66,366,597 132,108,703 66,366,597
Financial liabilitiesLong-term ‘project finance’ loans3 45,254,399 30,800,245 45,254,399 30,800,245Short-term loans1 4,662,459 6,531,797 4,662,459 6,531,797LC Bill discounting and buyers’ credit facility1 402,339 – 402,339 –Current trade and other payables1 10,544,783 3,918,117 10,544,783 3,918,117Non-current trade and other payables3 1,231,509 2,261,141 1,231,509 2,261,141
62,095,489 43,511,300 62,095,489 43,511,300
Set out below is a comparison by class of the carrying amounts and fair value of the Company’s financial instruments that are carried in the financial statements: Carrying amount Fair value
2011 2010 2011 2010
Financial assetsCash and short term deposits1 64,598,301 7,072,048 64,598,301 7,072,048Financial assets at fair value through profit or loss – – – –– designated at fair value through profit or loss3 – – – –Current loans and other receivables2 59,043,372 61,145,096 59,043,372 61,145,096Non-current loans and other receivables2 11,164 10,297 11,164 10,297
123,652,837 68,227,441 123,652,837 68,227,441
Financial liabilitiesFinancial liabilities at fair value through profit or loss3 – – – –Financial guarantee contracts1 – – – –Current trade and other payables1 72,691 44,747 72,691 44,747
72,691 44,747 72,691 44,747
Notes to the Consolidated and Company Financial Statements continuedFor the year ended 31 March 2011 (All amounts in £, unless otherwise stated)
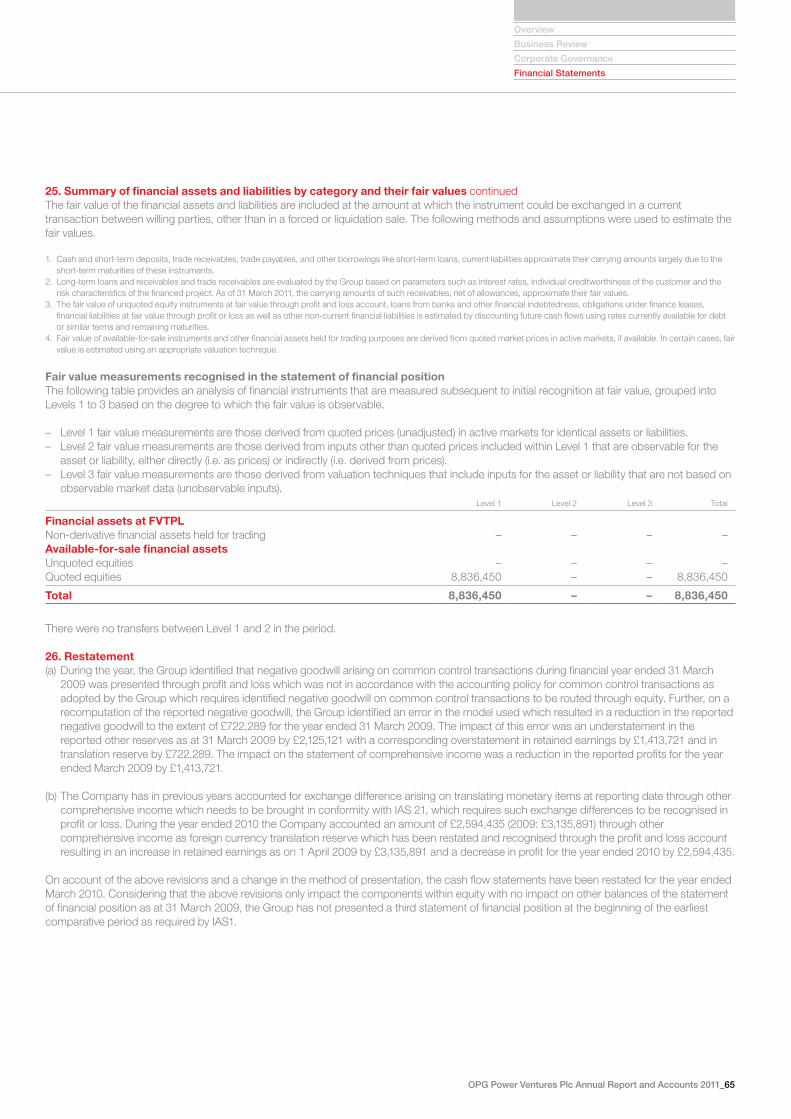
Overview
Business Review
Corporate Governance
Financial Statements
OPG Power Ventures Plc Annual Report and Accounts 2011_65
25. Summary of financial assets and liabilities by category and their fair values continuedThe fair value of the financial assets and liabilities are included at the amount at which the instrument could be exchanged in a current transaction between willing parties, other than in a forced or liquidation sale. The following methods and assumptions were used to estimate the fair values.
1. Cash and short-term deposits, trade receivables, trade payables, and other borrowings like short-term loans, current liabilities approximate their carrying amounts largely due to the short-term maturities of these instruments.
2. Long-term loans and receivables and trade receivables are evaluated by the Group based on parameters such as interest rates, individual creditworthiness of the customer and the risk characteristics of the financed project. As of 31 March 2011, the carrying amounts of such receivables, net of allowances, approximate their fair values.
3. The fair value of unquoted equity instruments at fair value through profit and loss account, loans from banks and other financial indebtedness, obligations under finance leases, financial liabilities at fair value through profit or loss as well as other non-current financial liabilities is estimated by discounting future cash flows using rates currently available for debt or similar terms and remaining maturities.
4. Fair value of available-for-sale instruments and other financial assets held for trading purposes are derived from quoted market prices in active markets, if available. In certain cases, fair value is estimated using an appropriate valuation technique.
Fair value measurements recognised in the statement of financial position The following table provides an analysis of financial instruments that are measured subsequent to initial recognition at fair value, grouped into Levels 1 to 3 based on the degree to which the fair value is observable.
Level 1 fair value measurements are those derived from quoted prices (unadjusted) in active markets for identical assets or liabilities. –Level 2 fair value measurements are those derived from inputs other than quoted prices included within Level 1 that are observable for the –asset or liability, either directly (i.e. as prices) or indirectly (i.e. derived from prices).Level 3 fair value measurements are those derived from valuation techniques that include inputs for the asset or liability that are not based on –observable market data (unobservable inputs).
Level 1 Level 2 Level 3 Total
Financial assets at FVTPLNon-derivative financial assets held for trading – – – –Available-for-sale financial assetsUnquoted equities – – – –Quoted equities 8,836,450 – – 8,836,450
Total 8,836,450 – – 8,836,450
There were no transfers between Level 1 and 2 in the period.
26. Restatement(a) During the year, the Group identified that negative goodwill arising on common control transactions during financial year ended 31 March
2009 was presented through profit and loss which was not in accordance with the accounting policy for common control transactions as adopted by the Group which requires identified negative goodwill on common control transactions to be routed through equity. Further, on a recomputation of the reported negative goodwill, the Group identified an error in the model used which resulted in a reduction in the reported negative goodwill to the extent of £722,289 for the year ended 31 March 2009. The impact of this error was an understatement in the reported other reserves as at 31 March 2009 by £2,125,121 with a corresponding overstatement in retained earnings by £1,413,721 and in translation reserve by £722,289. The impact on the statement of comprehensive income was a reduction in the reported profits for the year ended March 2009 by £1,413,721.
(b) The Company has in previous years accounted for exchange difference arising on translating monetary items at reporting date through other comprehensive income which needs to be brought in conformity with IAS 21, which requires such exchange differences to be recognised in profit or loss. During the year ended 2010 the Company accounted an amount of £2,594,435 (2009: £3,135,891) through other comprehensive income as foreign currency translation reserve which has been restated and recognised through the profit and loss account resulting in an increase in retained earnings as on 1 April 2009 by £3,135,891 and a decrease in profit for the year ended 2010 by £2,594,435.
On account of the above revisions and a change in the method of presentation, the cash flow statements have been restated for the year ended March 2010. Considering that the above revisions only impact the components within equity with no impact on other balances of the statement of financial position as at 31 March 2009, the Group has not presented a third statement of financial position at the beginning of the earliest comparative period as required by IAS1.

66_OPG Power Ventures Plc Annual Report and Accounts 2011
27. Reclassification of the consolidated financial statements for the prior yearsPrior year’s figures in the consolidated financial statements have been regrouped and reclassified wherever necessary to conform to the current year’s figures. The Group has reclassified the following items which do not have any impact upon the income statement, cash flows, equity and financial position and performance of the Group.
Capital advances relating to construction of power stations amounting to £21,160,152 which was disclosed as non-current has now been reclassified to Investments and other financial assets (current).
Capital work in progress relating to construction of power stations amounting to £2,387,533 which was disclosed as non-current has now been reclassified to investment and other financial assets.
Restricted cash amounting to £1,333,253 which was disclosed as current has been reclassified to non-current.
Financial assets amounting to £259,123 has been reclassified to trade and other receivables.
Current tax assets (£2,003,214) and provision for taxation (£1,599,018) which were shown on a gross basis have been disclosed on a net basis.
The Group has made significant presentational changes in the income statement, to further improve comparability of its results to those of other power sector companies and to allow readers to make a more accurate assessment of the sustainable earnings capacity of the Group.
Operating revenue (£1,357,189) and cost of generation (£1,196,914) – relating to purchase and sale of coal have been regrouped to other income.
Other expenses (£495,104), employee costs (£1,373,055), depreciation (£195,461), pre-operative expenses (£1,171,626) have been reclassified to general and administration expenses.
Other gains and losses (£1,028,559) has been reclassified to other income (£84,035) and to finance income (£944,524).
An amount of £46,252 has been reclassified from finance income to finance expense.
28. Subsequent eventsOPGPG acquired certain assets of M/s Bellary Steels & Alloys Ltd, which consist primarily of 120 acres of land with partially completed 12 MW power plant for a consideration of £8.89m (Rs 649m). The Company was not operational for the last two years and was under liquidation. Subsequent to the reporting date, the Group, having paid the bid price in full, has acquired possession of the same. The Group has assessed this transaction as an acquisition of assets and not as a acquisition of business in the absence of any process which is part of a set of integrated activities to create any output.
The financial statements were authorised for issue by Board of Directors on 12 August 2011 and were signed on behalf by:
Arvind Gupta V Narayan SwamiChief Executive Officer Chief Financial Officer
Notes to the Consolidated and Company Financial Statements continuedFor the year ended 31 March 2011 (All amounts in £, unless otherwise stated)

Overview
Business Review
Corporate Governance
Financial Statements
OPG Power Ventures Plc Annual Report and Accounts 2011_67
Corporate Directory
Nominated Advisor and BrokerCenkos Securities Plc6-7-8 Tokenhouse Yard London EC2R 7AS
Financial PRTavistock Communications131 Finsbury Pavement London EC2A 7AS
Administrators and Company SecretaryIOMA Fund and Investment Management LimitedIOMA House Hope Street Douglas Isle of Man IM1 1AP
AuditorsGrant ThorntonThird Floor Exchange House 54-58 Athol Street Douglas Isle of Man IM1 1JD
Legal AdvisorsDougherty QuinnThe Chambers 5 Mount Pleasant Douglas Isle of Man IM1 2PU
RegistrarsCapita Registrars (Isle of Man) Limited3rd Floor Exchange House 54-58 Athol Street Douglas Isle of Man IM1 1JD

68_OPG Power Ventures Plc Annual Report and Accounts 2011
Definitions and Glossary
Act: the Isle of Man Companies Act 2006
AGM: Annual General Meeting
Board: the Board of Directors of OPG Power Ventures plc
CAGR: Compound Average Growth Rate
CEA: Central Electricity Authority
CIL: Coal India Limited
Company or OPG or parent: OPG Power Ventures Plc
Current Quarter: the quarter commencing from 1 July 2011 to 30 September 2011
EBITDA: Earnings before interest, tax, depreciation and amortisation
Electricity Act: the Indian Electricity Act 2003 as amended
EPC: Engineering, Procurement and Construction
EPS: Earnings per share
FY: Financial Year commencing from 1 April to 31 March
GCP: Group Captive Plant
GDP: Gross Domestic Product
GM: Annual General Meeting
GMDC: Gujarat Mineral Development Corporation
Government: Government of India
Great Britain Pound Sterling or £/pence: Pounds or sterling/pence, the lawful currency of the UK
Group Captive: Group Captive Power plant as defined under Electricity Act 2003, India
Group or OPG: the Company and its subsidiaries
GW: Giga Watt
IAS: International Accounting Standards
IFRS: International Financial Reporting Standards
Indian Companies Act: the Companies Act, 1956 and amendments thereto
KWh: kilowatt hour
LSE: London Stock Exchange plc
MoU: Memorandum of Understanding
MW: Mega Watt
MWh: Mega Watt hour
O&M: Operating and Management
PPA: Power Purchase Agreement
PSA: Power Supply agreement
ROE: Return on Equity
Rupees/INR, Rs: Indian Rupee, the lawful currency of India
SPV: Special Purpose Vehicle
State: State of India
The Code: the UK Corporate Governance code, issued by the Financial Reporting Council
UK/United Kingdom: United Kingdom of Great Britain and Northern Ireland
UK LLP: United Kingdom Limited Liability Partnership
US$ or U.S.$ or $: US Dollars, the lawful currency of the US

OPG Power Ventures Plc is developing and operating power plants in India. The company is committed to building shareholder value and to being the first choice provider of reliable, uninterrupted power at competitive rates to its customers. OPG is listed on the Alternative Investment Market (AIM).
Overview01 Highlights02 Our Markets04 Our Operations and Projects06 Our Strategy and KPIs08 Capacity Growth Profile10 Chairman’s Statement
Business Review12 Principal Risks14 Chief Executive’s Statement16 Operational Review20 Financial Review22 Responsible Growth24 Board of Directors
Corporate Governance 26 Corporate Governance 30 Directors’ Remuneration Report34 Directors’ Report36 Statement of Directors’ Responsibilities
in Respect of the Accounts
Financial Statements37 Independent Auditors’ Report to the
Members of OPG Power Ventures Plc38 Consolidated and Company Statement
of Comprehensive Income39 Consolidated and Company Statement
of Financial Position40 Consolidated Statement of changes
in Equity42 Company Statement of changes in Equity44 Consolidated and Company Statement of
Cash Flows45 Notes to the Consolidated and Company
Financial Statements67 Corporate Directory68 Definitions and Glossary
Certain statements included in this Annual Report and Accounts contain forward-looking information concerning the Group’s strategy, operations, financial performance or condition, outlook, growth opportunities or circumstances in the countries, sectors or markets in which the Group operates. By their nature, forward-looking statements involve uncertainty because they depend on future circumstances, and relate to events, not all of which are within the Group’s control or can be predicted by the Group. Although the Group believes that the expectations reflected in such forward-looking statements are reasonable, no assurance can be given that such expectations will prove to have been correct. Actual results could differ materially from those set out in the forward-looking statements. For a detailed analysis of the factors that may affect our business, financial performance or results of operations, please refer to the Principal Risks and Uncertainties included in this Annual Report and Accounts. No part of these results constitutes, or shall be taken to constitute, an invitation or inducement to invest in the Group or any other entity, and must not be relied upon in any way in connection with any investment decision. The Group undertakes no obligation to update any forward-looking statements.
Cover: Covered coal shed at Chennai with 40,000t capacity

OP
G P
ower Ventures P
lcA
nnual Rep
ort and A
ccounts 2011
A platformfor growth
OPG Power Ventures Plc
Annual Report and Accounts 2011
www.opgpower.com
OPG Power Ventures Plc117 Sir P S Sivasamy SalaiSt Ebba’s AvenueMylaporeChennai 600 004India
T: +91(0) 44 42911214/42911222F: +91(0) 44 42911209E: [email protected]
Registered officeIoma HouseHope StreetDouglasIsle of Man IM1 1AP