
Opf Quick Start
54
Quick Start for Using Quick Start for Using PowerWorld Simulator for Market Analysis
-
Upload
johny-willy -
Category
Documents
-
view
45 -
download
4
Transcript of Opf Quick Start

Quick Start for UsingQuick Start for Using PowerWorld Simulator for
Market Analysis

Overview
• This is a quick tutorial of PowerWorld Simulator’s Optimal• This is a quick tutorial of PowerWorld Simulator s Optimal Power Flow (OPF) tool for analyzing power markets.
• The examples may be performed with the free evaluation software which may be downloaded atsoftware, which may be downloaded at http://www.powerworld.com/downloads/demosoftware.asp.
• The tutorial is intended for those who are familiar with navigating PowerWorld Simulator and have some familiaritynavigating PowerWorld Simulator and have some familiarity with power flow studies.– Free online training videos are available at
http://www powerworld com/services/webtraining asp to teachhttp://www.powerworld.com/services/webtraining.asp to teach program navigation and basic functions in PowerWorldSimulator
– Live training sessions are also available. Please visit h // ld / l d
Market Analysis Quick Start-2©2011 PowerWorld Corporation
http://www.powerworld.com/calendar.asp

Objectivesj
• Provide background on the Optimal PowerProvide background on the Optimal Power Flow (OPF) Problem
• Show how the OPF is implemented inShow how the OPF is implemented in PowerWorld Simulator OPF
• Explain how Simulator OPF can be used toExplain how Simulator OPF can be used to solve small and large problems
• Provide hands-on examplesProvide hands on examples • Provide sample OPF results and visualization
on a realistic large power system
Market Analysis Quick Start-3©2011 PowerWorld Corporation
on a realistic large power system

Optimal Power Flowp
• The goal of an optimal power flow (OPF) isThe goal of an optimal power flow (OPF) is to determine the “best” way to instantaneously operate a power system.y p p y
• Usually “best” = minimizing operating cost.• OPF can incorporate and enforceOPF can incorporate and enforce
transmission limits, but we’ll introduce OPF initially ignoring transmission limitsy g g
Market Analysis Quick Start-4©2011 PowerWorld Corporation
“Ideal” Power Market:N T i i S t C t i tNo Transmission System Constraints
• An ideal power market is analogous to aAn ideal power market is analogous to a lake– generators supply energy to the lake and loads g pp y gy
remove energy– no transmission limits and no losses
• There is a single marginal cost associated with enforcing the constraint that supply = d ddemand– buy from the least-cost unit that is not at a limit
h i f h i h i l
Market Analysis Quick Start-5©2011 PowerWorld Corporation
– the price of that unit sets the marginal cost
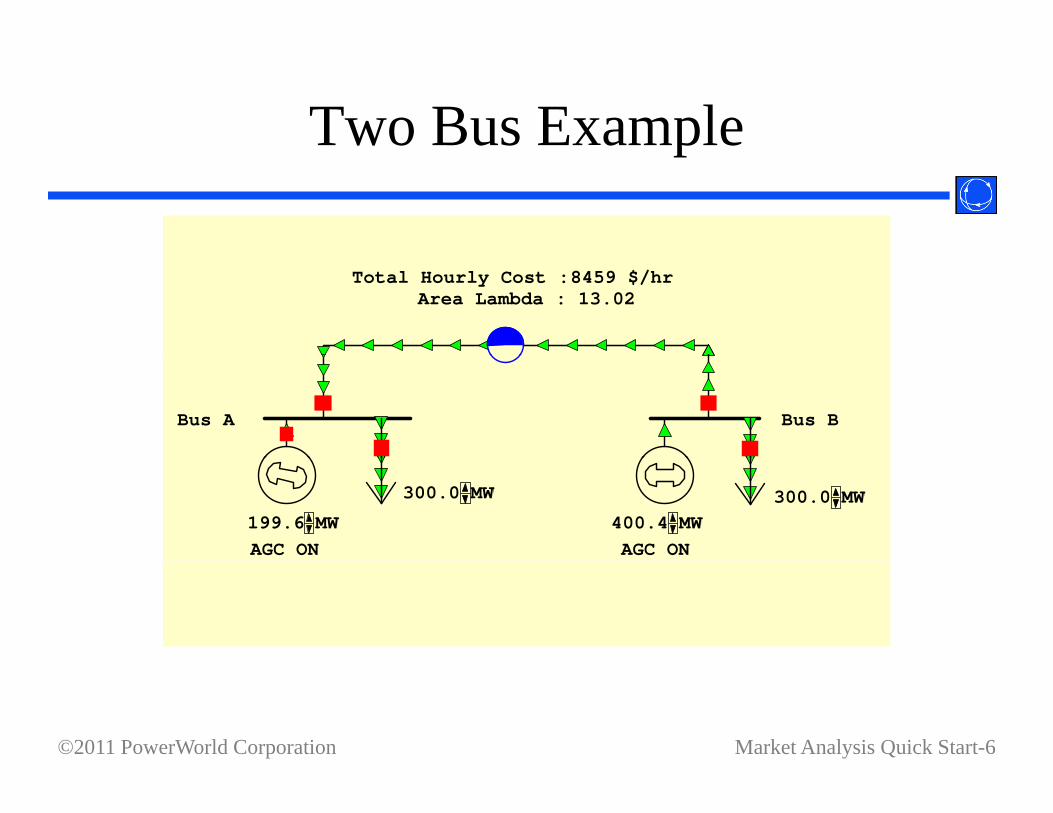
Two Bus Examplep
Total Hourly Cost :8459 $/hr Area Lambda : 13.02
Bus A Bus B
300.0 MWMW
199.6 MWMW 400.4 MWMW300.0 MWMW
AGC ON AGC ON
Market Analysis Quick Start-6©2011 PowerWorld Corporation
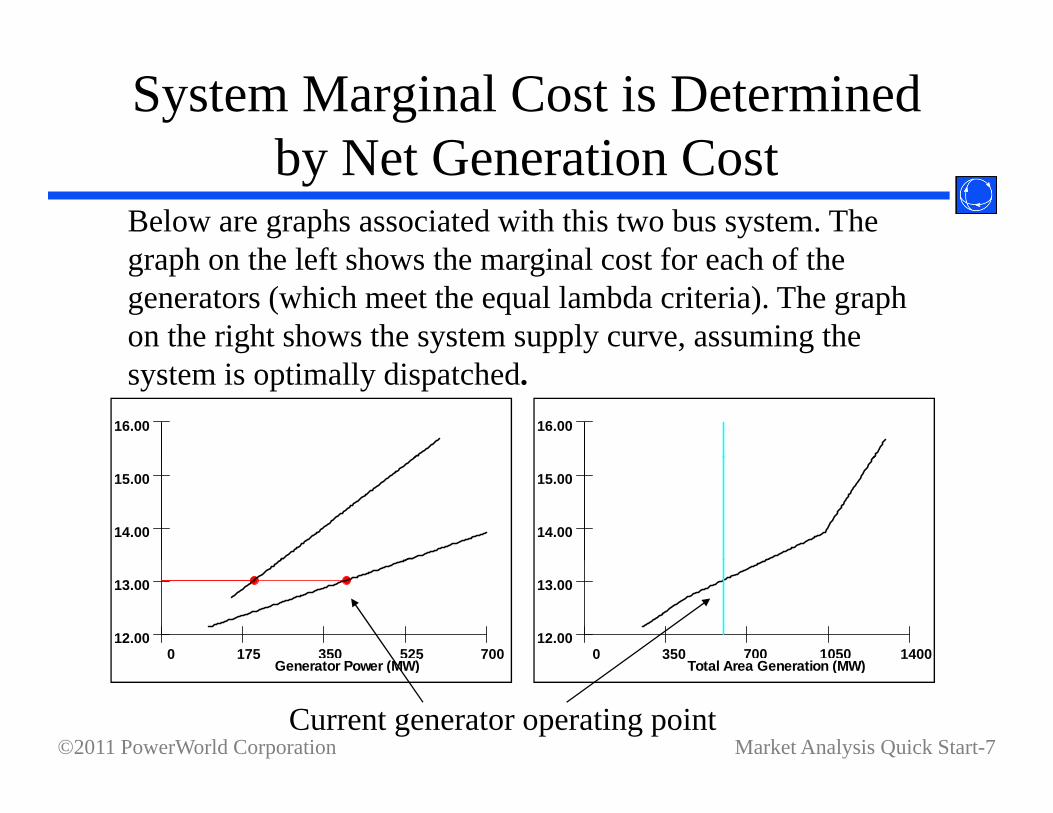
System Marginal Cost is Determined b N t G ti C tby Net Generation Cost
Below are graphs associated with this two bus system. The h th l ft h th i l t f h f thgraph on the left shows the marginal cost for each of the
generators (which meet the equal lambda criteria). The graph on the right shows the system supply curve, assuming the
16.00
system is optimally dispatched.16.00
14.00
15.00
14.00
15.00
0 175 350 525 700G t P (MW)
12.00
13.00
0 350 700 1050 1400T t l A G ti (MW)
12.00
13.00
Market Analysis Quick Start-7©2011 PowerWorld Corporation
Generator Power (MW)
Current generator operating point
Total Area Generation (MW)

Typical Supply Curvef N th t U Sfor Northeast U.S.
80.0
60.0
MW
h)
For each value of generation there is a single, system-wide marginal cost
40.0
ost (
$ / M
marginal cost
20.0
gina
l Co
60 100 140 1800.0M
arg
Market Analysis Quick Start-8©2011 PowerWorld Corporation
Total Generation (GW)

Real Power Market
• Different operating regions imposeDifferent operating regions impose constraints, e.g. total supply in region must equal total demand plus scheduled exportsequal total demand plus scheduled exports
• Transmission system imposes constraints (transmission limits)(transmission limits)
• Marginal costs become localized
Market Analysis Quick Start-9©2011 PowerWorld Corporation

Optimal Power Flow (OPF)p ( )
• Minimize cost function, such as operating cost,Minimize cost function, such as operating cost, taking into account realistic equality and inequality constraints
• Equality constraints– Bus real and reactive power balance– Generator voltage setpoints– Area MW interchange– Transmission line/transformer/interface flow limits
Market Analysis Quick Start-10©2011 PowerWorld Corporation

Optimal Power Flow (OPF)p ( )
• Inequality constraintsInequality constraints– Transmission line/transformer/interface flow limits– Generator MW limits– Generator reactive power capability curves
• Available Controls– Generator MW outputs– Load MW demands– Phase-shifting transformers (or phase angle regulators)– Area Transactions
DC T i i Li S t i t
Market Analysis Quick Start-11©2011 PowerWorld Corporation
– DC Transmission Line Setpoints

Two Bus Example:N C t i tNo Constraints
TransmissionTotal Hourly Cost : 8459 $/hr
Area Lambda : 13.01
Transmission line is not overloaded
Bus A Bus B13.01 $/MWh 13.01 $/MWh
300.0 MWMW
197.0 MWMW 403.0 MWMW300.0 MWMW
AGC ON AGC ON
Marginal cost of supplyingpower to each bus (locational
Market Analysis Quick Start-12©2011 PowerWorld Corporation
power to each bus (locationalmarginal price or LMP)

Two Bus Example:C t i d LiConstrained Line
Total Hourly Cost : 9513 $/hr Area Lambda : 13.26
Bus A Bus B13.43 $/MWh 13.08 $/MWh
380.0 MWMW
260.9 MWMW 419.1 MWMW300.0 MWMW
AGC ON AGC ON
With the line loaded to its limit, additional load at Bus A must be supplied locally, causing the marginal costs to
Market Analysis Quick Start-13©2011 PowerWorld Corporation
pp y g gdiverge.

Hands-on: Three Bus Examplep
• Load the B3LP.pwb case.*p• Switch to Run Mode• Go to the Add Ons ribbon tab• Click Primal LP in the Optimal Power Flow
(OPF) ribbon group to solve the caseLP li t h i d t l• LP = linear program, a technique used to solve the OPF
• Initially the transmission line limits are notInitially the transmission line limits are not enforced*This case and others referenced herein by file name are included with
Market Analysis Quick Start-14©2011 PowerWorld Corporation
yboth the full commercial software and the free evaluation software. They are found in the Sample Cases subdirectory where Simulator is installed.
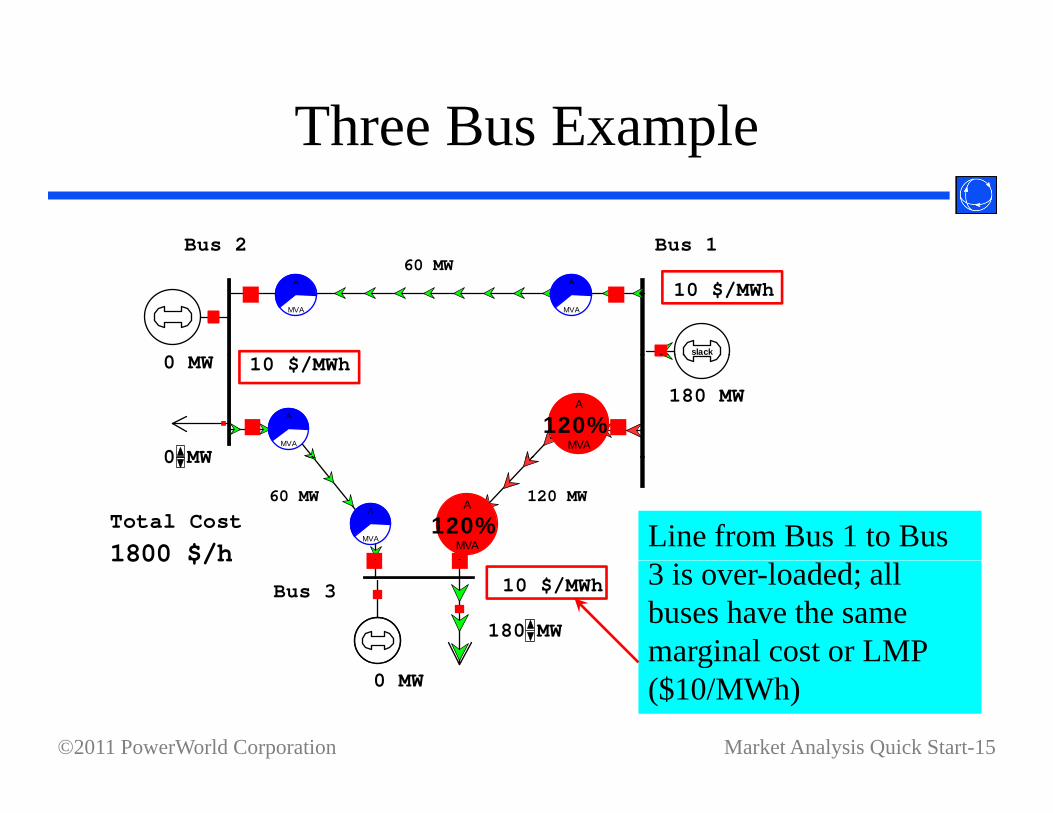
Three Bus Example
Bus 2 Bus 1
p
slack
60 MW
10 $/MWhA
MVA
A
MVA
0 10 $/MWh
A
MVA
0 MW
0 MW
180 MW
120%A
MVA
Total Cost 60 MW 120 MW
A
MVA
1800 $/h
0 MW
120%A
MVA Line from Bus 1 to Bus Bus 3 10 $/MWh
1800 $/h
180 MW
3 is over-loaded; all buses have the same marginal cost or LMP
Market Analysis Quick Start-15©2011 PowerWorld Corporation
0 MWg
($10/MWh)

Three Bus Examplep• All buses are connected through 0.1 pu
reactance transmission lines (no MW losses), each with a 100 MVA limit
• The generator marginal costs are – Bus 1: 10 $ / MWhr; Range = 0 to 400 MW– Bus 2: 12 $ / MWhr; Range = 0 to 400 MW– Bus 3: 20 $ / MWhr; Range = 0 to 400 MW
• A single 180 MW load is at bus 3• Ignoring transmission limits, all load is served
Market Analysis Quick Start-16©2011 PowerWorld Corporation
by the least-cost generator, at bus 1

Three Bus Examplep
• To enforce transmission line limits:– From the OPF ribbon group, Select OPF Options and
Results to view the main options dialog– Select Constraint Options TabSelect Constraint Options Tab– Clear the checkbox
Disable i / fLine/Transformer
MVA Limit Enforcement
– Click Solve LP OPF
Market Analysis Quick Start-17©2011 PowerWorld Corporation

Line Limits Enforced
Bus 2 Bus 1
slack
20 MW
10 $/MWhA
MVA
A
MVA
slack
12 $/MWh
0 MW
60 MW
120 MW
80%A
MVA
100%A
MVA
Total Cost 80 MW 100 MW
1920 $/h
0 MW
80%A
MVA100%
A
MVAOPF redispatches
Bus 3 14 $/MWh1920 $/h
180 MW
to remove violation.Bus marginalcosts are now
Market Analysis Quick Start-18©2011 PowerWorld Corporation
0 MW different.

Why is bus 3 LMP $14 /MWh?y
• The least-cost source of marginal power at buses 1 g pand 2 is the local generator. Each LMP matches the marginal cost of the local generator.
• However, the generator at bus 3 has a marginal costHowever, the generator at bus 3 has a marginal cost of $20, and no generator has a marginal cost of $14.
• Power flow in the network distributes inversely to line impedance and all line impedances are equalline impedance, and all line impedances are equal.– For bus 1 to supply 1 MW to bus 3, 2/3 MW would
flow on direct path from 1 to 3, while 1/3 MW would “loop around” from 1 to 2 to 3loop around from 1 to 2 to 3.
– Likewise, for bus 2 to supply 1 MW to bus 3, 2/3 MW would go directly from 2 to 3, while 1/3 MW would go from 2 to 1 to 3
Market Analysis Quick Start-19©2011 PowerWorld Corporation
from 2 to 1 to 3.

Why is bus 3 LMP $14 /MWh?y
• With the line from 1 to 3 limited noWith the line from 1 to 3 limited, no additional power may flow on it.
• To supply 1 more MW to bus 3 we need• To supply 1 more MW to bus 3 we need Pg1 + Pg2 = 1 MW2/3 P 1 1/3 P 2 0 ( fl 1 3)2/3 Pg1 + 1/3 Pg2 = 0; (no more flow on 1-3)
• Solving requires we increase Pg2 by 2 MW and decrease Pg1 by 1 MW: a net cost increase of $14.
Market Analysis Quick Start-20©2011 PowerWorld Corporation

Bus Marginal Controlsg
• In the OPF Options and Results go to theIn the OPF Options and Results, go to the Results Bus Marginal Controls tab to identify the marginal units for each busidentify the marginal units for each bus
Market Analysis Quick Start-21©2011 PowerWorld Corporation
Three Bus Examplep
• To verify marginal cost first set the presentTo verify marginal cost, first set the present case as the base case (from Tools Ribbon, choose Difference Flows Set Present aschoose Difference Flows Set Present as Base Case)
• Change bus 3 load to 181 MW• Change bus 3 load to 181 MW• Solve the OPF• View the difference case (from Tools
Ribbon, choose Difference Flows
Market Analysis Quick Start-22©2011 PowerWorld Corporation
Difference Case)

Verify Bus 3 Marginal Cost
Bus 2 Bus 1
y g
slack
1 MW
0 $/MWhA
MVA
A
MVA
slack
0 $/MWh
A
MVA
A
MVA
0 MW
2 MW
-1 MW
Total Cost 1 MW 0 MW
A
MVA
A
MVA
14 $/h
0 MW
One additional MWof load at bus 3
Bus 3 0 $/MWh 14 $/h
1 MW
raised total cost by14 $/hr, as G2 wentup by 2 MW and G1
Market Analysis Quick Start-23©2011 PowerWorld Corporation
0 MWup by 2 MW and G1went down by 1MW

Marginal Cost of Enforcing C t i tConstraints
• Similarly to the bus marginal cost you canSimilarly to the bus marginal cost, you can also calculate the marginal cost of enforcing a line constrainta line constraint
• For a transmission line, this represents the amount of system savings which could beamount of system savings which could be achieved if the MVA rating was increased by 1 0 MVAby 1.0 MVA.
Market Analysis Quick Start-24©2011 PowerWorld Corporation

MVA Marginal Costg
• Switch Difference Flows back to Present Case• From the Add Ons ribbon, Choose OPF Case Info OPF
Lines and Transformers to access OPF Constraint Records• Look at the column MVA Marg. CostLook at the column MVA Marg. Cost
Market Analysis Quick Start-25©2011 PowerWorld Corporation
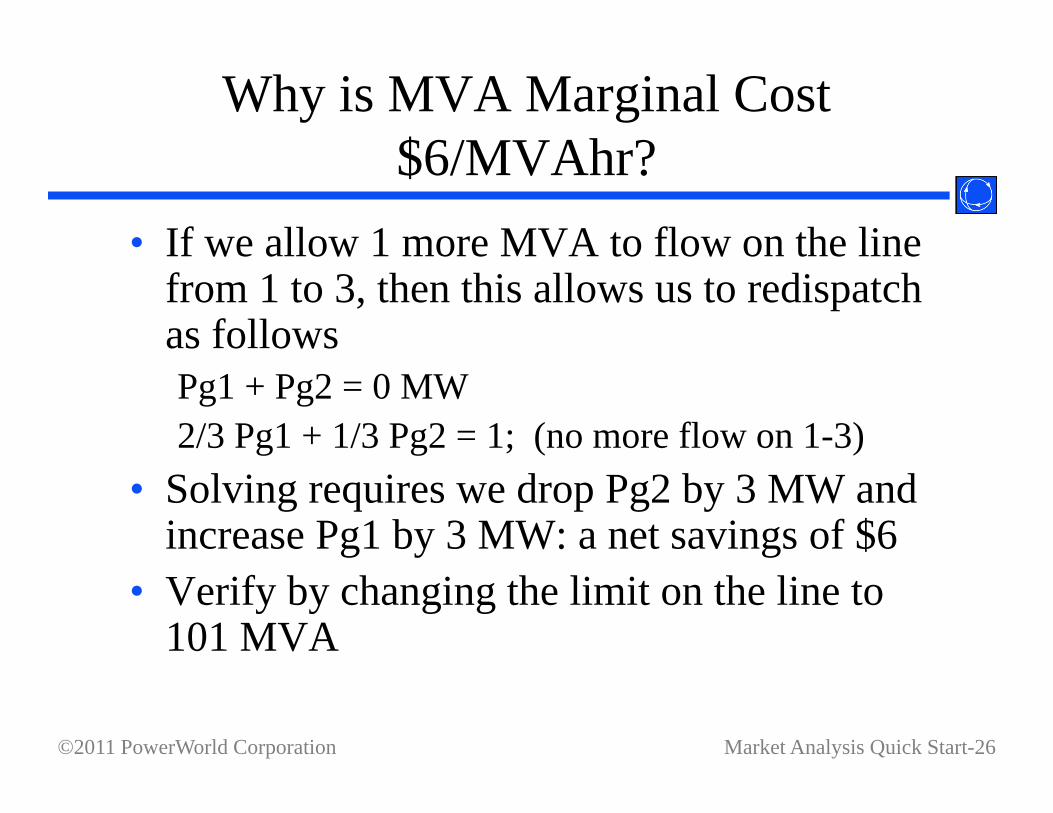
Why is MVA Marginal Cost $6/MVAh ?$6/MVAhr?
• If we allow 1 more MVA to flow on the lineIf we allow 1 more MVA to flow on the line from 1 to 3, then this allows us to redispatchas followsPg1 + Pg2 = 0 MW2/3 Pg1 + 1/3 Pg2 = 1; (no more flow on 1-3)
• Solving requires we drop Pg2 by 3 MW and increase Pg1 by 3 MW: a net savings of $6
• Verify by changing the limit on the line to 101 MVA
Market Analysis Quick Start-26©2011 PowerWorld Corporation
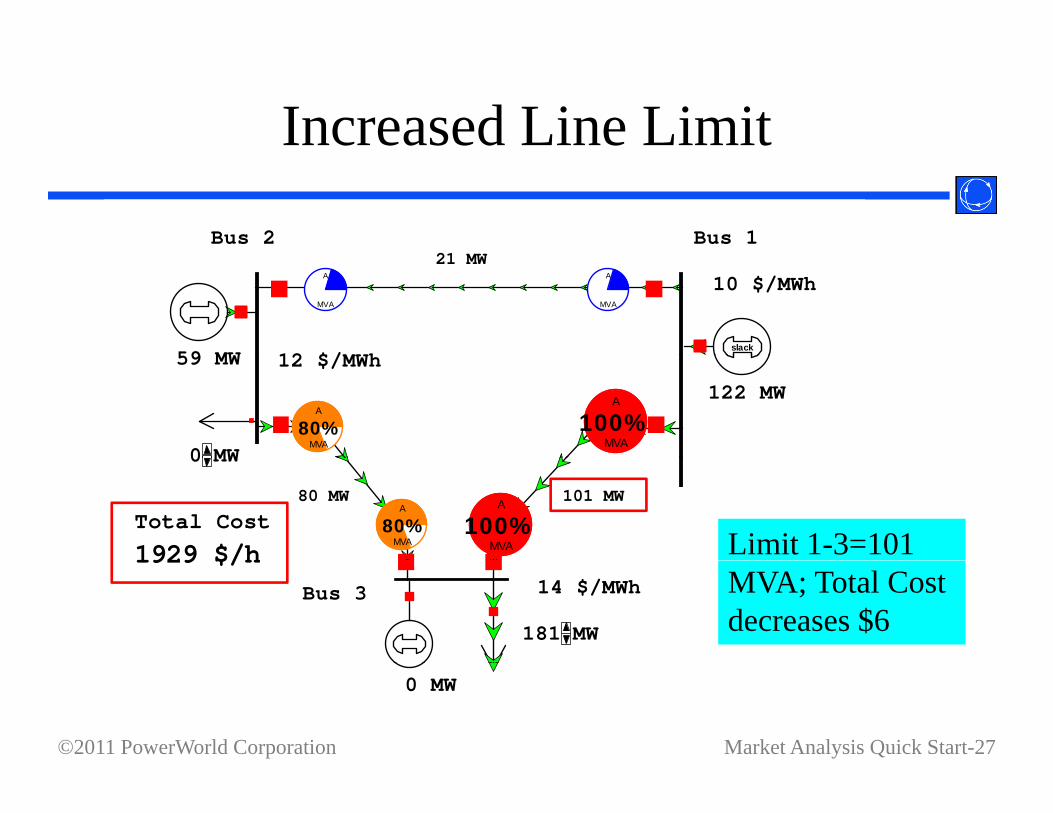
Increased Line Limit
Bus 2 Bus 121
slack
12 $/MWh
21 MW
10 $/MWhA
MVA
A
MVA
59 MW 12 $/MWh
0 MW
59 MW
122 MW
80%A
MVA
100%A
MVA
Total Cost 80 MW 101 MW
1929 $/h
0 MW
80%A
MVA100%
A
MVA Limit 1-3=101 Bus 3 14 $/MWh
1929 $/h
181 MW
MVA; Total Cost decreases $6
Market Analysis Quick Start-27©2011 PowerWorld Corporation
0 MW

How do Marginal Generators Aff t C t i t ?Affect Constraints?
• In the OPF Options and Results, go to LPIn the OPF Options and Results, go to LP Solution Details LP Basis Matrix tab to identify the sensitivity of each marginal de t y t e se s t v ty o eac a g acontrol on each constraint
Increasing output of Gen 2 by 1 MW decreases flow on
Market Analysis Quick Start-28©2011 PowerWorld Corporation
g p ythe binding constraint (Line 1-3) by 1/3 MW. The values assume marginal power is absorbed at the slack.

Both lines into Bus 3 Congestedg
• For bus 3 load above 200 MW the marginalFor bus 3 load above 200 MW, the marginal load must be supplied locally
• Restore line 1 3 limit to 100 MVA• Restore line 1-3 limit to 100 MVA• Change bus 3 load to 250 MW
Market Analysis Quick Start-29©2011 PowerWorld Corporation

Both lines into Bus 3 Congested
Bus 2 Bus 1
g
us us
slack
0 MW
10 $/MWhA
MVA
A
MVA
slack
12 $/MWh
0 MW
100 MW
100 MW
100%A
MVA
100%A
MVA
Total Cost100 MW 100 MW
3202 $/h
0 MW MVA
100%A
MVA100%
A
MVA LMP at bus 3 is Bus 3 20 $/MWh
3202 $/h
250 MW
set by the cost of the generator at bus 3 ($20)
Market Analysis Quick Start-30©2011 PowerWorld Corporation
50 MWbus 3 ($20)

Loss of Generator at Bus 3
• Now if the generator at Bus 3 is taken out of gservice, the 250 MW load cannot be served without overloading the lines, which have a total capacity of 200 MWtotal capacity of 200 MW
• Both constraints cannot be enforced• The marginal cost is now arbitrary, given by aThe marginal cost is now arbitrary, given by a
penalty function• The Maximum Violation Cost is $1000/MWh
b d f l b b h d h OPFby default, but may be changed on the OPF Options and Results dialog, Constraint Options tab
Market Analysis Quick Start-31©2011 PowerWorld Corporation
p

Unenforceable Constraint
Bus 2 Bus 1
slack
53 MW
10 $/MWhA
MVA
A
MVA
12 $/MWh
0 MW
47 MW
203 MW
100%A
MVA
152%A
MVA
Total Cost 99 MW 151 MW
2593 $/h
0 MW
99%A
MVA151%
A
MVA
Both constraints cannot be enforced
Bus 3 1041 $/MWh2593 $/h
250 MW
cannot be enforced. One is unenforceable and bus 3 marginal
t i bit
Market Analysis Quick Start-32©2011 PowerWorld Corporation
0 MWcost is arbitrary.

Unenforceable Limits
• The cost minimization algorithm naturally triesThe cost minimization algorithm naturally tries to remove the line violations.
• High marginal prices and the OPF Constraint• High marginal prices and the OPF Constraint Records will identify binding and unenforceable transmission limitsunenforceable transmission limits
• Look for generators that are in/out of service near the constraintsnear the constraints
• There may be a load pocket without enough transmission: the 3 bus case with generator 3
Market Analysis Quick Start-33©2011 PowerWorld Corporation
transmission: the 3 bus case with generator 3 out of service is an example of a load pocket
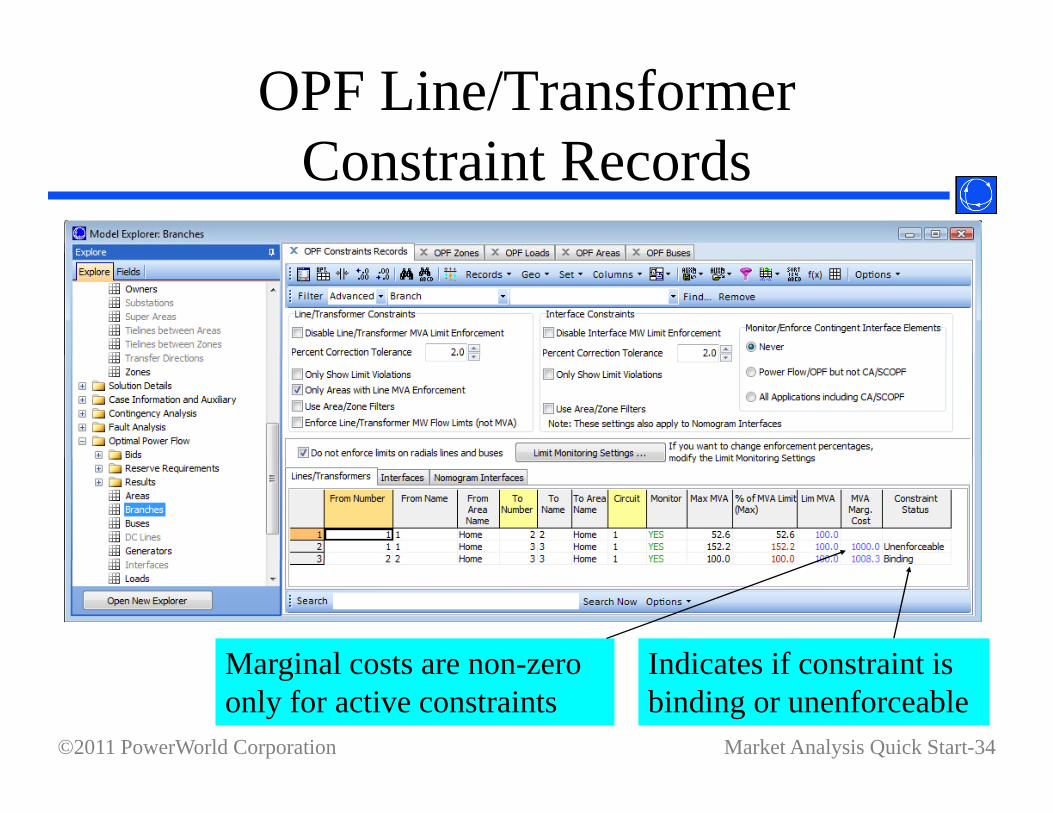
OPF Line/Transformer C t i t R dConstraint Records
Indicates if constraint isMarginal costs are non zero
Market Analysis Quick Start-34©2011 PowerWorld Corporation
Indicates if constraint is binding or unenforceable
Marginal costs are non-zero only for active constraints

Cost of Energy, Losses and C tiCongestion
• Some ISO documents refer to costSome ISO documents refer to cost components of energy, losses, and congestion
• Simulator can resolve the LMP into theseSimulator can resolve the LMP into these components
• Open the B7OPF pwb case for an exampleOpen the B7OPF.pwb case for an example, using a slightly more complex system with transmission lossestransmission losses
Market Analysis Quick Start-35©2011 PowerWorld Corporation

Cost of Energy, Losses and C tiCongestion
• From the Add Ons ribbon tab, select OPF Case InfoFrom the Add Ons ribbon tab, select OPF Case Info OPF Areas.
• For each area:– Set AGC Status to OPF – Toggle Include Marg. Losses column of each area to YES
Market Analysis Quick Start-36©2011 PowerWorld Corporation

Cost of Energy, Losses and C tiCongestion
• Change the load at Bus 5 to 170 MWChange the load at Bus 5 to 170 MW• From the Add Ons ribbon, click Primal LP to solve• The line between buses 2 and 5 is a binding
constraint• Now open OPF Options and Results
G t th R lt B MW M i l P i D t il– Go to the Results Bus MW Marginal Price Detailspage
– Here you will find columns for the MW Marg Cost, Energy, Congestion, and Losses
Market Analysis Quick Start-37©2011 PowerWorld Corporation

Cost of Energy, Losses and C tiCongestion
• Note that the only value that is truly unique for an OPFNote that the only value that is truly unique for an OPF solution is the total MW Marginal Cost k
“I t” f
Market Analysis Quick Start-38©2011 PowerWorld Corporation
LkCkEkk “Impact” of constraints on LMP

Cost of Energy, Loss, andC ti R fCongestion Reference
• The costs of Energy, Losses, and Congestion areThe costs of Energy, Losses, and Congestion are dependent on the reference for Energy and Losses, specified for each region on OPF control: either an area or super area– Return to OPF Case Info OPF Areas– Right-click on Area Top and choose show Dialog– The Cost of Energy, Loss, and Congestion Reference
option group is in the lower leftoption group is in the lower left– Similar settings may be found on the Super Area
dialog
Market Analysis Quick Start-39©2011 PowerWorld Corporation

Super Areasp
• Super areas are a record structure used to hold aSuper areas are a record structure used to hold a set of areas
• Super Areas work like ISOs: a number of control pareas are dispatched as though they were a single area, without fixed interchanges between the individual areas
• Area records are preserved for calculation of average prices, exports, and other quantities
• For a super area to be used in the OPF, its AGC St t fi ld t b OPF
Market Analysis Quick Start-40©2011 PowerWorld Corporation
Status field must be OPF

Super Area Controlp
• For comparison set the present case as theFor comparison, set the present case as the base case again (from Tools Ribbon, choose Difference Flows Set Present aschoose Difference Flows Set Present as Base Case)
• From the Add Ons ribbon select OPF• From the Add Ons ribbon, select OPF Case Info OPF Super AreasRi h li k i h id d l• Right click in the empty grid and select Insert…
Market Analysis Quick Start-41©2011 PowerWorld Corporation

Super Area Controlp
• Right-click in the empty grid and selectRight-click in the empty grid and select Insert…
• Select all areas and click OK• Select all areas and click OK• Choose Optimal Power Flow Control
f h i h i hfrom the option group on the right• Optionally click the Rename button and
rename the super area “ISO”
Market Analysis Quick Start-42©2011 PowerWorld Corporation

Super Area Controlp
Market Analysis Quick Start-43©2011 PowerWorld Corporation

Super Area Controlp
• Click OK to close the dialogClick OK to close the dialog• Toggle Include Marg. Losses to YES
S l h O• Solve the OPF
Market Analysis Quick Start-44©2011 PowerWorld Corporation

Super Area Controlp
• Replacing the 3 area interchange constraintsReplacing the 3 area interchange constraints and with a single power balance constraint for the Super Area allowed a redispatch that p pdecrease the total cost by $89/hour
• LMP changes vary by location. LMPs drop g y y pat buses 1-3, but increase at buses 4-6
• Generator MW output increased at buses 4 pand 6, but decreased at buses 2 and 7
• The line between buses 2 and 5 is still a
Market Analysis Quick Start-45©2011 PowerWorld Corporation
binding constraint

Super Area Controlp
• Change in bus marginal costs with ISOChange in bus marginal costs with ISO Super Area control vs. individual area controlcontrol
Market Analysis Quick Start-46©2011 PowerWorld Corporation

Options for Further Analysisp y
• What are the marginal costs of enforcing the line g gconstraints? How do the system costs change if the line constraints are relaxed (i.e., not enforced)? For example, try solving without enforcing line 2 to 5.p , y g g
• Try these other scenarios– Reduce the fuel cost of the generator at bus 1
Take the generator at bus 4 out of service– Take the generator at bus 4 out of service– Take the line between buses 2 and 5 out of service– Increase the load at bus 3 to 200 MW– Scale the load by 150%, system-wide– Change the minimum MW limit of the generator at bus
2 to 50 MW
Market Analysis Quick Start-47©2011 PowerWorld Corporation
– …and numerous other possibilities

Summaryy
• In nodal markets, clearing prices and “winnersIn nodal markets, clearing prices and winners and losers” may be greatly influenced by inputs and assumptions, including– Generator costs or bids– Generator availability
N t k t l (li i i t)– Network topology (lines in service or out)– Transmission limits
Load: system-wide and at individual buses– Load: system-wide and at individual buses• The concepts analyzed in these simple models
apply to real-world power markets as well
Market Analysis Quick Start-48©2011 PowerWorld Corporation
apply to real world power markets as well

Application of OPF to a L S tLarge System
• Next case is based upon the FERC Form 715 1997 pSummer Peak case filed by NEPOOL– Case includes NEPOOL, NYPP, PJM, and ECAR, representing a
significant portion of the Eastern Interconnect (9270 buses and 2506 t )generators)
– The system was modeled both as a single Super Area and as separate power pools with fixed interchanges
– Most generators have estimated costs (others default to $10/MWh)ost ge e ato s ave est ated costs (ot e s de au t to $ 0/ W )– Market model and results developed in joint project between
PowerWorld and U.S. Energy Information Administration • Such cases are now generally only available in North g y y
America from ISOs, Transmission Operators, and NERC entities. They are proprietary and subject to Critical Energy Infrastructure Information (CEII)
Market Analysis Quick Start-49©2011 PowerWorld Corporation
Critical Energy Infrastructure Information (CEII) restrictions on distribution.

NEPOOL/NYPP/PJM/ECAR Supply CCurve
80.0
60.0
MW
h) Super area has about 160 GW generation, with i f 2 62 GW
40.0
ost (
$ / M imports of 2.62 GW
20.0
gina
l Co
60 100 140 1800.0M
arg
Market Analysis Quick Start-50©2011 PowerWorld Corporation
Total Generation (GW)

System-Wide Super Area:T i i L di t O ti l S l tiTransmission Loading at Optimal Solution
The constrainedlines are shown
Market Analysis Quick Start-51©2011 PowerWorld Corporation
with the largered pie charts

System-Wide Super Area:B M i l P i C tBus Marginal Price Contour
Market Analysis Quick Start-52©2011 PowerWorld Corporation

System-Wide Superarea:85 MW G i W t NY i ffli85 MW Gen in Western NY is offline
N t th l d k t t d d diff i LMP b d
Market Analysis Quick Start-53©2011 PowerWorld Corporation
Note the load pocket created and difference in LMPs based on operation of a single 85 MW generator

Individual Power Pools:B M i l P i C tBus Marginal Price Contour
T t l ti t $4 494 170 / h i f $48 170 / h
Market Analysis Quick Start-54©2011 PowerWorld Corporation
Total operating cost = $4,494,170 / hr, an increase of $48,170 / hrFixed interchange yields “seams” between power pools