Operations management
95
Operations Management Concepts Wiki
description
Concepts Operations Management
Transcript of Operations management

Operations ManagementConcepts Wiki

Contents
1 Operations management 11.1 History . . . . . . . . . . . . . . . . . . . . . . . . . . . . . . . . . . . . . . . . . . . . . . . . . 2
1.1.1 Industrial Revolution . . . . . . . . . . . . . . . . . . . . . . . . . . . . . . . . . . . . . 31.1.2 Operations management . . . . . . . . . . . . . . . . . . . . . . . . . . . . . . . . . . . 3
1.2 Topics . . . . . . . . . . . . . . . . . . . . . . . . . . . . . . . . . . . . . . . . . . . . . . . . . 51.2.1 Production systems . . . . . . . . . . . . . . . . . . . . . . . . . . . . . . . . . . . . . . 51.2.2 Metrics: efficiency and effectiveness . . . . . . . . . . . . . . . . . . . . . . . . . . . . . 71.2.3 Configuration and management . . . . . . . . . . . . . . . . . . . . . . . . . . . . . . . . 81.2.4 Modeling . . . . . . . . . . . . . . . . . . . . . . . . . . . . . . . . . . . . . . . . . . . 101.2.5 Safety, Risk and Maintenance . . . . . . . . . . . . . . . . . . . . . . . . . . . . . . . . . 12
1.3 Organizations . . . . . . . . . . . . . . . . . . . . . . . . . . . . . . . . . . . . . . . . . . . . . 121.4 Journals . . . . . . . . . . . . . . . . . . . . . . . . . . . . . . . . . . . . . . . . . . . . . . . . 121.5 See also . . . . . . . . . . . . . . . . . . . . . . . . . . . . . . . . . . . . . . . . . . . . . . . . 121.6 References . . . . . . . . . . . . . . . . . . . . . . . . . . . . . . . . . . . . . . . . . . . . . . . 121.7 Further reading . . . . . . . . . . . . . . . . . . . . . . . . . . . . . . . . . . . . . . . . . . . . 13
2 Benchmarking 142.1 Benefits and use . . . . . . . . . . . . . . . . . . . . . . . . . . . . . . . . . . . . . . . . . . . . 142.2 Collaborative benchmarking . . . . . . . . . . . . . . . . . . . . . . . . . . . . . . . . . . . . . 142.3 Procedure . . . . . . . . . . . . . . . . . . . . . . . . . . . . . . . . . . . . . . . . . . . . . . . 152.4 Costs . . . . . . . . . . . . . . . . . . . . . . . . . . . . . . . . . . . . . . . . . . . . . . . . . 152.5 Technical/product benchmarking . . . . . . . . . . . . . . . . . . . . . . . . . . . . . . . . . . . 162.6 Types . . . . . . . . . . . . . . . . . . . . . . . . . . . . . . . . . . . . . . . . . . . . . . . . . 162.7 Tools . . . . . . . . . . . . . . . . . . . . . . . . . . . . . . . . . . . . . . . . . . . . . . . . . . 172.8 Metric benchmarking . . . . . . . . . . . . . . . . . . . . . . . . . . . . . . . . . . . . . . . . . 172.9 See also . . . . . . . . . . . . . . . . . . . . . . . . . . . . . . . . . . . . . . . . . . . . . . . . 172.10 References . . . . . . . . . . . . . . . . . . . . . . . . . . . . . . . . . . . . . . . . . . . . . . 17
i

ii CONTENTS
3 Root cause analysis 193.1 General principles of root cause analysis . . . . . . . . . . . . . . . . . . . . . . . . . . . . . . . 203.2 General process for performing and documenting an RCA-based Corrective Action . . . . . . . . . 203.3 See also . . . . . . . . . . . . . . . . . . . . . . . . . . . . . . . . . . . . . . . . . . . . . . . . 213.4 References . . . . . . . . . . . . . . . . . . . . . . . . . . . . . . . . . . . . . . . . . . . . . . . 21
4 Ishikawa diagram 224.1 Overview . . . . . . . . . . . . . . . . . . . . . . . . . . . . . . . . . . . . . . . . . . . . . . . 224.2 Causes . . . . . . . . . . . . . . . . . . . . . . . . . . . . . . . . . . . . . . . . . . . . . . . . . 23
4.2.1 The 6 Ms (used in manufacturing industry) . . . . . . . . . . . . . . . . . . . . . . . . . . 234.2.2 The 7 Ps (used in marketing industry) . . . . . . . . . . . . . . . . . . . . . . . . . . . . 234.2.3 The 5 Ss (used in service industry) . . . . . . . . . . . . . . . . . . . . . . . . . . . . . . 23
4.3 See also . . . . . . . . . . . . . . . . . . . . . . . . . . . . . . . . . . . . . . . . . . . . . . . . 234.4 References . . . . . . . . . . . . . . . . . . . . . . . . . . . . . . . . . . . . . . . . . . . . . . . 23
4.4.1 Further reading . . . . . . . . . . . . . . . . . . . . . . . . . . . . . . . . . . . . . . . . 234.5 External links . . . . . . . . . . . . . . . . . . . . . . . . . . . . . . . . . . . . . . . . . . . . . 24
5 Performance metric 255.1 See also . . . . . . . . . . . . . . . . . . . . . . . . . . . . . . . . . . . . . . . . . . . . . . . . 255.2 References . . . . . . . . . . . . . . . . . . . . . . . . . . . . . . . . . . . . . . . . . . . . . . . 255.3 Further reading . . . . . . . . . . . . . . . . . . . . . . . . . . . . . . . . . . . . . . . . . . . . 26
6 Failure mode and effects analysis 276.1 Introduction . . . . . . . . . . . . . . . . . . . . . . . . . . . . . . . . . . . . . . . . . . . . . . 27
6.1.1 Functional analysis . . . . . . . . . . . . . . . . . . . . . . . . . . . . . . . . . . . . . . 286.1.2 Ground rules . . . . . . . . . . . . . . . . . . . . . . . . . . . . . . . . . . . . . . . . . 286.1.3 Benefits . . . . . . . . . . . . . . . . . . . . . . . . . . . . . . . . . . . . . . . . . . . . 28
6.2 Basic terms . . . . . . . . . . . . . . . . . . . . . . . . . . . . . . . . . . . . . . . . . . . . . . 296.3 History . . . . . . . . . . . . . . . . . . . . . . . . . . . . . . . . . . . . . . . . . . . . . . . . 296.4 Example worksheet (ARP4761) - Design (Hardware) FMEA . . . . . . . . . . . . . . . . . . . . 30
6.4.1 Probability (P) . . . . . . . . . . . . . . . . . . . . . . . . . . . . . . . . . . . . . . . . 306.4.2 Severity (S) . . . . . . . . . . . . . . . . . . . . . . . . . . . . . . . . . . . . . . . . . . 306.4.3 Detection (D) . . . . . . . . . . . . . . . . . . . . . . . . . . . . . . . . . . . . . . . . . 306.4.4 Risk level (P*S) and (D) . . . . . . . . . . . . . . . . . . . . . . . . . . . . . . . . . . . 31
6.5 Timing . . . . . . . . . . . . . . . . . . . . . . . . . . . . . . . . . . . . . . . . . . . . . . . . 316.6 Uses . . . . . . . . . . . . . . . . . . . . . . . . . . . . . . . . . . . . . . . . . . . . . . . . . . 32

CONTENTS iii
6.7 Advantages . . . . . . . . . . . . . . . . . . . . . . . . . . . . . . . . . . . . . . . . . . . . . . 326.8 Limitations . . . . . . . . . . . . . . . . . . . . . . . . . . . . . . . . . . . . . . . . . . . . . . 326.9 Types . . . . . . . . . . . . . . . . . . . . . . . . . . . . . . . . . . . . . . . . . . . . . . . . . 326.10 See also . . . . . . . . . . . . . . . . . . . . . . . . . . . . . . . . . . . . . . . . . . . . . . . . 336.11 References . . . . . . . . . . . . . . . . . . . . . . . . . . . . . . . . . . . . . . . . . . . . . . . 33
7 Work breakdown structure 357.1 Overview . . . . . . . . . . . . . . . . . . . . . . . . . . . . . . . . . . . . . . . . . . . . . . . 357.2 History . . . . . . . . . . . . . . . . . . . . . . . . . . . . . . . . . . . . . . . . . . . . . . . . 367.3 Design principles . . . . . . . . . . . . . . . . . . . . . . . . . . . . . . . . . . . . . . . . . . . 37
7.3.1 100% rule . . . . . . . . . . . . . . . . . . . . . . . . . . . . . . . . . . . . . . . . . . 377.3.2 Plan outcomes, not actions . . . . . . . . . . . . . . . . . . . . . . . . . . . . . . . . . . 377.3.3 Level of detail . . . . . . . . . . . . . . . . . . . . . . . . . . . . . . . . . . . . . . . . 377.3.4 Coding scheme . . . . . . . . . . . . . . . . . . . . . . . . . . . . . . . . . . . . . . . . 387.3.5 Terminal element . . . . . . . . . . . . . . . . . . . . . . . . . . . . . . . . . . . . . . . 387.3.6 Consistent to Norms . . . . . . . . . . . . . . . . . . . . . . . . . . . . . . . . . . . . . 39
7.4 Example . . . . . . . . . . . . . . . . . . . . . . . . . . . . . . . . . . . . . . . . . . . . . . . 397.5 Misconceptions . . . . . . . . . . . . . . . . . . . . . . . . . . . . . . . . . . . . . . . . . . . . 397.6 See also . . . . . . . . . . . . . . . . . . . . . . . . . . . . . . . . . . . . . . . . . . . . . . . . 397.7 References . . . . . . . . . . . . . . . . . . . . . . . . . . . . . . . . . . . . . . . . . . . . . . . 397.8 Further reading . . . . . . . . . . . . . . . . . . . . . . . . . . . . . . . . . . . . . . . . . . . . 407.9 External links . . . . . . . . . . . . . . . . . . . . . . . . . . . . . . . . . . . . . . . . . . . . . 40
8 Supply chain management 428.1 Origin of the Term and Definitions . . . . . . . . . . . . . . . . . . . . . . . . . . . . . . . . . . 428.2 Functions . . . . . . . . . . . . . . . . . . . . . . . . . . . . . . . . . . . . . . . . . . . . . . . 438.3 Importance . . . . . . . . . . . . . . . . . . . . . . . . . . . . . . . . . . . . . . . . . . . . . . 448.4 Historical developments . . . . . . . . . . . . . . . . . . . . . . . . . . . . . . . . . . . . . . . . 44
8.4.1 Creation era . . . . . . . . . . . . . . . . . . . . . . . . . . . . . . . . . . . . . . . . . . 448.4.2 Integration era . . . . . . . . . . . . . . . . . . . . . . . . . . . . . . . . . . . . . . . . . 448.4.3 Globalization era . . . . . . . . . . . . . . . . . . . . . . . . . . . . . . . . . . . . . . . 458.4.4 Specialization era (phase I): outsourced manufacturing and distribution . . . . . . . . . . . 458.4.5 Specialization era (phase II): supply chain management as a service . . . . . . . . . . . . . 458.4.6 Supply chain management 2.0 (SCM 2.0) . . . . . . . . . . . . . . . . . . . . . . . . . . 46
8.5 Business process integration . . . . . . . . . . . . . . . . . . . . . . . . . . . . . . . . . . . . . 468.6 Theories . . . . . . . . . . . . . . . . . . . . . . . . . . . . . . . . . . . . . . . . . . . . . . . . 48

iv CONTENTS
8.7 Supply chain centroids . . . . . . . . . . . . . . . . . . . . . . . . . . . . . . . . . . . . . . . . . 498.8 Tax efficient supply chain management . . . . . . . . . . . . . . . . . . . . . . . . . . . . . . . . 498.9 Sustainability and social responsibility in supply chains . . . . . . . . . . . . . . . . . . . . . . . . 498.10 Components . . . . . . . . . . . . . . . . . . . . . . . . . . . . . . . . . . . . . . . . . . . . . 50
8.10.1 Management components . . . . . . . . . . . . . . . . . . . . . . . . . . . . . . . . . . 508.10.2 Reverse supply chain . . . . . . . . . . . . . . . . . . . . . . . . . . . . . . . . . . . . . 51
8.11 Systems and value . . . . . . . . . . . . . . . . . . . . . . . . . . . . . . . . . . . . . . . . . . . 518.12 Global applications . . . . . . . . . . . . . . . . . . . . . . . . . . . . . . . . . . . . . . . . . . 518.13 Certification . . . . . . . . . . . . . . . . . . . . . . . . . . . . . . . . . . . . . . . . . . . . . . 518.14 Supply chain management college level education . . . . . . . . . . . . . . . . . . . . . . . . . . . 528.15 See also . . . . . . . . . . . . . . . . . . . . . . . . . . . . . . . . . . . . . . . . . . . . . . . . 538.16 References . . . . . . . . . . . . . . . . . . . . . . . . . . . . . . . . . . . . . . . . . . . . . . . 538.17 Further reading . . . . . . . . . . . . . . . . . . . . . . . . . . . . . . . . . . . . . . . . . . . . 548.18 External links . . . . . . . . . . . . . . . . . . . . . . . . . . . . . . . . . . . . . . . . . . . . . 55
9 Lean manufacturing 569.1 Overview . . . . . . . . . . . . . . . . . . . . . . . . . . . . . . . . . . . . . . . . . . . . . . . 56
9.1.1 Origins . . . . . . . . . . . . . . . . . . . . . . . . . . . . . . . . . . . . . . . . . . . . 579.2 A brief history of waste reduction thinking . . . . . . . . . . . . . . . . . . . . . . . . . . . . . . 58
9.2.1 Pre-20th century . . . . . . . . . . . . . . . . . . . . . . . . . . . . . . . . . . . . . . . 589.2.2 20th century . . . . . . . . . . . . . . . . . . . . . . . . . . . . . . . . . . . . . . . . . . 589.2.3 Ford gets the ball rolling . . . . . . . . . . . . . . . . . . . . . . . . . . . . . . . . . . . 599.2.4 Toyota develops TPS . . . . . . . . . . . . . . . . . . . . . . . . . . . . . . . . . . . . . 60
9.3 Types of waste . . . . . . . . . . . . . . . . . . . . . . . . . . . . . . . . . . . . . . . . . . . . . 609.4 Lean implementation develops from TPS . . . . . . . . . . . . . . . . . . . . . . . . . . . . . . . 62
9.4.1 An example program . . . . . . . . . . . . . . . . . . . . . . . . . . . . . . . . . . . . . 629.4.2 Lean leadership . . . . . . . . . . . . . . . . . . . . . . . . . . . . . . . . . . . . . . . . 629.4.3 Differences from TPS . . . . . . . . . . . . . . . . . . . . . . . . . . . . . . . . . . . . . 63
9.5 Lean services . . . . . . . . . . . . . . . . . . . . . . . . . . . . . . . . . . . . . . . . . . . . . 649.6 Lean goals and strategy . . . . . . . . . . . . . . . . . . . . . . . . . . . . . . . . . . . . . . . . 649.7 The Lean Management Model . . . . . . . . . . . . . . . . . . . . . . . . . . . . . . . . . . . . . 659.8 Steps to achieve lean systems . . . . . . . . . . . . . . . . . . . . . . . . . . . . . . . . . . . . . 65
9.8.1 Design a simple manufacturing system . . . . . . . . . . . . . . . . . . . . . . . . . . . . 659.8.2 There is always room for improvement . . . . . . . . . . . . . . . . . . . . . . . . . . . . 659.8.3 Continuously improve . . . . . . . . . . . . . . . . . . . . . . . . . . . . . . . . . . . . . 659.8.4 Measure . . . . . . . . . . . . . . . . . . . . . . . . . . . . . . . . . . . . . . . . . . . . 65

CONTENTS v
9.8.5 9 Steps for Creating World Class Organization . . . . . . . . . . . . . . . . . . . . . . . . 659.9 Implementation pitfalls . . . . . . . . . . . . . . . . . . . . . . . . . . . . . . . . . . . . . . . . 659.10 See also . . . . . . . . . . . . . . . . . . . . . . . . . . . . . . . . . . . . . . . . . . . . . . . . 669.11 References . . . . . . . . . . . . . . . . . . . . . . . . . . . . . . . . . . . . . . . . . . . . . . . 669.12 Further reading . . . . . . . . . . . . . . . . . . . . . . . . . . . . . . . . . . . . . . . . . . . . 679.13 External links . . . . . . . . . . . . . . . . . . . . . . . . . . . . . . . . . . . . . . . . . . . . . 67
10 Pareto chart 6810.1 See also . . . . . . . . . . . . . . . . . . . . . . . . . . . . . . . . . . . . . . . . . . . . . . . . 6810.2 References . . . . . . . . . . . . . . . . . . . . . . . . . . . . . . . . . . . . . . . . . . . . . . . 6810.3 Further reading . . . . . . . . . . . . . . . . . . . . . . . . . . . . . . . . . . . . . . . . . . . . 68
11 ABC analysis 7011.1 ABC analysis categories . . . . . . . . . . . . . . . . . . . . . . . . . . . . . . . . . . . . . . . 7011.2 ABC analysis in ERP packages . . . . . . . . . . . . . . . . . . . . . . . . . . . . . . . . . . . . 7011.3 Example of the application of weighed operation based on ABC class . . . . . . . . . . . . . . . . 7111.4 See also . . . . . . . . . . . . . . . . . . . . . . . . . . . . . . . . . . . . . . . . . . . . . . . . 7111.5 References . . . . . . . . . . . . . . . . . . . . . . . . . . . . . . . . . . . . . . . . . . . . . . . 7211.6 External links . . . . . . . . . . . . . . . . . . . . . . . . . . . . . . . . . . . . . . . . . . . . . 72
12 Just in time (business) 7312.1 Philosophy . . . . . . . . . . . . . . . . . . . . . . . . . . . . . . . . . . . . . . . . . . . . . . . 7312.2 Transaction cost approach . . . . . . . . . . . . . . . . . . . . . . . . . . . . . . . . . . . . . . . 7312.3 Environmental concerns . . . . . . . . . . . . . . . . . . . . . . . . . . . . . . . . . . . . . . . . 7412.4 Price change . . . . . . . . . . . . . . . . . . . . . . . . . . . . . . . . . . . . . . . . . . . . . . 7412.5 Quality volatility . . . . . . . . . . . . . . . . . . . . . . . . . . . . . . . . . . . . . . . . . . . . 7412.6 Supply stability . . . . . . . . . . . . . . . . . . . . . . . . . . . . . . . . . . . . . . . . . . . . 7412.7 JIT implementation design . . . . . . . . . . . . . . . . . . . . . . . . . . . . . . . . . . . . . . . 74
12.7.1 Effects . . . . . . . . . . . . . . . . . . . . . . . . . . . . . . . . . . . . . . . . . . . . . 7512.7.2 Benefits . . . . . . . . . . . . . . . . . . . . . . . . . . . . . . . . . . . . . . . . . . . . 7512.7.3 Problems . . . . . . . . . . . . . . . . . . . . . . . . . . . . . . . . . . . . . . . . . . . 75
12.8 Business models following similar approach . . . . . . . . . . . . . . . . . . . . . . . . . . . . . . 7712.8.1 Vendor-managed inventory . . . . . . . . . . . . . . . . . . . . . . . . . . . . . . . . . . 7712.8.2 Customer-managed inventory . . . . . . . . . . . . . . . . . . . . . . . . . . . . . . . . . 77
12.9 Early use of a JIT system . . . . . . . . . . . . . . . . . . . . . . . . . . . . . . . . . . . . . . . 7712.10See also . . . . . . . . . . . . . . . . . . . . . . . . . . . . . . . . . . . . . . . . . . . . . . . . 77

vi CONTENTS
12.11References . . . . . . . . . . . . . . . . . . . . . . . . . . . . . . . . . . . . . . . . . . . . . . . 7812.12Further reading . . . . . . . . . . . . . . . . . . . . . . . . . . . . . . . . . . . . . . . . . . . . 78
13 Schedule 7913.1 Kinds of schedules . . . . . . . . . . . . . . . . . . . . . . . . . . . . . . . . . . . . . . . . . . . 80
13.1.1 Publicly available schedules . . . . . . . . . . . . . . . . . . . . . . . . . . . . . . . . . . 8013.1.2 Internal schedules . . . . . . . . . . . . . . . . . . . . . . . . . . . . . . . . . . . . . . . 80
13.2 References . . . . . . . . . . . . . . . . . . . . . . . . . . . . . . . . . . . . . . . . . . . . . . . 8113.3 See also . . . . . . . . . . . . . . . . . . . . . . . . . . . . . . . . . . . . . . . . . . . . . . . . 8213.4 Text and image sources, contributors, and licenses . . . . . . . . . . . . . . . . . . . . . . . . . . 83
13.4.1 Text . . . . . . . . . . . . . . . . . . . . . . . . . . . . . . . . . . . . . . . . . . . . . . 8313.4.2 Images . . . . . . . . . . . . . . . . . . . . . . . . . . . . . . . . . . . . . . . . . . . . 8613.4.3 Content license . . . . . . . . . . . . . . . . . . . . . . . . . . . . . . . . . . . . . . . . 88

Chapter 1
Operations management
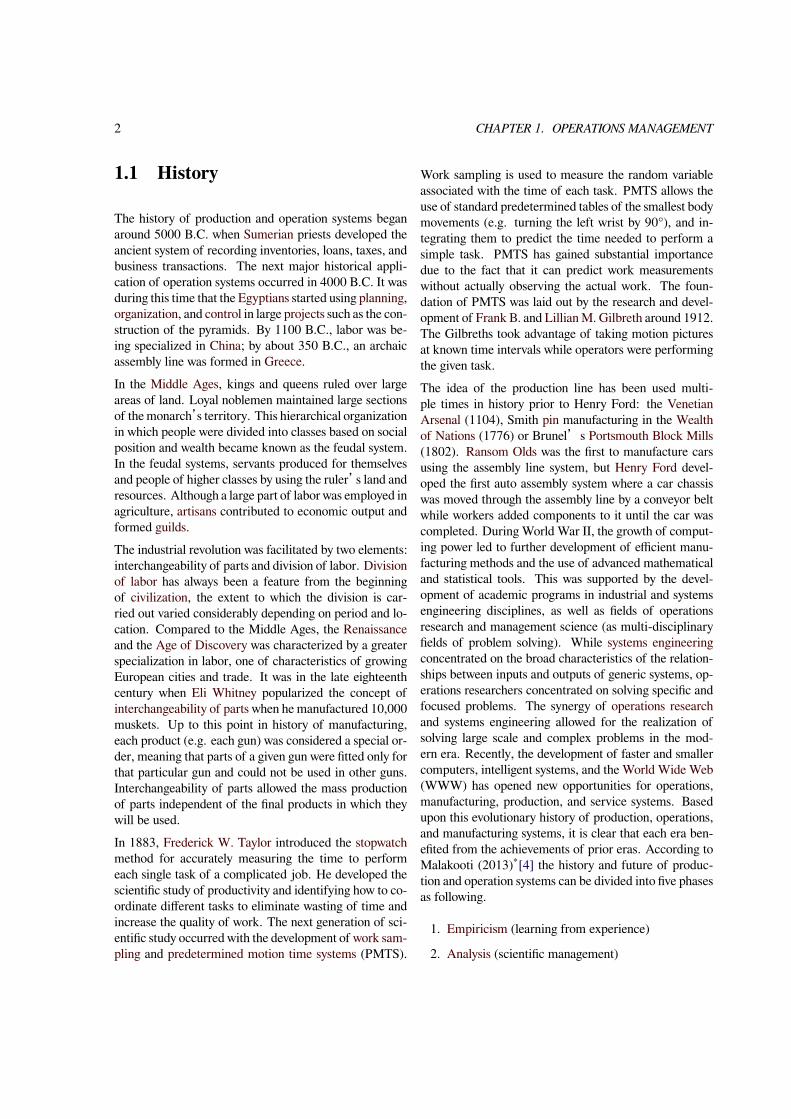
Operations management is an area of managementconcerned with overseeing, designing, and controlling theprocess of production and redesigning business opera-tions in the production of goods or services. It involvesthe responsibility of ensuring that business operations areefficient in terms of using as few resources as needed, andeffective in terms of meeting customer requirements. It isconcerned with managing the process that converts inputs(in the forms of raw materials, labor, and energy) intooutputs (in the form of goods and/or services).*[1] Therelationship of operations management to senior man-agement in commercial contexts can be compared to therelationship of line officers to highest-level senior offi-cers in military science. The highest-level officers shapethe strategy and revise it over time, while the line offi-cers make tactical decisions in support of carrying out thestrategy. In business as in military affairs, the boundariesbetween levels are not always distinct; tactical informa-tion dynamically informs strategy, and individual peopleoften move between roles over time.According to the United States Department of Education,operations management is the field concerned with man-aging and directing the physical and/or technical func-tions of a firm or organization, particularly those relatingto development, production, and manufacturing. Oper-ations management programs typically include instruc-tion in principles of general management, manufacturingand production systems, factory management, equipmentmaintenance management, production control, indus-trial labor relations and skilled trades supervision, strate-gic manufacturing policy, systems analysis, productivityanalysis and cost control, and materials planning.*[2]*[3]Management, including operations management, is likeengineering in that it blends art with applied science. Peo-ple skills, creativity, rational analysis, and knowledge oftechnology are all required for success.
Ford Motor car assembly line: the classical example of a manu-facturing production system.
Airport queue. Operations Management studies both manufac-turing and services.
1
2 CHAPTER 1. OPERATIONS MANAGEMENT
1.1 History
The history of production and operation systems beganaround 5000 B.C. when Sumerian priests developed theancient system of recording inventories, loans, taxes, andbusiness transactions. The next major historical appli-cation of operation systems occurred in 4000 B.C. It wasduring this time that the Egyptians started using planning,organization, and control in large projects such as the con-struction of the pyramids. By 1100 B.C., labor was be-ing specialized in China; by about 350 B.C., an archaicassembly line was formed in Greece.In the Middle Ages, kings and queens ruled over largeareas of land. Loyal noblemen maintained large sectionsof themonarch s̓ territory. This hierarchical organizationin which people were divided into classes based on socialposition and wealth became known as the feudal system.In the feudal systems, servants produced for themselvesand people of higher classes by using the ruler s̓ land andresources. Although a large part of labor was employed inagriculture, artisans contributed to economic output andformed guilds.The industrial revolution was facilitated by two elements:interchangeability of parts and division of labor. Divisionof labor has always been a feature from the beginningof civilization, the extent to which the division is car-ried out varied considerably depending on period and lo-cation. Compared to the Middle Ages, the Renaissanceand the Age of Discovery was characterized by a greaterspecialization in labor, one of characteristics of growingEuropean cities and trade. It was in the late eighteenthcentury when Eli Whitney popularized the concept ofinterchangeability of parts when he manufactured 10,000muskets. Up to this point in history of manufacturing,each product (e.g. each gun) was considered a special or-der, meaning that parts of a given gun were fitted only forthat particular gun and could not be used in other guns.Interchangeability of parts allowed the mass productionof parts independent of the final products in which theywill be used.In 1883, Frederick W. Taylor introduced the stopwatchmethod for accurately measuring the time to performeach single task of a complicated job. He developed thescientific study of productivity and identifying how to co-ordinate different tasks to eliminate wasting of time andincrease the quality of work. The next generation of sci-entific study occurred with the development of work sam-pling and predetermined motion time systems (PMTS).
Work sampling is used to measure the random variableassociated with the time of each task. PMTS allows theuse of standard predetermined tables of the smallest bodymovements (e.g. turning the left wrist by 90°), and in-tegrating them to predict the time needed to perform asimple task. PMTS has gained substantial importancedue to the fact that it can predict work measurementswithout actually observing the actual work. The foun-dation of PMTS was laid out by the research and devel-opment of Frank B. and LillianM. Gilbreth around 1912.The Gilbreths took advantage of taking motion picturesat known time intervals while operators were performingthe given task.The idea of the production line has been used multi-ple times in history prior to Henry Ford: the VenetianArsenal (1104), Smith pin manufacturing in the Wealthof Nations (1776) or Brunelʼs Portsmouth Block Mills(1802). Ransom Olds was the first to manufacture carsusing the assembly line system, but Henry Ford devel-oped the first auto assembly system where a car chassiswas moved through the assembly line by a conveyor beltwhile workers added components to it until the car wascompleted. During World War II, the growth of comput-ing power led to further development of efficient manu-facturing methods and the use of advanced mathematicaland statistical tools. This was supported by the devel-opment of academic programs in industrial and systemsengineering disciplines, as well as fields of operationsresearch and management science (as multi-disciplinaryfields of problem solving). While systems engineeringconcentrated on the broad characteristics of the relation-ships between inputs and outputs of generic systems, op-erations researchers concentrated on solving specific andfocused problems. The synergy of operations researchand systems engineering allowed for the realization ofsolving large scale and complex problems in the mod-ern era. Recently, the development of faster and smallercomputers, intelligent systems, and the World Wide Web(WWW) has opened new opportunities for operations,manufacturing, production, and service systems. Basedupon this evolutionary history of production, operations,and manufacturing systems, it is clear that each era ben-efited from the achievements of prior eras. According toMalakooti (2013)*[4] the history and future of produc-tion and operation systems can be divided into five phasesas following.
1. Empiricism (learning from experience)
2. Analysis (scientific management)

1.1. HISTORY 3
3. Synthesis (development of mathematical problemsolving tools)
4. Isolated Systems with Single Objective (use ofIntegrated and Intelligent Systems, and WWW)
5. Integrated Complex Systems with Multiple Objec-tives (development of ecologically sound systems,environmentally sustainable systems, consideringindividual preferences)
Some of these historical aspects are examined in moredetail bellow.
1.1.1 Industrial Revolution
Marshall s̓ flax mill in Holbeck. The textile industry is the pro-totypical example of the English industrial revolution.
See also: Industrial Revolution and Productivity improv-ing technologies (historical)
Before the First industrial revolution work was mainlydone through two systems: domestic system and craftguilds. In the domestic system merchants took mate-rials to homes where artisans performed the necessarywork, craft guilds on the other hand were associationsof artisans which passed work from one shop to another,for example: leather was tanned by a tanner, passed tocurriers, and finally arrived at shoemakers and saddlers.The beginning of the industrial revolution is usually as-sociated with 18th century English textile industry, withthe invention of flying shuttle by John Kay in 1733, thespinning jenny by James Hargreaves in 1765, the water
frame by Richard Arkwright in 1769 and the steam en-gine by JamesWatt in 1765. In 1851 at the Crystal PalaceExhibition the term American system of manufacturingwas used to describe the new approach that was evolvingin the United States of America which was based on twocentral features: interchangeable parts and extensive useof mechanization to produce them.Henry Ford was 39 years old when he founded the FordMotor Company in 1903, with $28,000 capital fromtwelves investors. The model T car was introduced in1908, however it was not until Ford implemented the as-sembly line concept, that his vision of making a popu-lar car affordable by every middle-class American citizenwould be realized. The first factory in which Henry Fordused the concept of the assembly line was Highland Park(1913), he characterized the system as follows:
“The thing is to keep everything in mo-tion and take the work to the man and not theman to the work. That is the real principle ofour production, and conveyors are only one ofmany means to an end”*[5]
This became one the central ideas that led to mass pro-duction, one of the main elements of the Second Indus-trial Revolution, along with emergence of the electricalindustry and petroleum industry.
1.1.2 Operations management
Although productivity benefited considerably from tech-nological inventions and division of labour, the prob-lem of systematic measurement of performances and thecalculation of these by the use of formulas remainedsomewhat unexplored until Frederick Winslow Taylor.Frederick Taylor early work focused on developing whathe called a“differential piece-rate system”*[6] and a se-ries of experiments, measurements and formulas dealingwith cutting metals*[7] and manual labor.*[8] The dif-ferential piece-rate system consisted in offering two dif-ferent pay rates for doing a job: a higher rate for work-ers with high productivity (efficiency) and who producedhigh quality goods (effectiveness) and a lower rate forthose who fail to achieve the standard. One of the prob-lems Taylor believed could be solved with this system,was the problem of soldiering: faster workers reducingtheir production rate to that of the slowest worker. In1911 Taylor published his“The Principles of Scientific

4 CHAPTER 1. OPERATIONS MANAGEMENT
Management”,*[9] in which he characterized scientificmanagement as:
1. The development of a true science;
2. The scientific selection of the worker;
3. The scientific education and development of theworker;
4. Intimate friendly cooperation between the manage-ment and the workers.
Taylor is also credited for developing stopwatch timestudy, this combined with Frank and Lillian Gilbrethmotion study gave way to time and motion study whichis centered on the concepts of standard method andstandard time. Frank Gilbreth is also responsible for in-troducing the flow process chart. Other contemporariesof Taylor worth remembering are Morris Cooke (ruralelectrification in 1920s and implementer of Taylor s̓ prin-ciples of scientific management in the Philadelphia s̓ De-partment of Public Works), Carl Barth (speed-and-feed-calculating slide rules ) and Henry Gantt (Gantt chart).Also in 1910 Hugo Diemer published the first industrialengineering book: Factory Organization and Administra-tion.In 1913 Ford W. Harris published his“HowMany partsto make at once”in which he presented the idea of theeconomic order quantity model. He described the prob-lem as follows:
extquotedblInterest on capital tied up inwages, material and overhead sets a maximumlimit to the quantity of parts which can beprofitably manufactured at one time; extquot-edblset-up extquotedbl costs on the job fix theminimum. Experience has shown one managera way to determine the economical size of lots”*[10]
This paper inspired a large body of mathematical litera-ture focusing on the problem of production planning andinventory control.In 1924 Walter Shewhart introduced the control chartthrough a technical memorandum while working at BellLabs, central to his method was the distinction betweencommon cause and special cause of variation. In 1931Shewhart published his Economic Control of Quality
of Manufactured Product, the first systematic treatment*[11] of the subject of Statistical Process Control.In the 1940s methods-time measurement (MTM) wasdeveloped by H.B. Maynard, JL Schwab and GJ Stege-merten. MTM was the first of a series of predeterminedmotion time systems, predetermined in the sense that es-timates of time are not determined in loco but are de-rived from an industry standard. This was explained byits originators in a book they published in 1948 called“Method-Time Measurement”.*[12]Up to this point in history, optimization techniques wereknown for a very long time, from the simple methods em-ployed by F.W.Harris to the more elaborate techniquesof the calculus of variations developed by Euler in 1733or the multipliers employed by Lagrange in 1811, andcomputers were slowly being developed, first as analogcomputers by Sir William Thomson (1872) and JamesThomson (1876) moving to the eletromechanical com-puters of Konrad Zuse (1939 and1941). During WorldWar II however, the development of mathematical op-timization went trough a major boost with the develop-ment of the Colossus computer, the first eletronic digi-tal computer that was all programmable, and the possi-bility to computationally solve large linear programmingproblems, first by Kantorovich in 1939 working for theSoviet government and latter on in 1947 with the simplexmethod of Dantzig. These methods are know today asbelonging to the field of operations research.From this point on a curious development took place:while in the United States the possibility of applying thecomputer to business operations led to the developmentof management software architecture such as MRP andsuccessive modifications, and ever more sophisticated op-timization techniques and manufacturing simulation soft-ware, in post-war Japan a series of events at ToyotaMotorled to the development of the Toyota Production System(TPS) and Lean Manufacturing.In 1943, in Japan, Taiichi Ohno arrived at Toyota Mo-tor company. Toyota evolved a unique manufacturingsystem centered on two complementary notions: just intime (produce only what is needed) and autonomation(automation with a human touch). Regarding JIT, Ohnowas inspired by American supermarkets: workstationsfunctioned like a supermarket shelf where the customercan get products they need, at the time they need and inthe amount needed, the workstation (shelf) is then re-stocked. Autonomation was developed by Toyoda Sa-kichi in Toyoda Spinning and Weaving: an automatically
1.2. TOPICS 5
activated loom that was also foolproof, that is automati-cally detected problems. In 1983 J.N Edwards publishedhis “MRP and Kanban-American style”in which hedescribed JIT goals in terms of seven zeros:*[13] zerodefects, zero (excess) lot size, zero setups, zero break-downs, zero handling, zero lead time and zero surging.This period also marks the spread of Total Quality Man-agement in Japan, ideas initially developed by Americanauthors such as Deming, Juran and Armand V. Feigen-baum. Schnonberger*[14] identified seven fundamentalsprinciples essential to the Japanese approach:
1. Process control: SPC and worker responsibility overquality
2. Easy able -to-see quality: boards, gauges, meters,etc. and poka-yoke
3. Insistence on compliance: “quality first”
4. Line stop: stop the line to correct quality problems
5. Correcting one s̓ own errors: worker fixed a defec-tive part if he produced it
6. The 100% check: automated inspection techniquesand foolproof machines
7. Continual improvement: ideally zero defects
In 1987 the International Organization for Standardiza-tion (ISO), recognizing the growing importance of qual-ity, issued the ISO 9000, a family of standards relatedto quality management systems. There has been somecontroversy thought regarding the proper procedures tofollow and the amount of paperwork involved.Meanwhile in 1964, a different approach was developedby Joseph Orlicky as a response to the TOYOTA Man-ufacturing Program: Material Requirements Planning(MRP) at IBM, latter gaining momentum in 1972 whenthe American Production and Inventory Control Societylaunched the “MRP Crusade”. One of the key in-sights of this management system was the distinction be-tween dependent demand and independent demand. In-dependent demand is demand which originates outside ofthe production system, therefore not directly controllable,and dependent demand is demand for components of finalproducts, therefore subject to being directly controllableby management through the bill of materials, via productdesign. MRP II was developed by Gene Thomas at IBM,
and expanded the original MRP software to include ad-ditional production functions. Enterprise resource plan-ning (ERP) is the actual software architecture, whichaddresses, besides production operations, distribution,accounting, human resources and procurement.Recent trends in the field revolve around concepts such asBusiness Process Re-engineering (launched by MichaelHammer in 1993*[15]), Lean Manufacturing, Six Sigma(an approach to quality developed at Motorola between1985-1987) and Reconfigurable Manufacturing Systems.The term lean manufacturing was coined in the book TheMachine that Changed the World.*[16] Six Sigma refersto control limits placed at six (6) standard deviations fromthe mean of a normal distribution, this became very fa-mous after Jack Welch of General Electric launched acompany-wide initiative in 1995 to adopt this set ofmeth-ods. More recently, Six Sigma has included DMAIC (forimproving processes) and DFSS (for designing new prod-ucts and new processes)
1.2 Topics
1.2.1 Production systems
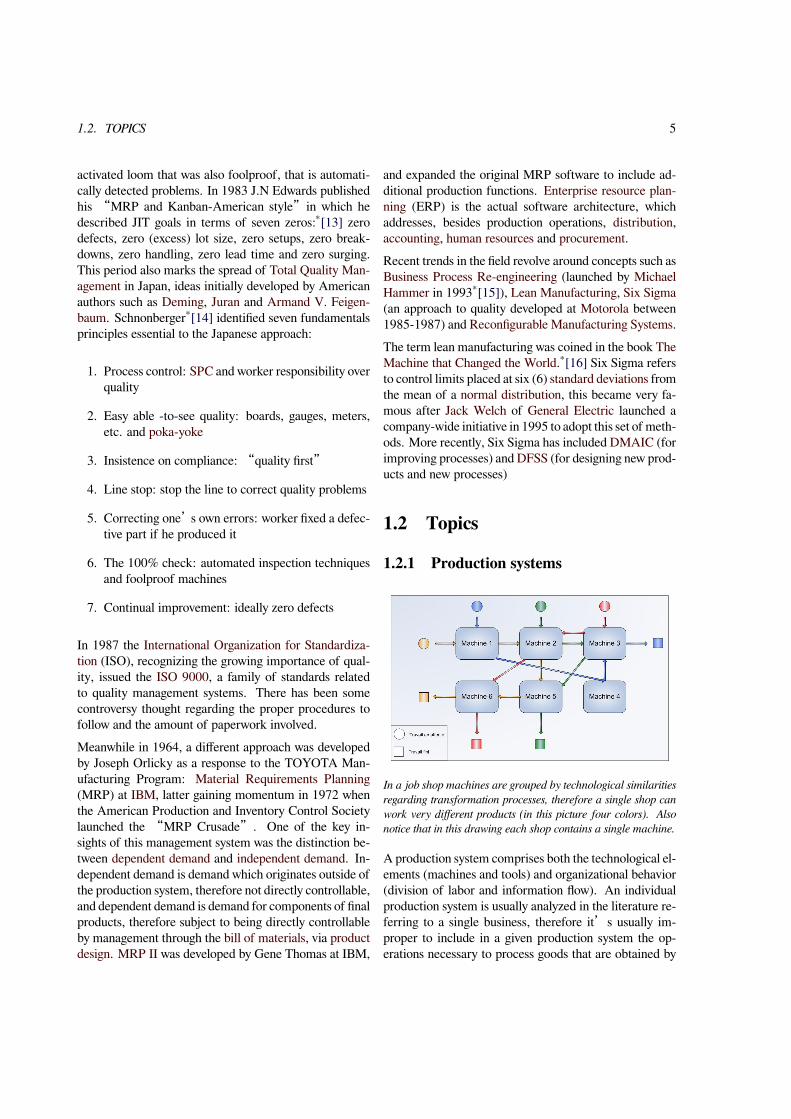
In a job shop machines are grouped by technological similaritiesregarding transformation processes, therefore a single shop canwork very different products (in this picture four colors). Alsonotice that in this drawing each shop contains a single machine.
A production system comprises both the technological el-ements (machines and tools) and organizational behavior(division of labor and information flow). An individualproduction system is usually analyzed in the literature re-ferring to a single business, therefore itʼs usually im-proper to include in a given production system the op-erations necessary to process goods that are obtained by

6 CHAPTER 1. OPERATIONS MANAGEMENT
Flexible Manufacturing System: in the middle there are two railsfor the shuttle to move pallets between machining centers (thereare also FMSwhich use AGVs), in front of each machining centerthere is a buffer and in left we have a shelf for storing pallets.Usually in the back there is a similar system for managing the setof tools required for different machining operations.
purchasing or the operations carried by the customer onthe sold products, the reason being simply that since busi-nesses need to design their own production systems thisthen becomes the focus of analysis, modeling and deci-sion making (also called“configuring”a production sys-tem) .A first possible distinction in production systems (techno-logical classification) is between continuous process pro-duction and discrete part production (manufacturing).
• Process production means that the product under-goes physical-chemical transformations and lacksassembly operations, therefore the original raw ma-terials cant easily be obtained from the final prod-uct, examples include: paper, cement, nylon andpetroleum products.
• Part production (ex:cars and ovens) comprises bothfabrication systems and assembly systems. In thefirst category we find job shops, manufacturing cells,flexible manufacturing systems and transfer lines, inthe assembly category we have fixed position sys-tems, assembly lines and assembly shops (both man-ual and/or automated operations).*[17]*[18]
Another possible classification*[19] is one based on LeadTime (manufacturing lead time vs delivery lead time):Engineer to Order (ETO, Purchase to Order (PTO),
Delivery lead time is the blue bar, manufacturing time is thewhole bar, the green bar is the difference between the two.
Make to Order (MTO), Assemble to Order (ATO) andMake to Stock (MTS). According to this classificationdifferent kinds of systems will have different customerorder decoupling points (CODP), meaning that Work inProgress (WIP) cycle stock levels are practically nonexis-tent regarding operations located after the CODP (exceptfor WIP due to queues). (See Order fulfillment)The concept of production systems can be expanded tothe service sector world keeping in mind that serviceshave some fundamental differences in respect to materialgoods: intangibility, client always present during trans-formation processes, no stocks for“finished goods”. Ser-vices can be classified according to a service process ma-trix:*[20] degree of labor intensity (volume) vs degree ofcustomization (variety). With a high degree of labor in-tensity there areMass Services (e.g., commercial bankingbill payments and state schools) and Professional Services(e.g., personal physicians and lawyers), while with a lowdegree of labor intensity there are Service Factories (e.g.,airlines and hotels) and Service Shops (e.g., hospitals andauto mechanics).The systems described above are ideal types: real systemsmay present themselves as hybrids of those categories.Consider, for example, that the production of jeans in-volves initially carding, spinning, dyeing and weaving,then cutting the fabric in different shapes and assem-bling the parts in pants or jackets by combining thefabric with thread, zippers and buttons, finally finishingand distressing the pants/jackets before being shipped tostores.*[21] The beginning can be seen as process pro-duction, the middle as part production and the end againas process production: itʼs unlikely that a single com-

1.2. TOPICS 7
pany will keep all the stages of production under a sin-gle roof, therefore the problem of vertical integration andoutsourcing arises. Most products require, from a supplychain perspective, both process production and part pro-duction.
1.2.2 Metrics: efficiency and effectiveness
Operations strategy concerns policies and plans of use ofthe firm productive resources with the aim of support-ing long term competitive strategy. Metrics in operationsmanagement can be broadly classified into efficiencymet-rics and effectiveness metrics. Effectiveness metrics in-volve:
1. Price (actually fixed by marketing, but lowerbounded by production cost): purchase price, usecosts, maintenance costs, upgrade costs, disposalcosts
2. Quality: specification and compliance
3. Time: productive lead time, information lead time,punctuality
4. Flexibility: mix, volume, gamma
5. Stock availability
6. Ecological Soundness: biological and environmentalimpacts of the system under study.*[4]
A more recent approach, introduced by Terry Hill,*[22]involves distinguishing competitive variables in orderwinner and order qualifiers when defining operationsstrategy. Order winners are variables which permit dif-ferentiating the company from competitors, while orderqualifiers are prerequisites for engaging in a transaction.This view can be seen as a unifying approach betweenoperations management andmarketing (see segmentationand positioning).Productivity is a standard efficiency metric for evalua-tion of production systems, broadly speaking a ratio be-tween outputs and inputs, and can assume many specificforms,*[23] for example: machine productivity, work-force productivity, raw material productivity, warehouseproductivity (=inventory turnover). It is also useful tobreak up productivity in use U (productive percentageof total time) and yield η (ratio between produced vol-ume and productive time) to better evaluate production
systems performances. Cycle times can be modeledthrough manufacturing engineering if the individual op-erations are heavily automated, if the manual componentis the prevalent one, methods used include: time and mo-tion study, predetermined motion time systems and worksampling.
An ABC cumulated curve. Typically one curve is constructed forrevenue (consumption) and another for inventory (stock).
ABC analysis is a method for analyzing inventory basedon Pareto distribution, it posits that since revenue fromitems on inventory will be power law distributed then itmakes sense to manage items differently based on theirposition on a revenue-inventory level matrix, 3 classes areconstructed (A,B and C) from cumulative item revenues,so in a matrix each item will have a letter (A,B or C) as-signed for revenue and inventory. This method posits thatitems away from the diagonal should be managed differ-ently: items in the upper part are subject to risk of ob-solescence, items in the lower part are subject to risk ofstockout.Throughput is a variable which quantifies the number ofparts produced in the unit of time. Although estimatingthroughput for a single processmaybe fairly simple, doingso for an entire production system involves an additionaldifficulty due to the presence of queues which can comefrom: machine breakdowns, processing time variability,scraps, setups, maintenance time, lack of orders, lack ofmaterials, strikes, bad coordination between resources,mix variability, plus all these inefficiencies tend to com-pound depending on the nature of the production system.One important example of how system throughput is tiedto system design are bottlenecks: in job shops bottlenecksare typically dynamic and dependent on scheduling whileon transfer lines it makes sense to speak of“the bottle-

8 CHAPTER 1. OPERATIONS MANAGEMENT
neck”since it can be univocally associated with a specificstation on the line. This leads to the problem of how to de-fine capacity measures, that is an estimation of the max-imum output of a given production system, and capacityutilization.Overall Equipment Effectiveness (OEE) is defined as theproduct between system availability, cycle time efficiencyand quality rate. OEE is typically used as key perfor-mance indicator (KPI) in conjunction with the lean man-ufacturing approach.
1.2.3 Configuration and management
Classic EOQ model: trade-off between ordering cost (blue) andholding cost (red). Total cost (green) admits a global optimum.
Designing the configuration of production systems in-volves both technological and organizational variables.Choices in production technology involve: dimension-ing capacity, fractioning capacity, capacity location,outsourcing processes, process technology, automationof operations, trade-off between volume and variety(see Hayes-Wheelwright matrix). Choices in the or-ganizational area involve: defining worker skills andresponsibilities, team coordination, worker incentivesand information flow.Regarding the planning of production, there is a basicdistinction between the push approach and the pull ap-proach, with the later including the singular approach ofjust in time. Pull means that the production system au-thorizes production based on inventory level; push meansthat production occurs based on demand (forecasted orpresent, that is purchase orders). An individual produc-tion system can be both push and pull; for example ac-tivities before the CODP may work under a pull system,while activities after the CODP may work under a push
A typical MRPII construct: general planning (top) concernedwith forecasts, capacity planning and inventory levels, pro-gramming (middle) concerned with calculation of workloads,rough-cut capacity planning, MPS, capacity requirements plan-ning, traditional MRP planning, control (bottom) concerned withscheduling.
When introducing kanbans in real production systems, attainingunitary lot from the start maybe unfeasible, therefore the kanbanwill represent a given lot size defined by management.
system.Regarding the traditional pull approach, a number oftechniques have been developed based on the work ofFord W. Harris*[10] (1913), which came to be known
1.2. TOPICS 9
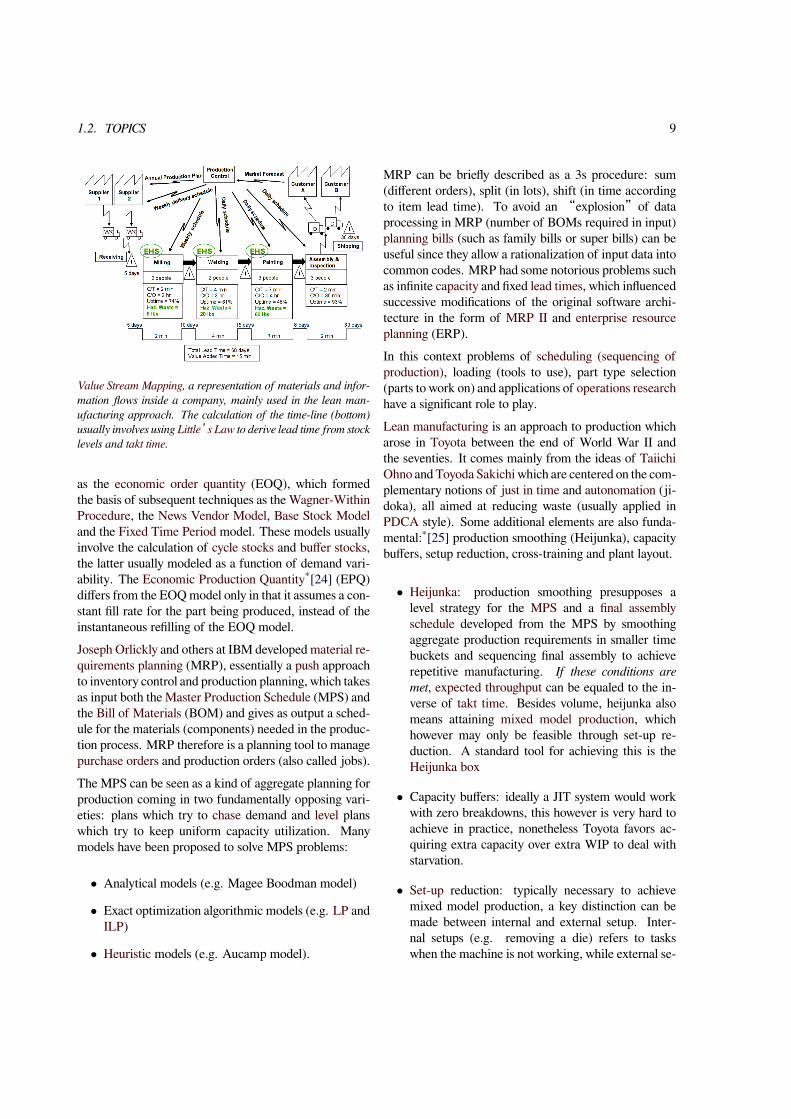
Value Stream Mapping, a representation of materials and infor-mation flows inside a company, mainly used in the lean man-ufacturing approach. The calculation of the time-line (bottom)usually involves using Little s̓ Law to derive lead time from stocklevels and takt time.
as the economic order quantity (EOQ), which formedthe basis of subsequent techniques as the Wagner-WithinProcedure, the News Vendor Model, Base Stock Modeland the Fixed Time Period model. These models usuallyinvolve the calculation of cycle stocks and buffer stocks,the latter usually modeled as a function of demand vari-ability. The Economic Production Quantity*[24] (EPQ)differs from the EOQmodel only in that it assumes a con-stant fill rate for the part being produced, instead of theinstantaneous refilling of the EOQ model.Joseph Orlickly and others at IBM developed material re-quirements planning (MRP), essentially a push approachto inventory control and production planning, which takesas input both the Master Production Schedule (MPS) andthe Bill of Materials (BOM) and gives as output a sched-ule for the materials (components) needed in the produc-tion process. MRP therefore is a planning tool to managepurchase orders and production orders (also called jobs).The MPS can be seen as a kind of aggregate planning forproduction coming in two fundamentally opposing vari-eties: plans which try to chase demand and level planswhich try to keep uniform capacity utilization. Manymodels have been proposed to solve MPS problems:
• Analytical models (e.g. Magee Boodman model)
• Exact optimization algorithmic models (e.g. LP andILP)
• Heuristic models (e.g. Aucamp model).
MRP can be briefly described as a 3s procedure: sum(different orders), split (in lots), shift (in time accordingto item lead time). To avoid an “explosion”of dataprocessing in MRP (number of BOMs required in input)planning bills (such as family bills or super bills) can beuseful since they allow a rationalization of input data intocommon codes. MRP had some notorious problems suchas infinite capacity and fixed lead times, which influencedsuccessive modifications of the original software archi-tecture in the form of MRP II and enterprise resourceplanning (ERP).In this context problems of scheduling (sequencing ofproduction), loading (tools to use), part type selection(parts to work on) and applications of operations researchhave a significant role to play.Lean manufacturing is an approach to production whicharose in Toyota between the end of World War II andthe seventies. It comes mainly from the ideas of TaiichiOhno and Toyoda Sakichi which are centered on the com-plementary notions of just in time and autonomation (ji-doka), all aimed at reducing waste (usually applied inPDCA style). Some additional elements are also funda-mental:*[25] production smoothing (Heijunka), capacitybuffers, setup reduction, cross-training and plant layout.
• Heijunka: production smoothing presupposes alevel strategy for the MPS and a final assemblyschedule developed from the MPS by smoothingaggregate production requirements in smaller timebuckets and sequencing final assembly to achieverepetitive manufacturing. If these conditions aremet, expected throughput can be equaled to the in-verse of takt time. Besides volume, heijunka alsomeans attaining mixed model production, whichhowever may only be feasible through set-up re-duction. A standard tool for achieving this is theHeijunka box
• Capacity buffers: ideally a JIT system would workwith zero breakdowns, this however is very hard toachieve in practice, nonetheless Toyota favors ac-quiring extra capacity over extra WIP to deal withstarvation.
• Set-up reduction: typically necessary to achievemixed model production, a key distinction can bemade between internal and external setup. Inter-nal setups (e.g. removing a die) refers to taskswhen the machine is not working, while external se-
10 CHAPTER 1. OPERATIONS MANAGEMENT
tups can be completed while the machine is running(ex:transporting dies).
• Cross training: important as an element of Au-tonomation, Toyota cross trained their employeesthrough rotation, this served as an element of pro-duction flexibility, holistic thinking and reducingboredom.
• Layout: U-shaped lines or cells are common in thelean approach since they allow for minimum walk-ing, greater worker efficiency and flexible capacity.
A series of tools have been developed mainly with theobjective of replicating Toyota success: a very commonimplementation involves small cards known as kanbans;these also come in some varieties: reorder kanbans, alarmkanbans, triangular kanbans, etc. In the classic kanbanprocedure with one card:
• Parts are kept in containers with their respectivekanbans
• The downstream stationmoves the kanban to the up-stream station and starts producing the part at thedownstream station
• The upstream operator takes the most urgent kan-ban from his list (compare to queue discipline fromqueue theory) and produces it and attach its respec-tive kanban
The two-card kanban procedure differs a bit:
• The downstream operator takes the production kan-ban from his list
• If required parts are available he removes the movekanban and places them in another box, otherwisehe chooses another production card
• He produces the part and attach its respective pro-duction kanban
• Periodically a mover picks up the move kanbans inupstream stations and search for the respective parts,when found he exchanges production kanbans formove kanbans and move the parts to downstreamstations
Since the number of kanbans in the production system isset by managers as a constant number, the kanban proce-dure works as WIP controlling device, which for a givenarrival rate, per Littleʼs Law, works as a lead time con-trolling device.In Toyota the TPS represented more of a philosophy ofproduction than a set of specific tools, the latter wouldinclude: SMED, Value Stream Mapping, 5S, poka-yoke,elimination of time batching, lot-size reduction, RankOrder Clustering, single-point scheduling, multi-processhandling and backflush accounting.Seen more broadly, JIT can include methods such as:product standardization and modularity, group technol-ogy, total productive maintenance, job enlargement, jobenrichment, flat organization and vendor rating (JIT pro-duction is very sensitive to replenishment conditions).In heavily automated production systems productionplanning and information gathering may be executed viathe control system, attention should be paid however toavoid problems suck as deadlocks, as these can lead toproductivity losses.
1.2.4 Modeling
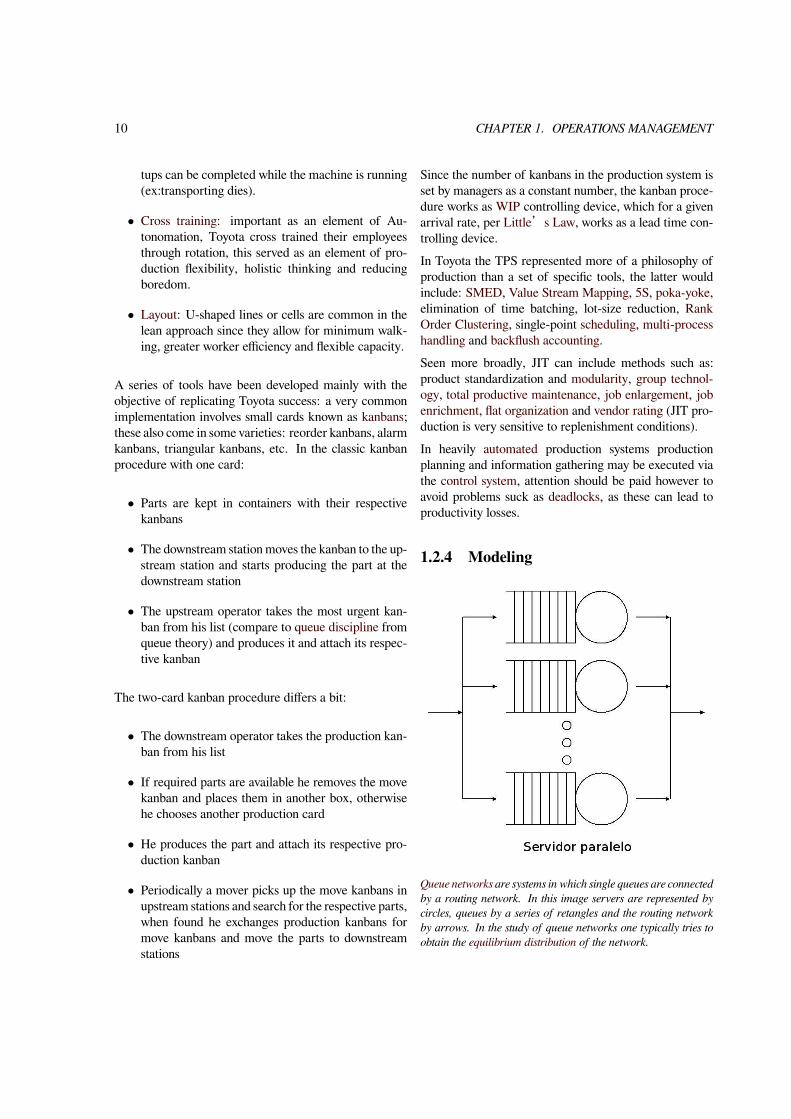
Queue networks are systems in which single queues are connectedby a routing network. In this image servers are represented bycircles, queues by a series of retangles and the routing networkby arrows. In the study of queue networks one typically tries toobtain the equilibrium distribution of the network.
1.2. TOPICS 11
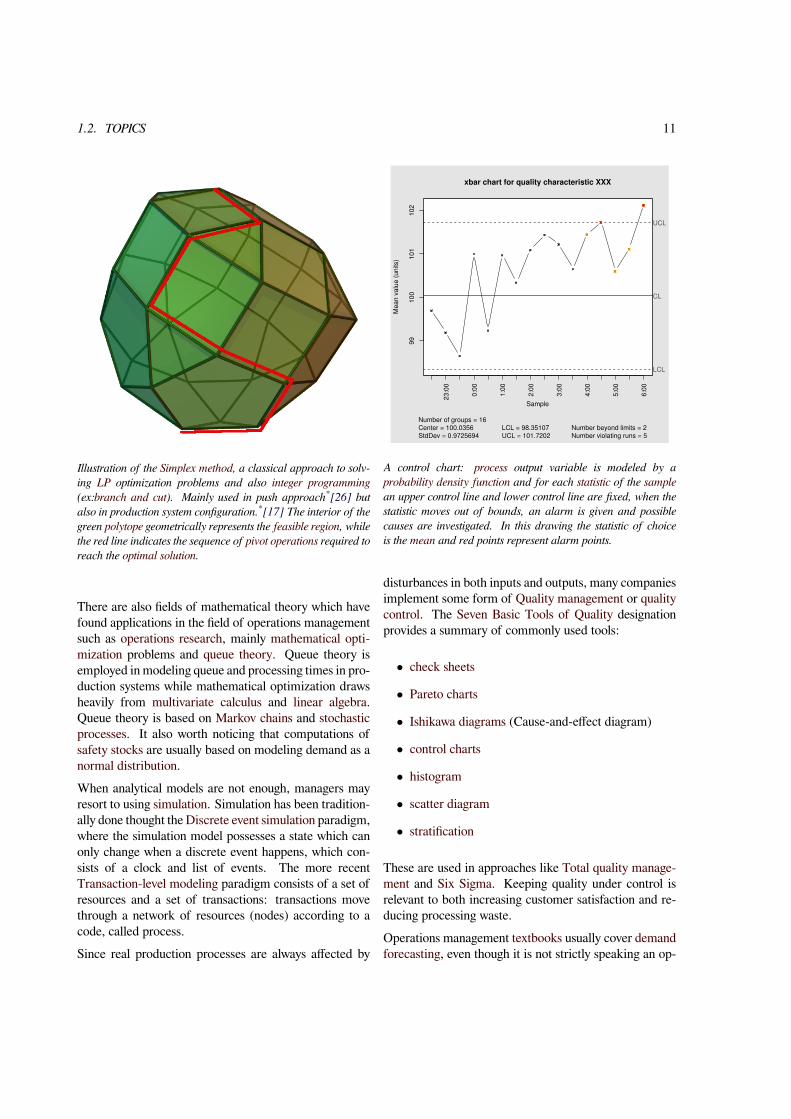
Illustration of the Simplex method, a classical approach to solv-ing LP optimization problems and also integer programming(ex:branch and cut). Mainly used in push approach*[26] butalso in production system configuration.*[17] The interior of thegreen polytope geometrically represents the feasible region, whilethe red line indicates the sequence of pivot operations required toreach the optimal solution.
There are also fields of mathematical theory which havefound applications in the field of operations managementsuch as operations research, mainly mathematical opti-mization problems and queue theory. Queue theory isemployed in modeling queue and processing times in pro-duction systems while mathematical optimization drawsheavily from multivariate calculus and linear algebra.Queue theory is based on Markov chains and stochasticprocesses. It also worth noticing that computations ofsafety stocks are usually based on modeling demand as anormal distribution.When analytical models are not enough, managers mayresort to using simulation. Simulation has been tradition-ally done thought the Discrete event simulation paradigm,where the simulation model possesses a state which canonly change when a discrete event happens, which con-sists of a clock and list of events. The more recentTransaction-level modeling paradigm consists of a set ofresources and a set of transactions: transactions movethrough a network of resources (nodes) according to acode, called process.Since real production processes are always affected by
xbar chart for quality characteristic XXX
SampleM
ean
valu
e (u
nits
)
23:0
0
0:00
1:00
2:00
3:00
4:00
5:00
6:00
9910
010
110
2
¤
¤
¤
¤
¤
¤
¤
¤
¤
¤
¤
¤
¤
¤
¤
¤
LCL
UCL
CL
¤
¤
¤
¤
¤
¤
¤
Number of groups = 16Center = 100.0356StdDev = 0.9725694
LCL = 98.35107UCL = 101.7202
Number beyond limits = 2Number violating runs = 5
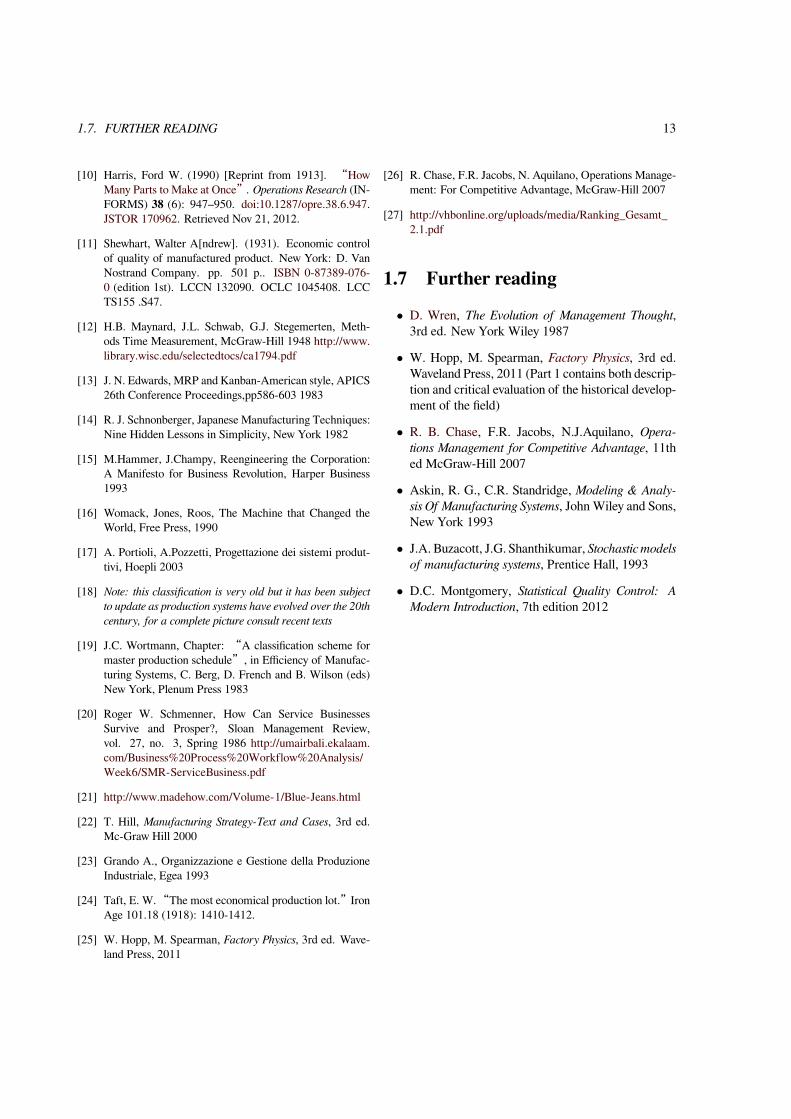
A control chart: process output variable is modeled by aprobability density function and for each statistic of the samplean upper control line and lower control line are fixed, when thestatistic moves out of bounds, an alarm is given and possiblecauses are investigated. In this drawing the statistic of choiceis the mean and red points represent alarm points.
disturbances in both inputs and outputs, many companiesimplement some form of Quality management or qualitycontrol. The Seven Basic Tools of Quality designationprovides a summary of commonly used tools:
• check sheets
• Pareto charts
• Ishikawa diagrams (Cause-and-effect diagram)
• control charts
• histogram
• scatter diagram
• stratification
These are used in approaches like Total quality manage-ment and Six Sigma. Keeping quality under control isrelevant to both increasing customer satisfaction and re-ducing processing waste.Operations management textbooks usually cover demandforecasting, even though it is not strictly speaking an op-

12 CHAPTER 1. OPERATIONS MANAGEMENT
erations problem, because demand is related to some pro-duction systems variables. For example, a classic ap-proach in dimensioning safety stocks requires calculatingstandard deviation of forecast errors. Demand forecast-ing is also a critical part of push systems, since order re-leases have to be planned ahead of actual clients orders.Also any serious discussion of capacity planning involvesadjusting company outputs with market demands.
1.2.5 Safety, Risk and Maintenance
Other important management problems involvemaintenance policies (see also reliability engineering andmaintenance philosophy), safety management systems(see also safety engineering and Risk management),facility management and supply chain integration.
1.3 Organizations
The following organizations support and promote opera-tions management:
• Association for Operations Management (APICS)which supports the Production and Inventory Man-agement Journal
• European Operations Management Association(EurOMA) which supports the International Journalof Operations & Production Management
• Production and Operations Management Society(POMS) which supports the journal: Productionand Operations Management
• Institute for Operations Research and the Manage-ment Sciences (INFORMS)
• The Manufacturing and Service Operations Man-agement Society (MSOM) which supports the jour-nal: Manufacturing & Service Operations Manage-ment
• Institute of Operations Management (UK)
• Association of Technology, Management, and Ap-plied Engineering (ATMAE)
1.4 Journals
The following high-ranked*[27] academic journals areconcerned with Operations Management issues:
• Management Science
• Manufacturing & Service Operations Management
• Operations Research
• International Journal of Operations & ProductionManagement
• Production and Operations Management
1.5 See also
1.6 References[1] Great Operations: What is Operations Management. Re-
trieved on July 3, 2013 from
[2] U.S. Department of Education Institute of Education Sci-ences: Classification of Instructional Programs (CIP). Re-trieved onOctober 26, 2009 fromCIP 2000 - CIP Lookupto Occupational Crosswalks
[3] ATMAE Membership Venn Diagram
[4] Malakooti, Behnam (2013). Operations and ProductionSystems with Multiple Objectives. John Wiley & Sons.ISBN 978-1-118-58537-5.
[5] H. Ford, Today and Tomorrow, New York, 1926
[6] Taylor, Frederick Winslow (1896), A Piece Rate Sys-tem, read before the American Society ofMechanical En-gineers http://wps.prenhall.com/wps/media/objects/107/109902/ch17_a3_d2.pdf
[7] Taylor, F. W., On the Art of Cutting Metals, Americansociety of Mechanical Engineers (1906)
[8] Taylor, F. W., Shop management (1903), a handbookread before the American society of mechanical engi-neers, New York (this has been republished in 1911 https://archive.org/details/shopmanagement00taylgoog)
[9] Taylor, Frederick Winslow (1911). The Principles ofScientific Management. New York, NY, US and Lon-don, UK: Harper & Brothers. LCCN 11010339. OCLC233134. Also available from Project Gutenberg.
1.7. FURTHER READING 13
[10] Harris, Ford W. (1990) [Reprint from 1913]. “HowMany Parts to Make at Once”. Operations Research (IN-FORMS) 38 (6): 947–950. doi:10.1287/opre.38.6.947.JSTOR 170962. Retrieved Nov 21, 2012.
[11] Shewhart, Walter A[ndrew]. (1931). Economic controlof quality of manufactured product. New York: D. VanNostrand Company. pp. 501 p.. ISBN 0-87389-076-0 (edition 1st). LCCN 132090. OCLC 1045408. LCCTS155 .S47.
[12] H.B. Maynard, J.L. Schwab, G.J. Stegemerten, Meth-ods Time Measurement, McGraw-Hill 1948 http://www.library.wisc.edu/selectedtocs/ca1794.pdf
[13] J. N. Edwards, MRP and Kanban-American style, APICS26th Conference Proceedings,pp586-603 1983
[14] R. J. Schnonberger, Japanese Manufacturing Techniques:Nine Hidden Lessons in Simplicity, New York 1982
[15] M.Hammer, J.Champy, Reengineering the Corporation:A Manifesto for Business Revolution, Harper Business1993
[16] Womack, Jones, Roos, The Machine that Changed theWorld, Free Press, 1990
[17] A. Portioli, A.Pozzetti, Progettazione dei sistemi produt-tivi, Hoepli 2003
[18] Note: this classification is very old but it has been subjectto update as production systems have evolved over the 20thcentury, for a complete picture consult recent texts
[19] J.C. Wortmann, Chapter: “A classification scheme formaster production schedule”, in Efficiency of Manufac-turing Systems, C. Berg, D. French and B. Wilson (eds)New York, Plenum Press 1983
[20] Roger W. Schmenner, How Can Service BusinessesSurvive and Prosper?, Sloan Management Review,vol. 27, no. 3, Spring 1986 http://umairbali.ekalaam.com/Business%20Process%20Workflow%20Analysis/Week6/SMR-ServiceBusiness.pdf
[21] http://www.madehow.com/Volume-1/Blue-Jeans.html
[22] T. Hill, Manufacturing Strategy-Text and Cases, 3rd ed.Mc-Graw Hill 2000
[23] Grando A., Organizzazione e Gestione della ProduzioneIndustriale, Egea 1993
[24] Taft, E. W.“The most economical production lot.”IronAge 101.18 (1918): 1410-1412.
[25] W. Hopp, M. Spearman, Factory Physics, 3rd ed. Wave-land Press, 2011
[26] R. Chase, F.R. Jacobs, N. Aquilano, Operations Manage-ment: For Competitive Advantage, McGraw-Hill 2007
[27] http://vhbonline.org/uploads/media/Ranking_Gesamt_2.1.pdf
1.7 Further reading• D. Wren, The Evolution of Management Thought,3rd ed. New York Wiley 1987
• W. Hopp, M. Spearman, Factory Physics, 3rd ed.Waveland Press, 2011 (Part 1 contains both descrip-tion and critical evaluation of the historical develop-ment of the field)
• R. B. Chase, F.R. Jacobs, N.J.Aquilano, Opera-tions Management for Competitive Advantage, 11thed McGraw-Hill 2007
• Askin, R. G., C.R. Standridge, Modeling & Analy-sis Of Manufacturing Systems, JohnWiley and Sons,New York 1993
• J.A. Buzacott, J.G. Shanthikumar, Stochastic modelsof manufacturing systems, Prentice Hall, 1993
• D.C. Montgomery, Statistical Quality Control: AModern Introduction, 7th edition 2012
Chapter 2
Benchmarking
This article is about the business term. For the geolocat-ing activity, see Benchmarking (geolocating). For otheruses of the term, see Benchmark (disambiguation).
Benchmarking is the process of comparing one s̓ busi-ness processes and performance metrics to industry bestsor best practices from other companies. Dimensions typ-ically measured are quality, time and cost. In the pro-cess of best practice benchmarking, management identi-fies the best firms in their industry, or in another industrywhere similar processes exist, and compares the resultsand processes of those studied (the“targets”) to oneʼs own results and processes. In this way, they learn howwell the targets perform and, more importantly, the busi-ness processes that explain why these firms are successful.Benchmarking is used to measure performance using aspecific indicator (cost per unit of measure, productivityper unit of measure, cycle time of x per unit of measureor defects per unit of measure) resulting in a metric ofperformance that is then compared to others.*[1]*[2]Also referred to as “best practice benchmarking”or“process benchmarking”, this process is used in man-agement and particularly strategic management, in whichorganizations evaluate various aspects of their processesin relation to best practice companies p̓rocesses, usuallywithin a peer group defined for the purposes of compar-ison. This then allows organizations to develop plans onhow to make improvements or adapt specific best prac-tices, usually with the aim of increasing some aspect ofperformance. Benchmarking may be a one-off event, butis often treated as a continuous process in which organi-zations continually seek to improve their practices.
2.1 Benefits and use
In 2008, a comprehensive survey*[3] on benchmarkingwas commissioned by The Global Benchmarking Net-work, a network of benchmarking centers representing22 countries. Over 450 organizations responded fromover 40 countries. The results showed that:
1. Mission and Vision Statements and Customer(Client) Surveys are the most used (by 77% of or-ganizations) of 20 improvement tools, followed bySWOT analysis (strengths, weaknesses, opportuni-ties, and threats) (72%), and Informal Benchmark-ing (68%). Performance Benchmarking was usedby 49% and Best Practice Benchmarking by 39%.
2. The tools that are likely to increase in popularitythe most over the next three years are PerformanceBenchmarking, Informal Benchmarking, SWOT,and Best Practice Benchmarking. Over 60% of or-ganizations that are not currently using these toolsindicated they are likely to use them in the next threeyears.
2.2 Collaborative benchmarking
Benchmarking, originally described by Rank Xerox, isusually carried out by individual companies. Some-times it may be carried out collaboratively by groups ofcompanies (e.g. subsidiaries of a multinational in dif-ferent countries). One example is that of the Dutchmunicipally-owned water supply companies, which havecarried out a voluntary collaborative benchmarking pro-cess since 1997 through their industry association. An-other example is the UK construction industry which
14
2.4. COSTS 15
has carried out benchmarking since the late 1990s againthrough its industry association and with financial supportfrom the UK Government.
2.3 Procedure
There is no single benchmarking process that has beenuniversally adopted. The wide appeal and acceptance ofbenchmarking has led to the emergence of benchmarkingmethodologies. One seminal book is Boxwellʼs Bench-marking for Competitive Advantage (1994).*[4] The firstbook on benchmarking, written and published by KaiserAssociates,*[5] is a practical guide and offers a seven-step approach. Robert Camp (who wrote one of the ear-liest books on benchmarking in 1989)*[6] developed a12-stage approach to benchmarking.The 12 stage methodology consists of:
1. Select subject
2. Define the process
3. Identify potential partners
4. Identify data sources
5. Collect data and select partners
6. Determine the gap
7. Establish process differences
8. Target future performance
9. Communicate
10. Adjust goal
11. Implement
12. Review and recalibrate
The following is an example of a typical benchmarkingmethodology:
• Identify problem areas: Because benchmarkingcan be applied to any business process or func-tion, a range of research techniques may be re-quired. They include informal conversations withcustomers, employees, or suppliers; exploratory
research techniques such as focus groups; or in-depth marketing research, quantitative research,surveys, questionnaires, re-engineering analysis,process mapping, quality control variance reports,financial ratio analysis, or simply reviewing cycletimes or other performance indicators. Before em-barking on comparison with other organizations it isessential to know the organizationʼs function andprocesses; base lining performance provides a pointagainst which improvement effort can be measured.
• Identify other industries that have similar pro-cesses: For instance, if one were interested in im-proving hand-offs in addiction treatment one wouldidentify other fields that also have hand-off chal-lenges. These could include air traffic control, cellphone switching between towers, transfer of patientsfrom surgery to recovery rooms.
• Identify organizations that are leaders in theseareas: Look for the very best in any industry and inany country. Consult customers, suppliers, financialanalysts, trade associations, and magazines to deter-mine which companies are worthy of study.
• Survey companies for measures and practices:Companies target specific business processes usingdetailed surveys of measures and practices used toidentify business process alternatives and leadingcompanies. Surveys are typically masked to protectconfidential data by neutral associations and consul-tants.
• Visit the “best practice”companies to identifyleading edge practices: Companies typically agreeto mutually exchange information beneficial to allparties in a benchmarking group and share the re-sults within the group.
• Implement new and improved business prac-tices: Take the leading edge practices and developimplementation plans which include identificationof specific opportunities, funding the project andselling the ideas to the organization for the purposeof gaining demonstrated value from the process.
2.4 Costs
The three main types of costs in benchmarking are:

16 CHAPTER 2. BENCHMARKING
• Visit Costs - This includes hotel rooms, travel costs,meals, a token gift, and lost labor time.
• Time Costs - Members of the benchmarking teamwill be investing time in researching problems, find-ing exceptional companies to study, visits, and im-plementation. This will take them away from theirregular tasks for part of each day so additional staffmight be required.
• Benchmarking Database Costs - Organizationsthat institutionalize benchmarking into their dailyprocedures find it is useful to create and maintaina database of best practices and the companies as-sociated with each best practice now.
The cost of benchmarking can substantially be reducedthrough utilizing the many internet resources that havesprung up over the last few years. These aim to capturebenchmarks and best practices from organizations, busi-ness sectors and countries tomake the benchmarking pro-cess much quicker and cheaper.*[7]
2.5 Technical/product benchmark-ing
The technique initially used to compare existing corpo-rate strategies with a view to achieving the best possibleperformance in new situations (see above), has recentlybeen extended to the comparison of technical products.This process is usually referred to as“technical bench-marking”or“product benchmarking”. Its use is well-developed within the automotive industry (“automotivebenchmarking”), where it is vital to design products thatmatch precise user expectations, at minimal cost, by ap-plying the best technologies available worldwide. Datais obtained by fully disassembling existing cars and theirsystems. Such analyses were initially carried out in-houseby car makers and their suppliers. However, as theseanalyses are expensive, they are increasingly being out-sourced to companies who specialize in this area. Out-sourcing has enabled a drastic decrease in costs for eachcompany (by cost sharing) and the development of effi-cient tools (standards, software).-
2.6 Types
Benchmarking can be internal (comparing performancebetween different groups or teams within an organiza-tion) or external (comparing performance with compa-nies in a specific industry or across industries). Withinthese broader categories, there are three specific typesof benchmarking: 1) Process benchmarking, 2) Perfor-mance benchmarking and 3) strategic benchmarking.*[8]These can be further detailed as follows:
• Process benchmarking - the initiating firm focusesits observation and investigation of business pro-cesses with a goal of identifying and observing thebest practices from one or more benchmark firms.Activity analysis will be required where the objec-tive is to benchmark cost and efficiency; increas-ingly applied to back-office processes where out-sourcing may be a consideration.
• Financial benchmarking - performing a financialanalysis and comparing the results in an effort to as-sess your overall competitiveness and productivity.
• Benchmarking from an investor perspective- ex-tending the benchmarking universe to also compareto peer companies that can be considered alternativeinvestment opportunities from the perspective of aninvestor.
• Benchmarking in the public sector - functions asa tool for improvement and innovation in public ad-ministration, where state organizations invest effortsand resources to achieve quality, efficiency and ef-fectiveness of the services they provide.*[9]
• Performance benchmarking - allows the initiatorfirm to assess their competitive position by compar-ing products and services with those of target firms.
• Product benchmarking - the process of design-ing new products or upgrades to current ones. Thisprocess can sometimes involve reverse engineeringwhich is taking apart competitors products to findstrengths and weaknesses.
• Strategic benchmarking - involves observing howothers compete. This type is usually not industryspecific, meaning it is best to look at other industries.
• Functional benchmarking - a company will focusits benchmarking on a single function to improve

2.9. SEE ALSO 17
the operation of that particular function. Complexfunctions such as Human Resources, Finance andAccounting and Information and CommunicationTechnology are unlikely to be directly comparablein cost and efficiency terms and may need to be dis-aggregated into processes to make valid compari-son.
• Best-in-class benchmarking - involves studyingthe leading competitor or the company that best car-ries out a specific function.
• Operational benchmarking - embraces everythingfrom staffing and productivity to office flow andanalysis of procedures performed.*[10]
• Energy benchmarking - process of collecting,analysing and relating energy performance data ofcomparable activities with the purpose of evaluat-ing and comparing performance between or withinentities.*[11] Entities can include processes, build-ings or companies. Benchmarking may be internalbetween entities within a single organization, or -subject to confidentiality restrictions - external be-tween competing entities.
2.7 Tools
Benchmarking software can be used to organize largeand complex amounts of information. Software packagescan extend the concept of benchmarking and competitiveanalysis by allowing individuals to handle such large andcomplex amounts or strategies. Such tools support dif-ferent types of benchmarking (see above) and can reducethe above costs significantly.
2.8 Metric benchmarking
Another approach to making comparisons involves usingmore aggregative cost or production information to iden-tify strong and weak performing units. The two mostcommon forms of quantitative analysis used in metricbenchmarking are data envelope analysis (DEA) and re-gression analysis. DEA estimates the cost level an effi-cient firm should be able to achieve in a particular mar-ket. In infrastructure regulation, DEA can be used to re-ward companies/operators whose costs are near the effi-cient frontier with additional profits. Regression anal-
ysis estimates what the average firm should be able toachieve. With regression analysis, firms that performedbetter than average can be rewarded while firms thatperformed worse than average can be penalized. Suchbenchmarking studies are used to create yardstick com-parisons, allowing outsiders to evaluate the performanceof operators in an industry. Advanced statistical tech-niques, including stochastic frontier analysis, have beenused to identify high and weak performers in industries,including applications to schools, hospitals, water utili-ties, and electric utilities.*[12]One of the biggest challenges for metric benchmarking isthe variety of metric definitions used among companiesor divisions. Definitions may change over time within thesame organization due to changes in leadership and pri-orities. The most useful comparisons can be made whenmetrics definitions are common between compared unitsand do not change so improvements can be verified.
2.9 See also
• Business Excellence
• Best Practices
• Project triangle
• List of benchmarking methods and software tools
• Bench trending
2.10 References
[1] Fifer, R. M. (1989). Cost benchmarking functions in thevalue chain. Strategy & Leadership, 17(3), 18-19.
[2] Bogan, C. E., & English, M. J. (1994)., Best Practices,LLC Benchmarking for best practices: Winning throughinnovative adaptation.] New York, NY: McGraw-Hill.
[3] http://www.globalbenchmarking.ipk.fraunhofer.de/fileadmin/user_upload/GBN/PDF/2010_gbn_survey_business_improvement_and_benchmarking_web.pdf.Missing or empty |title= (help)
[4] Benchmarking for Competitive Advantage. Robert JBoxwell Jr, New York: McGraw-Hill. 1994. p. 225.ISBN 0-07-006899-2.

18 CHAPTER 2. BENCHMARKING
[5] Beating the competition: a practical guide to Benchmark-ing. Washington, DC: Kaiser Associates. 1988. p. 176.ISBN 978-1-56365-018-5.
[6] Camp, R. (1989). The search for industry best practicesthat lead to superior performance. Productivity Press.
[7] “What is Benchmarking? Save Supply Chain Costs”Retrieved 2014-3-25.
[8] Bogan, C.E. and English, M.J. (1994). Benchmarking forBest Practices: Winning through Innovative Adaptation.New York: McGraw-Hill.
[9] Del Giorgio Solfa, F. Benchmarking en el sector público:aportes y propuestas de implementación para la provinciade Buenos Aires (1a ed.). Villa Elisa: Industry ConsultingArgentina. 2012, p. 5. ISBN 978-987-33-2236-5.
[10] Benchmarking: How toMake the Best Decisions for YourPractice
[11] prEN16231:2011 Energy Efficiency BenchmarkingMethodology, Brussels: CEN, 2011, p5 (Definition 3.2)
[12] Body of Knowledge on Infrastructure Regulation“Incen-tive Regulation: Basic forms of Regulation”

Chapter 3
Root cause analysis
Root cause analysis (RCA) is a method of problemsolving that tries to identify the root causes of faults orproblems.*[1] A root cause is a cause that once removedfrom the problem fault sequence, prevents the final unde-sirable event from recurring. A causal factor is a factorthat affects an eventʼs outcome, but is not a root cause.Though removing a causal factor can benefit an outcome,it does not prevent its recurrence for certain. RCA arosein the 1950s as a formal study following the introduc-tion of Kepner-Tregoe Analysis, which had limitations inthe highly complex arena of rocket design developmentand launch in the United States by the National Aero-nautics and Space Administration (NASA). New meth-ods of problem analysis developed by NASA included ahigh level assessment practice called MORT (Manage-ment Oversight Risk Tree). MORT differed from RCAby assigning causes to common classes of cause short-comings, that summarized became a short list. These in-cluded work practice, procedures, management, fatigue,time pressure, along with several others. For example,an aircraft accident could occur as a result of weatheraugmented by pressure to leave on time. Failure to ob-serve weather precautions could indicate a managementor training problem, while lack of any weather concernmight indict work practices.RCA practice solve problems by attempting to identifyand correct the root causes of events, as opposed to sim-ply addressing their symptoms. Focusing correction onroot causes has the goal of preventing problem recur-rence. RCFA (Root Cause Failure Analysis) recognizesthat complete prevention of recurrence by one correctiveaction is not always possible.Conversely, there may be several effective measures(methods) that address the root causes of a problem.Thus, RCA is an iterative process and a tool of continuous
improvement.RCA is typically used as a reactive method of identify-ing event(s) causes, revealing problems and solving them.Analysis is done after an event has occurred. Insights inRCA may make it useful as a preemptive method. Inthat event, RCA can be used to forecast or predict proba-ble events even before they occur. While one follows theother, RCA is a completely separate process to IncidentManagement.Root cause analysis is not a single, sharply definedmethodology; there are many different tools, processes,and philosophies for performing RCA. However, sev-eral very-broadly defined approaches or“schools”canbe identified by their basic approach or field of origin:safety-based, production-based, process-based, failure-based, and systems-based.
• Safety-based RCA descends from the fields ofaccident analysis and occupational safety and health.
• Production-based RCA has its origins in the field ofquality control for industrial manufacturing.
• Process-based RCA is basically a follow-on toproduction-based RCA, but with a scope that hasbeen expanded to include business processes.
• Failure-based RCA is rooted in the practice offailure analysis as employed in engineering andmaintenance.
• Systems-based RCA has emerged as an amalgama-tion of the preceding schools, along with ideas takenfrom fields such as change management, risk man-agement, and systems analysis.
Despite the different approaches among the variousschools of root cause analysis, there are some common
19

20 CHAPTER 3. ROOT CAUSE ANALYSIS
principles. It is also possible to define several generalprocesses for performing RCA.
3.1 General principles of rootcause analysis
1. The primary aim of root cause analysis is to iden-tify the factors that resulted in the nature, the magni-tude, the location, and the timing of the harmful out-comes (consequences) of one or more past events inorder to identify what behaviors, actions, inactions,or conditions need to be changed to prevent recur-rence of similar harmful outcomes and to identifythe lessons to be learned to promote the achievementof better consequences. (“Success”is defined asthe near-certain prevention of recurrence.)
2. To be effective, root cause analysis must be per-formed systematically, usually as part of an inves-tigation, with conclusions and root causes that areidentified backed up by documented evidence. Usu-ally a team effort is required.
3. There may be more than one root cause for an eventor a problem, the difficult part is demonstrating thepersistence and sustaining the effort required to de-termine them.
4. The purpose of identifying all solutions to a problemis to prevent recurrence at lowest cost in the sim-plest way. If there are alternatives that are equallyeffective, then the simplest or lowest cost approachis preferred.
5. Root causes identified depend on the way in whichthe problem or event is defined. Effective problemstatements and event descriptions (as failures, forexample) are helpful, or even required.
6. To be effective, the analysis should establish asequence of events or timeline to understand therelationships between contributory (causal) factors,root cause(s) and the defined problem or event toprevent in the future.
7. Root cause analysis can help transform a reactiveculture (that reacts to problems) into a forward-looking culture that solves problems before they oc-cur or escalate. More importantly, it reduces the fre-quency of problems occurring over time within the
environment where the root cause analysis processis used.
8. Root cause analysis is a threat to many cultures andenvironments. Threats to cultures often meet withresistance. There may be other forms of manage-ment support required to achieve root cause analy-sis effectiveness and success. For example, a“non-punitive”policy toward problem identifiers may berequired.
3.2 General process for perform-ing and documenting an RCA-based Corrective Action
RCA (in steps 3, 4 and 5) forms the most critical part ofsuccessful corrective action, because it directs the correc-tive action at the true root cause of the problem. Knowingthe root cause is secondary to the goal of prevention, butwithout knowing the root cause, it is not possible to deter-mine what an effective corrective action for the definedproblem would be.
1. Define the problem or describe the event to pre-vent in the future. Include the qualitative and quan-titative attributes (properties) of the harmful out-comes. This usually includes specifying the natures,the magnitudes, the locations, and the timing ofevents. In some cases,“lowering the risks of reoc-currences”may be a reasonable target. For example,“lowering the risks”of future automobile accidentsmaybe more reasonable target than“preventing all”future automobile accidents.
2. Gather data and evidence, classifying it along atimeline of events to the final failure or crisis. Forevery behavior, condition, action, and inaction spec-ify in the“timeline”what should have been donewhen it differs from what was done.
3. Ask“why”and identify the causes associated witheach step in the sequence towards the defined prob-lem or event. “Why”is taken to mean “Whatwere the factors that directly resulted in the effect?extquotedbl
4. Classify causes into causal factors that relate to anevent in the sequence and root causes, that if elimi-
3.4. REFERENCES 21
nated, can be agreed to have interrupted that step ofthe sequence chain.
5. Identify all other harmful factors that have equal orbetter claim to be called“root causes.”If there aremultiple root causes, which is often the case, revealthose clearly for later optimum selection.
6. Identify corrective action(s) that will with certaintyprevent recurrence of each harmful effect, includingoutcomes and factors. Check that each correctiveaction would, if pre-implemented before the event,have reduced or prevented specific harmful effects.
7. Identify solutions that, when effective, and with con-sensus agreement of the group, prevent recurrencewith reasonable certainty, are within the institutionʼs control, meet its goals and objectives and do notcause or introduce other new, unforeseen problems.
8. Implement the recommended root cause correc-tion(s).
9. Ensure effectiveness by observing the implementedrecommendation solutions.
10. Identify other methodologies for problem solvingand problem avoidance that may be useful.
11. Identify and address the other instances of eachharmful outcome and harmful factor.
3.3 See also• Failure mode and effects analysis• Fault tree analysis• Forensic engineering• Eight Disciplines Problem Solving• Multiple regression and multivariate linear regres-sion
• Orthogonal Defect Classification• Barrier Analysis
3.4 References[1] “WHAT IS ROOT CAUSE ANALYSIS? extquotedbl.
alertsite.com. March 15, 2014. Retrieved June 27, 2014.

Chapter 4
Ishikawa diagram
Ishikawa diagrams (also called fishbone diagrams,herringbone diagrams, cause-and-effect diagrams,or Fishikawa) are causal diagrams created by KaoruIshikawa (1968) that show the causes of a specificevent.*[1]*[2] Common uses of the Ishikawa diagram areproduct design and quality defect prevention, to iden-tify potential factors causing an overall effect. Eachcause or reason for imperfection is a source of variation.Causes are usually grouped into major categories to iden-tify these sources of variation. The categories typicallyinclude:
• People: Anyone involved with the process
• Methods: How the process is performed and thespecific requirements for doing it, such as policies,procedures, rules, regulations and laws
• Machines: Any equipment, computers, tools, etc.required to accomplish the job
• Materials: Raw materials, parts, pens, paper, etc.used to produce the final product
• Measurements: Data generated from the processthat are used to evaluate its quality
• Environment: The conditions, such as location,time, temperature, and culture in which the processoperates
4.1 Overview
Ishikawa diagrams were popularized by KaoruIshikawa*[3] in the 1960s, who pioneered qualitymanagement processes in the Kawasaki shipyards, and
PeopleEquipment
EnvironmentMaterials Management
Process
Cause Effect
Problem
Primarycause
Secondarycause
Ishikawa diagram, in fishbone shape, showing factors of Equip-ment, Process, People, Materials, Environment and Manage-ment, all affecting the overall problem. Smaller arrows connectthe sub-causes to major causes.
in the process became one of the founding fathers ofmodern management.The basic concept was first used in the 1920s, and is con-sidered one of the seven basic tools of quality control.*[4]It is known as a fishbone diagram because of its shape,similar to the side view of a fish skeleton.Mazda Motors famously used an Ishikawa diagram in thedevelopment of the Miata sports car, where the requiredresult was“Jinba Ittai”(Horse and Rider as One̶jap.⼈⾺⼀体). The main causes included such aspects as“touch”and“braking”with the lesser causes includinghighly granular factors such as“50/50 weight distribu-tion”and“able to rest elbow on top of driverʼs door”. Every factor identified in the diagram was included inthe final design.
22

4.3. SEE ALSO 23
4.2 Causes
Causes in the diagram are often categorized, such as tothe 6 M s̓, described below. Cause-and-effect diagramscan reveal key relationships among various variables, andthe possible causes provide additional insight into processbehavior.Causes can be derived from brainstorming sessions.These groups can then be labeled as categories of the fish-bone. They will typically be one of the traditional cate-gories mentioned above but may be something unique tothe application in a specific case. Causes can be tracedback to root causes with the 5 Whys technique.Typical categories are:
4.2.1 The 6Ms (used in manufacturing in-dustry)
• Machine (technology)
• Method (process)
• Material (Includes Raw Material, Consumables andInformation.)
• Man Power (physical work)/Mind Power (brainwork): Kaizens, Suggestions
• Measurement (Inspection)
• Milieu/Mother Nature (Environment)
The original 6Ms used by the Toyota Production Systemhave been expanded by some to include the following andare referred to as the 8Ms. However, this is not globallyrecognized. It has been suggested to return to the rootsof the tools and to keep the teaching simple while recog-nizing the original intent; most programs do not addressthe 8Ms.
• Management/Money Power
• Maintenance
4.2.2 The 7 Ps (used in marketing indus-try)
• Product/Service
• Price
• Place
• Promotion
• People/personnel
• Positioning
• Packaging
4.2.3 The 5 Ss (used in service industry)
• Surroundings
• Suppliers
• Systems
• Skills
• Safety
4.3 See also• Seven Basic Tools of Quality
• Five whys
4.4 References[1] Ishikawa, Kaoru (1968). Guide to Quality Control. Tokyo:
JUSE.
[2] Ishikawa, Kaoru (1976). Guide to Quality Control. AsianProductivity Organization. ISBN 92-833-1036-5.
[3] Hankins, Judy (2001). Infusion Therapy in Clinical Prac-tice. p. 42.
[4] Tague, Nancy R. (2004).“Seven Basic Quality Tools”.The Quality Toolbox. Milwaukee, Wisconsin: AmericanSociety for Quality. p. 15. Retrieved 2010-02-05.
4.4.1 Further reading
• Ishikawa, Kaoru (1990); (Translator: J. H. Lof-tus); Introduction to Quality Control; 448 p; ISBN4-906224-61-X OCLC 61341428
• Dale, Barrie G. et al. (2007);Managing Quality 5thed; ISBN 978-1-4051-4279-3 OCLC 288977828

24 CHAPTER 4. ISHIKAWA DIAGRAM
4.5 External links

Chapter 5
Performance metric
A performance metric is that which determines an or-ganizationʼs behavior and performance. Performancemetrics measure an organization s̓ activities and perfor-mance. It should support a range of stakeholder needsfrom customers, shareholders to employees.*[1] Whiletraditionally many metrics are finance based, inwardly fo-cusing on the performance of the organization, metricsmay also focus on the performance against customer re-quirements and value.*[2] In project management, per-formance metrics are used to assess the health of theproject and consist of the measuring of seven criteria:safety, time, cost, resources, scope, quality, and ac-tions.*[3] In call centres, performance metrics help cap-ture internal performance and can include productivitymeasurements and the quality of service provided by thecustomer service advisor. These metrics can include:Calls Answered, Calls Abandoned, Average Handle Timeand Average Wait Time. *[4]Developing performance metrics usually follows a pro-cess of:
1. Establishing critical processes/customer require-ments
2. Identifying specific, quantifiable outputs of work
3. Establishing targets against which results can bescored
A criticism of performance metrics is that when the valueof information is computed using mathematical meth-ods, it shows that even performance metrics professionalschoose measures that have little value. This is referred toas the“measurement inversion”.*[5]*[6] For example,metrics seem to emphasize what organizations find im-mediately measurable ̶even if those are low value ̶
and tend to ignore high value measurements simply be-cause they seem harder to measure (whether they are ornot).To correct for the measurement inversion other methods,like applied information economics, introduce the“valueof information analysis”step in the process so that metricsfocus on high-value measures. Organizations where thishas been applied find that they define completely differentmetrics than they otherwise would have and, often, fewermetrics.*[7] For projects, the effort to collect a metric hasto be weighed against its value as projects are temporaryendeavors performed with finite resources. *[8]There are a variety of ways in which organizations mayreact to results.*[9] This may be to trigger specific activ-ity relating to performance (i.e., an improvement plan) orto use the data merely for statistical information. Oftenclosely tied in with outputs, performance metrics shouldusually encourage improvement, effectiveness and appro-priate levels of control.Performance metrics are often linked in with corporatestrategy*[10] and are often derived in order to measureperformance against a critical success factor.
5.1 See also
5.2 References
[1] Mark Graham Brown, Using the Right Metrics to DriveWorld-class Performance
[2] Value based performance metrics
[3] Measuring Project Health Neville Turbit, 2008
25

26 CHAPTER 5. PERFORMANCE METRIC
[4] http://www.callcentrehelper.com/the-best-kpis-to-use-in-your-call-centre-10598.htm]The Call Centre School, 2010
[5] Douglas Hubbard,“The ITMeasurement Inversion”, CIOMagazine, 1999
[6] Douglas Hubbard, How to Measure Anything: Finding theValue of Intangibles in Business. JohnWiley& Sons, 2007
[7] US Government Study on AIE
[8] Determining Project Management Metrics Frank Parth,2006
[9] Andy D. Neely, Business PerformanceMeasurement: The-ory and Practice
[10] Mark Graham Brown, How to Interpret the Baldrige Cri-teria for Performance Excellence
5.3 Further reading• University of California Approach to developingperformance metrics

Chapter 6
Failure mode and effects analysis
Failure Mode and Effects Analysis (FMEA) was oneof the first systematic techniques for failure analysis. Itwas developed by reliability engineers in the 1950s tostudy problems that might arise from malfunctions ofmilitary systems. An FMEA is often the first step of asystem reliability study. It involves reviewing as manycomponents, assemblies, and subsystems as possible toidentify failure modes, and their causes and effects. Foreach component, the failure modes and their resultingeffects on the rest of the system are recorded in a spe-cific FMEA worksheet. There are numerous variationsof such worksheets. An FMEA is mainly a qualitativeanalysis.*[1]A few different types of FMEA analyses exist, such as
• Functional,
• Design, and
• Process FMEA.
Sometimes FMEA is extended to FMECA to indicatethat criticality analysis is performed too.FMEA is an inductive reasoning (forward logic) singlepoint of failure analysis and is a core task in reliabilityengineering, safety engineering and quality engineering.Quality engineering is specially concerned with the“Pro-cess”(Manufacturing and Assembly) type of FMEA.A successful FMEA activity helps to identify potentialfailure modes based on experience with similar productsand processes - or based on common physics of failurelogic. It is widely used in development and manufactur-ing industries in various phases of the product life cycle.Effects analysis refers to studying the consequences ofthose failures on different system levels.
Functional analyses are needed as an input to deter-mine correct failure modes, at all system levels, both forfunctional FMEA or Piece-Part (hardware) FMEA. AnFMEA is used to structure Mitigation for Risk reductionbased on either failure (mode) effect severity reductionor based on lowering the probability of failure or both.The FMEA is in principle a full inductive (forward logic)analysis, however the failure probability can only be es-timated or reduced by understanding the failure mecha-nism. Ideally this probability shall be lowered to “im-possible to occur”by eliminating the (root) causes. It istherefore important to include in the FMEA an appropri-ate depth of information on the causes of failure (deduc-tive analysis).
6.1 Introduction
The FME(C)A is a design tool used to systematically ana-lyze postulated component failures and identify the resul-tant effects on system operations. The analysis is some-times characterized as consisting of two sub-analyses, thefirst being the failure modes and effects analysis (FMEA),and the second, the criticality analysis (CA).*[2] Success-ful development of an FMEA requires that the analystinclude all significant failure modes for each contribut-ing element or part in the system. FMEAs can be per-formed at the system, subsystem, assembly, subassemblyor part level. The FMECA should be a living documentduring development of a hardware design. It should bescheduled and completed concurrently with the design.If completed in a timely manner, the FMECA can helpguide design decisions. The usefulness of the FMECA asa design tool and in the decision-making process is depen-dent on the effectiveness and timeliness with which de-sign problems are identified. Timeliness is probably the
27
28 CHAPTER 6. FAILURE MODE AND EFFECTS ANALYSIS
most important consideration. In the extreme case, theFMECA would be of little value to the design decisionprocess if the analysis is performed after the hardware isbuilt. While the FMECA identifies all part failure modes,its primary benefit is the early identification of all criti-cal and catastrophic subsystem or system failure modesso they can be eliminated or minimized through designmodification at the earliest point in the development ef-fort; therefore, the FMECA should be performed at thesystem level as soon as preliminary design informationis available and extended to the lower levels as the detaildesign progresses.Remark: For more complete scenario modelling anothertype of Reliability analysis may be considered, for exam-ple fault tree analysis(FTA); a deductive (backward logic)failure analysis that may handle multiple failures withinthe item and/or external to the item including mainte-nance and logistics. It starts at higher functional / systemlevel. An FTA may use the basic failure mode FMEArecords or an effect summary as one of its inputs (the ba-sic events). Interface hazard analysis, Human error anal-ysis and others may be added for completion in scenariomodelling.
6.1.1 Functional analysis
The analysis may be performed at the functional level un-til the design has matured sufficiently to identify specifichardware that will perform the functions; then the analy-sis should be extended to the hardware level. When per-forming the hardware level FMECA, interfacing hard-ware is considered to be operating within specification.In addition, each part failure postulated is considered tobe the only failure in the system (i.e., it is a single failureanalysis). In addition to the FMEAs done on systems toevaluate the impact lower level failures have on systemoperation, several other FMEAs are done. Special atten-tion is paid to interfaces between systems and in fact at allfunctional interfaces. The purpose of these FMEAs is toassure that irreversible physical and/or functional dam-age is not propagated across the interface as a result offailures in one of the interfacing units. These analysesare done to the piece part level for the circuits that di-rectly interface with the other units. The FMEA can beaccomplished without a CA, but a CA requires that theFMEA has previously identified system level critical fail-ures. When both steps are done, the total process is calleda FMECA.
6.1.2 Ground rules
The ground rules of each FMEA include a set of projectselected procedures; the assumptions on which the anal-ysis is based; the hardware that has been included andexcluded from the analysis and the rationale for the exclu-sions. The ground rules also describe the indenture levelof the analysis, the basic hardware status, and the criteriafor system and mission success. Every effort should bemade to define all ground rules before the FMEA begins;however, the ground rules may be expanded and clarifiedas the analysis proceeds. A typical set of ground rules(assumptions) follows:*[3]
1. Only one failure mode exists at a time.
2. All inputs (including software commands) to theitem being analyzed are present and at nominal val-ues.
3. All consumables are present in sufficient quantities.
4. Nominal power is available
6.1.3 Benefits
Major benefits derived from a properly implementedFMECA effort are as follows:
1. It provides a documented method for selecting a de-sign with a high probability of successful operationand safety.
2. A documented uniform method of assessing poten-tial failure mechanisms, failure modes and their im-pact on system operation, resulting in a list of failuremodes ranked according to the seriousness of theirsystem impact and likelihood of occurrence.
3. Early identification of single failure points (SFPS)and system interface problems, which may be criti-cal to mission success and/or safety. They also pro-vide a method of verifying that switching betweenredundant elements is not jeopardized by postulatedsingle failures.
4. An effective method for evaluating the effect of pro-posed changes to the design and/or operational pro-cedures on mission success and safety.

6.3. HISTORY 29
5. A basis for in-flight troubleshooting proceduresand for locating performance monitoring and fault-detection devices.
6. Criteria for early planning of tests.
From the above list, early identifications of SFPS, inputto the troubleshooting procedure and locating of perfor-mance monitoring / fault detection devices are probablythe most important benefits of the FMECA. In addition,the FMECA procedures are straightforward and allow or-derly evaluation of the design.
6.2 Basic terms
The following covers some basic FMEA terminology.*[4]
Failure The loss of a function under stated conditions.
Failure mode The specific manner or way by which afailure occurs in terms of failure of the item (beinga part or (sub) system) function under investigation;it may generally describe the way the failure occurs.It shall at least clearly describe a (end) failure state ofthe item (or function in case of a Functional FMEA)under consideration. It is the result of the failuremechanism (cause of the failure mode). For exam-ple; a fully fractured axle, a deformed axle or a fullyopen or fully closed electrical contact are each a sep-arate failure mode.
Failure cause and/or mechanism Defects in require-ments, design, process, quality control, handling orpart application, which are the underlying cause orsequence of causes that initiate a process (mecha-nism) that leads to a failuremode over a certain time.A failure mode may have more causes. For exam-ple;“fatigue or corrosion of a structural beam”or“fretting corrosion in an electrical contact”is a failuremechanism and in itself (likely) not a failure mode.The related failure mode (end state) is a“full frac-ture of structural beam”or“an open electrical con-tact”. The initial cause might have been“Improperapplication of corrosion protection layer (paint) ex-tquotedbl and /or extquotedbl(abnormal) vibrationinput from another (possibly failed) system”.
Failure effect Immediate consequences of a failure onoperation, function or functionality, or status ofsome item.
Indenture levels (bill of material or functional breakdown)An identifier for system level and thereby item com-plexity. Complexity increases as levels are closer toone.
Local effect The failure effect as it applies to the itemunder analysis.
Next higher level effect The failure effect as it applies atthe next higher indenture level.
End effect The failure effect at the highest indenturelevel or total system.
Detection The means of detection of the failure modeby maintainer, operator or built in detection system,including estimated dormancy period (if applicable)
Risk Priority Number (RPN) Cost (of the event) *Probability (of the event occurring) * Detection(Probability that the event would not be detected be-fore the user was aware of it)
Severity The consequences of a failure mode. Severityconsiders the worst potential consequence of a fail-ure, determined by the degree of injury, propertydamage, system damage and/or time lost to repairthe failure.
Remarks / mitigation / actions Additional info, in-cluding the proposed mitigation or actions used tolower a risk or justify a risk level or scenario.
6.3 History
Procedures for conducting FMECA were described inUS Armed Forces Military Procedures document MIL-P-1629*[5] (1949); revised in 1980 as MIL-STD-1629A).*[6] By the early 1960s, contractors for the U.S.National Aeronautics and Space Administration (NASA)were using variations of FMECA or FMEA under a va-riety of names.*[7]*[8] NASA programs using FMEAvariants included Apollo, Viking, Voyager, Magellan,Galileo, and Skylab.*[9]*[10]*[11] The civil aviation in-dustry was an early adopter of FMEA, with the Societyfor Automotive Engineers (SAE) publishing ARP926 in1967.*[12] After two revisions, ARP926 has been re-placed by ARP4761, which is now broadly used in civilaviation.

30 CHAPTER 6. FAILURE MODE AND EFFECTS ANALYSIS
During the 1970s, use of FMEA and related techniquesspread to other industries. In 1971 NASA prepared a re-port for the U.S. Geological Survey recommending theuse of FMEA in assessment of offshore petroleum ex-ploration.*[13] A 1973 U.S. Environmental ProtectionAgency report described the application of FMEA towastewater treatment plants.*[14] FMEA as applicationfor HACCP on the Apollo Space Program moved intothe food industry in general.*[15]The automotive industry began to use FMEA by themid 1970s.*[16] The Ford Motor Company introducedFMEA to the automotive industry for safety and reg-ulatory consideration after the Pinto affair. Ford ap-plied the same approach to processes (PFMEA) to con-sider potential process induced failures prior to launch-ing production. In 1993 the Automotive Industry Ac-tion Group (AIAG) first published an FMEA standard forthe automotive industry.*[17] It is now in its fourth edi-tion.*[18] The SAE first published related standard J1739in 1994.*[19] This standard is also now in its fourth edi-tion.*[20]Although initially developed by the military, FMEAmethodology is now extensively used in a variety of in-dustries including semiconductor processing, food ser-vice, plastics, software, and healthcare.*[21]*[22] Toyotahas taken this one step further with its Design Re-view Based on Failure Mode (DRBFM) approach. Themethod is now supported by the American Society forQuality which provides detailed guides on applying themethod.*[23] The standard Failure Modes and EffectsAnalysis (FMEA) and Failure Modes, Effects and Crit-icality Analysis (FMECA) procedures however, do notidentify the product failure mechanisms and models,which limits their applicability to provide a meaningfulinput to critical procedures such as virtual qualification,root cause analysis, accelerated test programs, and to re-maining life assessment. To overcome the shortcomingsof FMEA and FMECA a Failure Modes, Mechanismsand Effect Analysis (FMMEA) has often been used.
6.4 Exampleworksheet (ARP4761)- Design (Hardware) FMEA
6.4.1 Probability (P)
It is necessary to look at the cause of a failure mode andthe likelihood of occurrence. This can be done by anal-
ysis, calculations / FEM, looking at similar items or pro-cesses and the failure modes that have been documentedfor them in the past. A failure cause is looked upon asa design weakness. All the potential causes for a fail-ure mode should be identified and documented. Thisshould be in technical terms. Examples of causes are:Human errors in handling, Manufacturing induced faults,Fatigue, Creep, Abrasive wear, erroneous algorithms, ex-cessive voltage or improper operating conditions or use(depending on the used ground rules). A failure mode isgiven a Probability Ranking.
6.4.2 Severity (S)
Determine the Severity for the worst-case scenario ad-verse end effect (state). It is convenient to write theseeffects down in terms of what the user might see or ex-perience in terms of functional failures. Examples ofthese end effects are: full loss of function x, degradedperformance, functions in reversed mode, too late func-tioning, erratic functioning, etc. Each end effect is givena Severity number (S) from, say, I (no effect) to VI (catas-trophic), based on cost and/or loss of life or quality of life.These numbers prioritize the failure modes (together withprobability and detectability). Below a typical classifica-tion is given. Other classifications are possible. See alsohazard analysis.
6.4.3 Detection (D)
The means or method by which a failure is detected, iso-lated by operator and/or maintainer and the time it maytake. This is important for maintainability control (Avail-ability of the system) and it is specially important for mul-tiple failure scenarios. This may involve dormant fail-ure modes (e.g. No direct system effect, while a redun-dant system / item automatic takes over or when the fail-ure only is problematic during specific mission or sys-tem states) or latent failures (e.g. deterioration failuremechanisms, like a metal growing crack, but not a criti-cal length). It should be made clear how the failure modeor cause can be discovered by an operator under normalsystem operation or if it can be discovered by the mainte-nance crew by some diagnostic action or automatic builtin system test. A dormancy and/or latency period may beentered.DORMANCY or LATENCY PERIOD The averagetime that a failure mode may be undetected may be en-

6.5. TIMING 31
tered if known. For example:
• During aircraft C Block inspection, preventive orpredictive maintenance, X months or X flight hours
• During aircraft B Block inspection, preventive orpredictive maintenance, X months or X flight hours
• During Turn-Around Inspection before or afterflight (e.g. 8 hours average)
• During in-built system functional test, X minutes
• Continuously monitored, X seconds
INDICATIONIf the undetected failure allows the system to remain in asafe / working state, a second failure situation should beexplored to determine whether or not an indication willbe evident to all operators and what corrective action theymay or should take.Indications to the operator should be described as follows:
• Normal. An indication that is evident to an opera-tor when the system or equipment is operating nor-mally.
• Abnormal. An indication that is evident to an oper-ator when the system has malfunctioned or failed.
• Incorrect. An erroneous indication to an operatordue to themalfunction or failure of an indicator (i.e.,instruments, sensing devices, visual or audible warn-ing devices, etc.).
PERFORM DETECTION COVERAGE ANALYSISFOR TEST PROCESSES AND MONITORING (FromARP4761 Standard):This type of analysis is useful to determine how effec-tive various test processes are at the detection of latentand dormant faults. The method used to accomplish thisinvolves an examination of the applicable failure modesto determine whether or not their effects are detected,and to determine the percentage of failure rate applica-ble to the failure modes which are detected. The possibil-ity that the detection means may itself fail latent shouldbe accounted for in the coverage analysis as a limitingfactor (i.e., coverage cannot be more reliable than thedetection means availability). Inclusion of the detection
coverage in the FMEA can lead to each individual fail-ure that would have been one effect category now beinga separate effect category due to the detection coveragepossibilities. Another way to include detection coverageis for the FTA to conservatively assume that no holes incoverage due to latent failure in the detection method af-fect detection of all failures assigned to the failure effectcategory of concern. The FMEA can be revised is neces-sary for those cases where this conservative assumptiondoes not allow the top event probability requirements tobe met.After these three basic steps the Risk level may be pro-vided.
6.4.4 Risk level (P*S) and (D)
Risk is the combination of End Effect ProbabilityAnd Severity. Where probability and severity includesthe effect on non-detectability (dormancy time). Thismay influence the end effect probability of failure or theworst case effect Severity. The exact calculation may notbe easy in all cases, such as those where multiple scenar-ios (with multiple events) are possible and detectability /dormancy plays a crucial role (as for redundant systems).In that case Fault Tree Analysis and/or Event Trees maybe needed to determine exact probability and risk levels.Preliminary Risk levels can be selected based on a RiskMatrix like shown below, based on Mil. Std. 882.*[24]The higher the Risk level, the more justification and mit-igation is needed to provide evidence and lower the riskto an acceptable level. High risk should be indicated tohigher level management, who are responsible for finaldecision-making.
• After this step the FMEA has become like aFMECA.
6.5 Timing
The FMEA should be updated whenever:
• A new cycle begins (new product/process)
• Changes are made to the operating conditions
• A change is made in the design
• New regulations are instituted

32 CHAPTER 6. FAILURE MODE AND EFFECTS ANALYSIS
• Customer feedback indicates a problem
6.6 Uses
• Development of system requirements that minimizethe likelihood of failures.
• Development of designs and test systems to ensurethat the failures have been eliminated or the risk isreduced to acceptable level.
• Development and evaluation of diagnostic systems
• To help with design choices (trade-off analysis).
6.7 Advantages
• Improve the quality, reliability and safety of a prod-uct/process
• Improve company image and competitiveness
• Increase user satisfaction
• Reduce system development time and cost
• Collect information to reduce future failures, cap-ture engineering knowledge
• Reduce the potential for warranty concerns
• Early identification and elimination of potential fail-ure modes
• Emphasize problem prevention
• Minimize late changes and associated cost
• Catalyst for teamwork and idea exchange betweenfunctions
• Reduce the possibility of same kind of failure in fu-ture
• Reduce impact on company profit margin
• Improve production yield
6.8 Limitations
While FMEA identifies important hazards in a system,its results may not be comprehensive and the approachhas limitations.*[25]*[26]*[27] In the healthcare context,FMEA and other risk assessment methods, includingSWIFT (Structured What If Technique) and retrospec-tive approaches, have been found to have limited validitywhen used in isolation. Challenges around scoping andorganisational boundaries appear to be a major factor inthis lack of validity.*[25]If used as a top-down tool, FMEA may only identify ma-jor failure modes in a system. Fault tree analysis (FTA)is better suited for“top-down”analysis. When used asa“bottom-up”tool FMEA can augment or complementFTA and identify many more causes and failure modesresulting in top-level symptoms. It is not able to discovercomplex failure modes involving multiple failures withina subsystem, or to report expected failure intervals of par-ticular failure modes up to the upper level subsystem orsystem.Additionally, the multiplication of the severity, occur-rence and detection rankings may result in rank rever-sals, where a less serious failure mode receives a higherRPN than a more serious failure mode.*[28] The reasonfor this is that the rankings are ordinal scale numbers, andmultiplication is not defined for ordinal numbers. The or-dinal rankings only say that one ranking is better or worsethan another, but not by how much. For instance, a rank-ing of“2”may not be twice as severe as a ranking of“1,”or an“8”may not be twice as severe as a“4,”butmultiplication treats them as though they are. See Levelof measurement for further discussion.
6.9 Types
• Functional: before design solutions are provided(or only on high level) functions can be evaluated onpotential functional failure effects. General Mitiga-tions (“design to”requirements) can be proposed tolimit consequence of functional failures or limit theprobability of occurrence in this early development.It is based on a functional breakdown of a system.This type may also be used for Software evaluation.
• Concept Design / Hardware: analysis of systemsor subsystems in the early design concept stages to
6.11. REFERENCES 33
analyse the failure mechanisms and lower level func-tional failures, specially to different concept solu-tions in more detail. It may be used in trade-offstudies.
• Detailed Design / Hardware: analysis of productsprior to production. These are the most detailed(in mil 1629 called Piece-Part or Hardware FMEA)FMEAs and used to identify any possible hardware(or other) failure mode up to the lowest part level.It should be based on hardware breakdown (e.g. theBoM = Bill of Material). Any Failure effect Sever-ity, failure Prevention (Mitigation), Failure Detec-tion and Diagnostics may be fully analysed in thisFMEA.
• Process: analysis of manufacturing and assemblyprocesses. Both quality and reliability may be af-fected from process faults. The input for this FMEAis amongst others a work process / task Breakdown.
6.10 See also
6.11 References[1] System Reliability Theory: Models, Statistical Methods,
and Applications, Marvin Rausand & Arnljot Hoylan,Wiley Series in probability and statistics - second edition2004, page 88
[2] Project Reliability Group (July 1990). Koch, John E., ed.Jet Propulsion Laboratory Reliability Analysis Handbook(pdf). Pasadena, California: Jet Propulsion Laboratory.JPL-D-5703. Retrieved 2013-08-25.
[3] Goddard Space Flight Center (GSFC) (1996-08-10).Performing a Failure Mode and Effects Analysis (pdf).Goddard Space Flight Center. 431-REF-000370. Re-trieved 2013-08-25.
[4] Langford, J. W. (1995). Logistics: Principles and Appli-cations. McGraw Hill. p. 488.
[5] United States Department of Defense (9 November1949). MIL-P-1629 - Procedures for performing a failuremode effect and critical analysis. Department of Defense(US). MIL-P-1629.
[6] United States Department of Defense (24 November1980). MIL-STD-1629A - Procedures for performing afailure mode effect and criticality analysis. Departmentof Defense (USA). MIL-STD-1629A.
[7] Neal, R.A. (1962). Modes of Failure Analysis Summaryfor the Nerva B-2 Reactor (PDF). Westinghouse ElectricCorporation Astronuclear Laboratory. WANL–TNR–042. Retrieved 2010-03-13.
[8] Dill, Robert; et al. (1963). State of the Art ReliabilityEstimate of Saturn V Propulsion Systems (PDF). GeneralElectric Company. RM 63TMP–22. Retrieved 2010-03-13.
[9] Procedure for Failure Mode, Effects and Criticality Analy-sis (FMECA) (PDF). National Aeronautics and Space Ad-ministration. 1966. RA–006–013–1A. Retrieved 2010-03-13.
[10] Failure Modes, Effects, and Criticality Analysis (FMECA)(PDF). National Aeronautics and Space AdministrationJPL. PD–AD–1307. Retrieved 2010-03-13.
[11] Experimenters R̓eference Based Upon Skylab ExperimentManagement (PDF). National Aeronautics and Space Ad-ministration George C. Marshall Space Flight Center.1974. M–GA–75–1. Retrieved 2011-08-16.
[12] Design Analysis Procedure For Failure Modes, Effects andCriticality Analysis (FMECA). Society for Automotive En-gineers. 1967. ARP926.
[13] Dyer, Morris K.; Dewey G. Little, Earl G. Hoard, Al-fred C. Taylor, Rayford Campbell (1972). Applicabilityof NASA Contract Quality Management and Failure ModeEffect Analysis Procedures to the USFS Outer Continen-tal Shelf Oil and Gas Lease Management Program (PDF).National Aeronautics and Space Administration GeorgeC. Marshall Space Flight Center. TM X–2567. Retrieved2011-08-16.
[14] Mallory, Charles W.; Robert Waller (1973). Applicationof Selected Industrial Engineering Techniques to Wastewa-ter Treatment Plants (PDF). United States EnvironmentalProtection Agency. pp. 107–110. EPA R2–73–176. Re-trieved 2012-11-10.
[15] Sperber, William H.; Stier, Richard F. (December 2009 –January 2010). “Happy 50th Birthday to HACCP: Ret-rospective and Prospective”. FoodSafety magazine: 42,44–46.
[16] Matsumoto, K.; T. Matsumoto; Y. Goto (1975). “Reli-ability Analysis of Catalytic Converter as an AutomotiveEmission Control System”. SAE Technical Paper 750178.doi:10.4271/750178. Retrieved 2012-11-10.
[17] AIAG (1993). Potential Failure Mode and Effect Analysis.Automotive Industry Action Group.

34 CHAPTER 6. FAILURE MODE AND EFFECTS ANALYSIS
[18] AIAG (2008). Potential Failure Mode and Effect Analysis(FMEA), 4th Edition. Automotive Industry Action Group.ISBN 9781605341361.
[19] SAE (1994). Potential Failure Mode and Effects Analysisin Design (Design FMEA), Potential Failure Mode and Ef-fects Analysis in Manufacturing and Assembly Processes(Process FMEA), and Potential Failure Mode and EffectsAnalysis for Machinery (Machinery FMEA). SAE Inter-national.
[20] SAE (2008). Potential Failure Mode and Effects Analysisin Design (Design FMEA) and Potential Failure Mode andEffects Analysis in Manufacturing and Assembly Processes(Process FMEA) and Effects Analysis for Machinery (Ma-chinery FMEA). SAE International.
[21] Quality Associates Internationalʼs History of FMEA
[22] Fadlovich, Erik (December 31, 2007).“Performing Fail-ure Mode and Effect Analysis”. Embedded Technology.
[23] “Failure Mode Effects Analysis (FMEA) extquotedbl.ASQ. Retrieved 2012-02-15.
[24] http://www.everyspec.com/MIL-STD/MIL-STD-0800-0899/MIL-STD-882E_41682/
[25] Potts H.W.W., Anderson J.E., Colligan L., Leach P.,Davis S., Berman J. (2014). “Assessing the validity ofprospective hazard analysis methods: A comparison oftwo techniques”. BMC Health Services Research (14).doi:10.1186/1472-6963-14-41.
[26] Franklin BD, Shebl NA, Barber N: “Failure mode andeffects analysis: too little for too much? extquotedbl BMJQual Saf 2012, 21: 607–611
[27] Shebl NA, Franklin BD, Barber N:“Is failure mode andeffect analysis reliable? extquotedbl J Patient Saf 2009, 5:86–94
[28] Kmenta, Steven; Ishii, Koshuke (2004). “Scenario-Based Failure Modes and Effects Analysis Using Ex-pected Cost”. Journal of Mechanical Design 126 (6):1027. doi:10.1115/1.1799614.

Chapter 7
Work breakdown structure
Example of a product oriented work breakdown structure of anaircraft system.
A work breakdown structure (WBS), in project man-agement and systems engineering, is a deliverable-oriented decomposition of a project into smaller compo-nents.A work breakdown structure element may be a product,data, service, or any combination thereof. A WBS alsoprovides the necessary framework for detailed cost es-timating and control along with providing guidance forschedule development and control.*[1]
7.1 Overview
WBS is a hierarchical and incremental decomposition ofthe project into phases, deliverables and work packages.It is a tree structure, which shows a subdivision of effortrequired to achieve an objective; for example a program,project, and contract.*[2] In a project or contract, theWBS is developed by starting with the end objective andsuccessively subdividing it into manageable componentsin terms of size, duration, and responsibility (e.g., sys-tems, subsystems, components, tasks, subtasks, and workpackages) which include all steps necessary to achieve theobjective.
Example of work breakdown structure applied in a NASA report-ing structure.*[2]
The work breakdown structure provides a commonframework for the natural development of the overallplanning and control of a contract and is the basis fordividing work into definable increments from which thestatement of work can be developed and technical, sched-ule, cost, and labor hour reporting can be established.*[2]A work breakdown structure permits summing of subor-dinate costs for tasks, materials, etc., into their succes-sively higher level “parent”tasks, materials, etc. Foreach element of the work breakdown structure, a descrip-tion of the task to be performed is generated.*[3] Thistechnique (sometimes called a system breakdown struc-ture *[4]) is used to define and organize the total scope ofa project.The WBS is organized around the primary products ofthe project (or planned outcomes) instead of the workneeded to produce the products (planned actions). Sincethe planned outcomes are the desired ends of the project,they form a relatively stable set of categories in which thecosts of the planned actions needed to achieve them canbe collected. A well-designed WBS makes it easy to as-
35

36 CHAPTER 7. WORK BREAKDOWN STRUCTURE
sign each project activity to one and only one terminalelement of the WBS. In addition to its function in costaccounting, the WBS also helps map requirements fromone level of system specification to another, for example arequirements cross reference matrix mapping functionalrequirements to high level or low level design documents.
7.2 History
The concept of work breakdown structure developedwith the Program Evaluation and Review Technique(PERT) by the United States Department of Defense(DoD). PERT was introduced by the U.S. Navy in 1957to support the development of its Polaris missile pro-gram.*[5] While the term“work breakdown structure”was not used, this first implementation of PERT did or-ganize the tasks into product-oriented categories.*[6]By June 1962, DoD, NASA and the aerospace indus-try published a document for the PERT/COST systemwhich described the WBS approach.*[7] This guide wasendorsed by the Secretary of Defense for adoption by allservices.*[8] In 1968, the DoD issued“Work BreakdownStructures for Defense Materiel Items”(MIL-STD-881),a military standard requiring the use of work breakdownstructures across the DoD.*[9]The document has been revised several times, most re-cently in 2011. The current version of this document canbe found in “Work Breakdown Structures for DefenseMateriel Items”(MIL-STD-881C).*[10] It includesWBSdefinitions for specific defense material commodity sys-tems, and addresses WBS elements that are common toall systems. Elements of each WBS Element:
1. The scope of the project, “deliverables”of theproject.
2. Start and end time of the scope of project.
3. Budget for the scope of the project.
4. Name of the person related to the scope of project.
Defense Material Item categories from MIL-STD-881Care:
• Aircraft Systems WBS
• Electronic Systems WBS
Example from MIL-HDBK-881, which illustrates the first threelevels of a typical aircraft system.*[11]
• Missile Systems WBS
• Ordnance Systems WBS
• Sea Systems WBS
• Space Systems WBS
• Surface Vehicle Systems WBS
• Unmanned Air Vehicle Systems WBS
• Unmanned Maritime Systems WBS
• Launch Vehicle Systems WBS
• Automated Information Systems WBS
The common elements identified in MIL-STD-881C,Appendix L are: Integration, assembly, test, and check-out; Systems engineering; Program management; Sys-tem test and evaluation; Training; Data; Peculiar sup-port equipment; Common support equipment; Opera-tional/Site activation; Industrial facilities; Initial sparesand repair parts. The standard also includes additionalcommon elements unique to Space Systems, Launch Ve-hicle Systems and Automated Information Systems.In 1987, the Project Management Institute (PMI) doc-umented the expansion of these techniques across non-defense organizations. The Project Management Body ofKnowledge (PMBOK) Guide provides an overview of theWBS concept, while the “Practice Standard for WorkBreakdown Structures”is comparable to the DoD hand-book, but is intended for more general application.*[12]

7.3. DESIGN PRINCIPLES 37
7.3 Design principles
7.3.1 100% rule
An important design principle for work breakdown struc-tures is called the 100% rule.*[13] It has been defined asfollows:
The 100% rule states that the WBS includes100% of the work defined by the project scopeand captures all deliverables – internal, exter-nal, interim – in terms of the work to be com-pleted, including project management. The100% rule is one of the most important princi-ples guiding the development, decompositionand evaluation of the WBS. The rule applies atall levels within the hierarchy: the sum of thework at the “child”level must equal 100%of the work represented by the“parent”andthe WBS should not include any work that fallsoutside the actual scope of the project, that is, itcannot include more than 100% of the work…It is important to remember that the 100% rulealso applies to the activity level. The work rep-resented by the activities in each work packagemust add up to 100% of the work necessary tocomplete the work package.*[14]
Mutually exclusive elements
Mutually exclusive: In addition to the 100% rule, it isimportant that there is no overlap in scope definition be-tween different elements of a work breakdown structure.This ambiguity could result in duplicated work or mis-communications about responsibility and authority. Suchoverlap could also cause confusion regarding project costaccounting. If the WBS element names are ambiguous,a WBS dictionary can help clarify the distinctions be-tween WBS elements. The WBS Dictionary describeseach component of the WBS with milestones, deliver-ables, activities, scope, and sometimes dates, resources,costs, quality.
7.3.2 Plan outcomes, not actions
If the work breakdown structure designer attempts tocapture any action-oriented details in the WBS, s/he willlikely include either too many actions or too few actions.
Too many actions will exceed 100% of the parentʼsscope and too few will fall short of 100% of the parentʼs scope. The best way to adhere to the 100% rule is todefineWBS elements in terms of outcomes or results, notactions. This also ensures that the WBS is not overly pre-scriptive of methods, allowing for greater ingenuity andcreative thinking on the part of the project participants.For new product development projects, the most commontechnique to ensure an outcome-oriented WBS is to usea product breakdown structure. Feature-driven softwareprojects may use a similar technique which is to employa feature breakdown structure. When a project providesprofessional services, a common technique is to captureall planned deliverables to create a deliverable-orientedWBS.*[15] Work breakdown structures that subdividework by project phases (e.g. preliminary design phase,critical design phase) must ensure that phases are clearlyseparated by a deliverable also used in defining entry andexit criteria (e.g. an approved preliminary or criticaldesign review).
7.3.3 Level of detail
One must decide when to stop dividing work into smallerelements. This will assist in determining the duration ofactivities necessary to produce a deliverable defined bytheWBS. There are several heuristics or“rules of thumb”used when determining the appropriate duration of an ac-tivity or group of activities necessary to produce a specificdeliverable defined by the WBS.
• The first is the “80 hour rule”which means thatno single activity or group of activities at the lowestlevel of detail of the WBS to produce a single deliv-erable should be more than 80 hours of effort.
• The second rule of thumb is that no activity orgroup of activities at the lowest level of detail of theWBS should be longer than a single reporting pe-riod. Thus if the project team is reporting progressmonthly, then no single activity or series of activitiesshould be longer than one month long.
• The last heuristic is the “if it makes sense”rule.Applying this rule of thumb, one can apply“com-mon sense”when creating the duration of a singleactivity or group of activities necessary to producea deliverable defined by the WBS.
A work package at the activity level is a task that:

38 CHAPTER 7. WORK BREAKDOWN STRUCTURE
• can be realistically and confidently estimated;
• makes no sense practically to break down any fur-ther;
• can be completed in accordance with one of theheuristics defined above;
• produces a deliverable which is measurable; and
• forms a unique package of work which can be out-sourced or contracted out.
7.3.4 Coding scheme
It is common for work breakdown structure elements tobe numbered sequentially to reveal the hierarchical struc-ture. The purpose for the numbering is to provide a con-sistent approach to identifying and managing the WBSacross like systems regardless of vendor or service.*[16]For example 1.1.2 Propulsion (in the example below)identifies this item as a Level 3 WBS element, since thereare three numbers separated by a decimal point. A cod-ing scheme also helps WBS elements to be recognized inany written context.A practical example of the WBS coding scheme is*[17]1 Aircraft System
1.1 Air Vehicle
1.1.1 Airframe
1.1.1.1 Airframe Integra-tion, Assembly, Test andCheckout1.1.1.2 Fuselage1.1.1.3 Wing1.1.1.4 Empennage1.1.1.5 Nacelle1.1.1.6 Other AirframeComponents 1..n (Specify)
1.1.2 Propulsion1.1.3 Vehicle Subsystems1.1.4 Avionics
1.2 System Engineering
1.3 Program Management
1.4 System Test and Evaluation
1.5 Training
1.6 Data
1.7 Peculiar Support Equipment
1.8 Common Support Equipment
1.9 Operational/Site Activation
1.10 Industrial Facilities
1.11 Initial Spares and Repair Parts
An example in the software industry would be as fol-lows:*[18]1267.1 Systems Integration
1267.1.1 Re-quirementsDefinition1267.1.2 Regu-lations1267.1.3Scheduling1267.1.4 Moni-toring & Control1267.1.5 Pro-curement Man-agement1267.1.6 Close-out
1267.2 Design
1267.2.1 Con-ceptual Design1267.2.2 Prelim-inary Design1267.2.3 FinalDesign
7.3.5 Terminal element
The lowest elements in a tree structure, a terminal ele-ment is one that is not further subdivided. In a WorkBreakdown Structure such (activity or deliverable) el-ements are the items that are estimated in terms ofresource requirements, budget and duration; linked bydependencies; and scheduled. At the juncture of theWBS element and organization unit, control accountsand work packages are established and performanceis planned, measured, recorded and controlled.*[19] A
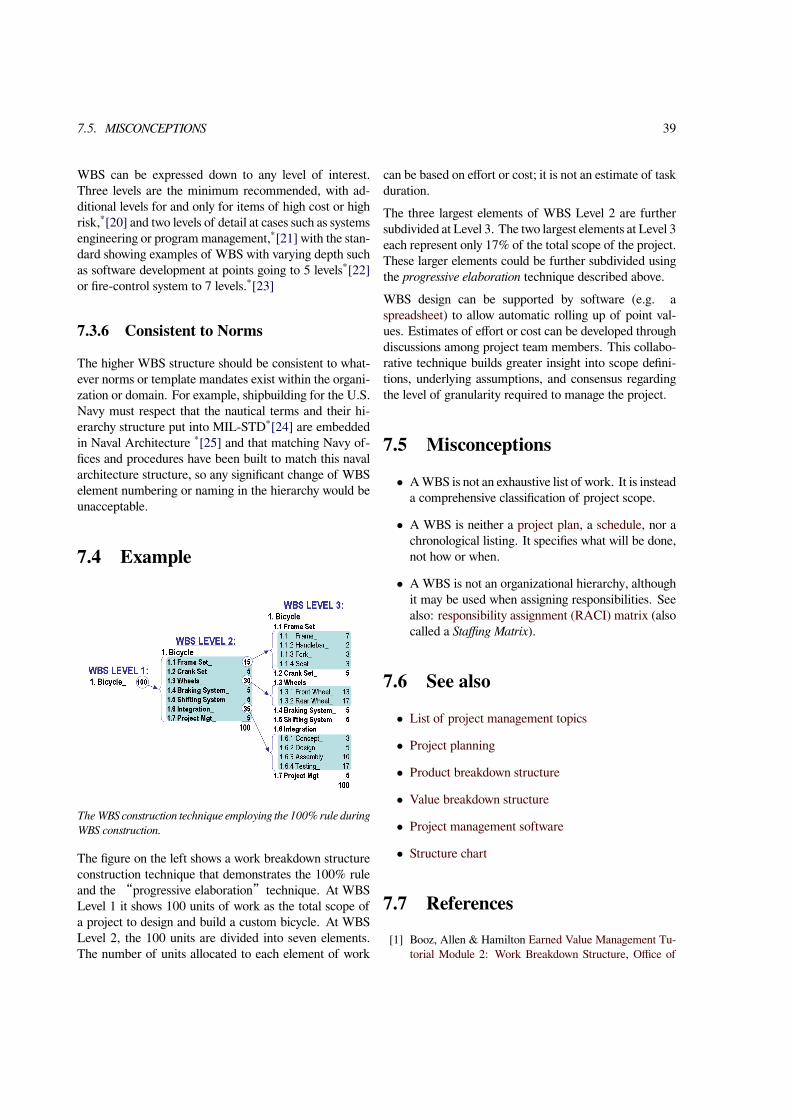
7.5. MISCONCEPTIONS 39
WBS can be expressed down to any level of interest.Three levels are the minimum recommended, with ad-ditional levels for and only for items of high cost or highrisk,*[20] and two levels of detail at cases such as systemsengineering or programmanagement,*[21] with the stan-dard showing examples of WBS with varying depth suchas software development at points going to 5 levels*[22]or fire-control system to 7 levels.*[23]
7.3.6 Consistent to Norms
The higher WBS structure should be consistent to what-ever norms or template mandates exist within the organi-zation or domain. For example, shipbuilding for the U.S.Navy must respect that the nautical terms and their hi-erarchy structure put into MIL-STD*[24] are embeddedin Naval Architecture *[25] and that matching Navy of-fices and procedures have been built to match this navalarchitecture structure, so any significant change of WBSelement numbering or naming in the hierarchy would beunacceptable.
7.4 Example
TheWBS construction technique employing the 100% rule duringWBS construction.
The figure on the left shows a work breakdown structureconstruction technique that demonstrates the 100% ruleand the“progressive elaboration”technique. At WBSLevel 1 it shows 100 units of work as the total scope ofa project to design and build a custom bicycle. At WBSLevel 2, the 100 units are divided into seven elements.The number of units allocated to each element of work
can be based on effort or cost; it is not an estimate of taskduration.The three largest elements of WBS Level 2 are furthersubdivided at Level 3. The two largest elements at Level 3each represent only 17% of the total scope of the project.These larger elements could be further subdivided usingthe progressive elaboration technique described above.WBS design can be supported by software (e.g. aspreadsheet) to allow automatic rolling up of point val-ues. Estimates of effort or cost can be developed throughdiscussions among project team members. This collabo-rative technique builds greater insight into scope defini-tions, underlying assumptions, and consensus regardingthe level of granularity required to manage the project.
7.5 Misconceptions
• AWBS is not an exhaustive list of work. It is insteada comprehensive classification of project scope.
• A WBS is neither a project plan, a schedule, nor achronological listing. It specifies what will be done,not how or when.
• AWBS is not an organizational hierarchy, althoughit may be used when assigning responsibilities. Seealso: responsibility assignment (RACI) matrix (alsocalled a Staffing Matrix).
7.6 See also
• List of project management topics
• Project planning
• Product breakdown structure
• Value breakdown structure
• Project management software
• Structure chart
7.7 References[1] Booz, Allen & Hamilton Earned Value Management Tu-
torial Module 2: Work Breakdown Structure, Office of

40 CHAPTER 7. WORK BREAKDOWN STRUCTURE
Science, Tools & Resources for Project Management, sci-ence.energy.gov. Accessed 27. Dec 2011.
[2] NASA (2001). NASA NPR 9501.2D. May 23, 2001.
[3] Electronic Industries Alliance Standard Systems Engineer-ing Capability Model EIA-731.1
[4] Institute of Electrical and Electronics Engineers Standardfor Application and Management of the Systems Engineer-ing Process IEEE Std 1220-2005
[5] Fleming, QuentinW., JoelM. Koppelman“Earned ValueProject Management”CROSSTALK: The Journal of De-fense Software Engineering July 1998, p 20
[6] Haugan, Gregory T., Effective Work Breakdown Struc-tures, pp7-8
[7] DOD and NASA Guide, PERT/COST System Design,June 1962
[8] Hamilton, R. L., Study of Methods for Evaluation ofthe PERT/Cost Management System, MITRE Corporation,June 1964
[9] MIL-STD-881, 1 November 1968
[10] MIL-STD-881C,Work Breakdown Structures for DefenseMateriel Items, 3 October 2011
[11] Systems Engineering Fundamentals. Defense AcquisitionUniversity Press, 2001
[12] Haugan, Gregory T., The Work Breakdown Structure inGovernment Contracting, Management Concepts, 2003ISBN 978-1567261202
[13] Effective Work Breakdown Structures By Gregory T. Hau-gan, Published by Management Concepts, 2001, ISBN1567261353, p.17
[14] Practice Standard forWork Breakdown Structures (SecondEdition), published by the Project Management Institute,ISBN 1933890134, page 8
[15] Swiderski, Mark A., PMP workbreakdownstructure.com,PMBOK-Work Breakdown Structures. Accessed 16.June 2013.
[16] MIL-STD-881C, Work Breakdown Structures for De-fense Materiel Items, 3 October 2011, ¶4.3
[17] MIL-STD-881C, Work Breakdown Structures for De-fense Materiel Items, 3 October 2011 Appendix A, ¶A.3
[18] Taylor, Michael, WBS Examples, PM Hut. Accessed 17.Oct 2009.
[19] MIL-STD-881C, Work Breakdown Structures for De-fense Materiel Items, 3 October 2011, ¶3.1.4
[20] MIL-STD-881C, Work Breakdown Structures for De-fense Materiel Items, 3 October 2011, ¶1.4.1
[21] MIL-STD-881C, Work Breakdown Structures for De-fense Materiel Items, 3 October 2011, ¶2.2.4.2
[22] MIL-STD-881C, Work Breakdown Structures for De-fense Materiel Items, 3 October 2011, ¶Fig.3-6
[23] MIL-STD-881C, Work Breakdown Structures for De-fense Materiel Items, 3 October 2011, ¶Fig.3-1
[24] MIL-STD-881C, Work Breakdown Structures for De-fense Materiel Items, 3 October 2011, ¶Appendix E
[25] Gilmer, Thomas (1982-08-04). Introduction to Naval Ar-chitecture. pp. pg98. ISBN 9780870213182.
7.8 Further reading
• Carl L. Pritchard. Nuts and Bolts Series 1: Howto Build a Work Breakdown Structure ISBN 1-890367-12-5
• Project Management Institute. Project ManagementInstitute Practice Standard for Work BreakdownStructures, Second Edition (2006) ISBN 1-933890-13-4 (Note: The Second Edition is an extensive re-write of the Practice Standard.)
• Gregory T. Haugan. Effective Work BreakdownStructures (The Project Management Essential Li-brary Series) ISBN 1-56726-135-3
• Dennis P. Miller, PMP, “Building Your ProjectWork Breakdown Structure -- Visualizing Your Ob-jectives, Deliverables, Activities and Schedule”.ISBN 1-42006969-1 (Note: This new book is es-sentially a facilitator s̓ guide for planning a projectbased on the WBS.)
7.9 External links
• Media related to Work breakdown structures atWikimedia Commons
• how to create work breakdown structureWBS usingstandard Division of work

7.9. EXTERNAL LINKS 41
• EverySpec.Com copies of MIL-HDBK-881 ver-sions
• Defense Acquisition University ACQ101 Summaryfor Work Breakdown Structures
• How to Make a Work Breakdown Structure
• NASA Work Breakdown Structure Handbook,NASA/SP-2010-3404, January 2010

Chapter 8
Supply chain management
For the journal, see Supply ChainManagement (journal).Supply chain management (SCM) is the manage-
Supply chain management managing complex and dynamic sup-ply and demand networks.*[1] (cf. Wieland/Wallenburg, 2011)
ment of the flow of goods. It includes the movementand storage of raw materials, work-in-process inventory,and finished goods from point of origin to point of con-sumption. Interconnected or interlinked networks, chan-nels and node businesses are involved in the provisionof products and services required by end customers ina supply chain.*[2] Supply chain management has beendefined as the“design, planning, execution, control, andmonitoring of supply chain activities with the objectiveof creating net value, building a competitive infrastruc-ture, leveraging worldwide logistics, synchronizing sup-ply with demand and measuring performance globally.”*[3]SCM draws heavily from the areas of operations man-agement, logistics, procurement, and information tech-nology, and strives for an integrated approach.*[4]
8.1 Origin of the Term and Defini-tions
The term“supply chain management”entered the pub-lic domain when Keith Oliver, a consultant at Booz AllenHamilton (now Booz & Company), used it in an inter-view for the Financial Times in 1982. The term was slowto take hold. It gained currency in the mid-1990s, whena flurry of articles and books came out on the subject. Inthe late 1990s it rose to prominence as a managementbuzzword, and operations managers began to use it intheir titles with increasing regularity.*[5]*[6]*[7]Commonly accepted definitions of supply chain manage-ment include:
• The management of upstream and downstreamvalue-added flows of materials, final goods, and re-lated information among suppliers, company, re-sellers, and final consumers
• The systematic, strategic coordination of traditionalbusiness functions and tactics across all businessfunctions within a particular company and acrossbusinesses within the supply chain, for the pur-poses of improving the long-term performance ofthe individual companies and the supply chain as awhole*[8]
• A definition is given by Hines (2004:p76): “Sup-ply chain strategies require a total systems view ofthe links in the chain that work together efficientlyto create customer satisfaction at the end point ofdelivery to the consumer. As a consequence, costsmust be lowered throughout the chain by driving outunnecessary expenses, movements, and handling.
42

8.2. FUNCTIONS 43
The main focus is turned to efficiency and addedvalue, or the end-userʼs perception of value. Effi-ciency must be increased, and bottlenecks removed.The measurement of performance focuses on totalsystem efficiency and the equitable monetary re-ward distribution to those within the supply chain.The supply chain system must be responsive to cus-tomer requirements.”*[9]
• The integration of key business processes across thesupply chain for the purpose of creating value forcustomers and stakeholders (Lambert, 2008)*[10]
• According to the Council of Supply Chain Man-agement Professionals (CSCMP), supply chainmanagement encompasses the planning and man-agement of all activities involved in sourcing,procurement, conversion, and logistics manage-ment. It also includes coordination and collabora-tion with channel partners, which may be suppliers,intermediaries, third-party service providers, orcustomers. Supply chain management integratessupply and demand management within and acrosscompanies. More recently, the loosely coupled,self-organizing network of businesses that cooper-ate to provide product and service offerings has beencalled the Extended Enterprise.
• Supply Chain Management (SCM) is the man-agement of the relationship between the supplier s̓supplier and the customerʼs customer through thesupply chain participants (Distributor/Wholesalerand Retailer) between them, mainly using informa-tion flow and logistics activities to gain Competitiveadvantage and customer satisfaction.
A supply chain, as opposed to supply chain management,is a set of organizations directly linked by one or moreupstream and downstream flows of products, services,finances, or information from a source to a customer.Supply chain management is the management of such achain.*[8]Supply chain management software includes tools ormodules used to execute supply chain transactions, man-age supplier relationships, and control associated busi-ness processes.Supply chain event management (SCEM) considers allpossible events and factors that can disrupt a supply chain.
With SCEM, possible scenarios can be created and solu-tions devised.In many cases the supply chain includes the collection ofgoods after consumer use for recycling. Including third-party logistics or other gathering agencies as part of theRM re-patriation process is a way of illustrating the newendgame strategy...
8.2 Functions
SCM is a cross-functional approach that includes manag-ing the movement of raw materials into an organization,certain aspects of the internal processing of materials intofinished goods, and the movement of finished goods outof the organization and toward the end consumer. Asorganizations strive to focus on core competencies andbecoming more flexible, they reduce their ownership ofraw materials sources and distribution channels. Thesefunctions are increasingly being outsourced to other firmsthat can perform the activities better or more cost effec-tively. The effect is to increase the number of organiza-tions involved in satisfying customer demand, while re-ducing managerial control of daily logistics operations.Less control and more supply chain partners led to thecreation of the concept of supply chain management. Thepurpose of supply chain management is to improve trustand collaboration among supply chain partners, thus im-proving inventory visibility and the velocity of inventorymovement.Main functions of Supply Chain Management are as fol-lows:
• Inventory Management
• Distribution Management
• Channel Management
• Payment Management
• Financial Management
• Supplier Management
• Transportation Management
• Customer Service Management

44 CHAPTER 8. SUPPLY CHAIN MANAGEMENT
8.3 Importance
Organizations increasingly find that they must rely on ef-fective supply chains, or networks, to compete in theglobal market and networked economy.*[11] In PeterDrucker's (1998) management paradigms, this conceptof business relationships extends beyond traditional en-terprise boundaries and seeks to organize entire businessprocesses throughout a value chain of multiple compa-nies.In recent decades, globalization, outsourcing, andinformation technology have enabled many organiza-tions, such as Dell and Hewlett Packard, to successfullyoperate collaborative supply networks in which each spe-cialized business partner focuses on only a few key strate-gic activities (Scott, 1993). This inter-organisationalsupply network can be acknowledged as a new form oforganisation. However, with the complicated interac-tions among the players, the network structure fits neither“market”or“hierarchy”categories (Powell, 1990). Itis not clear what kind of performance impacts differentsupply network structures could have on firms, and lit-tle is known about the coordination conditions and trade-offs that may exist among the players. From a systemsperspective, a complex network structure can be decom-posed into individual component firms (Zhang and Dilts,2004). Traditionally, companies in a supply network con-centrate on the inputs and outputs of the processes, withlittle concern for the internal management working ofother individual players. Therefore, the choice of an in-ternal management control structure is known to impactlocal firm performance (Mintzberg, 1979).In the 21st century, changes¶ in the business environ-ment have contributed to the development of supply chainnetworks. First, as an outcome of globalization and theproliferation of multinational companies, joint ventures,strategic alliances, and business partnerships, significantsuccess factors were identified, complementing the ear-lier extquotedbljust-in-time extquotedbl, lean manufac-turing, and agile manufacturing practices.*[12] Second,technological changes, particularly the dramatic fall incommunication costs (a significant component of trans-action costs), have led to changes in coordination amongthe members of the supply chain network (Coase, 1998).Many researchers have recognized supply network struc-tures as a new organisational form, using terms such asextquotedblKeiretsu extquotedbl,“Extended Enterprise”,“Virtual Corporation”,“Global Production Network”
, and“Next Generation Manufacturing System”.*[13]In general, such a structure can be defined as“a groupof semi-independent organisations, each with their capa-bilities, which collaborate in ever-changing constellationsto serve one or more markets in order to achieve somebusiness goal specific to that collaboration”(Akkermans,2001).The security management system for supply chains is de-scribed in ISO/IEC 28000 and ISO/IEC 28001 and re-lated standards published jointly by the ISO and the IEC.Supply Chain Management draws heavily from the areasof operations management, logistics, procurement, andinformation technology, and strives for an integrated ap-proach.
8.4 Historical developments
Six major movements can be observed in the evolution ofsupply chain management studies: creation, integration,and globalization (Movahedi et al., 2009), specializationphases one and two, and SCM 2.0.
8.4.1 Creation era
The term“supply chain management”was first coinedby Keith Oliver in 1982. However, the concept of a sup-ply chain in management was of great importance longbefore, in the early 20th century, especially with the cre-ation of the assembly line. The characteristics of thisera of supply chain management include the need forlarge-scale changes, re-engineering, downsizing drivenby cost reduction programs, and widespread attention toJapanese management practices.
8.4.2 Integration era
This era of supply chain management studies was high-lighted with the development of electronic data inter-change (EDI) systems in the 1960s, and developedthrough the 1990s by the introduction of enterprise re-source planning (ERP) systems. This era has continuedto develop into the 21st century with the expansion ofInternet-based collaborative systems. This era of supplychain evolution is characterized by both increasing valueadded and cost reductions through integration.

8.4. HISTORICAL DEVELOPMENTS 45
A supply chain can be classified as a stage 1, 2 or 3 net-work. In a stage 1–type supply chain, systems such asproduction, storage, distribution, and material control arenot linked and are independent of each other. In a stage2 supply chain, these are integrated under one plan andis ERP enabled. In a stage 3 supply chain is one thatachieves vertical integration with upstream suppliers anddownstream customers. An example of this kind of sup-ply chain is Tesco.
8.4.3 Globalization era
The third movement of supply chain management devel-opment, the globalization era, can be characterized bythe attention given to global systems of supplier relation-ships and the expansion of supply chains over nationalboundaries and into other continents. Although the useof global sources in organisationsʼsupply chains can betraced back several decades (e.g., in the oil industry), itwas not until the late 1980s that a considerable number oforganizations started to integrate global sources into theircore business. This era is characterized by the globaliza-tion of supply chain management in organizations withthe goal of increasing their competitive advantage, addingvalue, and reducing costs through global sourcing.
8.4.4 Specialization era (phase I): out-sourced manufacturing and distri-bution
In the 1990s, companies began to focus on“core com-petencies”and specialization. They abandoned verticalintegration, sold off non-core operations, and outsourcedthose functions to other companies. This changed man-agement requirements, by extending the supply chain be-yond the company walls and distributing managementacross specialized supply chain partnerships.This transition also refocused the fundamental perspec-tives of each organization. Original equipment manufac-turers (OEMs) became brand owners that required visi-bility deep into their supply base. They had to control theentire supply chain from above, instead of from within.Contract manufacturers had to manage bills of mate-rial with different part-numbering schemes from multi-ple OEMs and support customer requests for work-in-process visibility and vendor-managed inventory (VMI).The specialization model creates manufacturing and dis-
tribution networks composed of several individual sup-ply chains specific to producers, suppliers, and customersthat work together to design, manufacture, distribute,market, sell, and service a product. This set of partnersmay change according to a given market, region, or chan-nel, resulting in a proliferation of trading partner envi-ronments, each with its own unique characteristics anddemands.
8.4.5 Specialization era (phase II): supplychain management as a service
Specialization within the supply chain began in the 1980swith the inception of transportation brokerages, ware-house management, and non-asset-based carriers, andhas matured beyond transportation and logistics into as-pects of supply planning, collaboration, execution, andperformance management.Market forces sometimes demand rapid changes fromsuppliers, logistics providers, locations, or customers intheir role as components of supply chain networks. Thisvariability has significant effects on supply chain in-frastructure, from the foundation layers of establishingand managing electronic communication between trad-ing partners, to more complex requirements such as theconfiguration of processes and work flows that are essen-tial to the management of the network itself.Supply chain specialization enables companies to im-prove their overall competencies in the same way thatoutsourced manufacturing and distribution has done; itallows them to focus on their core competencies and as-semble networks of specific, best-in-class partners to con-tribute to the overall value chain itself, thereby increasingoverall performance and efficiency. The ability to quicklyobtain and deploy this domain-specific supply chain ex-pertise without developing and maintaining an entirelyunique and complex competency in house is a leadingreason why supply chain specialization is gaining popu-larity.Outsourced technology hosting for supply chain solutionsdebuted in the late 1990s and has taken root primar-ily in transportation and collaboration categories. Thishas progressed from the application service provider(ASP) model from roughly 1998 through 2003, to the on-demand model from approximately 2003 through 2006,to the software as a service (SaaS) model currently in fo-cus today.

46 CHAPTER 8. SUPPLY CHAIN MANAGEMENT
8.4.6 Supply chain management 2.0 (SCM2.0)
Building on globalization and specialization, the term“SCM 2.0”has been coined to describe both changeswithin supply chains themselves as well as the evolutionof processes, methods, and tools to manage them in thisnew “era”. The growing popularity of collaborativeplatforms is highlighted by the rise of TradeCard s̓ sup-ply chain collaboration platform, which connects multiplebuyers and suppliers with financial institutions, enablingthem to conduct automated supply-chain finance transac-tions.*[14]Web 2.0 is a trend in the use of theWorldWideWeb thatis meant to increase creativity, information sharing, andcollaboration among users. At its core, the common at-tribute ofWeb 2.0 is to help navigate the vast informationavailable on theWeb in order to find what is being bought.It is the notion of a usable pathway. SCM 2.0 replicatesthis notion in supply chain operations. It is the pathway toSCM results, a combination of processes, methodologies,tools, and delivery options to guide companies to theirresults quickly as the complexity and speed of the sup-ply chain increase due to global competition; rapid pricefluctuations; surging oil prices; short product life cycles;expanded specialization; near-, far-, and off-shoring; andtalent scarcity.SCM 2.0 leverages solutions designed to rapidly deliverresults with the agility to quickly manage future changefor continuous flexibility, value, and success. This is de-livered through competency networks composed of best-of-breed supply chain expertise to understand which el-ements, both operationally and organizationally, deliverresults, as well as through intimate understanding of howto manage these elements to achieve the desired results.The solutions are delivered in a variety of options, suchas no-touch via business process outsourcing, mid-touchvia managed services and software as a service (SaaS), orhigh-touch in the traditional software deployment model.
8.5 Business process integration
Successful SCM requires a change from managing in-dividual functions to integrating activities into key sup-ply chain processes. In an example scenario, a purchas-ing department places orders as its requirements becomeknown. The marketing department, responding to cus-
tomer demand, communicates with several distributorsand retailers as it attempts to determine ways to satisfythis demand. Information shared between supply chainpartners can only be fully leveraged through process in-tegration.Supply chain business process integration involves collab-orative work between buyers and suppliers, joint prod-uct development, common systems, and shared informa-tion. According to Lambert and Cooper (2000), operat-ing an integrated supply chain requires a continuous in-formation flow. However, in many companies, manage-ment has concluded that optimizing product flows can-not be accomplished without implementing a process ap-proach. The key supply chain processes stated by Lam-bert (2004)*[15] are:
• Customer relationship management
• Customer service management
• Demand management style
• Order fulfillment
• Manufacturing flow management
• Supplier relationship management
• Product development and commercialization
• Returns management
Best-in-class companies have similar characteristics,which include the following:
• Internal and external collaboration
• Initiatives to reduce lead time
• Tighter feedback from customer and market de-mand
• Customer-level forecasting
One could suggest other critical supply business processesthat combine these processes stated by Lambert, such as:
1. Customer service management
2. Procurement
3. Product development and commercialization

8.5. BUSINESS PROCESS INTEGRATION 47
4. Manufacturing flow management/support
5. Physical distribution
6. Outsourcing/partnerships
7. Performance measurement
8. Warehousing management
a) Customer service management process
Customer relationship management concerns the rela-tionship between an organization and its customers. Cus-tomer service is the source of customer information. Italso provides the customer with real-time informationon scheduling and product availability through interfaceswith the companyʼs production and distribution opera-tions. Successful organizations use the following steps tobuild customer relationships:
• determine mutually satisfying goals for organizationand customers
• establish and maintain customer rapport
• induce positive feelings in the organization and thecustomers
b) Procurement process
Strategic plans are drawn up with suppliers to support themanufacturing flow management process and the devel-opment of new products. In firms whose operations ex-tend globally, sourcing may bemanaged on a global basis.The desired outcome is a relationship where both partiesbenefit and a reduction in the time required for the prod-uct s̓ design and development. The purchasing functionmay also develop rapid communication systems, such aselectronic data interchange (EDI) and Internet linkage,to convey possible requirements more rapidly. Activitiesrelated to obtaining products and materials from outsidesuppliers involve resource planning, supply sourcing, ne-gotiation, order placement, inbound transportation, stor-age, handling, and quality assurance, many of which in-clude the responsibility to coordinate with suppliers onmatters of scheduling, supply continuity, hedging, and re-search into new sources or programs.
c) Product development and commercialization
Here, customers and suppliers must be integrated into theproduct development process in order to reduce the timeto market. As product life cycles shorten, the appropri-ate products must be developed and successfully launchedwith ever-shorter time schedules in order for firms to re-main competitive. According to Lambert and Cooper(2000), managers of the product development and com-mercialization process must:
1. coordinate with customer relationship managementto identify customer-articulated needs;
2. select materials and suppliers in conjunction withprocurement; and
3. develop production technology in manufacturingflow to manufacture and integrate into the best sup-ply chain flow for the given combination of productand markets.
d) Manufacturing flow management process
The manufacturing process produces and supplies prod-ucts to the distribution channels based on past forecasts.Manufacturing processes must be flexible in order to re-spond to market changes and must accommodate masscustomization. Orders are processes operating on a just-in-time (JIT) basis in minimum lot sizes. Changes in themanufacturing flow process lead to shorter cycle times,meaning improved responsiveness and efficiency in meet-ing customer demand. This process manages activitiesrelated to planning, scheduling, and supporting manufac-turing operations, such as work-in-process storage, han-dling, transportation, and time phasing of components,inventory at manufacturing sites, and maximum flexibil-ity in the coordination of geographical and final assem-blies postponement of physical distribution operations.
e) Physical distribution
This concerns the movement of a finished product or ser-vice to customers. In physical distribution, the customeris the final destination of a marketing channel, and theavailability of the product or service is a vital part of eachchannel participant s̓ marketing effort. It is also throughthe physical distribution process that the time and spaceof customer service become an integral part of market-ing. Thus it links a marketing channel with its customers(i.e., it links manufacturers, wholesalers, and retailers).
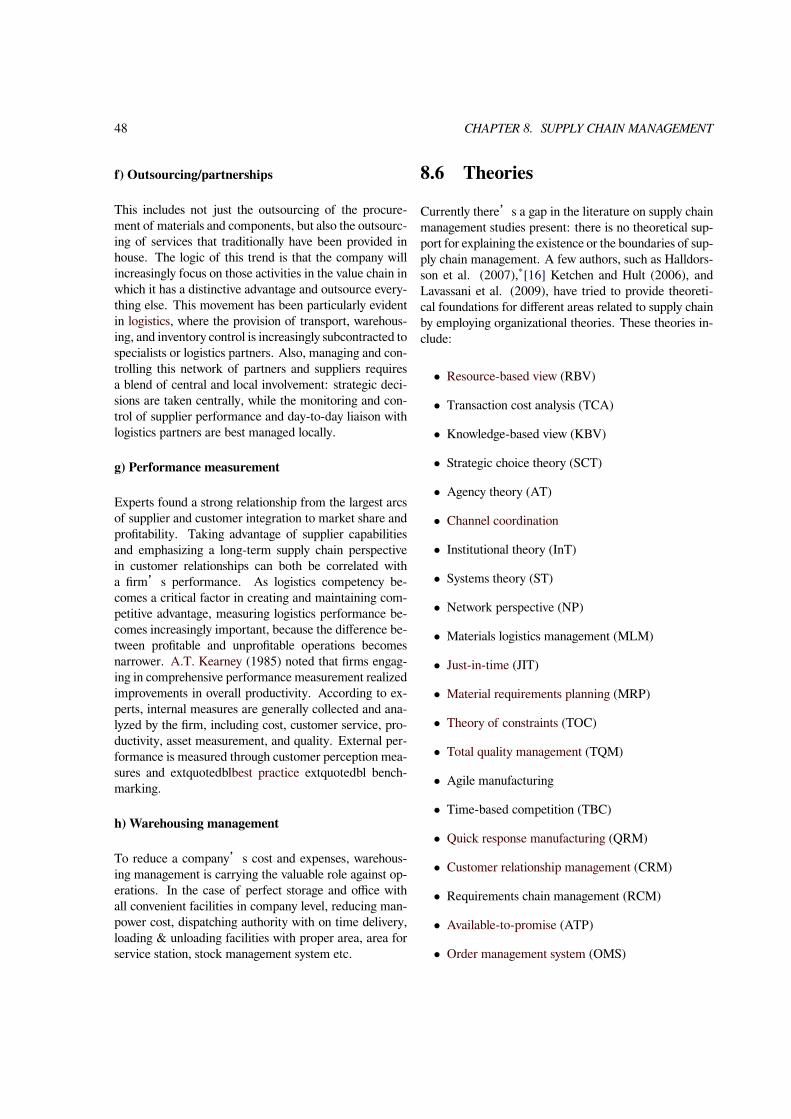
48 CHAPTER 8. SUPPLY CHAIN MANAGEMENT
f) Outsourcing/partnerships
This includes not just the outsourcing of the procure-ment of materials and components, but also the outsourc-ing of services that traditionally have been provided inhouse. The logic of this trend is that the company willincreasingly focus on those activities in the value chain inwhich it has a distinctive advantage and outsource every-thing else. This movement has been particularly evidentin logistics, where the provision of transport, warehous-ing, and inventory control is increasingly subcontracted tospecialists or logistics partners. Also, managing and con-trolling this network of partners and suppliers requiresa blend of central and local involvement: strategic deci-sions are taken centrally, while the monitoring and con-trol of supplier performance and day-to-day liaison withlogistics partners are best managed locally.
g) Performance measurement
Experts found a strong relationship from the largest arcsof supplier and customer integration to market share andprofitability. Taking advantage of supplier capabilitiesand emphasizing a long-term supply chain perspectivein customer relationships can both be correlated witha firmʼs performance. As logistics competency be-comes a critical factor in creating and maintaining com-petitive advantage, measuring logistics performance be-comes increasingly important, because the difference be-tween profitable and unprofitable operations becomesnarrower. A.T. Kearney (1985) noted that firms engag-ing in comprehensive performance measurement realizedimprovements in overall productivity. According to ex-perts, internal measures are generally collected and ana-lyzed by the firm, including cost, customer service, pro-ductivity, asset measurement, and quality. External per-formance is measured through customer perception mea-sures and extquotedblbest practice extquotedbl bench-marking.
h) Warehousing management
To reduce a companyʼs cost and expenses, warehous-ing management is carrying the valuable role against op-erations. In the case of perfect storage and office withall convenient facilities in company level, reducing man-power cost, dispatching authority with on time delivery,loading & unloading facilities with proper area, area forservice station, stock management system etc.
8.6 Theories
Currently there s̓ a gap in the literature on supply chainmanagement studies present: there is no theoretical sup-port for explaining the existence or the boundaries of sup-ply chain management. A few authors, such as Halldors-son et al. (2007),*[16] Ketchen and Hult (2006), andLavassani et al. (2009), have tried to provide theoreti-cal foundations for different areas related to supply chainby employing organizational theories. These theories in-clude:
• Resource-based view (RBV)
• Transaction cost analysis (TCA)
• Knowledge-based view (KBV)
• Strategic choice theory (SCT)
• Agency theory (AT)
• Channel coordination
• Institutional theory (InT)
• Systems theory (ST)
• Network perspective (NP)
• Materials logistics management (MLM)
• Just-in-time (JIT)
• Material requirements planning (MRP)
• Theory of constraints (TOC)
• Total quality management (TQM)
• Agile manufacturing
• Time-based competition (TBC)
• Quick response manufacturing (QRM)
• Customer relationship management (CRM)
• Requirements chain management (RCM)
• Available-to-promise (ATP)
• Order management system (OMS)

8.8. TAX EFFICIENT SUPPLY CHAIN MANAGEMENT 49
However, the unit of analysis of most of these theories isnot the supply chain but rather another system, such as thefirm or the supplier-buyer relationship. Among the fewexceptions is the relational view, which outlines a theoryfor considering dyads and networks of firms as a key unitof analysis for explaining superior individual firm perfor-mance (Dyer and Singh, 1998).*[17]One of the recent developments about supply chain the-ory has been presented by supply chain manager and ed-ucator Hernan David Perez, under the name of “Sup-ply Chain Roadmap”, which is a method whereby anorganizationʼs supply chain strategy can be reviewedin an organized and systematic approach in order to as-sure alignment of the supply chain with the business strat-egy. The method allows the characterisation of the sup-ply chain under analysis by 42 factors in a single pageview called“The Map”*[18] and allows the compari-son of this supply chain with 6-Supply Chain Archetypes(Fast, Efficient, Continuous Flow, Agile, Custom Con-figured, Flexible), in order to find gaps between supplychain under analysis and the most proper supply chainarchetype.*[19]*[20]
8.7 Supply chain centroids
In the study of supply chain management, the concept ofcentroids has become an important economic considera-tion. A centroid is a location that has a high proportionof a countryʼs population and a high proportion of itsmanufacturing, generally within 500 mi (805 km). In theUS, two major supply chain centroids have been defined,one near Dayton, Ohio, and a second near Riverside, Cal-ifornia.The centroid near Dayton is particularly important be-cause it is closest to the population center of the US andCanada. Dayton is within 500 miles of 60% of the USpopulation andmanufacturing capacity, as well as 60% ofCanada s̓ population.*[21] The region includes the inter-change between I-70 and I-75, one of the busiest in thenation, with 154,000 vehicles passing through per day,30–35% of which are trucks hauling goods. In addition,the I-75 corridor is home to the busiest north-south railroute east of the Mississippi River.*[21]
8.8 Tax efficient supply chain man-agement
Tax efficient supply chain management is a businessmodel that considers the effect of tax in the design andimplementation of supply chain management. As theconsequence of globalization, cross-national businessespay different tax rates in different countries. Due to thesedifferences, they may legally optimize their supply chainand increase profits based on tax efficiency.*[22]
8.9 Sustainability and social re-sponsibility in supply chains
Supply chain sustainability is a business issue affectingan organization s̓ supply chain or logistics network, andis frequently quantified by comparison with SECH rat-ings, which uses a triple bottom line incorporating eco-nomic, social, and environmental aspects.*[23] SECHratings are defined as social, ethical, cultural, and health'footprints. Consumers have become more aware of theenvironmental impact of their purchases and companiesʼSECH ratings and, along with non-governmental orga-nizations (NGOs), are setting the agenda for transitionsto organically grown foods, anti-sweatshop labor codes,and locally produced goods that support independent andsmall businesses. Because supply chains may account forover 75% of a company s̓ carbon footprint, many orga-nizations are exploring ways to reduce this and thus im-prove their SECH rating.For example, in July 2009, Wal-Mart announced its in-tentions to create a global sustainability index that wouldrate products according to the environmental and socialimpacts of their manufacturing and distribution. The in-dex is intended to create environmental accountabilityin Wal-Martʼs supply chain and to provide motivationand infrastructure for other retail companies to do thesame.*[24]It has been reported that companies are increasingly tak-ing environmental performance into account when select-ing suppliers. A 2011 survey by the Carbon Trust foundthat 50% of multinationals expect to select their suppliersbased upon carbon performance in the future and 29% ofsuppliers could lose their places on 'green supply chainsʼif they do not have adequate performance records on car-bon.*[25]
50 CHAPTER 8. SUPPLY CHAIN MANAGEMENT
The US Dodd–Frank Wall Street Reform and ConsumerProtection Act, signed into law by President Obama inJuly 2010, contained a supply chain sustainability pro-vision in the form of the Conflict Minerals law. Thislaw requires SEC-regulated companies to conduct thirdparty audits of their supply chains in order to determinewhether any tin, tantalum, tungsten, or gold (together re-ferred to as conflict minerals) is mined or sourced fromthe Democratic Republic of the Congo, and create a re-port (available to the general public and SEC) detailingthe due diligence efforts taken and the results of the au-dit. The chain of suppliers and vendors to these reportingcompanies will be expected to provide appropriate sup-porting information.Incidents like the 2013 Savar building collapse with morethan 1,100 victims have led to widespread discussionsabout corporate social responsibility across global sup-ply chains. Wieland and Handfield (2013) suggest thatcompanies need to audit products and suppliers and thatsupplier auditing needs to go beyond direct relationshipswith first-tier suppliers. They also demonstrate that vis-ibility needs to be improved if supply cannot be directlycontrolled and that smart and electronic technologies playa key role to improve visibility. Finally, they highlightthat collaboration with local partners, across the industryand with universities is crucial to successfully managingsocial responsibility in supply chains.*[26]In fact, supply chain sustainability has become sucha prominent field within the supply chain literature,Procurify created a scholarship to dedicate resourcestowards sustainability.*[27] Sustainability is an impor-tant concern for companies looking to improve theircompetitive advantage.
8.10 Components
8.10.1 Management components
SCM components are the third element of the four-square circulation framework. The level of integrationand management of a business process link is a func-tion of the number and level of components added to thelink (Ellram and Cooper, 1990; Houlihan, 1985). Con-sequently, adding more management components or in-creasing the level of each component can increase thelevel of integration of the business process link.Literature on business process re-engineering*[28]
buyer-supplier relationships,*[29] and SCM,*[30] Hall-dorsson and Skjoett-Larsen, 2006, suggests variouspossible components that should receive managerialattention when managing supply relationships. Lambertand Cooper (2000) identified the following components:
• Planning and control
• Work structure
• Organization structure
• Product flow facility structure
• Information flow facility structure
• Management methods
• Power and leadership structure
• Risk and reward structure
• Culture and attitude
However, a more careful examination of the existing lit-erature*[31] leads to a more comprehensive understand-ing of what should be the key critical supply chain com-ponents, or“branches”of the previously identified supplychain business processes̶that is, what kind of relation-ship the components may have that are related to sup-pliers and customers. Bowersox and Closs (1996) statethat the emphasis on cooperation represents the syner-gism leading to the highest level of joint achievement.A primary-level channel participant is a business thatis willing to participate in responsibility for inventoryownership or assume other financial risks, thus includingprimary level components (Bowersox and Closs, 1996).A secondary-level participant (specialized) is a businessthat participates in channel relationships by performingessential services for primary participants, including sec-ondary level components, which support primary partic-ipants. Third-level channel participants and componentsthat support primary-level channel participants and arethe fundamental branches of secondary-level componentsmay also be included.Consequently, Lambert and Cooper s̓ framework of sup-ply chain components does not lead to any conclusionabout what are the primary- or secondary-level (special-ized) supply chain components (see Bowersox and Closs,1996, p. 93) ̶that is, which supply chain componentsshould be viewed as primary or secondary, how thesecomponents should be structured in order to achieve a

8.13. CERTIFICATION 51
more comprehensive supply chain structure, and how toexamine the supply chain as an integrative one (See abovesections 2.1 and 3.1).
8.10.2 Reverse supply chain
Reverse logistics is the process of managing the return ofgoods. It is also referred to as “aftermarket customerservices”. Any time money is taken from a companyʼs warranty reserve or service logistics budget, one canspeak of a reverse logistics operation. Reverse logisticsis also the process of managing the return of goods fromstore, which the returned goods are sent back to ware-house and after that either warehouse scrap the goods orsend them back to supplier for replacement depending onthe warranty of the merchandise.
8.11 Systems and value
Supply chain systems configure value for those that orga-nize the networks. Value is the additional revenue overand above the costs of building the network. Co-creatingvalue and sharing the benefits appropriately to encourageeffective participation is a key challenge for any supplysystem. Tony Hines defines value as follows:“Ultimatelyit is the customer who pays the price for service deliveredthat confirms value and not the producer who simply addscost until that point”.*[9]
8.12 Global applications
Global supply chains pose challenges regarding bothquantity and value. Supply and value chain trends in-clude:
• Globalization
• Increased cross-border sourcing
• Collaboration for parts of value chain with low-costproviders
• Shared service centers for logistical and administra-tive functions
• Increasingly global operations, which require in-creasingly global coordination and planning toachieve global optimums
• Complex problems involve also midsized companiesto an increasing degree
These trends have many benefits for manufacturers be-cause they make possible larger lot sizes, lower taxes, andbetter environments (e.g., culture, infrastructure, spe-cial tax zones, or sophisticated OEM) for their products.There are many additional challenges when the scope ofsupply chains is global. This is because with a supplychain of a larger scope, the lead time is much longer, andbecause there are more issues involved, such as multiplecurrencies, policies, and laws. The consequent problemsinclude different currencies and valuations in differentcountries, different tax laws, different trading protocols,and lack of transparency of cost and profit.
8.13 Certification
There are several certification programs for SCM staffdevelopment, including International Institute for Pro-curement and Market Research (IIPMR), Associationfor Operations Management (APICS), International Pur-chasing and supply chain management institute (IP-SCMI),the International Supply Chain Education Al-liance (ISCEA), and the Institute of Supply Chain Man-agement (IOSCM). IIPMR offers three Certificationsnamely Certified Supply Chain Associate (CSCA), Cer-tified Supply Chain Specialist (CSCS) and Certified Pro-curement Professional (CPP.*[32]*[33] The APICS cer-tification is called the Certified Supply Chain Professional(CSCP); the ISCEA certification is called the CertifiedSupply Chain Manager (CSCM). Additionally, the In-stitute for Supply Management is developing a certifica-tion called the Certified Professional in Supply Manage-ment (CPSM),*[34] focused on procurement and sourc-ing, also called supply management. The PurchasingManagement Association of Canada is the main Cana-dian certifying body; its designations have global recipric-ocity. The main designation is the Supply Chain Man-agement Professional (SCMP), with several others pro-gressing toward it. In India, SCNext India caters to offerISCEA Certification to students and young professionalsthe CSCA and CSCM Certification Program, as the SC-Next youth arm of ISCEA, USA.Topics addressed by selected profes-sional supply chain certification pro-grammes*[32]*[33]*[34]*[35]*[36]*[37]

52 CHAPTER 8. SUPPLY CHAIN MANAGEMENT
8.14 Supply chain managementcollege level education
In the 2013/2014 Eduniversal Best Masters Rankingin Supply Chain and Logistics, the following schoolsachieved the highest degrees for logistics and supply chainrelated master programs worldwide: Erasmus UniversityRotterdam, Vienna University of Economics and Busi-ness, KEDGE Business School, Purdue University andCopenhagen Business School.*[38]The only university with a primary focus on logistics andsupply chain management is the Kühne Logistics Univer-sity in Hamburg, Germany. It is supported by the Kühne-Foundation of the logistics entrepreneur Klaus-MichaelKühne.In English-speaking countries, many other universitiesoffer supply chain management programs at the under-graduate and graduate levels including Degrees, Certifi-cates and Courses. Some of them are:United States*[39]
• University of Houston
• Indiana University
• Michigan State University*[40]
• Massachusetts Institute of Technology
• Brigham Young University
• Arizona State University
• Pennsylvania State University
• Ohio State University
• Carnegie Mellon University
• University of Tennessee
• Purdue University
• Northeastern University
• Rutgers University
• Virginia Tech
• University of Maryland
• University of Michigan
• University of South Carolina
• University of Texas at Dallas
• Western Michigan University
• Texas State University
• Western Illinois University
• Embry-Riddle Aeronautical University
• Louisiana Tech University
• University of North Dakota
• Clarkson University*[41]
United Kingdom*[42]
• University of Sheffield
• Heriot Watt University
• Cranfield University
• Huddersfield University
• Northumbria University
• University of Sunderland
• University of Liverpool
• University of Lincoln
• University of Birmingham
• University of Hull
• University of Central Lancashire
• Brunel University
• University of Westminster
Egypt
• Arab Academy for Science, Technology & Mar-itime Transport
Canada*[43]
• John Molson School of Business
• HEC Montreal

8.16. REFERENCES 53
8.15 See also
8.16 References[1] cf. Andreas Wieland, Carl Marcus Wallenburg (2011):
Supply-Chain-Management in stürmischen Zeiten. Berlin.
[2] Harland, C.M. (1996) Supply Chain Management, Pur-chasing and Supply Management, Logistics, Vertical In-tegration, Materials Management and Supply Chain Dy-namics. In: Slack, N (ed.) Blackwell Encyclopedic Dic-tionary of Operations Management. UK: Blackwell.
[3] “supply chain management (SCM) extquotedbl. APICSDictionary. Retrieved 19 June 2013.
[4] Bartsch, Frank.“Supply Chain Management (SCM) ex-tquotedbl. BB Handel. Retrieved 19 June 2013.
[5] David Jacoby (2009), Guide to Supply Chain Manage-ment: How Getting it Right Boosts Corporate Perfor-mance (The Economist Books), Bloomberg Press; 1st edi-tion, ISBN 978-1576603451
[6] Andrew Feller, Dan Shunk, & Tom Callarman (2006).BPTrends, March 2006 - Value Chains Vs. Supply Chains
[7] David Blanchard (2010), Supply Chain Management BestPractices, 2nd. Edition, John Wiley & Sons, ISBN9780470531884
[8] Mentzer, J.T. et al. (2001): Defining Supply Chain Man-agement, in: Journal of Business Logistics, Vol. 22, No.2, 2001, pp. 1–25
[9] Hines, T. 2004. Supply chain strategies: Customer drivenand customer focused. Oxford: Elsevier.
[10] Cooper et al., 1997
[11] Baziotopoulos, 2004
[12] MacDuffie and Helper, 1997; Monden, 1993; Womackand Jones, 1996; Gunasekaran, 1999
[13] Drucker, 1998; Tapscott, 1996; Dilts, 1999
[14] Trade Services and the Supply Chain
[15] Lambert, Douglas M.Supply Chain Management: Pro-cesses, Partnerships, Performance, 3rd edition, 2008.
[16] http://dx.doi.org/10.1108/13598540710759808
[17] http://dx.doi.org/10.2307/259056
[18] http://www.supplychainroadmap.com
[19] Supply Chain Roadmap: aligning supply chain with busi-ness strategy.
[20] “Supply Chain Strategies: Which one hits the mark? ex-tquotedbl. Supply Chain Quarterly (CSCMP). 2013.
[21] Doug Page,“Dayton Region a Crucial Hub for SupplyChain Management”, Dayton Daily News, 2009-12-21.
[22] Investor Words definition of“tax efficient”
[23] Khairul Anuar Rusli, Azmawani Abd Rahman and Ho,J.A. Green Supply Chain Management in DevelopingCountries: A Study of Factors and Practices in Malaysia.Paper presented at the 11th International Annual Sym-posium on Sustainability Science and Management (UM-TAS) 2012, Kuala Terengganu, 9–11 July 2012. See pub-lication here
[24] Wal-Mart s̓ Sustainability Index and Supply Chain GreenStandards
[25]“Indirect carbon emissions andwhy theymatter”. CarbonTrust. 7 Nov 2011. Retrieved 28 Jan 2014.
[26] Andreas Wieland and Robert B. Handfield (2013): TheSocially Responsible Supply Chain: An Imperative forGlobal Corporations. Supply Chain Management Re-view, Vol. 17, No. 5.
[27] “Procurify announces scholarship programs for supplychain sustainability and women in technology”. YahooFinance. 13 Jun 2014. Retrieved 18 Jun 2014.
[28] Macneil ,1975; Williamson, 1974; Hewitt, 1994
[29] Stevens, 1989; Ellram and Cooper, 1993; Ellram andCooper, 1990; Houlihan, 1985
[30] Cooper et al., 1997; Lambert et al.,1996; Turnbull, 1990
[31] Zhang and Dilts, 2004 ;Vickery et al., 2003; Hemila,2002; Christopher, 1998; Joyce et al., 1997; Bowersoxand Closs, 1996; Williamson, 1991; Courtright et al.,1989; Hofstede, 1978
[32] http://www.thehindu.com/features/metroplus/society/young-entrepreneurs-with-a-difference/article5064673.ece
[33] http://www.market-research-experts.com/wp/research-analysis/top-5-supply-chain-certifications/
[34] David Jacoby, 2009, Guide to Supply ChainManagement:HowGetting it Right Boosts Corporate Performance (TheEconomist Books), Bloomberg Press; 1st edition, ISBN978-1576603451. Chapter 10, Organising, training anddeveloping staff
54 CHAPTER 8. SUPPLY CHAIN MANAGEMENT
[35] Boston Strategies International
[36] http://techjumble.com/the-iipmr-certify-yourself-today/
[37] http://www.crunchbase.com/organization/international-institute-for-procurement-and-market-research-iipmr
[38] http://www.best-masters.com/ranking-master-supply-chain-and-logistics.html
[39] U.S. News - College Compass
[40] “Supply Chain Management Certificates”. MSU.
[41]
[42] UK Supply Chain Management Education
[43] HEC Montréal | Global Supply Chain Management | Op-tions | M. Sc. Hec.ca. Retrieved on 2014-04-19.
8.17 Further reading• Ferenc Szidarovszky and Sándor Molnár (2002) In-troduction to Matrix Theory: With Applications toBusiness and Economics, World Scientific Publish-ing. Description and preview.
• Cooper, M.C., Lambert, D.M., & Pagh, J. (1997)Supply Chain Management: More Than a NewName for Logistics. The International Journal ofLogistics Management Vol 8, Iss 1, pp 1–14
• FAO, 2007, Agro-industrial supply chain manage-ment: Concepts and applications. AGSF Occa-sional Paper 17 Rome.
• Haag, S., Cummings, M., McCubbrey, D., Pin-sonneault, A., & Donovan, R. (2006), Manage-ment Information Systems For the Information Age(3rd Canadian Ed.), Canada: McGraw Hill RyersonISBN 0-07-281947-2
• Halldorsson, Arni, Herbert Kotzab & Tage Skjott-Larsen (2003). Inter-organizational theories behindSupply Chain Management – discussion and appli-cations, In Seuring, Stefan et al. (eds.), Strategy andOrganization in Supply Chains, Physica Verlag.
• Halldorsson, A., Kotzab, H., Mikkola, J. H.,Skjoett-Larsen, T. (2007). Complementary theo-ries to supply chain management. Supply ChainManagement: An International Journal, Volume 12Issue 4, 284-296.*[1]
• Handfield and Bechtel, 2001; Prater et al., 2001;Kern and Willcocks, 2000; Bowersox and Closs,1996; Christopher, 1992; Bowersox, 1989
• Hines, T. 2004. Supply chain strategies: Customerdriven and customer focused. Oxford: Elsevier.
• Kallrath, J., Maindl, T.I. (2006): Real Optimizationwith SAP® APO. Springer ISBN 3-540-22561-7.
• Kaushik K.D., & Cooper, M. (2000). IndustrialMarketing Management. Volume29, Issue 1, Jan-uary 2000, Pages 65–83
• Ketchen Jr., G., & Hult, T.M. (2006). Bridgingorganization theory and supply chain management:The case of best value supply chains. Journal of Op-erations Management, 25(2) 573-580.
• Kouvelis, P.; Chambers, C.; Wang, H. (2006): Sup-ply Chain Management Research and Productionand Operations Management: Review, Trends, andOpportunities. In: Production and Operations Man-agement, Vol. 15, No. 3, pp. 449–469.
• Larson, P.D. and Halldorsson, A. (2004). Logisticsversus supply chain management: an internationalsurvey. International Journal of Logistics: Research& Application, Vol. 7, Issue 1, 17-31.*[2]
• Movahedi B., Lavassani K., Kumar V. (2009) Tran-sition to B2B e-Marketplace Enabled Supply Chain:Readiness Assessment and Success Factors, The In-ternational Journal of Technology, Knowledge andSociety, Volume 5, Issue 3, pp. 75–88.
• Lavassani K., Movahedi B., Kumar V. (2009) De-velopments in Theories of Supply Chain Manage-ment: The Case of B2B Electronic MarketplaceAdoption, The International Journal of Knowledge,Culture and Change Management, Volume 9, Issue6, pp. 85–98.
• Mentzer, J.T. et al. (2001): Defining Supply ChainManagement, in: Journal of Business Logistics, Vol.22, No. 2, 2001, pp. 1–25
• Simchi-Levi D.,Kaminsky P., Simchi-levi E.(2007), Designing and Managing the Supply Chain,third edition, Mcgraw Hill
• Packowski, Josef (2013): LEAN Supply Chain Plan-ning: The New Supply Chain Management Paradigmfor Process Industries to Master Todayʼs VUCAWorld. Productivity Press ISBN 978-1482205336.

8.18. EXTERNAL LINKS 55
8.18 External links• Supply Chain Management Definition and Solutions- CIO Magazine
• The Vital Role of Contract Manufacturing in SupplyChain Management and Optimization

Chapter 9
Lean manufacturing
Leanmanufacturing, Lean Enterprise, or lean produc-tion, often simply, extquotedbllean extquotedbl, is a pro-duction philosophy that considers the expenditure of re-sources in any aspect other than the direct creation ofvalue for the end customer to be wasteful, and thus a tar-get for elimination. Working from the perspective of theclient who consumes a product or service,“value”is anyaction or process that a customer would be willing to payfor.Essentially, lean is centered onmaking obvious what addsvalue by reducing everything else. Lean manufacturingis a management philosophy derived mostly from theToyota Production System (TPS) (hence the term Toy-otism is also prevalent) and identified as“lean”only in the1990s.*[1]*[2] TPS is renowned for its focus on reduc-tion of the original Toyota seven wastes to improve overallcustomer value, but there are varying perspectives on howthis is best achieved. The steady growth of Toyota, froma small company to the worldʼs largest automaker,*[3]has focused attention on how it has achieved this success.
9.1 Overview
Lean principles are derived from the Japanese manufac-turing industry. The term was first coined by John Kraf-cik in his 1988 article,“Triumph of the Lean ProductionSystem,”based on his master s̓ thesis at the MIT SloanSchool of Management.*[4] Krafcik had been a qualityengineer in the Toyota-GMNUMMI joint venture in Cal-ifornia before coming to MIT for MBA studies. Krafcikʼs research was continued by the International Motor Ve-hicle Program (IMVP) at MIT, which produced the inter-national best-selling book co-authored by Jim Womack,Daniel Jones, and Daniel Roos called The Machine That
Changed the World.*[1] A complete historical account ofthe IMVP and how the term“lean”was coined is givenby Holweg (2007).*[2]For many, lean is the set of “tools”that assist in theidentification and steady elimination of waste (muda).As waste is eliminated quality improves while produc-tion time and cost are reduced. A non exhaustive list ofsuch tools would include: SMED, Value Stream Map-ping, Five S, Kanban (pull systems), poka-yoke (error-proofing), Total Productive Maintenance, elimination oftime batching, mixed model processing, Rank OrderClustering, single point scheduling, redesigning work-ing cells, multi-process handling and control charts (forchecking mura).There is a second approach to lean Manufacturing, whichis promoted by Toyota, called The Toyota Way, in whichthe focus is upon improving the“flow”or smoothness ofwork, thereby steadily eliminating mura (“unevenness”) through the system and not upon 'waste reduction' perse. Techniques to improve flow include production lev-eling,“pull”production (by means of kanban) and theHeijunka box. This is a fundamentally different approachfrom most improvement methodologies, which may par-tially account for its lack of popularity.The difference between these two approaches is not thegoal itself, but rather the prime approach to achievingit. The implementation of smooth flow exposes qual-ity problems that already existed, and thus waste reduc-tion naturally happens as a consequence. The advan-tage claimed for this approach is that it naturally takesa system-wide perspective, whereas a waste focus some-times wrongly assumes this perspective.Both lean and TPS can be seen as a loosely connectedset of potentially competing principles whose goal is costreduction by the elimination of waste.*[5] These princi-
56
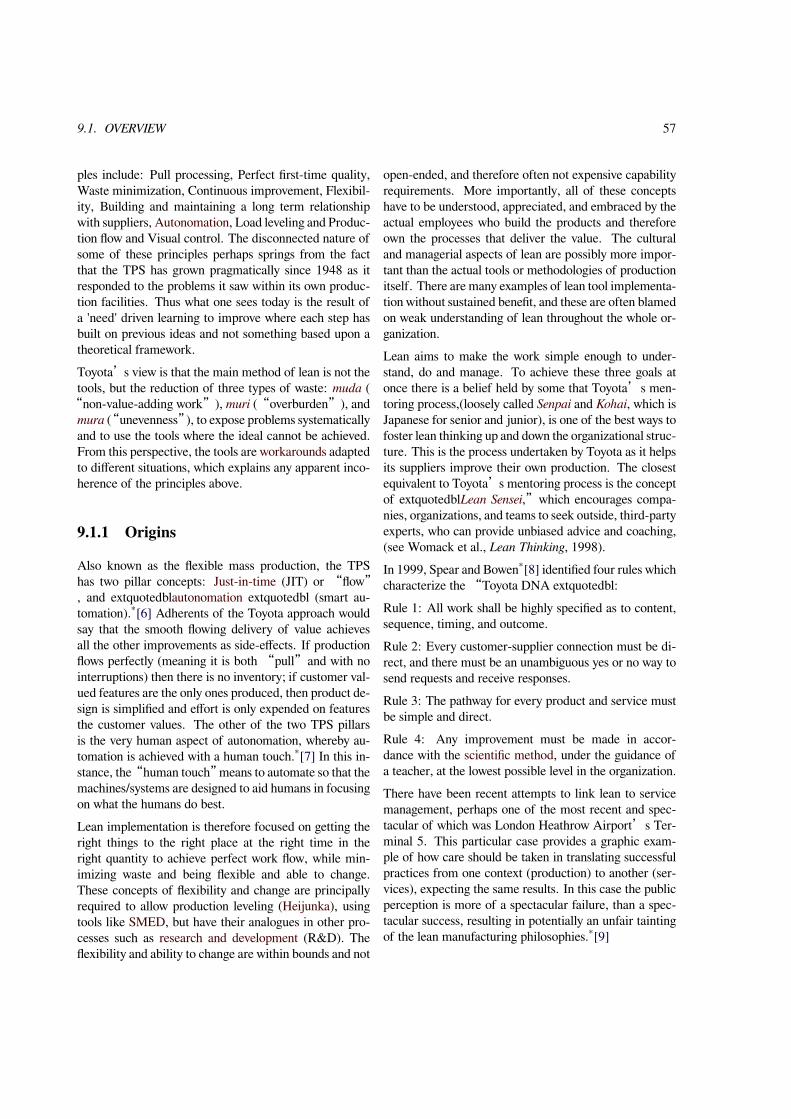
9.1. OVERVIEW 57
ples include: Pull processing, Perfect first-time quality,Waste minimization, Continuous improvement, Flexibil-ity, Building and maintaining a long term relationshipwith suppliers, Autonomation, Load leveling and Produc-tion flow and Visual control. The disconnected nature ofsome of these principles perhaps springs from the factthat the TPS has grown pragmatically since 1948 as itresponded to the problems it saw within its own produc-tion facilities. Thus what one sees today is the result ofa 'need' driven learning to improve where each step hasbuilt on previous ideas and not something based upon atheoretical framework.Toyota s̓ view is that the main method of lean is not thetools, but the reduction of three types of waste: muda (“non-value-adding work”), muri (“overburden”), andmura (“unevenness”), to expose problems systematicallyand to use the tools where the ideal cannot be achieved.From this perspective, the tools are workarounds adaptedto different situations, which explains any apparent inco-herence of the principles above.
9.1.1 Origins
Also known as the flexible mass production, the TPShas two pillar concepts: Just-in-time (JIT) or “flow”, and extquotedblautonomation extquotedbl (smart au-tomation).*[6] Adherents of the Toyota approach wouldsay that the smooth flowing delivery of value achievesall the other improvements as side-effects. If productionflows perfectly (meaning it is both “pull”and with nointerruptions) then there is no inventory; if customer val-ued features are the only ones produced, then product de-sign is simplified and effort is only expended on featuresthe customer values. The other of the two TPS pillarsis the very human aspect of autonomation, whereby au-tomation is achieved with a human touch.*[7] In this in-stance, the“human touch”means to automate so that themachines/systems are designed to aid humans in focusingon what the humans do best.Lean implementation is therefore focused on getting theright things to the right place at the right time in theright quantity to achieve perfect work flow, while min-imizing waste and being flexible and able to change.These concepts of flexibility and change are principallyrequired to allow production leveling (Heijunka), usingtools like SMED, but have their analogues in other pro-cesses such as research and development (R&D). Theflexibility and ability to change are within bounds and not
open-ended, and therefore often not expensive capabilityrequirements. More importantly, all of these conceptshave to be understood, appreciated, and embraced by theactual employees who build the products and thereforeown the processes that deliver the value. The culturaland managerial aspects of lean are possibly more impor-tant than the actual tools or methodologies of productionitself. There are many examples of lean tool implementa-tion without sustained benefit, and these are often blamedon weak understanding of lean throughout the whole or-ganization.Lean aims to make the work simple enough to under-stand, do and manage. To achieve these three goals atonce there is a belief held by some that Toyotaʼs men-toring process,(loosely called Senpai and Kohai, which isJapanese for senior and junior), is one of the best ways tofoster lean thinking up and down the organizational struc-ture. This is the process undertaken by Toyota as it helpsits suppliers improve their own production. The closestequivalent to Toyota s̓ mentoring process is the conceptof extquotedblLean Sensei,”which encourages compa-nies, organizations, and teams to seek outside, third-partyexperts, who can provide unbiased advice and coaching,(see Womack et al., Lean Thinking, 1998).In 1999, Spear and Bowen*[8] identified four rules whichcharacterize the“Toyota DNA extquotedbl:Rule 1: All work shall be highly specified as to content,sequence, timing, and outcome.Rule 2: Every customer-supplier connection must be di-rect, and there must be an unambiguous yes or no way tosend requests and receive responses.Rule 3: The pathway for every product and service mustbe simple and direct.Rule 4: Any improvement must be made in accor-dance with the scientific method, under the guidance ofa teacher, at the lowest possible level in the organization.There have been recent attempts to link lean to servicemanagement, perhaps one of the most recent and spec-tacular of which was London Heathrow Airportʼs Ter-minal 5. This particular case provides a graphic exam-ple of how care should be taken in translating successfulpractices from one context (production) to another (ser-vices), expecting the same results. In this case the publicperception is more of a spectacular failure, than a spec-tacular success, resulting in potentially an unfair taintingof the lean manufacturing philosophies.*[9]

58 CHAPTER 9. LEAN MANUFACTURING
9.2 A brief history of waste reduc-tion thinking
The avoidance of waste has a long history. In factmany ofthe concepts now seen as key to lean have been discoveredand rediscovered over the years by others in their searchto reduce waste. Lean manufacturing builds on their ex-periences, including learning from their mistakes.
9.2.1 Pre-20th century
The printer Benjamin Franklin contributed greatly to waste re-duction thinking
Most of the basic goals of lean manufacturing are com-mon sense, and documented examples can be seen asearly as Benjamin Franklin. Poor Richardʼs Almanacksays of wasted time, “He that idly loses 5s. worth oftime, loses 5s., and might as prudently throw 5s. into theriver.”He added that avoiding unnecessary costs could bemore profitable than increasing sales:“A penny saved istwo pence clear. A pin a-day is a groat a-year. Save andhave.”Again Franklin s̓ The Way to Wealth says the followingabout carrying unnecessary inventory. “You call themgoods; but, if you do not take care, they will prove evilsto some of you. You expect they will be sold cheap, and,perhaps, they may [be bought] for less than they cost; but,if you have no occasion for them, they must be dear to
you. Remember what Poor Richard says, 'Buy what thouhast no need of, and ere long thou shalt sell thy neces-saries.' In another place he says, 'Many have been ru-ined by buying good penny worths .̓”Henry Ford citedFranklin as a major influence on his own business prac-tices, which included Just-in-time manufacturing.The concept of waste being built into jobs and then takenfor granted was noticed bymotion efficiency expert FrankGilbreth, who saw that masons bent over to pick up bricksfrom the ground. The bricklayer was therefore loweringand raising his entire upper body to pick up a 2.3 kg (5lb.) brick, and this inefficiency had been built into thejob through long practice. Introduction of a non-stoopingscaffold, which delivered the bricks at waist level, allowedmasons to work about three times as quickly, and withless effort.
9.2.2 20th century
Frederick Winslow Taylor, the father of scientific man-agement, introduced what are now called standardizationand best practice deployment. In his Principles of Scien-tific Management, (1911), Taylor said:“And whenever aworkman proposes an improvement, it should be the pol-icy of the management to make a careful analysis of thenew method, and if necessary conduct a series of exper-iments to determine accurately the relative merit of thenew suggestion and of the old standard. And wheneverthe new method is found to be markedly superior to theold, it should be adopted as the standard for the wholeestablishment.”Taylor also warned explicitly against cutting piece rates(or, by implication, cutting wages or discharging work-ers) when efficiency improvements reduce the need forraw labor: extquotedbl...after a workman has had theprice per piece of the work he is doing lowered two orthree times as a result of his having worked harder andincreased his output, he is likely entirely to lose sight ofhis employer s̓ side of the case and become imbued witha grim determination to have no more cuts if soldiering[marking time, just doing what he is told] can prevent it.”Frank Bunker Gilbreth, Sr. established the fundamentalsfor predetermined motion time system, used in systemslike Methods-time measurement or similar.Shigeo Shingo, the best-known exponent of singleminute exchange of die and error-proofing or poka-yoke,cites Principles of Scientific Management as his inspira-

9.2. A BRIEF HISTORY OF WASTE REDUCTION THINKING 59
tion.*[10]American industrialists recognized the threat of cheapoffshore labor to American workers during the 1910s,and explicitly stated the goal of what is now called leanmanufacturing as a countermeasure. Henry Towne, pastPresident of the American Society of Mechanical Engi-neers, wrote in the Foreword to Frederick Winslow Tay-lor s̓ Shop Management (1911),“We are justly proud ofthe high wage rates which prevail throughout our country,and jealous of any interference with them by the prod-ucts of the cheaper labor of other countries. To maintainthis condition, to strengthen our control of home mar-kets, and, above all, to broaden our opportunities in for-eign markets where we must compete with the productsof other industrial nations, we should welcome and en-courage every influence tending to increase the efficiencyof our productive processes.”
9.2.3 Ford gets the ball rolling
Henry Ford continued this focus on waste while devel-oping his mass assembly manufacturing system. CharlesBuxton Going wrote in 1915:
Ford s̓ success has startled the country, almostthe world, financially, industrially, mechani-cally. It exhibits in higher degree than mostpersons would have thought possible the seem-ingly contradictory requirements of true effi-ciency, which are: constant increase of qual-ity, great increase of pay to the workers, re-peated reduction in cost to the consumer. Andwith these appears, as at once cause and ef-fect, an absolutely incredible enlargement ofoutput reaching something like one hundred-fold in less than ten years, and an enormousprofit to the manufacturer.*[11]
Ford, in My Life and Work (1922),*[12] provided asingle-paragraph description that encompasses the entireconcept of waste:
I believe that the average farmer puts to a re-ally useful purpose only about 5% of the energyhe expends.... Not only is everything done byhand, but seldom is a thought given to a log-ical arrangement. A farmer doing his choreswill walk up and down a rickety ladder a dozen
times. He will carry water for years insteadof putting in a few lengths of pipe. His wholeidea, when there is extra work to do, is to hireextramen. He thinks of puttingmoney into im-provements as an expense.... It is waste motion̶waste effort̶that makes farm prices highand profits low.
Poor arrangement of the workplace̶amajor focus of themodern kaizen̶and doing a job inefficiently out of habit̶are major forms of waste even in modern workplaces.Ford also pointed out how easy it was to overlookmaterialwaste. A former employee, Harry Bennett, wrote:
One day when Mr. Ford and I were togetherhe spotted some rust in the slag that ballastedthe right of way of the D. T. & I [railroad].This slag had been dumped there from our ownfurnaces. 'You know,' Mr. Ford said to me,'there s̓ iron in that slag. You make the cranecrews who put it out there sort it over, and takeit back to the plant.'*[13]
In other words, Ford saw the rust and realized that thesteel plant was not recovering all of the iron.Fordʼs early success, however, was not sustainable. AsJames P.Womack and Daniel Jones pointed out in“LeanThinking”, what Ford accomplished represented the“special case”rather than a robust lean solution.*[14]The major challenge that Ford faced was that his meth-ods were built for a steady-state environment, rather thanfor the dynamic conditions firms increasingly face to-day.*[15] Although his rigid, top-down controls made itpossible to hold variation in work activities down to verylow levels, his approach did not respond well to uncertain,dynamic business conditions; they responded particularlybadly to the need for new product innovation. This wasmade clear by Ford s̓ precipitous decline when the com-pany was forced to finally introduce a follow-on to theModel T (see Lean Dynamics).Design for Manufacture (DFM) also is a Ford concept.Ford said in My Life and Work (the same reference de-scribes just in time manufacturing very explicitly):
...entirely useless parts [may be]̶a shoe, adress, a house, a piece ofmachinery, a railroad,a steamship, an airplane. As we cut out uselessparts and simplify necessary ones, we also cut

60 CHAPTER 9. LEAN MANUFACTURING
down the cost of making. ... But also it is to beremembered that all the parts are designed sothat they can be most easily made.
This standardization of parts was central to Ford s̓ con-cept of mass production, and the manufacturing extquot-edbltolerances extquotedbl, or upper and lower dimen-sional limits that ensured interchangeability of parts be-came widely applied across manufacturing. Decadeslater, the renowned Japanese quality guru, GenichiTaguchi, demonstrated that this“goal post”method ofmeasuring was inadequate. He showed that “loss”incapabilities did not begin only after exceeding these tol-erances, but increased as described by the Taguchi LossFunction at any condition exceeding the nominal con-dition. This became an important part of W. EdwardsDeming's quality movement of the 1980s, later helpingto develop improved understanding of key areas of focussuch as cycle time variation in improving manufacturingquality and efficiencies in aerospace and other industries.While Ford is renowned for his production line it is of-ten not recognized how much effort he put into remov-ing the fittersʼwork to make the production line possi-ble. Until Ford, a carʼs components always had to befitted or reshaped by a skilled engineer at the point ofuse, so that they would connect properly. By enforcingvery strict specification and quality criteria on componentmanufacture, he eliminated this work almost entirely, re-ducing manufacturing effort by between 60-90%.*[16]However, Fordʼs mass production system failed to in-corporate the notion of“pull production”and thus oftensuffered from over-production.
9.2.4 Toyota develops TPS
Toyota s̓ development of ideas that later became leanmayhave started at the turn of the 20th century with SakichiToyoda, in a textile factory with looms that stopped them-selves when a thread broke. This became the seed of au-tonomation and Jidoka. Toyotaʼs journey with just-in-time (JIT) may have started back in 1934 when it movedfrom textiles to produce its first car. Kiichiro Toyoda,founder of Toyota Motor Corporation, directed the en-gine casting work and discovered many problems in theirmanufacture. He decided he must stop the repairing ofpoor quality by intense study of each stage of the process.In 1936, when Toyota won its first truck contract withthe Japanese government, his processes hit new problems
and he developed the extquotedblKaizen extquotedbl im-provement teams.Levels of demand in the PostWar economy of Japan werelow and the focus of mass production on lowest cost peritem via economies of scale therefore had little applica-tion. Having visited and seen supermarkets in the USA,Taiichi Ohno recognised the scheduling of work shouldnot be driven by sales or production targets but by ac-tual sales. Given the financial situation during this period,over-production had to be avoided and thus the notion ofPull (build to order rather than target driven Push) cameto underpin production scheduling.It was with Taiichi Ohno at Toyota that these themescame together. He built on the already existing inter-nal schools of thought and spread their breadth and useinto what has now become the Toyota Production System(TPS). It is principally from the TPS, but now includingmany other sources, that lean production is developing.Norman Bodek wrote the following in his foreword to areprint of Fordʼs Today and Tomorrow:
I was first introduced to the concepts of just-in-time (JIT) and the Toyota production systemin 1980. Subsequently I had the opportunityto witness its actual application at Toyota onone of our numerous Japanese study missions.There I met Mr. Taiichi Ohno, the systemʼscreator. When bombarded with questions fromour group on what inspired his thinking, he justlaughed and said he learned it all from HenryFord s̓ book.”The scale, rigor and continuouslearning aspects of TPS have made it a coreconcept of lean.
9.3 Types of waste
Although the elimination of waste may seem like a sim-ple and clear subject it is noticeable that waste is oftenvery conservatively identified. This then hugely reducesthe potential of such an aim. The elimination of wasteis the goal of lean, and Toyota defined three broad typesof waste: muda, muri and mura; it should be noted thatfor many lean implementations this list shrinks to thefirst waste type only with reduced corresponding bene-fits. To illustrate the state of this thinking Shigeo Shingoobserved that only the last turn of a bolt tightens it̶the rest is just movement. This ever finer clarification of

9.3. TYPES OF WASTE 61
waste is key to establishing distinctions between value-adding activity, waste and non-value-adding work.*[17]Non-value adding work is waste that must be done underthe present work conditions. One key is to measure, orestimate, the size of these wastes, to demonstrate the ef-fect of the changes achieved and therefore the movementtoward the goal.The “flow”(or smoothness) based approach aims toachieve JIT, by removing the variation caused by workscheduling and thereby provide a driver, rationale or tar-get and priorities for implementation, using a variety oftechniques. The effort to achieve JIT exposes many qual-ity problems that are hidden by buffer stocks; by forcingsmooth flow of only value-adding steps, these problemsbecome visible and must be dealt with explicitly.Muri is all the unreasonable work that management im-poses on workers and machines because of poor or-ganization, such as carrying heavy weights, movingthings around, dangerous tasks, even working signifi-cantly faster than usual. It is pushing a person or a ma-chine beyond its natural limits. This may simply be ask-ing a greater level of performance from a process than itcan handle without taking shortcuts and informally mod-ifying decision criteria. Unreasonable work is almost al-ways a cause of multiple variations.To link these three concepts is simple in TPS and thuslean. Firstly, muri focuses on the preparation and plan-ning of the process, or what work can be avoided proac-tively by design. Next, mura then focuses on how thework design is implemented and the elimination of fluc-tuation at the scheduling or operations level, such as qual-ity and volume. Muda is then discovered after the pro-cess is in place and is dealt with reactively. It is seenthrough variation in output. It is the role of managementto examine the muda, in the processes and eliminate thedeeper causes by considering the connections to the muriand mura of the system. The muda and mura inconsis-tencies must be fed back to the muri, or planning, stagefor the next project.A typical example of the interplay of these wastes is thecorporate behaviour of “making the numbers”as theend of a reporting period approaches. Demand is raisedto 'make plan,' increasing (mura), when the“numbers”are low, which causes production to try to squeeze ex-tra capacity from the process, which causes routines andstandards to be modified or stretched. This stretch andimprovisation leads to muri-style waste, which leads todowntime, mistakes and back flows, and waiting, thus the
muda of waiting, correction and movement.The original seven muda are:
• Transport (moving products that are not actually re-quired to perform the processing)
• Inventory (all components, work in process, and fin-ished product not being processed)
• Motion (people or equipment moving or walkingmore than is required to perform the processing)
• Waiting (waiting for the next production step, inter-ruptions of production during shift change)
• Overproduction (production ahead of demand)
• Over Processing (resulting from poor tool or productdesign creating activity)
• Defects (the effort involved in inspecting for and fix-ing defects)*[18]
Later an eighth waste was defined by Womack et al.(2003); it was described as manufacturing goods or ser-vices that do not meet customer demand or specifications.Many others have added the “waste of unused humantalent”to the original seven wastes. For example, sixsigma includes the waste of Skills, referred to as“under-utilizing capabilities and delegating tasks with inadequatetraining”. Other additional wastes added were for ex-ample“space”. These wastes were not originally a partof the seven deadly wastes defined by Taiichi Ohno inTPS, but were found to be useful additions in practice. In1999 Geoffrey Mika in his book,“Kaizen Event Imple-mentationManual”added three more forms of waste thatare now universally accepted; The waste associated withworking to the wrong metrics or no metrics, the wasteassociated with not utilizing a complete worker by notallowing them to contribute ideas and suggestions and bepart of ParticipativeManagement, and lastly the waste at-tributable to improper use of computers; not having theproper software, training on use and time spent surfing,playing games or just wasting time. For a complete list-ing of the “old”and “new”wastes see Bicheno andHolweg (2009)*[19]Some of these definitions may seem rather idealistic, butthis tough definition is seen as important and they drovethe success of TPS. The clear identification of non-value-adding work, as distinct from wasted work, is critical to
62 CHAPTER 9. LEAN MANUFACTURING
identifying the assumptions behind the current work pro-cess and to challenging them in due course.*[20] Break-throughs in SMED and other process changing tech-niques rely upon clear identification of where untappedopportunities may lie if the processing assumptions arechallenged.
9.4 Lean implementation developsfrom TPS
The discipline required to implement lean and the dis-ciplines it seems to require are so often counter-culturalthat they have made successful implementation of lean amajor challenge. Some*[21] would say that it was a ma-jor challenge in its manufacturing 'heartland' as well.Lean is about more than just cutting costs in the fac-tory.*[22] One crucial insight is that most costs areassigned when a product is designed, (see GenichiTaguchi).
9.4.1 An example program
In summary, an example of a lean implementation pro-gram could be:
9.4.2 Lean leadership
The role of the leaders within the organization is thefundamental element of sustaining the progress of leanthinking. Experienced kaizen members at Toyota, for ex-ample, often bring up the concepts of Senpai, Kohai, andSensei, because they strongly feel that transferring of Toy-ota culture down and across Toyota can only happenwhenmore experienced Toyota Sensei continuously coach andguide the less experienced lean champions.One of the dislocative effects of lean is in the area ofkey performance indicators (KPI). The KPIs by which aplant/facility are judged will often be driving behaviour,because the KPIs themselves assume a particular ap-proach to the work being done. This can be an issuewhere, for example a truly lean, Fixed Repeating Sched-ule (FRS) and JIT approach is adopted, because theseKPIs will no longer reflect performance, as the assump-tions on which they are based become invalid. It is a keyleadership challenge to manage the impact of this KPI
chaos within the organization.Similarly, commonly used accounting systems developedto support mass production are no longer appropriate forcompanies pursuing lean. Lean accounting provides trulylean approaches to business management and financial re-porting.After formulating the guiding principles of its lean man-ufacturing approach in the Toyota Production System(TPS), Toyota formalized in 2001 the basis of its leanmanagement: the key managerial values and attitudesneeded to sustain continuous improvement in the longrun. These core management principles are articulatedaround the twin pillars of Continuous Improvement (re-lentless elimination of waste) and Respect for People (en-gagement in long term relationships based on continuousimprovement and mutual trust).This formalization stems from problem solving. As Toy-ota expanded beyond its home base for the past 20 years,it hit the same problems in getting TPS properly appliedthat other western companies have had in copying TPS.Like any other problem, it has been working on tryinga series of countermeasures to solve this particular con-cern. These countermeasures have focused on culture:how people behave, which is the most difficult challengeof all. Without the proper behavioral principles and val-ues, TPS can be totally misapplied and fail to deliver re-sults. As with TPS, the values had originally been passeddown in a master-disciple manner, from boss to subor-dinate, without any written statement on the way. Justas with TPS, it was internally argued that formalizing thevalues would stifle them and lead to further misunder-standing. However, as Toyota veterans eventually wrotedown the basic principles of TPS, Toyota set to put theToyota Way into writing to educate new joiners.*[24]Continuous Improvement breaks down into three basicprinciples:
1. Challenge: Having a long term vision of the chal-lenges one needs to face to realize oneʼs ambition(what we need to learn rather than what we want todo and then having the spirit to face that challenge).To do so, we have to challenge ourselves every dayto see if we are achieving our goals.
2. Kaizen: Good enough never is, no process can everbe thought perfect, so operations must be improvedcontinuously, striving for innovation and evolution.
3. Genchi Genbutsu: Going to the source to see the

9.4. LEAN IMPLEMENTATION DEVELOPS FROM TPS 63
facts for oneself and make the right decisions, createconsensus, and make sure goals are attained at thebest possible speed.
Respect For People is less known outside of Toyota, andessentially involves two defining principles:
1. Respect: Taking every stakeholders p̓roblems seri-ously, and making every effort to build mutual trust.Taking responsibility for other people reaching theirobjectives.
2. Teamwork: This is about developing individualsthrough team problem-solving. The idea is to de-velop and engage people through their contributionto team performance. Shop floor teams, the wholesite as team, and team Toyota at the outset.
9.4.3 Differences from TPS
While lean is seen by many as a generalization of theToyota Production System into other industries and con-texts there are some acknowledged differences that seemto have developed in implementation.
1. Seeking profit is a relentless focus for Toyotaexemplified by the profit maximization principle(Price – Cost = Profit) and the need, therefore, topractice systematic cost reduction (through TPS orotherwise) to realize benefit. Lean implementa-tions can tend to de-emphasise this key measureand thus become fixated with the implementationof improvement concepts of “flow”or “pull”.However, the emergence of the“value curve anal-ysis”promises to directly tie lean improvements tobottom-line performance measuments.20
2. Tool orientation is a tendency in many programs toelevate mere tools (standardized work, value streammapping, visual control, etc.) to an unhealthy sta-tus beyond their pragmatic intent. The tools arejust different ways to work around certain types ofproblems but they do not solve them for you or al-ways highlight the underlying cause of many typesof problems. The tools employed at Toyota are of-ten used to expose particular problems that are thendealt with, as each toolʼs limitations or blindspotsare perhaps better understood. So, for example,Value Stream Mapping focuses upon material and
information flow problems (a title built into the Toy-ota title for this activity) but is not strong onMetrics,Man orMethod. Internally they well know the limitsof the tool and understood that it was never intendedas the best way to see and analyze every waste or ev-ery problem related to quality, downtime, personneldevelopment, cross training related issues, capacitybottlenecks, or anything to do with profits, safety,metrics or morale, etc. No one tool can do all ofthat. For surfacing these issues other tools are muchmore widely and effectively used.
3. Management technique rather than changeagents has been a principle in Toyota from the early1950s when they started emphasizing the develop-ment of the production manager s̓ and supervisorsʼskills set in guiding natural work teams and did notrely upon staff-level change agents to drive improve-ments. This can manifest itself as a“Push”imple-mentation of lean rather than“Pull”by the teamitself. This area of skills development is not that ofthe change agent specialist, but that of the naturaloperations work team leader. Although less presti-gious than the TPS specialists, development of workteam supervisors in Toyota is considered an equally,if not more important, topic merely because thereare tens of thousands of these individuals. Specif-ically, it is these manufacturing leaders that are themain focus of training efforts in Toyota since theylead the daily work areas, and they directly and dra-matically affect quality, cost, productivity, safety,and morale of the team environment. In many com-panies implementing lean the reverse set of priori-ties is true. Emphasis is put on developing the spe-cialist, while the supervisor skill level is expected tosomehow develop over time on its own.
4. Lack of understanding is one of the key reasonsthat a large share of lean manufacturing projects inthe west fail to bring any benefit. In Factory Physics,Hopp and Spearman describe this as romantic JIT,where the belief in the methods is more importantthan the actual understanding and results. In thisaspect, lean manufacturing is more of a religion thana science. Others have compared it to cargo cultscience.
64 CHAPTER 9. LEAN MANUFACTURING
9.5 Lean services
Main article: Lean services
Lean, as a concept or brand, has captured the imagina-tion of many in different spheres of activity. Examplesof these from many sectors are listed below.Lean principles have been successfully applied to callcenter services to improve live agent call handling. Bycombining Agent-assisted Automation and lean s̓ wastereduction practices, a company reduced handle time, re-duced between agent variability, reduced accent barriers,and attained near perfect process adherence.*[25]Lean principles have also found application in softwareapplication development andmaintenance and other areasof information technology (IT).*[26] More generally, theuse of lean in information technology has become knownas Lean IT.A study conducted on behalf of the Scottish Executive, byWarwick University, in 2005/06 found that lean methodswere applicable to the public sector, but that most resultshad been achieved using a much more restricted range oftechniques than lean provides.*[27]A study completed in 2010 identified that lean was be-ginning to embed in Higher Education in the UK (seeLean Higher Education).*[28] In addition, Bolton Hospi-tals NHS Trust published an article reporting to have suc-cessfully lowered their mortality rates after implementingLean. *[29]The challenge in moving lean to services is the lack ofwidely available reference implementations to allow peo-ple to see how directly applying lean manufacturing toolsand practices can work and the impact it does have. Thismakes it more difficult to build the level of belief seenas necessary for strong implementation. However, someresearch does relate widely recognized examples of suc-cess in retail and even airlines to the underlying princi-ples of lean.*[15] Despite this, it remains the case that thedirect manufacturing examples of 'techniquesʼor 'toolsʼneed to be better 'translated' into a service context to sup-port the more prominent approaches of implementation,which has not yet received the level of work or public-ity that would give starting points for implementors. Theupshot of this is that each implementation often 'feels itsway' along as must the early industrial engineering prac-tices of Toyota. This places huge importance upon spon-sorship to encourage and protect these experimental de-
velopments.
9.6 Lean goals and strategy
The espoused goals of lean manufacturing systems differbetween various authors. While some maintain an inter-nal focus, e.g. to increase profit for the organization,*[30]others claim that improvements should be done for thesake of the customer*[31]Some commonly mentioned goals are:
• Improve quality: To stay competitive in todayʼsmarketplace, a company must understand its cus-tomersʼwants and needs and design processes tomeet their expectations and requirements.
• Eliminate waste: Waste is any activity that con-sumes time, resources, or space but does not addany value to the product or service. See Types ofwaste, above.
Taking the first letter of each waste, the acronym“TIMWOOD”is formed. This is a common way to rememberthe wastes.
• Reduce time: Reducing the time it takes to finish anactivity from start to finish is one of the most effec-tive ways to eliminate waste and lower costs.
• Reduce total costs: To minimize cost, a companymust produce only to customer demand. Overpro-duction increases a company s̓ inventory costs be-cause of storage needs.
The strategic elements of lean can be quite complex, andcomprise multiple elements. Four different notions oflean have been identified:*[32]
1. Lean as a fixed state or goal (being lean)
2. Lean as a continuous change process (becominglean)
3. Lean as a set of tools ormethods (doing lean/toolboxlean)
4. Lean as a philosophy (lean thinking)

9.9. IMPLEMENTATION PITFALLS 65
9.7 The Lean Management Model
The Total Lean Management Model aligns ALL the pil-lars of Lean – TFM, TPM, TQM, TSM and THM in asystematic way under one umbrella, making Lean under-standing, learning and execution a smooth methodology.CreatingWORLDCLASSORGANIZATIONS – beginswith the basic requirement of having a good 5S in theworkplace, followed by identification, reduction and ifpossible elimination of the 7 Mudaʼs across the valuechain: customers to suppliers.
9.8 Steps to achieve lean systems
The following steps should be implemented to create theideal lean manufacturing system:*[33]
1. Design a simple manufacturing system
2. Recognize that there is always room for improve-ment
3. Continuously improve the lean manufacturing sys-tem design
9.8.1 Design a simple manufacturing sys-tem
A fundamental principle of lean manufacturing isdemand-based flow manufacturing. In this type of pro-duction setting, inventory is only pulled through each pro-duction center when it is needed to meet a customerʼsorder. The benefits of this goal include:*[33]
• decreased cycle time
• less inventory
• increased productivity
• increased capital equipment utilization
9.8.2 There is always room for improve-ment
The core of lean is founded on the concept of continuousproduct and process improvement and the elimination of
non-value added activities.“The Value adding activitiesare simply only those things the customer is willing to payfor, everything else is waste, and should be eliminated,simplified, reduced, or integrated”(Rizzardo, 2003). Im-proving the flow ofmaterial through new ideal system lay-outs at the customer s̓ required rate would reduce wastein material movement and inventory.*[33]
9.8.3 Continuously improve
A continuous improvement mindset is essential to reachthe companyʼs goals. The term“continuous improve-ment”means incremental improvement of products, pro-cesses, or services over time, with the goal of reducingwaste to improve workplace functionality, customer ser-vice, or product performance (Suzaki, 1987).Stephen Shortell (Professor of Health Services Manage-ment and Organizational Behaviour – Berkeley Univer-sity, California) states:-“For improvement to flourish it must be carefully cul-tivated in a rich soil bed (a receptive organization),given constant attention (sustained leadership), assuredthe right amounts of light (training and support) andwater(measurement and data) and protected from damaging.”
9.8.4 Measure
Overall equipment effectiveness (OEE) is a set of perfor-mance metrics that fit well in a lean environment.
9.8.5 9 Steps for CreatingWorld Class Or-ganization
The 9 steps make Lean Learning the easiest possible.Each is Muda can be reduced by Lean Pillars and toolsthough a step by step approach.
9.9 Implementation pitfalls
One criticism of lean perennially heard among rank-and-file workers is that lean practitioners may easily focus toomuch on the tools and methodologies of lean, and fail tofocus on the philosophy and culture of lean. The implica-tion of this for lean implementers is that adequate com-mand of the subject is needed in order to avoid failed im-

66 CHAPTER 9. LEAN MANUFACTURING
plementations.*[34] Another pitfall is that managementdecides what solution to use without understanding thetrue problem and without consulting shop floor person-nel. As a result lean implementations often look good tothe manager but fail to improve the situation.*[34] In ad-dition, many of the popular lean initiatives, coming fromthe TPS, are solutions to specific problems that Toyotawas facing. Toyota, having an undesired current con-dition, determined what the end state would look like.Through much study, the gap was closed, which resultedin many of the tools in place today. Often, when a toolis implemented outside of TPS, a company believes thatthe solution lay specifically within one of the popular leaninitiatives. The tools which were the solution to a specificproblem for a specific company may not be able to be ap-plied in exactly the same manner as designed. Thus, thesolution does not fit the problem and a temporary solutionis created vs. the actual root cause.*[35]
9.10 See also
• Toyota Production System
• Lean software development
• Lean CFP driven
• JobShopLean
• Efficiency Movement
• 5S (methodology)
• Value stream mapping
• Kanban
• Six Sigma
• Key performance indicator
• Ishikawa diagram
• Spaghetti plot
• Total productive maintenance
• Poka-yoke
9.11 References[1] Womack, James P.; Daniel T. Jones; Daniel Roos (1990).
The Machine That Changed the World.
[2] Holweg, Matthias (2007). “The genealogy of lean pro-duction”. Journal of Operations Management 25 (2):420–437. doi:10.1016/j.jom.2006.04.001.
[3] Bailey, David (24 January 2008). “Automotive Newscalls Toyota world No 1 car maker”. Reuters.com.Reuters. Retrieved 19 April 2008.
[4] Krafcik, John F. (1988).“Triumph of the lean productionsystem”. Sloan Management Review 30 (1): 41–52.
[5] Ohno, Taiichi (1988). Toyota Production System. Produc-tivity Press. p. 8. ISBN 0-915299-14-3.
[6] Suprateek Roy (1988), p 4
[7] Suprateek Roy (1988), p 6
[8] Spear, Steven; Bowen, H. Kent (September 1999).“De-coding the DNA of the Toyota Production System”. Har-vard Business Review.
[9] “Problems continue at Heathrow s̓ Terminal 5”. NewYork Times. March 31, 2008.
[10] Andrew Dillon, translator, 1987. The Sayings of ShigeoShingo: Key Strategies for Plant Improvement).
[11] (Charles Buxton Going, preface to Arnold and Faurote,Ford Methods and the Ford Shops (1915))
[12] Ford, Henry; with Crowther, Samuel (1922). My Life andWork. Garden City, New York, USA: Garden City Pub-lishing Company, Inc. Various republications, includingISBN 978-1-4065-0018-9. Original is public domain inU.S.
[13] Bennett, Harry; with Marcus, Paul (1951). We NeverCalled Him Henry. New York: Fawcett Publications.LCCN 51036122.
[14] Womack, James P.; Daniel T. Jones (2003). Lean Think-ing. Free Press.
[15] Ruffa, Stephen A. (2008). Going Lean: How the BestCompanies Apply Lean Manufacturing Principles to Shat-ter Uncertainty, Drive Innovation, and Maximize Profits.AMACOM. ISBN 0-8144-1057-X.
[16] Hounshell, David A. (1984), From the American Sys-tem to Mass Production, 1800-1932: The Development ofManufacturing Technology in the United States, Baltimore,Maryland: Johns Hopkins University Press, ISBN 978-0-8018-2975-8, LCCN 83016269 pp 248 ff.

9.12. FURTHER READING 67
[17] Toyota Production System, Taichi Ohno, ProductivityPress, 1988, p. 58
[18] Template:Cite book * Under utilization of employees
[19] Bicheno, John; Holweg, Matthias (2009). The Lean Tool-box. PICSIE. ISBN 978-0-9541244-5-8.
[20] Toyota Vision and Philosophy
[21] Pat Lancaster of Lean Thinking s̓ Lanchester Technolo-gies reference implementation
[22] Maskell & Baggaley (December 19, 2003). “PracticalLean Accounting”. Productivity Press, New York, NY.
[23] The Gold Mine, F & M Ballé, The Lean Enterprise Insti-tute, 2005, p196
[24] Michael Ballé & Freddy Ballé (2009) The Lean Manager,Lean Enterprise Institute
[25] Adsit, Dennis.“Cutting Edge Methods Target Real CallCenter Waste”. isixsigma.com. Archived from the orig-inal on 2008-04-14. Retrieved 19 April 2008.
[26] Hanna, Julia. “BringingʻLeanʼPrinciples to ServiceIndustries”. HBSWorking Knowledge. October 22, 2007.(Summary article based on published research of Profes-sor David Upton of Harvard Business School and doctoralstudent Bradley Staats: Staats, Bradley R., and David M.Upton. “Lean Principles, Learning, and Software Pro-duction: Evidence from Indian Software Services.”. Har-vard Business School Working Paper. No. 08-001. July2007. (Revised July 2008, March 2009.)
[27] Radnor, Dr Zoe; Paul Walley; Andrew Stephens; Gio-vanni Bucci. “Evaluation Of The Lean Approach ToBusiness Management And Its Use In The Public Sector”. scotland.gov.uk. Retrieved 19 April 2008.
[28] Radnor & Bucci (2010) extquotedbl Analysis ofLean Implementation in UK Business Schools andUniversities”, Association of Business Schools,http://www.wbs.ac.uk/downloads/news/2011/03/abs-lean-report-exec-summary-march-2011-13008.pdf
[29] Fillingham, D. (2007) Can lean save lives? Leadership inHealth Services. Vol 20 (4) pp. 231-241
[30] e.g. Liker, J.K., 2004. The Toyota Way: 14 Manage-ment Principles from theWorld s̓ Greatest Manufacturer,NewYork: McGraw-Hill., Feld, W.M., 2001. LeanMan-ufacturing: Tools, Techniques, and How to Use Them,Boca Raton: St. Lucie Press., Ohno, T., 1988. Toy-ota Production System: Beyond Large-Scale Production,Portland: Productivity Press., Monden, Y., 1998. Toy-ota production system: an integrated approach to just-in-time, London: Chapman & Hall., Schonberger, R.J.,
1982. Japanese Manufacturing Techniques: Nine HiddenLessons in Simplicity, New York: Free Press., Shingo, S.,1984. A Study of the Toyota Production System from anIndustrial Engineering Viewpoint, Tokyo: JapanManage-ment Association.
[31] e.g. Womack, J.P., Jones, D.T. & Roos, D., 1990. TheMachine That Changed the World: The Story of Lean Pro-duction, New York: Rawson Associates., Womack, J.P. &Jones, D.T., 2003. Lean Thinking: Banish Waste and Cre-ate Wealth in Your Corporation, New York: Free Press.,Bicheno, J., 2004. The new lean toolbox: towards fast,flexible flow, Buckingham: PICSIE Books., Dennis, P.,2002. Lean Production Simplified: A Plain LanguageGuide to the Worldʼs Most Powerful Production Sys-tem, New York: Productivity Press., Schonberger, R.J.,1982. Japanese Manufacturing Techniques: Nine HiddenLessons in Simplicity, New York: Free Press.
[32] Pettersen, J., 2009. Defining lean production: some con-ceptual and practical issues. The TQM Journal, 21(2),127 - 142.
[33] Thinking of Lean Manufacturing Systems
[34] Hopp, Wallace; Spearman, Mark (2008), Factory Physics:Foundations of Manufacturing Management (3rd ed.),ISBN 978-0-07-282403-2.
[35] Pederson, Joseph.“Author”. the business dude. Word-Press.com. Retrieved 27 April 2014.
9.12 Further reading• MacInnes, Richard L. (2002) The Lean EnterpriseMemory Jogger.
• Page, Julian (2003) Implementing LeanManufactur-ing Techniques.
• Mika, Geoffrey L. (1999) Kaizen Event Implemen-tation Manual
9.13 External links• NIST lean manufacturing portal
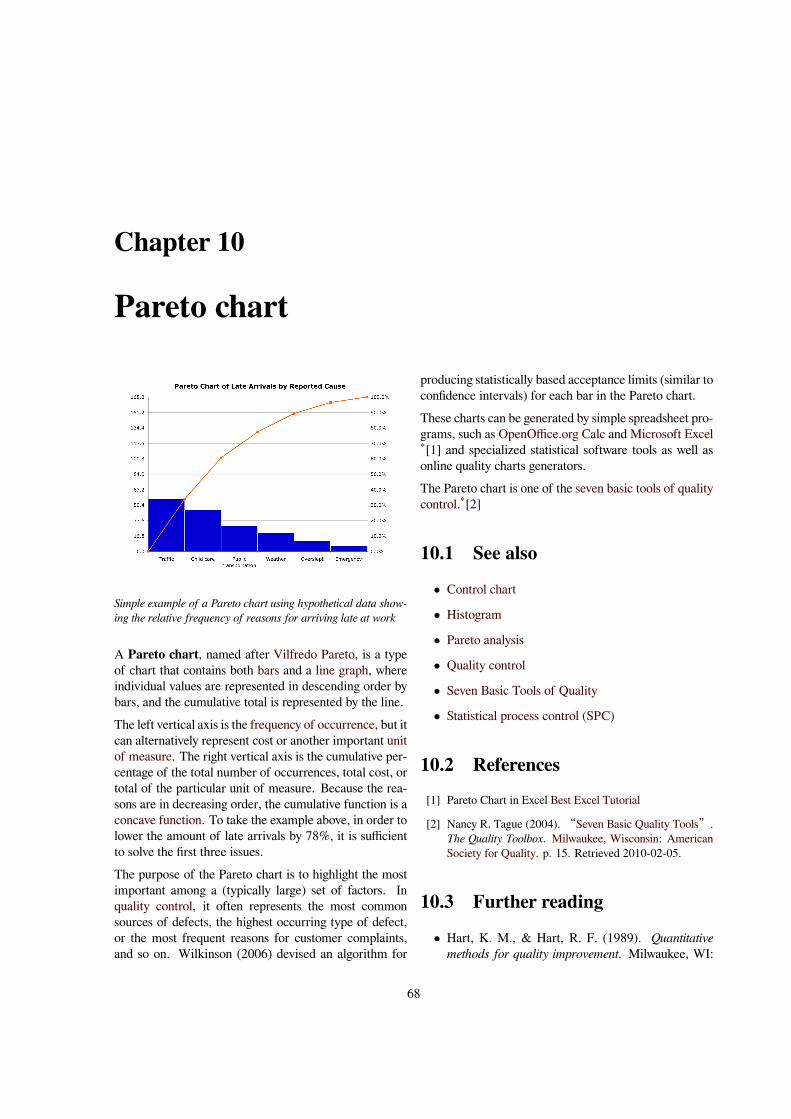
Chapter 10
Pareto chart
Simple example of a Pareto chart using hypothetical data show-ing the relative frequency of reasons for arriving late at work
A Pareto chart, named after Vilfredo Pareto, is a typeof chart that contains both bars and a line graph, whereindividual values are represented in descending order bybars, and the cumulative total is represented by the line.The left vertical axis is the frequency of occurrence, but itcan alternatively represent cost or another important unitof measure. The right vertical axis is the cumulative per-centage of the total number of occurrences, total cost, ortotal of the particular unit of measure. Because the rea-sons are in decreasing order, the cumulative function is aconcave function. To take the example above, in order tolower the amount of late arrivals by 78%, it is sufficientto solve the first three issues.The purpose of the Pareto chart is to highlight the mostimportant among a (typically large) set of factors. Inquality control, it often represents the most commonsources of defects, the highest occurring type of defect,or the most frequent reasons for customer complaints,and so on. Wilkinson (2006) devised an algorithm for
producing statistically based acceptance limits (similar toconfidence intervals) for each bar in the Pareto chart.These charts can be generated by simple spreadsheet pro-grams, such as OpenOffice.org Calc and Microsoft Excel*[1] and specialized statistical software tools as well asonline quality charts generators.The Pareto chart is one of the seven basic tools of qualitycontrol.*[2]
10.1 See also• Control chart
• Histogram
• Pareto analysis
• Quality control
• Seven Basic Tools of Quality
• Statistical process control (SPC)
10.2 References[1] Pareto Chart in Excel Best Excel Tutorial
[2] Nancy R. Tague (2004). “Seven Basic Quality Tools”.The Quality Toolbox. Milwaukee, Wisconsin: AmericanSociety for Quality. p. 15. Retrieved 2010-02-05.
10.3 Further reading• Hart, K. M., & Hart, R. F. (1989). Quantitativemethods for quality improvement. Milwaukee, WI:
68

10.3. FURTHER READING 69
ASQC Quality Press. Santosh: Pre Press
• Juran, J. M. (1962). Quality control handbook. NewYork: McGraw-Hill.
• Juran, J. M., & Gryna, F. M. (1970). Quality plan-ning and analysis. New York: McGraw-Hill.
• Montgomery, D. C. (1985). Statistical quality con-trol. New York: Wiley.
• Montgomery, D. C. (1991). Design and analysis ofexperiments, 3rd ed. New York: Wiley.
• Pyzdek, T. (1989). What every engineer shouldknow about quality control. New York: MarcelDekker.
• Vaughn, R. C. (1974). Quality control. Ames, IA:Iowa State Press.
• Wilkinson, L. (2006). “Revising the ParetoChart”. The American Statistician 60: 332–334.doi:10.1198/000313006x152243.
Chapter 11
ABC analysis
The ABC Analysis is a business term used to de-fine an inventory categorization technique often used inmaterials management. It is also known as Selective In-ventory Control. Policies based on ABC analysis:
• A ITEMS: very tight control and accurate records.
• B ITEMS: less tightly controlled and good records.
• C ITEMS: simplest controls possible and minimalrecords.
The ABC analysis provides a mechanism for identifyingitems that will have a significant impact on overall in-ventory cost,*[1] while also providing a mechanism foridentifying different categories of stock that will requiredifferent management and controls.The ABC analysis suggests that inventories of an organi-zation are not of equal value. *[2] Thus, the inventory isgrouped into three categories (A, B, and C) in order oftheir estimated importance.'A' items are very important for an organization. Becauseof the high value of these ʻAʼitems, frequent valueanalysis is required. In addition to that, an organizationneeds to choose an appropriate order pattern (e.g.ʻJust-in- timeʼ) to avoid excess capacity.'B' items are important, but of course less important thanʻA i̓tems and more important than̒ C i̓tems. ThereforeʻBʼitems are intergroup items.'C' items are marginally important.
11.1 ABC analysis categories
There are no fixed threshold for each class, different pro-portion can be applied based on objective and criteria.
ABC Analysis is similar to the Pareto principle in thatthe 'A' items will typically account for a large proportionof the overall value but a small percentage of number ofitems.*[3]Example of ABC class are
• ‘A’ items – 20% of the items accounts for 70% ofthe annual consumption value of the items.
• ‘B’ items - 30% of the items accounts for 25% of theannual consumption value of the items.
• ‘C’ items - 50% of the items accounts for 5% of theannual consumption value of the items.
Another recommended breakdown of ABC classes:*[4]
1.“A”approximately 10% of items or 66.6% of value
2.“B”approximately 20% of items or 23.3% of value
3.“C”approximately 70% of items or 10.1% of value
11.2 ABC analysis in ERP pack-ages
Major ERP packages (Adjutant, SAP, Oracle,Microsoft,Roadmap etc.) have built in function ofABC analysis. User can execute ABC analysis basedon user defined criteria and system apply ABC code toitems (parts). See detail at external link.
70

11.4. SEE ALSO 71
11.3 Example of the application ofweighed operation based onABC class
Actual distribution of ABC class in the electron-ics manufacturing company with 4051 active parts.
Using this distribution of ABC class and change totalnumber of the parts to 14213.
• Uniform Purchase
When you apply equal purchasing policy to all 14213components, example weekly delivery and re-order point(safety stock) of 2 week supply assuming that there areno lot size constraints, the factory will have 16000 deliv-ery in 4 weeks and average inventory will be 2.5 weeksupply.
• Weighed Purchase
In comparison, when weighed purchasing policy ap-plied based on ABC class, example C class monthly
(every 4 week) delivery with re-order point of 3week supply, B class Bi-weekly delivery with re-order point of 2 weeks supply, A class weekly de-livery with re-order point of 1 week supply, to-tal number of delivery in 4 weeks will be (A200x4=800)+(B 400x2=800)+(C 3400x1=3400)=5000and average inventory will be (A 75%x1.5weeks)+(B15%x3weeks)+(C 10%x3.5weeks)=1.925 week supply.*a) A class item can be applied much tighter control likeJIT daily delivery. If daily delivery with one day stock isapplied, delivery frequency will be 4000 and average in-ventory level of A class item will be 1.5 days supply andtotal inventory level will be 1.025 week supply. reduc-tion of inventory by 59%. Total delivery frequency alsoreduced to half from 16000 to 8200.
• Result
By applying weighed control based on ABC classifica-tion, required man-hours and inventory level are drasti-cally reduced.
• Alternate way of finding ABC analysis:-
The ABC concept is based on*[5] It too much inventoryis kept, the ABC analysis can be performed on a sample.After obtaining the random sample the following stepsare carried out for the ABC analysis. STEP 1: Computethe annual usage value for every item in the sample bymultiplying the annual requirements by the cost per unit.STEP 2: Arrange the items in decending order of theusage value calculated above. STEP 3: Make a cumu-lative total of the number of items and the usage value.STEP 4: Convert the cumulative total of number of itemsand usage values into a percentage of their grand totals.STEP 5: Draw a graph connecting cumulative % itemsand cumulative % usage value. The graph is divided ap-proximately into three segments, where the curve sharplychanges its shape. This indicates the three segments A,B and C. www.freeittips.com
11.4 See also
• Inventory
• Stock management

72 CHAPTER 11. ABC ANALYSIS
11.5 References[1] Manufacturing planning and control systems for supply
chain management By Thomas E. Vollmann
[2] Lun, Lai, Cheng (2010) Shipping and Logistics Manage-ment, p. 158
[3] Purchasing and Supply Chain Management By KennethLysons, Brian Farrington
[4] Best Practice in Inventory Management, by Tony Wild(2nd Ed., p. 40)
[5] Paretoʼs law that few high usage value items constitutea major part of the capital invested in inventories whereasa large number of items having low usage value constitutean insignificant part of the capital.
11.6 External links• SAP library ABC Analysis
• Oracle Overview of ABC Analysis

Chapter 12
Just in time (business)
Just in time (JIT) is a production strategy that strivesto improve a businessʼreturn on investment by reduc-ing in-process inventory and associated carrying costs.Just in time is a type of operations management approachwhich originated in Japan in the 1950s. It was adopted byToyota and other Japanese manufacturing firms, with ex-cellent results: Toyota and other companies that adoptedthe approach ended up raising productivity (through theelimination of waste) significantly.*[1] To meet JIT ob-jectives, the process relies on signals or Kanban (看板,Kanban) between different points, which are involved inthe process, which tell production when to make the nextpart. Kanban are usually 'ticketsʼbut can be simple vi-sual signals, such as the presence or absence of a part on ashelf. Implemented correctly, JIT focuses on continuousimprovement and can improve a manufacturing organi-zationʼs return on investment, quality, and efficiency.To achieve continuous improvement key areas of focuscould be flow, employee involvement and quality.JIT relies on other elements in the inventory chain as well.For instance, its effective application cannot be indepen-dent of other key components of a lean manufacturingsystem or it can“end up with the opposite of the desiredresult.”*[2] In recent years manufacturers have contin-ued to try to hone forecasting methods such as apply-ing a trailing 13-week average as a better predictor forJIT planning; however, some research demonstrates thatbasing JIT on the presumption of stability is inherentlyflawed.*[3]
12.1 Philosophy
The philosophy of JIT is simple: the storage of unusedinventory is a waste of resources. JIT inventory systems
expose hidden cost of keeping inventory, and are there-fore not a simple solution for a company to adopt it. Thecompany must follow an array of new methods to man-age the consequences of the change. The ideas in this wayof working come from many different disciplines includ-ing statistics, industrial engineering, production manage-ment, and behavioral science. The JIT inventory philos-ophy defines how inventory is viewed and how it relatesto management.Inventory is seen as incurring costs, or waste, insteadof adding and storing value, contrary to traditional ac-counting. This does not mean to say JIT is implementedwithout an awareness that removing inventory exposespre-existing manufacturing issues. This way of workingencourages businesses to eliminate inventory that doesnot compensate for manufacturing process issues, and toconstantly improve those processes to require less inven-tory. Secondly, allowing any stock habituates manage-ment to stock keeping. Management may be temptedto keep stock to hide production problems. These prob-lems include backups at work centers, machine reliabil-ity, process variability, lack of flexibility of employeesand equipment, and inadequate capacity.In short, the Just-in-Time inventory system focus in hav-ing“the right material, at the right time, at the right place,and in the exact amount”, without the safety net of in-ventory. The JIT system has broad implications for im-plementers.
12.2 Transaction cost approach
JIT helps in keeping inventory to minimum in a firm.However, a firm may simply be outsourcing their inputinventory to suppliers, even if those suppliers don't use
73
74 CHAPTER 12. JUST IN TIME (BUSINESS)
Just-in-Time (Naj 1993). Newman (1994) investigatedthis effect and found that suppliers in Japan charged JITcustomers, on average, a 5% price premium.
12.3 Environmental concerns
During the birth of JIT, multiple daily deliveries wereoften made by bicycle. Increased scale has required amove to vans and trucks (lorries). Cusumano (1994)highlighted the potential and actual problems this causeswith regard to gridlock and burning of fossil fuels. Thisviolates three JIT waste guidelines:
1. Time̶wasted in traffic jams2. Inventory̶specifically pipeline (in transport) in-
ventory3. Scrap̶fuel burned while not physically moving
12.4 Price change
Because Just-In-Time manufacturers do not store rawmaterials, they can be affected more drastically by theeffects of changing prices.
12.5 Quality volatility
JIT implicitly assumes that input parts quality remainsconstant over time. If not, firms may hoard high-qualityinputs. As with price volatility, a solution is to work withselected suppliers to help them improve their processesto reduce variation and costs. Longer term price agree-ments can then be negotiated and agreed-on quality stan-dards made the responsibility of the supplier. Fixing upof standards for volatility of quality according to the qual-ity circleKarmarker (1989) highlights the importance of relativelystable demand, which helps ensure efficient capital uti-lization rates. Karmarker cost production.
12.6 Supply stability
In the U.S., the 1992 railway strikes caused General Mo-tors to idle a 75,000-worker plant because they had no
supply.
12.7 JIT implementation design
Based on a diagram modeled after the one used byHewlett-Packard s̓ Boise plant to accomplish its JIT pro-gram.
1) F Design Flow Process
– F Redesign/relayout for flow – L Reduce lot sizes – OLink operations –W Balance workstation capacity – MPreventivemaintenance – S Reduce setup Times
2) Q Total Quality Control
– C worker compliance – I Automatic inspection – Mqualitymeasures –M fail-safemethods –WWorker par-ticipation
3) S Stabilize Schedule
– S Level schedule –W Establish freeze windows – UCUnderutilize Capacity
4) K Kanban Pull System
– D Demand pull – B Backflush – L Reduce lot sizes
5) VWork with Vendors
–LReduce lead time –D Frequent deliveries –U Projectusage requirements – Q Quality expectations
6) I Further Reduce Inventory in Other Areas
– S Stores – T Transit –C Implement carrousel to reducemotion waste – C Implement conveyor belts to reducemotion waste
7) P Improve Product Design
– P Standard production configuration – P Standardizeand reduce the number of parts – P Process design withproduct design – Q Quality expectations

12.7. JIT IMPLEMENTATION DESIGN 75
12.7.1 Effects
A surprising effect of JIT was that car factory responsetime fell to about a day. This improved customer satis-faction by providing vehicles within a day or two of theminimum economic shipping delay.Also, the factory began building many vehicles to order,eliminating the risk they would not be sold. This im-proved the companyʼs return on equity.Since assemblers no longer had a choice of which partto use, every part had to fit perfectly. This caused a qual-ity assurance crisis, which led to a dramatic improvementin product quality. Eventually, Toyota redesigned everypart of its vehicles to widen tolerances, while simultane-ously implementing careful statistical controls for qualitycontrol. Toyota had to test and train parts suppliers toassure quality and delivery. In some cases, the companyeliminated multiple suppliers.When a process or parts quality problem surfaced onthe production line, the entire production line had to beslowed or even stopped. No inventory meant a line couldnot operate from in-process inventory while a productionproblem was fixed. Many people in Toyota predicted thatthe initiative would be abandoned for this reason. In thefirst week, line stops occurred almost hourly. But by theend of the first month, the rate had fallen to a few linestops per day. After six months, line stops had so littleeconomic effect that Toyota installed an overhead pull-line, similar to a bus bell-pull, that let any worker on theline order a line stop for a process or quality problem.Even with this, line stops fell to a few per week.The result was a factory that has been studied worldwide.It has been widely emulated, but not always with the ex-pected results, as many firms fail to adopt the full sys-tem.*[4]The just-in-time philosophy was also applied to othersegments of the supply chain in several types of indus-tries. In the commercial sector, it meant eliminating oneor all of the warehouses in the link between a factory anda retail establishment. Examples in sales, marketing, andcustomer service involve applying information systemsand mobile hardware to deliver customer information asneeded, and reducing waste by video conferencing to cuttravel time.*[5]
12.7.2 Benefits
Main benefits of JIT include:
• Reduced setup time. Cutting setup time allowsthe company to reduce or eliminate inventory for“changeover”time. The tool used here is SMED(single-minute exchange of dies).
• The flow of goods from warehouse to shelves im-proves. Small or individual piece lot sizes reduce lotdelay inventories, which simplifies inventory flowand its management.
• Employees with multiple skills are used more effi-ciently. Having employees trained to work on differ-ent parts of the process allows companies to moveworkers where they are needed.
• Production scheduling and work hour consistencysynchronized with demand. If there is no demand fora product at the time, it is not made. This saves thecompany money, either by not having to pay work-ers overtime or by having them focus on other workor participate in training.
• Increased emphasis on supplier relationships. Acompany without inventory does not want a supplysystem problem that creates a part shortage. Thismakes supplier relationships extremely important.
• Supplies come in at regular intervals throughout theproduction day. Supply is synchronized with pro-duction demand and the optimal amount of inven-tory is on hand at any time. When parts move di-rectly from the truck to the point of assembly, theneed for storage facilities is reduced.
• Minimizes storage space needed.
• Smaller chance of inventory breaking/expiring.
• Waste Elimination Supports Continuous Qualityand Productivity Improvement *[6]
12.7.3 Problems
Within a JIT system
Just-in-time operation leaves suppliers and downstreamconsumers open to supply shocks and large supply or de-mand changes. For internal reasons, Ohno saw this as a

76 CHAPTER 12. JUST IN TIME (BUSINESS)
feature rather than a bug. He used an analogy of loweringthe water level in a river to expose the rocks to explainhow removing inventory showed where production flowwas interrupted. Once barriers were exposed, they couldbe removed. Since one of the main barriers was rework,lowering inventory forced each shop to improve its ownquality or cause a holdup downstream. A key tool to man-age this weakness is production levelling to remove thesevariations. Just-in-time is a means to improving perfor-mance of the system, not an end.Very low stock levels means shipments of the same partcan come in several times per day. This means Toyota isespecially susceptible to flow interruption. For that rea-son, Toyota uses two suppliers for most assemblies. Asnoted in Liker (2003), there was an exception to this rulethat put the entire company at risk because of the 1997Aisin fire. However, since Toyota also makes a pointof maintaining high quality relations with its entire sup-plier network, several other suppliers immediately tookup production of the Aisin-built parts by using existingcapability and documentation.
Within a raw material stream
As noted by Liker (2003) andWomack and Jones (2003),it ultimately would be desirable to introduce synchronisedflow and link JIT through the entire supply stream. How-ever, none followed this in detail all the way back throughthe processes to the raw materials. With present technol-ogy, for example, an ear of corn cannot be grown anddelivered to order. The same is true of most raw ma-terials, which must be discovered and/or grown throughnatural processes that require time and must account fornatural variability in weather and discovery. The part ofthis currently viewed as impossible is the synchronisedpart of flow and the linked part of JIT. It is for the rea-sons stated raw materials companies decouple their sup-ply chain from their clientsʼdemand by carrying large'finished goods s̓tocks. Both flow and JIT can be imple-mented in isolated process islands within the raw mate-rials stream. The challenge becomes to achieve that iso-lation by some means other than carrying huge stocks, asmost do today.Because of this, almost all value chains are split into apart made-to-forecast and a part that could, by using JIT,become make-to-order. Historically, the make-to-orderpart has often been within the retailer portion of the valuechain. Toyota took Piggly Wiggly s̓ supermarket replen-
ishment system and drove it at least halfway through theirautomobile factories. Their challenge today is to drive itall the way back to their goods-inwards dock. Of course,the mining of iron and making of steel is still not con-nected to an order for a particular car. Recognising JITcould be driven back up the supply chain has reaped Toy-ota huge benefits and a dominant position in the auto in-dustry.Note that the advent of the mini mill steelmaking facilityis starting to challenge how far back JIT can be imple-mented, as the electric arc furnaces at the heart of manymini-mills can be started and stopped quickly, and steelgrades changed rapidly.
Oil
It has been frequently charged that the oil industry hasbeen influenced by JIT.*[7]*[8]*[9]The argument is presented as follows:
The number of refineries in the United Stateshas fallen from 279 in 1975 to 205 in 1990 andfurther to 149 in 2004. As a result, the indus-try is susceptible to supply shocks, which causespikes in prices and subsequently reduction indomestic manufacturing output. The effectsof hurricanes Katrina and Rita are given as anexample: in 2005, Katrina caused the shut-down of 9 refineries in Louisiana and 6 morein Mississippi, and a large number of oil pro-duction and transfer facilities, resulting in theloss of 20% of the US domestic refinery out-put. Rita subsequently shut down refineries inTexas, further reducing output. The GDP fig-ures for the third and fourth quarters showed aslowdown from 3.5% to 1.2% growth. Similararguments were made in earlier crises.
Beside the obvious point that prices went up because ofthe reduction in supply and not for anything to do with thepractice of JIT, JIT students and even oil and gas indus-try analysts question whether JIT as it has been developedby Ohno, Goldratt, and others is used by the petroleumindustry. Companies routinely shut down facilities forreasons other than the application of JIT. One of thosereasons may be economic rationalization: when the ben-efits of operating no longer outweigh the costs, includingopportunity costs, the plant may be economically inef-

12.9. EARLY USE OF A JIT SYSTEM 77
ficient. JIT has never subscribed to such considerationsdirectly; following Waddel and Bodek (2005), this ROI-based thinking conforms more to Brown-style account-ing and Sloan management. Further, and more signif-icantly, JIT calls for a reduction in inventory capacity,not production capacity. From 1975 to 1990 to 2005,the annual average stocks of gasoline have fallen by only8.5% from 228,331 to 222,903 bbls to 208,986 (EnergyInformation Administration data). Stocks fluctuate sea-sonally by as much as 20,000 bbls. During the 2005hurricane season, stocks never fell below 194,000,000bbl (30,800,000 m3), while the low for the period 1990to 2006 was 187,017,000 bbl (29,733,300 m3) in 1997.This shows that while industry storage capacity has de-creased in the last 30 years, it hasn't been drastically re-duced as JIT practitioners would prefer.Finally, as shown in a pair of articles in the extquot-edblOil & Gas Journal extquotedbl, JIT does not seemto have been a goal of the industry. In Waguespack andCantor (1996), the authors point out that JIT would re-quire a significant change in the supplier/refiner relation-ship, but the changes in inventories in the oil industryexhibit none of those tendencies. Specifically, the re-lationships remain cost-driven among many competingsuppliers rather than quality-based among a select fewlong-term relationships. They find that a large part of theshift came about because of the availability of short-haulcrudes from Latin America. In the follow-up editorial,the Oil & Gas Journal claimed that“casually adoptingpopular business terminology that doesn't apply”had pro-vided a“rhetorical bogey”to industry critics. Confessingthat they had been as guilty as other media sources, theyconfirmed that“It also happens not to be accurate.”
12.8 Business models followingsimilar approach
12.8.1 Vendor-managed inventory
Vendor-managed inventory (VMI) employs the sameprinciples as those of JIT inventory, however, the respon-sibilities of managing inventory is placed with the ven-dor in a vendor/customer relationship. Whether itʼs amanufacturer managing inventory for a distributor, or adistributor managing inventory for their customers, themanagement role goes to the vendor.An advantage of this business model is that the vendor
may have industry experience and expertise that lets thembetter anticipate demand and inventory needs. The in-ventory planning and controlling is facilitated by applica-tions that allow vendors access to their customerʼs in-ventory data.Another advantage to the customer is that inventory costusually remains on the vendor s̓ books until used by thecustomer, even if parts or materials are on the customerʼs site.
12.8.2 Customer-managed inventory
With customer-managed inventory (CMI), the customer,as opposed to the vendor in a VMI model, has respon-sibility for all inventory decisions. This is similar to JITinventory concepts. With a clear picture of their inven-tory and that of their supplier s̓, the customer can antic-ipate fluctuations in demand and make inventory replen-ishment decisions accordingly.
12.9 Early use of a JIT system
A type of JIT was used successfully in the UK by Perkinsto supply F3 engines to Ford from 1957 until 1964.
12.10 See also• Backflush accounting
• CONWIP
• Demand flow technology
• Industrial engineering
• Inventory proportionality
• Just in case manufacturing
• Just in Sequence
• Lean consumption
• Lean manufacturing
• Liquid logistics
• Organizational capital
• Real-time enterprise

78 CHAPTER 12. JUST IN TIME (BUSINESS)
• Theory of constraints
• Total quality management
• Vendor-managed inventory
12.11 References[1] Impact of just-in-time (JIT) inventory system on effi-
ciency, quality and flexibility among manufacturing sec-tor, small and medium enterprise (SMEs) in South Africa,Musara Mazanai, African Journal of Business Manage-ment Vol. 6(17), pp. 5786-5791, 2 May, 2012, pg. 5787-5788
[2] A study of the Toyota Production System, Shigeo Shingo,Productivity Press, 1989, p 187
[3] Ruffa, Stephen A., (2008). Going Lean: How theBest Companies Apply Lean Manufacturing Principlesto Shatter Uncertainty, Drive Innovation, and MaximizeProfits, AMACOM (American Management Associa-tion)
[4] Alan Pilkington,“Manufacturing Strategy Regained: Ev-idence for the Demise of Best-Practice”, California Man-agement Review, (1998) Vol. 41, No.1, pp.31–42.
[5] Paul H. Selden (1997). Sales Process Engineering: APersonalWorkshop. Milwaukee,WI: ASQQuality Press.pp. 113–117.
[6] Malakooti, Behnam (2013). Operations and ProductionSystems with Multiple Objectives. John Wiley & Sons.ISBN 978-1-118-58537-5.
[7] Bongiorni, Sara.“All in the timing”, The Greater BatonRouge Business Report, 19 July 2004.
[8] “Online NewsHour: Rising gas prices – April 30, 1996”. Retrieved 2007-09-24.
[9]“Story taken from Time magazine May 13, 1996 Volume147, No. 20”. Retrieved 2007-09-24.
12.12 Further reading• Schonberger, Richard J. (1982), Japanese Manufac-turing Techniques: Nine Hidden Lessons in Simplic-ity, Free Press, ISBN 0-02-929100-3
• Editorial,“The Inventory Land Mine”, Oil & GasJournal, Vol 94, Number 29, 15 July 1996.
• Flinchbaugh, Jamie and Carlino, Andy (2006), TheHitchhiker s̓ Guide to Lean: Lessons from the Road,SME, ISBN 0-87263-831-6
• Goldratt, Eliyahu M. and Fox, Robert E. (1986),The Race, North River Press, ISBN 0-88427-062-9
• Hirano, Hiroyuki andMakota, Furuya (2006),“JITIs Flow: Practice and Principles of Lean Manufac-turing”, PCS Press, Inc., ISBN 0-9712436-1-1
• Liker, Jeffrey (2003), The Toyota Way: 14 Man-agement Principles from the World s̓ Greatest Man-ufacturer, First edition, McGraw-Hill, ISBN 0-07-139231-9.
• Management Coaching and Training Services,(2006). The Just-In-Time (JIT) Approach. Re-trieved June 19, 2006 from the World Wide Web:
• Ohno, Taiichi (1988), Toyota Production System:Beyond Large-Scale Production, Productivity Press,ISBN 0-915299-14-3
• Ohno, Taiichi (1988), Just-In-Time for Today andTomorrow, Productivity Press, ISBN 0-915299-20-8
• Wadell, William, and Bodek, Norman (2005), TheRebirth of American Industry, PCS Press, ISBN 0-9712436-3-8
• Waguespack, Kevin, and Cantor, Bryan (1996),“Oil inventories should be based on margins, supplyreliability”, Oil & Gas Journal, Vol 94, Number 28,8 July 1996.
• Womack, James P. and Jones, Daniel T. (2003),Lean Thinking: Banish Waste and Create Wealthin Your Corporation, Revised and Updated, Harper-Business, ISBN 0-7432-4927-5.
• Womack, James P., Jones, Daniel T., and Roos,Daniel (1991), The Machine That Changed theWorld: The Story of Lean Production, HarperBusi-ness, 2003, ISBN 0-06-097417-6.
Condie, Allan T.“Fordson Dexta 957E s̓ 1957-1964”ISBN 0-907742-71-8

Chapter 13
Schedule
For other uses, see Schedule (disambiguation).“Timetable”redirects here. For other uses, see Timetable(disambiguation).A schedule or a timetable, as a basic time-management
A volunteer adjusts the schedule board at Wikimania 2007. Theboard indicates the times and locations at which events will takeplace, thus assisting participants in deciding which events theycan attend.
tool, consists of a list of times at which possible tasks,events, or actions are intended to take place, or of asequence of events in the chronological order in which
A train schedule informs travelers of the trains going to variouslocations, and indicates the times of departure.
Hours of operation posted at a FEMA office following a disasterinform the public of when FEMA employees will be available toassist them.
such things are intended to take place. The process ofcreating a schedule - deciding how to order these tasksand how to commit resources between the variety of pos-
79

80 CHAPTER 13. SCHEDULE
A weekly work schedule indicates which employees of a businessare going to work at which times, to insure the effective distribu-tion of labor resources.
sible tasks - is called scheduling,*[1]*[2] and a person re-sponsible for making a particular schedule may be calleda scheduler. Making and following schedules is an an-cient human activity,*[3] though perhaps not a universalone.*[4] Some scenarios associate“this kind of planning”with learning extquotedbllife skills extquotedbl.*[5]*[6]In a wide variety of situations schedules are necessary, orat least useful.Schedules can usefully span both short periods, such asa daily or weekly schedule, and long-term planning withrespect to periods of several months or years.*[7] Theyare oftenmade using a calendar, where the personmakingthe schedule can note the dates and times at which variousevents are planned to occur. Schedules that do not setforth specific times for events to occur may instead listalgorithmically an expected order in which events eithercan or must take place.
13.1 Kinds of schedules
13.1.1 Publicly available schedules
Certain kinds of schedules reflect information that is gen-erally made available to the public, so that members ofthe public can plan certain activities around them. Thesemay include things like:
• Hours of operation of businesses and governmentoffices, which allow consumers of these services toknow when they can obtain them.
• Transportation schedules, such as airline timetables,
train schedules, bus schedules, and various publictransport timetables are published to allow com-muters to plan their travels. From the perspective ofthe organization responsible for making transporta-tion available, schedules must provide for the pos-sibility of schedule delay, a term in transport mod-eling which refers to a difference between a desiredtime of arrival or departure and the actual time. De-spite the use of“delay”, it can refer to a differencein either the early or late direction.
• In broadcast programming, the minute planning ofthe content of a radio or television broadcast chan-nel, the result of that activity is the generation of alist of shows to be broadcast at regular times or atspecific times, which is then distributed to the pub-lic so that the potential audience for the show willknow when it will be available to them.
• Concerts and sporting events are typically scheduledso that fans can plan to buy tickets and attend theevents.
13.1.2 Internal schedules
An internal schedule is a schedule that is only of impor-tance to the people who must directly abide by it. It hasbeen noted that extquotedbl[g]roups often begin with aschedule imposed from the outside, but effective groupsalso develop an internal schedule that sets goals for thecompletion of micro-tasks”.*[8] Unlike schedules forpublic events or publicly available amenities, there is noneed to go to the time and effort of publicizing the inter-nal schedule. To the contrary, an internal schedule maybe kept confidential as a matter of security or propriety.An example of an internal schedule is a workplace sched-ule, which lists the hours that specific employees are ex-pected to be in a workplace, ensure sufficient staffing atall times while in some instances avoiding overstaffing.A work schedule for a business that is open to the publicmust correspond to the hours of operation of the business,so that employees are available at times when customersare able to use the services of the business. One commonmethod of scheduling employees to ensure the availabilityof appropriate resources is a Gantt chart.*[9] Another ex-ample of an internal schedule is the class schedule of anindividual student, indicating what days and times theirclasses will be held.

13.2. REFERENCES 81
Project management scheduling
Main article: Schedule (project management)
A schedule may also involve the completion of a projectwith which the public has no interaction public prior toits completion. In project management, a formal sched-ule will often be created as an initial step in carrying outa specific project, such as the construction of a building,development of a product, or launch of a program. Es-tablishing a project management schedule involves listingmilestones, activities, and deliverables with intended startand finish dates, of which the scheduling of employeesmay be an element.*[10] A production process scheduleis used for the planning of the production or the opera-tion, while a resource schedule aids in the logistical plan-ning for sharing resources among several entities.In such cases, a schedule “is obtained by estimatingthe duration of each task and noting any dependenciesamongst those tasks”.*[2] Dependencies, in turn, aretasks that must be completed in order to make other taskspossible, such as renting a truck before loading materialson the truck (since nothing can be loaded until the truckis available for things to be loaded on).*[2] Schedulingof projects, therefore, requires the identification of all ofthe tasks necessary to complete the project, and the ear-liest time at which each task can be completed.*[2] Increating a schedule, a certain amount of time is usuallyset aside as a contingency against unforeseen days. Thistime is called scheduling variance,*[11] or float,*[12] andis a core concept for the critical path method.
In computing
Scheduling is important as an internal process incomputer science, wherein a schedule is a list of actionsfrom a set of transactions in databases, and scheduling isthe way various processes are assigned in computer mul-titasking and multiprocessing operating system design.This kind of scheduling is incorporated into the com-puter program, and the user may be completely unawareof what tasks are being carried out and when. Schedulingoperations and issues in computing may include:
• The operation of a network scheduler or packetscheduler, an arbiter program that manages themovement of certain pieces of information in thecomputer.
• Open-shop scheduling, Job Shop Scheduling, FlowShop Scheduling Problem, optimization problems incomputer science.
• I/O scheduling, the order in which I/O requests aresubmitted to a block device in operating systems.
• Job scheduler, an enterprise software application incharge of unattended background executions.
13.2 References[1] See Hojjat Adeli, Asim Karim, Construction Scheduling,
Cost Optimization and Management (2003), p. 54.
[2] Ofer Zwikael, John Smyrk, Project Management for theCreation of Organisational Value (2011), p. 196: “Theprocess is called scheduling, the output from which is atimetable of some form”.
[3] James, C. Renée (2014). Science Unshackled. JohnsHopkins University Press. p. 14. ISBN 1421415003.“This obsession with timekeeping isn't anything new,though. Ancient schedules revolved around annual, sea-sonal, monthly, or daily rhythms, and innumerable ex-amples of timekeeping structures and rock carvings fromthese early cultures still pepper our planet in famousplaces like Stonehenge in Wiltshire County, England, andin less famous places like the V-V Ranch Petroglyph sitenear Sedona, Arizona.”
[4] Compare some aspects of hunter-gatherer society: Lee,Richard B. (1998). “What hunters do for a living, or,how to make out on scarce resources”. In Gowdy, John.Limited Wants, Unlimited Means: A Reader On Hunter-Gatherer Economics And The Environment. Island Press.p. 52. ISBN 9781559635554. Retrieved 2014-09-09.“The hunters[' ...] schedule is uneven. it is not unusual fora man to hunt avidly for a week and then do no huntingat all for two or three weeks. Since hunting is an unpre-dictable business and subject to magical control, hunterssometimes experience a run of bad luck and stop hunt-ing for a month or longer. During these periods, visiting,entertaining, and especially dancing are the primary ac-tivities of men.”
[5] Kohl Coston, Phyllis (2013). Celebration of Success.Bloomington, Indiana: AuthorHouse. p. 26. ISBN9781491802311. Retrieved 2014-09-02. extquot-edbl[Allison] and Evan believe this kind of planningteaches responsibility and consideration for others as wellas helping the boys learn life skills such as time manage-ment, the importance of being a team member, and own-ership of calendar details.”

82 CHAPTER 13. SCHEDULE
[6] Karniol, Rachel (2010). Social Development as Prefer-ence Management: How Infants, Children, and ParentsGet What They Want from One Another. Cambridge Uni-versity Press. p. 129. ISBN 1139484001. extquot-edbl[P]arents have agendas that dictate how they prior-itize their own behavior. These agendas necessarily re-quire them to plan and set up schedules and childrenʼspreferences may play a subsidiary role in these schedules.”
[7] Dennis Coon, JohnMitterer, Psychology: Modules for Ac-tive Learning (2007), p. 7.
[8] Michael E. Gorman, Transforming Nature: Ethics, Inven-tion and Discovery (1998), p. 308.
[9] Gantt chart scheduling“Planning shift work” CEITONtechnologies
[10] Identifying milestones “Identify and Describe MILE-STONES and CONTROL POINTS” Phil Richardson
[11] Calin M. Popescu, Project Planning, Scheduling, and Con-trol in Construction (1995), p. 522.
[12] Project Management Institute. A Guide to the ProjectManagement Body of Knowledge (PMBOK Guide).Project Management Institute, 4 Original edition (De-cember 31, 2008).
13.3 See also• Calendaring software
• Employee scheduling software
• Notation for theoretic scheduling problems

13.4. TEXT AND IMAGE SOURCES, CONTRIBUTORS, AND LICENSES 83
13.4 Text and image sources, contributors, and licenses
13.4.1 Text• Operationsmanagement Source: http://en.wikipedia.org/wiki/Operations_management?oldid=626852495Contributors: Dominus, Aho-erstemeier, Ronz, Joy, Robbot, Bovlb, Piotrus, Ukexpat, S.K., Pedant, Remuel, Mdd, Gary, Saxifrage, Ryuujin23, Myleslong, Sen-gkang, Astronaut, SchuminWeb, Der Sporkmeister, Bornhj, YurikBot, Group6, SluggoOne, Noypi380, BirgitteSB, Dhollm, Sylvestre,Tony1, Closedmouth, SmackBot, Facius, Paxse, Deli nk, JDiPierro, JonHarder, Caravaca, Kuru, Acidburn24m, Maj IIM, Motorworld,Cathiehops, CRGreathouse, CmdrObot, Abqsteve, Lo2u, Bmunden, Infinitefate, Mvjs, Bozokhun, Nicransby, Spwalker, Nposs, Oneileri,FisherQueen, Flowanda, MartinBot, Smokizzy, Lucianoweb, NerdyNSK, Nemo bis, Pandaplodder, Jeff G., Soliloquial, Philip Trueman,TXiKiBoT, SueHay, Rei-bot, Kshatriyasandy, Jinky32, Julcia, Meters, SieBot, Mikemoral, Lawrencemj, WereSpielChequers, Gerakibot,Benbetts, Rakkerman, Ej uk, Yhkhoo, Caitlin Gilmore, ClueBot, Mild Bill Hiccup, Uncle Milty, Niceguyedc, Rballiet, Lbertolotti, Excirial,Three-quarter-ten, PixelBot, Arjayay, TheRedPenOfDoom, Iohannes Animosus, Erbelc, SchreiberBike, Dthomsen8, Libcub, LindaDavey,Addbot, Jafeluv, OEEGuru, Leszek Jańczuk, MrOllie, Download, Luckas-bot, Yobot, Fraggle81, AnomieBOT, Ciphers, Bendoly, Ru-binbot, Materialscientist, Zad68, The Banner, Opsman1952, Transpar3nt, Shadowjams, Eugene-elgato, Wireless Keyboard, Pinethicket,A8UDI, Mh007, Czmilner, Opsman 1957, Jpbatabc, Luisxx24, Chriss.2, Damienpower, EmausBot, Dewritech, GoingBatty, XGarretman,Daonguyen95, Robertlo9, Ghoughfner, 28bot, ClueBot NG, Cwmhiraeth, Kstouras, Danim, Anna, Olsenprof, Cdeverille, Wald, BG19bot,Tcody84, DPL bot, Ethraen, Pratyya Ghosh, Mogism, NartAbaza, Zwiebelspaetzle, Osterm38, Sean Scheiderer, Der-Wir-Ing, PindusJ,Chuluojun, Trackteur, Moorshed k, Procurementobservatory and Anonymous: 208
• Benchmarking Source: http://en.wikipedia.org/wiki/Benchmarking?oldid=626853159 Contributors: Kku, Ahoerstemeier, Ronz, Lit-tleDan, Mydogategodshat, Timwhit, Val42, Bevo, Kucing, Shantavira, Robbot, Romanm, David Edgar, LutzPrechelt, Craigwb, Zfr, SamHocevar, Imroy, Wrp103, Wk muriithi, Robert P. O'Shea, Reinyday, Maurreen, Rd232, Suruena, Lemmie, Commander Keane, Sjakkalle,Jeffrey Henning, Ademkader, Aapo Laitinen, Guthardt, FlaBot, RobertG, YurikBot, Hede2000, CambridgeBayWeather, NawlinWiki,Spike Wilbury, Irishguy, Albedo, Sergeidave, Encephalon, Graemeaustin, Amalthea, Crystallina, SmackBot, Cutter, David n m bond,Betacommand, Asclepius, Deli nk, Bazonka, Adpsimpson, Beatgr, JonHarder, Fuhghettaboutit, Kuru, GrandiJoos, Caim, JohnCub, M0z,16@r, Beetstra, Csbaker80, TastyPoutine, RichardF, Petrolmaps, Hu12, Veyklevar, Gmatht, Courcelles, Eactivist, CmdrObot, Wegge-Bot, Iliank, Omicronpersei8, Thijs!bot, N5iln, AndrewCarey, AntiVandalBot, Majorly, Gdo01, JAnDbot, MER-C, Xuelei, Ian mccarthy,Jjasi, Samjackson99, Indon, 28421u2232nfenfcenc, E-pen, Calltech, Kgeis, MartinBot, Axlq, Rettetast, Tgeairn, AlphaEta, Naniwako,Apqcmrkt, S, Signalhead, VolkovBot, Philip Trueman, TXiKiBoT, SueHay, Cbishop77, Simi8017, Qxz, Enzoanglia, WazzaMan, EricZbikowski, Coerrsm, Ericmelse, Lillingen, Rbonjo, SieBot, VVVBot, Pinkano, Brad Kenney, Very special, Malcia, Pm master, Mayalld,OSP Editor, ClueBot, Ottawahitech, Jusdafax, TheRedPenOfDoom, Rsmann1, Lucasartes, Darth Kule, J matula, SoxBot III, Rsmann2,Robolb, Addbot, PURCDirector MarkJamison, Mwolleswinkel, Cevalsi, MrOllie, RTFArt, Frehley, Yobot, Heisenbergthechemist, Mmxx,AnomieBOT, DirlBot, Gsmgm, Capricorn42, Eric Yurken, Mathonius, Ronaldo12345, Shadowjams, FrescoBot, MQL, Dinbandhu kmr,StaticVision, Xodó, Nuesoft, Black Swan01, BRUTE, Ricochet2, MastiBot, Elisina78, Billyb22, Дмитрий Сироткин, TheGrimReaperNS, Crysb, EmausBot, WikitanvirBot, Dcirovic, Dick.avis, Tswain1, ZéroBot, Huodaxia, ChuispastonBot, ClueBot NG, CPieras, Nootal-ghoubain, Widr, Helpful Pixie Bot, Deborah new, Liu.spain, PhnomPencil, Copter007, Ryanology, Snow Blizzard, Joelsmom, BattyBot,Suizei, EnzaiBot, Mpalan25, Rick diamond, Bpllc, Infor deepi, Manojbothejue, Jamesu5 wiki, MrColorado2014, VikrantY, Procuremen-tobservatory and Anonymous: 221
• Root cause analysis Source: http://en.wikipedia.org/wiki/Root_cause_analysis?oldid=622242517 Contributors: The Anome, Edward,Michael Hardy, Kku, Karada, Ronz, Firebird, RedWolf, DrBillCorcoran, Michael Devore, Luigi30, Discospinster, Rich Farmbrough,Prainog, Ygfperson, Hagerman, Free Bear, Velella, Mindmatrix, MONGO, Seraphimblade, Utuado, Bgwhite, Bachrach44, Astral,Crasshopper, NineInchNachos, BOT-Superzerocool, IceCreamAntisocial, RustySpear, Fedkad, Sdayal, Abualfad, SmackBot, Slashme,Harrias, Vina-iwbot, Peterlewis, RichardF, AbsolutDan, JohnCD, Johnlogic, CFMWiki1, Dchristle, DumbBOT, Thijs!bot, Mysterychop-per3027, Kedarg6500, Charlesbaldo, WhatamIdoing, Mannuthareja, Anoopkzm, Tbonnema, Mausy5043, Samwaltersdc, Bonadea, Inwind,VolkovBot, Kyle the bot, Philip Trueman, Jamelan, Marcusmccoy, Dalechadwick, Pm master, Phil Bridger, Jruderman, Drjamesaustin,Cranders7, Loren.wilton, EoGuy, Ancos, Bobanni, Excirial, Tnxman307, William Flower, XLinkBot, Ngocnb, Bugpower, PietroSavo,MystBot, Addbot, Deangano, Deichmans, Credible58, Ettrig, Luckas-bot, Yobot, AdjustShift, SassoBot, Erik9bot, Thequality, Antho-nyrenda, Pinethicket, Starazagora, Reaper Eternal, Obankston, Causeeffect, Slightsmile, TuHan-Bot, K6ka, Spikebailey666, FinalRapture,Staszek Lem, Orange Suede Sofa, ClueBot NG, JK August, Kasirbot, Raj Vimal Dev, Widr, Rjlatino, Kurtaotto, Softwrite, Karlomag-nus, Canderson1494, Giliev, Ryczypisk, ChrisGualtieri, Mogism, Jhudson1512, Br808, Tabletopper323, Tesla1231, Dealia29, Steambt21,FaerieChilde, James C. Breese, Botbqr, QualityBear and Anonymous: 142
• Ishikawa diagram Source: http://en.wikipedia.org/wiki/Ishikawa_diagram?oldid=627526037 Contributors: Ap, Ubiquity, MichaelHardy, Ronz, Darkwind, AugPi, Charles Matthews, Sbwoodside, Dysprosia, Robbot, Greudin, Unfree, Ancheta Wis, Moyogo, Craigwb,Utcursch, Babrahamse, Imroy, Gch42, Jaromil, Mdd, Alansohn, Arthena, Saxifrage, Infinoid, Hayvac, Tom W.M., Techieb0y, Mendaliv,Ligulem, Utuado, YurikBot, Wavelength, Filippof, Manop, Gaius Cornelius, Capi, Santtus, MSJapan, BOT-Superzerocool, Vinchem,Jsong123, Boogachamp, Closedmouth, GraemeL, DoriSmith, Eaefremov, Attilios, SmackBot, Slashme, DanielPenfield, EncycloPetey,Telempe, Ixuscane, Metacomet, Mfactor, Nbarth, Rhodesh, Kazov, Cybercobra, Abmac, JanCeuleers, DoomProof, Burt Harris, Karn-b,Alant, AbsolutDan, CmdrObot, Pgr94, Was a bee, ThreeVryl, Letranova, Thijs!bot, Wikid77, CarrotMan, 0x845FED, Kedarg6500, Vic-torAnyakin, Russeltarr, Wasell, Transcendence, Destynova, Davidjcmorris, Poeloq, CommonsDelinker, Exitcreative, Rlsheehan, Maduskis,Biglovinb, Egaal, Taffykins, Wcrosbie, Philip Trueman, SueHay, Martin451, PaulTanenbaum, Jsifoni, Weetjesman, Bharatmoorthy, Wee-man com, Noveltyghost, Findbecca, Allmightyduck, Phil Bridger, PHermans, Kumioko (renamed), Gav Newman, Pinkadelica, Denisarona,

84 CHAPTER 13. SCHEDULE
Chuckie B, Briansun, Rockfang, Excirial, -Midorihana-, Liberal Saudi, Vcornelius, BOTarate, SoxBot III, DumZiBoT, XLinkBot, Piet-roSavo, Addbot, AkhtaBot, -nothingman-, Tide rolls, Lightbot, Ettrig, Legobot, Luckas-bot, Yobot, Fraggle81, At Large, Gianvittorio,Wonderfl, DemocraticLuntz, Quorn3000, Chuckiesdad, LilHelpa, Xqbot, Jayarathina, GrouchoBot, N419BH, Shadowjams, Thequality,Ajivarges, Vrenator, Kkwright88, Minimac, Pestrickland, Mmm333k, WikitanvirBot, ZéroBot, ElationAviation, Ihardlythinkso, Logical-gregory, Pikesway, ClueBot NG, Faizdiro, SarahAlSaleh, Widr, Helpful Pixie Bot, KShiger, Robert Thyder, RscprinterBot, Andriy Ivkov,TPL57, Mrt3366, Khazar2, Mirthachab, Tentinator, Tymon.r and Anonymous: 212
• Performancemetric Source: http://en.wikipedia.org/wiki/Performance_metric?oldid=613794399 Contributors: Tvh2k, Jeff3000, Stansz,Rjwilmsi, D Monack, SmackBot, JenLouise, R'n'B, Largoplazo, Malik Shabazz, A.Ward, Shanzu, Pm master, BillGosset, Maanushah,CohesionBot, Snacks, Yobot, ChristyGris, Rodo82, Trinitresque, PindusJ and Anonymous: 18
• Failure mode and effects analysis Source: http://en.wikipedia.org/wiki/Failure_mode_and_effects_analysis?oldid=622852673 Contrib-utors: AxelBoldt, Rmhermen, SimonP, Michael Hardy, Rp, Liftarn, Ronz, CatherineMunro, Aimaz, PeterBrooks, Zarius, Greenrd, Lupo,Tom harrison, Everyking, Duncharris, Brockert, Quarl, Ukexpat, Rich Farmbrough, Gejigeji, El C, Adambro, Remuel, Prainog, Vor-texrealm, Cohesion, HasharBot, Spangineer, Marasmusine, David Haslam, Plrk, Prashanthns, Jivecat, Yamamoto Ichiro, Wragge, FlaBot,Rsavoie, RexNL, Knoma Tsujmai, Chris Capoccia, Darren.bowles, Epipelagic, Boogachamp, Bondegezou, Daleh, Bill, Attilios, SmackBot,LaurensvanLieshout, DanielPenfield, David n m bond, Chris the speller, Bluebot, Darth Panda, Emurphy42, KaiserbBot, Cybercobra, MarcT Smith, Derek R Bullamore, NickPenguin, RJBurkhart, DP2.5, Thopper, Peterlewis, Fig wright, Petter73, RichardF, Hu12, Twas Now,AbsolutDan, ChrisCork, Eastlaw, CmdrObot, Cydebot, Fnlayson, Jayen466, Kozuch, Thijs!bot, Miller17CU94, QuiteUnusual, JAnDbot,Harryzilber, Davewho2, Ncsupimaster, Vicsar, Kevinmon, JSSX, Mmoitzh, Pswift, Anaxial, RJBurkhart3, J.delanoy, Rlsheehan, Dfunk58,HALIGHT, Juliancolton, Taffykins, Inwind, VolkovBot, Philip Trueman, Kevconaghan, Allantonkin, SueHay, Wittym, HansMair, Ahh-boo, Bdm87, Wtubeguru, Jt310897, Heat fan1, Billinghurst, AlleborgoBot, Finnrind, Jmuenzing, SieBot, PeterFV, CWDURAND, Jsc83,Mongbei, Yintan, Flyer22, Jojalozzo, Pac72, Ctxppc, Onopearls, Zwiadowca21, Linforest, ClueBot, TerribleTadpole, PipepBot, PhilipSutton, Compellingelegance, Ashchori, LizardJr8, Trivialist, LyallDNZ, Excirial, Jdvernier, Vinodh.vinodh, SchreiberBike, Qwfp, DumZ-iBoT, Spitfire, Gnowor, Rich Baldwin, DragonFury, Gerhardvalentin, WikHead, Addbot, NielsJurgen, QAassistant, Olufowa, Ashton1983,9000store, Mm0therway, Foamfollower, Tide rolls, Quantumobserver, Syona, Yobot, Niklo sv, RandomAct, Citation bot, JohnnyB256,LilHelpa, MilesSmith1776, Capricorn42, Jü, Kobraton, RibotBOT, SassoBot, Imveracious, Broeze, FrescoBot, Plain Jane 2009, Lexas,Alexdfromald, Thequality, Pavanpatidar, Redrose64, Modalla, Er.yogesh3486, SchreyP, Fiducial, Watdenfoo, EmausBot, WikitanvirBot,Wikipelli, DonToto, J to2000, Mburdis, Tolly4bolly, Kerlevenez, Robin48gx, Bsaguy, ClueBot NG, Pawankashyap123, Abhi.analyst,ConconJondor, O.Koslowski, Helpful Pixie Bot, BG19bot, Kjwilson76, Maradi.mallikarjun, M2OS, Omerpeksen, BattyBot, New LightTaiwan, Khazar2, FMEA Expert, Whagen2, Jonahugh, Fantomian, OliJWalker, Marianne.jyrgenson, IrfanSha, Michaelsopa, Javegeorge,Uwnib, Tourhaan, Monkbot, Riskdoctor and Anonymous: 292
• Work breakdown structure Source: http://en.wikipedia.org/wiki/Work_breakdown_structure?oldid=626082268 Contributors:NathanBeach, Ap, SimonP, Madvenu, RTC, D, Michael Hardy, GABaker, Nixdorf, Kku, Ixfd64, Ahoerstemeier, Julesd, Mkoval,Mydogategodshat, Andrewman327, Mbarker, Art Carlson, Khalid hassani, Ukexpat, D6, RossPatterson, Lycurgus, 0.39, Maurreen,Mdd, Greenmind, Woohookitty, LizardWizard, Plrk, Graham87, Rjwilmsi, Yamamoto Ichiro, FlaBot, Winterstein, Ewlyahoocom,TheDJ, Salvatore Ingala, Chobot, NTBot, RadioFan, Semperf, Aeon1006, A bit iffy, SmackBot, Verne Equinox, Mogsie, SmartGuy Old,Hmains, Mastercko, Carl.bunderson, Bluebot, Luftikusss, Volphy, Addshore, Thopper, Markbassett, Alexthe5th, Garrybooker, Axxgreazz,Rwflammang, Neelix, Equendil, Naudefj, Agatlin, Thijs!bot, Mentifisto, Nthep, Vincehk, MartinBot, Davidjcmorris, R'n'B, Erkan Yilmaz,JCarlos, Belovedfreak, Bonadea, Sarahbei, Rafael Pi, VolkovBot, Monkey Bounce, Seb az86556, Lova Falk, AlleborgoBot, Ghaag,Jojalozzo, Universalcosmos, Pm master, Svick, ClueBot, Robomanx, Nuggetkiwi, Spandrawn, Limejello, DragonBot, ComputerGeezer,Dekisugi, Tojulius, Tevon, Viky m, Apparition11, SilvonenBot, Addbot, Technoparkcorp, Krenakarore, Legobot, Ptbotgourou, Fraggle81,Amirobot, Mauriciojxs, Ciphers, Rubinbot, Killiondude, ChristopheS, Materialscientist, Dr PDG, KrytoThenseld, Mario777Zelda,Fld300b, Nixón, MacMed, Reconsider the static, Michel192cm, Lotje, Dinamik-bot, Bluesguy, Thebluemanager, DARTH SIDIOUS 2,MI6, EmausBot, Jazzy Diva, Maria.staicovici, Fæ, Josve05a, Mm2720, Loflabr, TYelliot, Will Beback Auto, ClueBot NG, Satellizer,Frostbitcanadian, Helpful Pixie Bot, Steveswei, Mark Arsten, Njacobs1, Wannabemodel, Leonidas48, YFdyh-bot, Yuripobrasil, NovakNikola, Makecat-bot and Anonymous: 225
• Supply chain management Source: http://en.wikipedia.org/wiki/Supply_chain_management?oldid=627794592 Contributors: Chuq, Ed-ward, Michael Hardy, Earth, Kku, Ronz, Ghewgill, Technopilgrim, Mydogategodshat, Hashar, Juxo, Radiojon, Maximus Rex, Traroth,Shizhao, Topbanana, Phil Boswell, Chuunen Baka, Robbot, ZimZalaBim, Academic Challenger, SchmuckyTheCat, Alan Liefting, Jpo,Oberiko, Lueo, Obli, Everyking, Khalid hassani, Kberry, Beland, Sonett72, Discospinster, Rich Farmbrough, Rubicon, S.K., JoeSmack,Dataphile, MBisanz, Perfecto, P4r4d0x, Shenme, Maurreen, Mdd, Espoo, Storm Rider, Poweroid, Bootstoots, Wtmitchell, Red dwarf,Saxifrage, Lkinkade, OwenX, Woohookitty, Eleusis, Plek, Myleslong, Bellenion, Isnow, KKramer, Hughcharlesparker, Brendancon-way, Gimboid13, BD2412, Jason237, Josh Parris, Sonicace, Vary, Jehochman, Sleepyhead81, Latka, Chobot, Dispatx, Bgwhite, DellAdams, YurikBot, RobotE, Hede2000, Splash, Gaius Cornelius, RicDod, Rebel, Shaun F, Ezeu, TheSeer, Zzuuzz, Emana, RMehra,Arthur Rubin, GraemeL, LeonardoRob0t, Giant89, Garion96, Jasón, Trickstar, Marquez, SpLoT, Veinor, SmackBot, Tilmann, C.Fred,Facius, Verne Equinox, Eskimbot, Tiagowright, Nzd, Fluri, Cb9, Alriode, Addshore, Rgill, Soosed, Radagast83, Valenciano, Michael-Billington, Weregerbil, Roxis, DMacks, PatricTimmermans, Uday Chava, Kuru, Dejudicibus, Sawgrass, AB, Stupid Corn, Rahulkamath,[email protected], Deepak D'Souza, Peter Horn, Sifaka, Hu12, Walton One, Shemshak, Shahnavazkazi, Daniel5127, Jasrocks, Jame-spfarrell, Timrem, Markchockal, CmdrObot, Van helsing, Huva26, Epistemophiliac, Tim1988, Paul Accardo, Karenjc, Jac16888, Stil-webm, Fl, Corpx, Markperera, Costkiller, Jaxsonjo, Hollomis, N5iln, Marek69, Tomd1969, Rajat Bhargav, Grharshman, AntiVandalBot,Gioto, Luna Santin, Seaphoto, QuiteUnusual, IrishPete, Leobaz, Darklilac, Kmcfadden-balward, MikeLynch, Tldai, JAnDbot, Combat-Wombat42, Achalmeena, MER-C, Vijaymathur, 4dolo, SiobhanHansa, Magioladitis, VoABot II, Omnisentry, Estherschindler, What123,

13.4. TEXT AND IMAGE SOURCES, CONTRIBUTORS, AND LICENSES 85
Jborsum, Ehsani1, Chemical Engineer, Lridolfi, Michou81, Jonein, JaGa, WallyKlatch, Saganaki-, Stanistani, MartinBot, Bissinger, R'n'B,J.delanoy, Aerobe, Icseaturtles, Elogistics, Nemo bis, Thomas Larsen, Skier Dude, Mikeonatrike, Jamesontai, DASonnenfeld, TheNew-Phobia, Mofu, Richardean, Sheehsim, Timotab, Philip Trueman, Supernet, DragonLord, Fredsmith2, Jamelan, Billinghurst, Lamro, Bri-anga, Bsgoud, Mh 007, The Random Editor, StAnselm, Lawrencemj, Euryalus, Krawi, Triwbe, Tripathimanish, France3470, Kguske,Jojalozzo, Scmexpert, Oxymoron83, Steven Zhang, Sanya3, RedCoat1510, Tamojit.ghosh, Mghadge, ClueBot, Loggedon, The Thing ThatShould Not Be, Mattgirling, WriterListener, Vapmachado, Lockalsash, Brentnlisa, Boing! said Zebedee, Trivialist, Lbertolotti, Nkshastri,Sisterdetestai, Jusdafax, SupplyChainGuy, Frogmarshall, Ghirsch5454, Rwilli13, Haque simmi, Rom4in, Jthirdparty, Daveg0403, Dek-isugi, Thingg, Gyoengyi, ShawnAGaddy, Johnuniq, Prateeshb4u, XLinkBot, The TriZ, Badgernet, HarlandQPitt, Tweet76, Interorganisa-tional, Addbot, Roystonea, AHRMM, Wickie37, Jojhutton, Whliang8118, Kolichka, Jncraton, Mdl17, MrOllie, Download, Nikhiloswal,D.c.camero, Glane23, 5 albert square, Tide rolls, Pjw2072, Beren, Edithsl, Zfor, Legobot, Yobot, Fraggle81, Travis.a.buckingham,Grochim, Chewie103, Becky Sayles, Sttroy, KamikazeBot, BMPmanagement, Neofirebear, Tempodivalse, C431us, AnomieBOT, Demo-craticLuntz, Bendoly, Rubinbot, Eng maly, M athari anaraki, Jim1138, AdjustShift, Kingpin13, JohnXemec001, Crecy99, Materialscien-tist, Merlissimo, Lkt1126, Dkaupp, LilHelpa, Xqbot, Capricorn42, Nasnema, DSisyphBot, Supplychaineditor, Loungeflyer, Agricmarket-ing, Mattg82, Dear cobain, SRMurrayut, HelgaHere, January2009, SD5, Constructive editor, FrescoBot, Remotelysensed, Universityal-liance, Funkycora, Recognizance, Bms15, Igor101, Bhaskarbanerjee, San16 kaul, Hoo man, Maxbhenry, FoxBot, Salesforce, Ed Wright,the 69th, Vrenator, Ponmayil, Canuckian89, Insat2d, DARTH SIDIOUS 2, Mean as custard, Profrock, Nandssiib, Damienpower, Emaus-Bot, Racerx11, Suchit321, Pmmesp, Tommy2010, Cecody, ZéroBot, Fæ, Niamhtrner, Klaus Bells, Egomorales, Laneways, Inniverse,Rcsprinter123, Jinesh18omy, ,שלמה Kranix, Robertlo9, Donner60, Sindy832, RoyKok, Hazard-Bot, Sataqvi, Tracy Logistic, Ynotshine,TimUrry1, 28bot, Toplink, Petrb, ClueBot NG, Rich Smith, YaseminITÜ, Qarakesek, KimTran22, ChesterMarkel, Mahenan, Frietjes, Cn-tras, Widr, Mohd. Toukir Hamid, Pmresource, MerlIwBot, Helpful Pixie Bot, Zengqi321, BG19bot, Wikibee500, Mopla, Meysam.maleki,PhnomPencil, Compfreak7, Scmzone, Amol.rane, Meclee, Drt2252, Conifer, Gsks2011, Krishnapranav, APerson, Egomexico, Xujiayu,Markbenalla, Rozbeh80, Red185, Killban, Carbonaut, OrganizedGuy, Williamcuris, Knaashiv, Epicgenius, Wikikham, Tentinator, An-uarusli85, Yousifsuad, Amar.kumarmetha, Mrm7171, Jithendrak, Ginsuloft, Beskidek, Hdperez, AKS.9955, A2zpets, SantiLak, Evanjain,Somscand, Chuluojun, MariettaNixon24000, Ferozahmed0382, Bendemuth, Scminnovation, ARPR 2012, Vijaybisk, 90.mohamedashrafand Anonymous: 810
• Lean manufacturing Source: http://en.wikipedia.org/wiki/Lean_manufacturing?oldid=626089515 Contributors: Bryan Derksen, Heron,Jose Icaza, Edward, Paul A, Ronz, Mkoval, Mydogategodshat, Wik, Furrykef, Chris 73, Auric, Cutler, Jooler, Oberiko, Bobblewik,Ehusman, Drhaggis, Pjabbott, Ukexpat, MementoVivere, Now3d, Discospinster, Rich Farmbrough, Crinoidgirl, Lycurgus, Nickj, Reiny-day, Duk, Maurreen, Makawity, Mgraban, Mdd, Alansohn, Spangineer, Snowolf, Velella, BBird, Suruena, RJFJR, Forderud, Ironwolf,Jensgb, Marcelo1229, Woohookitty, Eleusis, RHaworth, SDC, Rjwilmsi, Sango123, Fish and karate, FlaBot, Fivemack, RexNL, Yorrose,Turidoth, Sharkface217, Manscher, WriterHound, Shaggyjacobs, Wavelength, RobotE, Garglebutt, Madkayaker, ChristianEdwardGru-ber, 0tto, Manop, Chris Murphy, Irishguy, Elipatwood, Closedmouth, Juanscott, Arthur Rubin, RedJ 17, Nelson50, SalvadorRodriguez,Stumps, That Guy, From That Show!, Mgc0wiki, Veinor, KnightRider, SmackBot, KnowledgeOfSelf, Royalguard11, Symphony Girl,Facius, DanielPenfield, Stifle, Hardyplants, Gilliam, Folajimi, Exprexxo, Nalyd357, Zsinj, Bill Levinson, Onorem, Whpq, Freek Verk-erk, Marc T Smith, Tvinson, NickPenguin, Jbergquist, CraigTheBrit, ALR, Kukini, The undertow, Eliyak, Rory096, Harryboyles, JzG,Kuru, Euchiasmus, Scientizzle, JorisvS, Gorgalore, Chris 42, A. Parrot, Beetstra, Eric76, Dicklyon, Mig77, Xsmith, Toddwill, CharlesT. Betz, Bisco, AbsolutDan, [email protected], Richard Stone, VGarner, CmdrObot, MessedRobot, Dgw, Mattj2, Mmoyer,Cydebot, Khatru2, Anthonyhcole, ST47, Cesare22, Kozuch, Toolingu, Billtubbs, Satori Son, PKT, Thijs!bot, Mysterychopper3027,Jheuristic, VSather, Deipnosophista, I already forgot, AntiVandalBot, Jbillh, Fabykot, Gioto, Seaphoto, Alleganywiki, Res2216firestar,JAnDbot, Kojotw, MER-C, Roleplayer, C Lazerick, Leanadvisors, Michel Baudin, DCwom, Paddyclyde, Vamaro, Heners, Balloonguy,Meyerkl, Paul Aster, Indon, Eataubm, DerHexer, WallyKlatch, Symington, TimidGuy, DavidChao, Jsnelson, Tashambrown, MartinBot,Scioperati, Mausy5043, Dwachter, Abhijitsathe, Chris9674, AntiSpamBot, BMaskell, Waveofthefuture, Cometstyles, Jc4p, Rob Cran-fill, S, Xnuala, Wikicomments, Mistercupcake, TreasuryTag, Butcherdwayne, Wcrosbie, Thaisk, Jpatram, Philip Trueman, Enigma2006,Meridies (usurped), Trashbag, Coehmigen, Meganlaw15, Inteloutside2, Jpeeling, Phmoreno, Thanatos666, Logan, Rmptls, Alexnicholls,Sundarram s, Alanmossman, Jmuenzing, SieBot, Accounting4Taste, Jessicahullman, Bobteapot, Pengyanan, The Parsnip!, LeadSong-Dog, Student1980, Flyer22, Xvani, Wilson44691, Marceladevivo, Llocklee, Pm master, Phil Bridger, MiNombreDeGuerra, LeanInsider,Pafi, S2000magician, Kjtobo, Geoff Plourde, Orangerider, Dwmann, Granite07, Philmat, Elnon, Cyclonerunner, Rredmond, ケゼペル, ClueBot, Agaribotti, PipepBot, The Thing That Should Not Be, Waldoemerson, Cp111, Mild Bill Hiccup, Joe.woelfle, Lbertolotti,Abeywickrama, Excirial, Bigalgot, Three-quarter-ten, Vladliv, Sun Creator, Jschmidt163, Ashwinmkoshy, SchreiberBike, Carriearchdale,Nitech2008, MelonBot, Nasanine, Vanished user uih38riiw4hjlsd, Bingobangobongoboo, XLinkBot, Stickee, Ideasintoaction, PietroSavo,Dthomsen8, SilvonenBot, Srobert01, Atlantic777, MetellusScipio, Thebestofall007, LindaDavey, Addbot, Mortense, Dyson1, Nkeating,Ravi Achanta, OEEGuru, Scientus, Cst17, MrOllie, Download, Mktadmin, Sonneborn, Tassedethe, Knguyeniii, Luckas-bot, Karthikv-inay, WikiDan61, Ptbotgourou, Fraggle81, Lssacademy, Yauhey, AnomieBOT, Njathind, Wikitawe, Piano non troppo, Materialscientist,Citation bot, Averynight, Capricorn42, Drilnoth, TheMaskedImprover, Customlean, J04n, Kienleong, Shadowjams, Nabiw1, Tim2wp,Louperibot, Iwjnichol, Citation bot 1, Nkaufman, Tintenfischlein, Pinethicket, Mh007, L.manufacturing, Jikybebna, Sudfa, Jerry4dos,Mike734, Beauvallet, Hans.ehm.infineon, Darp-a-parp, Hospiracr, Mean as custard, RjwilmsiBot, Jctchan, Chriss.2, Whatswiki, Sil-verpop81, Craig.larman, EmausBot, D1Doris, 2aprilboy, Wilhkar, Tommy2010, Wikipelli, Grabchuk Andrij, AvicBot, Turnbull.mgmt,Hypocaustic, Jonpatterns, Es20490446e, Kruckas, Oracleconnect, Erianna, Robertlo9, AndyTheGrump, VictorianMutant, Journalist pro-cesverb, Heimis90, ClueBot NG, Cwmhiraeth, Jmreinhart, Nasmtih, ScottSteiner, Urbancowboy1773, Helpful Pixie Bot, Deborah new,BG19bot, Justintbassett, Pine, Roberticus, Meysam.maleki, Mrunalshaldar, Leanfrontiers, ITZHAKBEN, MusikAnimal, Guy.shrimpton,Sixsigmageek, Silentriver1019, ChrisGualtieri, SantoshBot, WPworkerbee, Artichoke83, Stark.shai, Efumagalli, Jamesx12345, Bradcoe,069952497a, JohannesFB, Incognito668, Jianhui67, Kpdaa, Morgan Catha, Geoffmika, Sksarker.ie, WestcottJ, Ranjeetsinh Jadeja, Lewis

86 CHAPTER 13. SCHEDULE
boii 123, Burpedworm, Monkbot, Kavito1225, Sairp, Vikas Katyal, Kallary, Queenbwest, Mohammed Hamed Ahmed Soliman, Kcswilsonand Anonymous: 494
• Pareto chart Source: http://en.wikipedia.org/wiki/Pareto_chart?oldid=626170044Contributors: BlckKnght, Michael Hardy, Ixfd64, Seav,Ronz, AugPi, Craigwb, Noe, Imroy, Stillnotelf, Marudubshinki, Rjwilmsi, Srleffler, Wavelength, Laurentius, NawlinWiki, Irishguy, Smack-Bot,WoodenBooks, Gribeco, Verne Equinox, DanielPenfield, Stevegallery, Gilliam, Cootha, Metacomet, Nbarth, [email protected], A.B., DylanW, Elbac14, Ck lostsword, Feureau, Hu12, MdG, JoeBot, Tawkerbot2, AbsolutDan, Rupertb, Yaris678, Thijs!bot, PhilKnight,Takahashi J, NajaB, Taffykins, VolkovBot, MBlakley, TXiKiBoT, Nono le petit robot, SueHay, Rei-bot, Anonymous Dissident, Way-cool27, Tuyvan, Nubiatech, Lucasbfrbot, Pm master, Melcombe, Celique, Pscott22, ClueBot, PixelBot, XLinkBot, ParetoDaddy, Addbot,Norman21, T-turtle, Yobot, LilHelpa, Omnipaedista, LucienBOT, Boxplot, Kormie, EmausBot, ZéroBot, Nlskrg, Top Jim, ClueBot NG,AvocatoBot, Jimmy Dimmy, BeaumontTaz, Newtesteditor, Navya soveen, Kedzik, Velmurti and Anonymous: 77
• ABC analysis Source: http://en.wikipedia.org/wiki/ABC_analysis?oldid=627595926 Contributors: Silvonen, GregorB, Koavf, BOT-Superzerocool, Wpollard, Vermorel, Miquonranger03, Sadads, EVula, Gogo Dodo, Ameliorate!, Haakondahl, Saibo, Xeno, JaGa, Com-monsDelinker, Euku, TXiKiBoT, Fredsmith2, Masaqui, Shanzu, SieBot, VVVBot, Addbot, AkhtaBot, Yobot, Inauto, Bunnyhop11, Milkʼs Favorite Bot II, Ebalter, Rubinbot, GB fan, Xqbot, Iuri gavronski, Shiju.johns, AnotherOnymous, FrescoBot, D'ohBot, RedBot, Gryl-lida, Cutchnz, The Utahraptor, EmausBot, WikitanvirBot, K6ka, MaineYankee, Kiwi128, Devnaniji, ClueBot NG, Helpful Pixie Bot,Elle&Vire, Liu.spain, Bhavesh.s12, Vanished user lt94ma34le12, Soal was110, Mostafahtsm, Parswerk and Anonymous: 56
• Just in time (business) Source: http://en.wikipedia.org/wiki/Just_in_time_(business)?oldid=626487824 Contributors: JohnOwens,Michael Hardy, Willsmith, Pnm, Kku, Alfio, Ronz, Lupinoid, EdH, Mydogategodshat, Timwi, Juxo, Dysprosia, Robbot, AlainV, Yas,Chris 73, Rhombus, Matthew Stannard, Jpo, Oberiko, Ianhowlett, Golbez, Ehusman, Kberry, Quarl, Pat Berry, NegativeK, Fintor, Me-mentoVivere, Master Of Ninja, Mike Rosoft, A-giau, Rich Farmbrough, Michal Jurosz, Phreed, Alistair1978, Nabla, Smalljim, Maurreen,Mgraban, Mdd, Alansohn, Spangineer, SidP, Bobrayner, ArpadGabor, LoopZilla, MONGO, Rickjpelleg, GregorB, BlaiseFEgan, Jeffm-cneill, Wikifier, Sango123, FlaBot, Yorrose, Bgwhite, Roboto de Ajvol, Wavelength, RussBot, Aekolman, Bullzeye, Welsh, Irishguy,Saper, Tony1, Bota47, TransUtopian, E Wing, Alias Flood, Pavone, Nelson50, Martinku, Katieh5584, Meegs, GrinBot, Stumps, Yakudza,SmackBot, KnowledgeOfSelf, C.Fred, Facius, Mark Redden, Verne Equinox, Grey Shadow, Gilliam, Tiagowright, Afa86, Bluebot, Well-spring, Miquonranger03, MalafayaBot, DHN-bot, Sentinel75, Trekphiler, Bill Levinson, KaiserbBot, AMK152, Solarapex, Ixnayonthetim-may, Ricky@36, JethroElfman, CaptainVindaloo, Darkmaster2004, NipponBill, Naaman Brown, Tawkerbot2, Abhijitparab, Justin T.Sampson, AbsolutDan, ShelfSkewed, Cydebot, Karimarie, Lesqual, Inpixels, Chrislk02, Alaibot, Septagram, Alimond, BetacommandBot,Daniel, Marek69, Jbillh, Bdowell-acarnovale, Darklilac, Myanw, SiobhanHansa, Vamaro, Meyerkl, Thunderhead, Just James, WallyKlatch,Zip123, Giordanobruno, Mausy5043, J.delanoy, Svetovid, Maproom, Shoessss, Waveofthefuture, Sigmundur, Kolja21, TopGun, Timo-tab, Headphonos, Anna Lincoln, Thomasflee, SpecMode, The News Hound, AlleborgoBot, Nagy, SieBot, Unregistered.coward, Keilana,Flyer22, Brozozo, Pm master, Lightmouse, Animagi1981, Ssingh 2729, Oxford Steve, Denisarona, ClueBot, MonkeyMensch, Kl4m, Snig-brook, Drmies, Niceguyedc, Magnificascriptor, DragonBot, Drewster1829, Resoru, Eeekster, Cokeabout, Brett Leaford, XLinkBot, Nel-lieBly, MystBot, Heinous Krime 5, Arbore, Addbot, Fluffernutter, MrOllie, Glane23, Lightbot, Zorrobot, Yobot, Ptbotgourou, Galoubet,Flewis, Materialscientist, Xqbot, Capricorn42, GrouchoBot, Kienleong, Sp3, Thehelpfulbot, FrescoBot, Weetoddid, Nabiw1, MastiBot,Vrenator, Rentzepopoulos, Jeffrd10, RjwilmsiBot, DexDor, EmausBot, WikitanvirBot, Wilhkar, Wikipelli, Kami8844, Mathteacher69,Anupamgood, 03Indira, Ferrenrock, Shoto Wakizashi, Tolly4bolly, Erianna, GeorgeBarnick, ClueBot NG, Kerkchai.wat, Antiqueight,CavemanEconomist, Avergara2010, Deborah new, BG19bot, Liambroad97, Twatflops, BattyBot, Comatmebro, Khazar2, Awsomewriter,Cerabot, EdouardDeloin, Supamunki, 069952497a, DeviantSerpent, Ajavadiank, Tango303, Michellemaree, Atulmthakkar, Ginsuloft,Madi125, Tremblingleaf, Ashane.rodrigo, Whiteknight146, Bob7866, Moorhsed k and Anonymous: 336
• Schedule Source: http://en.wikipedia.org/wiki/Schedule?oldid=624788324 Contributors: Bryan Derksen, Patrick, Michael Hardy, Mko-val, Poor Yorick, Yelyos, Rchandra, Sword, Dbachmann, Interiot, Diego Moya, Joriki, GregorB, BD2412, Ewlyahoocom, Quuxplusone,Chrisvonsimson, Pinotgris, Chobot, Bgwhite, Peter Grey, Piet Delport, Epolk, RadioFan2 (usurped), Amwebb, MarkBrooks, PTSE,Thomas Blomberg, Sarah, True Pagan Warrior, Cybercobra, Stiles, Kristenq, Kuru, J 1982, Rythie, Kvng, Markbassett, CRGreathouse,Skittleys, Tortillovsky, Abernaki, Christoph Dürr, Dougher, Arsenikk, Magioladitis, Chris.hames, R'n'B, Mange01, Sgeureka, Lear s̓ Fool,Owain.wilson, Altermike, Grk1011, Phe-bot, Doctorfluffy, RW Marloe, Witchkraut, Brownturkey, ChrisHodgesUK, Addbot, ICSGlobal,WuBot, Amirobot, AnomieBOT, Bob Burkhardt, Anna Frodesiak, BenzolBot, Winterst, Mean as custard, ZéroBot, Bobannie, Nikos 1993,Jitklo, Shedjuldattaque77, МетаСкептик12, Tentinator, Vieque, U2fanboi, LiberumConsilium and Anonymous: 28
13.4.2 Images• File:ABC_class.jpg Source: http://upload.wikimedia.org/wikipedia/commons/a/ac/ABC_class.jpg License: CC-BY-SA-3.0 Contribu-tors: Own work Original artist: Masaqui
• File:Ambox_content.png Source: http://upload.wikimedia.org/wikipedia/en/f/f4/Ambox_content.png License: ? Contributors: ? Origi-nal artist: ?
• File:Benjamin-Franklin-U.S.-\protect\__xunadd_text_character:nN{\textdollar}{$}100-bill.jpg Source: http://upload.wikimedia.org/wikipedia/commons/9/95/Benjamin-Franklin-U.S.-%24100-bill.jpg License: Public domain Contributors: Wikimedia Comons [1]Original artist: U.S. Government
• File:Brain.png Source: http://upload.wikimedia.org/wikipedia/commons/7/73/Nicolas_P._Rougier%27s_rendering_of_the_human_brain.png License: GPL Contributors: http://www.loria.fr/~{}rougier Original artist: Nicolas Rougier

13.4. TEXT AND IMAGE SOURCES, CONTRIBUTORS, AND LICENSES 87
• File:Cause_and_effect_diagram_for_defect_XXX.svg Source: http://upload.wikimedia.org/wikipedia/commons/a/af/Cause_and_effect_diagram_for_defect_XXX.svg License: CC-BY-SA-3.0 Contributors: Own work Original artist: DanielPenfield
• File:Class_wort.jpg Source: http://upload.wikimedia.org/wikipedia/commons/e/e4/Class_wort.jpg License: Public domain Contributors:Transferred from it.wikipedia to Commons by Vanjagenije. Original artist: Kategoriko at Italian Wikipedia
• File:Commons-logo.svg Source: http://upload.wikimedia.org/wikipedia/en/4/4a/Commons-logo.svg License: ? Contributors: ? Originalartist: ?
• File:Departure_for_the_south_-_Nashville.jpg Source: http://upload.wikimedia.org/wikipedia/commons/3/34/Departure_for_the_south_-_Nashville.jpg License: CC-BY-SA-2.0 Contributors: departure for the south Original artist: Derek Baird from So California
• File:Edit-clear.svg Source: http://upload.wikimedia.org/wikipedia/en/f/f2/Edit-clear.svg License: ? Contributors: ? Original artist: ?• File:Eoq_inventory_0001.png Source: http://upload.wikimedia.org/wikipedia/commons/a/a2/Eoq_inventory_0001.png License: CC-BY-SA-3.0 Contributors: Own work Original artist: Joxemai
• File:FEMA_-_42163_-_Hours-days_of_operation_sign_at_the_Disaster_Recovery_Center.jpg Source: http://upload.wikimedia.org/wikipedia/commons/b/ba/FEMA_-_42163_-_Hours-days_of_operation_sign_at_the_Disaster_Recovery_Center.jpg License: Pub-lic domain Contributors: This image is from the FEMA Photo Library. Original artist: George Armstrong
• File:FlexiblesFertigungssystem.jpg Source: http://upload.wikimedia.org/wikipedia/commons/c/c8/FlexiblesFertigungssystem.jpg Li-cense: CC-BY-SA-3.0 Contributors: ? Original artist: ?
• File:Folder_Hexagonal_Icon.svg Source: http://upload.wikimedia.org/wikipedia/en/4/48/Folder_Hexagonal_Icon.svg License: ? Con-tributors: ? Original artist: ?
• File:Ishikawa_Fishbone_Diagram.svg Source: http://upload.wikimedia.org/wikipedia/commons/5/52/Ishikawa_Fishbone_Diagram.svg License: GFDL Contributors: Translated from en:File:Ursache_Wirkung_Diagramm_allgemein.svg Original artist: FabianLange atde.wikipedia
• File:Job_Shop_Ordonnancement.JPEG Source: http://upload.wikimedia.org/wikipedia/commons/3/31/Job_Shop_Ordonnancement.JPEG License: CC-BY-SA-2.5 Contributors: Transferred from fr.wikipedia; transferred to Commons by User:Bloody-libu usingCommonsHelper. Original artist: Original uploader was Younes2000 at fr.wikipedia
• File:Kanban_esp.png Source: http://upload.wikimedia.org/wikipedia/commons/b/bd/Kanban_esp.png License: CC-BY-SA-3.0-2.5-2.0-1.0 Contributors: Own work Original artist: Jmc2
• File:Kos_airport_queue.jpg Source: http://upload.wikimedia.org/wikipedia/commons/a/a2/Kos_airport_queue.jpg License: CC-BY-SA-2.0 Contributors: http://www.flickr.com/photos/22384617@N08/5036594493/sizes/o/in/photostream/ Original artist: horax zeigt hier
• File:LongBeachFord.jpg Source: http://upload.wikimedia.org/wikipedia/commons/6/68/LongBeachFord.jpg License: Public domainContributors: Los Angeles Times photographic archive, UCLA Library Original artist:
• File:MRP2.jpg Source: http://upload.wikimedia.org/wikipedia/commons/f/f4/MRP2.jpg License: CC-BY-SA-2.5 Contributors:“CIM:Principles of Computer Integrated Manufacturing”, Jean-Baptiste Waldner, John Wiley & Sons, 1992. Original artist: Jean-BaptisteWaldner
• File:Marshall’s_flax-mill,_Holbeck,_Leeds_-_interior_-_c.1800.jpg Source: http://upload.wikimedia.org/wikipedia/commons/6/6c/Marshall%27s_flax-mill%2C_Holbeck%2C_Leeds_-_interior_-_c.1800.jpg License: Public domain Contributors: From The Story ofLeeds by J. S. Fletcher, available from the Internet Archive Original artist: No picture credit in book
• File:NASA_NF_533_reporting_structure.jpg Source: http://upload.wikimedia.org/wikipedia/commons/6/63/NASA_NF_533_reporting_structure.jpg License: Public domain Contributors: NASA NPR 9501.2D Original artist: NASA
• File:OilCleanupAfterValdezSpill.jpg Source: http://upload.wikimedia.org/wikipedia/commons/5/52/OilCleanupAfterValdezSpill.jpgLicense: Public domain Contributors: ? Original artist: ?
• File:Panorama_clip3.jpg Source: http://upload.wikimedia.org/wikipedia/commons/f/f3/Panorama_clip3.jpg License: CC-BY-SA-3.0Contributors: ? Original artist: ?
• File:Pareto.PNG Source: http://upload.wikimedia.org/wikipedia/commons/8/8a/Pareto.PNG License: Public domain Contributors:Transferred from en.wikipedia; transferred to Commons by User:Common Good using CommonsHelper. Original artist: Original up-loader was Metacomet at en.wikipedia
• File:Pareto_chart_of_titanium_investment_casting_defects.svg Source: http://upload.wikimedia.org/wikipedia/commons/9/93/Pareto_chart_of_titanium_investment_casting_defects.svg License: CC-BY-SA-3.0 Contributors: Own work Original artist:DanielPenfield
• File:Portal-puzzle.svg Source: http://upload.wikimedia.org/wikipedia/en/f/fd/Portal-puzzle.svg License: ? Contributors: ? Originalartist: ?
• File:Question_book-new.svg Source: http://upload.wikimedia.org/wikipedia/en/9/99/Question_book-new.svg License: ? Contributors:? Original artist: ?
• File:ServidorParalelo.jpg Source: http://upload.wikimedia.org/wikipedia/commons/2/2b/ServidorParalelo.jpg License: CC-BY-SA-3.0Contributors: Own work Original artist: Daniellimahp

88 CHAPTER 13. SCHEDULE
• File:Simplex-method-3-dimensions.png Source: http://upload.wikimedia.org/wikipedia/commons/d/d4/Simplex-method-3-dimensions.png License: CC-BY-SA-3.0 Contributors: Created using gimp based on Image:Elongated_pentagonal_orthocupolarotunda.png. Original artist: User:Sdo
• File:Supply_and_demand_network_(en).png Source: http://upload.wikimedia.org/wikipedia/commons/2/29/Supply_and_demand_network_%28en%29.png License: CC-BY-SA-3.0-2.5-2.0-1.0 Contributors: Wieland, Andreas; Wallenburg, Carl Marcus (2011): Supply-Chain-Management in stürmischen Zeiten. Berlin, p. 8. Original artist: Andreas Wieland, Supply Chain Management Research
• File:Text_document_with_red_question_mark.svg Source: http://upload.wikimedia.org/wikipedia/commons/a/a4/Text_document_with_red_question_mark.svg License: Public domain Contributors: Created by bdesham with Inkscape; based upon Text-x-generic.svgfrom the Tango project. Original artist: Benjamin D. Esham (bdesham)
• File:Vsm-epa.gif Source: http://upload.wikimedia.org/wikipedia/commons/6/67/Vsm-epa.gif License: Public domain Contributors: USEPA Lean and Environment Toolkit Original artist:
• File:WBS.png Source: http://upload.wikimedia.org/wikipedia/en/0/0f/WBS.png License: ? Contributors: ? Original artist: ?• File:WbsConstruction.png Source: http://upload.wikimedia.org/wikipedia/en/e/e4/WbsConstruction.png License: ? Contributors: ?Original artist: ?
• File:WeeklySchedule.png Source: http://upload.wikimedia.org/wikipedia/commons/e/e8/WeeklySchedule.png License: Public domainContributors: ? Original artist: ?
• File:Wiki_letter_w.svg Source: http://upload.wikimedia.org/wikipedia/en/6/6c/Wiki_letter_w.svg License: ? Contributors: ? Originalartist: ?
• File:Wikimania2007_everythings_a_wiki.jpg Source: http://upload.wikimedia.org/wikipedia/commons/0/00/Wikimania2007_everythings_a_wiki.jpg License: CC-BY-SA-3.0 Contributors: Own work Original artist: Kat Walsh
• File:Wikisource-logo.svg Source: http://upload.wikimedia.org/wikipedia/commons/4/4c/Wikisource-logo.svg License: ? Contributors:Original artist: Nicholas Moreau
• File:Wiktionary-logo-en.svg Source: http://upload.wikimedia.org/wikipedia/commons/f/f8/Wiktionary-logo-en.svg License: Publicdomain Contributors: Vector version of Image:Wiktionary-logo-en.png. Original artist: Vectorized by Fvasconcellos (talk · contribs),based on original logo tossed together by Brion Vibber
• File:Work_Breakdown_Structure_of_Aircraft_System.jpg Source: http://upload.wikimedia.org/wikipedia/commons/e/eb/Work_Breakdown_Structure_of_Aircraft_System.jpg License: Public domain Contributors: Transferred from en.wikipedia Original artist: Orig-inal uploader was Mdd at en.wikipedia
• File:Xbar_chart_for_a_paired_xbar_and_R_chart.svg Source: http://upload.wikimedia.org/wikipedia/commons/9/93/Xbar_chart_for_a_paired_xbar_and_R_chart.svg License: CC-BY-SA-3.0 Contributors: Own work Original artist: DanielPenfield
13.4.3 Content license• Creative Commons Attribution-Share Alike 3.0