
Operations Conference and Exhibition -...
134
11 th WIOA NSW Water Industry Operations Conference and Exhibition 29 & 30 March 2017 - Exhibition Park in Canberra (EPIC) HOSTED BY SUPPORTED BY PRIME SPONSORS
Transcript of Operations Conference and Exhibition -...

11th WIOA NSW Water Industry Operations Conference and Exhibition29 & 30 March 2017 - Exhibition Park in Canberra (EPIC)
HOSTED BY SUPPORTED BY PRIME SPONSORS

11th Annual WIOA NSW Water Industry Operations Conference & Exhibition Page No. 1EPIC – Exhibition Park in Canberra, 29 & 30 March, 2017
SOLIDS HANDLING AND DISPOSAL AT LOWERMOLONGLO WATER QUALITY CONTROL CENTRE
Paper Presented by:
Shane Dyson & Eric Nielsen
Authors:
Shane Dyson, Water Industry Operator-Technical Officer,Eric Nielsen, Water Distribution Engineer/Water Industry Operator,
Icon Water
11th Annual WIOANSW Water Industry Operations Conference and Exhibition
EPIC – Exhibition Park in Canberra,29 & 30 March, 2017

11th Annual WIOA NSW Water Industry Operations Conference & Exhibition Page No. 2EPIC – Exhibition Park in Canberra, 29 & 30 March, 2017
SOLIDS HANDLING AND DISPOSAL AT LOWER MOLONGLOWATER QUALITY CONTROL CENTRE
Shane Dyson, Water Industry Operator – Technical Officer, Icon WaterEric Nielsen, Water Distribution Engineer/Water Industry Operator, Icon Water
ABSTRACT
The Lower Molonglo Water Quality Control Centre (LMWQCC) solids handling process isunique in that it processes solids using the only large Sewage Sludge Incinerators (SSI) inAustralia. The other unique fact being that the sterile by-product ash is disposed from site andsold as “Agri Ash” an agricultural soil conditioner.
Since its inception in 1978 the way this multi hearth furnace is operated has evolved to accountfor increased stringencies in the environmental emissions license, greater solids loads due topopulation increase and a secondary augmentation upgrade, as well as a result of themaintenance issues associated with running large pieces of plant continuously. Given itsinherently complicated and chaotic nature, operating this dynamic process is a task that requiresconsiderable training and operational experience as does understanding its interrelationshipwith the broader treatment process used at the LMWQCC.
To meet these changes, safeguard environmental obligations and strive toward operational andasset management best practice, Icon Water has committed funding for substantial projectworks being undertaken and planned for the future. The aim of this paper is to outline theunique solids handling and incineration process employed at LMWQCC, detail how operabilityhas changed and what projects are in place to renew this facility.
1.0 INTRODUCTION
The solids handling process employed at the LMWQCC is based on technology largelydeveloped and used in the United States of America and Europe which relies onincinerating solids a Multi Hearth Furnace (MHF). The system was designed in the early1970’s and installed from 1974 to 1978 as part of a joint venture developed for thedesign and construction of the larger LMWQCC WWTP. Incineration was seen asfavourable over other methods of solids handling due to a number of factors. While thelocation of LMWQCC meant that flows could be gravitated to the plant, it placedchallenges on removal of large quantities of solids from site and increased the demandon landfill sites on a growing city. Incineration allowed for solids to be reduced by athird with an average of 45 tonnes of dry solids per day reduced to 15 tonnes of ashmaterial. It also created an opportunity to reuse the ash from site and to be on-sold as alime enrichened agricultural soil condition under the name “Agri Ash”. Incineration alsooffered the option of energy recovery by heated scrubber filter water being returned tothe screened waste water flow which is extremely useful to the biological process duringthe cold Canberra winter months, where the difference between 15-17 degrees Celsiusresults in an almost exponential amount of biological activity.
1.1 Overview of Solids Handling Process
The below schematic in figure 1 outlines the solids handling process at LMWQCC. Asit can be seen typical treatment processes such as screening and grit collection areemployed, although unlike the majority of most WWTPs in Australia these products arenot disposed of at landfill sites.

11th Annual WIOA NSW Water Industry Operations Conference & Exhibition Page No. 3EPIC – Exhibition Park in Canberra, 29 & 30 March, 2017
They are instead incinerated with the other solid waste streams such as settled primarysolids and waste streams from the biological nutrient removal process.
Figure 1: Overview of LMWQCC solids handling process
1.2 Overview of LMWQCC MHF
The Screenings and Incineration building at LMWQCC houses the two identicalcombustion trains comprising of:
x 6.8 metre outside diameter - 9 hearth Incinerators, both 13m tall A multi-clone cyclone system for separation of heavy particulates A wet scrubber exhaust system with pre-cooler and impingement plates for
capture of fine particulates An Induced Draft fan and butterfly valve air dampers to maintain negative
pressure conditions within the furnace Multiple types of stack emission instrumentation Ash cooling and handling system 6 x auxiliary fuel oil burners in hearths 5, 6 and 7
Figure 2: Overview of MHF process

11th Annual WIOA NSW Water Industry Operations Conference & Exhibition Page No. 4EPIC – Exhibition Park in Canberra, 29 & 30 March, 2017
Combined thickened sludge and macerated screenings are pumped from the sludgeholding tank to one of three centrifuges. Dewatered sludge or “Cake” is fed via a seriesof conveyors to hearth 1 of the online furnace; centrate is piped to the buildings drainagesump and from there pumped back to the screened waste water flow at the head of theplant.
The MHF can be divided into three zones. The first zone, which consists of the upperhearths, is the drying zone. Most of the water is evaporated in the drying zone. Thesecond zone, generally consisting of the central hearths, is the combustion zone. In thiszone, the majority of combustible material is burned, and temperatures reach 760 - 1150degrees Celsius. The third zone includes the lowest hearths and is the cooling zonebefore ash is conveyed to storage bins.
2.0 OPERATION AND OPERABILITY OF LMWQCC MHF
The MHF is operated, monitored and controlled 24hrs a day 7 days a week by a WaterIndustry Operator in a control room in the same building as the furnace. Due to theconstantly changing characteristics of sludge feed to the furnace, operation could notalways be described as in a stable condition and can dive and climb rapidly. Thisrequires an immense amount of interaction and fine tuning to changing conditions. Forexample, the control room can’t be left without someone monitoring trends and alarmsbecause of the likely possibility of rapid changes. Typical operating conditions haveevolved substantially compared to those when it was designed and built some 40 yearsago, below is an outline of the main factors that affect operability.
Variability of feed characteristics: The furnace was originally designed to burnsludge at approximately 8 l/s at a sludge density of 12 - 17%. Typical operatingconditions today, 40 years on are 10-12 l/s at 30-40% solids. This change insludge density (being twice as dry as design) has resulted in the burn or onset ofcombustion occurring in the upper hearths, so instead of combustion taking placein hearth three, it occurs in hearth one or two. These values have changedbecause of population increase and a secondary augmentation to the process,adding an anoxic bioreactor which has resulted in tonnes of additional biomassin circulation. Additionally, density has been affected by competing economies –lime re-use V’s combustion costs. Lime was originally reclaimed and recycledthrough the incineration process, as at the time lime was more expensive thanfuel. More so feed density has increased because of more efficient dewateringequipment. During a shift, proportion of volatiles in the feed can changedramatically which effects overall burn and furnace stability, this is because of adaily flush of the plants inflow structure. Grit loadings on the furnace areconstant but due to poor grit classifier performance water can be transferredthrough to the furnace resulting in high emissions and temperature drops, allmaking the operation of the furnace more challenging.
Inherent Risks Associated with Incineration: As it can be expected with anyincineration process there are a multitude of interlocks associated with protectingthe asset and personal safety of employees. These range from pressure drops on afuel line, whether or not a scrubber water supply pump is running, fire detectionalarms and many more. These examples and many other interlocks some 24 intotal are all capable of tripping feed to the furnace causing an unstableenvironment to “burn out” the furnace.

11th Annual WIOA NSW Water Industry Operations Conference & Exhibition Page No. 5EPIC – Exhibition Park in Canberra, 29 & 30 March, 2017
Some safety measures are put in place from lessons learnt. For example on the10th of May 1995 the screenings and incineration building caught fire due toignition of combustible material in a foul air duct as a result all fibreglass in thefurnace hall was replaced with steel and more importantly a hot work permitsystem was put in place. Others can be general nuisance from alarms due tosmoke and ash which are not uncommon. This can be managed reasonablyduring normal conditions but when projects or major maintenance is occurringthe operators focus is not only devoted to furnace monitoring and shutdown butalso site management procedures. During an emergency all site work ceases andsite personnel muster, with operations acting as site safety wardens.
Sludge Inventory: As sludge from the primary settling tanks is the main feedsource for the furnace, whether or not the furnace is running bears greatinfluence over sludge inventory and variables such as Waste Activated Sludge(WAS) rate. Inversely sludge inventory is a main driver for sludge feed rates tothe furnace. Prolonged periods of high inventories must be combated with highfeed rates to the furnace sometimes running dual centrifuges at rates of 14 l/s;although this is achievable the furnace requires even closer monitoring of hearthtemperatures, oxygen demands and emission parameters as it operates in an evenmore meta-stable condition.
Design Legacies: The successful operation of the furnace depends on obtainingaccurate, reliable and most importantly truly representative combustiontemperatures. Gaining truly representative temperatures from the furnace is justabout impossible; the thermocouples on an IN hearth (where the gases flowOUT) give a representative reading. However, the thermocouples on an OUThearth (where the gases flow IN towards the shaft) read a combination of thetemperature of the flue gases coming up through the drop holes from the hearthbelow and flame radiation from the hearth below, especially in the combustionzone. A compounding issue is that each hearth contains only one thermocouple,reducing operator feedback and resulting in difficulty to pre-empt the “burn”moving from one hearth to another, which can cause flare ups as combustionrapidly moves to material not yet burnt.
The burners are as they were installed forty years ago and can be hard to start,which happens when they are generally needed the most, which is in a rapidtemperature loss situation. Furthermore, they cannot be controlled automaticallyor to set points as the thermocouples do not return reliable information aboutconductive heat transfer.
While not truly representative at least temperature is reported to the operator inreal time whereas time lag from the stack emission analysers can be between 5and 15 minutes. This essentially means that by the time emissions readings areout of specification relative to our atmospheric license parameters, theconditions within the furnace causing the issue have already occurred. This ismore often than not overcome by the intuitiveness of operators piecing togethermultiple other inputs and pre-empting changing conditions.
Ageing Infrastructure and Equipment: As the plant was built some forty yearsago with equipment generally replaced as necessary, ageing infrastructure beginsto present issues as equipment failures become more frequent resulting in morescheduled shutdowns.

11th Annual WIOA NSW Water Industry Operations Conference & Exhibition Page No. 6EPIC – Exhibition Park in Canberra, 29 & 30 March, 2017
While condition monitoring can predict certain equipment failures others areunpredictable, for example loss of a core in a multi core cable causing anInduced Draft Fan trip and a prolonged shut for fault finding. These planned orunplanned shutdowns result in situations where maintaining the atmosphericlicense is difficult. Also, the loss of production and increased sludge age in theprimary and secondary clarifiers puts other stresses on the rest of the plant.
2.1 Project Works to Overcome Operability Issues
A Computational Fluid Dynamics (CFD) model of the LMWQCC furnace has beendeveloped and significant amount of money through four packages of capital worksprojects is being invested by Icon Water in the LMWQCC solids handling process toimprove operability. The design phase of all of these projects are complete andconstruction already underway. An outline of these projects and how they will improveoperability and efficiency of the solids handling process is detailed below.
CFD modelling of the incineration process - Developing a CFD model of thefurnace enabled a platform to assess different upgrade options to the furnace.This provides confidence that the engineering changes will reduce emissions andenergy costs.
Stage #1 - Furnace and Exhaust System: This project will involve a broadequipment upgrade including the installation of new additional thermocouples,new dual fuel burners, new natural gas supply for these burners and a new dropchute to allow cake to be fed directly into hearth three moving the combustionzone down into hearths three and four as originally designed. A completeelectrical, instrumentation and control upgrade will also be undertaken involvinginstallation of new variable speed drives, motors, emissions analysers and an ashhandling system upgrade.
Stage #2 - Centrifuges, Polymer Dosing and Ventilation upgrade. This projectwill deliver three new centrifuges, new and modified centrifuge diverter chutesand a centrifuge hot swap changeover tank to enable centrifuges to be run indifferent modes simultaneously, building sump pump and instruments. Anupgraded polymer dosing system to handle projected plant flows into 2030 andupgrade to the Screening and Incineration ventilation system.
Stage #3 - Sludge Holding Tank and Ventilation upgrade. This project willdeliver a new Sludge Holding Tank which anticipates spreading the load of %solids in feed to create a more consistent sludge feed. This consistent feed shouldeliminate the peaks and troughs of temperatures throughout the shift. It alsoaddresses capacity and reliability improvements to the Solids handling portion ofthe plant, in particular with the existing lime sludge and recirculated sludgepumps and the flow of sludge from the proposed Sludge Holding Tank againtargeting projected plant flows to 2030 and management of sludge age.
Stage #4 - Screenings and Grit. This package will achieve increased capacity forthe inlet screens to handle increased inlet flows and morning flush solidsloadings to the design horizon of 2030. Increased screenings handling capacityand macerator performance to handle these projected flow increases. Enhancedsafety with double isolation around the inlet channel for operations andmaintenance activities.

11th Annual WIOA NSW Water Industry Operations Conference & Exhibition Page No. 7EPIC – Exhibition Park in Canberra, 29 & 30 March, 2017
Increased performance and stability in the grit dewatering process reducing themoisture content of material being fed into the furnace with subsequentemissions control benefits.
3.0 CONCLUSION
In summary the challenges presented to operators of the furnace at the LMWQCC are asa result of the type of process used to deal with solids at the plant as well as designlegacies, changes to feed characteristics, downstream process interactions and having tooperate infrastructure that has aged significantly. In its current state the organisationrelies heavily on their operators to ensure emissions license compliance and processmonitoring and control. Given the complexities and risks associated with operating thefurnace it is a testament to both operator and organisation that it is operated andmaintained to the standard that it is. Significant investment into the renewal of thesludge handling and incineration process and associated control technology will yieldmore efficient, safe and compliant operation of this facility.
4.0 ACKNOWLEDGEMENTS
Garry Charker – Major Plant Coordinator LMWQCC
Ian Bruce – Principal Process Engineer
Kyleigh Victory – Senior Process Engineer
Azhar Ashfaq – Sewerage TP Program Design Manager
5.0 REFERENCES
Darvodelsky,P, Bridle,T & Kellett, K, 2009, Lower Molonglo Furnaces Report, PollutionSolutions & Design PTY LTD
Boustead,N , 2004, CFD Model of Existing Incineration Process, Pollution Solutions & DesignPTY LTD
Lewis, F.M., 2004, Operating Strategies to Reduce Fuel Usage in Multiple Hearth and FluidBed Sludge Incinerators, WEF Bio-energy, Ohio
Schoermer, G, 2016, Engineering Project Execution Stage Proposal CX10677 Solids HandlingSystem Upgrade Package 1 – Furnace and Exhaust Systems
Stevens,M, Harris,D, 2016, Engineering Project Execution Stage Proposal CX10677-2 SolidsHandling System Upgrade Package 2 – Centrifuges, Polymer Dosing and Ventilation Upgrade
Stewart,B, 2016, Engineering Project Execution Stage Proposal CX10677-3 Solids HandlingSystem Upgrade Package 3 – Sludge Holding Tank & Ventilation
Harris,D Stewart,B, 2016, Engineering Project Execution Stage Proposal CX10677-4 SolidsHandling System Upgrade Package 4 – Screening and Grit
United States Environmental Protection Agency Centre for Environmental ResearchInformation, 1985, Municipal Wastewater Sludge Combustion Technology

11th Annual WIOA NSW Water Industry Operations Conference & Exhibition Page No. 8EPIC – Exhibition Park in Canberra, 29 & 30 March, 2017
BLOWER TECHNOLOGIES AND ENERGY EFFICIENCYOPPORTUNITIES
Paper Presented by:
Jeff Coyle
Author:
Jeff Coyle, National Design & Engineering Manager,
KAESER Compressors Australia Pty Ltd
11th Annual WIOANSW Water Industry Operations Conference and Exhibition
EPIC – Exhibition Park in Canberra,29 & 30 March, 2017

11th Annual WIOA NSW Water Industry Operations Conference & Exhibition Page No. 9EPIC – Exhibition Park in Canberra, 29 & 30 March, 2017
BLOWER TECHNOLOGIES AND ENERGY EFFICIENCYOPPORTUNITIES
Jeff Coyle, National Design & Engineering Manager, KAESER Compressors Australia.
ABSTRACT
The operating principles of today’s Wastewater Treatment Plants (WWTP) are permanentlyunder review against world best practice. Not only does the right treatment selection play a vitalrole, but the energy efficiency is also of utmost importance with energy consumption a majorcost factor during the lifetime cycle of installed equipment. It is no longer good enough topurchase individual components. Plant managers, design engineers and consultants must worktogether to find world best practice system solutions for today’s needs that flexibility cater forfuture requirements. With ever increasing energy costs, it is vital to understand the importanceof the working principles of compressed air equipment, and its influence on the overall plantperformance and lifecycle cost. Knowing that energy is the single highest operating cost in aWWTP, where blowers for aeration play a crucial role, knowledge of the different bloweroperating principles is important.
This paper outlines; the traditional approach to WWTP design and its associated efficiencyproblems, system solutions and an alternate design approach with key efficiency gains,guidance on how to calculate specific power for an individual unit and an entire system.
1.0 INTRODUCTION
The needs of commercial and municipal WWTP’s vary substantially in size andprojected period of planned operation cycle. It is not unusual that the designs formunicipal plants are based on projected populations and demand 10 to 30 years in thefuture. As project funding is available now and may not be there later on, systemengineers must build a system that will continue to serve the community’s growingneeds, in the most cost-effective, energy-efficient way possible. This is no simple task.Although the volume of air and pressure changes seasonally, each day, even hour tohour, the general practice is to design the plant’s capacity for the worst case, maximumfuture load, resulting in oversizing the blowers. However, oversized blowers do notoperate at their most efficient design point and spend as much as 90% of their operatingtime wasting costly energy.
2.0 DISCUSSION
2.1 Blower Operating Principle Efficiency
There are two main groups of compression principles; compression by dynamic anddisplacement design. An overview of the different operating designs available is shownin Figure 1. Standard for all applications with pressure requirements below 1000 mbar(g)
is roots type blowers - a robust design where the compression process happens in theassociated pipework. Displacement rotary blowers are of oil free design and so requireclearance between blower housing and both rotating rotors. This results in slip(backflow) of air, resulting in reduced efficiency.
Figure 2 illustrates the differences between external and internal compression. Withincreased pressure influence, system engineers do their best to combat wasted energy byselecting energy efficient equipment.

11th Annual WIOA NSW Water Industry Operations Conference & Exhibition Page No. 10EPIC – Exhibition Park in Canberra, 29 & 30 March, 2017
This has led to an increased focus on energy and has helped spur innovations in blowertechnology. It is important to make the right decision on the blower package and itsoperating principle.
Figure 1: The various designs on compression principles for gaseous mediums
External compression: Air is pushed out against thepressure losses in the process and therefore compressedin the piping between blower and application:
Internal compression: a certain pressure is alwaysbuilt up, independent of the process requirements:
Figure 2: Compression principle three lube rotary blowers with pre-inlet channeldesign and screw blower
Blower manufacturers are taking advantage of the increasing interest in energy savingsand offer low pressure equipment in the form of Roots Type Three Lobe Blowers, aswell as Screw Type Blowers. The question therefore is, ‘what blower type for whatapplication?’ The trade off on work required to compress a gas, using internal orexternal compression principle is shown in Figure 3: an energy advantage of internalcompression at precise adjustment of the screw geometry (green area), compared toadditional consumption at over-compression (top area).
4-1: suction process1-2b: polytropic compression screw profile1-2a: isochoric compression blower2-3: pushing out against pressure
Figure 3: Comparison on required work associated with blower using internaland external compression
Energy savings are achieved as long as the area enclosed by 4-1-2b-3-4 is less than thearea 4-1-2a-3-4. When choosing a blower with internal compression (helical rotors), theoperating point must exactly comply with the by design (geometrically) determinedoptimum design pressure or else this will lead to over-compression and unnecessaryenergy consumption.
Compress
Compr

11th Annual WIOA NSW Water Industry Operations Conference & Exhibition Page No. 11EPIC – Exhibition Park in Canberra, 29 & 30 March, 2017
The internal compression of screw blowers operating in idle load, is always connectedto higher power consumption. Pressure requirements of 500 mbar(g) and above should beconsidered as a base line where the use of screw blowers can be more efficient.
2.2 Plug & Play Solutions
The next step is “Wire-To-Air” efficiency. Here, the drive system, motor and starter, arecarefully matched, ensuring minimum mechanical and electrical losses. A basic tool forthe plant operation and system design engineer is simply total energy used to providethe specified flow and pressure and is expressed as a ratio of the power to the flow.While this metric is relatively new to the blower market, it is widely used for industrialcompressors and compressed air systems and is often referred to as specific power.
Whether using the term plug & play, wire-to-air or specific power, it is important todifferentiate between each individual piece of equipment’s efficiency and the overallsystem efficiency. The traditional system design approach for WWTP’s focuses onindividual blowers instead of considering how each piece will work with one another.However, even if the most energy efficient blowers are selected, if they are not properlyapplied and controlled, they will not yield the anticipated energy savings. This is whysystem specific power is crucial in system design.
2.3 Specific Power Explained
In its most basic form, specific power is a product of input kilowatt to the machinedivided by cubic metre per minute of air at standard conditions.
Specific Power = Input kWm3/min
While the equation is relatively simple, the process for calculating the value is not, nounified testing standard currently available to serve as a baseline for the calculations.There are a number of international standards manufacturers can use for determiningequipment efficiency, depending on the compression principle of the equipment. Mostcommonly used is ISO1217-2008 annex C for compressors, operating on displacementprinciple. Furthermore, these international standards don’t use a common baseline, orunified protocol for manufacturers to publish their performance on datasheets. Becausethe testing procedures aren’t standardised, end-users aren’t able to make true ‘apples-to-apples’ comparisons when considering different equipment to purchase.
As there is currently no testing standard and no published datasheets for blowers, theburden of making uniform calculations is on the user. To calculate specific power, it ispossible to measure the input kW at the package control panel and install a flow meterat the outlet of the package to determine flow. However, when specifying equipment,this is not possible as the equipment is not on hand.
Figure 4: Blower consumption (1), drive losses (2), and motor efficiency (3), allimpact specific power
This necessitates understanding how to calculate specific power for the entire packageand how each component will affect the overall efficiency.

11th Annual WIOA NSW Water Industry Operations Conference & Exhibition Page No. 12EPIC – Exhibition Park in Canberra, 29 & 30 March, 2017
Looking at the specific power of only a blower block from one manufacturer versus thatof an entire package from another will not give a true efficiency comparison. Tocalculate specific power, first the flow rate needs to be determined. For positivedisplacement blowers, this is a function of the blower’s displacement per revolution,blower slip, operating RPM, ambient conditions, and operating pressure.
V1 = Suction Volume nslip = Slip Speed (basis 100mbar) p1 = Inlet PressureV0 = Displacement/Revolution T1 = Inlet Temperature in Kelvin [K]n = Block Speed Δp = Pressure Differential
Next, we need the required blower power (1) which is a function of mechanical designand pressure differential. As ambient conditions are the same as normal conditions inthis example, Nm3/min and m3/min are equal. Now we have blower power (1), but thisis not what the user is paying for. The user is paying for electrical input at the motor (3).
To calculate motor input power (2), we need to determine the losses associated with thedrive. For most v-belt slide base designs where the motor can be moved to adjust centredistance and apply tension, we can expect a 5% loss. For more advanced tensionsystems, these losses can be reduced to 2-3%. Finally, we need the rated motorefficiency as given on the motor nameplate. Therefore, input kilowatt (3) is given by;
Blower Horsepower × ( 1 + Drive Efficiency) x 0.746Motor Efficiency
Once input power is calculated the specific power can be obtained.
Specific Power = Input kWm3/min
The lower the specific power value, the more efficient the blower is. Here we onlyevaluated the blower, belt drive, and motor, and we assumed ambient conditions to bethe same as standard conditions, which helped simplify the flow values and calculations.In reality, most blower systems include accessory components such as silencers, filters,and valves, which all present flow restrictions. Flow restrictions result in a greaterpressure differential across the blower and result in more power consumption. Inaddition, other package designs utilise cooling fans (shaft or separate), pumps forcooling, or some other electrical or mechanical device, which add to the powerrequirements of the machine. We also need to consider the different internal pressurebetween rotary lobe and screw blowers. For the best accuracy, input kilowatt should bemeasured at the input of the machine’s control panel. This takes into account all lossesassociated with the package as well as other relevant components. In addition to systemlosses and power consumers inside the package, power consumers in the control panelalso need to be considered. The sum of each of these gives the total package inputkilowatt consumption.
So far we have evaluated the elements of a blower package, power transmission, andaccessory power consumers to represent the performance of the physical package. For afixed speed machine, the specific performance of the machine is mostly constant(excluding the effects of ambient conditions). However, the vast majority of modernwastewater systems utilise variable frequency drives and the demand is split betweenthe units enabling handling flow and pressure requirement at constantly changing needs.

11th Annual WIOA NSW Water Industry Operations Conference & Exhibition Page No. 13EPIC – Exhibition Park in Canberra, 29 & 30 March, 2017
2.4 Variable Frequency Drive
Variable frequency drives (VFDs) allow equipment to operate at different speeds byadjusting the voltage and frequency delivered to the motor. This gives the machineversatility by varying blower performance to match system demand; however, thiscomes at a price. Most variable frequency drives have an efficiency rating just likemotors. The 97% VFD and 95% motor efficiency do not apply when the unit is runningat ¼ or ½ speed. At these reduced speeds, the efficiency is decreased; therefore, VFDusage should be limited to applications where the demand actually fluctuates.
Figure 5: Running at reduced capacity greatly impacts the energy efficiency of avariable frequency drive unit
VFD’s are beneficial in handling fluctuations in demand, especially when compared toblowing off excess air to atmosphere. What should be avoided, however, is using a VFDon an oversized machine.
Figure 6: Specific power consumption conventional speed control and blowermanufacturer speed control
2.5 Focus on the System
For a multiple blower system, the focus must be on system efficiency. It is not enoughto simply use the most efficient blowers. Well-designed blowers are a great start but tooperate as an efficient system, they must be applied correctly and controlled properly.Now that we have examined the efficiency for individual units, we can apply thoseconcepts to understanding the overall efficiency of the entire system and how sizing andselection affects the efficiency of the system. This means, system design engineersshould actively investigate the possibility of using rotary lobe- and screw- blowers inone system. Conventional aeration system designs include two large blowers. Thisneeds to be critically reviewed, knowing that WWTP’s are designed for the future, andthat for a long time blowers are underutilised and operating most of the time in partload. Also the impact of large variable speed blowers with an identically sized back upunit, are the main reason for the high energy consumption. In-house basic controlsystems are set to share the demand and the units cost more to purchase, their drivelosses must be factored into the unit’s efficiency.

11th Annual WIOA NSW Water Industry Operations Conference & Exhibition Page No. 14EPIC – Exhibition Park in Canberra, 29 & 30 March, 2017
Flexibility and energy efficiency can be achieved by an alternate method of systemdesign, so called system splitting. With system splitting, the maximum load is splitamong several cycling online/offline fixed speed machines to cover the large portion ofthe demand and a variable frequency drive (VFD) machine to cover the trim load. Thismethod of system design allows much more efficient control without sacrificing theability to meet the occasional periods of higher demand. Simulation programs can assistworking out the best combination on rotary lobe blowers, screw blower and which oneshould be driven by variable speed drive.
2.6 Adaptive Control
For system splitting, only one or two machines are VFD units. If there are two VFDs inthe system, only one runs at a time, with the second acting as back-up. The remainingblowers are fixed speed units. By limiting the number of VFD units in the system, initialinvestment costs are considerably lowered. The final component of system splitting iscontrols. Adding an adaptive master controller makes it possible to find the bestcombination of units to meet the current demand. Since the fixed speed units run onauto-dual control, the units can run idle for a defined period of time before shuttingdown. This gives the adaptive master controller enough time to observe the system’sresponse and signal the units to reload if needed. The VFD is sized no larger thanrequired, reducing the initial investment cost while covering the supply gaps that occurwhen the fixed speed machines are offline.
Adaptability: A master controller that learns the system and adapts to fluctuatingdemand can better respond and choose the most efficient unit combination to meet thedemand and improve pressure stability.Integration: Chances are you have a plant SCADA system for monitoring. Look for amaster controller with communications capabilities that will easily integrate into whatyou already have.Back-up: The right controller can help reduce maintenance costs, with some able torotate like-sized machines to equalise run times and spread out maintenance intervals.Some will also let you specify the units to run as back up only, ideal where you wantolder/less efficient units to only operate if a unit fails.
Table 2: Adaptive master controller; key criteria to consider when selecting acontroller
3.0 CONCLUSION
Wastewater treatment is a critical utility and the system must be designed to reliablymeet its highest expected load. When it comes to the blower system, bigger is notalways better. The best air system design is a holistic one that takes into account therange of demand, future growth, the entire system’s specific power, and optimisedenergy efficiency. System splitting, using rotary lobe and screw blowers, and using anadaptive control scheme can provide reliable supply without unnecessarily burdeningthe community with higher energy costs. Understanding system dynamics can saveinitial costs as well as maintenance and power costs for many years to come.
4.0 ACKNOWLEDGEMENTS
Co-authors; Albin Hess & Stephen Home, KAESER Compressors

11th Annual WIOA NSW Water Industry Operations Conference & Exhibition Page No. 15EPIC – Exhibition Park in Canberra, 29 & 30 March, 2017
UPGRADE OF CALALA WATER TREATMENT PLANTFILTER PNEUMATICS AND CONTROLLERS
Paper Presented by:
Rick Cowley & Norm Priestly
Authors:
Rick Cowley, Fitter and Machinist,Norm Priestly, Supervisor - Mechanical
Tamworth Regional Council
11th Annual WIOANSW Water Industry Operations Conference and Exhibition
EPIC – Exhibition Park in Canberra,29 & 30 March, 2017

11th Annual WIOA NSW Water Industry Operations Conference & Exhibition Page No. 16EPIC – Exhibition Park in Canberra, 29 & 30 March, 2017
UPGRADE OF CALALA WATER TREATMENT PLANT FILTERPNEUMATICS AND CONTROLLERS
Rick Cowley, Fitter and Machinist, Tamworth Regional CouncilNorm Priestly, Supervisor – Mechanical, Tamworth Regional Council
ABSTRACT
Tamworth Regional Council (TRC) Mechanical staff were engaged to assess the operation ofthe Calala Water Treatment filtration control system. The system was comprised of antiquated240v electric/air solenoids with pneumatic cylinders and was identified to not meet Council’sWork, Health and Safety (WH&S) requirements with a number of quality and operationalissues also raised. Based on the assessment a new system was successfully designed andinstalled by the TRC fitters.
1.0 INTRODUCTION
Following an assessment of the filtration system of the Calala Water Treatment Plant inTamworth NSW, the pneumatic cylinders and control solenoids were identified ashaving exceeded planned life expectancy and due for replacement or upgrade. Thisreport will be focused on the design and installation of new pneumatic cylinders andcontrols for the 12 filters at the water treatment plant and subsequent work involved torectify identified WH&S, water quality and operational issues.
Figure 1: Calala Water Treatment Plant
1.1 About Tamworth Water Supply and the Calala Water Treatment Plant
Located inland between Sydney and Brisbane, Tamworth has a population in excess of42,000 people. Tamworth sources its water from nearby state owned Chaffey dam, viathe Peel River, and the Dungowan Dam, owned and operated by TRC. During periods ofdrought, water can also be sourced from a series of 12 wells located at the junctionbetween the Peel River and Cockburn River.

11th Annual WIOA NSW Water Industry Operations Conference & Exhibition Page No. 17EPIC – Exhibition Park in Canberra, 29 & 30 March, 2017
The Calala Treatment Plant is the sole water treatment plant in Tamworth and is a fullyflow paced plant. Commissioned in 1980, the plant was technologically advanced for thetime and has benefited from ongoing upgrades in terms of automation and processcontrol. The plant remains unique due to its simultaneous treatment of water obtainedfrom two distinct sources. Each source has a distinctive raw water quality and requiresdiffering levels of treatment to meet minimum quality guidelines
The plant has a design capacity of 80 Megalitres (ML) per day and has been designed tomeet the requirements of the city until the year 2020. It has also been designed toaccommodate short term influxes of up to 96 ML per day due to water demand peaks.
1.2 About the Filters and Filter Control
The Calala Water Treatment Plant utilises 12 filters; eight designated for Peel supplyand four for Dungowan supply. Water arrives at the filters after being chemically treatedwith coagulants and pH adjusters and passing through the clarifier. Operatingspecifications of the filters at Calala Water Treatment are as follows:
Direct Filtration Rated capacity - 6.8 ML/day each Filter bed size - 6.4m x 4.2m Filter rate - 10.5 m/h Up wash rate - 0.3-0.6 m/min Surface cross flow wash rate - 737/L/min /m2 Filter media has dual layers of anthracite and sand and gravel to a maximum size
of 16mm.
Under normal operating conditions, the pneumatic cylinders operate the inlet and outletactuated valves, and are operated by an automated computer system. The outlet valve isusually closed and the inlet valve is open to allow a controlled flow of clarified water toenter the filters. Following treatment via the filters, the water flows through to achlorine contact tank and is treated with soda ash to balance pH and fluoride.Subsequent to chemical treatment, it is pumped to storage reservoirs, ready fordistribution to the customers.
Figure 2: The filters at Calala Water Treatment Plant

11th Annual WIOA NSW Water Industry Operations Conference & Exhibition Page No. 18EPIC – Exhibition Park in Canberra, 29 & 30 March, 2017
Backwashing of the filters is generally undertaken after 30 hours of active filtration, orcan be triggered by turbidity or head loss set-points. When the timeframe is reached, orthe set-points are triggered, an automated program implements a filter backwash cycleby alternating the position of the inlet/outlet valves. The filters are air and waterscoured, and backwash water is transported to an onsite storage pond. Once thebackwash cycle completes, the valves return to normal position and filtration resumes.
The treatment plant can continue to operate while up to three filters are in a backwashcycle, with a standard backwash taking 40 minutes. If a fourth filter initiates a backwashcycle, the plant is unable to process the incoming water and will shut down. To preventunnecessary shutdown and potential water hammer in raw water supply pipes, thereliability of the pneumatic cylinders and control solenoids is crucial to the effectiveoperation of the filter process and overall plant operation.
2.0 DISCUSSION
2.1 Issues Identified with Existing Infrastructure
There were a number of WH&S issues identified with the existing filter system. The useof 240v solenoids in a designated wet area created a potential electric shock risk tooperators, and deteriorating fibreglass cylinders could potentially burst under theoperating pressure of 600 Kpa. Pinch points were also identified on the air cylindersbetween the exposed cylinder shaft and manual override wheels.
Figure 3: The old cylinders (L), control panel (TR) & operator access (BR)
During the assessment a number of operational issues were also identified. Ageinginfrastructure was resulting in a higher frequency of call outs, at times requiring a partialor complete shutdown of the water treatment plant. The location of the oil lubricationsystems created the potential for contamination of the treated water, and access wasimpeded by poorly placed handrails and walkways. Air leaks were causing losses inefficiency, replacement parts were becoming difficult to source and operators wererequired to manually open and close the inlet/outlet valves when the automatic systemfailed to initiate.

11th Annual WIOA NSW Water Industry Operations Conference & Exhibition Page No. 19EPIC – Exhibition Park in Canberra, 29 & 30 March, 2017
2.2 System Re-Design and Repair Methodology
In order to rectify the issues identified in the assessment, a new system was designedand installed by TRC mechanical staff. The new cylinders were required to fit into theexisting hardware and 24v air/electric solenoids compatible with the computerisedcontrol system. Aluminium and stainless steel pneumatic cylinders were utilised fortheir smaller size and higher efficient, and the control cabinet and solenoids werereplaced.
The fitting began with the adaption of the new cylinders to the existing penstock valveframes and shafts. The shaft adapters were machined to a uniform size and new baseplates manufactured allowing for the installation of the cylinders. The old cabinets werethen removed and new control cabinets and solenoid manifold were assembled andinstalled. New airlines were installed between the cabinets and cylinders and power wasconnected.
Following initial testing, some minor alterations to the airline configuration were madeand a two week trial was commenced. No issues were raised during this trial and thesystem was cleared for full time operation. A further eleven sets of components wereordered and subsequently installed into the remaining filters over the following eightmonths.
The final aspect of the project was to improve operator safety when undertakingmaintenance, inspections and cleaning of the filters. Walkways to improve operatoraccess were manufactured and installed along with new handrails to ensure adequateprotection. The operators are now able to access the filters for cleaning and routineinspection in an easy and safe manner.
Upon completion of the filter upgrades, senior members of Council visited the waterplant. Management were impressed by ingenuity of the new system and commended thestaff involved on their workmanship, which was described as world class.
Figure 4: The new cylinders (L), control panel (TR) & operator access (BR)

11th Annual WIOA NSW Water Industry Operations Conference & Exhibition Page No. 20EPIC – Exhibition Park in Canberra, 29 & 30 March, 2017
3.0 CONCLUSION
Following the completing of the Calala Water Treatment Plant filter system upgrade,many improvements have been observed during the two years since project wascompleted. There has been a significant decrease in call outs, improving overall plantefficiency and reliability. Increased reliably of the filters has resulted in a higher waterquality and superior product for consumers. Maintenance requirements have also beenreduced and the new filter system will continue to be of benefit to the Calala WaterTreatment Plant for future water requirements.
4.0 ACKNOWLEDGEMENTS
Many thanks to all the fitters at the TRC Workshop who helped with this upgrade, andthe onsite assistance provided by the Calala Water Treatment Plant Operators.

11th Annual WIOA NSW Water Industry Operations Conference & Exhibition Page No. 21EPIC – Exhibition Park in Canberra, 29 & 30 March, 2017
JOURNEY TO DISCOVERING DAFF LIMITATIONS &IDENTIFYING PROCESS IMPROVEMENTS AT
GOOGONG WTP
Paper Presented by:
Alice Liao
Author:
Alice Liao, Process Engineer,
Icon Water
11th Annual WIOANSW Water Industry Operations Conference and Exhibition
EPIC – Exhibition Park in Canberra,29 & 30 March, 2017

11th Annual WIOA NSW Water Industry Operations Conference & Exhibition Page No. 22EPIC – Exhibition Park in Canberra, 29 & 30 March, 2017
JOURNEY TO DISCOVERING DAFF LIMITATIONS &IDENTIFYING PROCESS IMPROVEMENTS AT GOOGONG WTP
Alice Liao, Process Engineer, Icon Water
ABSTRACT
Icon Water has two water treatment plants that produce safe and clean drinking water toCanberra: Stromlo Water Treatment Plant (SWTP) and Googong Water Treatment Plant(GWTP). Following the Canberra bushfires in 2003, both plants were upgraded simultaneouslyin 2004. Due to issues outside the control of the project team, process commissioning andproving of the GWTP Stage 2 Upgrade Project was limited when the plant was prematurelyparked.
GWTP is nominally operated for two months per year when SWTP is shut-down for annualmaintenance. Intermittent operation has limited the opportunities of operational exposure forOperations, Engineering and Automation staff, to continue to learn and troubleshoot the Stage 2process. In conjunction with poor water quality and tighter filtered water turbidity requirements,this resulted in the plant not being able to meet its design capacity over the past few years.
In 2015, Icon Water prioritised recommissioning and optimisation of GWTP Stage 2. In orderto address ongoing reliability issues, additional resources and an extended GWTP run, allowedtroubleshooting and changes to be made.
This paper discusses the results of recommissioning and process optimisation carried out duringthe 2015 and 2016 runs. Further improvements identified for future upgrades that will promoteDAFF functionality and improve the reliability of the treatment plant are also discussed.
One conclusion that can be drawn from this work is that when upgrading treatmentinfrastructure that is only operated intermittently, sufficient time should be allowed forcommissioning and proving under a range of expected conditions prior to shut down forextended periods. Equipment reliability issues combined with the passage of time reduce theavailable pool of staff with working knowledge of the upgraded asset. This increases thechallenge of producing drinking water that meets the design performance specification for bothflowrate and turbidity targets.
1.0 INTRODUCTION
Googong Water Treatment Plant is only turned on for Operate-To-Maintain purposeswhen Stromlo Water Treatment is offline for planned annual maintenance, or rareemergency shutdowns, or to supplement SWTP during periods of peak demand.
There are two parallel process stages at GWTP which can be operated independently ortogether. Stage 1 is the original plant which comprises of clarification and directfiltration to achieve pathogen and sediment removal of up to 180ML/d. Stage 2 of theprocess was added on to the existing plant in 2004 to increase plant capacity by 90ML/d (total of 270ML/d) which comprises the use of DAFF for pathogen and sedimentremoval.

11th Annual WIOA NSW Water Industry Operations Conference & Exhibition Page No. 23EPIC – Exhibition Park in Canberra, 29 & 30 March, 2017
Figure 1: Googong WTP process flow diagram
The Stage 2 Dissolved Air Flotation Filtration (DAFF) plant has 6 filters with a designcapacity of 90ML/d (15ML/d per filter). In theory, DAFF should have the ability to startup and produce water more quickly than Stage 1 where it relies on filling up largevolume of clarifiers first. However, due to unresolved residual project commissioningdefects, infrequent operations of the plant, and deteriorating raw water quality andtightening of filtered water turbidity requirements in ADWG, GWTP Stage 2 has notbeing able to meet its design capacity. Over the past 5 tears, there has been limitedsuccess in operating DAFF due to seasonal run duration which has restricted theavailable time focus dedicated to the DAFF unit.
In 2015 and 2016, the process engineering team and operations team allowed additionalresources to focus on re-commissioning of DAFF. The goal was to determine the actualcapacity and condition of the system whilst addressing any automation sequence errorsand equipment capabilities, and identify optimisation opportunities.
2.0 DISCUSSION
2.1 2015 DAFF Process Recommissioning
In 2015, GWTP operated for 9 weeks (Aug-Oct). During this time, several limitationswere found that restricted DAFF’s production capability and reliability. From a capacityviewpoint, each filter was only able to produce up to 20MLD with short run hours,<17hours, compared to the plant design of 25 hours. From a quality perspective, the 95th
percentile filtered water turbidity of 0.12NTU was achieved, compared to the ACTHealth requirement of 95% percentile filtered water turbidity of 0.2NTU.
Production capacity was limited due to rapidly changing flows causing premature andterminal turbidity breakthrough (reducing filter run times) due to DAFF control logicissues. Faults with the backwash sequence reduced capacity further. From a reliabilityviewpoint, a faulty pneumatic actuator on the Stage 2 DAFF inlet valve wouldunexpectedly close, causing unexpected flow changes and overflows.
During the 2015 run, the process engineer made the following automationimprovements:Changes to backwash queuing logicThe global backwash queue was implemented to allow the stage 1 and stage 2 filters toqueue for backwashes together, without one filter type knocking other filters out of thequeue. This change improved the operation of the system because it provided a logicalqueuing system for the filters which did not exist within the initial code.
11th Annual WIOA NSW Water Industry Operations Conference & Exhibition Page No. 24EPIC – Exhibition Park in Canberra, 29 & 30 March, 2017
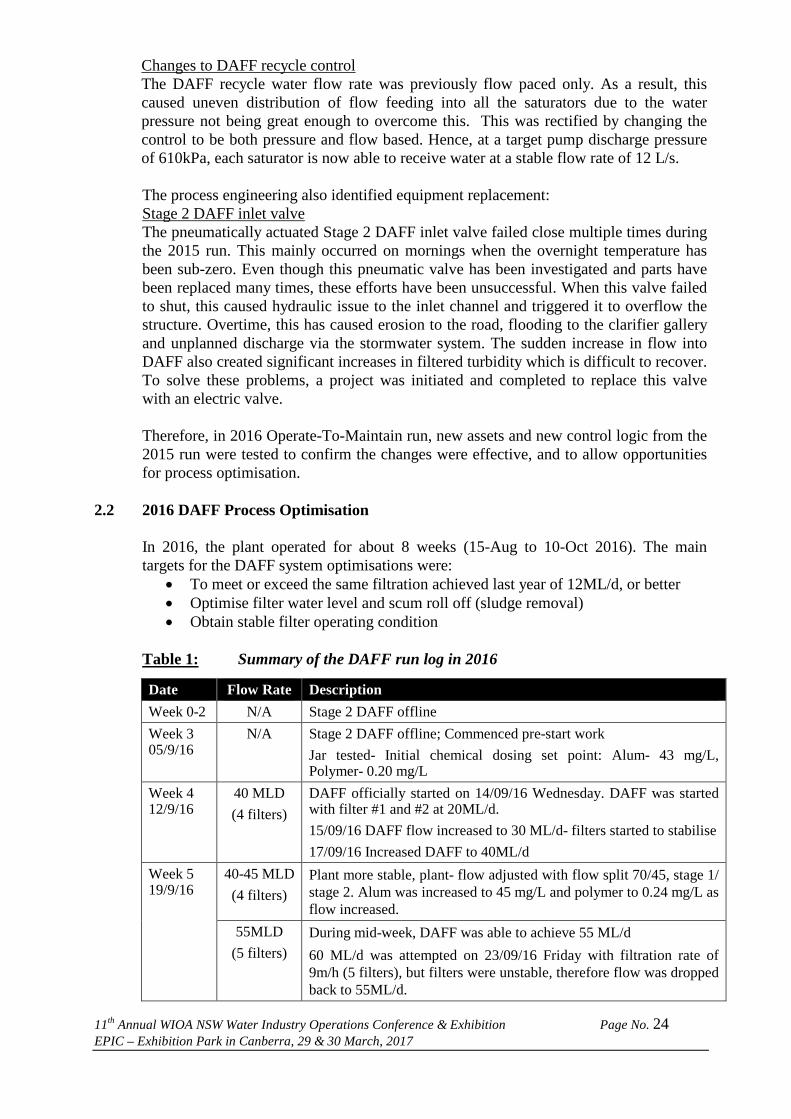
Changes to DAFF recycle controlThe DAFF recycle water flow rate was previously flow paced only. As a result, thiscaused uneven distribution of flow feeding into all the saturators due to the waterpressure not being great enough to overcome this. This was rectified by changing thecontrol to be both pressure and flow based. Hence, at a target pump discharge pressureof 610kPa, each saturator is now able to receive water at a stable flow rate of 12 L/s.
The process engineering also identified equipment replacement:Stage 2 DAFF inlet valveThe pneumatically actuated Stage 2 DAFF inlet valve failed close multiple times duringthe 2015 run. This mainly occurred on mornings when the overnight temperature hasbeen sub-zero. Even though this pneumatic valve has been investigated and parts havebeen replaced many times, these efforts have been unsuccessful. When this valve failedto shut, this caused hydraulic issue to the inlet channel and triggered it to overflow thestructure. Overtime, this has caused erosion to the road, flooding to the clarifier galleryand unplanned discharge via the stormwater system. The sudden increase in flow intoDAFF also created significant increases in filtered turbidity which is difficult to recover.To solve these problems, a project was initiated and completed to replace this valvewith an electric valve.
Therefore, in 2016 Operate-To-Maintain run, new assets and new control logic from the2015 run were tested to confirm the changes were effective, and to allow opportunitiesfor process optimisation.
2.2 2016 DAFF Process Optimisation
In 2016, the plant operated for about 8 weeks (15-Aug to 10-Oct 2016). The maintargets for the DAFF system optimisations were:
To meet or exceed the same filtration achieved last year of 12ML/d, or better Optimise filter water level and scum roll off (sludge removal) Obtain stable filter operating condition
Table 1: Summary of the DAFF run log in 2016
Date Flow Rate Description
Week 0-2 N/A Stage 2 DAFF offline
Week 305/9/16
N/A Stage 2 DAFF offline; Commenced pre-start work
Jar tested- Initial chemical dosing set point: Alum- 43 mg/L,Polymer- 0.20 mg/L
Week 412/9/16
40 MLD
(4 filters)
DAFF officially started on 14/09/16 Wednesday. DAFF was startedwith filter #1 and #2 at 20ML/d.
15/09/16 DAFF flow increased to 30 ML/d- filters started to stabilise
17/09/16 Increased DAFF to 40ML/d
Week 519/9/16
40-45 MLD
(4 filters)
Plant more stable, plant- flow adjusted with flow split 70/45, stage 1/stage 2. Alum was increased to 45 mg/L and polymer to 0.24 mg/L asflow increased.
55MLD
(5 filters)
During mid-week, DAFF was able to achieve 55 ML/d
60 ML/d was attempted on 23/09/16 Friday with filtration rate of9m/h (5 filters), but filters were unstable, therefore flow was droppedback to 55ML/d.

11th Annual WIOA NSW Water Industry Operations Conference & Exhibition Page No. 25EPIC – Exhibition Park in Canberra, 29 & 30 March, 2017
Date Flow Rate Description
Week 626/9/16
60MLD
(6 filters)
As flow rate increases, the run hours are significantly shorter (10-13hour) and turbidity increases with every scum roll off. DAFF #3 and#6 had the most stable performance, whereas DAFF #5 struggled.Polymer dosing was also increased to 0.25mg/L
Week 7
03/10/16
45-52 MLD
(5 filters)
Process optimisation and trial: Sat 8/10/16Operators to attempt produce 13ML/d per filter (4 filters online/ 1standby); DAFF #5 offline (52 ML/d to DAFF, 63ML/d to DF)Operator feedback: DAFF seem happy with the high poly dose &recycle rate of 13.5L/s at 13ML/d.
Process optimisation and trial: Sun 9/10/16Operators to attempt produce 14ML/d per filter (4 filters online/ 1standby); DAFF #5 offline (56 ML/d to DAFF)
Process not stable- still require further adjustment to the system;saturation vessel pressure will need to be increased to 500kpa ormore, high polymer dosing at 0.35mg/L and alum dosing at 47-50mg/L. Scum roll off time also adjusted.
During the 2016 run, progress was made in the following areas identified during the2015 run:DAFF Recycle ControlDuring initial start-up, the coding for DAFF recycle water flow that was implemented in2015 was not enabled due to programming issue. Therefore start-up took longer thanexpected as there was not enough water pressure to distribute flow to the saturators.Once the coding was enabled, the system proved to be running smoothly and maintainedset flow of 12.5L/s into each saturator. With the pump discharging pressuremaintenance at 610kPa, the reduction of erratic flow has minimised shocks to the filters.
Backwash Queuing LogicThe global backwash queue implemented in 2015 was still in place and worked for thefirst 5 weeks of operation. Nevertheless, as more filters were brought online, the codingwas still not fully correctly encrypted and there were programmable logic issues whichfaulted the backwash sequence on several occasions for several hours, limiting thenumber of filters available, and reducing plant production. This is still a work inprogress with the Automation team. To ensure continuous run of the filters, it isrecommended that the functional specification be revisited and the sequence possiblyreprogrammed.
Valve ReplacementConversion from pneumatic to electric actuation has addressed the root cause of thevalve failure (freezing from morning sub-zero temperatures). This has had a majorimprovement to the DAFF flow stabilisation allowing the DAFF to run moreconsistently than during the 2015 run.
Additional Equipment ReplacementApart from above changes, some additional assets were replaced and renewed since the2015 run. These include DAFF no.4, no.5 and no.6 flocculators VSDs, Stage 2 polymerand alum dosing pump VSDs, and DAFF recycle pump VSDs. With some of these assetrenewals, the DAFF system has improved its reliability. However, the commissioning ofthese new assets was not visible and communicated through to the relevantstakeholders. Therefore this was also a bottleneck in the process of starting up DAFFand a lesson learned experience.

11th Annual WIOA NSW Water Industry Operations Conference & Exhibition Page No. 26EPIC – Exhibition Park in Canberra, 29 & 30 March, 2017
2.3 DAF Filter Optimisation
DAFF had similar performance to 2015 run in 2016. However the filter ran morecontinuously and longer (18-21 hours) due to the changes implemented in 2015 and theadditional operational resources delegated to this process. On average, 95th percentileturbidity in September and October 2016 was 0.12 NTU and 0.11 NTU respectively.The graph below is a snapshot of the DAFF performance in September, 2016. It alsoshows how filters are performing from turbidity changes when filtration rate increases.
Figure 2: DAFF filter- turbidity performance in September 2016
Additionally, during the final weeks of operation, we were able to achieve 13MLD outof each filter and attempted 14MLD per filter for a short period of time. It was identifiedthat in order to filter at higher filtration rate, the saturator vessel pressure will need to beincreased to >500kpa. Nevertheless, due to the sensitivity of the vessels, much attention,resources and time is required to implement this.
Scum RemovalA scum roll off frequency trial was conducted in 2016 is the. In 2015, minor attentionwas made to the scum roll off hence caused some mud-balling issue to the filters.

11th Annual WIOA NSW Water Industry Operations Conference & Exhibition Page No. 27EPIC – Exhibition Park in Canberra, 29 & 30 March, 2017
Therefore, during 2016 run, observations were made on the scum blanket on a timedinterval and frequency is adjusted to ensure one-quarter to one-third of the blanketslengths is left on the surface of the filter. As a result, the filter ripening period reducedand mud-balling is minimised.
Figure 3: DAFF scum blanket roll-off
DAFF DiffusersDAFF diffuser adjustments were also a new fine tuning process done in 2016. Aspreadsheet was used to monitor and keep track of the changes that were made tosixteen diffusers per filter. This also recorded the saturator vessel pressure and recyclewater ratio so the effects of the changes from the diffusers were captured. Minorchanges were made to the diffusers as we were in an observation phase. However, it wasnoted that the diffusers position tend to change due to vibration of the infrastructure. Abaseline data on the diffusers has now been collected. Therefore, for future operations, itis in our team’s intent to investigate the relationship between saturator vessel pressures,recycle ratio and diffuser position on our DAFF system, and optimise the process toreach its design capacity.
3.0 CONCLUSION
A significant amount of progress was made in 2016. With the level of repair andproblems identified in 2015, DAFF was able to consistently produce 13ML/d per filtergiving a total flow rate of 78ML/d (87% of design capacity). Even though there are stilla number of issues to be addressed, there is now a baseline filter performance and arecord of asset information. With continuous improvement, monitoring and necessaryupgrades, the filters will be less prone to failure and will continue to improve the overallperformance and reliability of the DAFF system.
It also highlights that when upgrading treatment infrastructure that is only operatedintermittently, sufficient time should be allowed for commissioning and proving under arange of expected conditions prior to shut-down for extended periods. Equipmentreliability issues combined with the passage of time reduce the available pool of staffwith working knowledge of the upgraded asset. This increases the challenge ofproducing drinking water that meets the design performance specification for bothflowrate and turbidity targets.
4.0 ACKNOWLEDGEMENTS
I would like to acknowledge all the members of the operations team for theircontributions and commitment. Valuable information was greatly appreciated fromSarah McLaren who summarised the 2015 re-commissioning process and addressedsome of the physical limitations. Special thanks to all my mentors, Ian Bruce, LauraFuhrman and Kimberly Lawson and manager, Cameron Patrick, who have been verysupportive in this learning process.

11th Annual WIOA NSW Water Industry Operations Conference & Exhibition Page No. 28EPIC – Exhibition Park in Canberra, 29 & 30 March, 2017
ICE PIGGING – A TARGETED APPROACH TO MAINSCLEANING
Paper Presented by:
Alan Duke
Author:
Alan Duke, Project Engineer,
Suez Water & Treatment Solutions
11th Annual WIOANSW Water Industry Operations Conference and Exhibition
EPIC – Exhibition Park in Canberra,29 & 30 March, 2017

11th Annual WIOA NSW Water Industry Operations Conference & Exhibition Page No. 29EPIC – Exhibition Park in Canberra, 29 & 30 March, 2017
ICE PIGGING – A TARGETED APPROACH TO MAINSCLEANING
Alan Duke, Project Engineer, Suez Water & Treatment Solutions
ABSTRACT
Ice Pigging is a relatively new technology in which an ice-slurry is inserted into a main as aliquid and once pressurised, creates a solid ‘pig’ which conforms to the inside of the mainoffering an alternative to conventional swabbing without the need to do any majormodifications to the main. This property allows ice pigging to be utilised for differentapplications including cleaning transfer and trunk mains with a high sediment content as well ascleaning reticulation networks which experience high numbers of customer complaints due todiscoloured water.
Two such projects conducted for Bega Valley Shire Council and Bathurst Regional Councildemonstrate the ability for ice pigging to be tailored for the water provider’s specific need. In2015, Suez Water & Treatment Solutions undertook a project with Bega Valley Shire Councilto remove the sediment build up in their transfer and trunk mains which provide water to thetownships of Bega and Tathra. In 2016, Suez undertook a project with Bathurst RegionalCouncil to remove sediment in their reticulation network which had a high number ofdiscoloured water complaints.
1.0 INTRODUCTION
Ice Pigging is the process of inserting an ice slurry into the water main and oncepressure is applied the slurry turns into a solid pig allowing for the main to then becleaned. Once the main is isolated, the required quantity of ice slurry is then pumpedinto the main via a hydrant or similar fitting, the water displaced by the ice exits themain via a discharge hydrant as to not exert any excess pressure on the main.
Once the insertion is complete, both insertion and discharge fittings are closed and theupstream valve is fully opened, this compresses the ice to form a solid pig and providesthe pressure which will propel the ice through the main. The discharge fitting is thenopened to discharge the water allowing for the pig to move through the main.
The ice pig progresses through the main as a solid plug, but its properties as a two-phasematerial allow it to flow around solid obstacles such as partially closed valve gates,bends, constrictions and even tubercles on cast iron mains. A further benefit of this two-phase characteristic is that the pig does not “bulldoze” the sediment in front of it; ratherit lifts the sediment from the pipe walls and carries it in suspension between the iceparticles.
At the discharge fitting, pressure; flow rate; conductivity; temperature and turbidity aremonitored and recorded in real time. As the front of the pig nears the outlet, an increasein conductivity is seen, caused by the salt added to the ice during manufacture; thisindicates that the arrival of the pig is imminent. Once discolouration of the dischargewater is observed the flow is diverted into waste tankers, ensuring all of the sedimentand salt within the main body of the pig is collected and disposed of safely.

11th Annual WIOA NSW Water Industry Operations Conference & Exhibition Page No. 30EPIC – Exhibition Park in Canberra, 29 & 30 March, 2017
Finally, a short period of flushing is undertaken to ensure that all traces of salt andsediment have been removed. The main is returned to the customer when water qualityindicators recorded exceed those taken pre-clean.
As the ice pigging process relies on both a shear force exerted from the ice crystals aswell as turbulence of the flow of water before and after the pig, it provides theeffectiveness of conventional foam pigging without the need for any excavation workssaving on preparation time and operation time.
2.0 DISCUSSION
Bega Valley Shire Council and Bathurst Regional Council both experiencediscolouration of their water network due to sediment build-up which leads to customerdissatisfaction and complaints. In order to reduce the occurrence of these events as wellas improve customer satisfaction throughout the network, Bega Valley Shire Counciland Bathurst Regional Council both undertook an extensive mains cleaning programutilising the ice pigging technology. Due to Bega Valley Shire Council using anunfiltered source for their water supply, ice pigging was utilised on the large transfermains to remove the build-up of sediment in these pipes, as Bathurst Regional Councilalready utilise a water filtration plant, ice pigging was undertaken on the reticulationwater network to remove any sediment build-up.
To measure the effectiveness of the ice pigging operations, turbidity readings were takenbefore and after the operation as well as sediment samples collected and analysed fortotal suspended solids (TSS), these samples were then compared with the flow rate togive an estimate on how much sediment was removed in the process.
2.1 Bathurst Regional Council Reticulation Network
Bathurst Regional Council provides water services to some 42 000 residents in CentralWestern New South Wales, due to sediment build-up in the reticulation pipesdiscoloured water is often experienced from changes to flow conditions in thereticulation network. Ice pigging was chosen as the method to remove this sediment as itwas able to utilise the existing reticulation network valve and hydrant configuration.The sediment is mostly manganese.
In March & April 2016, Suez conducted the ice pigging project for Bathurst RegionalCouncil to remove the sediment build up, this project consisted of 74 individualoperations on reticulation pipes totalling 50.82km of mains less than 250mm indiameter with an average distance of 687m cleaned per operation.
In order to complete the ice pigging operation, the section of main to be cleaned wasrequired to be fully shut down for the ice pig to remain solid throughout the operation.This relied heavily on the experience and expertise of the network operators. Once theshutdown was achieved, an ice slurry consisting of approximately 10-15% of the mainvolume was inserted and pushed along using the existing pressure of the network.
To measure the success of the operation, the turbidity was recorded before the ice wasinserted and before the main was returned to service. The average turbidity decrease forall operations was 59.95 NTU with a maximum decrease of 538.8 NTU. A graphshowing the turbidity results for all operations is shown below.

11th Annual WIOA NSW Water Industry Operations Conference & Exhibition Page No. 31EPIC – Exhibition Park in Canberra, 29 & 30 March, 2017
Figure 1: Graph showing turbidity readings for all operations
As can be seen from the above graph, there was a significant decrease in turbidity in themajority of operations, which lead to a reduction of discoloured water eventsexperienced by customers and an improvement in overall customer satisfaction.
In addition to the turbidity readings, samples were taken at constant intervals throughoutsome operations, these were then analysed for their suspended sediment content. Thesediment concentration was then matched to the recorded flow rate to gain an estimateof the total sediment, on average, 7 kg per kilometre was removed during the project.This has resulted in a significant reduction in customer complaints.
2.2 Bega Valley Shire Council Transfer Mains
Bega Valley Shire Council located on New South Wales South Coast provides water tosome 33 000 residents, due to no sediment filtration of the source water, discolouredwater is often experienced throughout the network, particularly in the townships of Begaand Tathra. Four trunk mains ranging from 250mm to 500mm in diameter and a borewater main were chosen to be cleaned using ice pigging as it allowed for the easyinsertion and discharge of ice without any major modifications to the mains.
In November & December of 2015, Suez conducted 17 ice pigging operations whichconcentrated on mains including the 450mm trunk main from the pumping station to theSouth Bega reservoir, the 500mm trunk main from South Bega to the Belmore Stbalance tank, the 300mm trunk main from South Bega to the Tathra reservoir as well asthe 250mm trunk main from South Bega to Belmore St.
As with the Bathurst Regional Council project, turbidity and sediment data wereobtained for the operations. On average the turbidity readings were 5.7 NTU lower forall operations with a maximum improvement of 26 NTU. As multiple flushing pointswere used for the mains over 450mm in diameter, accurate flow rates could not beobtained to gain a total amount of sediment removed, however the average sedimentconcentration for these operations was 35.83 g/L.

11th Annual WIOA NSW Water Industry Operations Conference & Exhibition Page No. 32EPIC – Exhibition Park in Canberra, 29 & 30 March, 2017
For operations where accurate flow data could be obtained, the total suspended solidsconcentration and overall sediment content was able to be calculated. For the SouthBega to Tathra 300mm main, the average sediment concentration was 6.60 g/L with atotal estimate of 62.96 g/m of sediment removed, in comparison, the 375mm bore line,the average sediment concentration was 60.92 g/L with an overall estimate of 1069.57kgof sediment removed throughout the operation with a concentration of 1944.69 g/m. Thetable below shows the sediment data for all operations:
Table 1: Ice Pigging operation sediment data
Location Operation
Number
Diameter
(mm)
Length
(m)
Mass of
Sediment
(kg)
Concentration
(g/m)
South Bega-
Belmore
1 500 1004 135.17 134.63
South Bega-
Belmore
2 500 809 427.89 528.91
South Bega-
Belmore
3 500 624 476.59 763.77
High St-South Bega 4 450 1420 642.27 452.30
High St-South Bega 5 450 1350 933.38 691.11
South Bega-Tathra 6 300 2280 25.31 111.03
South Bega-Tathra 7 300 2336 34.31 147.01
South Bega-Tathra 8 300 2642 9.97 37.77
South Bega-Tathra 9 300 2433 50.63 20.81
South Bega-Tathra 10 300 3007 116.82 38.85
South Bega-Tathra 11 300 1203 77.95 22.29
Bega Borefield 12 375 550 1069.57 1944.69
Tathra 13 250 900 20.06 22.29
South Bega-
Belmore
14 250 1400 52.39 37.42
Belmore-West 15 250 1400 48.28 34.48
South Bega-
Belmore
16 250 1440 18.17 12.62
Belmore-West 17 250 700 97.75 139.64
Please note for operations 1-5, an estimated flow rate of 80 L/s was used as multiple points were used in
the discharge process. This only gives an indication of the sediment in the mains.
3.0 CONCLUSION
The two projects detailed above for Bathurst Regional Council and Bega Valley ShireCouncil demonstrate the adaptability of ice pigging as a method of mains cleaning. Incases where customer complaints are experienced due to discolouration in thereticulation system, the two-phase property of an ice slurry allow for the easy insertionand removal of the ice pig which utilises the existing network configuration. An averageimprovement in turbidity of 59.95 NTU after the ice pigging operation has reduced thenumber of discolouration events and customer complaints in the Bathurst RegionalCouncil reticulation system improving customer satisfaction and council reputation.

11th Annual WIOA NSW Water Industry Operations Conference & Exhibition Page No. 33EPIC – Exhibition Park in Canberra, 29 & 30 March, 2017
In water systems where source water with a high sediment content is utilised such as inthe Bega Valley Shire Council network, sediment build up in the larger trunk mains canbecome dislodged during high flow events causing discoloured water to enter into thereticulation network leading to a large number of customer complaints. Ice pigging caneffectively remove this sediment build up from the network without the need for anymajor modifications to the network, the high quantity of sediment removed throughoutthe project demonstrates ice pigging’s effectiveness for these larger diameter pipes.
Since the removal of this sediment the number of discoloured water events hasdecreased causing a significant reduction in customer complaints which allows for thevaluable time operations staff spend to rectify these events to be freed up for othernetwork maintenance.
4.0 ACKNOWLEDGEMENTS
I would like to thank the following people:
Damien Tom and the operations team at Bathurst Regional Council for theirknowledge and experience to contribute to a successful and fun project.
Keith Hyatt and the network team at Bega Valley Shire Council for their valuableexpertise to contribute to a successful and fun project.
Ed Petts and the operations team at Suez for helping deliver the ice piggingservices.
Graeme Berriman for the encouragement and support to write this paper.

11th Annual WIOA NSW Water Industry Operations Conference & Exhibition Page No. 34EPIC – Exhibition Park in Canberra, 29 & 30 March, 2017
COMMISSIONING OF ACTIVATED SLUDGE PLANTAT THE DUBBO SEWAGE TREATMENT PLANT
Paper Presented by:
Prakashbabu Radhakrishnan
Author:
Prakashbabu Radhakrishnan, Water Treatment Supervisor,
Dubbo Regional Council
11th Annual WIOANSW Water Industry Operations Conference and Exhibition
EPIC – Exhibition Park in Canberra,29 & 30 March, 2017

11th Annual WIOA NSW Water Industry Operations Conference & Exhibition Page No. 35EPIC – Exhibition Park in Canberra, 29 & 30 March, 2017
COMMISSIONING OF ACTIVATED SLUDGE PLANT AT THEDUBBO SEWAGE TREATMENT PLANT
Prakashbabu Radhakrishnan, Water Treatment Supervisor, Dubbo Regional Council
ABSTRACT
The Dubbo STP Major Upgrade is the third joint venture project built by CCB Envico andCockram. The upgrade ensures Dubbo has adequate facilities in place to serve the needs of anestimated population of up to 55,000 people in 2035. The new Plant was constructed with theexisting STP with a new biological nutrient removal plant which includes the following;
The existing Inlet works were upgraded to a sealed system including covering the inletworks and proving an odour control system to extract and treat air to mitigate odoursemanating from the Inlet Works. An epoxy coating was applied to the concrete channelsat the inlet works to prevent degradation.
Provision of two 6 ML/day bioreactor trains with a total of 12 ML/d capacity. Twotrains of 4-stage Bardenpho bioreactors with a fine bubble disc aeration system andinternal recycles pumps. Each train process contains four zones of pre-anoxic Zone,aerobic Zone, post-anoxic zone and re-aeration zone designed for biological treatmentof wastewater.
Two 31m diameter secondary Clarifiers for solid separation, as well as chemical dosingand storage facilities plus an in-channel UV unit to disinfect the clarifier effluent.
This paper discusses the Testing, Commissioning and Process performance in the first year ofoperation for the new biological nutrient removal plant.
1.0 INTRODUCTION
Figure 1: SCADA Screen – Dubbo Sewage Treatment Plant Overview
Testing and Commissioning of the Dubbo STP Upgrade was carried out in the followingsequence;
Stage1 Testing
Stage 2 Pre- Commissioning
Stage 3 Equipment Commissioning
Stage 4 Process Commissioning
Stage 5:Post Completion

11th Annual WIOA NSW Water Industry Operations Conference & Exhibition Page No. 36EPIC – Exhibition Park in Canberra, 29 & 30 March, 2017
1.1 Stage 1 - Testing
The following tests were conducted1) Factory Acceptance Testing;2) Hydrostatic Testing;3) Mechanical Installation of Plant and Equipment;4) Electrical Installation of Plant and the Equipment;5) Chemical Systems;6) Aeration Systems;7) Diffuser Test and Oxygen Transfer Test prior to pre-Commissioning;8) Aeration Blower Factory Tests;9) UV Disinfection;10) Instrumentation;11) PLC IO testing.
1.2 Stage 2 - Pre-CommissioningPre-Commissioning could not commence until testing has been completed
Pre-Commissioning Activities Checking Completeness of installation
Checking all equipment is correctly labelled
Ensuring all equipment’s are lubricated.
Checking electrical circuit continuity in accordance with drawings.
Checking calibration of instruments, meters, signal converters etc.
Checking the PLC and SCADA system monitoring and control displays.
Checking chemical and building services water system operation etc.…
Pre-Commissioning PlanThe Contractor (Cockram) provided a Pre-Commissioning plan to the council twoweeks in advance of Pre-Commissioning of any component. This plan includes final testplan, calibration certificates for equipment’s, factory acceptance testing and inspectionreports, all regulatory certificates and approvals, all drawings including Process andInstrumentation Diagrams.
1.3 Stage 3 - Commissioning of Equipment
Equipment Commissioning took place after all pre-commissioning has beensuccessfully completed. During the equipment Commissioning period, Cockram ensuredthat the plant is fully operational and reliable and the following works been completed;Activation of alarms including fault conditions,
Functional checks on interlocks and control system for the plant.
Calibration of all instruments and results sheets completed.
Develop, monitor and control equipment commissioning procedures.
1.4 Stage 4 Process Commissioning
Following the successful completion of Equipment Commissioning, Council, Contractorand Public Works was responsible for Process commissioning includes determiningdosing rates, set points, sludge feed, sewage quantity and testing regime.

11th Annual WIOA NSW Water Industry Operations Conference & Exhibition Page No. 37EPIC – Exhibition Park in Canberra, 29 & 30 March, 2017
Figure 2: Aerial view of the Old & New Sewerage Treatment
Seeding/Cut-OverThe Summary of matters discussed regarding the Seeding are as follows;
As the Sludge from the old plant was poor due to the over population of thebiomass in the ditch and also foaming issues ,we have considered few optionsto seed;
Bathurst STP can provide 3% solution which could be dosed into the plant,however the volume makes this solution impractical. 11% solution could alsobe provided however this would be very difficult to get into the plant forseeding.
Challenge to follow the EPA regulations in transport & environmental issues.
Time and cost factor.
Need huge volume of the quality sludge?
Council has therefore decided to use sludge from the existing plant.
The following process was undertaken to seed the new plant:
The bioreactor will be seeded one train at a time. The first train of thenew STP will be running concurrently with existing STP (each takinghalf of the load) for two weeks while the new bioreactor train is seededand the process proved.
The above will mean that the existing plant will be at half its current loadand water levels will need to be correctly maintained so that the surfaceaerators work as expected.

11th Annual WIOA NSW Water Industry Operations Conference & Exhibition Page No. 38EPIC – Exhibition Park in Canberra, 29 & 30 March, 2017
Once the first train of the new plant is successfully established theseeding of the second train will commence following a similar procedureto the first.
The timing of the shutdown of the existing STP Carousel will beconsidered once the first train of the new STP has been successfullycommissioned and the seeding of the second train has commenced.
Council has therefore decided to use sludge from the existing plant.
August 2015, Started seeding Bio reactor Train 2, started testing program .Beginpumping from the old RAS to Bio reactor Train 2. Also, done chemical dosinginspection.
September 2015, also done seeding for the Bio reactor Train 1.
According to the above planning, the cutover/seeding was successfully completed bythe removal of isolation or connection to allow the process flow (Sewage) into the newplant. These included the screened influent and return lines. PLC/SCADA works forthe relevant Component for operator use was installed by the Contractor before thecut-over was implemented.
Figure 3: Control Ranges for 4-Stage Bardenpho Process
Process Proving PeriodThe Council conducted Process Proving trials over differing seasons for 1 year aftercommissioning is complete. The Contractor continued to attend the defects during thisperiod and resolved efficiently. Some of the Defects include;
1.4.1 Aeration Blowers
Issues: There was few issues with the Blower fault such as Internal water Temperature,Under Temperature, Unreliable aeration control, Aeration system power usages,Aeration system control investigations and rectification.
Solution: New exhaust fan for the blower room installed. Also, fixed 4 new filter padsto the Blower room doors to prevent dust. Swapping Duty Blower at midnight on a 24hours basis to get run time across the units. In September 2016, Atlas Copco andEDC Commissioned the Screw Blower which had been installed to achieve betteraeration and power saving.

11th Annual WIOA NSW Water Industry Operations Conference & Exhibition Page No. 39EPIC – Exhibition Park in Canberra, 29 & 30 March, 2017
The aeration system was shutdown to fix the new feed and valving arrangement. Also,Control method for all the blower system have been changed for better aerationcontrol.
1.4.2 Odour Control Unit
Issues: During November 2016 & December 2016, we had couple of times issues withthe Odour Control unit exhaust fan tripped out due to the unit filled with water.Cockram repaired the fan and advised council to install drain to resolve this problemhappening again.
Solution: Drain was installed and no issues raised till now. The odour issue from thehead of works has been improved and also the unit is working efficiently.
1.4.3 RAS Pumps
Issues: 6 Pumps have been installed according to the design, with 3 per Clarifier .FewPumps have been faulted few times with the no flow and also high Temperature faults.We reset the Pumps and kept running and it happens again in few weeks, So throughfurther investigation, Experts found the clogging up of RAS Pumps were causing due tothe pump is installed in vertical position , instead of Horizontal leaving the pumpminimal head ,we cannot complete bleeding the pump volute.
Solution: Try running only one or two pumps for each clarifier to meet theparameters for daily demand and install additional bleed points on all the pumpvolute. Two new Flow Switches were replaced by the Electrician. Still working on it.
1.4.4 WAS Pumps
Issues: One of the Pump faulting regularly on Stator High Temperature.
Solution: Xylem local pump technician inspected and serviced the pump. Fixed thefaulty mini cast relay and our council Electrician checked, still faulting and finallyfound the issue was due to wrong wiring. At present, the pump is running efficiently.
1.4.5 UV System
Issues: Few of the wipers faulting often, the wiper cards need to be replaced. Isolationswitch not working. Wiper ran continuously due to algal growth in the UV Channel.Also, the Air-Condition to the UV System couldn’t cope with these conditions causesthe high ballast temperature faults.
Solution: Service maintenance agreement with Xylem have been implemented andthe Flex Board been replaced which affects the lamps/ballast fault generation. Also,checked Air Condition and the system is working fine.
1.4.6 Clarifiers
Issues: Due to enormous amount of algal growth on the Clarifier Launders, affects theUV Lamps /Wipers and also leads more work /time for the Operators to clean the algae.

11th Annual WIOA NSW Water Industry Operations Conference & Exhibition Page No. 40EPIC – Exhibition Park in Canberra, 29 & 30 March, 2017
Solution: Clarifier launder covers have been installed during September 2016 byNextep Contractor which was not part of the original upgrade contract. This laundercover inhibits algae growth within the launder troughs and weirs by minimisingsunlight penetration to these surfaces.
1.5 Stage 5 POST Completion
NSW Public Works ensured; Reviewed Work as Executed drawings and operations manuals prior to issue to
Dubbo Regional Council,
Co-ordinated the rectification of Defects during the Defects Liability period.
Finalized the contract and provided Dubbo Regional Council documentationwith regards to the final contract value.
Conducted and closed out workshop with the Contractor and Dubbo RegionalCouncil.
2.0 CONCLUSION
Challenging elements of construction included:
Swift mass excavation of over 50,000m3 for the in-ground bioreactor tanks.
Up to 1500m3concrete pours commencing in some cases at 10pm and conductedthroughout the night due to very high day time temperatures.
Installation and testing large diameter 7 meter deep pipework beneath theclarifier Structures.
7 meter deep shielded excavation through a 60degree batter for the inlet feedpipe, in very close proximity to adjacent operating STP.
The Dubbo STP upgrade and associated inlet works odour control project at over$25m represent the biggest single capital works project ever carried out by theDubbo Regional Council was Completed Successfully by December 2015.TheContractor Performance was evaluated with high and improving scores oncommunication, time, cost, quality, safety, issue resolution and contractrelations. The Process during the First year of Operation regarding wassuccessful in meeting the EPA Licence limits which is user friendly in operationof the plant for the Operators. The recommended Scope for the next project forthe Council would be to build extra Sludge Lagoons due to the large volume ofthe sludge produced in the new Dubbo STP.
3.0 ACKNOWLEDGMENTS
NSW Public WorksCockram ConstructionsAECOMDubbo Regional Council staff.

11th Annual WIOA NSW Water Industry Operations Conference & Exhibition Page No. 41EPIC – Exhibition Park in Canberra, 29 & 30 March, 2017
MANGANESE REMOVAL AT BATHURST WTP
Paper Presented by:
David Cashen
Author:
David Cashen, Water Filtration Supervisor,Bathurst Regional Council
11th Annual WIOANSW Water Industry Operations Conference and Exhibition
EPIC – Exhibition Park in Canberra,29 & 30 March, 2017

11th Annual WIOA NSW Water Industry Operations Conference & Exhibition Page No. 42EPIC – Exhibition Park in Canberra, 29 & 30 March, 2017
MANGANESE REMOVAL AT BATHURST WTP
David Cashen, Water Filtration Supervisor, Bathurst Regional Council
HISTORY
Bathurst Regional Council caters for an estimated 40,000 population at any one time and over aperiod of many years, has suffered due to the naturally occurring minerals Iron and Manganese.
Is was not uncommon for the Engineering department to receive large quantities of calls fromthe general public complaining of discoloured water or quality issues, especially around thehigh draw off or warmer weather periods when demand was at its highest. Following on fromthe complaints were then the expected compensation payments which at times due to the natureor location of the complaint, council obliged as it was a very big issue especially for businessesrelying on water quality like dry cleaners.
Due to Bathurst having all facets of industry from food production to education and medicaland the dry cleaning sector cleaning whites, obviously weighed in on the decision to providecompensation over the years. Council as a business also has a duty of care and responsibility tothe ratepayers, so started to look at alternatives to find a long overdue remedy for the problem.
1.0 Problem 1
Bathurst Regional Council is a wide spread, fast growing region and it only has oneWater Filtration Plant which can treat and supply up to 60ML/d or 695 L/s. It was builtin 1972 so has limited augmentation potential.
The WTP consists of conventional treatment processes from floatation deflector tubewith 300mm of debris wire on the raw water source or Macquarie river to 50mmvertical bar screens on inlet channels to the vertical lift raw water pumps. These pumpslift the water up to the Rapid Mix chamber or where the coagulant (Aluminium sulfate -Liquid Alum) is added as the chemical part of the process. This process changes or addsions to the existing ions to form bonds or floc particles which bond up the dirt particles.
At this stage, the plant also utilises a coagulant aid to strengthen the floc formed whichis a polymer that can be charged either way or neutral. Flow then travels into three bayscalled flocculation chambers which are tapered which means lower in speed as watertravels through each one so to not break up or shear the floc. Flows then move into thesedimentation part of the process where the physical settling process takes place. Thenewly formed large and now heavy floc settles under gravity and is scraped away andwasted to drying lagoons. The clean water travels out of this part and into channelswhich go to the duel media Rapid Sand Filters (14 in use). The water filters through toa quality of about 0.05- 0.10 NTU's under normal running conditions. It is at this stagethat pH post correction chemical is added, Fluoride for Dental Health and mostimportantly Gaseous Chlorine for disinfection to a Free Chlorine level of 2.5mg/L inorder to maintain the furthermost distribution location minimum free residual of0.2mg/L. At this stage it is then pumped out to the service reservoirs fit for safe humanconsumption.

11th Annual WIOA NSW Water Industry Operations Conference & Exhibition Page No. 43EPIC – Exhibition Park in Canberra, 29 & 30 March, 2017
This is where the problem presented itself, as once the Chlorine was added, oxidationwould occur in the distribution system and reservoirs and then ultimately to theconsumer.
2.0 Problem 2
We experienced high levels of Manganese in the source water at various times of theyear due to our Dam being a surface water Dam and prone to mineral wash in. Levelsranged from 0.015mg/L to as high as 0.8mg/L.
Remedy trial:Potassium Permanganate - (KmNo4) was trialled for several years however wasunsuccessful due to lack of contact time even at various % strengths and dose rates. A2% solution was found to be the most suited to Bathurst, but was found to not havesufficient Mn removal over all mineral ranges and we could not get it under therecommended 0.02mg/L minimum in our treated water so the problem remained.
Study: Stage 1:Trial by Catalyst - Force the minerals to oxidise before filtration so they could then beremoved before the disinfection stage promoting the problem.
Clear tubes filled with a similar sand media used in the filters, conditions adjusted tomatch plant flows, temperature. The Catalyst used was Sodium Hypochlorite at 13%but most importantly, the location and pH of the water had to be corrected. This was toallow the right conditions for the hypo to oxidise and force out of solution the blackproblem Manganese mineral so that the filters could remove it.
Summer and Winter trials were also completed (2 years to cover all running conditions).Results were above expectations with levels of not only under 0.02mg/L but as low as0.01 and under. This was classed as complete removal for around 90-95% of the time.Due to this, a full scale trail utilising two of our 14 Filters was warranted.
Study Stage 2:Trial ongoing utilising 2 full scale filters, all conditions tested and noted. Results backedup those identified in the stage 1 trial.
Funding was sought and plant augmentation was completed at a cost of around $5M.Testing is ongoing with over expected results and system performance.

11th Annual WIOA NSW Water Industry Operations Conference & Exhibition Page No. 44EPIC – Exhibition Park in Canberra, 29 & 30 March, 2017
DEWATERING CENTRIFUGE OPTIMISATION - ABETTER WAY
Paper Presented by:
Lachlan McTaggart
Author:
Lachlan McTaggart, Production Officer,
Sydney Water Corporation
11th Annual WIOANSW Water Industry Operations Conference and Exhibition
EPIC – Exhibition Park in Canberra,29 & 30 March, 2017

11th Annual WIOA NSW Water Industry Operations Conference & Exhibition Page No. 45EPIC – Exhibition Park in Canberra, 29 & 30 March, 2017
DEWATERING CENTRIFUGE OPTIMISATION-A BETTER WAY
Lachlan McTaggart, Production Officer, Sydney Water Corporation
ABSTRACT
The disposal of dewatered biosolids has both significant cost and environmental implications.The varying nature of feed sludge and poor understanding of the dewatering process make itdifficult to fully optimise. In addition, the commonly applied one factor at a time optimisationapproach is time consuming and only achieves adequate not optimal performance.
A full-scale design of experiments approach was taken to better understand the importance andinteractions of operational parameters (factors) relating to centrifuge dewatering. An initial twostage screening test was used to identify the top three factors that influence dewateringperformance. These were further investigated and described using a full factorial design.
It was found that torque was the top factor affecting dewatering performance. By establishing adeeper pond, increasing the feed flow and maximising the bowl speed it was possible toincrease the torque and maximise the cake dryness. Factors such as the pond depth, bowl speedand polymer dose were shown to be important for maintaining the centrate clarity.
The dryness of the dewatered cake was increased from 20.3% to 23.5% representing a financialsaving of AUD $176000pa. The lessons learnt during the full-scale design of experiments mayrepresent significant savings if replicated elsewhere.
1.0 INTRODUCTION
The management and handling of wastewater sludge is one of the largest problemsfacing Wastewater Treatment Plants (WWTPs) (Spinosa et al., 2011). Even though thevolume of sludge is small in comparison with the amount of wastewater treated, thecosts associated with handling of wastewater sludge may comprise of up to 50% of theoperating budget of the WWTP (Barber, 2014, Spinosa et al., 2011).
The nature of wastewater sludges makes them both inherently difficult to dewater(Chen, 2013) and unique (Włodarczyk et al., 2014). Their properties and characteristics are dependent on both the sewage entering the WWTP and the treatment processes usedat the WWTP (Thomas, 2009, Włodarczyk et al., 2014).
There are many parameters (or factors) that may affect the performance of centrifugedewatering. While the effects of changes to each parameter are mostly agreed upon(Table 1), there is still some debate found within the literature, particularly in the case ofpond depth. Furthermore, the extent to which each operational parameter influencescake dryness and centrate clarity is unknown.
Centrifuge optimisation usually involves using a one factor at a time (OFAT) approach.This aims to identify the optimum setting for each operational parameter by changingone factor at a time across its range while keeping the other parameters constant.

11th Annual WIOA NSW Water Industry Operations Conference & Exhibition Page No. 46EPIC – Exhibition Park in Canberra, 29 & 30 March, 2017
Table 1: Summary of literature findings on effects of changing mainoperational parameters
Increasing
Bowl speed Feed rate Torque Polymer dose Pond depth
Cake Dryness Increase Decrease Increase Increase Decrease
CentrateClarity
Increase Decrease Decrease Increase Increase
While useful, this fails to fully optimise the process, or to identify the key operationalparameters that provide the most influence to the outcome. It is also a slow and costlyprocess.
2.0 DISCUSSION
2.1 Aims and Methodology
The aims were to validate the effects of factors in published literature, determine whichare the significant and ultimately optimise the dewatering process to achieve themaximum dewatered cake TSR% whilst still maintaining a good quality centrate.
A two-stage design of experiment approach was taken using an initial screening designfollowed by a more targeted full factorial design. The statistical design of experiments isan excellent way to design or plan experiments, analyse the results to achieve objectiveconclusions and also the most effective means of optimising a process (Gündoğdu et al., 2016). MINTAB was used for experimental design and analysis.
2.2 Study Site
Cronulla WWTP is a tertiary wastewater treatment plant located in Sydney’s south. Ittreats an Equivalent Population (EP) of 210000 with an ADWF of 56.8 ML/day andgenerates approximately 6.6 dry tonnes of biosolids each day. The sludge at the plant isa mix of Thickened Primary Sludge and Thickened Waste Activated Sludge. This sludgeis anaerobically digested and then dewatered using a High G centrifuge. Thesecentrifuges were installed in 2011/12, and had been optimised by the plant team usingan OFAT approach to achieve an average TSR of 20.3%.
2.2 Screening Design
A screening design using a fractional factorial design was used to identify the vitalfactors that had the greatest effect on cake TSR% and centrate quality. This is anexcellent way to consider the effect of a large number of factors in a minimum numberof runs, thus reducing the time and budget required (Antony, 2014). This two-levelfactorial investigated the effects of the all six factors: Torque, polymer dose, bowlspeed, feed rate, dilution water and pond depth (Table 2). The high and low levels wereselected based on the normal operating levels, as well as relevant site knowledge andrelevant literature.

11th Annual WIOA NSW Water Industry Operations Conference & Exhibition Page No. 47EPIC – Exhibition Park in Canberra, 29 & 30 March, 2017
Table 2: High and low levels used for each factor investigated in the initialscreening design
Factor Low level High Level
Bowl Speed (rpm) 2400 3000
Torque (kN) 2.8 3.3
Polymer Dose (kg/dT) 12 18
Dilution Water (l/m) 0 2
Feed Rate (l/s) 4.5 6
Pond Depth (mm) 120 110
The average result for each run in the initial screening design are presented in Table 3below, along with the factor levels used in that run. The analysis of the screeningexperiment data identified two critical factors for the cake TSR response, torque andbowl speed. The analysis of the screening experiment data also showed two criticalfactors for the centrate TS% response, weir height and torque. Polymer dose rate anddilution water were shown to have a moderate effect. The responses to the varying of thefactors in stage 1 are displayed in Figure 1.
Table 3: Summary of runs for screening design including factor level andobserved responses
RunNumber
BowlSpeed
TorquePolyDose
DilutionWater
Feedrate
Weir(PondDepth)
MeanCakeTS%
MeanCentrate
TS%
1 (+1) (-1) (+1) (+1) (+1) (-1) 19.44 0.190
2 (-1) (+1) (-1) (+1) (+1) (+1) 19.83 0.180
3 (-1) (-1) (-1) (-1) (-1) (-1) 19.88 0.208
4 (-1) (+1) (+1) (-1) (+1) (+1) 20.97 0.215
5 (+1) (+1) (-1) (+1) (-1) (-1) 20.24 0.760
6 (+1) (-1) (-1) (+1) (+1) (+1) 19.24 0.193
7 (-1) (+1) (+1) (+1) (-1) (-1) 20.90 0.370
8 (+1) (-1) (+1) (-1) (+1) (-1) 18.85 0.270
9 (+1) (-1) (-1) (-1) (-1) (+1) 18.81 0.167
10 (-1) (-1) (+1) (+1) (-1) (+1) 19.00 0.160
11 (-1) (+1) (-1) (-1) (+1) (-1) 20.66 0.940
12 (+1) (+1) (+1) (-1) (-1) (+1) 20.45 0.157
Figure 1: Optimiser plot showing how changes to factors affect the responses ofcake dryness and centrate clarity based on the initial screening design

11th Annual WIOA NSW Water Industry Operations Conference & Exhibition Page No. 48EPIC – Exhibition Park in Canberra, 29 & 30 March, 2017
2.3 Full Factorial Design
A full factorial design using the three most significant factors identified in the screeningdesign was used to describe the effect of the factors on the responses and also to identifyany significant interaction between them. After reviewing the results from the screeningdesign and output from MINITAB the factors chosen were: Bowl speed, Torque andPolymer dose. The low and high levels were used from the screening design, and a mid-level was added (see Table 4). The exception to this was torque as it was identified inthe screening design that certain combinations of factors were not able to achieve thetorque set points, hence lower values were chosen.
Table 4: Factors and levels investigated in the full factorial design
Factor Low level Mid Level High Level
Bowl Speed (rpm) 2400 2700 3000
Torque (kN) 2.3 2.55 2.8
Polymer Dose (kg/dT) 12 15 18
The factors not investigated in the full factorial design were set at the optimal points thatwere identified in the screening design. As such a feed rate of 4.5l/s, no dilution waterand R-110 weir plates (deep pond) were used. The responses and factor levels used foreach run are presented in Table 5 below.
Table 5: Summary of runs for full factorial design including factor level andobserved responses
RunNumber Torque
BowlSpeed
PolymerDose
%TSCake
%TSCentrate
1 (-1) (-1) (-1) 19.41 0.1605
2 (-1) (+1) (-1) 18.65 0.1737
3 (0) (0) (0) 19.87 0.1732
4 (+1) (-1) (-1) 19.39 0.1562
5 (-1) (-1) (+1) 18.65 0.1655
6 (-1) (+1) (+1) 19.72 0.1900
7 (0) (0) (0) 20.05 0.1856
8 (+1) (+1) (+1) 21.00 0.1853
9 (+1) (-1) (+1) 19.78 0.1778
10 (0) (0) (0) 20.22 0.1667
11 (+1) (+1) (-1) 20.60 0.1677
12 (0) (0) (0) 20.71 0.1744
13 (-1) (+1) (-1) 19.70 0 .1995
14 (-1) (-1) (+1) 20.01 0.1934
15 (+1) (-1) (-1) 20.45 0 .1978
16 (+1) (+1) (+1) 21.25 0.1576
17 (0) (0) (0) 20.17 0.2078
18 (+1) (-1) (+1) 18.93 0.1846
19 (-1) (+1) (+1) 19.98 0.1701
20 (0) (0) (0) 20.00 0.1520
21 (+1) (+1) (-1) 20.42 0.1655
22 (-1) (-1) (-1) 19.22 0.1709

11th Annual WIOA NSW Water Industry Operations Conference & Exhibition Page No. 49EPIC – Exhibition Park in Canberra, 29 & 30 March, 2017
The analysis found that there were two critical factors for cake TSR, torque and bowlspeed, and one critical interaction between torque and bowl speed. The analysis for theresponse centrate TS did not find any critical factors or interactions. The responses ofthe factors investigated in the full factorial design are shown in Figure 2.
Figure 2: Optimiser plot for full factorial design showing the effect of changes tofactor level for each response. A composite of both responses is shownat the top
2.4 Findings and Application
Using the results of both stages it was possible to develop a site-specific responsematrix (Table 6). This information better allowed the operational team to understand theinfluence of centrifuge parameters on the dewatering performance. Changes were thenmade to the process which sacrificed ‘low influence’ parameters to greatly increase‘high influence’ parameters. In particular, the bowl speed was maximised and the feedrate was increased to allow the most important factor torque to be maximised. Eventhough an increased torque and feed rate was shown to be detrimental to centratequality, the deeper pond and higher bowl speed could maintain the centrate quality at anacceptable level.
Table 6: An example of a site specific response matrix showing significance andeffect for both Cake TSR and centrate clarity
Most significant ------------------------------------------ Least significant
Torque Bowl Speed Weir Height Poly Dose Feed Rate
IncreaseCake TSR
Increase Increase Increase Not linear NA
Weir Height Torque Poly Dose Bowl Speed Feed Rate
DecreaseCentrate TS
Increase Decrease Not linear Increase Decrease
When fully optimised an ultimate cake TSR% of 25.11 could be achieved. A maximumcake of 23.5% was achievable before the centrate quality deteriorated to an unacceptablelevel. This was an overall improvement of 3.2%. This improvement in cake TSR willresult in a reduction of sludge transport, which equates to a financial saving of $176000each year.

11th Annual WIOA NSW Water Industry Operations Conference & Exhibition Page No. 50EPIC – Exhibition Park in Canberra, 29 & 30 March, 2017
Contrary to the literature and recommendations from the manufacturer the deeper pondprovided for better sedimentation within the centrifuge resulting in both dryer cake anda much cleaner centrate. This allowed for the feed rate to be increased and the torque tobe maximised producing a much dryer cake without compromising the centrate.
2.5 Future research opportunities
The following have been identified as potential future research opportunities: Conduct similar studies on other sludge types (i.e. Primary only and WAS only)
and dewatering processes (belt and screw presses) to determine if there are anygeneral rules that can be applied
Test the experimental design process on thickening centrifuges where thedesired responses are different (high capture rate and a specific TSR for TWAS).
3.0 CONCLUSION
This process has shown that design of experiments is an excellent statistical approachto the optimisation of a dewatering centrifuge. It enables for the development of a site-specific response matrix that shows both the significance and response of each factorinvestigated. It was found that increases to the torque and pond depth were the mostimportant factors for producing dryer cake and cleaner centrate.
4.0 ACKNOWLEDGEMENTS
Thanks to Professor Richard Stuetz and Dr Juan Pablo Alavrez Gaitan from UNSW, foryour support and technical expertise. Thanks also to Robert Aurisch and the plant teamat Cronulla WWTP, for your encouragement and for allowing me to undertake myexperiment.
5.0 REFERENCES
Antony, J. 2014. Design of Experiments for Engineers and Scientists, Elsevier.
Barber, W. P. F. 2014. Influence of wastewater treatment on sludge production and processing.Water and Environment Journal, 28, 1-10.
Chen, W. 2013. Optimization of Sludge Dewatering Through Pretreatment, EquipmentSelection, and Testing. Drying Technology: An International Journal, 31, 193-201.
Gündoğdu, T. B. K., Deniz, I. R., Çaliskan, G. L., Şahin, E. S. & Azbar, N. 2016. Experimental design methods for bioengineering applications. Critical Reviews in Biotechnology, 36, 368-388.
Spinosa, L., Ayol, A., Baudez, J.C., Canziani, R., Jenicek, P., Leonard, A., Rulkens, W., Xu, G.& Dijk, L. V. 2011. Sustainable and Innovative Solutions for Sewage Sludge Management.Water, 3, 702-717.
Thomas, M. 2009. Optimisation of Dewatering Centrifuges. 34th Annual Qld Water IndustryOperation Workshop. Indoor Sports Stadium, Caloundra.
Wlodarczyk, E. B., Wolny, L. & Wolski, P. 2014. Evaluation of dewatered sludge propertiesfrom a selected municipal sewage treatment plant. Desalination and Water Treatment, 52, 19-21.

11th Annual WIOA NSW Water Industry Operations Conference & Exhibition Page No. 51EPIC – Exhibition Park in Canberra, 29 & 30 March, 2017
REHABILITATION OF VICTORIA ST RAW WATERPUMPING STATION
Paper Presented by:
Geoff Lewis
Authors:
Marty Woodhead, Corowa Water Treatment Plant OperatorGeoff Lewis, Manager Water & Sewerage,
Federation Council
11th Annual WIOANSW Water Industry Operations Conference and Exhibition
EPIC – Exhibition Park in Canberra,29 & 30 March, 2017

11th Annual WIOA NSW Water Industry Operations Conference & Exhibition Page No. 52EPIC – Exhibition Park in Canberra, 29 & 30 March, 2017
REHABILITATION OF VICTORIA ST RAW WATER PUMPINGSTATION
Marty Woodhead, Corowa Water Treatment Plant Operator, Federation CouncilGeoff Lewis, Manager Water & Sewerage, Federation Council
ABSTRACT
The Victoria St water supply pump station pumps water through an in-river gravel media filterbed built for the purpose of providing clean water to the town of Corowa. The gravel filtercannot be easily cleaned and this paper reports on its development, the method of backwashingand the level of success of recent rehabilitation work.
It demonstrates the importance of realistic planning to meet customer expectations and the highoperational costs associated with projects proposed on low capital expenditure budgets and theimportance of good design which considers operational costs as important as capital costs.
1.0 INTRODUCTION
Corowa is a town of 6000 people situated on the Murray River about 50km west ofAlbury. It has two raw water pumping stations delivering water to a distant watertreatment plant which supplies water to the town.
The old Netherby Pump station was built in 1926 and comprises a 10m deep dry wellwith 2 duty pumps and is built on a rocky bend with deep water good for low riverconditions in drought and a good high bank giving good access in times of flood.
In 1967 a new pump station was built at Victoria St to replace the old pump station andfor the purpose of providing good quality water by pumping through a natural gravelfilter bed in the river in lieu of building a treatment plant. The pump station struggleswith high suction head problems when the river is low. When the river is in flood, thepump station can only be accessed by boat.
In 2002 a DAF water treatment plant was built and can receive water from either pumpstation.
The problem is that at the Victoria St pump station the gravel filter bed cannot besuccessfully backwashed and we cannot easily maintain the 3 pumps working at theirdesign duty points.
Figure 1: Victoria St P/S Intake 1967 Figure 2: Netherby P/S Intake 1926

11th Annual WIOA NSW Water Industry Operations Conference & Exhibition Page No. 53EPIC – Exhibition Park in Canberra, 29 & 30 March, 2017
2.0 PUMPING STATION CONSTRUCTION
How did this backwashing problem develop?
In 1963 Council’s consultant was authorised to undertake preliminary investigations into ways of improving the town’s water quality. The consultant produced a plancomprising a treatment plant but a referendum was held and the project proceeded nofurther.
In 1966 the consultant was again asked for further advice on improving the town watersupply. An alternative scheme for providing a filtration system was put forward.
The scheme was to find a location somewhere on the river where a suitable naturalgravel profile existed through which water could be pumped thus delivering clean waterto the town. A pump station would be built at this location and the old pump stationretained only for emergency use.
The Victoria St pump station site was selected as potentially suitable and test boring wasundertaken and core samples were sent off for testing at a Sydney laboratory. Testsconfirmed the suitability of the grading and the permeability of the material to act as aneffective filtration medium for the town water supply.
Plans and specifications were then prepared for the intake screens and the pumps andapproval received from the Department of Local Government and contracts were let toundertake the work.
Once work commenced it was found that the supposed suitable gravel bed was a smalldeposit only and that the sand and gravel composition was not as anticipated. It wasdecided to create artificial sand and gravel bed by excavating the river bed and carting inthe necessary gravel to form a satisfactory filter bed.
By 1967 the work was complete and the pump station was commissioned. The pumpswere operated and duly delivered water as expected. The filter bed was to be kept cleanby backwashing by reversing flow through the filter from the rising main. When thebackwashing was undertaken the adjacent river bank collapsed into the river andpartially covered the filter media with silt. This occurred because the filter media wasfluidised by the backwashing to make it like quick sand with no strength and suddenlyprovided no support for the river bank.
According to the record the Council’s solicitors were not informed precisely of whattook place following the collapse.
The record states that the river bank was then reconstructed using locally available sandselected by field inspection. With subsequent rise in the river level of about 1.5m thenew bank again slumped over the intake. Remedial action to clear the media cost aconsiderable sum with drawings prepared showing details of the work which requiredconsiderable labour, drag lines, the council bulldozer and the hire of a pump at$120/week!

11th Annual WIOA NSW Water Industry Operations Conference & Exhibition Page No. 54EPIC – Exhibition Park in Canberra, 29 & 30 March, 2017
Council held the consultant responsible for the failed work and the attendantexpenditure which was duly accepted. Nevertheless the consultant took the view that itcould not be expected to have foreseen and forestalled what happened and that itconsequently could not be held to account for it.
Figure 3: Victoria St Pump Station Plan and Cross Section
3.0 BACKWASHING METHODOLOGY
Two methods for backwashing were employed; the original water purging method, andan augmented air scouring system.
The original practice was to reverse the flow through the intake screens by openingvalves allowing water in the rising main to flow back through the draft tubes betweenthe pump and the casing and out through the screens and the filter media. This musthave been only of limited success.
Within a couple of years of the initial commissioning a new air scouring backwashsystem was installed. It comprised an air vessel connected to a series of lateral andvertical galvanised pipes of about 50mm diameter embedded into the media. The airvessel was 10m long and 600mm in diameter and from the drawing it appears that theair was driven through the system by water from the rising main. There is no referenceon the drawings to compressors and there is no evidence in the pump station building ofa compressor ever having existed.

11th Annual WIOA NSW Water Industry Operations Conference & Exhibition Page No. 55EPIC – Exhibition Park in Canberra, 29 & 30 March, 2017
By 1985 after 15 years this augmented system was completely defunct and had notoperated for an unknown period of time. The pipework was rusty and eventually all theaccessible pipework was removed and it is expected that all of the pipework in themedia bed has long since rusted away to nothing.
In 2002 a water treatment plant was built rendering the need for an in-river filterunnecessary. Nevertheless it remained in place and had to be maintained. Because therewas no longer pressure from the rising main to the reservoirs to generate backwashingpressure the new design provided for 2 of the 3 pumps to pump the water to backwashthe third pump. Consequently 3 pumps have to be working for any pump to be working.
4.0 BACKWASHING REHABILITATION
Pump performance has always been at its worst when the river is low and suctionconditions are at their worst. Fortunately this occurs in mid-winter when demand is at itslowest. The Murray River is low in winter because it is a regulated river and all flow isdriven by irrigator demand. In winter there is no irrigation water requirement and flowsare reduced to the environmental minimum which is 1,200ML/day – in summer it istypically about 20,000ML/day with a maximum allowed flow of 25,000ML/day. All ofthe water stored in the Hume Dam and Dartmouth Dam is for irrigation usage, the townson the river use only about 2% of the total.
The first serious attempt to improve the filter media performance was undertaken 10years ago when a diving company was employed to suction clean the 2m deep mediawith a barge mounted pump. The success of this operation was dubious at best.
The filter screens are 5m long with one for each of the 3 pumps and are about 5m apart.When backwashing is undertaken entrained air allows easy identification of where thebackwash water is discharging. The localised points at which this would occur, and notover the length of the screens, suggested that the stainless steel screens may have rustedthrough jeopardising the whole backwash system.
The diving company was re-employed to investigate the integrity of the screens. Thereport received was that the screens were intact but no video evidence or comprehensivedata supported this information.
One year ago as the performance further deteriorated a CCTV company was employedwhich managed to get a camera into 2 of the screens which showed them to be intactalthough there was a lot of scale and growth on the screens and it was obvious that waterwas only passing through part of the screens.
It was decided a major effort was required to clean the media to the point of dredging itcompletely off the screens. Considerations were:
Excavate the gravel media using shore based equipment or barge mounted. Use a suction dredge to break up the media. Use a venturi suction system with land based pump and sedimentation basin. Jet the media using compressed air with a lance. Blast compressed air through the media from within the screens.

11th Annual WIOA NSW Water Industry Operations Conference & Exhibition Page No. 56EPIC – Exhibition Park in Canberra, 29 & 30 March, 2017
The venturi suction system was first tried but although the gravel was successfullysucked out of the river it blocked the delivery pipe to the sedimentation basin and wasdiscontinued. With bigger equipment it could have been successful.
The compressed air approach was then employed. A compressor was hired and apontoon tethered to the bore casings. Air lines were tapped into the backwash pipes andair jetted into the media using a 5m long 50mm PVC lance which was able to reach thescreens through the 2m deep media. Air was also injected into the media from insidethe screens. The compressor was of limited capacity and deliberately so for fear of highpressure air rupturing a screen making it unusable.
The exercise was relatively successful. At the end of one week, the filter performancehad increased from about 15% to 50% of full functionality.
Figure 4: Pontoon in position
Three months after the work was finished one of the pumps stopped pumping and wasremoved to find gravel in the impeller bowl. The camera was brought back in and thisshowed the filter screen half full of gravel indicating that the screen had rupturedconfirming our worst fear.
Currently a diesel pump with its own suction line has been connected into the pumpstation so that the pump station can still function but the 1926 original pump station isnow back on line as the duty pump station.

11th Annual WIOA NSW Water Industry Operations Conference & Exhibition Page No. 57EPIC – Exhibition Park in Canberra, 29 & 30 March, 2017
Figure 5: Jetting with lance while compressed air blowing from inside the screensimultaneously
5.0 CONCLUSION
A new pump station is to be built to replace this facility with the intention of having itconstructed before next summer. The challenge for the new pump station will be toprovide an installation that can pump water from a depth of less than 450mm, not haveinfrastructure that impacts on recreational water skiing activities on the river, and nothave infrastructure that is underwater that requires maintenance.
The Victoria St pump station was built as a compromise to building a water treatmentplant. Its record is one of low design capital cost but high construction cost and highoperating cost. The project development and the geotechnical and design process has ledto the pump station being a liability for the duration of its 50 year life.
It will be replaced not because 2 pump stations are needed but because of the value inhaving redundancy in pump intakes where low river conditions will be a greater risk inthe future.

11th Annual WIOA NSW Water Industry Operations Conference & Exhibition Page No. 58EPIC – Exhibition Park in Canberra, 29 & 30 March, 2017
DISINFECTION OF A MAJOR TRUNK MAIN
Paper Presented by:
Danny Roberts
Author:
Danny Roberts, Water Treatment Supervisor,
Port Macquarie-Hastings Council
11th Annual WIOANSW Water Industry Operations Conference and Exhibition
EPIC – Exhibition Park in Canberra,29 & 30 March, 2017

11th Annual WIOA NSW Water Industry Operations Conference & Exhibition Page No. 59EPIC – Exhibition Park in Canberra, 29 & 30 March, 2017
DISINFECTION OF A MAJOR TRUNK MAIN
Danny Roberts, Water Treatment Supervisor, Port Macquarie-Hastings Council
ABSTRACT
The Southern Arm Trunk Main (SATM) project is a major component of the ongoingaugmentation of Port Macquarie-Hastings Councils (PMHC) Bulk Water Scheme. Whencomplete the Southern Arm Trunk Main will provide a direct link between Cowarra Dam andthe Camden Haven region.
In 2016, construction of a 10.5km section of The Southern Arm Trunk Main was completed inthe Bonny Hills area. This paper outlines the planning of the disinfection of this trunk main.This is the largest disinfection task attempted by our Water Treatment Operators and presentedmany new challenges.
Disinfection is the process designed to kill most microorganisms in water, including allpathogenic (disease-causing) bacteria.
It is best practice to disinfect new mains prior to bringing them into service to control the riskof pathogens entering the water distribution network. This is outlined in the followingdocuments:
The ADWG (appendix I table AI.7) recommends development of mains disinfectionprocedures to control pathogen risk in distribution networks.
WSA Appendix I outlines a best practice example to achieve disinfection of mains. NSW DPI Circular 18 recommends water authorities develop mains disinfection
procedures to control pathogen risk in distribution networks.
1.0 INTRODUCTION
1.1 Port Macquarie-Hastings Water Supply Schemes
Port Macquarie-Hastings Council operates and maintains a major bulk water supply
scheme and five reticulation systems. This paper is primarily concerned with the staged
expansion of the bulk water scheme. A description of the existing bulk water scheme is
provided below.
1.2 Hastings Bulk Water Supply Scheme
The Hastings Bulk Water Supply Scheme includes the bulk water supply pumpingstations, water conditioning/treatment, off-creek storage dams and trunk main networkto the townships of Wauchope, Port Macquarie and Camden Haven.
Raw water is pumped from the Hastings River at Koree Island (5km south-west ofWauchope). The three Koree Island pumping stations have a combined pumpingcapacity of 120 Megalitres (ML) per day via rising mains into Rosewood Reservoirs #2& #3. The raw water is treated in the rising mains at the Wauchope Water TreatmentPlant with lime and carbon dioxide (water conditioning) to increase alkalinity andstabilise the pH of the raw water. Fluoridation and chlorination is also completed at theRosewood Reservoir site, prior to the water being stored in Rosewood #2 & #3Reservoirs.

11th Annual WIOA NSW Water Industry Operations Conference & Exhibition Page No. 60EPIC – Exhibition Park in Canberra, 29 & 30 March, 2017
The water in the Rosewood Reservoirs #2 & #3 is then gravity fed to the 2,500 ML PortMacquarie and 10,000 ML Cowarra Off-Creek Storage Dams.
Water is pumped from the Port Macquarie Off-Creek Storage Dam to supply zoneswithin the Port Macquarie area. Water is also distributed from the Port Macquarie Off-Creek Storage Dam via an existing trunk main to supply the Camden Haven regionsouth of Port Macquarie.
When extraction is not possible from the Hastings River at Koree Island then water ispumped from the Cowarra Dam to Port Macquarie Dam.
1.3 Secure Yield Study
Port Macquarie-Hastings Council is in the process of completing a Secure Yield Study.The study has assessed the Bulk Water Scheme to –
1. Identify critical operational limitations within the existing Bulk Water Scheme2. Determine the impact of growth in the region on the existing Bulk Water
Scheme3. Re-assess existing plans to expand the Bulk Water Scheme.4. Recommend actions and priorities for future augmentation of the Bulk Water
Scheme.
The study reaffirmed that the SATM project is a major priority to secure the Supply inthe Camden Haven area south of Port Macquarie.
1.4 Future Bulk Water Scheme
When complete, the SATM will provide a direct link from Cowarra Dam to the Camden
Haven region and will provide a secure water supply to this rapidly expanding area.
The SATM will connect to the existing trunk main at Bonny Hills. This connection will
ultimately provide an alternative flow path from Cowarra Dam to Port Dam.
Figure 1: Bulk Water Scheme and proposed SATM
2.0 DISCUSSION

11th Annual WIOA NSW Water Industry Operations Conference & Exhibition Page No. 61EPIC – Exhibition Park in Canberra, 29 & 30 March, 2017
2.1 Disinfection Method
PMHC’s standard disinfection method is to super chlorinate by injecting SodiumHypochlorite.
1. The water main is charged and pressured tested2. The water main is flushed until turbidity is < 2 NTU (lower if possible)3. Water is drawn through the main at a predetermined flow rate.4. Sodium Hypochlorite is dosed into the main until a residual of 100mg/L is
measured at the draw out point.5. The main is left to stand for a calculated detention time.6. After detention time the chlorine residual is again measured.7. Should there be a > 50% decline in the measured chlorine residual after the
detention time, the disinfection would be deemed inadequate and the injectionprocess repeated.
8. When the measured residual chlorine decline is <50% the main is flushed untilthe chlorine residual and turbidity is ≤ the parent main.
9. After an additional standing period of 16-24hrs microbiological samples aretaken for analysis in the laboratory.
10. Samples are tested for E coli and Total Coliforms.11. If lab results are clear of contaminants the main is approved for service.12. If lab results fail the process is repeated.
2.2 SATM Disinfection Task Outline
Table 1: Pipe sizes, volumes & flushing flow required
Task - Disinfect 10.5km of new trunk main
Pipe size (mm) Length (m) Volume (L) Flushing flow (L/s)
450 2000 318,086 159.04750 7500 3,313,399 441.79600 800 266,195 282.74600 200 56,549 282.74
Total 10,500 3,954,229L 441.79
2.3 Operational Requirements and Limitations
In addition to the sheer scope of the disinfection of the SATM, several additionaloperational requirements needed to be considered:
1. Bonny Hills reservoir to remain in service2. Existing trunk main to remain in service.3. No interruption to normal operation of the scheme.4. New main to be brought into service after disinfection
2.4 Disinfection Planning
The first consideration was to establish a flow path for the disinfection.Option 1 - Feeding water from the Bonny Hills reservoir via the new inlet from south tonorthOption 2 - Open the existing trunk main just south of Bonny Hills to create south tonorth flow.We decided to utilise both options and establish two chlorine dosing points. Thedisinfection could then be completed in two stages.

11th Annual WIOA NSW Water Industry Operations Conference & Exhibition Page No. 62EPIC – Exhibition Park in Canberra, 29 & 30 March, 2017
We now needed a viable discharge point for flushing and for discharge duringdisinfection.Option 1 - Opening hydrants on the new main and discharging to water tankers.Considering the volume of water and the limited heavy vehicle access we decided thiswas not a good option.Option 2 - Opening hydrants on the new main and using de-chlorination chemicals todischarge water to the environment. We considered the environmental risk was too high.Option 3 - A 300mm reclaim water main had been laid adjacent to the existing trunkmain. This main provided a path back the Bonny Hills Waste Water Plant. It couldeasily be interconnected to the new main for the purpose of disposing of disinfectionwastewater. We decided to pursue Option 3 as the best environmental, operational andeconomical outcome.
Two (2) dosing sites were established for chlorine injection. A pH correction unit was set up at the discharge point. Eight (8) Sample points were established along the new main to monitor dosing
progress. The max flushing flow available was only 50 L/s, significantly less than the
441.79 L/S required providing high velocity scouring of the internal pipelinesurface.
Calculations completed to determine dosing requirements and time estimates.
Table 2: Flow and volume calculation results
Figure 2: Disinfection map
2.5 Commissioning of Reclaimed Water Main
The reclaimed water main had been laid over a number of years and had not beenpressure tested. The interconnection between the new trunk main and the reclaimedwater main was put in place.
The reclaimed water main was extended at the Bonny Hills Wastewater Treatment Plantto allow direct access to a sludge lagoon. The sludge lagoon was emptied to hold thevolume required for the commissioning and disinfection task.
Disinfection Calculations Results
total length volume to be dosed constant flow time
10,500 m 3,954,229 L 21.75 hours
hypo strength cl 2 residual start cl 2 residual target
12.5% 1 mg/L 100 mg/L
flow rate hypo flow rate hypo quantity
50 L/s 142.56 L/h 3100 L

11th Annual WIOA NSW Water Industry Operations Conference & Exhibition Page No. 63EPIC – Exhibition Park in Canberra, 29 & 30 March, 2017
The new inlet was opened at Bonny Hills Reservoir to charge all of the pipework.Construction crews spent the next 2 weeks pressure testing, finding valves and repairingleaks.
The flow path was finally established.
2.6 Resource and Work Planning
The task required 24hour monitoring during dosing and flushing.At this point we consulted with our team of Water Treatment Operators. Both on-siteand off -site meetings were conducted and the following resource/work flow plan wasdeveloped.1. Set up and test checklist
a) Relevant safety equipment is on site, available and checked.b) Spill kit, SDS for hypo, PPE for hypo, Shower / Eye washc) Solo and remote workers procedure in place (check in times & iota)d) Lights for access and work area, amenities trailer set upe) Final check that all equipment, is set up connected and pressure tested.f) Chemical tank in place secure, fenced.g) Power available, pump installed connected and tested (no leaks)h) Correct chemical stock availablei) Injection points x 2 installed and testedj) Sample points x 8 installed and testedk) Confirm flow control valve location & who is operating SCADAl) Confirm isolation valve locations & operatorm) Flow meter reading available and tested at injection point 1n) Flow meter reading available and tested at injection point 2 (and on SCADA)o) Chlorine & pH test meter (check range and dilution procedure)p) Communications method between staff off site confirmed( UHF radios and
mobile phones)2. Chlorine injection point 1 work flow plan
a) Set up trailer at injection location #1b) Carry out pre start checks Hypo, Power, Safety equip, Temp fencingc) Establish agreed flow rate as per Disinfection Calculatord) Establish contact with Bonny Hills STP to monitor inflow & lagoon level
(maintain communication with STP operator)e) When flow rate is stable start dosing at agreed dose.f) Monitor dose and residual at 30min intervals or more frequent if flow or dose
rate deviate from target (record on log)g) Sample at SATM D1 at calculated volume to that location to track progress
(record in log sheet)h) When target volume and time have been met take a sample at SATM D2 sample
point to confirm chlorine concentration is at the target.i) When confirmation of the above shutdown flow and dosing then relocate to
injection point #2j) Inform Bonny Hills STP that flow has stopped for location change
3. Chlorine injection point 2 work flow plana) Set up trailer at injection location #2 for safety shower and eye washb) Carry out pre start checks Hypo, Power, Safety equip, Temp fencingc) Establish agreed flow rate as per Disinfection Calculatord) Establish contact with Bonny Hills STP to monitor inflow & lagoon level
(maintain communications with STP operator)

11th Annual WIOA NSW Water Industry Operations Conference & Exhibition Page No. 64EPIC – Exhibition Park in Canberra, 29 & 30 March, 2017
e) When flow rate is stable start dosing at agreed dose.f) Monitor dose and residual at 30min intervals or more frequent if flow or dose
rate deviate from target (record on log)g) Sample at SATM D3, 4, 5, 6, 7 & 8 at calculated volume to that location to track
progress (record in log sheet)h) When target volume and time have been met take a sample at SATM D2 sample
point to confirm chlorine concentration is at the target.i) When confirmation of the above shutdown water flow and dosingj) Inform Bonny Hills STP that flow has stopped for contact time
4. Sample Super chlorinated at sample locations 1, 2, 3, 4, 5, 6, 7 & 8a) Carry out chlorine testing at each of the above locations to determine chlorine
demand during the contact period (if <50% demand from initial sample at alllocations then step #1 is a pass)
5. Purge out super chlorinateda) Establish agreed flow rate & contact with Bonny Hills STP to monitor inflow &
lagoon level (maintain communications with STP operator)b) Sample at locations 3, 4, 5, 6, 7 & 8 at calculated volume to that location to track
progress of purge (record in log sheet)c) Once target volume and time have been met for purge and super chlorinated
water has been purged from the system isolate main for stand durationd) Inform Bonny Hills STP that flow has stopped
6. Collect samplesa) Collect 8 Bacto samples SATM D1, 2, 3, 4, 5, 6, 7 & 8 following sampling
procedureb) Deliver to lab
7. Reviewa) Carry out a review of the process and update for next timeb) Review water volume in STP lagoons and consider treatment options required to
reduce levels so that re-run can be carried out if required8. Re-run
a) Carry out re-run if sample failure occursb) Review method prior to re-run to identify if procedure was the cause of failure
3.0 CONCLUSION
All subsequent monitoring samples following disinfection passed laboratory testing andthe main was put into service. Micro bubbles of dissolved air were entrained in the newsection of main when full flow was applied from Port Dam. This caused false turbidityreadings in the early weeks of operation. Extensive monitoring was carried out and nocustomer complaints were received.
The project required extensive communication between all groups within the WaterSection including planners, water treatment operators, process/ head works engineersand construction crews. Detailed planning and outstanding teamwork by all involvedensured the task was completed successfully.
4.0 ACKNOWLEDGEMENTS
Many thanks to the PMHC Water Process and Construction teams for their dedication,cooperation and teamwork during these works.

11th Annual WIOA NSW Water Industry Operations Conference & Exhibition Page No. 65EPIC – Exhibition Park in Canberra, 29 & 30 March, 2017
LEARNINGS FROM DAMAGED CHLORINE VALVESAND EXAMPLES OF BEST PRACTICES
Paper Presented by:
Dmitri Lobachevsky
Author:
Dmitri Lobachevsky, Lead Mechanical Engineer,
Ixom
11th Annual WIOANSW Water Industry Operations Conference and Exhibition
EPIC – Exhibition Park in Canberra,29 & 30 March, 2017

11th Annual WIOA NSW Water Industry Operations Conference & Exhibition Page No. 66EPIC – Exhibition Park in Canberra, 29 & 30 March, 2017
LEARNINGS FROM DAMAGED CHLORINE VALVES ANDEXAMPLES OF BEST PRACTICES
Dmitri Lobachevsky, Lead Mechanical Engineer, Ixom
ABSTRACT
In early 2016 there have been a number of Chlorine Institute valves that developed a crack andreported by Australian customers. These valves are used on chlorine cylinders and drums. Thelocation of cracks was consistently above the valve seat which made it possible to isolate theleak path by closing the valves. In total there were 5 Chlorine Institute valves that failed, whichmakes up 0.1% of annual container valve consumption by Ixom. An investigation wasperformed to identify the mode of failure. It was performed by a team of Ixom Engineers withassistance from ALS Industrial.
Valve crack investigation consisted of heat exposure test, a visual examination, dye-penetrantinspection, chemical analysis, hardness testing, microstructural evaluation and scanningelectron microscopy (SEM) with energy dispersive analysis of X-rays (EDX). The results of theinvestigation indicated that the mode of failure was a combination of fabrication flaw andcertain conditions of service environment.
1.0 INTRODUCTION
Chlorine Institute (CI) valves are commonly used in ChlorAlkali industry for plantpurge points and transportable containers. In Ixom over 99% of CI valves are installedon chlorine drums and cylinders.
The design aspects of the CI valves are guided by Chlorine Institute Pamphlet 17 whichare then adopted by the manufacturer. These valves consist of several main components;including the valve body, spindle, gland packing and gland nut, see Figure 1.
Figure1: Chlorine Institute Valve Layout
The material selection for the components follows the recommendations of the ChlorineInstitute Pamphlet. In particular, the valve body material is Aluminium Silicon Bronze(ASB) alloy C64210 to ASTM B 124-04. This material provides excellent corrosionresistance properties when used in chlorine duty.
In 2008, Ixom has adopted CI valves in configuration mentioned above. In early 2012there has been several cracks detected in a batch of valves. This was quicklyinvestigated and addressed by the supplier and the manufacturer of chlorine valves. Atthat time the cracks were attributed to poor temperature control during valve bodyforging process. To address the issues the process was automated. Until 2016 there hasbeen no more crack failures of the CI valves.

11th Annual WIOA NSW Water Industry Operations Conference & Exhibition Page No. 67EPIC – Exhibition Park in Canberra, 29 & 30 March, 2017
The issue with cracks in the valve bodies reoccurred in early 2016. Initially, there were 3chlorine cylinders identified with visible cracks in valve body. Several months later adrum was identified with both valves exhibiting cracks. In all of these cases of valvefailure there was only a small weep that, due to crack position, was possible to beisolated. This makes up 0.1% of the CI valves purchased and used by Ixom annually.Investigation was triggered to identify root cause of the cracks in valved bodies.
Cracks in chlorine container valves are rare. A similar investigation has taken place in2004 in USA. A number of valves from a reputable manufacturer began to exhibit valvebody cracks at gland packing area. This resulted in a recall of a number of specific valvebatched and a requirement to inspect valve that were manufactured in 2004 for cracks.The incident was followed by Chlorine Institute Notice to all chlorine users with a set ofrecommendations.
2.0 DISCUSSION
2.1 Valve Cracks and Initial Investigation
In March 2016 there were 3 cylinders returned from customers that were quarantined forinspection. These cylinders developed a minor leak from the chlorine valves. Uponclose inspection it was identified that the crack has developed in both cases at thethreaded section where the gland packing is located. The valves were traced back to thesame batch BS 08/11. The total number of valves in this batch was 1250, making it0.24% failed cases. Fabrication data sheets (including material certificates) for this batchof valves indicated compliance with the valve purchasing specification. Initialinvestigation has shown that the crack location and appearance were very similar towhat the cracks in CI valve were experienced in 2004 in USA. It was decided to adoptthe same recommendation as in 2004 by USA valve consumers provided by ChlorineInstitute: perform non-destructive testing in the form of dye penetrant on all the valvesfrom BS08/11 batch to release them for service.
Figure 2: Cracked valve from BS 08/11 batch
In May 2016 a customer has reported chlorine drum that has shown a minor leak whenconnected and both valves opened. Cracks were suspected by the customer so specialvalve clamps were design and supplied to ensure the valve cracks didn’t propagateduring transport. This chlorine drum was returned and inspected. It was discovered thatboth valves had a crack in the valve body right above the valve seat. The valves weretraced back to the same batch CL 10/12. The total number of valves in this batch was750, making it 0.27% failed cases. Like with CI valves from cylinders, inspection of theoriginal fabrication data sheets didn’t reveal any deviations from the valve purchasingspecification. Same recommendation to perform dye penetrant crack detection testingwas applied to CL 10/12 batch of valves before returning them to service.

11th Annual WIOA NSW Water Industry Operations Conference & Exhibition Page No. 68EPIC – Exhibition Park in Canberra, 29 & 30 March, 2017
2.2 Valve Heat Exposure Test
As part of the investigation process of cylinder valves it has been discovered that thePTFE packing is heavily extruded in the cracked area of the valve. The extrusion of thepacking material was contributed to high gland nut torque and the ambient heat that thevalves were subjected to during service. The expansion and subsequent extrusion of thepacking may have applied additional pressure in the gland area which resulted in acrack. This process can potentially be accelerated by applying aqua ammonia to thevalve body.
Figure 4: Gland packing extrusion in BS 08/11 after test
It was decided to carry out a heat test which consisted of:1. Valves from BS 08/11 batch2. New valves from B2 12/12 batch3. Valves with applied gland nut torque values from 34Nm to 130Nm (test #1)4. Valves with re-tightened gland nut when hot to 34Nm to 130Nm (test #2)5. Applying aqua ammonia to valves from test #1 (test #3)
During each test the valves were left in an oven at a temperature of 67oC for 7 daysbefore being inspected for cracks. The test results are shown in Table 1.
Table 1: Heat Exposure Test
Heat Exposure TestValve Batch
BS08/11
B212/12
Test #1Gland
NutTorque
34Nm √ √
70Nm √ √
105Nm √ √
130Nm √ √
Test #2Hot re-torque
GlandNut
Torque
34Nm √ √
70Nm √ √
105Nm √ √
130Nm √ √
Test #3Ammoniaexposure
GlandNut
Torque
34Nm √ √
70Nm √ √
105Nm √ √
130Nm √ √
Note: √ indicates that test did not produce a crack in a valve x indicates that test did produce a crack in a valve

11th Annual WIOA NSW Water Industry Operations Conference & Exhibition Page No. 69EPIC – Exhibition Park in Canberra, 29 & 30 March, 2017
As can be seen from Table 1, none of the test was severe enough to produce a crack inthe valve body. Valves were disassembled and internal components investigated. It wasnoted that the PTFE gland packing had severely extruded, refer to Figure4. Thishowever did not manage to cause the gland area to overstress and crack. The achievedresult demonstrates that the cause of crack failure was not directly associated with glandnut being over-torqued and/or exposed to high ambient temperatures. These howevercan be a contributor if other fabrication aspects aren’t followed as the over-torquecreates unnecessary stress in the gland packing area of the valve.
2.3 Detailed Valve Investigation
Damaged valves from chlorine cylinders and a drum were sent to ALS for analysis. Thescope included a visual examination, dye-penetrant inspection, chemical analysis,hardness testing, microstructural evaluation and scanning electron microscopy (SEM)with energy dispersive analysis of X-rays (EDX). Finding from material testing werevery similar amongst the tested cracked valves from chlorine drums and cylinders.
In examining a defective cylinder valve, it exhibited a longitudinal crack at the threadedspindle end of the valve. The crack was considered to be the result of a mixed modefailure which consisted of intergranular and transgranular fracture. It was consideredlikely that several defects, such as laps and also oxide related inclusions were createdduring the forging stage of manufacture. Although cracking was not through thickness atinstallation (due to no observable leaks), it was also considered likely that the crevice-like features formed by the manufacturing defect created ideal nucleation site for asecondary failure mechanism to initiate. Further, exposure to ammonia (during leaktesting), in the presence of moisture may have diffused via capillary action into thecrevice sites initiating a stress corrosion cracking (SCC) mechanism, as noted by thepresence of widespread transgranular and intergranular cracks.
Figure 5: Magnification view of the intergranular and transgranular cracking.(Un-etched)
The nature of the defective valves from chlorine drum appeared to be very similar towhat was discovered with valves from chlorine cylinder.
Valves appeared to have failed (leaked) as the result of a multi-stage crackingmechanism. The multi-stage mechanism predominantly consisted of branchedintergranular cracking with some transgranular cracking. The nature of this cracking wasconsidered to be indicative of a stress corrosion cracking mechanism which wouldtypically be associated with either ammonia or some other nitrogenous complex. Inaddition to this, some de-alloying (copper rich) features were also identified andconsidered to be the result of a secondary corrosion mechanism, likely to be attributed tode-aluminification in the presence of chlorine. The SCC and secondary de-alloyingmechanisms also appeared to have initiated at a surface breaking defect which wasconsidered to be related to forging and oxide filled defects.

11th Annual WIOA NSW Water Industry Operations Conference & Exhibition Page No. 70EPIC – Exhibition Park in Canberra, 29 & 30 March, 2017
In all investigated samples there was evidence of oxide and what appeared to beentrapped scale, either from the forging process or impurities associated with theoriginal cast slug, were considered to be a contributing factor toward failure. In additionto this, microstructural evaluations conducted opposite and away from the crack zonerevealed the presence of lap-like features and further evidence of globular oxide fillednetworks. The presence these features away from the crack zone suggested that thesewere likely to be associated with manufacturing. The transgranular nature of the some ofthe defects could also indicate the beginnings of a secondary corrosion mechanism.
In the case of cylinder valves, the chemical analysis results were not consistent with thatexpected for ASTM B283 grade C64210 aluminium bronze. The silicon content of1.17wt% was below the minimum requirements specified in the range of 1.5-2.0wt%.This was not consistent with material certificates that were provided with the batch ofvalves (BS2 08/11) to Ixom. Silicon has an effect of material fluidity and shrinkageduring casting. The low contents of silicon may have contributed to the surface defectsexamined during the investigation.
In the case of drum valves, the microstructure exhibited evidence of a secondary phasewhich was considered to be unusual, based on the nominal aluminium content of<7.0wt%. The presence of this phase was likely to be present due to casting relatedchemical segregation which has resulted in localised regions within the core structureexhibiting higher than desired aluminium contents. This would then give rise to thepossibility that an undesirable gamma phase structure may have formed, dependingtemperature and cooling rates which may reduce the overall corrosion resistance. Aconsequence of this would be a material that is more susceptible to an environmentwhich consists of ammoniacal complexes and chlorine.
2.4 Valve Exposure to Aqueous Ammonia
Investigation of valve cracks in 2004 USA has highlighted the danger of exposingaluminium-silicon-bronze body of the CI valve to aqueous ammonia. Although it wasnot directly contributed to the failure of the valves, as a result, Chlorine Institute hasprovided clear guidelines regarding testing leaks with ammonia. As it states in Pamphlet155, clause 4.3.1:
“When a leak is suspected, it is recommended that ammonia vapours be used to find thesource. When ammonia vapour is directed at a leak, a white cloud will form. Toproduce ammonia vapour, a plastic squeeze bottle containing commercial, 26 degreeBaume or stronger, aqua ammonia (ammonium hydroxide solution) should be used. Aweaker solution such as household ammonia may not be concentrated enough to detectminor leaks. If a wash bottle is used, the dip tube inside the bottle should be cut off sothat squeezing the bottle directs only the vapour, and not liquid, from the nozzle. Toprevent corrosion, liquid aqua ammonia should not come into contact with any metalparts. “
During Ixom investigation, it has been discovered that the practice of testing chlorineconnections for leaks with aqueous ammonia is present on some sites. In particular, ithas been noted that this practice is common in Fiji. It has also been identified that atsome point prior to failure, the investigated chlorine cylinders and drums have beendelivered to Fiji. As stated in section 2.3, the valves exhibited initial forging defects thatprovided crevice creating ideal nucleation sites.

11th Annual WIOA NSW Water Industry Operations Conference & Exhibition Page No. 71EPIC – Exhibition Park in Canberra, 29 & 30 March, 2017
When these sites trapped and accumulated aqueous ammonia it has triggered SCCresulting in a crack in the prestressed areas of the valve.
3.0 CONCLUSION
During Ixom’s investigation of multiple chlorine valves with cracks, it has beendiscovered that:
1. Over-tensioning gland nut will create additional stress in the gland packing areaand subsequently deform PTFE packing rings by extruding them past the glandfollower.
2. The cracks demonstrated mixed mode of failure which consisted of intergranularand transgranular fracture.
3. There was evidence of initial forging defects that have formed crevices on thesurface of the valve body.
4. Surface crevices created ideal deposit sites for aqueous ammonia. This hasinitiated stress corrosion cracking mechanism.
5. Inconsistent valve body material, low silicon content in tested cylinder valvesand non-uniform contents of aluminium in drum valves
6. It was discovered that some customers apply aqueous ammonia when testingchlorine connections for leaks.
As a result of this investigation, an alternative supplier (Tekno Valves) was identifiedfor CI valves. Tekno Valves are a member of Chlorine Institute and participated in theinvestigation with valve body cracks. They have demonstrated understanding of theproblem and suitable controls to avoid them in their production facility. As far as weknow, Tekno Valves has no track record of product that has failed by developing a crackin the valve body.
4.0 ACKNOWLEDGEMENTS
The completion of this paper could not be possible without the assistance fromcolleagues at Ixom ChlorAlkali team. Their contributions is acknowledged and sincerelyappreciated. Special mention to:
Mr. Rohit Behani (Senior Executive Manager, Tekno Valves) for providing informationof Sherwood valves investigation from 2004 USA.
Mr. Matthew J Hogan (Senior Metallurgical Engineer, ALS) for material analysis workand reports during the investigation of valve body cracks.
5.0 REFERENCES
IXOM Heat Exposure Test Report, Dmitri Lobachevsky, 16th March 2016ALS Metallurgical Failure Analysis Report 31295/1, Matthew J Hogan, 4th April 2016ALS Material Evaluation Report 32935/1, Matthew J Hogan, 24th May 2016ALS Metallurgical Failure Analysis Report 35082/1, Matthew J Hogan, 18th August 2016CI Pamphlet 17, Packaging Plant Safety and Operational Guidelines, Edition 4CI Pamphlet 155, Water and Wastewater Operators Chlorine Handbook, Edition 2Sherwood Chlorine Valve Safety Notice, Sherwood Harsco, 15th September 2005Aluminium-Silicon Alloys, http://www.totalmateria.com/Article80.htm, August 2003

11th Annual WIOA NSW Water Industry Operations Conference & Exhibition Page No. 72EPIC – Exhibition Park in Canberra, 29 & 30 March, 2017
Winner of the Best Paper Overall at the79th Annual WIOA Victorian Water Industry Operations Conference,
Bendigo, 2016
INVESTIGATING THE BENEFIT OF UTILISING FISHIN SEWAGE TREATMENT
Paper Presented by:
Ben Pohlner
Author:
Ben Pohlner, Manager Aquaculture,
Wannon Water
11th Annual WIOANSW Water Industry Operations Conference and Exhibition
EPIC – Exhibition Park in Canberra,29 & 30 March, 2017

11th Annual WIOA NSW Water Industry Operations Conference & Exhibition Page No. 73EPIC – Exhibition Park in Canberra, 29 & 30 March, 2017
INVESTIGATING THE BENEFIT OF UTILISING FISH INSEWAGE TREATMENT
Ben Pohlner, Manager Aquaculture, Wannon Region Water Corporation
ABSTRACT
Wannnon Water has been undertaking a research and development project to determine theimpact of fish on the accumulation of sludge in lagoon based sewage treatment plants. Trialshave been underway for 7 years in partnership with Deakin University. Tank trials usingprimary effluent show fish can reduce the total volume of sludge up to 46% over 70 days. Fullscale trials are now underway at Hamilton and Port Campbell Water Reclamation Plants(WRP’s) to quantify the impact of fish in primary lagoon systems. This paper gives an outlineof the research undertaken, what we currently know, and the potential for this innovativetechnology in the Water Industry.
1.0 INTRODUCTION
De-sludging sewage treatment lagoons is a costly and messy process, and can be alengthy disruption to the operation of the sewage treatment facility. Reducing thefrequency of de-sludging has the potential to lead to significant OPEX savings andpotentially lower greenhouse emissions.
Wannon Water (in conjunction with Deakin University) have been trialling the use offish as a method of sludge removal in lagoon based sewage treatment plants since 2009,and are now in the process of undertaking full scale trials in the Hamilton and PortCampbell sewage treatment facilities. This paper details the work undertaken to date onthe use of fish to assist in the remediation of sludge, including the potential savings tothe water industry.
Wannon Water regard this research as significant for the water industry as a whole.Subsequently, this paper provides all relevant outcomes of aquaculture research to dateto inform the water industry. Wannon Water are seeking interested water utilities to helpcomplete the research and implement this technology.
2.0 DISCUSSION
Developing new technology can take time, and understanding the potential of fish toimprove sewage treatment processes is no different. The following is a brief history ofthe research undertaken by Wannon Water and others.
2.1 Getting Started: 2008-2010
Wannon Water initially became interested in the concept of using fish to improvesewage treatment through earlier work undertaken by the Victorian Department ofPrimary Industries. Their early work to demonstrate possible aquaculture production inwastewater lagoons concluded that:
Key drivers for development of integrated aquaculture use of recycledwastewater exist at a regional, state and federal level.

11th Annual WIOA NSW Water Industry Operations Conference & Exhibition Page No. 74EPIC – Exhibition Park in Canberra, 29 & 30 March, 2017
Key stakeholders for aquaculture use of recycled wastewater in Victoria includethe federal government, Victorian state government, and regional waterauthorities.
Major scientific and technical information gaps exist in relation to aquacultureuse of recycled wastewater
Following a review of the DPI work in 2008, Wannon Water invited Deakin Universityto investigate the concept of aquaculture in sewage lagoons, and the organisationsjointly developed a “Road Map” outlining the research required to get from concept tocommercialisation. This Road Map has been extremely valuable and has enabledWannon Water to take a strategic approach to R&D for integrated aquaculture insewerage treatment lagoons.
Step 1 in the Road Map was to undertake a review of Wannon Water facilities todetermine their suitability for aquaculture and to determine the location place toundertake research. Hamilton (Victoria) was chosen as the preferred site to undertakeaquaculture research as the relevant licences and permits were able to be obtained, andthe effluent quality was deemed suitable for the purpose.
A research facility was constructed on the banks of the Hamilton WRP primary lagoonand trials were set up to assess fish growth, sludge and water quality.
2.2 Establishing the Science: 2010 - 2013
Wannon Water has supported a number of Honour student projects at Deakin Universityto establish the basic science of using fish to improve the sewerage treatment process.
The initial project was to determine the impact of Goldfish (Carassius auratus) cultureon Total Nitrogen (TN) and Total Phosphorous (TP) in primary effluent lagoon water.The trial also examined Goldfish survival at different stocking densities, and fish fleshwas tested for accumulation of pesticides and heavy metals.
The early results showed very little impact on water quality including TN & TPconcentration over the duration of the trial. No accumulation of heavy metals in fishflesh was detected. An extension of this trial also showed no accumulation of pesticides.
Fish were trialled at 3 stocking densities with high survival in all categories. Growthwas also assessed and was directly correlated with stocking density – the lower stockingdensities showed much faster growth.
One major point of significance was noted in this trial. Approximately 50 – 100mm ofsludge accumulation was observed in the control tanks at the conclusion of the trial,however almost zero sludge accumulation was noted in the tubs containing fish.
This discovery was the inception of further research focusing on the potential for fish toreduce sludge volumes in sewage lagoons.
In an effort to identify a suitable native fish species for sludge remediation, a secondHonours project was undertaken to assess a range of potential fish species including twospecies of Mullet, Silver Perch and Tench.

11th Annual WIOA NSW Water Industry Operations Conference & Exhibition Page No. 75EPIC – Exhibition Park in Canberra, 29 & 30 March, 2017
Figure 1: Control tank – No fishheavy sludge accumulation
Figure 2: Tank with goldfishzero sludge accumulation
These species were assessed for survival and their ability to remove sludge from the trialtanks. The results showed that there were no native species suitable for sludgeremediation and that Goldfish were the best performers in the trial. These new trials alsofound a significant decrease in accumulated sludge in tanks with goldfish, confirmingthe earlier results.
Figure 3: Goldfish at the time ofstocking - trial tanks
Figure 4: Goldfish after 5 months inprimary effluent
In 2012, a third Honours trial assessed the impact of Goldfish on a set volume of sludgein a static tank with no inflow or outflow. The trial used sludge and water directly fromthe Hamilton primary effluent lagoon.
Results over 70 days showed fish survival of 89 – 93% and rapid early growth. Alltreatments containing fish displayed significant decreases in sludge and treatmentswithout fish showed very minor decreases that were not significant.
A Probiotic was also included in these trials as a comparison. The probiotic waspromoted as being able to significantly reduce sludge volume by enhancing the naturalbacteria populations in a sewage treatment system, and thereby significantly contributeto the decomposition of sludge.
Our results showed an average of 13.5% reduction in sludge volume when probiotic wasused alone compared to Goldfish which recorded an average of 32.4% reduction insludge volume. Of most interest was the combination of fish and probiotics whichrecorded from 37.6% to 46.2% reduction in sludge volume.

11th Annual WIOA NSW Water Industry Operations Conference & Exhibition Page No. 76EPIC – Exhibition Park in Canberra, 29 & 30 March, 2017
Figure 5: Sludge reduction over a 70 day period in static trial tanks
This trial demonstrated that fish are very effective at removing solids; however utilisingfish in combination with probiotics appears to be a more effective technique for sludgeremediation.
2.3 Growing Our Own Fish: 2013 - 2015
Based on the trial results, Wannon Water secured an unused commercial aquaculturefacility in Warrnambool (Victoria) capable of producing up to 2M fry (young fish)annually. This facility is now producing goldfish specifically reared for sewage sludgetreatment.
Wannon Water also invested in the development of a Juvenile Fish Production Facilityin Hamilton. This involved the conversion of an obsolete biosolids drying bed facilitycomprising 16 cells. This facility is currently used to grow 15mm fry from theWarrnambool hatchery up to 50mm in size ready for stocking into operational sewagetreatment plants.
2.4 Finding The Ultimate Sludge Sucker - Goldfish x Carp Hybrids
Common carp (Cyprinus carpio) are seen as superior to goldfish for the purpose ofsludge remediation as they grow faster, grow bigger, and are able to tolerate extremelyharsh water quality environments. Carp are classified as noxious and invasive inVictoria, meaning the biosecurity requirements for culturing carp would be so restrictivethat any proposal to use them in sewage treatment could not practically proceed.
During 2013 Wannon Water investigated Goldfish x Carp hybrids which are culturedoverseas as a food fish. This fish (when crossed correctly) has significant advantagesover both carp and goldfish in that it grows faster and to a much larger size (15kg+). Itis very hardy and able to tolerate very poor water quality conditions (much tougher thana both carp and goldfish). It also has enhanced disease resistance and it is almoststerile.

11th Annual WIOA NSW Water Industry Operations Conference & Exhibition Page No. 77EPIC – Exhibition Park in Canberra, 29 & 30 March, 2017
Deakin University undertook a literature review into the fertility status of Goldfish xCarp hybrids. This review found that male hybrids are sterile, however there is a slightchance that female hybrids may be fertile. It is not known if hybrids could develop aself-sustaining population in the wild if inadvertently released.
In 2015 Wannon Water received the appropriate DPI licences and commenced aprogram to breed goldfish x carp hybrids in Warrnambool to develop hatchery methods(in conjunction with a commercial hybrid hatchery in America). As a result of thiswork, successful spawning, larval rearing, and grow out of hybrids was achieved.Further work is now being undertaken to demonstrate acceptable levels of sterility usingdifferent larval rearing techniques in an effort to gain DPI approval to stock this fish inprimary effluent lagoons.
2.5 Confirming This Will Work Operationally - Hamilton and Port Campbell
Initial lagoon stocking using goldfish was undertaken at the Hamilton WRP in 2015/16to investigate the impact on sludge on a full lagoon scale. Approximately 150,000 fishwere raised by Wannon Water and stocked into the primary lagoon. The assessment oftheir impact is ongoing, with sludge surveys using novel sonar technology undertaken at6 monthly intervals to determine impact on sludge volumes.
A more structured research trial was also recently implemented at the Port CampbellWRP. Port Campbell has a twin primary lagoon system, with influent distributed evenlybetween the two lagoons. One Primary lagoon at Port Campbell was stocked withgoldfish to enable a direct comparison between the primary lagoons and the impact offish on sludge volumes. Monitoring of fish and water quality is undertaken on a weeklybasis, and sludge volume monitoring is undertaken on a 6 monthly basis. The trial willalso assess overall treatment plant efficiency and any implications for EPA licencing.
To date this trial is going well, with sampled fish showing good growth and nosymptoms of disease or stress. Fish are able to tolerate the primary effluent lagoonenvironment and have no impact on the daily operation of the facility. This trial is duefor completion in mid-2017.
2.6 Potential for the Australian Water Industry
Wannon Water has estimated the financial benefits of using fish to reduce the rate ofsludge accumulation within suitable water reclamation plants in South West Victoria.Whilst these estimates are encouraging, the potential is limited by the size and numberof the primary effluent lagoons in the Wannon Water service area.
Extrapolating these estimates to an industry wide figure for Victoria indicates that thetechnology has the potential to reduce operating costs in the sector by many millions ofdollars. Completing the current research phase of the project at Wannon Water is vital toproperly quantify this potential.
3.0 CONCLUSION
Wannon Water’s aquaculture research program has demonstrated that the use of fish toslow the rate of sludge accumulation in lagoon based primary effluent lagoons ispossible and significant.

11th Annual WIOA NSW Water Industry Operations Conference & Exhibition Page No. 78EPIC – Exhibition Park in Canberra, 29 & 30 March, 2017
Tank trials show that fish actively reduce the rate of sludge deposition in primaryeffluent lagoons. Wannon Water is now undertaking full scale trials at Port Campbelland Hamilton to confirm the concept will work operationally.
Wannon Water believes this research is significant to the Australian water industry, andis seeking interested water utilities to help finalise the research and implement thistechnology.
4.0 ACKNOWLEDGEMENTS
There are many people to thank who have contributed to this research. This includes theWannon Water Aquaculture Team, the Wannon Water Board and Management,Wannon Water Treatment Operators, Deakin University Researchers, Lecturers, andstudents.
5.0 REFERENCES
Gooley, G. J & Gavine, F. M & Olsen, L & Victoria. Dept. of Primary Industries 2006,Biological systems to improve quality and productivity of recycled urban wastewater: a casestudy from our rural landscapes sub-project 1.3, Dept. of Primary Industries, Melbourne.

11th Annual WIOA NSW Water Industry Operations Conference & Exhibition Page No. 79EPIC – Exhibition Park in Canberra, 29 & 30 March, 2017
CURLEWIS PUMP STATION CHLORINATIONUPGRADE
Paper Presented by:
Brock Stone
Author:
Brock Stone, Water Quality Officer,
Gunnedah Shire Council
11th Annual WIOANSW Water Industry Operations Conference and Exhibition
EPIC – Exhibition Park in Canberra,29 & 30 March, 2017

11th Annual WIOA NSW Water Industry Operations Conference & Exhibition Page No. 80EPIC – Exhibition Park in Canberra, 29 & 30 March, 2017
CURLEWIS PUMP STATION CHLORINATION UPGRADE
Brock Stone, Water Quality Officer, Gunnedah Shire Council
ABSTRACT
In 2016, Gunnedah Shire Council planned a major upgrade to the Curlewis Pump Station andchlorination site.
We had to take into consideration that this site is the only water source for Curlewis so anuninterrupted supply would have to be maintained during the build. These bores will more thanlikely be discontinued in the future due to the hardness of the ground water and a proposedpipeline extending to the village from Gunnedah. The pipeline will be a long term project as itwill require pipeline over 15 km in order to provide the village with Quality water however weneeded to fix the current problem of the dilapidated building and aging chlorination systemregardless of future plans. We also had to recognise and overcome the limited budget that wasgiven for this project.
1.0 INTRODUCTION
Curlewis lies on the Kamilaroi Highway, 17kms South of Gunnedah. Water for thevillage is pumped from the Liverpool Plains Bore field located approximately 5km fromthe town. I mentioned before the hardness of the water. If you were to ask anyone inCurlewis how their water tastes the standard reply would most likely be “Don’t know,don’t drink it”. The hardness is some two and a half times the Guideline Value of200mg/L and high in Sodium and Chloride and in the range specified by the WorldHealth Organisation as “unpalatable”. Drinking water mostly comes from private rainwater storage tanks. This inherently creates health risks through lack of maintenance ofrainwater collection systems, water age issues and lack of disinfection in the tanksupply. As mentioned, there is a future proposal for a water pipeline from Gunnedah toalleviate some of these issues.
The problem was the state of disrepair of the dosing site and the building. The buildingwas established in 1970, made of brick and mortar with a tin roof. It was a sturdyconstruction at the time and it kept the weather out. With the introduction ofdisinfection in 2004, extra funds were not available to support an upgrade to the assetand so year after year the project was put on the back burner as other concerns weredealt with.
Gunnedah Shire Council employed one Water Quality Officer at this point in time, GregEllis, affectionately known as ‘Slim’. He had to cover 16 bore sites, 6 dose sites, 12reservoirs, 31 telemetry sites over 4 townships spanning a distance of some 250kms.Effective time management was a fantasy, and as it was, a lot of jobs were put aside aspriority was given to break downs, DAL sampling and Chlorine Monitoring.
In 2014 I was a Water Meter Reader, but also being trained in Water Quality so I wouldbe ready to perform relief duties for Slim as they arose. I was first made aware of theissues at Curlewis during a training day with Jill Busch from Aqualift. Jill had beenextremely helpful to me as I had limited knowledge about the Water Quality role andwith the new Safe Drinking Water Guidelines that Gunnedah Shire Council (GSC) hadadopted both Slim and I were fast learning that this thing called ‘Water Quality’ wasgoing to eclipse all previous understanding of our roles within council.

11th Annual WIOA NSW Water Industry Operations Conference & Exhibition Page No. 81EPIC – Exhibition Park in Canberra, 29 & 30 March, 2017
Jill was taking me through the various issues of the Curlewis plant and making a fewdiscoveries that she thought would have to be preserved for posterity. As her camerastarted clicking away, Jill could be heard saying “Do you mind? I just have to get aphoto of that!”.
Some of the issues discussed included: Corrosion to the block work and slab Rusting supports to the bore perch Leaks to the bunding under the hypo tank Aging dose pumps and lines with rusted and corroded support brackets General housekeeping and maintenance
With Jill’s help, patience and guidance we were able to get on top of the basics and wereprovided with options and recommendations for an upgrade to the site.
August 2015 was a tough month. Slim passed away in a tragic car accident whilecoming back from Mullaley after completing DAL samples that morning, he was outdoing some field work and never made it home. I was now thrust into a position I didn’texpect to be in, and the next few months would prove to be one of those ‘sink or swim’scenarios as one thing after another would either break down, stop working or just getstruck by lightning as I was adjusting to this new role without my mentor. My respectfor Slim only grew during this time considering what he was able to accomplish day inand day out.
It wasn’t until the summer of 2015 when Curlewis Pump Station suffered one of thoselightning strikes which fried one of the bore pump cables, one of the dose pumps,different boards in the telemetry cabinet and the electrical switchboard. We werepromptly motivated to act on some of the recommendations Jill had previously providedas we had to rebuild so much at the site after the strike.
Figure 1: Curlewis Pump Station and Dose Site 2014

11th Annual WIOA NSW Water Industry Operations Conference & Exhibition Page No. 82EPIC – Exhibition Park in Canberra, 29 & 30 March, 2017
2.0 DISCUSSION
After much discussion and number crunching concerning the replacement of lightningaffected components, it was decided that we would attempt a complete upgrade duringthis process with the exception of the previously reconditioned bore pumps.
The proposed new plant would get the full treatment up to $85,000.
The upgrade would include: Dose plant; Two new dose pumps; Hypo storage tank; Two new mag flow meters; New electrical switch board and cabinet; and Security fencing around the site.
In addition to this consideration had to be made for the plant to be easily relocatable toaccommodate the plans of the future. We looked into various solutions to the ‘easilyrelocatable’ aspect of the work and realised pretty quickly that a pre-fabricated moduledesigned for dosing was well out of our price range due to the strict budget constraints.Finally after researching and brainstorming ideas we decided a cool room was our bestoption.
2.1 Not Quite a Cool Room
Gunnedah is a small community and we like to buy locally when we’re able. GSCapproached local business owners H & M Refrigeration & Air-conditioning anddiscussed the idea of a small plant for our dose pumps with them. They thought thebuild wouldn’t be a problem and began to design what would become our own versionof a pre-fab Dose Plant. The unit size is 2.4m x 2.4m with a solid skid base that can belifted by crane or forklift. Using the lightweight cool room materials the internal wallsand ceiling are poly vinyl lined and the floor has 2 pack resin coating so that none of thealloy panels could be affected by the Hypo. Ventilation windows were cut into all sidesof the room and designed to keep out weather, vermin and insects and an inclinedcorrugated roof finished off the design. The construction of the building cost just under$20,000.
Table 1: Breakdown costs of Curlewis project
Description Cost
Pre-fab building on skid $ 19,922.73New Dosing Pumps & installation $ 24,244.00Electrical & Switchboard upgrade $ 13,809.09Fence $ 8,337.91Demolition, Labour & plant hire $ 12,662.38Total build cost $78,976.11
2.2 Demolition
The demolition of the old building was challenging for the fact that we still had toprovide disinfected water to the reservoir during the process.
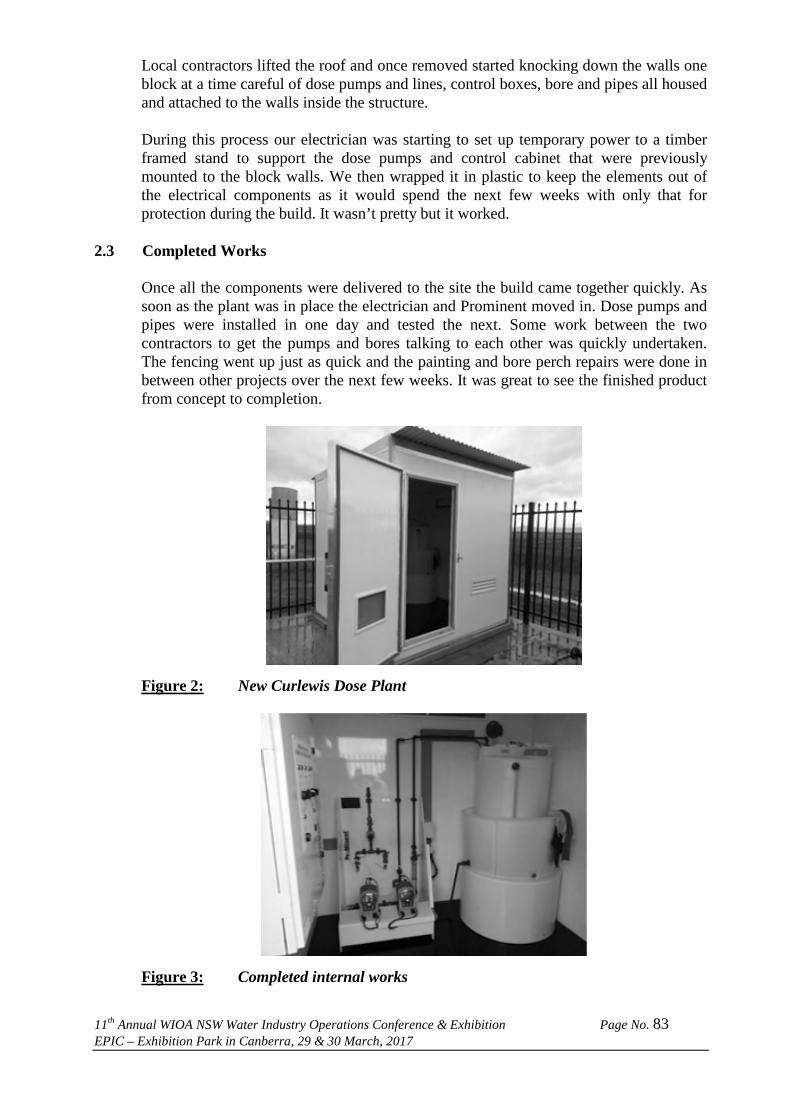
11th Annual WIOA NSW Water Industry Operations Conference & Exhibition Page No. 83EPIC – Exhibition Park in Canberra, 29 & 30 March, 2017
Local contractors lifted the roof and once removed started knocking down the walls oneblock at a time careful of dose pumps and lines, control boxes, bore and pipes all housedand attached to the walls inside the structure.
During this process our electrician was starting to set up temporary power to a timberframed stand to support the dose pumps and control cabinet that were previouslymounted to the block walls. We then wrapped it in plastic to keep the elements out ofthe electrical components as it would spend the next few weeks with only that forprotection during the build. It wasn’t pretty but it worked.
2.3 Completed Works
Once all the components were delivered to the site the build came together quickly. Assoon as the plant was in place the electrician and Prominent moved in. Dose pumps andpipes were installed in one day and tested the next. Some work between the twocontractors to get the pumps and bores talking to each other was quickly undertaken.The fencing went up just as quick and the painting and bore perch repairs were done inbetween other projects over the next few weeks. It was great to see the finished productfrom concept to completion.
Figure 2: New Curlewis Dose Plant
Figure 3: Completed internal works

11th Annual WIOA NSW Water Industry Operations Conference & Exhibition Page No. 84EPIC – Exhibition Park in Canberra, 29 & 30 March, 2017
Figure 4: Completed external works
3.0 CONCLUSION
By thinking outside the box and receiving input from members external to ourorganisation we achieved a result that has met all of our requirements.
We came in under budget, not by much, but with the need to upgrade switchboards,dose pumps and flow meters it increased the build cost considerably. The sharp, cleanand professional looks of the Dose Plant reflects the Gunnedah Shire Council approachto water quality management. We can relocate the plant in the future
The site is now an asset that our organisation can be proud of and in the future it will berelocated to a new site where it will ensure the small community of Curlewis has safedrinking water piped direct from Gunnedah.
This project has shown that you can achieve a lot even if the budget is quite small. Youjust have to keep an open mind when exploring all options.
4.0 ACKNOWLEDGEMENTS
Thanks to Gunnedah Shire Council’s Kevin Sheridan (Manager Water Services) andMick Ludlow (Water Project Officer) for the ongoing support of Water Quality, LesterWatterson (Water Meter Reader/Water Quality Officer) for the great paint job, DougBarr (Water Operator) for his great work with the perch rebuilds.
Appreciation is also extended to H & M Refrigeration and Air-conditioning, ProMinentFluid Controls for the internal fit out and Thomson Electrical Gunnedah for the 24 hoursupport and their ‘we can do it’ attitude.

11th Annual WIOA NSW Water Industry Operations Conference & Exhibition Page No. 85EPIC – Exhibition Park in Canberra, 29 & 30 March, 2017
PORT MACQUARIE STP SLUDGE DEWATERINGOPTIMISATION
Paper Presented by:
Wayne Ducat
Authors:
Wayne Ducat, Sewer Attendant Dewatering Operations,
David King, Team Leader,
Port Macquarie-Hastings Council
11th Annual WIOANSW Water Industry Operations Conference and Exhibition
EPIC – Exhibition Park in Canberra,29 & 30 March, 2017

11th Annual WIOA NSW Water Industry Operations Conference & Exhibition Page No. 86EPIC – Exhibition Park in Canberra, 29 & 30 March, 2017
PORT MACQUARIE STP SLUDGE DEWATERINGOPTIMISATION
David King, Team Leader Port Macquarie-Hastings CouncilWayne Ducat, Sewer Attendant Dewatering Operations Port Macquarie-Hastings Council
ABSTRACT
This paper outlines the trial of blending activated and digested sludge for treatment at our onsiteDewatering system at the Port Macquarie Wastewater Treatment Facility. The strategy wastrialled with a view of implementing permanently as an optimisation opportunity to manage theever increasing sludge volumes.
The trial firstly assessed the compatibility of blended sludge with our existing dewateringsystem in regards to plant operation, chemical dosing and sludge cake moisture content. It willalso convey the viability of permanent implementation into the process.
Dewatering is the process of removing as much water from the bio-solids for easy cost effectivetransportation and disposal off site.
1.0 INTRODUCTION
1.1 Port Macquarie-Hastings Sewerage Schemes
Port Macquarie-Hastings Council operates and maintains five (5) sewerage schemes and
treatment plants throughout the Local Government Area from Dunbogan in the South,
Port Macquarie in the North and to Wauchope in the West.
This paper details the optimisation of one of the processes at Port Macquarie Sewage
Treatment Plant (STP).
1.2 Port Macquarie Sewerage Treatment Plant
Port Macquarie STP is located on the Mid North Coast of NSW and has a design
loading of 52,000 Equivalent Persons (EP) and is currently running at 99% design
loading.
The current average dry weather flow is 13ML/d however Port Macquarie is prone to
heavy rainfall events that can cause a peak of 66ML/d. Council has plans in place to
build new infrastructure in the coming years to meet the rapidly growing demands and
reduce the loading on this plant.
Port Macquarie STP has three (3) extended aeration tanks (EAT) with a capacity of
12,000, 13,500 and 26,500 EP. The plant includes an onsite sludge dewatering plant to
treat activated sludge and lagoons for the storage of Waste Activated Sludge (WAS).
WAS is generally pumped from the EAT’s to the aerated sludge lagoon for immediate
dewatering with excess WAS being sent to the anaerobic sludge lagoons.

11th Annual WIOA NSW Water Industry Operations Conference & Exhibition Page No. 87EPIC – Exhibition Park in Canberra, 29 & 30 March, 2017
Figure 3: Aerial view of the Port Macquarie STP
2.0 DISCUSSION
2.1 Dewatering Process
Port Macquarie STP currently runs a sludge dewatering process consisting of two (2)
Gravity Drainage Decks with the sludge being fed into two (2) Alfa Laval NX4500
centrifuges.
Historically the dewatering plant is run five (5) days a week during normal working
hours processing the Waste Activated Sludge (WAS). Outside of these times the WAS
overflow is directed to two (2) sludge lagoons.
Polymer is dosed as part of the process and the final bio-solid is taken for recycling. The
sludge lagoons were typically dewatered every five years.
In recent years there has been a significant increase in sludge produced at the plant. Thisincrease in sludge volume is largely due to –
1. A change in process i.e. aluminium sulphate dosing has been relocated from theplant outlet to the plant inlet.
2. Population growth.

11th Annual WIOA NSW Water Industry Operations Conference & Exhibition Page No. 88EPIC – Exhibition Park in Canberra, 29 & 30 March, 2017
2.2 Process Optimisation
This increased WAS production has resulted in the anaerobic sludge lagoon dewateringlife span being reduced to from 5 years to 18 months.
This has significantly increased the cost of plant operation. The cost incurred forcontractual dewatering of the digested sludge lagoons exceeds $150,000 each time.
The Plant Operations Team recognised the problem and considered operational changesthat could be implemented to optimise the dewatering process with a view to reducingcosts.
The plans were to trial returning digested sludge from the sludge lagoons to the aeratedsludge lagoon and then blend it together with the activated sludge. This blended sludgecould then be processed in the dewatering plant.
If the trail proved to be successful the digested sludge in the lagoons could be processedon site and therefore eliminate the need to engage contractors to dewater the digestedsludge.
This would result in a significant cost saving for Council.
2.3 Operational Trial Plan
The team formulated a plan for a trail run of the modified process.
1. Set up a temporary pump at the sludge lagoon.2. Trial pumping digested sludge into the aerated sludge lagoon3. Introduce digested sludge directly in to the dewatering process4. Adjust the ratio of digested to activate sludge5. Introduce the blended sludge into the dewatering plant process6. Monitor bio-solid moisture content7. Monitor and adjust Polymer dosing8. Monitor and adjust dewatering process variables
2.4 Implementing the Trial
In consultation with the Process Engineer the decision was made to go ahead with thetrial. The Plant Operations team went ahead and implemented the trial as per the aboveplan.

11th Annual WIOA NSW Water Industry Operations Conference & Exhibition Page No. 89EPIC – Exhibition Park in Canberra, 29 & 30 March, 2017
Table 1: Outline of the trial process
Action Implemented Effect on Process
Temporary pump set up at thesludge lagoon
Transfer digested sludge directly todewatering plant
Transfer digested sludge up to aeratedlagoon.
Introduce 100% digested sludgedirectly into the dewateringprocess
Increase in % feed solids 100% Digested sludge could be
adequately treated at the dewateringplant.
Pump digested sludge into theaerated sludge lagoon
Transfer implemented on a staged basis. Blended sludge introduced to dewatering
plantAdjust the ratio of digested toactivate sludge
Ratio gradually increased to the process Increase in % feed solid
Introduce the blended sludge intothe dewatering plant process
Behavioural characteristics of dewateringplant showed little variation inperformance as the blend was introducedand the ratio increased.
Monitored bio-solid moisturecontent
Samples collected & analysed. Calculated moisture content of bio-solids. Minimal variation in bio- solid produced.
Monitor and adjust Polymerdosing
Polymer dosing remained within normaloperational range.
Monitor and adjust dewateringprocess variables
Flow and plant operational parametersadjusted as required to meet bio-solidproduction targets
The process trial showed that blending the Digested and Activated sludge had noadverse effect on the dewatering process.
2.5 Operational Trial Results
Figure 2: Moisture Content of processed sludge

11th Annual WIOA NSW Water Industry Operations Conference & Exhibition Page No. 90EPIC – Exhibition Park in Canberra, 29 & 30 March, 2017
Figure 3: Polymer dosing
The graphs in Figures 2 &3 display that there is no significant difference in moisturecontent of the treated sludge or in the Polymer dosing required.
Based on the trial results a permanent pumping system was set up on the anaerobicsludge lagoon and the modified process was implemented.
Figure 4: Bio-solids Removal graph
Figure 4 displays the monthly bio-solids removed from the plant over the period of oneyear. It shows a significant increase in tonnage processed since the implementation ofthe sludge handling optimisation program.

11th Annual WIOA NSW Water Industry Operations Conference & Exhibition Page No. 91EPIC – Exhibition Park in Canberra, 29 & 30 March, 2017
3.0 CONCLUSION
The trial that we have undertaken has proven that a blend of digested sludge andactivated sludge has had no negative effect on the existing dewatering process and hasenhanced bio-solids production. Prior to implementing the modified process when oursludge lagoons were full we could not shut down the dewatering of the activated sludge.Therefore the dewatering plant could not be utilised to process the digested sludge fromthe lagoons. To dewater the Sludge lagoons contractors were hired at a cost ofapproximately $150,000 every 18 months. Now with this new strategy utilising ouronsite dewatering system we are always ahead with our sludge lagoon management asthey are constantly being dewatered. The modified dewatering process has now beensuccessfully implemented resulting in a significant cost saving to Council.
4.0 ACKNOWLEDGEMENTS
Many thanks to the PMHC Water Process Technical Officer for assistance in developingthis Paper, and the Port Macquarie STP Process Team for their involvement and effortsthroughout the project.

11th Annual WIOA NSW Water Industry Operations Conference & Exhibition Page No. 92EPIC – Exhibition Park in Canberra, 29 & 30 March, 2017
IMPROVING OPERATIONS THROUGH BETTERPROJECT MANAGEMENT
Paper Presented by:
Jason Ip
Authors:
Austin Morris, Manager Works,Jason Ip, Manager Operations,
Riverina Water County Council
11th Annual WIOANSW Water Industry Operations Conference and Exhibition
EPIC – Exhibition Park in Canberra,29 & 30 March, 2017

11th Annual WIOA NSW Water Industry Operations Conference & Exhibition Page No. 93EPIC – Exhibition Park in Canberra, 29 & 30 March, 2017
IMPROVING OPERATIONS THROUGH BETTER PROJECTMANAGEMENT
Austin Morris, Manager Works, Riverina Water County CouncilJason Ip, Manager Operations, Riverina Water County Council
ABSTRACT
This paper outlines the ways in which projects and operations are linked, and how wateroperators can improve their operations through greater involvement in project management.Projects and operations are often seen as competing objectives that are managed and deliveredin different ways. Projects are viewed as the ‘glamourous’ side of the water industry withnumerous award ceremonies celebrating multi-million dollar projects. Operations is often onlyconsidered when it comes time to analyse an organisation’s performance, with a focus onefficiency and sustainability. Rather than treat projects and operations as two distinct andseparate functions, integrating both functions can improve overall outcomes for water utilities.For example, a change in operation or process may be the focus of a dedicated project, or morecommonly, a finished project can become part of operational management. Integration is notalways recognised, as project management literature often tends to omit the operational phase,even though good operational performance is part of good project management. This hasgreater importance in the government water industry where organisations generally become theowners of the newly delivered project, so a better quality project means lower operational costs.
1.0 INTRODUCTION
Project and Operations are both used in private and public organisations and thedifferences and importance of both will be discussed. Riverina Water County Council(RWCC) is in the process of implementing several large projects including a new depotstore and Water Treatment Plant (WTP). Using examples from the WTP, the influenceof engaging the operator in the project delivery phase will be examined.
2.0 DISCUSSION
Projects differ from day-to-day operations or ‘business as usual’ (BAU) because of theiruniqueness and finite characteristics. BAU incorporates repetitive processes undertakento produce the same service or product which contrasts with the characteristics of aproject (Bentley 2010; Anderson 2009). A major distinction between operations (BAU)and projects, is that the first is ongoing and repetitive while the second is temporary andunique (Dobie 2007).
In government more focus is placed on projects rather than ongoing management of day-to-day services. This can be due to their ‘glamorous’ nature, clear goals and specifiedtimeframes (Rosenthal 1989, p.111). This is despite the fact that operational costs ofcouncils generally far exceed the project costs. The greater focus is also apparent inother ways such as various Local Government Awards, which are primarily centred onlarge capital projects, and even the way Councils communicate with its ratepayers andwider community. Often newsletters and websites will showcase the latest capitalproject to be completed by a Council. Reading about how a Council has saved moneywith new processes is unlikely to generate the same enthusiasm or interest. Withincouncil’s themselves, the priority to projects is a common occurrence. Operational staffare expected to pause their operational work, if a project requires further assistance.

11th Annual WIOA NSW Water Industry Operations Conference & Exhibition Page No. 94EPIC – Exhibition Park in Canberra, 29 & 30 March, 2017
Whilst advocating for more attention for day-to-day services in government, Rosenthal(1989) accepts that projects in government are important, and gives the followingreasons:
interesting and challenging projects may attract managers who would nototherwise consider working in government;
successful projects can increase public faith in government as well as buildpolitical support for better routine services in the same field; and
public projects may hold lessons for the private sector who have turbulent andcompetitive business environments.
Dobie (2007) in contrast to Rosenthal, contends that neither projects nor operations areof greater or lesser importance than the other, but that they must work effectivelytogether. Dobie (2007) also acknowledges that whilst they must be integrated, theymust also be managed in a fundamentally different way. A change in an operation maybe the focus of a dedicated project, hence the two are linked in that case. The ProjectManagement Institute (Project Management Institute 2013) states projects andoperations can intersect at various points including: at each closeout phase; whendeveloping a new product; while improving operations; or until the end of the productlife cycle. As de Wit (1988) notes this is not always recognised as project managementbooks tend to omit the operational phase, even though as he states ‘a good operationalperformance is vital for all projects’ (de Wit 1988, p.167). Since a project turns into aproduct or service to be maintained, then the delivery of a poor product or service(project), would mean higher operational costs, to maintain that project throughout itsoperational life cycle. If the project were implemented successfully, then this wouldhave a flow on effect to the operating results. In private organisations, the end use maynot be such a concern, as they have often made their profit once the project is delivered.However in local government, the council is the one that will eventually take ownershipof the project, which may mean better quality is sought, but this may come at a highercost.
Figure 1: Wagga Wagga Water Treatment Plant
2.1 Case Study– Water Treatment Plant
Riverina Water County Council, located in Wagga Wagga, NSW, is currentlyconstructing a new 55 ML/d Water Treatment Plant (WTP) at the cost of $35 million.RWCC has three engineering sections: Works; Operations; and Projects. The workssection is responsible for laying new pipe and associated fittings.

11th Annual WIOA NSW Water Industry Operations Conference & Exhibition Page No. 95EPIC – Exhibition Park in Canberra, 29 & 30 March, 2017
The project section is responsible for all large capital projects such as treatment plants,reservoirs etc. The operations section is responsible for the running of the treatmentplants. The new WTP is being managed by the project section, but will ultimately berun by the operations section. To recognise this need for integration over the WTP lifecycle, operations and projects worked together in the project phase. During theinitiation and design stage of this project, the operations needs were considered anddesign concepts incorporated. Project staff visited existing Water Treatment Plantsaround the country to see how the design could enhance operations and safety. A few ofexamples of including operations requirements will be discussed.
Figure 2: Construction of the new Wagga Wagga Water Treatment Plant
Example 1
Project staff had visited sites where operators on their daily checks had to walk over andaround pipe work in the plant. In some instances steps were retrofit so that the largepipes could be safely crossed. To avoid this access issue and the need to provide accessstructures, the design of the WTP placed the pipes below the ground level with accessgrates above as shown in Figure 4. This means that operators can walk through the siteon one level.
Figure 3: Pipework below floor with access grates

11th Annual WIOA NSW Water Industry Operations Conference & Exhibition Page No. 96EPIC – Exhibition Park in Canberra, 29 & 30 March, 2017
Example 2
From speaking with WTP operators, cleaning the filters was raised as a difficult exercisedue to access. Complying with confined space requirements and easily being able toreach staff if required was inhibited in older treatment plants. The design of the WaggaWTP including large access ports underneath the filter tanks which are specifically formaintenance access. These are also shown in Figure 4 and in Figure 5 and all on onelevel. A gantry was been built overhead to avoid manual handling of large maintenanceequipment.
Figure 4: Access for maintenance
Example 3
At the old WW WTP, operators were unable to view outside the control room. If theoperator needed to do a quick visual check, they need to exit the building with their fullPPE. The new control room has been designed to be integrated so that the operator canconduct a quick visual inspection without leaving the control room. This is shown inFigure 6.
Figure 5: View from operators control room

11th Annual WIOA NSW Water Industry Operations Conference & Exhibition Page No. 97EPIC – Exhibition Park in Canberra, 29 & 30 March, 2017
Example 4
Similar to the pipe obstruction, bunding in many existing plants means the operatorsneed to climb over short walls, or stair are constructed to go up and over the bund wall.Materials need to be carried in as machinery such as forklifts etc, cannot access storageareas. The new WTP was designed so that everything can be accessed on one level.The material storage silos sit on concrete pads with the bund below. Corrosive resistantplate was then placed at ground level, which allows any liquid to be captured by thecavity below, but operators and machinery have level access to the area. This is shownin Figure 7 and 8.
Figure 6: Bunding below floor level
Figure 7: Bunding below floor level

11th Annual WIOA NSW Water Industry Operations Conference & Exhibition Page No. 98EPIC – Exhibition Park in Canberra, 29 & 30 March, 2017
Figure 8: Sign in the old WTP
3.0 CONCLUSION
The literature has shown that projects and operations are linked. The examples of theWagga WTP have demonstrated that including the needs of the final user, in this caseWTP operators, in the project design phase, means the operation of the new plant willbe improved. The new WTP will be safer and more efficient for the operators, whencommissioned in 2018.
5.0 REFERENCES
Anderson, T. 2009, 'Guide to Project Management', University of Technology Sydney.
Bentley, C. 2010, PRINCE2® Revealed, Second., Butterworth-Heinemann, MA, USA.
Dobie, C. 2007, A Handbook of Project Management: a complete guide for beginners toprofessionals, First., Allen & Unwin, Crows Nest, NSW.
Project Management Institute 2013, A Guide to the Project Management Body of Knowledge(PMBOK® Guide)-Fifth Edition, Project Management Journal, Fifth., vol. 44.
Rosenthal, S.R. 1989, 'Producing Results in Government: Moving Beyond Project Managementand its Limited View of Success', Journal of Policy Analysis and Management, vol. 8, no. 1,pp. 110–6.
de Wit, A. 1988, 'Measurement of project success', International Journal of ProjectManagement, vol. 6, no. 3, pp. 164–70.

11th Annual WIOA NSW Water Industry Operations Conference & Exhibition Page No. 99EPIC – Exhibition Park in Canberra, 29 & 30 March, 2017
UNDERSTANDING BACKFLOW PREVENTION – THETHINGS YOU NEED TO KNOW
Paper Presented by:
Peter McLennan
Author:
Peter McLennan, President,
The Backflow Prevention Association of Australia Inc.
11th Annual WIOANSW Water Industry Operations Conference and Exhibition
EPIC – Exhibition Park in Canberra,29 & 30 March, 2017

11th Annual WIOA NSW Water Industry Operations Conference & Exhibition Page No. 100EPIC – Exhibition Park in Canberra, 29 & 30 March, 2017
UNDERSTANDING BACKFLOW PREVENTION – THE THINGSYOU NEED TO KNOW
Peter McLennan, President, The Backflow Prevention Association of Australia Inc.
ABSTRACT
Design, installation and hydraulics of backflow prevention devices. Understanding the pressuredrop and flow restrictions.
Backflow prevention devices have become an integral part of the water supply asset. With theprotection of the drinking water being paramount, backflow prevention is required by thePlumbing Code at any connection that is subject to being affected by a cross connection. Theoperation and subsequent restraints backflow prevention devices present is not well understood.This paper discusses the design requirements and the performance characteristics of ReducedPressure Zone backflow prevention devices so that water supply personnel can be cognizantwith potential issues before they occur.
Topics covered include: Backflow Basics Pressure drop Vs flow rate and the issues Installation guidelines Discharge from Reduced Pressure Zone valves
Backflow prevention devices are like smoke detectors. They both save lives. Ignorance inunderstanding how they operate within your network is not an excuse when the coroner knocksat your door.
1.0 INTRODUCTION
Backflow is the term used to describe the reversal of flow in a water supply pipe orsystem. Backflow prevention devices are used to protect drinking water fromcontamination where cross connections occur.The Australian Plumbing Code Section 4 relates to Cross Connection Control andcovers the design and use of backflow prevention devices. Australian State and TerritoryGovernments reference the Australian Plumbing Code in their regulations thereforemandating the management and use of backflow prevention devices.
Since the introduction of backflow prevention devices to the plumbing code in 1998, itis estimated that there are more than 500,000 testable backflow prevention devicesinstalled across Australia. Other than a few in the plumbing industry, many peopleresponsible for managing and maintaining drinking water systems know little ofbackflow and how the devices affect the system.
This paper attempts to demystify backflow and presents the basics so that even non-plumbing people can understand how they interact with the water supply.
2.0 DISCUSSION
Whether a plumber, hydraulic designer, plumbing consultant, water officer, waterengineer, contractor or property owner, there are several things you must understandwhen considering installing or requiring the installation of a backflow preventiondevice.

11th Annual WIOA NSW Water Industry Operations Conference & Exhibition Page No. 101EPIC – Exhibition Park in Canberra, 29 & 30 March, 2017
A backflow prevention device is a safety valve that protects the drinking water supply.They are used extensively but many people don’t understand the operation or thelimitations and constraints applicable to these devices.
The following topics need to be addressed when considering the use of a ReducedPressure Zone Valve (RPZ) backflow prevention device.
Backflow BasicsPressure DropFlow ratesDischarge from RPZsInstallation Guidelines
2.1 Backflow Basics
The Plumbing Code:
AS/NZS3500.1-2015 is referenced in the National Construction Code, Volume 3, thePlumbing Code of Australia. Section 4 is Cross Connection Control and lays out thebackflow prevention requirements mandated through legislation. When a State orTerritory references the National Construction Code in their plumbing regulations,unless otherwise stipulated, it makes the use of backflow prevention devices mandatory.
The Standard:
Backflow prevention devices are Watermarked to AS/NZS2845.1-2010 orAS/NZS2845.1-1998. The Watermark is your assurance that the device has beenmanufactured and tested in accordance with the relevant Standard. If it does not have aWatermark it should not be installed in the drinking water network.
Hazard Ratings:
The Standard identifies 3 levels of hazard (the contamination or pollutant that can comein contact with the drinking water)
High Hazard – The pollutant or contaminant if ingested could kill you. Facilitiesconnected to the water supply likely to have this level of potential contamination wouldinclude mineral processing, meat processing plants, hospitals, mortuaries, plating works,etc.
Medium – The pollutant or contaminant if ingested is unpleasant and may make you ill.Facilities connected to the water supply likely to have this level of potentialcontamination include commercial buildings, schools, public parks, food processingplants etc.
Low – The pollutant or contaminant is non-toxic but is objectionable and should not bepresent in drinking water. Facilities connected to the water supply likely to have thislevel of contamination include residential homes, rainwater tanks etc.

11th Annual WIOA NSW Water Industry Operations Conference & Exhibition Page No. 102EPIC – Exhibition Park in Canberra, 29 & 30 March, 2017
Two types of cross connections:
1- A direct connection. This is where the cross connection is ‘hard piped’ and is ofteninstalled by people unaware of the possible consequences. It could be a bypass line or asubmerged tank filling connection.
2- An in-direct connection. The most common cross connection is a hose. A hose is anin-direct connection as the outlet can be used and left in all sorts of situations. Forexample, drain cleaning, chemical mixing, pipe flushing, pool filling etc.
Two types of backflow:
Backsiphonage – the pressure in the supply line is reversed causing the water to besucked or run backwards. This is usually caused by a water main break in the street butcan be caused by mechanical devices that rely on venturi action to draw water from thesupply line.
Backpressure – the water pressure within the facility is greater than the supply pressure.Causes can include high head pressure found in high rise building and at the top of hillsand mechanical equipment failures.
Two types of backflow preventer:
1-Testable – for use in high, medium or low hazard applications
2- Non- testable – for use in low hazard applications
Testable backflow prevention devices are designed to be able to be tested for operationeffectiveness and for maintenance whilst installed inline and are suitable for use in high,medium or low hazard applications.
Non-testable devices need to be removed from line for maintenance and testing hencethey are only suitable for installation in low hazard applications (see Table 1 for a list ofcommon devices and the applicable hazard ratings).
Table 1: Common devices and the applicable hazard ratings
Reduced Pressure ZoneDevice (RPZ)
Testable High hazard applications
Double Check Valve (DCV) Testable Medium hazard applicationsPressure Type Vacuum
Breaker (PVB)Testable Low hazard applications
Dual Check Valve (DUCV) Non-Testable Low hazard applicationsVented Dual Check Valve
(DCAP)Non-Testable Low hazard applications
Atmospheric VacuumBreaker (AVB)
Non-Testable Low hazard applications
Hose Connection VacuumBreaker (HCVB)
Non-Testable Low hazard applications
Single Check Valve Testable(SCVT)
Testable Medium hazard applications only onfire lines

11th Annual WIOA NSW Water Industry Operations Conference & Exhibition Page No. 103EPIC – Exhibition Park in Canberra, 29 & 30 March, 2017
2.2 Pressure Drop & Flow Rates
Backflow prevention devices rely upon pressure drop across the check valves foreffective operation. The minimum spring differentials are stipulated in the Standard andall Watermarked devices must comply.
Testable backflow prevention devices are field tested for effective operation uponcommissioning and at least annually by an accredited tester trained in backflowprevention.
Always check the manufacturers published literature for the pressure drop curve toensure you have enough available pressure to supply the amount of water required. It isespecially important where a fire connection is concerned.
The following examples are from manufacturers published literature and should be usedas a minimum.
100mm Reduced Pressure Zone Valve at 20 L/s has a head loss of 68 kPa (ApolloValves All Valve Industries product catalogue page 7)100mm Double Check Valve at 20 L/s has a head loss of 20 kPa (Apollo Valves AllValve Industries product catalogue page 6)100mm Double Detector Check Valve at 20 L/s has a head loss of 68 kPa (ApolloValves All Valve Industries product catalogue page 8)100 Single Check Valve Detector Testable at 20 L/s has a head loss of 57 kPa (PentairValcheq backflow prevention catalogue page 4)
These figures are devices only and do not include strainers or isolating valves. Thesevalues must be considered where pressure is limited. It is not unusual for a completeassembly comprising of isolating valves, strainer and the RPZ having a pressure dropclose to 100 kPa.
1.3 Discharge From RPZ Valves
All RPZ backflow prevention devices will dump water through the vent in the valve. Itis a safety feature that ensures that if the device fails or there is a backflow event, thedrinking water is protected.
The spillage of water is often inconvenient, but when installed where it cannot get away,it can become dangerous to property and humans.
All manufacturers publish the discharge rates applicable to their devices so be aware ofthese when you install an RPZ.
Otherwise you may have a flood on your hands as for example, a 50mm RPZ with apressure of 700 kPa can discharge around 660 l/min, sufficient water to empty anOlympic sized swimming pool in 6 hours. See figure 1.

11th Annual WIOA NSW Water Industry Operations Conference & Exhibition Page No. 104EPIC – Exhibition Park in Canberra, 29 & 30 March, 2017
RV Discharge Rates RP4A 1/2" to 2"
1/2", 3/4" & 1"
1-1/4" & 1-1/2"
2"
0
50
100
150
200
250
0 20 40 60 80 100 120 140 160 180
ZONE PRESSURE (PSIG)
FL
OW
RA
TE
(GP
M)
Figure 1: Apollo Valves RPZ discharge Rates
3.0 INSTALLATION GUIDELINES
Backflow prevention devices are mechanical devices that require regular testing andmaintenance. To facilitate this, they must be installed where ease of access is available.The Standard addresses some aspects, but each manufacturer outlines specificinstallation requirements in their published literature.
The three questions you need to ask yourself are:
1 Is the device I am installing suitable for vertical and horizontal installation orjust horizontal?Reduced Pressure Zone backflow prevention devices are designed to dischargewater either during pressure fluctuations or mechanical failure. To notcompromise the level of safety, they are to be only installed in the horizontalplane. There is no Watermarked RPZ device approved for vertical installation.
2 Is the device I am installing suitable for concealing in a valve box or pit?Due to the discharging of water, a valve box is susceptible to flooding. Once thewater level covers the discharge vent, the valve is compromised and the safetyreduced.
3 Does the device I am installing have ease of access for regular testing andmaintenance without the need for special equipment or dismantling from theline?AS/NZS2845.1 2010 stipulates that testable backflow prevention devices are tobe commissioned upon installation and tested at least annually to ensureeffective operation. Work place health and safety guidelines would dictate thatbackflow prevention devices not be installed in confined spaces, near hazards, inelevated positions or in ceiling cavities.

11th Annual WIOA NSW Water Industry Operations Conference & Exhibition Page No. 105EPIC – Exhibition Park in Canberra, 29 & 30 March, 2017
4.0 CONCLUSION
It is an everyday occurrence where the installation of a backflow prevention device isutilised to protect the drinking water, but to other than a few trained professionals in theindustry backflow prevention devices remain confusing and are not understood by thevery people responsible for providing the safe drinking water.
With the Australian Plumbing Code being referenced in most State and Territorylegislation, it is mandatory for backflow prevention devices to be installed to protect thedrinking water.
Understanding what backflow is and the limitations of the various devices will not onlyallow you to satisfy your duty of care where these devices are used, but to be able tounderstand the impacts the installation of these have within your network.
Backflow prevention devices are like smoke detectors. They both save lives.
5.0 ACKNOWLEDGEMENTS
Thanks to Apollo Valves / Conbraco Industries and the numerous ‘unsung heroes’, thededicated backflow professionals who have inspired me to develop this presentation.
6.0 REFERENCES
AS/NZS 3500.1:2015 - Plumbing and drainage - Water services. SAI Global Limited
AS/ NZS 2845.1:2010 - Water supply - Backflow prevention devices - Materials, designand performance requirements. SAI Global Limited
AS/ NZS 2845.1:1998 - Water supply - Backflow prevention devices - Materials, designand performance requirements. SAI Global Limited
All Valve Industries, Apollo Valves Backflow Prevention Catalogue.http://www.allvalve.com.au/Files/PDF/Conbraco/Apollo%20Backflow%20Catalogue%20AUS.pdf pages 6,7,8 & 11
Pentair ValVcheq BACKFlOW PREVENTERS FIGURE SCDA03https://valves.pentair.com/en/products/Gate%20Globe%20and%20Check%20Valves/Check%20Valves/Backflow%20preventors/Figure%20SCDA03#tech-spec

11th Annual WIOA NSW Water Industry Operations Conference & Exhibition Page No. 106EPIC – Exhibition Park in Canberra, 29 & 30 March, 2017
IMPLEMENTING AND MANAGING SYDNEYWATER’S BACKFLOW PREVENTION DEVICE
REGISTER
Paper Presented by:
James Milton
Author:
James Milton, Technical Specialist,
Sydney Water
11th Annual WIOANSW Water Industry Operations Conference and Exhibition
EPIC – Exhibition Park in Canberra,29 & 30 March, 2017

11th Annual WIOA NSW Water Industry Operations Conference & Exhibition Page No. 107EPIC – Exhibition Park in Canberra, 29 & 30 March, 2017
IMPLEMENTING AND MANAGING SYDNEY WATER’SBACKFLOW PREVENTION DEVICE REGISTER
James Milton, Technical Specialist, Sydney Water
ABSTRACT
A progressive policy developed and implemented to manage Sydney Water’s connectionrequirements for installing and testing backflow containment devices in Sydney Water’s area ofoperation.
Backflow is a term in plumbing for an unwanted flow of water in the reverse direction.
1.0 INTRODUCTION
Under its charter, Sydney Water is responsible for supplying clean, safe drinking waterto over five million people.
Sydney Water used to be the regulator for plumbing and drainage. We were responsiblefor inspecting all plumbing and drainage work in our area of operation, from Gerroa inthe South to the Hawkesbury River in the North, throughout the Blue Mountains and theCity of Sydney. Backflow prevention has always been a priority for Sydney Water, asoutlined in the plumbing standards, and we have retained responsibility although noofficial Sydney Water policy had existed.
The dedicated backflow prevention program began in 1996. Its aim was to identifypotentially hazardous industries with existing backflow prevention devices as well asproperties needing devices to be installed to prevent cross connections within theirproperties. The program has continued to evolve since its inception.
The importance of backflow containment has become more relevant as regulatoryrequirements have changed, with recognised on-site cross connection risks fromalternative water supplies, chemical production, trade waste operations, burst watermains and irrigation systems, to name a few.
While Sydney Water is no longer the regulator for plumbing and drainage, we must stillprotect greater Sydney’s drinking water and recycled water supplies.
2.0 OBJECTIVE
To protect customers and assets by managing and controlling risks caused by potentiallyharmful contaminants backflowing into our water mains from customers’ privateproperties.
Register backflow containment devices installed Sydney Water’s area of operations,build a list of accredited plumbers available to test devices and manage this data using asystem that will automatically send letters and notices to customers.

11th Annual WIOA NSW Water Industry Operations Conference & Exhibition Page No. 108EPIC – Exhibition Park in Canberra, 29 & 30 March, 2017
3.0 OPERATIONAL PRINCIPLES
Sydney Water will:
identify properties that pose a backflow risk to the drinking water supplyincluding Sydney Water assets, for example pump stations, wastewater treatmentplants, commercial and industrial properties
consult customers throughout the implementation process and be able todemonstrate due diligence and duty of care to customers
implement and maintain a cost-effective management system, including adatabase, reporting system and management control procedures
promptly identify, record, report and rectify non-compliant properties.
3.1 Implications, If Not Implemented
Sydney Water would not demonstrate the expected level of due diligence. Sydney Water customers would be exposed to contaminated water sources from
cross connections on private properties.
3.2 Benefits
Minimisation of risk to customers. Due diligence requirements met. Reduced regulatory role within customers’ properties. No contamination of drinking water from backflow. Reduced administration costs to Sydney Water.
4.0 CONSULTATION
Sydney Water consulted customers throughout our operating areas as implementationwould have ongoing consequences for all areas. This included consulting relevantindustry group and associations.
5.0 DEVELOPING THE PAPER-BASED BACKFLOW DATA BASE
From 1996–2004, we progressively moved towards a fully computerised system by:
utilising Sydney Water systems to identify properties requiring backflowprevention
writing to customers who needed to install devices receiving Compliance Certificates from plumbers completing testing work retaining associated paperwork on-site so we can match and issue notices developing spreadsheets to manage outgoing notices and incoming reports.

11th Annual WIOA NSW Water Industry Operations Conference & Exhibition Page No. 109EPIC – Exhibition Park in Canberra, 29 & 30 March, 2017
6.0 DESIGNING AND DEVELOPING THE ELECTRONIC DATA BASE
From 2004–2009, we:
proposed a business plan to the Sydney Water executive team for developmentapproval
assembled a team of subject matter experts identified system requirements and operational functions engaged in-house information technology teams to liaise and develop software built, tested and deployed the backflow data base.

11th Annual WIOA NSW Water Industry Operations Conference & Exhibition Page No. 110EPIC – Exhibition Park in Canberra, 29 & 30 March, 2017
6.1 A Fully Functional Online Lodgement System
From 2009, we notified the industry and designed implementation to progress over 12months, allowing plumbers to lodge test reports online while continuing with paperbased lodgement.
Sydney Water moved to a fully online lodgement system in 2011, rejecting paper-basedlodgement except in exceptional circumstances, for example no computer.
Plumbers could lodge and store test reports for containment, zone and individualdevices into the system. Plumbers can retrieve all reports lodged under their name.
All annual retest request letters, install, and non-compliance letters are sent through theonline data base.
Sydney Water technical advisers continue with industry education by attending TAFEcollege backflow accreditation classes and supporting the plumbing industry.
Annual targeted auditing of all industries is a key function of the Sydney WaterBackflow Management Program.
6.2 Devices Installed and Registered
2005 2009 2016 2017
9,000 devices 23,000 devices 38,000 devices Continued growth
6.3 Benefits of Online Lodgement
It is user friendly. It helps us meet customer expectations. We have reduced the time needed to manage paper-based exceptions in the
backflow system.
7.0 CONCLUSION
The backflow database is now an essential management system, which allows SydneyWater to accurately and reliably manage incoming and outgoing data from the onlinemanagement system.
Recent improvements have allowed accredited plumbers to update property reports withaccurate device information, changes to serial numbers and complete a simplified report.
Overall efficiency benefits have reduced manual adjustments of errors in the data basefrom up to a staggering 75% down to an outstanding result of 3%.
8.0 ACKNOWLEDGEMENTS
Tegan Van Der Linden: Sydney Water, Business Analyst Business Customer ServicesStephen Murphy: Sydney Water, Manager Business Customer AssuranceSydney Water Digital ServicesLicensed plumbers working in the backflow prevention industry

11th Annual WIOA NSW Water Industry Operations Conference & Exhibition Page No. 111EPIC – Exhibition Park in Canberra, 29 & 30 March, 2017
WHAT IS BACKFLOW & QLD BACKFLOWPREVENTION LOCAL GOVERNMENT
MANAGEMENT REQUIREMENTS
Paper Presented by:
Stephen Jennison
Author:
Stephen Jennison,President Backflow Prevention Association QLD Chapter,
Moreton Bay Regional Council
11th Annual WIOANSW Water Industry Operations Conference and Exhibition
EPIC – Exhibition Park in Canberra,29 & 30 March, 2017

11th Annual WIOA NSW Water Industry Operations Conference & Exhibition Page No. 112EPIC – Exhibition Park in Canberra, 29 & 30 March, 2017
WHAT IS BACKFLOW & QLD BACKFLOW PREVENTIONLOCAL GOVERNMENT MANAGEMENT REQUIREMENTS
Stephen Jennison – President Backflow Prevention Association QLD Chapter, Moreton BayRegional Council
PRESENTATION
Queensland laws to protect the water supply; What is backflow prevention; Why do we need a backflow prevention device; Authorised testers’ requirements; Local Government licensing and registration of backflow prevention devices.
1.0 INTRODUCTION
When the Sewerage and Water Supply Act 1949 (Qld) was amended in April 1992 itmade way for Backflow prevention to be written into law in Queensland for the firsttime.
Having previously worked in the private sector, specialising in the testing andcertification of testable backflow prevention devices, I joined the Pine Rivers ShireCouncil (now Moreton Bay Regional Council) as a plumbing inspector in 2005 and laterbecame President of the Backflow Prevention Association QLD Chapter in 2014.
In 2008, the amalgamation of Pine Rivers Shire Council, Caboolture and RedcliffeCouncils saw the Moreton Bay Regional Council established, creating the third largestCouncil in Australia with an area of 2,037 km2. Moreton Bay Regional Council isnow one of the fastest developing regions in Australia, situated between Brisbane andthe Sunshine Coast, and is currently home to 8600 registered testable backflowprevention devices.
2.0 DISCUSSION
This presentation is based on backflow prevention requirements in Queensland:
1. Plumbing and Drainage Act 2002;2. Standard Plumbing and Drainage Regulation 2003;3. National Construction Code Volume 3;4. AS/NZS3500:2015 (Individual, Zone and Containment protection);5. Submitting the testing reports with the Local Government;6. Local Government creating a backflow licence and register.
3.0 ACKNOWLEDGEMENTS
I would like to thank George Wall and the entire conference organisation team forallowing me to speak on backflow prevention and provide a brief overview on how, whyand where backflow prevention is required.

11th Annual WIOA NSW Water Industry Operations Conference & Exhibition Page No. 113EPIC – Exhibition Park in Canberra, 29 & 30 March, 2017
OLD FILTERS IN A NEW WORLD:AN OPERATORS PERSPECTIVE
Paper Presented by:
Michael Hearn & Justin Miller
Authors:
Michael Hearn, Process Operator,Justin Miller, Process Operator,
Tamworth Regional Council
11th Annual WIOANSW Water Industry Operations Conference and Exhibition
EPIC – Exhibition Park in Canberra,29 & 30 March, 2017

11th Annual WIOA NSW Water Industry Operations Conference & Exhibition Page No. 114EPIC – Exhibition Park in Canberra, 29 & 30 March, 2017
OLD FILTERS IN A NEW WORLD: AN OPERATORSPERSPECTIVE
Michael Hearn, Process Operator, Tamworth Regional CouncilJustin Miller, Process Operator, Tamworth Regional Council
ABSTRACT
Tamworth’s main Conventional Water Treatment Plant [Calala] was commissioned in the1980’s. The 80 mega litre plant has 12 filters. In 2016 we had numerous concerns of high NTUwhich affected a number of the filters. We conducted a series of tests on the filters whichconcluded that we would need to replace the media, and that was just the start of our problems!
1.0 CALALA WATER PLANT BACKGROUND
In 1980 the Tamworth Regional Council commissioned the Calala Water Plant. Thefacility has an initial capacity of 80megalitres a day but has been designed to provideeven greater water supply as Tamworth’s population continues to grow. The majority ofTamworth’s water is supplied from the 100,000 mega litre recently upgraded ChaffeyDam. This is located on the Peel River about 50 km south of the city.
Water from Chaffey Dam is released into the Peel River which flows downstreamwhere it is pumped via a large-capacity intake works, and then fed to Calala WaterTreatment Plant. Tamworth’s supplementary water supply is piped from 56km to thesouth east, out of Dungowan Dam. This dam has a capacity of 6300megalitres.Additionally there is six 12 metre deep Drift Wells adjacent to the Peel River. These aremaintained as an important alternative water supply for when dam levels are low.
Tamworth’s Calala Water Treatment is a conventional plant, consisting of two roundsolids-contact clarifiers [Clarification]. The clarified water then flows through to thefilter stage. There are 12 filters at Calala. The filter media consists of Anthracite [finecoal] over sand and gravel filters through which water passes for final purification.Impurities are removed from the filter by agitation with an air scour, followed by a largevolume of clean water “backwashed” upwards through the media. After filtration, waterfrom the filters flows through a common channel to a chlorine contact tank wherechlorine is injected for disinfection. The water is then treated with soda ash to balancepH, fluoride for dental health and then eventually pumped to the reservoirs fordistribution to consumers.
Figure 1: Clarifier 1 at Calala- WTP

11th Annual WIOA NSW Water Industry Operations Conference & Exhibition Page No. 115EPIC – Exhibition Park in Canberra, 29 & 30 March, 2017
2.0 ISSUES WHICH ARISED AFTER MOTHER NATURE
In June 2016 Tamworth’s WTP had a high rain fall event in the surrounding catchments.This changed the chemistry of the water significantly and overloaded some of the 12filters at Tamworth WTP. All the filters are set up with set points that shut down thefilter if the turbidity is too high.
During this time of unstable water we had to manually run the problem filters. This wasachieved by lowering the effluent value setting to drain the filters at slower rates beforebackwashing. We found at the automatic valve setting the filters were breaking throughduring the backwash stage. This was starting to become labour intensive, havingoperators manually backwashing after normal operating hours.
The water quality from Chaffey and Dungowan dams are generally stable. Our filterstreat this water quite efficiently; however when we combine these raw waters our filtersstruggle. We could treat this water effectively although we found that the water fromDungowan was not constant .This is due to the fact that Dungowan Dam has anautomatic gate that releases water when it hits a trigger point. Large amounts of waterare released which sends surges of bulk water downstream. This sends slug doses ofdifferent quality water through the plant which cannot be predicted. This in turn altersthe treatment process (Coagulation/flocculation) with raw water of low alkalinity, lowPH and high colour.
Figure 2: Dungowan Dam – Tipping
2.1 The Adverse Effect of Faulty Filters on Consumers
Tamworth WTP uses filters as part of a multiple-barrier treatment process designed toremove particles, including water-borne pathogens such as Cryptosporidium, frompotable water. Cryptosporidium is present in raw water and could possibly causediarrhoea or gastrointestinal illness in humans. As it’s highly resistant to chlorinedisinfection, the removal of Cryptosporidium relies upon effective sedimentation andfiltration processes. Detection of Cryptosporidium within the water system wouldrequire a boil water notice to be issued for all affected customers. This could be a costlyexercise.
3.0 OPERATORS OBSERVATIONS
Turbidity breakthrough on backwash drains down evident as dirty water in thebaths.
When filter breakthrough occurs the process can no longer be guaranteed to forman effective barrier to pathogens such as Cryptosporidium, and may compromisethe effectiveness of chlorine disinfection

11th Annual WIOA NSW Water Industry Operations Conference & Exhibition Page No. 116EPIC – Exhibition Park in Canberra, 29 & 30 March, 2017
Some filters have a considerable quantity of mud-balls. A lot of these mud-balls are located at the inlet end of the filters and this zone of
the bed typically appears to be less agitated than the remainder of the bed. Thisindicates blockages of laterals/nozzles in this area. Air and backwash velocitiesin the remainder of the bed may be excessive, which can result in mediaintermixing and migration of sand to nozzle depths.
Floating filter nozzles in cells When nozzles are missing from the plenum floor filter bed sand will migrate
into the underdrains of the filter. This leads to additional nozzles in those cellsalso being blocked and then the underdrains being over-pressurized. As theseissues continue to worsen, the risk of significant over-pressure increases. Thiswill eventually lead to a failure of the underdrain system. This will lead tocomplete failure of the filters.
Significant quantities of sand observed in the filtered water chambers; This indicates that there has been migration of sand from the filters into the
underdrains In some filters air can be observed to bubble up along the concrete edge at the
washout channel during the backwash, This is a sign that excessive pressures have resulted in lifting of this section of
the floor and complete failure of the underdrain may be imminent. .
4.0 CONSULTATIONS
This filter report will assess the current condition of the filters in respect to comply withthe Australian Drinking Water Guidelines 2011.
Initial consultation about the filters at the WTP was with Craig Jakobski (Hunter Water)and methods of initial filter investigation were taken from the WIOA journal PracticalGuide to the operation and Optimization of Media Filters.
Recommended actions to ascertain the condition of filters include;Visual filter checks
Filter bed appearance
This is visual observation of the bed for uniformity and media depth. When inservice filters may lose media which reduces their ability to produce clean waterand hold particles. Uneven and lumpy beds are signs of problems with mudballs.
Air scour pattern
This should be established evenly and gently across the entire filter. Violenteruptions or disjointed appearance is cause for concern as this indicates blockedor missing nozzles.
Underdrain pressure
This is important as high underdrain pressures in a plenum type arrangement canrupture the floor and lead to total failure of the filter.

11th Annual WIOA NSW Water Industry Operations Conference & Exhibition Page No. 117EPIC – Exhibition Park in Canberra, 29 & 30 March, 2017
High pressure in the underdrain is generally due to sand that has migrated to theunderdrain blocking the nozzles and laterals. As part of the investigation processpressure gauges linked to SCADA have been installed into the backwash and airscour line respectively
Underdrain leaks
These are the result of excessive underdrain pressure. Leaks in the underdrainindicate the plenum floor is starting to lift. This will relieve excessive pressuresto some extent but also indicates the structural integrity of the Plenum underflooris failing.
Dirty water treatment.
A filters ability to maintain good water quality is tested vigorously when thetreatment plant is dealing with ‘dirty’ water. Filter problems during this time canbecome especially evident.
Initial investigations were a visual observation of each filter completing a backwash
Figure 3: Air scour pattern-Filter 2 leaks evident along drain and 1/3 media notagitated
After installation of pressure sensors in the backwash and air scour line data wascollated and graphed.
0
20
40
60
80
100
1 2 3 4 5 6 7 8 9 10 11 12
Pe
rce
tan
ge5
0kP
a
Filter number
Backwash pressure
Backwash pressure
Figure 4: Backwash pipe pressure during backwash.-Filter 2 is currently offline

11th Annual WIOA NSW Water Industry Operations Conference & Exhibition Page No. 118EPIC – Exhibition Park in Canberra, 29 & 30 March, 2017
0
5
10
15
20
25
30
1 2 3 4 5 6 7 8 9 10 11 12
Pe
rcan
tage
50
kPa
Filter Number
Air scour pressure
Air scour pressure
Figure 5: Air scour pressure results
The information collected on each filter has been put into the table below and rated from0 to 10 with 0 good condition and 10 filtration may be severely compromised.
Table 1: Rated performance indicators
Filter bedappearance
Airscour
pattern
Underdrainpressure
Underdrainleaks
Dirtywater
treatment
Totalscore
Filter 2 10 8 6 10 10 44Filter 11 8 6 10 0 9 33Filter 12 7 4 9 2 9 31Filter 8 5 4 6 7 8 30Filter 7 4 4 9 2 8 27Filter 10 5 4 6 7 2 24Filter 5 5 6 5 5 1 22Filter 6 5 3 6 3 4 21Filter 3 4 4 4 5 3 20Filter 4 4 4 4 0 3 15Filter 9 0 0 6 0 9 15Filter 1 2 2 4 0 2 12

11th Annual WIOA NSW Water Industry Operations Conference & Exhibition Page No. 119EPIC – Exhibition Park in Canberra, 29 & 30 March, 2017
0
5
10
15
20
25
30
35
40
45
50
1 2 3 4 5 6 7 8 9 10 11 12
Filt
er
sco
re
Filter number
Filter graph
Filter graph
Figure 6: Results of investigation
Filter 2 is in very bad condition and can no longer be guaranteed to form an effectivebarrier to pathogens such as Cryptosporidium this filter has been taken offline.
Filters 11, 12 and 7 have very high underdrain pressure and the high pressure indicates alarge amount of sand has migrated to the underfloor. All filters are showing some signsof performance problems.
5.0 CONCLUSION
While the filters play a very important role in the treatment of the water, it is importantto note that without continual media replacement and filter up-keep dirty water cancause significant harm to the consumers.
Operators need to be vigilant in addressing any issues that arise before the turbidityreaches the baths.
It is important that the Australian Drinking Water guidelines are continually met andcorrect testing and monitoring will ensure that the guidelines are achieved.
6.0 ACKNOWLEDGEMENTS
Thanks to Tamworth Regional Council for giving me the opportunity to present thispaper and the team from Calala WTP for their input.
7.0 REFERENCES.
WIOA journal Practical Guide to the operation and Optimization of Media Filters.www.wioa.org.au/publications/documents/MediaFilters
Australian Drinking Water Guidelines 2011.
Craig Jakobski (Hunter Water)Tamworth Regional Council - http://milo.tamworth.nsw.gov.au/

11th Annual WIOA NSW Water Industry Operations Conference & Exhibition Page No. 120EPIC – Exhibition Park in Canberra, 29 & 30 March, 2017
Winner of the Best Operator Paper at the79th Annual WIOA Victorian Water Industry Operations Conference,
Bendigo, 2016
INCIDENT AT YERING GORGE PUMPING STATION.HOW WHAT YOU DON’T KNOW CAN HURT YOU
Paper Presented by:
John deBoer
Author:
John deBoer, Operations Specialist, Water Supply Operations,
Melbourne Water
11th Annual WIOANSW Water Industry Operations Conference and Exhibition
EPIC – Exhibition Park in Canberra,29 & 30 March, 2017

11th Annual WIOA NSW Water Industry Operations Conference & Exhibition Page No. 121EPIC – Exhibition Park in Canberra, 29 & 30 March, 2017
INCIDENT AT YERING GORGE PUMPING STATION.HOW WHAT YOU DON’T KNOW CAN HURT YOU
John deBoer, Operations Specialist, Water Supply Operations, Melbourne Water
ABSTRACT
On the 12th of May, 2015, a sequence events began that, 10 days later, would culminate in amajor hydraulic incident leaving the Yering Gorge pumping station critically damaged andexposing the operator on site to significant risk. This event would result in the station being outof operation for two months before partial pumping could be reinstated and a total of eightmonths before the station would again operate at its full capacity. The ultimate cost of thisincident included approximately 10 Gigalitres of lost water harvest and a significant restorationoperation costing over $1.2 million. This paper describes the events leading up to the incident,the investigation process and the key learnings identified.
1.0 INTRODUCTION
The Sugarloaf Reservoir is a 96 Gigalitre storage located 35 Km North East ofMelbourne in Christmas Hills and supplies potable water to the Northern suburbs via theWinneke Water Treatment Plant. The Yering Gorge pumping station delivers waterfrom the Maroondah Aqueduct and the Yarra River into the Sugarloaf Reservoir and isthe primary source of inflow to Sugarloaf.
The total pump station capacity is approximately 1100 ML/day and comprises of 4 mainpumps each with a capacity of 250ML/day and two additional supplementary pumpseach with a capacity of 40 ML/day. The station is operated to harvest approximately 200ML/day from the aqueduct together with the maximum available river flow excludingthe minimum required environmental passing flow of 350 ML/day.
2.0 DISCUSSION
2.1 Pump Station Configuration
The Yering Gorge pump station can deliver water from either the Yarra River or theMaroondah aqueduct which is supplied from the Maroondah Reservoir in Healesville.The pump well is situated approximately three meters below the river bed and 55 metersbelow the Maroondah Aqueduct, with the station delivering water into SugarloafReservoir which is approximately 120 meters above the pumping station. The aqueductsuction main is an 1100mm diameter pipeline which drops almost vertically from theaqueduct into the station below (see Figure 1). There is a manually operated diversionvalve at the aqueduct, an actuated isolation valve on ground level 17 meters above thepump well, and an 1100mm actuated suction valve at each of the two aqueduct dutypumps.
The station draws water from the aqueduct suction main to supply critical stationservices such as motor cooling, bearing cooling and seal ring flushing systems.Whenever the aqueduct is taken out of service, the station services supply is re-valved tobe supplied from the pump delivery main via a pressure reducing, service water controlvalve (see Figure 1).
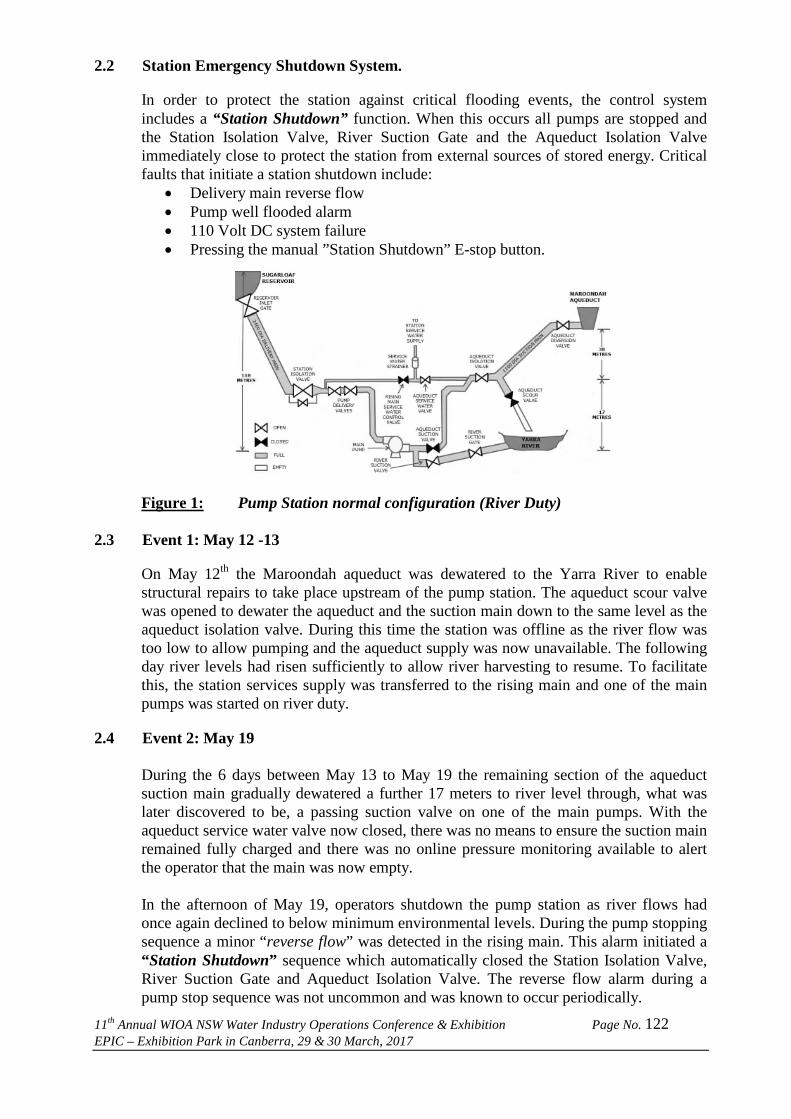
11th Annual WIOA NSW Water Industry Operations Conference & Exhibition Page No. 122EPIC – Exhibition Park in Canberra, 29 & 30 March, 2017
2.2 Station Emergency Shutdown System.
In order to protect the station against critical flooding events, the control systemincludes a “Station Shutdown” function. When this occurs all pumps are stopped andthe Station Isolation Valve, River Suction Gate and the Aqueduct Isolation Valveimmediately close to protect the station from external sources of stored energy. Criticalfaults that initiate a station shutdown include:
Delivery main reverse flow Pump well flooded alarm 110 Volt DC system failure Pressing the manual ”Station Shutdown” E-stop button.
Figure 1: Pump Station normal configuration (River Duty)
2.3 Event 1: May 12 -13
On May 12th the Maroondah aqueduct was dewatered to the Yarra River to enablestructural repairs to take place upstream of the pump station. The aqueduct scour valvewas opened to dewater the aqueduct and the suction main down to the same level as theaqueduct isolation valve. During this time the station was offline as the river flow wastoo low to allow pumping and the aqueduct supply was now unavailable. The followingday river levels had risen sufficiently to allow river harvesting to resume. To facilitatethis, the station services supply was transferred to the rising main and one of the mainpumps was started on river duty.
2.4 Event 2: May 19
During the 6 days between May 13 to May 19 the remaining section of the aqueductsuction main gradually dewatered a further 17 meters to river level through, what waslater discovered to be, a passing suction valve on one of the main pumps. With theaqueduct service water valve now closed, there was no means to ensure the suction mainremained fully charged and there was no online pressure monitoring available to alertthe operator that the main was now empty.
In the afternoon of May 19, operators shutdown the pump station as river flows hadonce again declined to below minimum environmental levels. During the pump stoppingsequence a minor “reverse flow” was detected in the rising main. This alarm initiated a“Station Shutdown” sequence which automatically closed the Station Isolation Valve,River Suction Gate and Aqueduct Isolation Valve. The reverse flow alarm during apump stop sequence was not uncommon and was known to occur periodically.

11th Annual WIOA NSW Water Industry Operations Conference & Exhibition Page No. 123EPIC – Exhibition Park in Canberra, 29 & 30 March, 2017
As the pumping station was no longer required to operate it was left offline in“Shutdown” mode with the major isolation valves remaining closed (see Figure 2).
Figure 2: Station in “Emergency Shutdown” Mode with Aqueduct suction maindewatered
2.5 Event 3: May 21
With the Aqueduct maintenance works now complete, the aqueduct is slowly rechargedbut only filled as far as the, now closed, aqueduct isolation valve leaving approximately17 meters of empty 1100mm diameter suction main beneath it (see Figure 3).
Figure 3: Aqueduct main recharged
2.6 Event 4: May 22
The Operator attends site to prepare the station to resume pumping from the nowrecharged, aqueduct supply. He initiates a “Station Reset” command. This controlfunction returns the Aqueduct Isolation Valve to its pre-shutdown condition,immediately opening the valve. The opening travel time of the 1100mm diameterbutterfly valve is less than three seconds and the rapid opening of this valve allowed the40 tonnes of stored water above the valve to drop rapidly into the empty void below.The resulting pressure shock split the housing of the 250mm service water valve causingwater to flood from the ground floor into the station below showering the high voltagepump drives with water and causing an electrical fault turning off all the station lighting.

11th Annual WIOA NSW Water Industry Operations Conference & Exhibition Page No. 124EPIC – Exhibition Park in Canberra, 29 & 30 March, 2017
The shock also hits the two closed, 1100mm diameter, aqueduct pump suction valvestearing the butterfly’s from their cast housings and punching a 300mm hole in the sideof one of the valves (Figure 4 & 5). Water flowing from these valves knocked down ablockwork wall and flooded into the pump well at a much greater rate than the sumppumps could manage.
Figure 4: Location of damaged valves
Figure 5: Damaged butterfly valves
2.7 In the Line of Fire
The Operator Interface Unit used for station control is situated on “C” floor at thebottom of the pump well, one level above the main pumps. With water flooding overhigh voltage equipment from above, the pump well flooding from below and the stationin total darkness, the operator was trapped in a precarious position. To add to theoperator’s predicament, an emergency escape ladder adjacent to the operator interfacehad been recently deemed non-compliant and was barricaded pending furtherinvestigation. This left the operator with no choice but to remain in this location (Figure6) until help arrived to safely isolate the electrical supply.
2.8 Saved from Flooding
One of the alarm conditions that initiate the “Station Shutdown” sequence is a 110VDC supply failure. The water flooding in from the failed service water valve abovefaulted the 110V system initiating a Station Shutdown which closed the AqueductIsolation Valve preventing any further flooding. With the station power supply nowfaulted leaving the sump pumps no longer operational, the safety measure that initiallyled to this incident was the same measure that ultimately protected the station frombeing totally flooded.

11th Annual WIOA NSW Water Industry Operations Conference & Exhibition Page No. 125EPIC – Exhibition Park in Canberra, 29 & 30 March, 2017
Figure 6: Operator location during the incident
2.9 Recovery Works
With all personnel now safe and the station safely isolated, work began immediately torepair the station to an operational state. Transfer of water from the MaroondahAqueduct was ceased and 10 Gigalitres of river water flowed past the station, unable tobe pumped into Sugarloaf Reservoir. The Winneke Treatment Plant continued to supplywater to Melbourne but, with no inflow, the level in Sugarloaf reservoir began tosteadily decline.
A team of operations, asset management and project engineering representatives workedtirelessly together to implement the recovery project in as short a time as possible.
Orders were immediately placed for replacement valves. Meanwhile detailed isolationrisk assessments and implementation plans were developed to allow the safe removal ofthe damaged valves and installation of blank flanges to enable the station to harvestfrom the Yarra River until the new valves arrived. A second shutdown was thenconducted to remove the blank flanges and install the new valves returning the station toits full operating capacity. These restoration works were conducted over a period ofeight months at a cost in excess of $1.2 million.
2.10 The Investigation
Following this incident a lengthy investigation was conducted using the “ICAM”investigation methodology. This investigation examined several key focus areasincluding:
Organisational Factors Task / Environmental Factors Individual Actions Absent or Failed Defences
Whilst there were many key factors associated with this incident the root cause wasultimately determined as: “The hazard of the aqueduct suction pipe becomingdewatered was not identified in the design and subsequent operation of the pumpstation.”
2.11 Key Learnings
This incident involved hazards affecting the asset/technical integrity of the facility. Theinstalled engineering controls did not effectively mitigate the process safety risks toasset integrity, which had the potential to affect personal safety.

11th Annual WIOA NSW Water Industry Operations Conference & Exhibition Page No. 126EPIC – Exhibition Park in Canberra, 29 & 30 March, 2017
In the facts and documentation considered during the investigation there was noevidence that the hazard of dewatering the lower section of the aqueduct suction pipehad been identified in the pump station design. The hazard was not identified in therelevant manuals, training or procedures, nor had it been observed in the operatingexperience of the pump station, and no mitigation measures were installed orimplemented at the pump station. (Gall 2015)
The key learnings from this investigation include the importance of: Risk assessment processes during the design stage (HAZOP, CHAZOP & Safety
in Design) to identify this type of hazard; Understanding hydraulic gradients and potential stored energy in pipes and
pump stations; Monitoring and managing the differential pressure across control or reducing
valves when de-isolating, recharging or resetting plant; Understanding how the loss of the control of stored energy can create process
safety hazards, arising from the failure of asset/technical integrity, which havethe potential to affect personal safety;
Selecting the correct engineering controls to prevent the plant from operating inan unsafe condition e.g. bypass valves, control interlocks and permissive alarms;
Ensuring asset risk assessment processes include consideration of process safetyrisks in evaluating the effectiveness of engineering controls and safe guards;
Ensuring that risk assessments of operational or asset changes include a holistic(whole-of-system) review of the potential impact of the relevant change, andensuring that those risk assessments are appropriately documented;
Proactively reviewing local operations that may expose people to “line of fire”hazards in the event of an asset/technical integrity failure, including evaluatingegress from these locations in the event of an emergency; and
Ensuring core risks are identified for each operational site, and effective controlsare in place and appropriately documented in procedures. (Gall 2015)
3.0 CONCLUSION
This incident was significant in identifying the need for renewed focus on process safetyat Melbourne Water’s key high risk assets with potential to house large volumes ofstored energy and high pressures. It also highlighted the potential for Operations andMaintenance staff to be in danger should a similar incident occur during routine plantoperations. The ripple effect from this incident spread to all corners of MelbourneWater’s Service Delivery arm, as teams from both the water and sewer sides of thebusiness took a fresh look at process safety at their keys assets and asked themselves thequestion, “Could something we don’t know be waiting to harm us on our site?”
4.0 ACKNOWLEDGEMENTS
I would like to acknowledge the efforts of the following people who assisted with thedevelopment of this paper:
Stephen Wilson: Lead Operator, Winneke Operations Team Matt Slater: Winneke Operations Team Aaron Ward: Process Engineer, Winneke Operations Peter Gall: Manager Eastern Treatment Plant
5.0 REFERENCES
Gall P, Yering Gorge Asset Failure, ICAM Investigation Report, (June 2015).

11th Annual WIOA NSW Water Industry Operations Conference & Exhibition Page No. 127EPIC – Exhibition Park in Canberra, 29 & 30 March, 2017
RIVERINA WATER’S ENERGY EFFICIENCY ANDCOST MINIMISATION JOURNEY
– THE STORY THUS FAR
Paper Presented by:
Jason Ip
Author:
Jason Ip, Manager Operations,
Riverina Water County Council
11th Annual WIOANSW Water Industry Operations Conference and Exhibition
EPIC – Exhibition Park in Canberra,29 & 30 March, 2017

11th Annual WIOA NSW Water Industry Operations Conference & Exhibition Page No. 128EPIC – Exhibition Park in Canberra, 29 & 30 March, 2017
RIVERINA WATER’S ENERGY EFFICIENCY AND COSTMINIMISATION JOURNEY – THE STORY THUS FAR
Jason Ip, Manager Operations, Riverina Water County Council
ABSTRACT
No mistake, Riverina Water’s journey did not begin easily… As many people would agree, it’sdifficult for any organisations to introduce energy cost minimisation programs if they don’tunderstand the administrative, technical, economic and operational environments in which theyoperate.
Riverina Water’s programmed commenced 3 years ago and Riverina Water is now benefittingfrom cost savings totalling $0.5M per year. It demonstrates that with a little understanding ofenergy pricing, tariff structures, and basic electrical theory, organisations can also obtain costsavings with good payback periods.
The implementation of various energy efficiency and cost minimisation programmes werebased on obtaining the best returns on investments (ie. ‘picking the low fruit from trees’) andthis presentation offer ways for others to begin this journey and implement some of thesevarious programmes in the water/wastewater industry.
Programs include: Time of Use management Power Factor correction Energy data management Tariff management Collective energy procurement contracts Energy invoice data management and reporting Financial accounts verification and management Energy Audits
1.0 INTRODUCTION
Managing energy efficiency and electricity costs is very complex. Riverina Water, aswith many similar local government water utilities, is under immense pressure to reduceoperational costs and electricity cost is a significant component.
Riverina Water has 79 electricity sites comprising of 55 small (collective) sites and 24large contestable sites. The 24 large contestable sites consume up to 93% of council’stotal electricity supplied, and make up approximately 89% of total electricity costs.
All these sites are under a single retail supply contract totalling approximately 11.5GWhper year at a total cost of approximately $1.8M (2015/16). Riverina Water,Goldenfields County Council and Wagga Wagga City Council also elected to undertakea joint retail contract totalling up to 31GWh per year.
Riverina Water began its energy efficiency and cost minimisation programme 3 yearsago, and has quickly generated savings over $0.5M annually whilst only concentratingso far on ‘picking the low fruits’.

11th Annual WIOA NSW Water Industry Operations Conference & Exhibition Page No. 129EPIC – Exhibition Park in Canberra, 29 & 30 March, 2017
Costs savings over the 3 years is illustrated in the graph below where water supplied tocustomers and energy consumed have been relatively consistent over the 3 years,whereas, the total energy costs have reduced from $2.5M to $1.8M. The total unitenergy cost of water supplied reduced from $183/ML to $134/ML.
Figure 1: Cost savings over the 3 years
The following is Riverina Water’s experience in implementing these various energy andcost minimisation programmes over the last three years.
2.0 PICKING THE LOWEST HANGING FRUIT
Given that the 24 large contestable sites comprises 89% of Riverina Water’s total energycosts, the following actions were performed that focussed on costs associated with theselarge contestable sites, namely 1) network charges and 2) retail energy costs.
2.1 Large Contestable Network Costs:
Over the 3 years, Riverina Water’s network/service charges reduced from over 80% to62% of total invoiced costs. This is the area to which Riverina Water obtained itsgreatest cost saving results.
The following programmes were used reduce these network costs:
Network Tariff Analysis:
Do not assume that the energy retailer or network provider is going to ensure thatyour large contestable sites are on the appropriate or the cheapest network tariff.It is recommended to perform your own network tariff review to:
Check whether it’s worthwhile for sites on obsolete network tariffs toremain on those tariffs, or change to the current equivalent tariff.

11th Annual WIOA NSW Water Industry Operations Conference & Exhibition Page No. 130EPIC – Exhibition Park in Canberra, 29 & 30 March, 2017
Identify which sites are affected by KVA charges. It’s recommended tothen undertake power factor analysis for these sites as described below.
Power Factor Analysis for sites affected by kVA network charges:
Power Factor is a way of measuring how efficiently power is being used toperform work. Poor Power Factor (ie. less than 0.95-0.98) will increase theApparent Power [kVA] and therefore increase the energy network KVA chargesfor each tariff period based on the following relationship:
Apparent Power [kVA] = Real Power [kW] / Power Factor
Power Factor Correction units are used to increase poor power factor by use ofcapacitors, and these should be correctly sized for the range of power [kW] usedthroughout the year, and not just sized for the maximum power used.
Power Factor values may be obtained from monthly invoices, or preferably fromactual meter data (obtained from the retailer) where sufficient data is available toaccurately determine the range of power factor corrections required overdifferent power demands.
For example, based on Riverina Water’s experience, $61k savings inKVA charges was achieved with payback periods of less than 0.5-1 yearfor 3 sites after installing power factor correction units.
Time of Use (ToU) Management:
Similarly to Retail Energy Time of Use management, significant reduction ofnetwork costs is possible by managing when and how much energy is consumedduring each tariff period.
Each tariff period is described below:
Off Peak Tariff Period: 10pm-7am: 9 hours + Weekends Shoulder Peak Tariff Period: 9am-5pm, 8pm-10pm: 10 hours Peak Tariff Period: 7am-9am, 5pm-8pm: 5 hours
Time of Use network costs may be reduced by:
i. Load shift production to Off Peak Tariff periods (providing there islatitude to shift timing of production) and balance further productionrequirements by utilizing shoulder, and then lastly, peak tariff periods eg.Refilling reservoirs overnight and/or over the weekend.
Note: Shoulder Tariff Period is preferred over Peak Tariff period as it hasmore continuous hours ie. 10 hours compared to 5 hours.
ii. Limiting the tariff periods that are activated for each month: Forexample, KVA charges are based on $/max KVA/Month for each tariffperiod. There are immediate savings by avoiding activation of tariffperiods.

11th Annual WIOA NSW Water Industry Operations Conference & Exhibition Page No. 131EPIC – Exhibition Park in Canberra, 29 & 30 March, 2017
For example, if a pump with a resulting 344kVA is operated for 1 hourfrom 8:30am to 9:30am, both Peak Tariff and Shoulder Tariff periods areactivated and both incur these kVA charges for the month (ie. $5.5k +$5.5k).
Riverina Water installed ToU control systems at various facilities to inhibit pumpoperations for certain tariff periods for each month. Assignments of what treatmentfacilities and pump stations are available to operate for each tariff period are determinedbased on estimated water supply demands.
3.0 LARGE CONTESTABLE ENERGY USAGE COSTS
Energy usage costs typically make up 20-40% of the total bill compared to networkcosts. Several of cost saving measures used for managing network costs can also assistreducing energy usage costs. The following programmes were used to specificallyreduce energy usage costs:
Identification of sites that qualify to be included on a large retail contestablesupply contract:
The typical difference between the general business retail usage and largecontestable supply contract retail charges can be very significant and it’sworthwhile to ensure sites that do qualify are included in the large contestablesupply contract. Don’t necessarily rely on being informed by the retailer whensites qualify over 100Mwh per year.
Re-negotiation of council’s large retail market contestable supply contract:
Riverina Water County Council, Wagga Wagga City Council and GoldenfieldsCounty Council have a combined annual energy consumption of approximately31GWh.
There are financial benefits gained by collectively purchasing power with otherorganisations as well as stipulating levels of service expected from the electricityretail company ie. Provision of energy data, invoices, dedicated accountmanager(s), etc.
Time of Use (ToU) Management:
Typically, the energy usage cost per kWh during peak tariff and shoulder periodsare the same, and depending on the retail supply contract, cost per kWh duringoff-peak tariff periods are typically 30-40% cheaper. Therefore, similarlyprinciples used to manage ToU network costs can be used to reduce energyusage costs by shifting production times to utilise off-peak tariff periods inpreference to shoulder and peak tariff periods.
Introduction and upgrading to energy efficient motors and appliances:
Identify where existing pumps are no longer performing efficiently ie.worn impellers
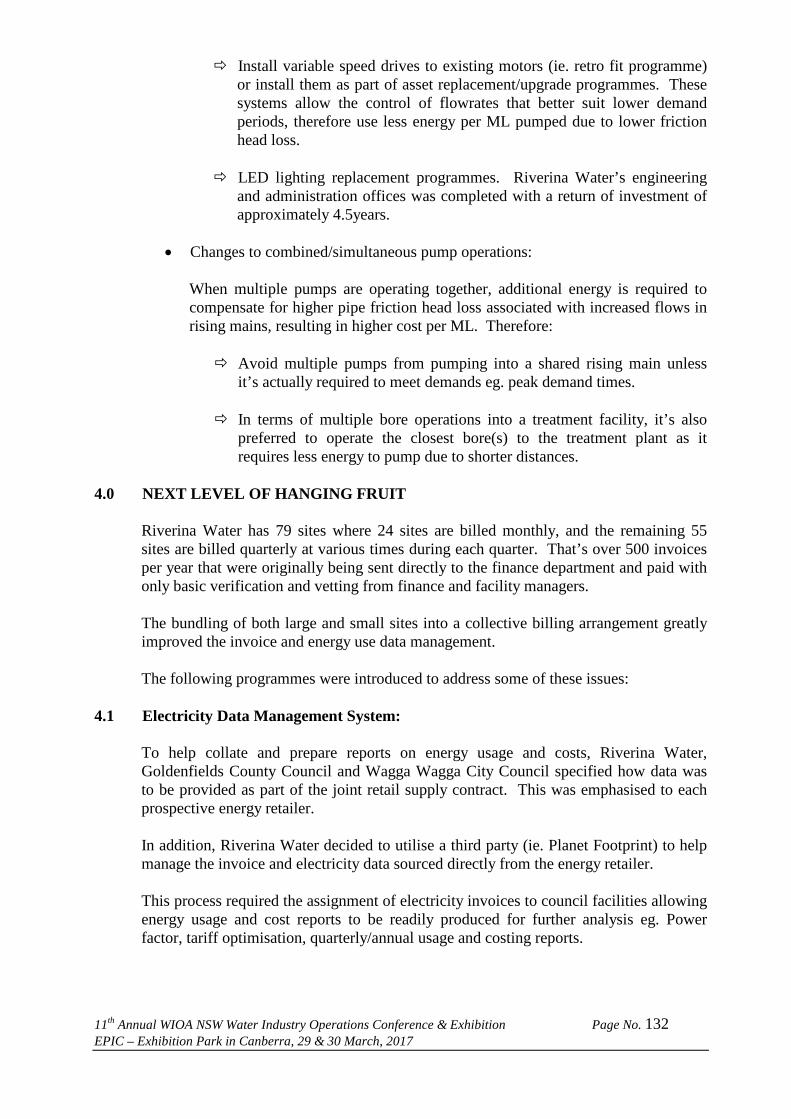
11th Annual WIOA NSW Water Industry Operations Conference & Exhibition Page No. 132EPIC – Exhibition Park in Canberra, 29 & 30 March, 2017
Install variable speed drives to existing motors (ie. retro fit programme)or install them as part of asset replacement/upgrade programmes. Thesesystems allow the control of flowrates that better suit lower demandperiods, therefore use less energy per ML pumped due to lower frictionhead loss.
LED lighting replacement programmes. Riverina Water’s engineeringand administration offices was completed with a return of investment ofapproximately 4.5years.
Changes to combined/simultaneous pump operations:
When multiple pumps are operating together, additional energy is required tocompensate for higher pipe friction head loss associated with increased flows inrising mains, resulting in higher cost per ML. Therefore:
Avoid multiple pumps from pumping into a shared rising main unlessit’s actually required to meet demands eg. peak demand times.
In terms of multiple bore operations into a treatment facility, it’s alsopreferred to operate the closest bore(s) to the treatment plant as itrequires less energy to pump due to shorter distances.
4.0 NEXT LEVEL OF HANGING FRUIT
Riverina Water has 79 sites where 24 sites are billed monthly, and the remaining 55sites are billed quarterly at various times during each quarter. That’s over 500 invoicesper year that were originally being sent directly to the finance department and paid withonly basic verification and vetting from finance and facility managers.
The bundling of both large and small sites into a collective billing arrangement greatlyimproved the invoice and energy use data management.
The following programmes were introduced to address some of these issues:
4.1 Electricity Data Management System:
To help collate and prepare reports on energy usage and costs, Riverina Water,Goldenfields County Council and Wagga Wagga City Council specified how data wasto be provided as part of the joint retail supply contract. This was emphasised to eachprospective energy retailer.
In addition, Riverina Water decided to utilise a third party (ie. Planet Footprint) to helpmanage the invoice and electricity data sourced directly from the energy retailer.
This process required the assignment of electricity invoices to council facilities allowingenergy usage and cost reports to be readily produced for further analysis eg. Powerfactor, tariff optimisation, quarterly/annual usage and costing reports.

11th Annual WIOA NSW Water Industry Operations Conference & Exhibition Page No. 133EPIC – Exhibition Park in Canberra, 29 & 30 March, 2017
4.2 Account and Invoice Management System:
Until August 2016, there was minimal verification and vetting of energy invoices beforepayment to ensure their accuracy, and no formal means of tracking or resolving accountand invoicing issues. Given that Riverina Water’s total energy costs are $1.8M(2015/16), there was adequate financial justification to introduce a third party accountmanagement system (ie. Finance Footprint by Planet Footprint) to perform the minimalfunctions that any prudent organisation should do.
Some of the advantages identified from this system include:
Verify all energy accounts are correct in consistent with contract rates Provide a single reporting platform that consolidates financial invoice and
energy consumption data from multiple systems into one system. Create a channel for better communication between the operational managers
and finance department Able to generate useful reports and improve tracking of invoice adjustments and
reduce of number of apparent estimated reads
Some of the validation rules used to verify invoices, include:
Bill does not match with a current account, asset (site) or organisation unit in oursystem.
Overall consumption, cost or cost/unit is more than 20% higher than for thesame time previous year.
Bill overlaps a previously received bill for the same meter and time period,including partially overlapping periods.
Meter read is estimated by the utility Billed usage does not match usage read from meter Energy account is not on the correct contract Charges are not as per the rates in the contract Large market electricity account is not on the most cost-effective network tariff. Water utility is charging for wastewater or other services that don’t apply to that
facility. For example, where water is used only for irrigation. Metered accounts that aren’t consuming any energy/water that could possibly be
disconnected to save on service charges.
5.0 CONCLUSION
The journey to reduce energy and costs can be very daunting for a newcomer. It’s a longroad to understand retail and network pricing structures, how different tariffs applywithin a day/week, technical energy terms and theory (eg. Power factor, KVA, kW),complexity of understanding electricity invoices, relationships between the energyretailer and network provider and how electricity data is being recorded and itsavailability.
Based on Riverina Water’s experience, it’s hoped others to start or continue theirjourney to reduce energy and costs by implementing some of the above-mentionedprograms.