Operations and Workforce Analysis Catalog · project to chart a path forward ... Structure and...
132
National Weather Service Operations and Workforce Analysis Catalog Assembling the data, analysis and findings from the 2015- 2016 Operations and Workforce Analysis of the National Weather Service (NWS) September 2017
Transcript of Operations and Workforce Analysis Catalog · project to chart a path forward ... Structure and...

National Weather Service
Operations and Workforce Analysis Catalog
Assembling the data, analysis and findings from the 2015- 2016 Operations and Workforce Analysis of the National Weather Service (NWS)
September 2017

Note: This document catalogs the findings and ideas of the OWA; it is not an implementation plan.
i
Table of Contents
Executive Summary ......................................................................................................... 1
Background: NWS is at a critical inflection point ............................................................ 9
Project Overview: NWS launched the Operations and Workforce Analysis (OWA) project to chart a path forward ...................................................................................... 11
OWA findings from Phase 1: Diagnostic ........................................................................ 12
Structure and General Findings from Phase 1 ..................................................................................... 12
Phase 1 Findings on NWS' Workforce ................................................................................................... 13
There is a mismatch in some areas between workforce and workload ............................................ 14
The diagnostic identified a difference between current and desired skill level for IDSS ................. 19
Phase 1 Findings on NWS' Operating model ....................................................................................... 20
Phase 1 Findings on NWS' Operating model: IDSS ............................................................................ 20
Uncertainty regarding IDSS partner types and metrics for IDSS across NWS offices .................. 20
Most partners are very satisfied with the support they receive from the NWS .............................. 22
The majority of partners also rely on non-NWS providers for weather information in addition to the NWS ................................................................................................................................................. 23
Partners had varied experiences when initially learning how to work with the NWS ................... 24
Phase 1 found that IDSS is delivered inconsistently and to varying degrees .................................. 25
Knowledge of NWS products is variable across partners ................................................................. 28
IDSS is critical to NWS partners, who say IDSS helps improve their decision-making ................. 29
The NWS may be over-serving some partners ................................................................................... 30
Phase 1 Findings on NWS' Operating model: forecast process ......................................................... 32
The forecast process has some duplication of effort, does not make best use of local staff time, and can result in inconsistent forecasts ...................................................................................................... 32
Phase 1 Findings on NWS' Organization (Workload, Role Clarity, and Organizational Health) .. 35
Lack of role clarity between the newly reorganized National Service Programs (NSPs) and the National Centers for Environmental Prediction (NCEP), as well as inconsistencies in NCEP roles and responsibilities ............................................................................................................................... 36
Tsunami Warning Centers are not aligned to partner needs ........................................................... 38
There is a lack of role clarity between River Forecast Centers (RFCs) and the Water Prediction Center/National Water Center (OWP/NWC) ..................................................................................... 38
The Phase 1 diagnostic found that staff in WFOs do not have sufficient time or flexibility to meet IDSS demand due to cookie-cutter fair-weather staffing, current responsibilities, 24/7 requirements, and requirement of two people per shift .................................................................... 39
Some current WFO functions are not effectively delivered within an individual office ................. 45
Span of control for field managers is high ........................................................................................... 47
NWS' organizational health is not sufficient to support performance ............................................. 48
Summary of Phase 1 Findings .............................................................................................................. 53
Ideas on Workforce: .............................................................................................................................. 54
Idea #1: Develop an NWS 101 onboarding program ......................................................................... 54

Note: This document catalogs the findings and ideas of the OWA; it is not an implementation plan.
ii
Idea #2: Create a GS-5/12 meteorologist career progression .......................................................... 56
Idea #3: Improve overall workforce training .................................................................................... 60
Idea #4: Revisit federal qualification standards for meteorologists ............................................... 60
Idea #5: Improve leadership training at all levels ............................................................................ 62
Idea #6: Develop additional MIC/HIC specific training ................................................................... 63
Ideas on Operating model: IDSS .......................................................................................................... 65
Idea #7: Continue to define IDSS and how NWS can become a customer-centric, science-based service organization ............................................................................................................................. 65
Idea #8: Develop IDSS metrics .............................................................................................................67
Idea #9: Establish common partner definitions .................................................................................67
Idea #10: Establish standard service levels for IDSS ........................................................................ 68
Idea #11: Develop additional IDSS-specific training ......................................................................... 69
Idea #12: Build reporting, accountability, and coaching mechanisms to support all MICs/HICs in achieving standard service levels ........................................................................................................ 70
Ideas on Operating model: Collaborative forecast process ................................................................ 71
Idea #13: Develop a collaborative forecast process that leverages technology (e.g., NBM) and reduces grid editing ............................................................................................................................... 71
Idea #14: Establish NCEP as the source for initial forecast guidance .............................................. 73
Idea #15: Develop NCEP common operating picture ......................................................................... 74
Ideas on Organization (Role Clarity and Organizational Health)..................................................... 74
Idea #16: Improve National Service Program role clarity with respect to other parts of the organization involved in integration and program/project management ...................................... 75
Idea #17: Clearly define roles of RFCs and OWP/NWC in the forecast process and IDSS ..............76
Idea #18: Re-evaluate reporting structure for RFCs ......................................................................... 78
Idea #19: Align Tsunami Warning Centers operationally and consider broader changes to program delivery ...................................................................................................................................79
Idea #20: Develop supervisory positions to break large span of control between Regions and WFOs and within WFOs ....................................................................................................................... 80
Idea #21: Focus on priority practices that have outsized influence to improve organizational health...................................................................................................................................................... 80
Idea #22: Establish body of MICs/HICs to advise NWS Governance councils ................................ 81
Idea #23: Utilize and expand internal rotation programs ................................................................ 81
Ideas for Function and Form Changes to Support a Fully Integrated Field Structure .................... 81
Idea #24: Define required office staffing based on criteria that estimate workload ...................... 82
Idea #25: Produce gridded forecasts for an area larger than currently established areas, where possible................................................................................................................................................... 85
Idea #26: Pursue function and form changes: “unlock” staff time at WFOs to focus on activities critically supporting WRN vision ........................................................................................................ 87
Idea #27: Move toward a fully integrated field structure that best positions are human resources where we need them most, and based on the functions of each office .............................................. 94
Idea #28: Establish formal mechanisms for offices to support each other ..................................... 96
Additional ideas not refined by the workstreams ................................................................................97
The benefits for the nation and for NWS staff ............................................................... 97

Note: This document catalogs the findings and ideas of the OWA; it is not an implementation plan.
iii
Moving forward after OWA ........................................................................................... 98
Vision for Evolving NWS and achieving a Fully Integrated Field Structure ................................... 98
Moving towards the vision through test, evaluate, involve ............................................................. 100
Appendix ......................................................................................................................107
Methodology: The methodology for OWA was rigorous, fact-based, and inclusive, involving employees and stakeholders ................................................................................................................ 107
Site visit methodology ......................................................................................................................... 109
Workforce findings ............................................................................................................................... 110
IDSS Findings ........................................................................................................................................ 111
Change management approach to design .......................................................................................... 112
Organizational Health Index (OHI) overview ................................................................................... 113
IDSS staffing level methodology ......................................................................................................... 113
Water services IDSS methodology ..................................................................................................... 121
Table of Key Acronyms ........................................................................................................................ 123

Note: This document catalogs the findings and ideas of the OWA; it is not an implementation plan.
iv
Table of Exhibits
Exhibit 1: Project timeline ................................................................................................................................... 3
Exhibit 2: Summary of findings & ideas from Phases 2-4................................................................................. 6
Exhibit 3: Estimated unmet IDSS needs across the United States identified by the OWA ............................. 9
Exhibit 4: TO and appropriated billets in 2015 ............................................................................................... 15
Exhibit 5: Summary vacancy and attrition rates, 2008-2015 ......................................................................... 16
Exhibit 6: Retirement eligibility as of 2015 ...................................................................................................... 16
Exhibit 7: WFO workload-workforce statistical analysis for all WFO hours ................................................. 18
Exhibit 8: WFO workload-workforce statistical analysis for 1340 series hours ............................................ 18
Exhibit 9: IDSS skill gap.................................................................................................................................... 19
Exhibit 10: Variation in core partners served .................................................................................................. 21
Exhibit 11: Partners are generally satisfied with NWS .................................................................................... 22
Exhibit 12: Partners used non-NWS providers for a variety of reasons ......................................................... 23
Exhibit 13: Partners had a diversity of experiences when learning how to work with the NWS .................. 24
Exhibit 14: Partners did not become much more familiar with understanding how to work with the NWS over time................................................................................................................................. 25
Exhibit 15: Loss events in the US are increasing (Munich RE)....................................................................... 26
Exhibit 16: “What was heard” from external stakeholders during Phase 1 .................................................... 27
Exhibit 17: IDSS operating model varies across WFOs ................................................................................... 28
Exhibit 18: Partner familiarity and use of NWS products varied widely........................................................ 29
Exhibit 19: Customer experience results relating the quality of decision making with respect to different areas of quality service. Across some dimensions of quality service, partners report that the NWS helps them make decisions at a relatively constant rate ............................ 31
Exhibit 20: Federal agency customer service .................................................................................................. 32
Exhibit 21: Duplication of effort in forecast process ....................................................................................... 33
Exhibit 22: Comparison of forecast techniques (Max temperature, Probability of precipitation) in NWS Central Region ....................................................................................................................... 34
Exhibit 23: Comparison of "seams" in NDFD to smooth forecast using a blend ........................................... 35
Exhibit 24: Roles of NCEP Centers vary by service area ................................................................................. 37
Exhibit 25: Division of high seas forecast responsibility vs. shipping lanes .................................................. 37
Exhibit 26: Tsunami Center roles not aligned to partner needs ..................................................................... 38
Exhibit 27: "Cookie-cutter" staffing model at WFOs .......................................................................................40

Note: This document catalogs the findings and ideas of the OWA; it is not an implementation plan.
v
Exhibit 28: MICs report shift requirements constrain IDSS .......................................................................... 41
Exhibit 29: Forecast products over time .......................................................................................................... 43
Exhibit 30: MICs report grid production is not the highest value activity ..................................................... 43
Exhibit 31: Focus on forecasting may limit time for situational awareness ................................................... 44
Exhibit 32: WFO workforce adaptations .......................................................................................................... 45
Exhibit 33: Meteorologist frequency of issuing different warning types ....................................................... 46
Exhibit 34: Number of direct reports at NWS by position .............................................................................. 47
Exhibit 35: Best practices in span of control .................................................................................................... 48
Exhibit 36: Results of Organizational Health Index (OHI) benchmarked against public and private sector McKinsey & Co. database ..................................................................................................... 50
Exhibit 37: Results of Organizational Health Index (OHI) benchmarked against only public sector McKinsey & Co. database ................................................................................................................ 50
Exhibit 38: OHI results compared public sector and professional scientific and technical services ........... 51
Exhibit 39: Senior level managers perceive higher outcomes ........................................................................ 52
Exhibit 40: Organizational Health Index: Free text response to “What is the least rewarding part of your job?” ......................................................................................................................................... 53
Exhibit 41: Summary of Phase 1 key findings .................................................................................................. 53
Exhibit 42: NWS onboarding course concept .................................................................................................. 55
Exhibit 43: Benefits of NWS 101 course ........................................................................................................... 56
Exhibit 44: Potential benefits of GS-5/12 career progression ........................................................................ 57
Exhibit 45: Additional benefits of the GS-5/12 competency-based promotion model .................................. 57
Exhibit 46: Dimensions of GS-5/12 competency model ................................................................................. 59
Exhibit 47: Overview of the 15 competencies that map to the 5 dimensions ................................................. 59
Exhibit 48: Support for revised GS-5/12 progression .....................................................................................60
Exhibit 49: Proposed NWS training journey for Meteorologists ....................................................................60
Exhibit 50: Thoughts on revising 1340 qualifications ..................................................................................... 61
Exhibit 51: Additional thoughts regarding 1340 qualifications ...................................................................... 62
Exhibit 52: Proposed NWS leadership training path ...................................................................................... 63
Exhibit 53: MIC/HIC dedicated course initial thoughts ................................................................................. 64
Exhibit 54: Benefits of MIC/HIC specialized training .................................................................................... 64
Exhibit 55: Proposed IDSS core service level process developed by IDSS workstream ................................ 65
Exhibit 56: IDSS partner categories ................................................................................................................. 68

Note: This document catalogs the findings and ideas of the OWA; it is not an implementation plan.
vi
Exhibit 57: IDSS partner service levels ............................................................................................................ 69
Exhibit 58: IDSS training and suggested additions ......................................................................................... 70
Exhibit 59: Potential spectrum of IDSS support activity (developed by OWA IDSS team in Mobile, AL) .................................................................................................................................................... 71
Exhibit 60: Collaborative forecast process vision ............................................................................................ 72
Exhibit 61: From-to with respect to the forecast process ................................................................................ 72
Exhibit 62: Idea for process flow in collaborative forecast process ................................................................ 74
Exhibit 63: Ideas for NSP roles ......................................................................................................................... 76
Exhibit 64: Idea for local, regional, national IDSS alignment for the NWS water program ......................... 77
Exhibit 65: Idea for water services collaborative forecast process ................................................................. 78
Exhibit 66: Ideas for reporting structure of RFCs ........................................................................................... 79
Exhibit 67: Blueprint for strategic staffing across all field offices .................................................................. 83
Exhibit 68: Blueprint for strategic staffing at National Centers ..................................................................... 83
Exhibit 69: Blueprint for strategic staffing at local offices .............................................................................. 84
Exhibit 70: Scenarios for providing met watch................................................................................................ 86
Exhibit 71: Conceptual diagram of IDSS and met watch staff interaction to serve partners ........................ 86
Exhibit 72: Resource usage in met watch scenarios ........................................................................................ 87
Exhibit 73: From-to on WFO allocation of time ............................................................................................. 88
Exhibit 74: Flexibility needed to support science-based service operating model ....................................... 88
Exhibit 75: "Unlocks" idea to increase flexibility in WFOs ............................................................................. 89
Exhibit 76: Unlocks of WFO staff time .............................................................................................................90
Exhibit 77: Collaborative forecast process "unlock" ........................................................................................ 91
Exhibit 78: 5/12 pathway "unlock" ................................................................................................................... 91
Exhibit 79: Auto-launchers "unlock" ................................................................................................................ 92
Exhibit 80: Met watch backup "unlock"........................................................................................................... 92
Exhibit 81: Shift scheduling flexibility "unlock" .............................................................................................. 93
Exhibit 82: Shift staffing "unlock" .................................................................................................................... 93
Exhibit 83: Total unlock of WFO staff time ..................................................................................................... 94
Exhibit 84: Estimated unmet IDSS needs across the United States .............................................................. 95
Exhibit 85: Potential distribution of weather and water IDSS staff at WFOs (does not include staff for other critical WFO functions) ................................................................................................... 96

Note: This document catalogs the findings and ideas of the OWA; it is not an implementation plan.
vii
Exhibit 86: Objectives supporting vision and mission .................................................................................. 101
Exhibit 87: Staff time “unlocks” ...................................................................................................................... 102
Exhibit 88: Sixteen initiatives for accomplishing five objectives ................................................................. 104
Exhibit 89: Phased approach to acting on OWA ideas. This phased approach depends on availability of resources, which have not yet been budgeted, and future decisions by NWS ............................................................................................................................................... 105
Exhibit 90: Sites visited in diagnostic phase .................................................................................................. 109
Exhibit 91: Drivers of workforce and workload statistical analysis .............................................................. 110
Exhibit 92: Experience versus lead time ........................................................................................................ 110
Exhibit 93: IDSS interpretations ..................................................................................................................... 111
Exhibit 94: Design options ............................................................................................................................... 112
Exhibit 95: OHI survey and methodology ....................................................................................................... 113
Exhibit 96: High-level objective and approach for IDSS segmentation ........................................................ 114
Exhibit 97: Example output of the IDSS-demand segmentation model ...................................................... 118
Exhibit 98: Hypothetical staffing levels by different demand layers............................................................. 119
Exhibit 99: Comparison of different hypothetical staffing methodologies ................................................... 119
Exhibit 100: Hypothetical staffing outcome with IDSS and met watch staff ............................................... 120
Exhibit 101: Hypothetical demand-balanced staffing outcome .................................................................... 120
Exhibit 102: Methodology for estimating water services IDSS demand ....................................................... 121
Exhibit 103: Dimensions for water services demand .................................................................................... 122
Exhibit 104: Distribution of offices by IDSS demand ................................................................................... 122
Exhibit 105: Potential staffing model for water services at WFOs ............................................................... 123

Note: This document catalogs the findings and ideas of the OWA; it is not an implementation plan.
1
Executive Summary Achieving the National Weather Service's mission of protecting lives and property and enhancing the national economy has always required excellent science, forecasts, and warnings. But today, it requires more. It requires forecasters to "go above and beyond the forecast," to deliver improved service to government agencies including State, county, local, and tribal emergency and disaster management agencies, and other agency partners, through actionable information that supports decision making to protect lives and property, a process we now call Impact-based Decision Support Services, or IDSS.
This is the core of the NWS' effort to evolve to build a Weather-Ready Nation, a nation that is ready, responsive, and resilient to extreme weather, water and short-term climate events. As part of this effort, NWS followed a rigorous and inclusive process to gather input and analyze how NWS can create a more flexible, adaptive, collaborative, and effective organization capable of providing the necessary accuracy in our forecasts – with associated impacts – that our partners trust and act upon.
The Operations and Workforce Analysis (OWA) was conducted to generate findings and recommendations to help the NWS move towards the vision of providing IDSS to build a Weather-Ready Nation, and to address recommendations in the National Academy of Public Administration (NAPA) report: Forecast for the Future1. Over the course of two years, the OWA generated a number of findings and ideas. The OWA found that the demand for IDSS outstrips our ability to provide it across every county of the United States, and that our current structure, workflow, and operational processes may not be ideally suited for providing the level of IDSS our partners need. The OWA also confirmed that our professional workforce is highly skilled, trained, and motivated in their mission delivery, and through: 1) Greater focus on the policies and processes behind IDSS; 2) increasing flexibility within our operating model; 3) incorporating new science and technology where appropriate; and, 4) streamlining administrative processes, NWS should be able to unlock the resources needed to provide these services within existing resources over the long term. The analysis gave NWS a large number of ideas to consider and provided a strong basis for evolving the NWS. In the last phase of the OWA, a Program Management Office was established within NWS to thoroughly test and evaluate any concepts, in a deliberate and inclusive manner, before decisions are made to put them into practice.
This catalog details the findings and ideas generated during the OWA from May 2015 to December 2016. The OWA was designed to assess NWS current operations and its workforce to generate ideas and strategies for the NWS to consider in support of the ultimate strategic outcome of building a Weather Ready Nation. It was also designed to respond to recommendations from the National Academy of Sciences2 and the
1 National Association of Public Administration, Forecast for the Future: Assuring the Capacity of the National
Weather Service, 2013 2 Weather Service for the Nation: Becoming Second To None: National Academy of Sciences, 2012

Note: This document catalogs the findings and ideas of the OWA; it is not an implementation plan.
2
National Academy of Public Administration3, which were supported by Congress. At the end of this document is a brief discussion of how NWS are using these OWA findings and ideas to move forward.
The OWA was organized into five phases (shown in Exhibit 1, following page) and reported to an NWS Operations and Workforce Committee (OWC) governance body to guide the project and workstream teams. The National Weather Service Employees Organization (NWSEO) was invited to, and participated, in many of these OWC meetings4. The OWC did not make decisions to implement any of these ideas, but rather guided teams as they refined ideas.
Phase 1, conducted by McKinsey and Co. from May through August 2015produced a baseline framework and gap analysis.
Phase 2, conducted between September and December 2015, saw the creation of four workstream teams comprised of NWS employees and leadership from headquarters and field offices, and were facilitated by McKinsey. These “grassroots” workstreams produced dozens of ideas to address the gaps identified in Phase 1.
Phase 3, (December 2015 through September 2016) involved idea refinementand prioritizing of ideas.
Phase 4, conducted concurrently with Phase 3 between December 2015 andSeptember 2016, focused on gathering key information and feedback frompartners and other key stakeholders.
Phase 5, (October 2016 through December 2016) included selection of asubset of ideas for further exploration, refinement, testing and demonstrationby the NWS.
o During Phase 5, an externally-looking weather enterprise analysis wasalso conducted. The report is published here5.
This catalog is not an implementation plan, nor should the ideas selected for testing and demonstration be misunderstood as final decisions for implementation. Further analysis and testing is required before changes in policy of approach can be adopted. It is also important to note that many of these ideas are strongly tied to each other. Many require a holistic approach to creating a Fully Integrated Field Structure based on a Collaborative Forecast Process to produce accurate and consistent products and IDSS across the entire NWS, meeting the weather, water, and near-term climate needs of decision makers at the local, State, Tribal, and Federal levels who are responsible for the public safety and security of the American people in every community.
3 Forecast for the Future: Assuring the Capacity of the National Weather Service, National Academy of PublicAdministration, 2013
4 NWSEO attendance at these meetings does not equate to approval or negotiation on the part of NWSEO.5 NWS, 2017: National Weather Service Enterprise Analysis Report: Findings on changes in the private
weather industry [2017]. Published: https://www.weather.gov/about/weather-enterprise
Note: This document catalogs the findings and ideas of the OWA; it is not an implementation plan.
3
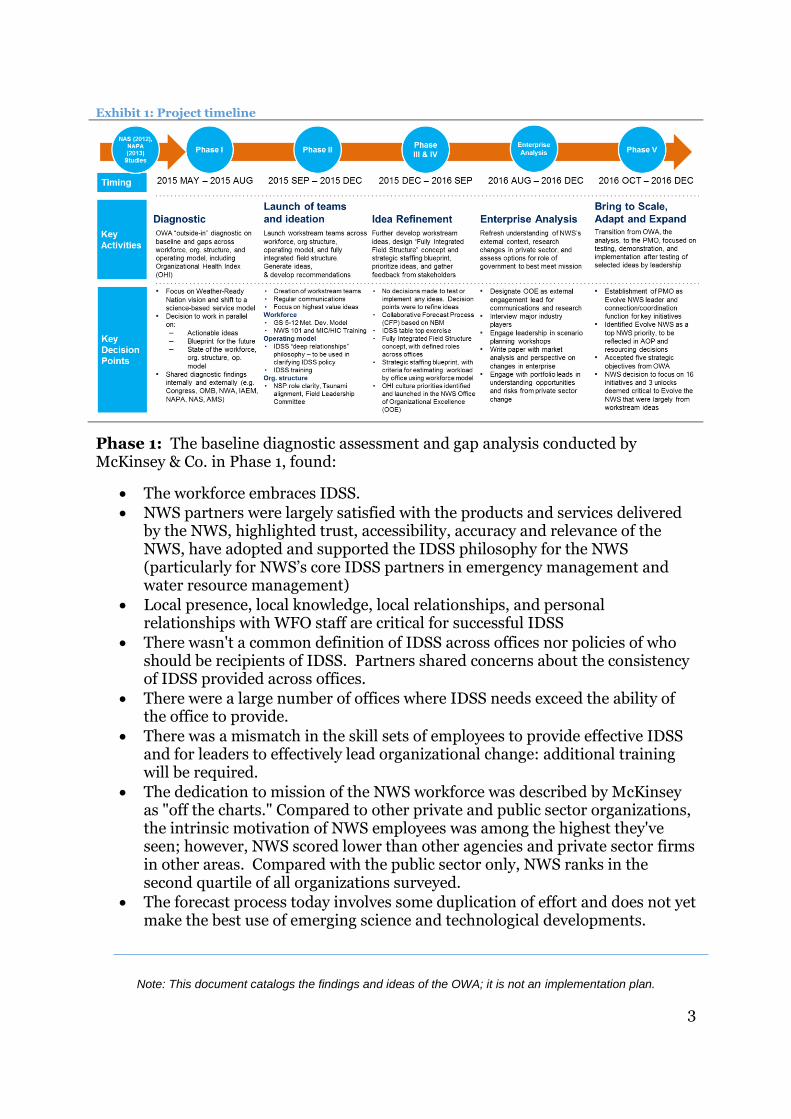
Exhibit 1: Project timeline
Phase 1: The baseline diagnostic assessment and gap analysis conducted by McKinsey & Co. in Phase 1, found:
The workforce embraces IDSS.
NWS partners were largely satisfied with the products and services delivered by the NWS, highlighted trust, accessibility, accuracy and relevance of the NWS, have adopted and supported the IDSS philosophy for the NWS (particularly for NWS’s core IDSS partners in emergency management and water resource management)
Local presence, local knowledge, local relationships, and personal relationships with WFO staff are critical for successful IDSS
There wasn't a common definition of IDSS across offices nor policies of who should be recipients of IDSS. Partners shared concerns about the consistency of IDSS provided across offices.
There were a large number of offices where IDSS needs exceed the ability of the office to provide.
There was a mismatch in the skill sets of employees to provide effective IDSS and for leaders to effectively lead organizational change: additional training will be required.
The dedication to mission of the NWS workforce was described by McKinsey as "off the charts." Compared to other private and public sector organizations, the intrinsic motivation of NWS employees was among the highest they've seen; however, NWS scored lower than other agencies and private sector firms in other areas. Compared with the public sector only, NWS ranks in the second quartile of all organizations surveyed.
The forecast process today involves some duplication of effort and does not yet make the best use of emerging science and technological developments.

Note: This document catalogs the findings and ideas of the OWA; it is not an implementation plan.
4
The operating model and workflow within Weather Forecast Offices (WFOs) and River Forecast Centers (RFCs) is neither flexible nor nimble enough to support the localized service to NWS’s core governmental partners that the emergency management and water resource management communities rely on to build a Weather-Ready Nation.
Phase 2: Development of ideas to address gaps identified in Phase 1 was conducted by several workstreams comprised of McKinsey & Co. and NWS employees: Workforce, Operating Model, Organization (Role Clarity and Organizational Health), and Fully Integrated Field Structure. NWSEO was invited and participated in all of these workstream teams.
Workforce: The team developed training objectives for a recommended NWS onboarding course for all employees, which was subsequently implemented in August 2016, as well as an onboarding course for new Meteorologists in Charge (MICs) and Hydrologists in Charge (HICs). The team also developed ideas for revisiting the GS-1340 qualification standards for meteorologists and instituting new competency-based career ladder from the Intern to the Journeyman meteorologist position (GS-5/12 career progression idea). Competencies in this new career progression align with the future direction of the NWS and ensure that promotions are based on demonstration of knowledge, skills, and abilities. Overall, the workforce workstream recommended actionable improvements to the way NWS hires, develops, promotes, and empowers its workforce to improve service delivery and the organizational health of the NWS.
Operating Model: The Operating Model workstream culled ideas and
recommendations from external reports and incorporated the day-to-day
experiences and testimonials of NWS forecasters to develop ideas and
recommendations to refine the policies, frameworks, customer classifications,
and execution plans of IDSS so the NWS could become a more customer- and
partner-centric, science-based service organization. The workstream found
that NWS partners were quite satisfied with the level of service from the NWS
and that IDSS is critical to governmental NWS partners to help them improve
their decision making related to saving lives and property from extreme
weather, water, and climate events. However, the team also found that IDSS
was currently delivered inconsistently and to varying degrees across offices.
The team proposed, and the NWS validated, a “deep relationships” IDSS
philosophy. The team also proposed a core-service level framework for IDSS,
recommended that the NWS develop IDSS performance metrics, establish
common partner definitions, improve workforce training for IDSS, and build
reporting, accountability, and coaching mechanisms to support all NWS
leadership in achieving standard IDSS service levels.

Note: This document catalogs the findings and ideas of the OWA; it is not an implementation plan.
5
Organization (Role Clarity and Organizational Health): The organization workstream recommended that roles and responsibilities in the WFO require additional clarity, particularly where there is overlap and/or redundancy in products and services. In some cases, staff time is being spent on low-value activities resulting from responsibilities assigned to meteorologists that today are less labor intensive due to scientific and technological advances. Further, in every WFO, it was suggested that the span of control – the number of employees supervised by a single manager – is too large in a modernized service delivery model. This creates a problem with performance management that affects IDSS delivery. Looking within at the workforce, the Organizational Health Index (OHI) survey conducted during Phase 1 and completed by ~50 percent of NWS staff members revealed some ideas for practices that could improve NWS’s organizational health and associated performance.
Fully Integrated Field Structure (FIFS): The “Fully Integrated Field Structure” refers to the size, staffing methodologies, operations, and resource sharing among NWS field offices. The vision for nationally consistent IDSS that meets demand could require additional staff time and/or a shift in the allocation of time spent on certain functions within NWS field offices beyond the time "unlocked" through: 1) a collaborative forecast process, 2) technological innovation, and 3) changes to the forecasters’ career progression. These unlocks are part of a demand-balanced staffing concept meant to provide the local flexibility that can be redeployed on higher value activities so that NWS can take full advantage of its field workforce. If staffing becomes more asymmetric with respect to time of day and location in a future model, there could be an increased need for offices to support each other in new ways. This support could necessitate a “mutual aid” framework providing surge capacity, “hot backup,” and other operational methodologies to make more efficient use of existing resources and an increased focus on IDSS before, during, and after extreme weather, water, and short-term climate events.
Phase 3 outlined the key findings and refined ideas developed by the workstream teams during of the project.
During Phase 4, the OWA workstreams refined ideas further, including: 1) refining the definition of core partners with deep relationships for highest priority IDSS government partners including State, county, local, and tribal emergency and disaster management agencies, and identified "gray areas" (e.g., school districts and hospitals); 2) confirming that most IDSS is provided at the local level; 3) determining that the need for IDSS to core governmental partners for public safety exceeded the capacity at all local WFOs; and, 4) determining NWS should first work to "unlock" time within each WFO to meet the unmet IDSS needs identified by the OWA.
Note: This document catalogs the findings and ideas of the OWA; it is not an implementation plan.
6
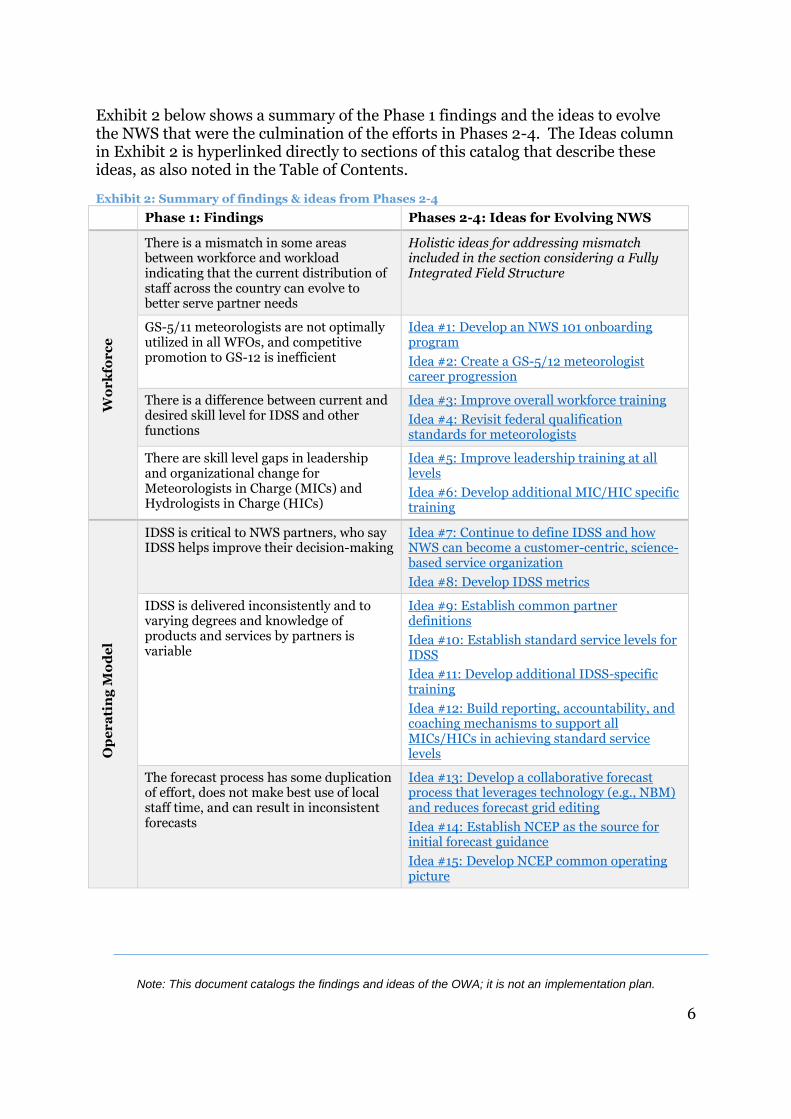
Exhibit 2 below shows a summary of the Phase 1 findings and the ideas to evolve the NWS that were the culmination of the efforts in Phases 2-4. The Ideas column in Exhibit 2 is hyperlinked directly to sections of this catalog that describe these ideas, as also noted in the Table of Contents.
Exhibit 2: Summary of findings & ideas from Phases 2-4
Phase 1: Findings Phases 2-4: Ideas for Evolving NWS
Wo
rk
for
ce
There is a mismatch in some areas between workforce and workload indicating that the current distribution of staff across the country can evolve to better serve partner needs
Holistic ideas for addressing mismatch included in the section considering a Fully Integrated Field Structure
GS-5/11 meteorologists are not optimally utilized in all WFOs, and competitive promotion to GS-12 is inefficient
Idea #1: Develop an NWS 101 onboarding program
Idea #2: Create a GS-5/12 meteorologist career progression
There is a difference between current and desired skill level for IDSS and other functions
Idea #3: Improve overall workforce training
Idea #4: Revisit federal qualification standards for meteorologists
There are skill level gaps in leadership and organizational change for Meteorologists in Charge (MICs) and Hydrologists in Charge (HICs)
Idea #5: Improve leadership training at all levels
Idea #6: Develop additional MIC/HIC specific training
Op
er
ati
ng
Mo
de
l
IDSS is critical to NWS partners, who say IDSS helps improve their decision-making
Idea #7: Continue to define IDSS and how NWS can become a customer-centric, science-based service organization
Idea #8: Develop IDSS metrics
IDSS is delivered inconsistently and to varying degrees and knowledge of products and services by partners is variable
Idea #9: Establish common partner definitions
Idea #10: Establish standard service levels for IDSS
Idea #11: Develop additional IDSS-specific training
Idea #12: Build reporting, accountability, and coaching mechanisms to support all MICs/HICs in achieving standard service levels
The forecast process has some duplication of effort, does not make best use of local staff time, and can result in inconsistent forecasts
Idea #13: Develop a collaborative forecast process that leverages technology (e.g., NBM) and reduces forecast grid editing
Idea #14: Establish NCEP as the source for initial forecast guidance
Idea #15: Develop NCEP common operating picture

Note: This document catalogs the findings and ideas of the OWA; it is not an implementation plan.
7
Phase 1: Findings Phases 2-4: Ideas for Evolving NWS O
rg
an
iza
tio
n (
Wo
rk
loa
d a
nd
Ro
le C
lar
ity
)
There is a lack of role clarity between the National Service Programs (NSPs) and other offices including the National Centers for Environmental Prediction (NCEP) and the Office of Planning and Programming for Service Delivery (OPPSD), as well as inconsistencies in NCEP roles and responsibilities following the 2015 NWS reorganization
Idea #16: Improve National Service Program role clarity with respect to other parts of the organization involved in integration and program/project management
There is a lack of role clarity between River Forecast Centers (RFCs) and the Office of Water Prediction/National Water Center (OWP/NWC); Tsunami Warning Centers are not aligned to partner needs
Idea #17: Clearly define roles for RFCs and OWP/NWC in the forecast process and IDSS
Idea #18: Re-evaluate reporting structure of RFCs
Idea #19: Align Tsunami Warning Centers operationally and consider broader changes to program delivery
Span of control for field managers exceeds best practice standards, reducing ability to provide effective leadership and coaching
Idea #20: Develop supervisory positions to break large span of control between Regions and WFOs and within WFOs
NWS' organizational health is not sufficient to support desired level of high performance
Idea #21: Focus on priority practices that have outsized influence to improve organizational health
Idea #22: Establish body of MICs and HICs to advise NWS Governance councils
Idea #23: Utilize and expand internal rotation programs
Fu
lly
In
teg
ra
ted
fie
ld S
tru
ctu
re
The findings on workforce, operating model, and organization (workload, role clarity, and organizational health) indicate that the current distribution of staff across the country can evolve to better serve partner needs
Idea #24: Define required office staffing based on criteria that estimate workload
Idea #25: Produce gridded forecasts for an area larger than currently established areas, where possible
Many WFOs do not have sufficient time or flexibility to deliver IDSS due to inflexibility in the current staffing model, which includes a “cookie cutter” workforce model across WFOs, 24/7 requirements, and the requirement of 2 people on duty, per shift
Idea #26: Pursue function and form changes: “unlock” existing staff time at WFOs to create flexibility to focus on IDSS and other activities critical to achieving WRN vision
Idea #27: Move toward a fully-integrated field structure that best positions our human resources where we need them most, and based on the functions of each office
WFOs could improve collaboration across neighboring offices and across national, regional, and local offices to deliver better forecasts and services
Idea #28: Establish formal mechanisms for offices to support each other

Note: This document catalogs the findings and ideas of the OWA; it is not an implementation plan.
8
Phase 5 was marked the conclusion of the OWA project and the handoff to the NWS for consideration of ideas, testing, and demonstration. During Phase 5, an externally-looking weather enterprise analysis was also conducted, published here5. During Phase 5, NWS determined that:
NWS needs to evolve in order to be more nimble, flexible, and adaptive to the changing weather, water, and climate needs of its core partners and the Nation
A subset of the recommendations to help evolve the NWS would be transitioned to the testing, demonstration, and evaluation phase within the established NWS Governance structure, to be led by a new Program Management Office (PMO) within the NWS Office of Planning and Planning for Service Delivery (OPPSD).
This subset of recommendations helps “unlock” staff time in forecast offices to meet unmet IDSS needs identified by the OWA.
The first “unlocks” focused on by the NWS are: 1) the Collaborative Forecast Process; 2) GS-5/12 career progression for meteorologists; and, 3) Auto-launchers for upper air observations. These unlocks are discussed further in the “Moving forward after OWA” concluding section of this catalog.
These first three unlocks are aimed at increasing the flexibility within an individual forecast office or center to address the unmet needs for IDSS provided to our core local, State, Tribal, and Federal partners in public safety, emergency management, water resource management, and national security in the overall effort to build a Weather-Ready Nation. These unmet needs, identified by the OWA project, are shown in Exhibit 3. The OWA project found that when delivering IDSS, 94% of the IDSS delivered is delivered at the local level. In addition to providing IDSS for local/State emergency management, NWS also provides direct support to the Navy and the Department of Homeland Security and indirect support to the Air Force.
It is important to note that these unmet IDSS needs across America were only estimated by the OWA. As a result, it is critical that NWS validate these estimates and test and evaluate the impact of these first three unlocks through an ongoing and deliberative process. After the successful testing, evaluation, and implementation of these initial three unlocks, NWS will consider testing, demonstration, and evaluation, and implementation of further ideas in consultation with stakeholders and oversight bodies, and in line with regulations and appropriations guidance. NWS may also take advantage of other low-risk opportunities, such as co-location of NWS offices with State and local emergency management or universities, if and when those opportunities present themselves.
Please also note this catalog only documents the data, analysis, and ideas of the OWA. It is not an implementation plan. Not all of the ideas generated by the OWA have been accepted by NWS senior leadership for testing and demonstration. Ideas not accepted for immediate testing and demonstration may be considered for such activity in the future.

Note: This document catalogs the findings and ideas of the OWA; it is not an implementation plan.
9
Exhibit 3: Estimated unmet IDSS needs across the United States identified by the OWA
Background: NWS is at a critical inflection point In the past 30 years, NWS's forecast and warning skill have improved dramatically. The emergency management and disaster response communities and government agencies that rely on NWS forecasts and warnings for their own decision making have become more sophisticated, and America’s Weather Industry has grown dramatically. Yet, lives and property continue to be lost due to extreme weather, water, and short-term climate events, with an estimated 550 deaths per year6 and an average of five multi-billion-dollar damage events each year, with tropical cyclones inflicting an average of $16 billion in damage per event7. As an example, approximately the same number of lives were lost in the 2011 tornado outbreak as were lost in the 1974 tornado outbreak – over 300 in each case – despite much better forecasts and warnings for the 2011 outbreak. In the 2011 outbreak, NWS provided a week’s notice that an outbreak was likely and over 20 minutes of lead time before tornadoes hit compared with 1974 when warnings were issued only minutes prior8. Given that the number of weather, water, and climate events that result in significant
6 http://www.nws.noaa.gov/om/hazstats/resources/weather_fatalities.pdf 7 http://www.ncdc.noaa.gov/billions/summary-stats 8 National Weather Service, Service Assessment: Historic Tornados of April 2011
Note: This document catalogs the findings and ideas of the OWA; it is not an implementation plan.
10
damage are expected to increase9, the demand for NWS' products and services to save lives and property will only continue to grow. And, the NWS and its many stakeholders realize that achieving NWS' mission of protecting lives and property requires more than the best science. It also requires delivery of improved service to government partners, through actionable information that supports decision making to protect lives and property. NOAA and NWS defined this new vision in NOAA’s 2011 strategic plan as building a “Weather-Ready Nation,” one that is ready, responsive, and resilient to extreme weather, water, and climate events10. Enhancing Impact-based Decision Support Services (IDSS) to partners is a centerpiece of building a Weather-Ready Nation.
While stakeholders, partners, and the National Academies expressed support for the Weather-Ready Nation vision, NWS also heard calls from organizations, including the National Academy of Public Administration (NAPA) and National Academy of Sciences (NAS), to go further to address gaps in capabilities, work collaboratively with internal and external partners, and rethink NWS’s organizational structure, workflow, and operational processes within and across forecast offices, and alignment of resources in order to contribute to the Weather-Ready Nation strategic outcome. This body of work addresses some of those questions, including the need for a holistic operations and workforce analysis. Additionally, NWS employees, via the annual Federal Employee Viewpoint Survey (FEVS) and other feedback mechanisms, have asked for change to improve NWS’s organizational health and culture.
The Academy reports stated that NWS cannot build a Weather-Ready Nation alone, but instead must continue to strengthen partnerships with the broader weather, water, and climate enterprise. While NWS continues to be foundational to the enterprise, major developments in private sector capabilities mean that NWS has an opportunity to reassess its role, making sure its resources are being used in the most effective and efficient way to support government’s core functions: protecting the public and enhancing the public good. Production of life-saving forecasts and warnings and communicating those forecasts and warnings for the protection of life and property to government partners and organizations with public safety missions is an inherently governmental function, as recently stressed in The Weather Research and Forecasting Innovation Act, signed into law in 201711.
9 U.S. Global Change Research Program, Our Changing Planet: The U.S. Global Change Research Program for
Fiscal Year 2016 10 NOAA, “NOAA’s National Weather Service Strategic Plan: Building a Weather-Ready Nation”, June 2011 11 Public Law No: 115-25

Note: This document catalogs the findings and ideas of the OWA; it is not an implementation plan.
11
Project Overview: NWS launched the Operations and Workforce Analysis (OWA) project to chart a path forward In light of the need for NWS to deliver on the Weather-Ready Nation vision and address the challenges associated with the Nation’s increasing vulnerability to extreme weather, water, and climate events, account for stakeholder calls for change, and capitalize on the growth of new technologies in the changing external environment, NWS launched the Operations and Workforce Analysis (OWA) project in May 2015.
The OWA project had the following objectives:
1. Stakeholder Engagement and Change Management: Involve stakeholders throughout the project
2. Current State Baseline: Understand baseline (current) state of operations and workforce through a comprehensive assessment and analysis
3. Evaluation of IDSS: Better qualify and quantify IDSS demand and IDSS provision by the NWS including how it varies geographically, organizationally, and across weather, water, and climate events
4. Current-State Gaps: Identify gaps in the current-state operations, workforce, and, organization that need to be filled to achieve a Weather-Ready Nation and, in particular, provide IDSS
5. Recommendation of Alternatives: Develop recommendation(s) for evolving NWS from its current to future state to close gaps, leverage state-of-the-art science and technology, consider geographic differences, and enable services and workforce concepts in NWS strategic documents
6. Testing, Evaluation, and Implementation Planning: Advance recommendations to action through quick wins and phased testing, demonstration, evaluation and implementation planning
As described above, the OWA project involved five phases: Phase 1) an independent, fact-based diagnostic across NWS' workforce, operating model, and organization by McKinsey and Co.; Phase 2) identification of ideas to address the diagnostic from Phase 1; Phases 3-4) refinement of ideas and alignment on a vision, led by NWS employees from headquarters and the field and involving stakeholders, as well as development of “quick win" ideas and, 5) development of testing, demonstration, and evaluation plans for a subset of initiatives, similarly led by NWS and involving stakeholders, to lead to implementation.
NWS leadership undertook the OWA project with the following considerations regarding scope:
Ensure no adverse impact to the NWS' mission core mission of saving lives and enhancing the nation’s economy

Note: This document catalogs the findings and ideas of the OWA; it is not an implementation plan.
12
Provide appropriate transparency and engagement
Account for changing demographics and unique/regional challenges
Leverage analysis and recommendations from previous studies
Bottom-line reductions in workforce are not a driving factor and should not be a main consideration
Assess infrastructure/facilities implications without seeking office closures, including colocations with partners where opportunities arise
Project future science and technology changes as a factor in
recommendations, especially as they relate to delivering forecasts and
warnings to decision-makers
OWA findings from Phase 1: Diagnostic
STRUCTURE AND GENERAL FINDINGS FROM PHASE 1
The Operations and Workforce Analysis (OWA) team launched Phase 1 in 2015 to establish a baseline understanding of the NWS. The goal of the diagnostic was to develop a current state baseline and assessment of any gaps in the areas of workforce, operating model, and organization required to deliver Impact-Based Decision Support Services (IDSS) – particularly to key partners in emergency management and water resource management – and to achieve the vision of a Weather-Ready Nation.
The current NWS operating model and field structure was designed around radar and other observation technology in the 1980s and early 1990s, when the NWS last modernized. As a result, NWS designed a field structure where a typical Weather Forecast Office was located at or near a weather radar site. Today, NWS has significantly more information available (in terms of extended-range forecasting and short-term situational awareness) as well as communications technology that allow staff to support each other and work collaboratively across the country.
NWS also has enhanced its focus on serving partners. The current workforce was not trained for that focus, nor was the current operating model or organization designed with that focus.
The OWA findings across the workforce, operating model, and organization workstreams highlight the challenges NWS has in meeting its mission, including the demands of delivering IDSS. Many of the findings suggested the current workforce is not positioned to spend time on the highest value activities. In some cases there were inefficiencies from the organization delivering lower-value activities that could be aided by technology or performed by fewer staff. Additionally, staff were not distributed according to workload, both across offices and shifts.

Note: This document catalogs the findings and ideas of the OWA; it is not an implementation plan.
13
The summarized findings from the Phase 1 diagnostic are as follows:
Workforce. There is a mismatch in some areas between today’s workforce and today’s workload. In addition, there is a difference between the current and desired skill level for skills identified as important to IDSS, including written and oral communications designed to support life-saving decisions before and during extreme events. In addition, the career progression and competency model for early to mid-career meteorologists could be improved.
Operating Model. Core partners strongly trust and rely on the NWS. Multiple examples of IDSS were observed as well as generally high customer satisfaction. However, IDSS was found to be largely undefined, including what IDSS products are provided, how IDSS is delivered, when IDSS is delivered, and to whom IDSS is delivered. The forecast process contains some duplication of effort, low-value activities, which can lead to inconsistencies between forecast shifts, across local offices, and between national and local offices.
Organization (Workload, Role Clarity, and Organizational Health). The current field structure, particularly how NWS employees and resources are located across the country, does not necessarily support the full range of IDSS demand. The roles and responsibilities of field offices require additional clarity, particularly where there is overlap. Within WFOs, staff time is not being spent on the highest value activities due to the rigidity of the forecast process and inflexibility of the NWS staffing structure. Collaborative tools are needed to improve flexibility. Additionally, while the local reach of NWS field offices supports IDSS delivery, there are some functions that could be more effectively and efficiently delivered. Within many offices, the span of control for field managers is too high to manage in the new service delivery model. Moreover, the Organizational Health Index (OHI) survey completed by approximately 50% of NWS staff, including NWSEO members, revealed that NWS has overall low health scores compared to the McKinsey global benchmark of public and private sector organizations, including in areas such as "innovation and learning" and "coordination and control." Yet, strengths in "motivation" and "external orientation" were identified.
NWS has an opportunity to address the challenges across its workforce, operating model, and organization to deliver on the vision for Weather-Ready Nation and to meet its mission of protecting lives and property.
PHASE 1 FINDINGS ON NWS' WORKFORCE
Summary Statement: There is a mismatch in some areas between today’s workforce and today’s workload. In addition, there is a difference between the current and desired skill level for skills identified as important to IDSS, including written and oral communications designed to support life-saving decisions before

Note: This document catalogs the findings and ideas of the OWA; it is not an implementation plan.
14
and during extreme events. In addition, the career progression and competency model for early to mid-career meteorologists could be improved.
There is a mismatch in some areas between workforce and workload
Current and future workforce supply
Currently, the NWS workforce is highly dispersed with the majority of staff (82 percent) working within one of the 183 field offices. The NWS average vacancy rate was 8 percent of appropriated positions as of July 2015, the time of the analysis. The largest number of vacancies occurs in the field, and the highest percent of vacancies occur in headquarters. While vacancy rates vary by position, the highest absolute number of vacancies occurs in meteorology positions, but the rates of vacancies are higher in non-meteorological positions. Vacancies in RFCs are similar across support and hydrology positions, while at headquarters, many of the vacancies are in support positions.
There are two key change drivers in the NWS workforce supply: hiring and attrition. External hires increase the workforce supply; however, many of NWS hiring actions are internal promotions, which do not increase the overall onboard strength. While the attrition rate has remained constant at around 5% over the over the last 5 years, hiring has not kept pace, resulting in a net decrease in employees. While hiring rates have improved in the past two years compared with the low point in 2013, significant hiring challenges and high retirement eligibility pose potential challenges in the future.
An increased hiring rate, following the trend of the last two years, could offset attrition losses. However, even with increased hiring rates, vacancies will likely continue to persist. If the hiring rate were to remain at the 2015 current level, vacancies could continue to increase through 2025.
The current career path for most NWS meteorologists starts in the intern position, though there are not currently enough interns in the NWS to fill the vacancies and expected attrition in the journeyman forecaster positions. In addition, past hiring freezes, coupled with the time required to develop senior meteorologists and hydrologists, have contributed to a potential leadership gap. There are additional challenges in career paths for hydrologists and hydrometeorological technicians (HMTs) due in part to both positions usually sharing a common hiring process with forecaster positions.
Exhibit 4 below illustrates the difference between the Table of Organization (TO), appropriated and filled billets at NWS for 2015, when the analysis was conducted. The TO, appropriated billets and the number of billets NWS can afford to fill are

Note: This document catalogs the findings and ideas of the OWA; it is not an implementation plan.
15
based upon the current year appropriation, budget allocation, and fixed costs, and may change year to year12.
Exhibit 4: TO and appropriated billets in 2015
Further, through 2015, the NWS vacancy rate trended upwards (Exhibit 5, below). And, as shown in Exhibit 6, below, approximately 42 percent of NWS employees will be eligible for retirement in the next five years. This provides an additional challenge for the NWS to maintain or increase its onboard strength.
12 Appropriated billets represents the share of the table of organization that is funded via NWS appropriations (not interagency reimbursable agreements), and is aligned with the FTE and position estimates in the President's Budget. Likewise "unappropriated billets" represent billets in the table of organization that represent NWS requirements but are not identified as funded in the President's Budget.

Note: This document catalogs the findings and ideas of the OWA; it is not an implementation plan.
16
Exhibit 5: Summary vacancy and attrition rates, 2008-2015
Exhibit 6: Retirement eligibility as of 2015

Note: This document catalogs the findings and ideas of the OWA; it is not an implementation plan.
17
Current and future workload demand
In order to understand the distribution of NWS' workforce compared to expected NWS workload, the OWA project estimated expected workload using a set of independent drivers, including severe weather events, the population and area of responsibilities served, IDSS expectations, programs managed by the offices, and others (see Appendix, Workforce Findings). It is important to note that WFO workload drivers are not independently correlated to workload in offices. Many workload drivers have varied between 2008 and 2014 with no significant patterns related to workload data emerging in that time period. Individual occurrences of severe weather events alone do not directly correlate with a WFO’s workload, even when accounting for office size. Existing data does not currently measure the duration of individual severe weather events, as frequent long-tail adverse weather events could disproportionally increase workload relative to other offices.
There is also a varying level of overtime by year, but WFOs have the highest amount of overtime by hours. CWSUs and RFCs have varying levels of overtime from office to office. In terms of total workload, there is not a wide variation between offices in total hours worked per FTE, and this has remained relatively constant over time. NCEP’s total workload includes relatively low overtime levels that have not varied over time.
There was a mismatch between workforce and workload
The diagnostic analysis projected the difference between the workforce (hours actually worked) and expected workload (based on workload drivers described) for WFOs from 2008 to 2014 (Exhibit 7). The regression analysis included a set of statistically significant workload drivers. The model achieved statistical significance with an f-statistic of 32.02 with a confidence interval of greater than 99 percent as well as an r-squared value of .5392. It indicated that a gap exists between today’s expected workload and today’s workforce (e.g., actual hours worked including overtime) that varies by WFO.
The difference varied across WFOs, with the regression projecting a higher expected workload than actual hours worked for some WFOs, while projecting a lower expected workload than actual hours worked for others. Severe weather and additional IDSS could exacerbate this gap in both cases. The type of office with a high expected workload also varied depending on the type of work included in the model, and whether the hours were for the entire office or just for 1340 series meteorologists. Due to differences in how positions are used across offices, there were further limitations in comparing across offices using only series 1340 meteorologist hours. As Exhibit 7 indicates below, there were relatively more offices where workload (demand) exceeded the available workforce (supply). When the analysis was conducted using only 1340 meteorologist hours, there was an increase in the number of offices with a deficit of workforce to anticipated workload (Exhibit 8).

Note: This document catalogs the findings and ideas of the OWA; it is not an implementation plan.
18
Exhibit 7: WFO workload-workforce statistical analysis for all WFO hours
Exhibit 8: WFO workload-workforce statistical analysis for 1340 series hours

Note: This document catalogs the findings and ideas of the OWA; it is not an implementation plan.
19
It is important to note that the model contains a variety of limitations. First, it did not match exact workload hours to drivers of workload (e.g., tropical storms cause x hours of workload). Second, it did not provide an absolute understanding of whether WFOs do or do not have the “correct” workload or workforce (WFOs were evaluated on a relative basis, not compared to what the world “should” look like under different assumptions). Additionally, it did not account for vacancies within offices, as vacant positions do not count positively or negatively towards the workload of the office as a whole. Finally, it cannot provide a recommended list of offices to make changes.
The diagnostic identified a difference between current and desired skill level for IDSS
In a skill assessment, supervisors indicated skill gaps exist in the written and oral communications skills required to perform IDSS. The full skill assessment revealed gaps in skills especially for those identified as important to IDSS and for the intern and forecaster positions. A talent systems assessment also highlighted strengths in capabilities and talent pools for key roles, but opportunities for improvement in the areas of workforce planning, hiring, performance management and training.
Exhibit 9: IDSS skill gap
GS-5/11 meteorologists are not optimally utilized in all WFOs, and competitive promotion to GS-12 is inefficient. Meteorologists are currently hired into the NWS as a GS-1340-5/11 Intern position. The Intern position is distinct from the GS-1340-12

Note: This document catalogs the findings and ideas of the OWA; it is not an implementation plan.
20
Forecaster position both in responsibilities and in career pathway. GS-5/11 Intern meteorologists are not technically required to formally perform forecasting and IDSS duties today (although roles vary considerably across offices). GS-5/11 Intern positions operate the Public Service Unit, which involves answering general public inquiries, monitoring and managing NOAA Weather Radio messages, launching weather balloons and quality controlling observations. Increasingly, they perform general outreach tasks such as managing social media presence and assisting with preparation for webinars.
In order to become a GS-12 forecaster, Interns must compete for a GS-12 position, which requires additional hiring actions, contributing to the NWS hiring backlog. In many cases, promotion to GS-12 requires taking an opening in a different office that can result in Permanent Change of Station (PCS) costs to the organization.
Intern and Forecaster positions operate distinctly, yet the large majority of GS-12 forecaster roles are filled by Interns. The disconnect between the GS-5/11 positions and the GS-12 position does not make the best use of the skills of early career meteorologists, does not set up the most efficient training path to the GS-12 position consistently across the NWS, contributes to hiring delays, incurs additional expenses, and does not adequately train and involve GS-5/11 meteorologists in providing IDSS.
PHASE 1 FINDINGS ON NWS' OPERATING MODEL
Summary Statement: Core partners and governmental officials at the local, State, Federal and Tribal levels strongly trust and rely on NWS and value the IDSS provided by the NWS. Many shining examples of IDSS were observed, as well as generally high customer satisfaction. However, IDSS was largely undefined, including what IDSS products are provided, how IDSS is delivered, when IDSS is delivered and to whom IDSS is being delivered. Additionally, the forecast process contains some duplication of effort and can lead to inconsistencies between forecast shifts, across local offices, and between national and local offices.
PHASE 1 FINDINGS ON NWS' OPERATING MODEL: IDSS
Uncertainty regarding IDSS partner types and metrics for IDSS across NWS offices
The external stakeholder landscape is composed of several interconnected networks of which the NWS is an important part. This network includes research and academic councils, core partners, media companies, the commercial weather industry, and other external stakeholders such as schools and hospitals. The general public is included as a user of the weather information disseminated from the overall enterprise.

Note: This document catalogs the findings and ideas of the OWA; it is not an implementation plan.
21
The definition of a “core partner” has been outlined in NWS Policy Directive 1-1003 and includes members of the emergency and disaster management communities, government partners, and members of the electronic media (assuming they have dissemination capabilities for weather information). Further guidance issued in the Service Description Document in 2014 articulated the stakeholders who are, and are not, included in the definition of “core partners.” However, site visits and interviews indicated that some offices consider stakeholders who are not part of the definition of “core partners” to be critical, including the general public and utilities and other various local institutions. This suggests that the existing policy has not yet been fully internalized and operationalized by employees throughout the organization. As such, there is variation in partners served.
Exhibit 10: Variation in core partners served
13 At the time of publication of this catalog, NWS has also considered adding a 4th partner category for the
water resources management community.
A review of partners identified by local offices, conducted in February and July of 2016, revealed that there is wide variation in types and number of partners served. Offices identified anywhere between 100 and 1,000 core and deep partners14. Offices in the same state often report serving the same state partners, while interviews with partners suggest that additional coordination is required for supporting partners who work with more than one WFO regularly15. WFOs also acknowledged the need for additional guidance on whether to serve certain types of partners (e.g., schools, hospitals, utilities and infrastructure providers, and public health entities). There is no standard policy across offices, and as such, practice varies widely.
13 At the time of publication of this catalog, NWS has also considered adding a 4
th partner category for the water
resources management community. 14 February 2016 initial data call to NWS offices, and subsequent follow-up interviews with WFO managers 15 Interviews with NWS state-level core partners
La
st M
od
ified
9/2
9/2
01
6 1
2:3
9 A
M In
dia
Sta
nd
ard
Tim
eP
rinte
d
10Draft/Pre-decisional — Proprietary and confidential
…
SOURCE:
Official definition of “core
partner” via NWS directives
“Government and non-
government entities which are
directly involved in the
preparation, dissemination and
discussions involving hazardous
weather or other emergency
information put out by the
National Weather Service”
▪ Core partners clarified to
include
– Member of the emergency
management community
– Government partners
– Members of the electronic
media
OPPSD clarification of NWS Directive describing core partners and WFO
employee regarding the definition of IDSS stakeholders
▪ State emergency
manager
▪ Fire department
▪ Local TV station
▪ Hospital
▪ School principal
▪ NWS spotter
▪ Public utility
▪ Storm chaser
“Of course hospitals make decisions on whether
to evacuate large numbers of people, they also
control the lives of large number of people”
“What about public schools? Not all public
schools have emergency managers who relay
information to them like the cities do”
“We have private industry (a nuclear power
plant) running critical infrastructure; why aren’t
they a core partner?”
“Utilities have to know days in advance of a
weather system – that does not affect property?”

Note: This document catalogs the findings and ideas of the OWA; it is not an implementation plan.
22
Existing metrics used to evaluate the effectiveness of IDSS products and information include NWS Service Assessments, stakeholder feedback, and Government Performance and Results Act (GPRA) data. NWS Service Assessments often include a strong focus on the outcomes of extreme weather events on life and property, and are often linked closely to the IDSS definition in the Weather Ready Nation Roadmap v2.0. Likewise, stakeholder feedback often focuses on the impact that NWS information had on stakeholder decisions. However, these metrics are difficult to implement systematically for all weather events across the organization because they rely on qualitative feedback and are resource-intensive to develop. On the other hand, GPRA data is collected across the organization but taken alone as a measure of forecast accuracy and utility, which is output-focused and less tied to impact.
Most partners are very satisfied with the support they receive from the NWS
NWS conducted two partner surveys in 2015 – an IDSS-focused survey sent by WFOs to their local core partners, and a customer experience (CX) survey sent to a wider variety of public and private partners from national to local. More information about the specific surveys can be found in the Appendix. The vast majority of partners surveyed in 2015 (96 percent) reported that they were either satisfied or extremely satisfied with the service they receive from the NWS. In addition, 80% of respondents said that the information they receive affects their decision-making.
Exhibit 11: Partners are generally satisfied with NWS
Through the survey and interviews, external stakeholders praised the NWS and highlighted trust, accessibility, accuracy, and relevance as the key themes. The diagnostic found local presence, local knowledge, and local relationships are critical
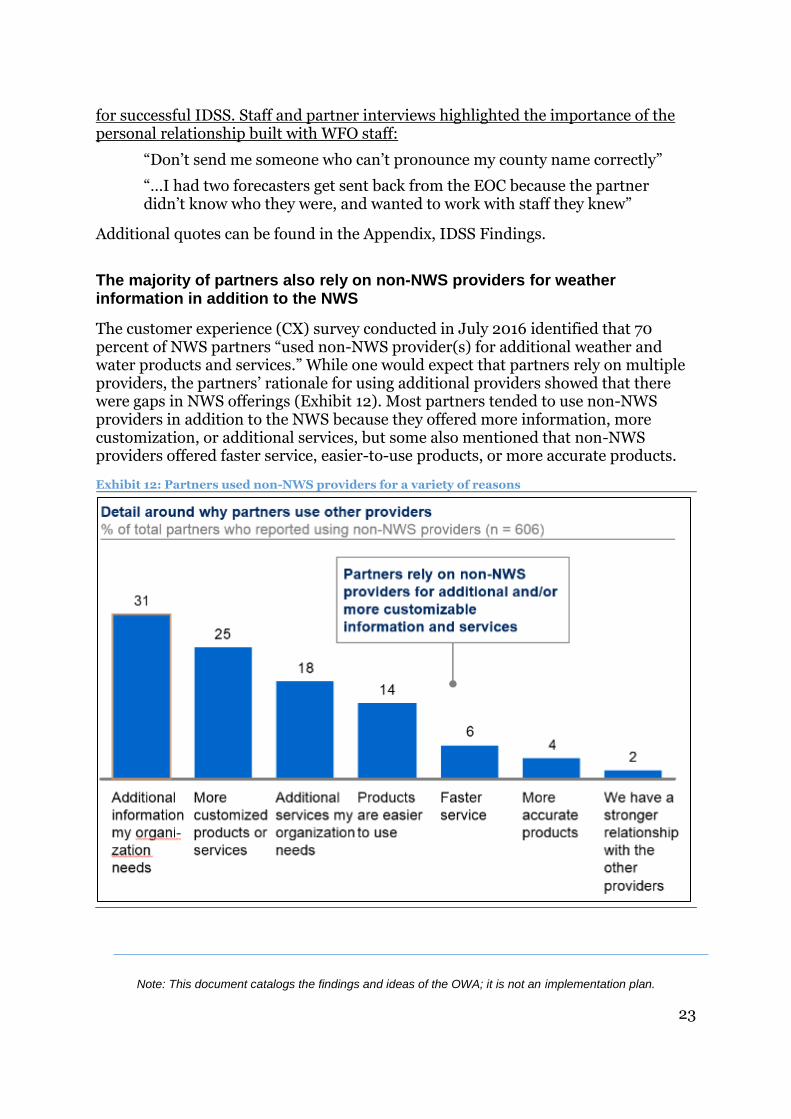
Note: This document catalogs the findings and ideas of the OWA; it is not an implementation plan.
23
for successful IDSS. Staff and partner interviews highlighted the importance of the personal relationship built with WFO staff:
“Don’t send me someone who can’t pronounce my county name correctly”
“…I had two forecasters get sent back from the EOC because the partner didn’t know who they were, and wanted to work with staff they knew”
Additional quotes can be found in the Appendix, IDSS Findings.
The majority of partners also rely on non-NWS providers for weather information in addition to the NWS
The customer experience (CX) survey conducted in July 2016 identified that 70 percent of NWS partners “used non-NWS provider(s) for additional weather and water products and services.” While one would expect that partners rely on multiple providers, the partners’ rationale for using additional providers showed that there were gaps in NWS offerings (Exhibit 12). Most partners tended to use non-NWS providers in addition to the NWS because they offered more information, more customization, or additional services, but some also mentioned that non-NWS providers offered faster service, easier-to-use products, or more accurate products.
Exhibit 12: Partners used non-NWS providers for a variety of reasons

Note: This document catalogs the findings and ideas of the OWA; it is not an implementation plan.
24
Partners had varied experiences when initially learning how to work with the NWS
While partners were overall very satisfied with the NWS, there was significant variability around how they learned how to work with the NWS. When asked in the CX Survey, “How satisfied were you with the process through which you learned how to work with the NWS?” about half of partners rated their satisfaction at a 7 (out of 10) or below (Exhibit 13). This data suggest that a more structured onboarding process or training process for those currently at the NWS could be beneficial when interacting with new partners or new staff at partner organizations. In addition, a more structured partner training and assistance model may also help. Overall, about 70 percent of participants were very satisfied16 with the level of accuracy in forecasts, 70 percent of participants were very satisfied with the consistency of forecasts and messaging, and six percent of participants were very satisfied with the level of customization.
Exhibit 13: Partners had a diversity of experiences when learning how to work with the NWS
Additionally, surveying partners indicated that they did not become much more familiar with how to work with the NWS over time (Exhibit 14). Partners with 11+ years of experience working with the NWS showed almost the same levels of understanding of how to work with the NWS as those with five years or less of
16 Very satisfied includes 9 and 10 ratings

Note: This document catalogs the findings and ideas of the OWA; it is not an implementation plan.
25
experience. This indicates that NWS should work on continually developing partner relationships, assessing their needs, and providing products and services that are relevant to those needs.
Exhibit 14: Partners did not become much more familiar with understanding how to work with the NWS over time
Phase 1 found that IDSS is delivered inconsistently and to varying degrees
Despite high levels of satisfaction, not all partners receive the level of service they expect or that NWS believes they need. Interviews with partners and field leadership highlight several cases:
Managers and partners reported that they would value additional daytime hours from local WFO staff to assist in interpreting forecasts and preparing for events
Several field leaders and partners have reported needs for dedicated liaisons (e.g., FEMA, CDC) or for event-driven embedding of NWS staff (e.g., state EOC): “Our operations were delayed every day because we could not understand the forecast, and we did not have anyone by our side to help us.”
NWS managers report that their office is not able to serve certain key decision-makers in their area of responsibility due to staffing constraints (e.g. Port Authority of NY and NJ, state government).
Managers and staff report that they are not consistently able to schedule meetings with partners due to shift rotations.

Note: This document catalogs the findings and ideas of the OWA; it is not an implementation plan.
26
Partners have also reported frustration with the varying consistency of NWS products and levels of service between WFOs within a state. One state-level EM confided that they had learned to simply avoid interacting with certain WFOs altogether due to poor service.
Partners report that their local WFO does not have time to prepare products they need for decision-making: “…forecast information [from NWS] is distilled into high-level briefing documents and distributed to our partner organizations…similar products could be created by NWS personnel which would save time and, more importantly, limit potential interpretation inaccuracies”
Additionally, demand for NWS services may increase over time, as weather trends suggest increased volatility and vulnerability of the population (Exhibit 15).17
Exhibit 15: Loss events in the US are increasing (Munich RE)
In sum, though generally high customer satisfaction was observed in the diagnostic surveys and interviews, areas for improvement were noted. Specific areas for improvement for NWS included realigning its product set, tailoring communication, increasing capacity, and improving precision. Some external partners and stakeholders, particularly in the private sector, also noted confusion about IDSS and the bounds of the service provided.
17 Munich RE; Environment America
Loss Events in the US (1980-2015)

Note: This document catalogs the findings and ideas of the OWA; it is not an implementation plan.
27
Exhibit 16: “What was heard” from external stakeholders during Phase 1
The diagnostic found that across the NWS, there are differences in the interpretation of IDSS along four key dimensions: “what” IDSS means, “how” IDSS is delivered, “to whom” IDSS is delivered, and “when” IDSS is delivered (Appendix, IDSS Findings). These differences in interpretation lead to variations in how offices are performing IDSS.
The Phase 1 diagnostic found that IDSS is often performed according to three different office structure archetypes. First, Type 1 offices concentrate IDSS activities among certain people in the office. Examples include offices where managers and senior forecasters are responsible for external relationships. Others decide that certain employees should not engage in IDSS – either because of lack of skill sets or by personal choice. Type 2 offices establish a dedicated IDSS shift that is staffed throughout each day or combine IDSS duties behind the Public Service Unit. These offices mostly staff forecasters on these desks, but the specific responsibilities rotate among employees from day to day. Finally, Type 3 offices adopt the “whole office” concept where it is the responsibility of all operational employees at all times to engage in IDSS on an as-needed basis. In these cases, IDSS is understood to be a part of the responsibility of every shift or desk in the rotation (Exhibit 17).
La
st M
od
ified
9/2
7/2
01
6 1
0:4
7 P
M E
aste
rn S
tan
da
rd T
ime
Prin
ted
8/2
9/2
01
6 8
:25
AM
Ea
ste
rn S
tan
da
rd T
ime
2Draft/Pre-decisional — Proprietary and confidential
What was heard
SOURCE: Site interviews
Realigning
products
Key themes
Tailoring
communi-
cation
Improving
precision
What was heard
“Too many products means that people need to
go to multiple places for relevant products--
needs a reorg around key customers”
“Communication within products needs to be
concise and consistent”“The feedback loop could be better—there is not
as much after action sharing about learning”
“Need more help with damage assessments
after the events—we cannot always count on
this at all or in a timely way"
“We would love to see more finer lines of
accuracy—and greater degrees or at least
transparency on the degree of certainty and
confidence in the forecasts”
“Timing of products to link up with customer
needs (particularly broadcast media); otherwise
they lose dissemination value”
“Apps, social media and texts need to be built
quickly--websites are becoming obsolete”
“EAS notices are not targeted enough for
locations because they’re based on census
areas”
“We could use more training—for example with
storm spotting”
“More capacity overall but especially with our
end users (business other government agencies
and consumers) for IDSS -- "we need more on-
site capacity pre and during events”
“NWS should really push for an end to end view
multi-party view especially on water -- can we
share more data?
Increased
capacity
“We need someone on-site. [In a recent event]
our operations were delayed every day because
we couldn’t understand the forecast”

Note: This document catalogs the findings and ideas of the OWA; it is not an implementation plan.
28
Exhibit 17: IDSS operating model varies across WFOs
Knowledge of NWS products is variable across partners
Along with inconsistencies regarding the delivery of IDSS to partners, the Phase 1 diagnostic also found inconsistencies around the delivery of products to NWS partners. In the CX Survey, partners were asked to rate NWS products and services along 3 dimensions: 1) had they used the products before; 2) were they aware of the products but had not used them before; or, 3) were they unaware of the products? The responses showed that partners had variable awareness of the NWS product suite and used products in varying amounts (Exhibit 18).
Towards the top of Exhibit 18, the majority of partners had used and were aware of products such as watch, warning, or advisory notifications; web-based forecast products; forecast discussion and other written text products, observations, the public website, etc. However, towards the bottom, less than half of partners had used products like the online restricted access sections, 700/800 MHz radio, on-site deployments or embedded NWS staff, online trainings, NWS chat, etc. While not all products are relevant to all partners, this research begs the question – are the most valuable NWS products being used by our partners? Should the NWS invest more in heavily used products and/or divest in certain less-utilized products?
La
st M
od
ified
9/2
7/2
01
6 1
0:4
7 P
M E
aste
rn S
tan
da
rd T
ime
Prin
ted
8/2
9/2
01
6 8
:25
AM
Ea
ste
rn S
tan
da
rd T
ime
3Draft/Pre-decisional — Proprietary and confidential
Type 1: Only select staff manage
external relationships on behalf of
the office
MIC
SOO WCM
Lead
Forecaster
Lead
Forecaster
Lead
Forecaster
Lead
Forecaster
Lead
Forecaster
General
Forecaster
General
Forecaster
General
Forecaster
General
Forecaster
General
Forecaster
OPL
HMT/
Intern
HMT/
Intern
HMT/
Intern
HMT/
Intern
IDSS operating model varies across WFOs
MIC
SOO WCM
Lead
Forecaster
Lead
Forecaster
Lead
Forecaster
Lead
Forecaster
Lead
Forecaster
General
Forecaster
General
Forecaster
General
Forecaster
General
Forecaster
General
Forecaster
OPL
HMT/
Intern
HMT/
Intern
HMT/
Intern
HMT/
Intern
Type 3: All staff provide IDSS
support and during severe weather
events flex to provide support
Type 2: Operational staff rotate
through dedicated IDSS, media, or
public desk shifts
MIC
SOO WCM
Lead
Forecaster
Lead
Forecaster
Lead
Forecaster
Lead
Forecaster
Lead
Forecaster
General
Forecaster
General
Forecaster
General
Forecaster
General
Forecaster
General
Forecaster
OPL
HMT/
Intern
HMT/
Intern
HMT/
Intern
HMT/
Intern
SOURCE: Site interviews
Staff dedicated to IDSS IDSS shift

Note: This document catalogs the findings and ideas of the OWA; it is not an implementation plan.
29
Exhibit 18: Partner familiarity and use of NWS products varied widely
This data also suggested that the NWS could consider more actively marketing its services to partners and increase communication and training for new products. In the CX survey, several partners provided unsolicited comments that mentioned they would like the NWS to be more proactive about educating them on products:
“Continue reaching out to organizations and let them know what new NWS products and services are available.”
“When new products come out, share them and teach us how to use them.”
IDSS is critical to NWS partners, who say IDSS helps improve their decision-making
In the diagnostic, partners said that Impact-based Decision Support Services help improve their decision making:
“During a severe weather event, NWS helps us ensure there’s not going to be a large loss of life.”
Trust and relationship building were often cited as primary reasons for satisfaction with NWS, including,
“I trust my partners at NWS and I know them – the tone of their voice, the way they report out to us. And they know me.”

Note: This document catalogs the findings and ideas of the OWA; it is not an implementation plan.
30
NWS IDSS was cited as being timely, relevant, and accurate, and highly valued for decision making. Partners also commented that they valued NWS' role as a translator of scientific information into actionable insights.
The NWS may be over-serving some partners
Despite high levels of quality service experienced by partners, partners indicated that higher service did not always correlate with improved decision-making. In the CX Survey, partners rated the NWS highly across quality service dimensions, which were defined as the following:
Components related to NWS staff:
Strong relationships with the NWS
Live support from the NWS
Timeliness of response
A courteous staff member
Accessibility of staff
Proactive nature of NWS staff
Components related to NWS products:
Accuracy of forecasts
Consistency of forecasts and messaging
Level of customization
However, even at lower levels of quality service, partners reported similar levels of decision-making, suggesting that the lengths that NWS staff go to serve partners well (e.g., serving them quickly, with frequent live support) may not be necessary to help them achieve their missions. For example, in the first chart in Exhibit 19 related to relationships, partners who did not have strong relationships with the NWS still reported being able to make decisions at almost the same level as those who did have strong relationships in the NWS. A reason could be that partners are not aware or do not understand NWS products and services, as indicated in Exhibit 18. Similarly, looking at the last chart in Exhibit 19, partners who received information in less than an hour were able to make decisions at almost the same rate as those who received information within several days. While this result may be a function of service area or the time required for different types of weather phenomena, another explanation could be that the NWS may be over-delivering in some cases and could vary service levels by partner needs.

Note: This document catalogs the findings and ideas of the OWA; it is not an implementation plan.
31
Exhibit 19: Customer experience results relating the quality of decision making with respect to different areas of quality service. Across some dimensions of quality service, partners report that the NWS helps them make decisions at a relatively constant rate

Note: This document catalogs the findings and ideas of the OWA; it is not an implementation plan.
32
Exhibit 20: Federal agency customer service
PHASE 1 FINDINGS ON NWS' OPERATING MODEL: FORECAST PROCESS
The forecast process has some duplication of effort, does not make best use of local staff time, and can result in inconsistent forecasts
The current forecast process at NWS involves all field offices and results in some degree of duplication across those offices. The primary area of duplication is in creating forecasts for the near-term (0-48 hour time range), though WFOs and NCEP overlap meaningfully in the medium to long-range as well (48 hours – 1 week)18. While there is some rationale for field offices to add expertise to the forecast, roles are not clear. As such, NCEP invests time and effort in creating forecasts, often referred to as guidance, distinct from WFO forecasts. The WFO forecasts are used to create most of the National Digital Forecast Database (NDFD), which is available to the public and used for IDSS. NCEP forecasts, often in graphical (not GIS) form, are also available to the public and used by some partners for IDSS.
18 Interviews with NWS managers, site visits, review of products and services

Note: This document catalogs the findings and ideas of the OWA; it is not an implementation plan.
33
Exhibit 21: Duplication of effort in forecast process
The current NDFD forecast process is decentralized and largely governed by local office policies. NWS stitches together individual, independent forecasts created at its 122 WFOs to create a national forecast. Many meteorologists at NWS manually select model guidance to incorporate into forecasts on each shift, for the majority of elements, despite the evidence that ensemble blends are on average increasingly suitable for most elements during most times19. Each office may develop its own unique tools for its meteorologists to use to populate the gridded forecast (i.e., the GIS-based forecast for the country) from the multitude of models available, to create additional forecast fields (e.g., weather type), and to adjust individual elements (e.g., temperature, precipitation).
Some NWS Regions have adopted regional policies that require the use of a common starting point for the forecast using blended models, and collaboration across WFOs if changes are made. Model blends work by bias-correcting model inputs and assigning weights to those inputs based on past performance to develop blended model grids. In Central Region, analysis has shown that the regional blend (SuperBlend), with and without the European model included (SuperBlend2 excludes the European model), is on par with or superior to the official WFO-generated grids20. The analysis included in Exhibit 22 is not intended to be generalized to all elements or events, but suggests model blends can provide a starting point for forecasting. Initial analysis of the National Blend of Models shows that it will likely be similarly skillful, although currently the NBM version 2.0 does not contain the full set of elements needed (NBM version 3.0 is scoped for all
19 Interviews with NWS managers, site visits; SuperBlend verification; Initial NBM verification 20 Central Region Scientific Services Division
Forecast process Forecast process
for subset of offices
Time period of primary
overlap across NWS
5 Inter-seasonal to inter-
annual (e.g., outlook)
3-4 weeks (e.g., guidance)4
1-2 weeks (e.g., threat
assessments)
3
48 hours-1 week (e.g.,
forecasts, watches)
2
0-48 hours (e.g.,
warnings, nowcasts,
forecasts, alert
coordination)
1
CWSUs
Forecast timeframe
WFOs RFCsROCs NCEP NWCT= 0

Note: This document catalogs the findings and ideas of the OWA; it is not an implementation plan.
34
elements)21. Blended model output for some elements, though, (e.g., wind) is not as skillful.
Exhibit 22: Comparison of forecast techniques (Max temperature, Probability of precipitation) in NWS Central Region
As WFO meteorologists adjust model output, they may use guidance from NCEP (e.g., if a hurricane is forecasted, WFO meteorologists will add in appropriate winds, precipitation, waves etc.). This process is highly manual and varies from forecaster to forecaster. NCEP has access to datasets and models at certain time and spatial resolutions that WFOs do not have access to, for bandwidth reasons, which can make it very difficult for WFO meteorologists to incorporate NCEP guidance.
The outcome of the process today is a forecast that may be inconsistent in several ways: 1) the forecast may contain meteorological inconsistencies (first order discontinuities), as forecasters independently edit elements that are related; 2) the forecast may contain inconsistencies from shift to shift, as local forecasters have different areas of interest and skill levels; 3) the forecast may contain inconsistencies across office boundaries if changes are not collaborated; and, 4) the forecast may be inconsistent with the message delivered nationally, given NCEP does not use the same tools, and is not generally part of the gridded forecast process. The result is that partners see and hear different forecasts and messages, making decision-making more difficult or eroding trust in the NWS.
While some regions have adopted consistency measures that seek to remove “seams” at borders of WFO areas of responsibility, inconsistencies in the forecast persist. Newly established Regional Operations Centers (ROCs) are beginning to reduce inconsistencies in both the forecast and threat messaging between NCEP and local
21 National Blend of Models Development team, May 2016
2
2.5
3
3.5
4
4.5
5
5.5
6
6.5
7
1 2 3 4 5 6 7
Feb - May 2016 CR MaxT Mean Average Error Day 1-7
NationalBlend
Official
Previous
SuperBlend
SuperBlend2
0.090
0.095
0.100
0.105
0.110
0.115
0.120
0.125
0.130
0.135
0.140
0.145
0.150
0.155
0.160
0.165
0.170
0.175
0.180
1 2 3 4 5 6 7
Feb - May 2016 CR PoP12 Brier Day 1-7
WPCGuide
Official
Previous
SuperBlend
SuperBlend2
Day Day
Mean
Avera
ge E
rror
Brier
Score

Note: This document catalogs the findings and ideas of the OWA; it is not an implementation plan.
35
staff, which requires time-consuming collaboration and negotiation across offices. Given this operating model, WFOs, RFCs, and NCEP overlap at times, resulting in occasional inconsistent forecasts and duplicated effort. Compounding the inefficiency is the fact that WFOs and NCEP do not currently use the same IT systems to produce their forecasts.
Exhibit 23: Comparison of "seams" in NDFD to smooth forecast using a blend
This process does not make the best use of NWS staff time, either at the national level or at the local level. The expertise at NCEP may not be used in the local forecast process, the latest technology (e.g., model blends) is not fully utilized, and local expertise must be added at each forecast cycle rather than being added automatically through post-processing. Further, as more and more data from models and observations are sent to the forecaster, due to time constraints forecasters won’t be using that information as effectively as possible without the help of post-processing techniques like model blends. It is also important to note that advanced post processing techniques for model blends, including machine learning and artificial intelligence, are being explored by components of America’s Weather Industry.
PHASE 1 FINDINGS ON NWS' ORGANIZATION (WORKLOAD, ROLE CLARITY, AND ORGANIZATIONAL HEALTH)
Summary Statement: The current NWS organizational structure, workflow, and operational processes are not optimized to support the IDSS-focused operating model. The roles and responsibilities of various field offices require additional clarity, particularly where there may be overlapping responsibilities. In some cases, staff time may not be spent on the highest value activities due to current operational processes. Additionally, while the local reach of NWS field offices supports the IDSS operating model, there are some functions that could be more effectively and efficiently delivered across multiple WFOs (e.g., gridded forecast production, “met watch”, etc. to be tested before further consideration or implementation). Finally,

Note: This document catalogs the findings and ideas of the OWA; it is not an implementation plan.
36
within and among offices, the span of control for field managers is too high to manage in the new service delivery model.
NWS has three levels of offices in its field structure: national (NCEP), regional (RFCs, ROCs, and Tsunami Warning Centers), and local (WFOs, CWSUs). Alaska and Hawaii have additional regional offices, the Alaska Weather Water Ice Center (AWWIC), the Alaska Aviation Weather Unit (AAWU), and the Central Pacific Hurricane Center (CPHC). The field footprint is dispersed, with WFO locations based on radar positioning, RFCs based on river basins, CWSUs located near major airports, and NCEP and the National Water Center located based on weather events and other factors. The NWS also organizes its activity around 11 service programs (e.g., marine, tropical, tsunami, fire).
Overall, there is not sufficient role clarity or optimal balance of functions across these field offices. The diagnostic found: 1) a lack of role clarity between the newly reorganized National Service Programs (NSPs) and the National Centers for Environmental Prediction (NCEP), as well as inconsistencies in NCEP roles and responsibilities; 2) a lack of alignment between the various tsunami offices; 3) a lack of coordination between River Forecast Centers (RFCs) and the newly created National Water Center; and, 4) staff in WFOs do not have sufficient time or flexibility to meet all IDSS demand, and that some WFO functions could be more efficiently or effectively delivered across multiple offices.
Lack of role clarity between the newly reorganized National Service Programs (NSPs) and the National Centers for Environmental Prediction (NCEP), as well as inconsistencies in NCEP roles and responsibilities
The National Centers for Environmental Prediction (NCEP) are comprised of seven operational “service” Centers (AWC, CPC, NHC, OPC, SPC, SWPC, and WPC) and two additional Centers (EMC, NCO) that provide foundational modeling and processing capabilities. Among the Centers, there are inconsistencies in roles and responsibilities; one Center provides warnings, watches, and advisories, while the rest provide either watches and/or outlooks (Exhibit 24).
Many NWS staff perceive the Centers to provide “guidance,” not forecasts, while Centers do issue products that contain forecast information directly to the public and partners. Some Centers, such as OPC, produce forecasts, which can create additional complexities. The boundaries of OPC, NHC TAF-B, and long term WFO forecasts, for instance, often do not match partner needs and require increased coordination.
Additionally, several Centers play a role in forecasting water – in the atmosphere, in the oceans/coastal areas, and on and in the ground – WPC, OPC, NHC, OWP/NWC – creating a fragmented national water picture and lack of role clarity for some functions (e.g., predicting storm surge). Similarly, several centers – AWC, SPC, and WPC – regularly need thunderstorm and precipitation forecasts, but each may consider the likelihood of such storms separately. However, these differing roles

Note: This document catalogs the findings and ideas of the OWA; it is not an implementation plan.
37
exist in part because forecasting water in the atmosphere is very different than forecasting water on and in the ground.
Exhibit 24: Roles of NCEP Centers vary by service area
Exhibit 25: Division of high seas forecast responsibility vs. shipping lanes
Finally, there is a lack of role clarity between the NSPs and the National Centers. The 11 NSPs aim to provide programmatic guidance, policy, strategic planning, etc. of each type of weather, water, and short-term climate concern handled by the NWS, yet the Centers are not divided cleanly according to NSPs (e.g., WPC handles winter weather, public weather, and quantitative precipitation forecasts, while OWP/NWC

Note: This document catalogs the findings and ideas of the OWA; it is not an implementation plan.
38
handles water forecasting for water on and in the ground). Further, the role of the NSPs and the Centers in programming and budgeting decisions has not been clearly defined.
Tsunami Warning Centers are not aligned to partner needs
NWS has two Tsunami Warning Centers that operate largely independently of each other yet have areas of responsibility that border each other. Currently, the two TWCs issue forecasts for their respective areas of responsibility, meaning a single seismic event leads to two forecasts, which may not be consistent with one another. Each Tsunami Warning Center is fully staffed for 24/7/365 watch functions, and each Center also has research and development functions (Exhibit 26).
Exhibit 26: Tsunami Center roles not aligned to partner needs
There is a lack of role clarity between River Forecast Centers (RFCs) and the Water Prediction Center/National Water Center (OWP/NWC)
The 13 River Forecast Centers (RFCs), organized by river basin, have well-defined roles and responsibilities when it comes to providing forecasts and serving partners. Generally, these partners are defined by river basins (e.g., dam operators) and are more regional in nature than WFO partners (e.g., Army Corps of Engineers), resulting in less overlap across offices. Each RFC also calibrates and operates a distinct version of a common river forecast model; the diagnostic did not find evidence that RFCs significantly overlap with each other in forecast areas. RFCs do
PTWC whites-out the West Coast
of the United States so that they will
not conflict with forecasts from the
NTWC, which is troublesome for core
partners with trans-Pacific interests

Note: This document catalogs the findings and ideas of the OWA; it is not an implementation plan.
39
overlap in forecast responsibilities with WFOs in the production of the precipitation forecast. RFCs publish a separate Quantitative Precipitation Forecast (QPF) as used in their river models; the forecast is not meant to conflict with WFO or WPC QPF (which also exist independently), but it is available to partners and could be seen as such. Additionally, RFCs devote 2-3 staff resources (HMTs: Hydro-Meteorological Technicians) to developing a QPF forecast22. RFCs have varying policies on how to create the QPF, with some RFCs using WPC inputs, others using WFO inputs, and still others producing QPF for nearby WFOs. Testing has not been done to determine if WPC and/or WFOs could produce QPF sufficient for use in the river forecast models such that those resources could be utilized elsewhere.
The RFCs are asymmetrically staffed, largely according to the frequency of 24/7 operational needs in response to emergency events. Some RFCs reported significant overtime hours and operational risk of not being able to sustain 24/7 operations as needed, particularly for long-lasting flood events.
Finally, at the time of the diagnostic, the roles and responsibilities of the RFCs in light of the new national water capabilities envisioned for the Office of Water Prediction’s National Water Center (NWC) had not yet been determined. There is the potential for significant overlap of function and inconsistency if the roles and responsibilities of each type of office are not clearly defined. The OWP/NWC may present an opportunity for RFCs to shift time from forecast production and model calibration to delivery of services to partners.
The Phase 1 diagnostic found that staff in WFOs do not have sufficient time or flexibility to meet IDSS demand due to cookie-cutter fair-weather staffing, current responsibilities, 24/7 requirements, and requirement of two people per shift
WFOs currently have a “cookie-cutter” fair-weather staffing and operational model designed during the Modernization and Associated Restructuring (MAR) from the 1990s. Each WFO is located near a radar site and is comprised of approximately 12 forecasters, management staff (MIC, SOO, WCM), and support staff (electronics maintenance, IT, observation program, and administrative). The base operating level of each WFO is 24/7/365 regardless of weather or partner needs, with a minimum of two people staffed at a given time. Offices will surge staffing during severe weather using overtime.
22 Table of Organization, June 2016

Note: This document catalogs the findings and ideas of the OWA; it is not an implementation plan.
40
Exhibit 27: "Cookie-cutter" staffing model at WFOs
The NAPA report found that, “…the current structural model…does not optimize decision support services; the NWS needs more public outreach into the major metropolitan areas. The act of co-locating offices near the base of radars due to data transmission limits had the unintended effect of moving some offices and the workforce away from population centers and actually diminished in-person communication with decision makers…Today’s technology could free NWS personnel from the base of the radars and allow them to become more agile and effective. Becoming more mobile and adaptable will likely also provide opportunities to ease budget pressures.23”
The OWA diagnostic reiterated this finding and its impact on the capacity of the NWS to deliver IDSS to critical partners. Regional Directors cite multiple instances of offices being positioned far from core partners, particularly on the East and West Coasts (e.g., Upton, NY and Oxnard, CA), and in Central and Southern regions where some offices are not positioned in the state capitol or a similarly populated metropolitan area. Additionally, partners such as FEMA Regions and state governments must work with multiple WFOs for a weather or water event, and may not have a dedicated liaison (although some WFOs have designated a primary office). Although there are many drivers of workload in addition to population, it serves as a proxy in many cases for where decision-makers are likely to be located.
23 National Association of Public Administration, Forecast for the Future: Assuring the Capacity of the National
Weather Service, 2013

Note: This document catalogs the findings and ideas of the OWA; it is not an implementation plan.
41
Center Weather Service Units (CWSUs) also have a cookie cutter staffing model. CWSUs are largely aligned to FAA partner needs, per the interagency agreement, and they are each staffed with four employees regardless of size and scope of the partner needs they support. CWSU staff report the need for additional staff focused on the aviation mission at select CWSUs, like those making up the Golden Triangle Initiative (Chicago, New York, Atlanta), and potentially others (e.g., Washington DC). WFOs also contribute to the aviation mission by providing Terminal Aerodrome Forecasts (TAFs) and IDSS for local airstrips not governed by the interagency agreement. WFOs also produce the pacing TAFs for major airports. There may be an opportunity to better align forecast roles with IDSS roles by possibly shifting some TAF responsibility to CWSUs.
WFO functions
A survey of MICs, with 100 of 122 MICs reporting, found that more than 90 percent of MICs find the current shift schedule and staffing constraints restrict their ability to enhance IDSS and meet growing IDSS needs at Federal, State, county, and local levels (Exhibit 28).
Exhibit 28: MICs report shift requirements constrain IDSS
The 24/7/365 staffing model, at two people required per shift, also introduces risk and rigidity into the WFO staffing model. In order to staff 42 shifts a week, as required at minimum, each WFO requires 11 meteorologists (assuming each meteorologist can cover 4.2 shifts per week, an assumption used by Southern region in workforce planning, given paid leave, sick leave, training, etc.)24. If there is even one vacancy or one instance of leave, the office must rely on its management team to
24 See Hiring Freeze Arbitration, Sharnoff decision, pages 79-80.
To really effectively allocate staff resources, I need to be able to count
on having specific staff members/or focal points available in the day time,
when core partners can meet
Hard to plan "green" days in advance with rotating shifts, people coming
and going etc…We can't just drop in on them with little notice…need to be able
to plan what to do on down days.
We do NOT need 2 people on midnight shifts. Surge when needed; work Mon-
Fri DAYS and EVES most of the time. Overnight only as needed, and at the
production centers. SPC should do all the convective products (including
warnings) and WPC all the Winter, QPF, etc. Fire weather should be done
nationally in Boise.
[We’re constrained by] fixed operational shift hours 24 hours/day
I really don't need 2 people on the midnight shift or 3 on the evening shift.
Those duties could be better accommodated with more time for IDSS
during the day and less emphasis on grid production.
Interns are working mainly evening & midnight shifts, with little time
for training & performing IDSS
SignificantlySomewhatNo
8%
57%
35%
1 17% of MICs listed vacancies as a constraint
Shift work is not healthy…improving health improves our ability
to be flexible and adaptable to our operational needs.
79
38
512
46
66
14
22
EveningDay Midnight
32 4+
92% of MICs reported that shift requirements constrain
enhancing IDSS
MICs report that requirements for operating hours and staffing levels
constrain ability to meet day-time hour partner needs1
MICs constrained by shift requirements
% of MICs, n = 97
Forecast desks staffed per shift
# of WFOs staffing 2, 3, or 4+ desks
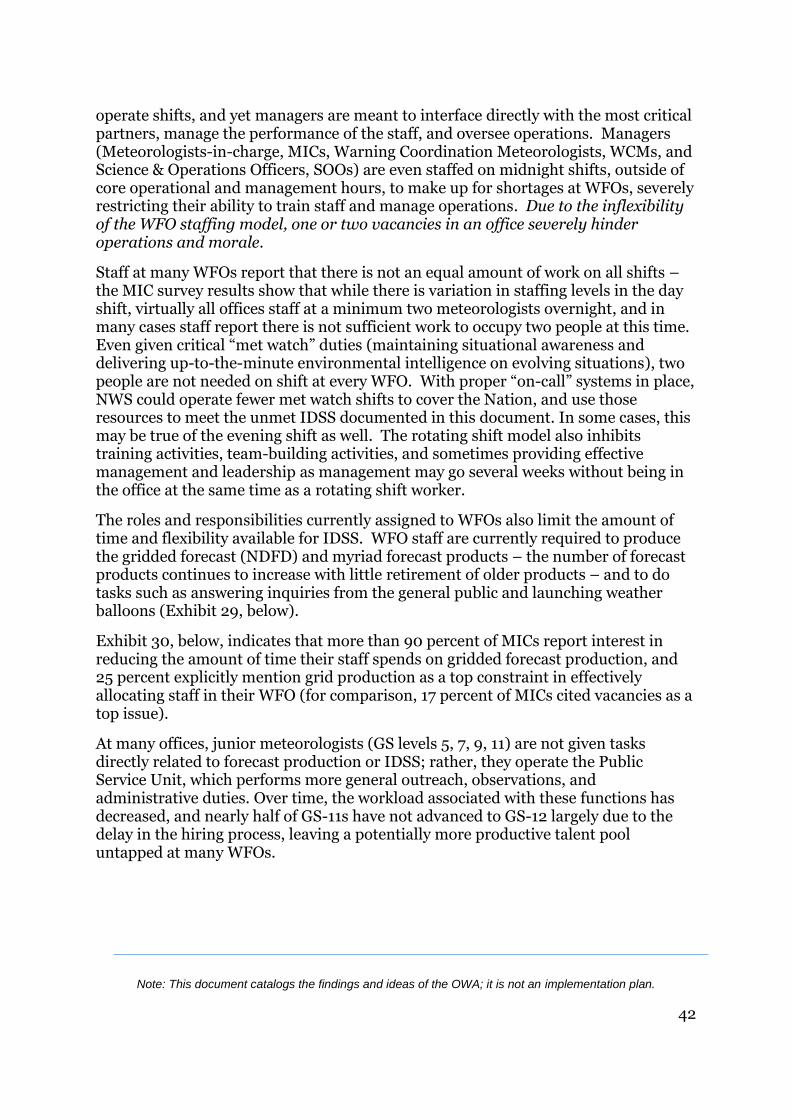
Note: This document catalogs the findings and ideas of the OWA; it is not an implementation plan.
42
operate shifts, and yet managers are meant to interface directly with the most critical partners, manage the performance of the staff, and oversee operations. Managers (Meteorologists-in-charge, MICs, Warning Coordination Meteorologists, WCMs, and Science & Operations Officers, SOOs) are even staffed on midnight shifts, outside of core operational and management hours, to make up for shortages at WFOs, severely restricting their ability to train staff and manage operations. Due to the inflexibility of the WFO staffing model, one or two vacancies in an office severely hinder operations and morale.
Staff at many WFOs report that there is not an equal amount of work on all shifts – the MIC survey results show that while there is variation in staffing levels in the day shift, virtually all offices staff at a minimum two meteorologists overnight, and in many cases staff report there is not sufficient work to occupy two people at this time. Even given critical “met watch” duties (maintaining situational awareness and delivering up-to-the-minute environmental intelligence on evolving situations), two people are not needed on shift at every WFO. With proper “on-call” systems in place, NWS could operate fewer met watch shifts to cover the Nation, and use those resources to meet the unmet IDSS documented in this document. In some cases, this may be true of the evening shift as well. The rotating shift model also inhibits training activities, team-building activities, and sometimes providing effective management and leadership as management may go several weeks without being in the office at the same time as a rotating shift worker.
The roles and responsibilities currently assigned to WFOs also limit the amount of time and flexibility available for IDSS. WFO staff are currently required to produce the gridded forecast (NDFD) and myriad forecast products – the number of forecast products continues to increase with little retirement of older products – and to do tasks such as answering inquiries from the general public and launching weather balloons (Exhibit 29, below).
Exhibit 30, below, indicates that more than 90 percent of MICs report interest in reducing the amount of time their staff spends on gridded forecast production, and 25 percent explicitly mention grid production as a top constraint in effectively allocating staff in their WFO (for comparison, 17 percent of MICs cited vacancies as a top issue).
At many offices, junior meteorologists (GS levels 5, 7, 9, 11) are not given tasks directly related to forecast production or IDSS; rather, they operate the Public Service Unit, which performs more general outreach, observations, and administrative duties. Over time, the workload associated with these functions has decreased, and nearly half of GS-11s have not advanced to GS-12 largely due to the delay in the hiring process, leaving a potentially more productive talent pool untapped at many WFOs.
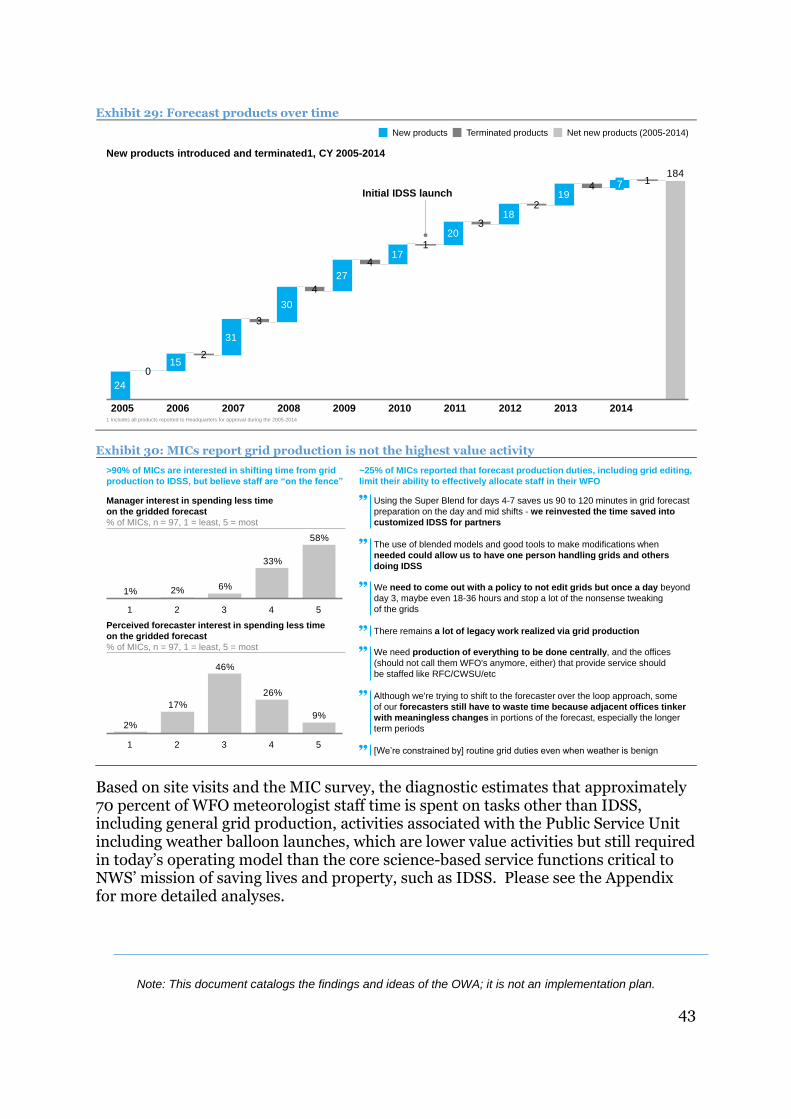
Note: This document catalogs the findings and ideas of the OWA; it is not an implementation plan.
43
Exhibit 29: Forecast products over time
Exhibit 30: MICs report grid production is not the highest value activity
Based on site visits and the MIC survey, the diagnostic estimates that approximately 70 percent of WFO meteorologist staff time is spent on tasks other than IDSS, including general grid production, activities associated with the Public Service Unit including weather balloon launches, which are lower value activities but still required in today’s operating model than the core science-based service functions critical to NWS’ mission of saving lives and property, such as IDSS. Please see the Appendix for more detailed analyses.
15
31
30
27
17
20
18
19
24
1841
4 7
0
1
3
3
2
4
4
2
Net new products (2005-2014)New products Terminated products
2005 20142006 2007 2008 2009 2010 2011 2012 2013
Initial IDSS launch
1 Includes all products reported to Headquarters for approval during the 2005-2014
New products introduced and terminated1, CY 2005-2014
58%
33%
6%2%1%
2 431 5
9%
26%
46%
17%
2%
4 5321
Manager interest in spending less time
on the gridded forecast
% of MICs, n = 97, 1 = least, 5 = most
Perceived forecaster interest in spending less time
on the gridded forecast
% of MICs, n = 97, 1 = least, 5 = most
>90% of MICs are interested in shifting time from grid
production to IDSS, but believe staff are “on the fence”
~25% of MICs reported that forecast production duties, including grid editing,
limit their ability to effectively allocate staff in their WFO
Using the Super Blend for days 4-7 saves us 90 to 120 minutes in grid forecast
preparation on the day and mid shifts - we reinvested the time saved into
customized IDSS for partners
The use of blended models and good tools to make modifications when
needed could allow us to have one person handling grids and others
doing IDSS
We need to come out with a policy to not edit grids but once a day beyond
day 3, maybe even 18-36 hours and stop a lot of the nonsense tweaking
of the grids
There remains a lot of legacy work realized via grid production
We need production of everything to be done centrally, and the offices
(should not call them WFO's anymore, either) that provide service should
be staffed like RFC/CWSU/etc
Although we're trying to shift to the forecaster over the loop approach, some
of our forecasters still have to waste time because adjacent offices tinker
with meaningless changes in portions of the forecast, especially the longer
term periods
[We’re constrained by] routine grid duties even when weather is benign

Note: This document catalogs the findings and ideas of the OWA; it is not an implementation plan.
44
WFOs play a critical role in met watch (maintaining situational awareness and delivering up-to-the-minute environmental intelligence on evolving situations), which includes producing warning and hazard products. Given increasing IDSS demands, WFOs were found to not be able to continually staff “met watch” around-the-clock. Short-term forecasting and situational awareness, especially in the 0-18 hour timeframe, is becoming increasingly useful as the science and technology between of “nowcasting” improves, but also challenging for the forecaster to manage all of the new tools being developed (Exhibit 31). In fair-weather, the met watch function is shared among staff that are also forecasting, interfacing with partners, and preparing for upcoming events and outreach.
Exhibit 31: Focus on forecasting may limit time for situational awareness
In response to this inflexible staffing structure, each MIC has adopted different operating models based on local factors (Exhibit 32, below). Some offices have reported to reduce the time spent on forecast analysis and administration, systems, and training during severe weather compared to a typical shift to enable IDSS. Other offices have reported to not change their operating model during severe weather and will continue to prioritize forecast analysis and production.
18 hrs12 hrs6 hrsTime 0
GFS-GEFS, NAM-SREF
HRRR
FACETS
CASA
LAPS
MRMS
RTMA
MADIS
Surface analysis
DA
DA
ForecastingAnalysis & nowcasting
Current field requirements for forecast production
may limit time to focus on analysis & nowcasting

Note: This document catalogs the findings and ideas of the OWA; it is not an implementation plan.
45
Exhibit 32: WFO workforce adaptations
Some current WFO functions are not effectively delivered within an individual office
Hazard and warning production
Each WFO produces warnings (i.e., warning issuance for a county warning area, with a call to action) used by the general public, media, and the emergency management community. Warnings are both a product (e.g., a polygon with a written call to action) and the basis for a service – the provision of hazard information and IDSS to partners. This finding focuses on the identification of the hazard and development of the product, not on messaging or IDSS related to warnings.
The current County Warning Area (CWA) assigned to each WFO presents a challenge in ensuring all meteorologists on duty have sufficient expertise and experience identifying hazards and issuing warnings. Warning frequency varies widely by office, and in the current operating model, meteorologists rotate through shifts that may include warning production. The rotational shift structure, paired with varying frequency of warnings across offices, means that individual meteorologists may not have sufficient experience in issuing certain warning types (Exhibit 33).

Note: This document catalogs the findings and ideas of the OWA; it is not an implementation plan.
46
Exhibit 33: Meteorologist frequency of issuing different warning types
In interviews, office managers acknowledged that some of their staff are more skilled than others in these functions, but that due to the rotational staffing model, it is difficult to guarantee a more skilled meteorologist will be on shift when significant weather occurs. Analysis of tornado warning patterns in “tornado alley” suggest there are 2-4 meteorologists who have issued the most warnings per office. Interviews suggest that offices develop “A” teams, or “go-to” forecasters who are preferred for warning operations. In the event of a significant outbreak, this “A-team” of 2-4 people is not sufficient to sustain severe weather operations for more than 24 hours, which can be problematic for long events or back-to-back events. Furthermore, the field structure does not currently provide “hot backup” across offices – although there are service backup agreements in place in case an office goes down (due to weather or other factors), there could be a gap in time when there is insufficient coverage.
Additionally, the current training model requires a uniform certification course, independent of where a meteorologist will be working and the associated climate and weather phenomena typical to that region. Specialized courses are offered but are sometimes not required by the WFO management team, particularly if there are staffing shortages restricting the time for training. Furthermore, warning performance data by forecasters is not centrally managed at NWS, so assessing and improving performance on a forecaster-to-forecaster basis is difficult.
La
st M
od
ified
9/2
7/2
01
6 1
0:4
7 P
M E
aste
rn S
tan
da
rd T
ime
Prin
ted
18Draft/Pre-decisional — Proprietary and confidential
1 Based on full staffing of 12-14 meteorologists per office
SOURCE: NWS warning frequency data
Distribution of warning experience across offices
% of WFOs based on number of warnings per forecaster1 per
year (2008-2015)
14
54
64
72
74
6
33
22
25
5
12
9
10
6
69
4
15
2
3
2
4-6
6+2-4
<2Warnings per
year per met
For all warnings except severe, two-thirds of warnings are
issued in offices with < 6 warnings per year per forecaster
Severe
Flash flood
Tornado
Winter storm
Marine

Note: This document catalogs the findings and ideas of the OWA; it is not an implementation plan.
47
Coordination of science, training, and decision support functions
Currently, each office has a Science & Operations Officer (SOO) responsible for developing the skills of staff, with a particular emphasis on incorporating new science into operations and contributing to research efforts. The NAPA report found that, “absent a functional NWS process for R2O and O2R, many field operators who desire a new capability work on developing it themselves,” which leads to inefficiencies and security risks. The current decentralization of research to operations efforts through the SOO program contributes to this difficulty. However, progress has been made in this area with the development of a formal SOO program under the Office of Science and Technology Integration, which funds all SOOs at the NWS.
Additionally, Field Directors and field managers report that individual SOOs vary widely in their ability to manage a training program. As with research to operations, there is minimal bridging between national training efforts and local field offices.
Each WFO also has a Warning Coordination Meteorologist (WCM) to lead IDSS functions for the office. The NWS currently lacks a centralized program function to coordinate priorities and activities across the WCMs, which would be beneficial.
Span of control for field managers is high
The number of layers between the NWS Director and a frontline forecaster is relatively low (5 layers), but the spans of control (number of direct reports) within the field are high. For example, the number of employees reporting directly to a Regional Director ranged from 13 to 45 persons at the regional sites visited, and number of reports to MICs often exceed 18 persons (Exhibit 34).
Exhibit 34: Number of direct reports at NWS by position
La
st M
od
ified
9/2
8/2
01
6 8
:54
PM
Ea
ste
rn S
tan
da
rd T
ime
Prin
ted
19Draft/Pre-decisional — Proprietary and confidential
Span of control
HQ reports Field reportsManager2
1. Shares some management responsibilities with Deputy Director and Chief of Staff. 2. Shares some management responsibilities with Deputy Director. Does not include direct
reports at Regional HQ office.
2. Shares some management responsibilities with WCM and SOO.
NWS Director1
Chief Operations
Officer
Regional
Director2
Meteorologist-in-
charge3
Forecaster
Reporting Line
1:9
1:9
Median Span of Control
Range in
Span of Control
1:24 1:13 – 1:45
1:22 1:18 – 1:29

Note: This document catalogs the findings and ideas of the OWA; it is not an implementation plan.
48
Given the complexity of products and services provided by NWS staff, the high level of skill required, and the emerging nature of IDSS provision, the current span of control in the field offices is not ideal. Best practice suggests that NWS' current span is appropriate for managers who play facilitator or coordinator roles, and staff who perform routine, identical tasks. The OWA site visits suggest that NWS needs to move towards coaching staff, which necessitates a lower span of control of 6-7 direct reports for each manager, as shown in Exhibit 35.
Exhibit 35: Best practices in span of control
NWS' organizational health is not sufficient to support performance
Key takeaways
The NWS scored in the Organizational Health Index (OHI) bottom quartile compared with the McKinsey & Co. public and private sector global benchmark, with individual outcomes for Innovation and Learning and Coordination and Control scoring particularly low. The individual outcomes for Motivation and External Orientation were very favorable, however, as often seen in other mission-driven organizations. However, when compared with only the public sector benchmark in the McKinsey & Co. database, the NWS scored in the second quartile.
Methodology
The OHI survey, conducted in June of 2015, measures organizational health and performance. Healthy organizations have an ability to align behind common goals, strategy and culture, execute with excellence to meet them, and are able to innovate and adapt to change. The OHI does not measure employee satisfaction (which is covered in other survey instruments such as the Federal Employee Viewpoint Survey
Managerial role archetypes
3-5 6-7 8-10 11-15 >15Average span
of control
Drivers of
managerial work
Coach Supervisor FacilitatorPlayer / Coach Coordinator2
Maturity
of process
▪ No standard work
process exists
and tasks require
conceptual problem
solving with manager
interaction
▪ Some work process
guidelines have been
developed but tasks
often require manager
intervention and
interaction
▪ A standard work
process exists
and subordinates
perform tasks that
require limited
interaction
▪ Work is performed on the
basis of mostly standard
processes OR sub-
ordinates are largely self-
managed with very limited
manager interaction and
intervention
▪ Work is completely
standardized or automated,
OR subordinates are self-
managed. Interactive
intervention is required only
for exceptions
Time spent
“managing”
vs. “doing”
▪ Manager spends
relevant time on own
work or client-facing
activities
▪ Manager may spend
time on own work,
often side-by-side
to apprentice others
▪ Manager spends little
time on own work
or client-facing
activities
▪ Manager spends most
of the time “managing”
OR work is mostly
managed indirectly via
metrics
▪ Manager spends nearly all
the time “managing,” OR
nearly all work is managed
indirectly via metrics,
reviewing decisions, and
handling exceptions
Task repeat-
ability
▪ Every subordinate
performs unique tasks
that are different at
every iteration
▪ Many subordinates
perform varying tasks
that, while repeated,
often require some
level of tailoring
▪ Most subordinates
perform tasks that
are similar and that
repeat over time
▪ Most subordinates perform
nearly identical tasks that
are repeated at nearly
every iteration
▪ All subordinates perform
the same essential tasks
independently OR are self-
managed enough to handle
non-standard tasks without
intervention
Subordinate
skills required▪ Tasks require specific
skills that take several
years of experience
and extensive
apprenticeship
▪ Tasks require specific
skills that take much
experience and
coaching. Skills
acquisition can take up
to a year
▪ Tasks require specific
skills that take some
experience, but limited
apprentice-ship. Skill
can take up to a
month to build
▪ Tasks require general
skills; job-specific
knowledge can be learned
very quickly, mainly via
training and self-study.
Skills can be taught within
~2 weeks
▪ Skills can be taught within
a week because tasks require
few specific skills and can be
learned nearly entirely via self-
study OR subordinates have
total mastery of skills required
before being in the job

Note: This document catalogs the findings and ideas of the OWA; it is not an implementation plan.
49
(FEVS)). The OHI survey was selected as one of the key inputs for this assessment based on its large data set (used for benchmarking), statistical reliability and validity. Beginning collection in 2003, the OHI data set currently has more than 700 organizations represented and 1.3 million respondents; it includes 27 public sector organizations. Using the global set of organizations across multiple industries, a strong correlation exists between organizational health and organizational performance25. At its essence, organizational health enables organizations to maintain the highest levels of financial and operating results and also enables organizations to implement their strategies26. For example, public companies with “top quartile” organizational health had a 68 percent chance of achieving above-average Earnings before interest, tax, depreciation and amortization (EBITDA) margins, compared to the 31 percent likelihood of companies in the bottom quartile of health. Similar relationships between performance and health also exist at business-unit levels within organizations27.
The survey was open from June 8, 2015 to June 24, 2015, and the participation was n=2,162 with a response rate of 49 percent. For this response rate, the OHI standard calculates margin of error at the 95 percent confidence level, which means that there is a 95 percent probability that the results of the complete population are within the margins of error of the results obtained. This is a standard used across the industry. Furthermore, the distribution of responses within the organization by office type (e.g., HQ, Central Region) and tenure (e.g., <1 year, 1 – 3 years) was representative of the overall distribution of the workforce.
Throughout the analysis, NWS was compared to the OHI global benchmark, as well as a public sector benchmark and a professional scientific and technical services benchmark. The public sector benchmark comprises 27 surveys (n=47,159), and the professional scientific and technical services benchmark comprises 27 surveys (n=17,849).
OHI Results
The overall Organizational Health Index score was 53, a bottom (4th) quartile overall health score when compared to the global benchmark of roughly 1.3 million responses across approximately 700 public and private sector organizations worldwide (Exhibit 36).
At the outcome level, six of the nine outcome scores were in the bottom quartile (Direction, Accountability, Coordination & Control, Leadership, Innovation & Learning, and Culture & Climate). Three outcome scores were relatively healthier -- Motivation, External Orientation, and Capabilities. The Motivation outcome score is a top quartile score when compared to the global benchmark, External Orientation is
25 De Smet, Palmer and Schaninger, 2007. 26 Keller and Price, 2011 27 Leslie, Loch and Schaninger, 2006.

Note: This document catalogs the findings and ideas of the OWA; it is not an implementation plan.
50
a second quartile score, and Capabilities is a third quartile score. When compared to just the public sector benchmark with 75,000 responses, NWS ranked in the second quartile for the overall score (Exhibit 37).
Exhibit 36: Results of Organizational Health Index (OHI) benchmarked against public and private sector McKinsey & Co. database
Exhibit 37: Results of Organizational Health Index (OHI) benchmarked against only public sector McKinsey & Co. database

Note: This document catalogs the findings and ideas of the OWA; it is not an implementation plan.
51
In addition to comparing to the global benchmark, the NWS outcome level scores were benchmarked against scores of other public sector organizations and professional, scientific, and technical services organizations (Exhibit 38). When compared against these two sets of benchmarks, the Motivation outcome score was relatively stronger than both. In addition, two of the NWS outcome scores that were in the bottom quartile – Coordination & Control and Innovation & Learning – were relatively weaker than both sets of benchmark scores.
Exhibit 38: OHI results compared public sector and professional scientific and technical services
The outcome scores were also compared internally across different levels within NWS, from respondents who self-identified as individual contributors versus senior leadership (Exhibit 39). Those responses indicate there is a statistically significant difference between senior leadership (who manage other managers) and individual contributors (who do not manage others) in the overall perception of health, with senior leadership having a more positive overall perception of the organization’s health. On certain outcomes – Direction, Leadership, and Culture & Climate – senior leadership had a more positive perception of health than individual contributors. For other outcome scores, there was more agreement, with both senior leadership and individual contributors perceiving those as being healthy (e.g., Motivation and External Orientation) or both groups perceiving those as being less healthy (e.g., Coordination & Control and Innovation & Learning).

Note: This document catalogs the findings and ideas of the OWA; it is not an implementation plan.
52
Exhibit 39: Senior level managers perceive higher outcomes
At the practice level, 34 of the 37 practices were in the bottom quartile for organizational health, and several themes emerged when looking at the patterns of practice-level results. First, employees are highly motivated, as shown by the top quartile Motivation outcome scores, despite low scores at the practice level on Motivation, indicating that employees may be intrinsically motivated. Second, employees say they lack clarity and buy-in around the vision and strategy of NWS, and feel they do not have personal ownership in the direction-setting process. Third, NWS is relatively externally oriented but does not often capture new ideas and quickly translate them into new innovation.
The NWS administered a pulse survey in February 2017 to follow up on the initial 2015 OHI survey. The pulse survey showed noticeable increases in several of the practices including Personal Ownership, Customer Focus, Operationally Disciplined, and Meaningful Values. These increases were even higher for employees that participated in the OWA project. While the outcome scores did not change appreciably between 2015 and 2017, it is more common for practice scores to increase first, which often will translate into higher outcome scores in future years.
Additionally, staff reported dissatisfaction with the current rotational shift paradigm at the NWS. Staff report that midnight shifts, in particular, lower morale and adversely affect health. Staff also highlight difficulties working within the bureaucracy and with regional and national headquarters (Exhibit 40).

Note: This document catalogs the findings and ideas of the OWA; it is not an implementation plan.
53
Exhibit 40: Organizational Health Index: Free text response to “What is the least rewarding part of your job?”
SUMMARY OF PHASE 1 FINDINGS
Exhibit 41 shows a summary of the key findings from the NWS diagnostic assessment in Phase 1. The next sections put forth ideas for the workforce, operating model, and organization (role clarity and organizational health), culminating in a vision for a fully integrated Field structure in support of delivering Impact-Based Decision Support Services to Build a Weather-Ready Nation.
Exhibit 41: Summary of Phase 1 key findings

Note: This document catalogs the findings and ideas of the OWA; it is not an implementation plan.
54
Phases 2-4: OWA ideas for evolving NWS
In order to deliver on the vision for evolving NWS to a Fully Integrated Field Structure, Phases 2, 3, and 4 involved idea generation and refinement to address findings raised during the diagnostic and to define ways to implement the vision.
During this idea generation process, the OWA workstreams, Field and HQ Directors, and the OWC developed, analyzed, and refined possible ideas. The OWC helped OWA workstream teams focus on the most promising ideas. Each workstream (Workforce, Operating Model, and Organization) consisted of HQ and field managers and NWSEO representation in order to ensure a representative balance of key stakeholders across the organization. These teams engaged in brainstorming sessions, interviewed subject matter experts, and surveyed their colleagues. Each workstream team presented their ideas to the OWC regularly, received guidance from senior leaders across portfolios and functions on these ideas through Key Decision Points (KDPs), and then refined those ideas. No ideas were selected for implementation during this phase.
Throughout the idea generation process, OWA engaged the Regional Directors, National Water Center Director, and NCEP Directors (Field Directors) in developing and refining ideas.
IDEAS ON WORKFORCE:
Phase 1: Findings Phases 2-4: Ideas for Evolving NWS
GS-5/11 meteorologists are not optimally utilized in all WFOs, and competitive promotion to GS12 is inefficient
Idea #1: Develop an NWS 101 onboarding program
Idea #2: Create a GS-5/12 meteorologist career progression
There is a difference between current and desired skill level for IDSS and other functions
Idea #3: Improve overall workforce training
Idea #4: Revisit federal qualification standards for meteorologists
There are skill level gaps in leadership and organizational change for MICs and HICs
Idea #5: Improve leadership training at all levels
Idea #6: Develop additional MIC/HIC specific training
Idea #1: Develop an NWS 101 onboarding program
The workforce team focused on refining a proposal for a universal, in-residence onboarding course, called NWS 101. Ideally, the course is offered to all new employees, regardless of seniority or function, and focuses on the NWS' role within the federal government, the NWS organization, NWS' mission and culture, and its strategy and vision. The team identified the benefits and risks associated with the

Note: This document catalogs the findings and ideas of the OWA; it is not an implementation plan.
55
course, projected costs, critical topics to be covered in the course, and suggested next steps for continued development. The course would immediately instill the core values, principles, and strategies of the NWS so that new employees are mission focused from day one on the job. Furthermore, the course generates career-long relationships between employees in different offices, functions, and job series, furthering the sense of belonging, inclusiveness, and diversity in the NWS.
The Office of the Chief Learning Officer adopted this idea and developed an NWS 101 onboarding program. The first class was held in August of 2016. The concept of an NWS onboarding course is described in Exhibit 42.
Exhibit 42: NWS onboarding course concept
An NWS 101 training program has significant benefits to the Agency, as indicated in Exhibit 43.
23DRAFT/PRE-DECISIONAL –
PROPRIETARY AND CONFIDENTIAL
Description
of
Investment
Gov 101 – an overview
of DOC, NOAA and
NWS role within the
larger organization
NWS org. structure – an
overview of the NWS’
budget, governance,
requirements and policy
processes
NWS mission & culture
– an introduction to NWS’
mission, history, vision
(including IDSS) and
culture
Team building – an
introduction to team
work, collaboration
and communication
at the NWS
Local office training could include online and on the job training1
An in-residence NWS 101 training could include:2
Role specific training could include in-residence, online, and/or on the job training; in addition
strength assessments could be administered, which would inform individual dev. plans (IDP)3
▪ All hires new to the NWS would participate1. A diverse class of varying seniority and job functions
from different offices will help lead to sharing of ideas and a more open and trusting environment
▪ Training could be offered 4 times per year for one-week or more. On average ~133 new NWS
employees are hired per year, which would allow for class sizes of ~33 people per quarter
▪ Lecturers could be drawn from across the organization. Experienced / seasoned staff could be
drawn from across the organization to speak to their specialty or lead breakout groups, potentially
fulfilling one of their own IDP goals
1. Materials developed for NWS 101 could be made available to all employees through web modules and/or
incorporated into other trainings
An example workforce idea includes the new 3-part onboarding
process: 1) local office training, 2) an in-residence NWS 101 &
3) role specific training

Note: This document catalogs the findings and ideas of the OWA; it is not an implementation plan.
56
Exhibit 43: Benefits of NWS 101 course
Idea #2: Create a GS-5/12 meteorologist career progression
In addition to staffing levels, OWA developed ideas for addressing the skill gap at WFOs and the challenges of the current GS-5/11 position, chiefly through an updated competency model for meteorologists and a unified career progression for GS-1340-5/12 meteorologists. Currently, employees advance based on time in grade alone, making it difficult to ensure necessary skills are demonstrated. GS-5/11 meteorologists are underused today, and promotion to GS-12 requires costly hiring actions. Exhibit 44 shows the benefits of the GS-5/12 career progression both to employees as well as to the NWS. One of the most significant benefits is that the GS-5/12 career progression advances the “whole office concept,” where junior employees can more efficiently contribute to the office mission (Please also refer to Exhibit 17). Through this career progression, Interns may contribute to the forecast process and IDSS in their office according to their training and competency level in a nationally-consistent manner, rather than being restricted to only certain Public Service Unit (PSU) duties due to their position description. Additional benefits are shown in Exhibit 45.

Note: This document catalogs the findings and ideas of the OWA; it is not an implementation plan.
57
Exhibit 44: Potential benefits of GS-5/12 career progression
Exhibit 45: Additional benefits of the GS-5/12 competency-based promotion model
The workforce workstream, along with their OWC champions, developed a framework that added training, experience, and promotion assessments to the time-

Note: This document catalogs the findings and ideas of the OWA; it is not an implementation plan.
58
in-grade standard. Training at each grade level could be a mix of mandatory and elective training, chosen from a broad library of classes to satisfy employee career interest and class availability. Employees could also be expected to fulfill a set number of hours of “experience,” which could range from partner visits to skills demonstration.
An updated competency model was designed to capture the critical science and service skillsets of future NWS meteorologists. The team developed five competency dimensions ranging from forecast and warning generation to IDSS to management and leadership (Exhibit 46). Under those five dimensions are 15 competencies (Exhibit 47), and under those competencies are proficiencies by grade level between the GS-5 and GS-12 grades. The competency model was based on an Office of Personnel Management (OPM) framework. The GS-5/12 career progression idea, as well as the specific competencies and proficiencies, were developed from input by all MICs through two targeted surveys. One survey indicated asked if MICs would support the GS-5/12 idea. With a 77 percent response rate of MICs, 91 percent said they would support the GS-5/12 idea, and 85 percent said it should apply to current and future meteorologists (Exhibit 48). The second survey asked questions about proficiency level for each competency in Exhibit 47, which provided crowd-sourced information to develop grade-by-grade proficiencies for each competency.
The competency model serves as a starting point for many human resources actions. Hiring, performance evaluation, promotions, and trainings could all be aligned to this model. It was suggested that promotion would not be tied to the annual performance review, but rather a promotion assessment based on the competency model when employees are eligible for their grade increase after one year at the current grade. Working with the OCLO, the team also performed a gaps analysis between an Intern’s current training plan and a future training plan that would address the proposed competencies and proficiencies. It was determined that about 30-40 percent of the proficiencies are not covered by the current curriculum, and would require development of additional courses or more on-the-job training.

Note: This document catalogs the findings and ideas of the OWA; it is not an implementation plan.
59
Exhibit 46: Dimensions of GS-5/12 competency model
Exhibit 47: Overview of the 15 competencies that map to the 5 dimensions
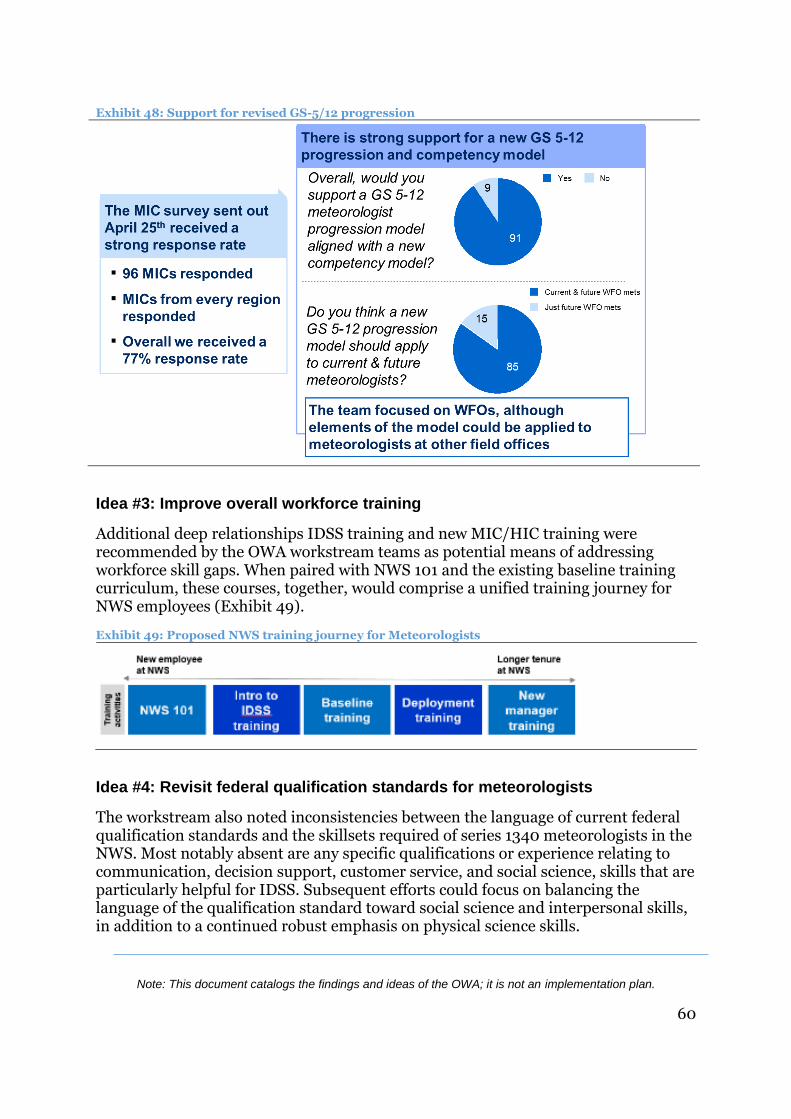
Note: This document catalogs the findings and ideas of the OWA; it is not an implementation plan.
60
Exhibit 48: Support for revised GS-5/12 progression
Idea #3: Improve overall workforce training
Additional deep relationships IDSS training and new MIC/HIC training were recommended by the OWA workstream teams as potential means of addressing workforce skill gaps. When paired with NWS 101 and the existing baseline training curriculum, these courses, together, would comprise a unified training journey for NWS employees (Exhibit 49).
Exhibit 49: Proposed NWS training journey for Meteorologists
Idea #4: Revisit federal qualification standards for meteorologists
The workstream also noted inconsistencies between the language of current federal qualification standards and the skillsets required of series 1340 meteorologists in the NWS. Most notably absent are any specific qualifications or experience relating to communication, decision support, customer service, and social science, skills that are particularly helpful for IDSS. Subsequent efforts could focus on balancing the language of the qualification standard toward social science and interpersonal skills, in addition to a continued robust emphasis on physical science skills.

Note: This document catalogs the findings and ideas of the OWA; it is not an implementation plan.
61
Since the number of current 1340 series meteorologist course requirements is already substantial, it is likely that if additional IDSS-related coursework were to be mandatory, other physical science courses may need to be removed. In a discussion with the Heads and Chairs of atmospheric science departments across the United States, these leaders identified a strong preference (92 percent) for the 1340 qualifications to be revisited, as shown in Exhibit 50. In particular, the participants requested that the six hours of physics, three hours of differential equations, or nine hours of electives should be revisited. For the physics requirement, this group largely questioned the three hours required for electricity and magnetism, but not mechanics. The group also stated that the largest skills gaps in their coursework are in IDSS and management, teamwork, and leadership, focus areas that are consistent with the findings and recommendations in Phase 1 and elsewhere in this catalog.
The workstream recommended that these meteorologist qualifications warrant future attention and debate. In particular, the workstream felt that broadening the physical science electives to include social/communication science or emergency management was a common-sense change, as it doesn’t add a required course to the 1340 series. Further, broadening the coursework for future meteorologists is consistent with recommendations by the American Meteorological Society and the World Meteorological Organization. Any changes to the 1340 series would need to be coordinated with other agencies that hire 1340 meteorologists through the Office of the Federal Coordinator for Meteorology, and all changes must be approved by the Office of Personnel Management (OPM).
Exhibit 50: Thoughts on revising 1340 qualifications

Note: This document catalogs the findings and ideas of the OWA; it is not an implementation plan.
62
As with many of these ideas, further discussion with the entire weather enterprise would also be needed to change these meteorologist qualifications, as any changes would affect university programs, which would in turn affect hiring in the private sector. In 2016, workstream members shared these results with the AMS Board on Higher Education and the Interdepartmental Committee for Meteorological Services and Supporting Research.
Exhibit 51: Additional thoughts regarding 1340 qualifications
Idea #5: Improve leadership training at all levels
The workforce workstream also identified that leadership training is not provided at all levels during one’s tenure at the NWS. This results in new managers not having the training or experience needed to excel in their new positions. The workforce workstream suggested that the NWS explore a learning and development path that builds on each other and utilizes national, regional, and local resources and expertise to effectively execute (Exhibit 52).

Note: This document catalogs the findings and ideas of the OWA; it is not an implementation plan.
63
Exhibit 52: Proposed NWS leadership training path
Idea #6: Develop additional MIC/HIC specific training
The workforce workstream also proposed a new manager orientation course specific to MICs and HICs, who are the supervisors of nearly 60% of the NWS’s workforce, to improve their leadership skills and skills in organizational change. The OHI showed that employees have trust in their first line supervisors, but not the senior leaders of the organization (Exhibit 39). As a result, MICs/HICs are critical to evolving the NWS. New manager training could build on previous supervision and management courses, and focus on developing specific skills in organizational leadership, including strategic planning for the office, how to lead service delivery in a deep-relationships IDSS framework, and field integration. If offered on a semi-annual or annual basis, cohort sizes could average approximately 6-12 managers per course. The focus of the proposed MIC/HIC course is presented in Exhibit 53.
Similar to NWS 101, courses specialized for MICs and HICs potentially realize significant benefit to the Agency. The anticipated benefits are shown in Exhibit 54.

Note: This document catalogs the findings and ideas of the OWA; it is not an implementation plan.
64
Exhibit 53: MIC/HIC dedicated course initial thoughts
Exhibit 54: Benefits of MIC/HIC specialized training

Note: This document catalogs the findings and ideas of the OWA; it is not an implementation plan.
65
IDEAS ON OPERATING MODEL: IDSS
Phase 1: Findings Phases 2-4: Ideas for Evolving NWS
IDSS is critical to NWS partners, who say IDSS helps improve their decision-making
Idea #7: Continue to define IDSS and how NWS can become a customer-centric, science-based service organization
Idea #8: Develop IDSS metrics
IDSS is delivered inconsistently and to varying degrees
Idea #9: Establish common partner definitions
Idea #10: Establish standard service levels for IDSS
Idea #11: Develop additional IDSS-specific training
Idea #12: Build reporting, accountability, and coaching mechanisms to support all MICs/HICs in achieving standard service levels
Idea #7: Continue to define IDSS and how NWS can become a customer-centric, science-based service organization
The vision for how IDSS could work in a local office mirrors the process of the Incident Command System (ICS) planning that was laid out in the NWS Weather-Ready Nation Roadmap v2.028. Exhibit 55 is the core service level process framework that was developed and recommended by the workstream and provided structure to the ideas that are highlighted in this section.
Exhibit 55: Proposed IDSS core service level process developed by IDSS workstream
The vision for deep relationships IDSS draws on examples from the NWS field today, where local offices have developed innovative ways to serve partners and protect lives and property. OWA has worked to identify best practices and elevate examples of what works based on leadership from the field, then make recommendations based on those practices. Two examples below illustrate what IDSS means to NWS partners.
28 WRN Roadmap: http://www.nws.noaa.gov/com/weatherreadynation/files/nws_wrn_roadmap_final_april17.pdf

Note: This document catalogs the findings and ideas of the OWA; it is not an implementation plan.
66
IDSS in action: Red River flooding in Fargo
The Red River in Fargo, ND has become increasingly prone to devastating floods over the past 15 years. After severe flooding in 2009, Tim Mahoney, the Deputy Mayor of Fargo, challenged the emergency management community to improve the city's response to such events: "In the flood fight of 2009, we did 3.5 million sandbags in nine days. We were trying to get ahead of that this time and have people start to get things ready for us in advance.”
The NWS responded by deepening its relationship with the US Army Corps of Engineers and local and state emergency managers, and conducting more in-depth training, exercises, briefings, and outlooks in advance of flood season. In the 2011 flooding, they deployed meteorologists and hydrologists as part of an inter-agency river surveillance effort, allowing for increased frequency and reliability of river forecasts. The information provided by the NWS was used to determine the location and scale of temporary levees, and coordinate reservoir releases to mitigate the impact of flood waters, resulting in millions of dollars saved. Extensive after-event reviews were conducted to ensure that the lessons learned from the deployment model could become standard operating procedures for subsequent events.
IDSS in action: Dense sea fog in Tampa Bay
The hazards associated with dense sea fog are particularly salient to folks in Tampa Bay, FL after a tragic collision in 1980 between a seagoing freighter and the Sunshine Skyway led to the collapse of a span and a loss of 35 lives. As such, the NWS takes fog in the area very seriously and partners closely with the US Coast Guard, area ports, and local law enforcement to ensure safety at sea when visibility deteriorates.
In a recent event, a cold front that stalled in the area resulted in a fog bank persisting for three days, enveloping the community in dense fog. Recognizing the potential impact of this kind of event, the NWS had exercised extensively with local partners, and was therefore ready to escalate the flow of information to its partners as the situation developed. Once the fog had settled in, a steady tempo of briefings kept partners apprised of location, thickness, and possible areas of clearing of fog, and advisories were issued to help law enforcement communicate the hazard to motorists and boaters. This steady flow of high-quality information allowed local authorities to set up special traffic alerts, close affected roadways, and halt marine operations until conditions improved. After the fog cleared, the NWS continued to support the USCG in follow-on search-and-rescue operations, and conducted extensive after-action reviews.
The workstream recommended that the NWS should continue to highlight and celebrate examples of good, deep-relationships IDSS in practice to build a consistent cultural understanding of what it means to be customer centric.

Note: This document catalogs the findings and ideas of the OWA; it is not an implementation plan.
67
Idea #8: Develop IDSS metrics
The workstream also recognized that in following a core service level process for IDSS, the ability to quantify impacts and core partner response is key to refining office plans and partner interaction. The team proposed developing performance metrics on IDSS to measure the impact of NWS IDSS, clarify and set consistent expectations for NWS offices and employees, and reinforce NWS ties to our core and deep partners.
Further, NWS tracks many science-based performance metrics that relate to the first part of NWS’ mission statement: “providing weather, water, and climate data forecasts and warnings.” IDSS metrics are critical to evaluating the second half of NWS’ mission statement: “for the protection of life and property and enhancement of the national economy.” The NWS does not have a robust set of performance metrics, tracked over time, which allows the NWS to monitor and manage progress towards this part of its mission.
Idea #9: Establish common partner definitions
The IDSS team developed ideas for improving delivery of IDSS through a more consistent approach to defining who receives IDSS and what constitutes IDSS. As of the writing of this catalog, work is ongoing to define how and when IDSS should be delivered through a standard operating model.
The NWS mission is: “The National Weather Service (NWS) provides weather, water, and climate data, forecasts and warnings for the protection of life and property and enhancement of the national economy. It is important to note that NWS’s IDSS partners help the NWS achieve the second part of its mission statement (“for the protection of life and property”) by amplifying NWS forecasts and warnings or being directly involved in decision making for public safety.
In defining who should receive IDSS, the team developed three categories of partners: general, core, and deep core. The partner categories correspond to the level of decision-making, authority, and impact the partner has in the community: partners who are an active part of the emergency management and water resource management communities or other government partners with similar missions fall in the deep core partner category; partners who help prepare or disseminate information about weather hazards fall in the core partner category (e.g. media); and all others are in the general partners and the public category, making decisions governing only themselves as individual entities (Exhibit 56). Some IDSS partners were classified in "gray areas" where roles and responsibilities for providing services to these partners are less clear between the public and the private sector (e.g., school districts and hospitals).

Note: This document catalogs the findings and ideas of the OWA; it is not an implementation plan.
68
Exhibit 56: IDSS partner categories
The IDSS team took an iterative approach to proposing guidelines for NWS field offices on which partners could be served, at which level. In addition to assisting with the development of a draft Public Notification Statement on the potential deep relationships IDSS policy, the IDSS team engaged all NWS field offices in an exercise to understand core and deep partner relationships, the results of which will be used in the future to establish an initial baseline dataset on partners that can be used to compare the current state across offices and further refine partner type definitions.
Idea #10: Establish standard service levels for IDSS
The IDSS team has also developed ideas for the service levels each type of IDSS partner could receive. Deep relationships partners receive the most customized products and services and the highest level of support, ranging from tabletop exercises and preparatory activities multiple times a year, to in-person, on-site support during a response (Exhibit 57).
The IDSS team also developed an IDSS planning framework that would help MICs/HICs structure their IDSS activities for any given year. The framework would consist of a planning template and supporting guidelines and materials for MICs/HICs to use in planning for and delivering IDSS to a common service level.

Note: This document catalogs the findings and ideas of the OWA; it is not an implementation plan.
69
Exhibit 57: IDSS partner service levels
Idea #11: Develop additional IDSS-specific training
The core team outlined several proposals for increasing and supplementing IDSS training in support of implementing a deep-relationships approach to service provision. IDSS Professional Competency Units had been developed (or were in development) prior to the OWA, but the core team identified additional needs to be incorporated into the training, particularly in familiarization with the deep-relationships philosophy, as well as additional skill training in product development, graphics, and briefings (Exhibit 58).
The core team also developed proposals to standardize “Deployment-ready” certifications and the training process by which staff can achieve them, in addition to outlining the potential content of a broader “Intro to IDSS” module for all NWS employees (not just meteorologists) focused on the “why” behind IDSS.

Note: This document catalogs the findings and ideas of the OWA; it is not an implementation plan.
70
Exhibit 58: IDSS training and suggested additions
Idea #12: Build reporting, accountability, and coaching mechanisms to support all MICs/HICs in achieving standard service levels
Along with establishing standard service levels, the NWS could develop systems to provide initial and ongoing support to field offices in developing, sustaining, and continuously improving their capabilities to deliver IDSS.
First, the NWS could develop an accountability mechanism for tracking, measuring, and reporting IDSS activity that would be shared with senior leadership and/or included in performance reviews. This mechanism would incentivize MICs/HICs to track their IDSS activities in a log or database throughout the year. With national IDSS information saved in one database, the NWS could measure national IDSS activities and benchmark across offices to identify best performers and those that need more support or training to deliver IDSS. Over time, this would help achieve a more uniform level of IDSS across the entire organization, as well as facilitate the sharing of best practices among peers.
Along with a formal accountability system, a more formalized set of support activities could help develop the IDSS capabilities of all MICs/HICs (Exhibit 59). The NWS could consider establishing IDSS working groups, where several offices get together in small groups or clusters to discuss their IDSS plans before submitting to senior leadership. Similarly, rotational assignments could allow forecasters to visit other offices and share their best IDSS techniques and practices. In certain cases, on-the-

Note: This document catalogs the findings and ideas of the OWA; it is not an implementation plan.
71
ground diagnostic reviews could be utilized to provide extra support to MICs/HICs who require additional IDSS training. These types of support activities and others could provide venues for MICs/HICs to share best practices across the organization and would ultimately help create a standard level of IDSS across the nation.
Exhibit 59: Potential spectrum of IDSS support activity (developed by OWA IDSS team in Mobile, AL)
IDEAS ON OPERATING MODEL: COLLABORATIVE FORECAST PROCESS
Phase 1: Findings Phases 2-4: Ideas for Evolving NWS
The forecast process has some duplication of effort, does not make best use of local staff time, and can result in inconsistent forecasts
Idea #13: Develop a collaborative forecast process that leverages technology (e.g., NBM) and reduces forecast grid editing
Idea #14: Establish NCEP as the source for initial forecast guidance
Idea #15: Develop NCEP common operating picture
Idea #13: Develop a collaborative forecast process that leverages technology (e.g., NBM) and reduces grid editing
The OWA team has developed ideas to increase collaboration in the forecast process with the dual aim of improving forecast quality and reducing duplication of effort across field offices. The collaborative forecast process could begin with a single starting point and a common operating picture for all field offices, and allow for the

Note: This document catalogs the findings and ideas of the OWA; it is not an implementation plan.
72
layering of expertise from the national level to the local level. The result of the collaborative forecast process could be a single source of initial forecast guidance for all offices to start with, for many of the NWS service areas, for local offices to adjust based on local needs and features, and then deliver to partners.
Exhibit 60: Collaborative forecast process vision
Exhibit 61: From-to with respect to the forecast process
In the long-term, this forecast process could be more automated than it is today, with model information updating rapidly and meteorologists at all levels providing quality control, targeted edits in space and time, and interpreting probabilistic weather information to identify hazards and communicate to partners.
Local
& Regional
Information,
Warnings,
IDSS
National Information, Outlooks,
Watches, Warnings & IDSS
Common operating picture, including probabilistic weather
elements, observations, hazard grids and information, IDSS
log, and situational awareness database
One Event – One Forecast
▪ Generated by a future
version of a National
Blend of Ensemble
based numerical
guidance (4-D Cube),
including NWM
▪ FACETS-enabled
temporal and spatial
scales
▪ Cloud-based, common
operating database
for internal/external use
▪ Future requirements
for high performance
computing,
dissemination systems,
networks, advanced
technologies and tools
developed and delivered
to enable CFP
▪ Delivered by local offices
(impact-based)
▪ Local impacts/threat
messages, based on NCEP
& NWC products
▪ Coordinated by ROCs
▪ Produced at NCEP & NWC
▪ Big picture impacts/threats
message (probabilistic – WWA
scenario/contingency based)
From multiple forecasts and a “patchwork” quilt To a common operating picture
Products at national scale… …that allow for local
detail to be added
The goal is one event, one forecast – because
multiple forecasts is no forecast at all
▪ WFOs, RFCs, and NCEP overlap at times resulting
in inconsistent forecasts and duplicated effort
▪ Many forecasters manually determine which
models to use
▪ Forecasts may contain “seams”
▪ Each office is not fully leveraging all the expertise
NWS has to offer
▪ Produced at NCEP
& NWC, based on the
National Blend of Models
and National Water Model
▪ Focused on big picture
impacts and threats
message, increasingly
probabilistic
▪ Local detail added
as needed for IDSS
▪ Focused on local
impacts and threat
messages, based on
NCEP & NWC
products and national
models

Note: This document catalogs the findings and ideas of the OWA; it is not an implementation plan.
73
In the short-term, while model guidance is not yet skilled enough or is still under development, the OWA team has developed and identified several ideas that build on work around the organization for improving the forecast and reducing duplication in the forecast process. National Centers, such as WPC and AWC that currently have overlap of some duties with forecast offices, could produce initial “first-guess” grids based on the National Blend of Models (NBM), or a proxy blend. Then, the gridded forecast information could be shared with WFOs for further improvement, particularly to address local meteorological features or impacts, whether through direct edits or through submission of concerns. Rapid, dynamic human understanding of the evolving forecast, and honing forecaster expertise on the tough parts of the forecast that are going to result in most of the impact, but also most of the value, will be key. For the other less impactful parts of the forecast, technology may be able to assist the forecaster to provide time for higher value activities. This process does not remove the human from the forecast, but rather allows the forecaster to use the tools, technologies, and observations available to the forecaster more effectively generate the forecast.
The NBM should provide a consistent and accurate starting point for all NWS weather, water, and climate forecasts and, as such, is expected to greatly increase the efficiency of forecast and warning production. Revised, clearer, and more precise impact-based warnings and IDSS tools will be integrated with the NBM to ensure NWS forecasters are able to provide more accurate warnings with lead times coupled as scientifically possible to societally needed response times.
The forecast process team and the National Blend of Models (NBM) team are developing ideas for tests and demonstrations that could help inform roles and responsibilities related to the forecast process. At the time OWA was developing ideas, AWC, through its Digital Aviation Forecasting initiative, had already begun developing a similar idea.
Idea #14: Establish NCEP as the source for initial forecast guidance
The collaborative forecast process puts forth a vision in which expertise is layered onto a common starting point (the National Blend of Models). An idea for how this process could flow in practice is for NCEP to develop an initial, single source for the forecast (particularly once the National Blend of Models is probabilistic), which is then sent to WFOs for review and refinement at more local levels, particularly in the short-term time ranges, as needed for IDSS.
This very high-level process flow outlined in Exhibit 62 would have to be refined for use across service areas but serves as an initial idea of how a collaborative forecast process could work.

Note: This document catalogs the findings and ideas of the OWA; it is not an implementation plan.
74
Exhibit 62: Idea for process flow in collaborative forecast process
Idea #15: Develop NCEP common operating picture
A common operating picture across the entire NWS, built on the NBM, is a critical component to the collaborative forecast process. As part of the collaborative forecast process and idea, the OWA team also considered how NCEP Service Centers might contribute to a consistent operating picture. The vision for a collaborative forecast process puts forth that the Centers provide watches and outlooks, while WFOs provide warnings, unless there is a case for building a national warning capability (such has been done with hurricanes). As collaboration becomes more critical across field offices, the Centers could develop a consistent set of tools for collaboration and protocol for setting up collaboration calls and incorporating feedback.
IDEAS ON ORGANIZATION (ROLE CLARITY AND ORGANIZATIONAL HEALTH)
Phase 1: Findings Phases 2-4: Ideas for Evolving NWS
There is a lack of role clarity between the National Service Programs (NSPs) and other offices including the National Centers for Environmental Prediction (NCEP) and the Office of Planning and Programming for Service Delivery (OPPSD), as well as inconsistencies in NCEP roles and responsibilities following the 2015 NWS reorganization
Idea #16: Improve National Service Program role clarity with respect to other parts of the organization involved in integration and program/project management

Note: This document catalogs the findings and ideas of the OWA; it is not an implementation plan.
75
There is a lack of role clarity between River Forecast Centers (RFCs) and the Office of Water Prediction/National Water Center (OWP/NWC); ); Tsunami Warning Centers are not aligned to partner needs
Idea #17: Clearly define roles for RFCs and OWP/NWC in the forecast process and IDSS
Idea #18: Re-evaluate reporting structure of RFCs
Idea #19: Align Tsunami Warning Centers operationally and consider broader changes to program delivery
Span of control for field managers exceeds best practice standards, reducing ability to provide effective leadership and coaching
Idea #20: Develop supervisory positions to break large span of control between Regions and WFOs and within WFOs
NWS' organizational health is not sufficient to support desired level of high performance
Idea #21: Focus on priority practices that have outsized influence to improve organizational health
Idea #22: Establish body of MICs and HICs to advise NWS Governance councils
Idea #23: Utilize and expand internal rotation programs
Idea #16: Improve National Service Program role clarity with respect to other parts of the organization involved in integration and program/project management
The organizational core team developed options to increase role clarity between the NSPs, NCEP, the Office of Planning and Programming for Service Delivery (OPPSD) in NWS HQ, and the broader field structure. Options included: 1) employing NSPs as policy aggregators across the integrated field; 2) allowing NSPs to directly oversee and set policy requirements for the field; and, 3) disbanding the NSPs and instead using NCEP to set policy and operational requirements.
The OWC directed the core team to further refine option 1, employing NSPs as policy aggregators across the integrated field, which led to the guiding principles and distribution of functions outlined in Exhibit 63.

Note: This document catalogs the findings and ideas of the OWA; it is not an implementation plan.
76
Exhibit 63: Ideas for NSP roles
Idea #17: Clearly define roles of RFCs and OWP/NWC in the forecast process and IDSS
The OWA team has worked closely with leaders and managers of the NWS water services program, including the NSP program lead, the Director of the OWP, regional water program managers, and several RFC managers to develop ideas for the roles and responsibilities at RFCs and the OWP/NWC. Through a series of working sessions, a water services team developed initial ideas on IDSS responsibilities (Exhibit 64) and a collaborative forecast process (Exhibit 65) to apply to the water program. RFCs could continue to play a vital role in managing the forecast process by providing the link to anthropogenic information needed in the National Water Model and by providing IDSS to more regional core and deep partners, as well as subject matter expertise for staff in WFOs and their partners.
24DRAFT/PRE-DECISIONAL –
PROPRIETARY AND CONFIDENTIAL
National Service Programs (NSPs)1 Integrated FieldFunctions
▪ The National Service Programs (NSPs) focus on
strategy, planning and policy – providing support to and
serving the field, acting as a check and balance against
desired requirements & budget constraints, & raising
issues to the Mission Deliver Council when appropriate
▪ Aggregates needs & proposed reqs. from internal
& external partners & stakeholders, to conduct
evidenced-based trade-off analysis, serving as an
impartial broker
▪ Proposes needs and requirements based
on input from core partnersRequirements
▪ Proposes and develops national policy based
on requirements
▪ Implements and enforces policy which is
based on requirements Policy
▪ Coordinates strategy with the field ▪ Proposes strategic objectivesStrategy
The integrated field offices are operationally
focused on mission delivery – providing products
and services, such as analyses, forecasts (IDSS),
forecast warnings, observations and infrastructure
Noteworthy change from
current state
Guiding
principles:
▪ Leads NSP long-term planning (e.g., 3-years),
with a focus on their entire service program
▪ Focuses primarily on execution year, and
collaborates with NSPs to develop 3-year plansPlanning
▪ Held accountable by AFSO director, who reports
to the COO
▪ Held accountable by respective directors, who
collaborate with the AFSO & report to the COOAccountability
▪ Advises AFSO director on mission critical needs
of programs with input from the entire field
▪ Advises respective directors (e.g., RDs,
NCEP Director) on budget needsBudget
Organizational
perspective
▪ Provides high-level view of entire field and
across the NSPs
▪ Provides technical and operational expertise –
including core partner knowledge
Knowledge
sharing
▪ Provides technical and operational expertise –
including best practices
▪ Provides forum for feedback loop regarding policy
& planning for the entire field
1. The OWC recommends that next steps include examining imbalance between different NSPs and
appropriate GS level for NSP leads
An example organizational structure idea includes increasing role
clarity between NSPs and integrated field by drawing dividing
lines along key, shared functions

Note: This document catalogs the findings and ideas of the OWA; it is not an implementation plan.
77
Exhibit 64: Idea for local, regional, national IDSS alignment for the NWS water program
1 May include international partners at a local level (e.g., counties in Canada); in some places, will be boroughs or parishes;2 May include international partners similar to state level (e.g., Canadian provinces); 3 Inundation mapping
includes time of flood and peak flood, duration, confidence, and worst case
Very frequent provider of IDSS Somewhat frequent provider
▪ Inundation maps▪ Transportation agencies (DOTs,
roadways, railways)
▪ River navigators ▪ In-flow forecasts and velocity
▪ River ice analysis
▪ In-flow forecasts of various lengths (e.g.,
12 days for nuclear)
Water supply,
management
Transportation
Utilities
Emergency
management
and support
▪ Event-driven support (Inundation maps3,
resource placement, advising on
emergency constructions and
hydraulics/scenarios, containment
transport)
▪ Recurring (pre-event planning; outlook
basis. Planning piece; post-event
▪ In-flow forecasts (lengths vary); forecast
low flow as well; with uncertainty
Who are the partners? What are the decision needs?
▪ Reservoir managers
▪ Local presence of national partners
(e.g., FEMA region)
▪ State EMs2
▪ National partner HQ (e.g., FEMA)
▪ State water resource managers
▪ National partners (US Bureau
of Reclamation. USGS, Army Corps
of Engineers)
▪ Watershed districts
▪ National partners (USGS, Army Corps
of Engineers)
▪ Dam operators, floodplain managers,
levy districts
▪ Event-driven support
▪ In-flow forecasts (lengths vary)
▪ Scenario planning and training
▪ Local or county EMs1
▪ Plant operators (e.g., hydro, nuclear)
▪ Large operators (e.g., TVA)
▪ International partners (e.g.,
International Joint Commission)
WFO RFC
Region/
ROC National
Where could the IDSS occur?
1 International Boundary and Water Commission (IBWC), International Joint Commission (IJC); 2 Inundation mapping includes time of flood and peak flood, duration, confidence, and worst case
Very frequent provider of IDSS Somewhat frequent provider
Recreation
Agriculture
Ecosystem
management
Water policy,
planning, and
community
resiliency
WFO RFC
Region/
ROC National
Where could the IDSS occur?
▪ In-flow projections
▪ Scenario planning and trainings
▪ Post-event analysis
▪ Inundation maps2
▪ Flow analysis
▪ National orgs (e.g., Parks Service)
▪ Boating organizations (e.g., American
Whitewater, Colorado River
Boatman’s)
▪ National organizations (e.g., USDA,
NRCS)▪ Long-term flow projections
▪ Land analysis (e.g., soil moisture)
▪ Sub-national organizations (e.g., river
basin commissions, Association of
State Floodplain Managers, Biologic
Opinion)
▪ Community organizations (e.g.,
Tanana Chiefs, Alaska Federation
of Natives)
▪ Water quality (e.g., nutrients,
temperature, dissolved oxygen)
▪ In-stream flows
▪ Monitoring (not just projections)▪ Water authorities
▪ National partners (e.g, NMFS, FWS,
NOS, NORR)
▪ International organizations (e.g., Rio
Grande Compact, IBWC, IJC1)
▪ National partners (e.g., National
Marine Fisheries Service, Army Corps
of Engineers, FERC)
What are the decision needs?Who are the partners?

Note: This document catalogs the findings and ideas of the OWA; it is not an implementation plan.
78
Exhibit 65: Idea for water services collaborative forecast process
Idea #18: Re-evaluate reporting structure for RFCs
The OWA team and water services subject matter experts also considered the reporting structure of RFCs: either to maintain status quo alignment of RFCs under regional HQs or an alternative, of reporting to the Office of Water Prediction’s National Water Center (NWC), which could align all water services field offices under one chain of command (Exhibit 66). As of the writing of this catalog, the Office of Water Prediction is still in the process of working with Regions and the RFCs to further develop the collaborative forecast process and the operational model across the NWC and RFCs.
Run NBM
and NWM
Generate NWM-based forecast
Post-process NWM output for evaluation/interpretation by field
Analyze NWM forecasts
and assess impacts to core
partners
Provide decision
support
WFOs
ROCs
Local and
regional
partners
Regional water
resources
partners
1 3 4
Forecast production Impact analysis Service delivery
RFCs
generate
lumped model
output and
utilize NWM
output
2
NCO
WCOSS
(run NWM)
Full NWM
output on
NOMADs
National water
resources
partners
NWC
Thinned
NWM
outputs
PRELIMINARY CollaborationItalics = information flowHydro-related
NCEP forcings including NBM
NCO IDP
(Post-
process
NWM
output)
WPC
NHC
National
partners
WWAs, text
and graphics
WFOs, RFCs
NWC link
NWM output
with
geospatial
data to
convert
information
into water
intelligence

Note: This document catalogs the findings and ideas of the OWA; it is not an implementation plan.
79
Exhibit 66: Ideas for reporting structure of RFCs
Idea #19: Align Tsunami Warning Centers operationally and consider broader changes to program delivery
The Organization (Role Clarity and Organizational Health) workstream developed structural options to improve alignment of the tsunami warning centers (TWCs), including aligning the TWCs under NCEP, having the TWCs report directly to the COO, or aligning the TWCs under another NOAA line office. The OWC directed the workstream to consider additional options under the current organization, including an option where the TWC reports to their respective regional directors, who in turn report to the COO, since the COO position and office are still relatively new.
▪ Acknowledges strength of “status quo” -
RFCs currently act relatively independently
to provide specialized IDSS to their
stakeholders
▪ Maintains relationship between WFOs and
RFCs; both answer to RDs and can easily
share information through region
▪ Facilitates water program alignment
throughout field structure
▪ Supports RFCs with NWC resources
▪ Develops a national voice for water
▪ Allows for sharing of best practices
Pros
▪ Does not improve alignment within
the water program
▪ Does not address resource or
management attention challenges
▪ Could potentially de-prioritize WFOs
as a partner for RFCs and increase
silos
▪ Could hinder coordination between
WFOs and RFCs during high impact
events
Ideas Cons
A
B
OR
Keep status quo,
where RFCs
answer to
regional HQ
Align RFCs
under the
National Water
Center
Goal: Create alignment for RFCs to increase consistency and enhance provision of IDSS
Office of Assistant
Administrator for Weather
Services
COO
Regions
RFC 1 RFC 2 RFC 3 RFC 4 RFC 13
National Water
Center (NWC)
Water responsibility
Office of Assistant
Administrator for Weather
Services
COO
Region
3 RFCs 2 RFCs 4 RFCs 3 RFCs 1 RFC
National Water
Center (NWC)
Region Region Region Region
Vision and mission of NWC and resources and abilities aligned to NWC are critical decisions that should be aligned with needs of RFCs and field
Could additionally require alignment between NSPs and NWC to help align RFC to all water resources in NWS
Would need to clarify reporting lines of Service Hydrologist
If status-quo is chosen, current variance in hydro programs between regions and lack of communication between RFCs and their regions would
need to be addressed
…
Status quo option for organization structure Secondary option for organization structure
Additional considerations
Water responsibility

Note: This document catalogs the findings and ideas of the OWA; it is not an implementation plan.
80
Currently, the two TWCs issue forecasts for their respective areas of responsibility, meaning a single seismic event leads to two forecasts, which may not be consistent with one another. To address this issue, in Phase 3 the workstream identified several actionable ideas, including: integrating IT systems, defining “operational watch” for the two centers, providing forecasts for the full Pacific basin, defining the Caribbean basin as a single area of responsibility, and formalizing structures to increase collaboration between the two centers. The core team also identified three alternative long-term paths for the centers: rotate between hot and warm status, so only one issues a forecast for any given event; consolidate the centers; or, have one center specialize in forecast issuance and the other specialize in education and outreach.
Idea #20: Develop supervisory positions to break large span of control between Regions and WFOs and within WFOs
To address the finding on span of control being too high in WFOs, the OWA project considered recommending that SOOs and WCMs assume supervisory responsibilities, although if offices potentially become more asymmetric the need for such roles could change (e.g., some offices with increasing needs would perhaps warranting dedicated management positions, while others might have a shrinking need). Currently, MICs have a span of control of approximately 1:22 and often have no supervisory experience prior to entering the position. WCMs and SOOs are already part of the management team, but have no formal supervisory authority. Providing them with this responsibility could allow for supervisory experience earlier in an employee’s career, reduce the span of control in a WFO to approximately 1:7, and allow for closer supervisor/employee relationships.
To address the Regional Director span of control, the OWA project considered organizing offices into group (e.g., “area,” “cohort,” or “cluster”) configurations, with MICs either reporting to one MIC in the group, or to a group manager who could be embedded into one of the offices (in the same way as a Navy ship carrying a fleet Admiral nonetheless retains its own Captain and internal command structure while the Admiral manages the activity of the fleet).
Idea #21: Focus on priority practices that have outsized influence to improve organizational health
Best practices from the OHI indicate that increasing role clarity, creating an open and trusting environment, and capturing external ideas (innovation) were three priority practices that have an outsized influence on improving organizational health. Many of the ideas on roles and responsibilities could increase role clarity across field offices. Ideas for dedicated research coordinators and for offices to support each other more closely could improve NWS' ability to capture external ideas and incorporate them into operations. The OWA team tested such ideas through a communications network of field managers to create a more open and trusting

Note: This document catalogs the findings and ideas of the OWA; it is not an implementation plan.
81
environment, and the OWA project itself has sought to operate in a transparent manner and to involve internal and external stakeholders early and often.
Idea #22: Establish body of MICs/HICs to advise NWS Governance councils
The workstream also identified the need for MICs and HICs to directly advise NWS Governance Councils in a systematic and effective way. The workstream recommended a Field Leadership Committee under the NWS Mission Delivery Council (MDC) in the NWS governance to perform this function. With the approval of the MDC, the Field Leadership Committee was established as a management representative committee that surfaces concerns, identifies ideas, and proposes best practices from the field to the MDC for consideration for broader action and/or implementation. The FLC provides a forum for field managers to identify and share inter- and intra-region efficiencies and effectiveness, and increases field managers’ access and involvement within the NWS governance structure. The committee collaborates, rectifies, prioritizes, and elevates best-practices that are cross-regional in nature to MDC attention. In addition, the FLC shares MDC information with their peers in the field.
Idea #23: Utilize and expand internal rotation programs
The OWA core team also identified internal rotational programs as a means of further building staff capabilities and developing more trust and cohesion across parts of the organization. A range of possibilities were explored, from simple working rotations of forecast staff from one WFO to another (potentially in another region, or to a location with robust IDSS capabilities), to ROC duty-officer rotations (as are currently in place in Southern Region), to more intensive rotations through NCEP or HQ as part of leadership development in advance of promotion to management.
IDEAS FOR FUNCTION AND FORM CHANGES TO SUPPORT A FULLY INTEGRATED FIELD STRUCTURE
NOTE: Ideas in this section have not been accepted by NWS management for testing and demonstration at this time. These ideas may or may not be considered for testing and demonstration at a future date. A brief overview of the current path forward can be found in the section, “Moving forward after OWA”
Phase 1: Findings Phases 2-4: Ideas for Evolving NWS
The findings on workforce, operating model, and organization (role clarity and organizational health) indicate that the current distribution of staff across the country can evolve to better serve partner needs
Idea #24: Define required office staffing based on criteria that estimate workload
Idea #25: Produce gridded forecasts for an area larger than currently established areas, where possible

Note: This document catalogs the findings and ideas of the OWA; it is not an implementation plan.
82
Many WFOs do not have sufficient time or flexibility to deliver IDSS due to inflexibility in the current staffing model, which includes a “cookie cutter” workforce model across WFOs, 24/7 requirements, and the requirement of 2 people on duty, per shift
Idea #26: Pursue function and form changes: “unlock” staff time at WFOs to focus on IDSS and other activities critical to achieving WRN vision
Idea #27: Move toward a fully integrated field structure that best positions our human resources where we need them most, and based on the functions of each office
WFOs could improve collaboration across neighboring offices and across national, regional, and local offices to deliver better forecasts and services
Idea #28: Establish formal mechanisms for offices to support each other
The OWA diagnostic findings, paired with the vision for the future and ideas for evolving the NWS, indicate that current structures, workflows, and operational processes across the country could evolve to better serve partner needs.
The fully integrated field structure refers to the location and size of NWS field offices, and is supported by the workforce model (i.e., how NWS develops and deploys staff), operating model (i.e., how staff work together to deliver products and services), and Organization (Role Clarity and Organizational Health) (i.e., roles and responsibilities at each office).
Idea #24: Define required office staffing based on criteria that estimate workload
Given the diagnostic findings on the workforce-workload gaps, as well as the commitment to the deep relationships IDSS philosophy, the OWA Fully Integrated Field Structure and Field Director teams developed ideas for aligning staff resources according to workload, including demand for IDSS. The Field Director team developed a blueprint for determining staffing levels for offices based on the functions they could perform according to the vision.
The blueprint, as shown in Exhibit 67, outlines the major functions of the field, and indicates conceptually how the balance of staff time could be spent in the future. This blueprint is still notional – no actual feasibility testing or detailed bottom-up workflow/workload analyses on these concepts were conducted during the OWA.

Note: This document catalogs the findings and ideas of the OWA; it is not an implementation plan.
83
Exhibit 67: Blueprint for strategic staffing across all field offices
The National Centers, given an increased focus in the future on collaborative forecast production, would have an allocation of time similar to that shown in Exhibit 68.
Exhibit 68: Blueprint for strategic staffing at National Centers
The local offices, given an increased focus in the future on science-based service, would have an allocation of time similar to that shown in Exhibit 69.
Current illustrative time allocation across all field offices
Our efforts will result in increased staff time for supporting partner decision-making, which is
critical to our public safety mission, delivered at the local, state, and national levels
1 Chart represents an average time allocation across all field offices, including WFOs, RFCs, CWSUs, RHQ, ROCs, NCEP, NWC – time allocation at each office will be different according to the focus of each office in
support of a Fully Integrated Field Structure
SOURCE: Interviews and job shadowing during ~40 office site visits from May 2015 – January 2016, OWA IDSS team, April 2016
Future illustrative time allocation across all field offices1
Science & training
Leadership & administration
Individually-produced
gridded forecast
Impact-based decision
support services (IDSS)
Systems support
Short-term forecasting,
warnings, and situational
awareness (“met watch”)
From siloed production… …to science-based service in a fully integrated field structure
Science & training
Leadership & administration
Collaborative forecast
production
Impact-based decision
support services (IDSS),
based on observations &
forecast analysis, to support
“ready, responsive, resilient”
Systems support
Short-term forecasting,
warnings, and situational
awareness (“met watch”)
Diagnostic findings Vision

Note: This document catalogs the findings and ideas of the OWA; it is not an implementation plan.
84
Exhibit 69: Blueprint for strategic staffing at local offices
For local offices, the size of each function and each office could be determined by assessing workload in that office’s area of responsibility.
IDSS dimensions to assess could include 1) people and property; 2) weather types; 3) weather frequency; 4) vulnerability; and, 5) presence of core and deep partners. The dimensions could balance quantitative indicators of demand, such as population, GDP, and hazard information, with qualitative factors, such as unique aspects of the population or geography or how decisions are made for that area.
Met watch: (maintaining situational awareness and delivering up-to-the-minute environmental intelligence on evolving situations): the need for and size of a dedicated met watch function could be determined by assessing the frequency of activity in the area and if another office could provide met watch for a group of offices.
Systems support: the number of and distance between radar sites, ASOS sites, COOP sites, and auto-launchers could inform the number of staff needed at each site. The level of IDSS activity in the area could also influence the number of systems support staff needed, as IT and electronics staff could provide the infrastructure support needed to collect and share data and maintain communications.
Science and training: The size of the science and training function could vary with size of the office overall and whether the office provides support to other offices. Offices located near key research partners (e.g., other NOAA offices, universities) could have dedicated research managers; these research managers could coordinate efforts across WFOs to participate in research projects. Similarly, some offices could have dedicated training managers who could provide support across WFOs.

Note: This document catalogs the findings and ideas of the OWA; it is not an implementation plan.
85
Leadership and administration: The number of managers and supervisors in the office should scale with the size of the office overall, targeting a span of 6-10 direct reports per supervisor to allow for coaching and development. Administrative staff could also scale with office size.
OWA first focused on staffing levels at WFOs, given the findings on the workload-workforce gaps from Phase 1. A similar analysis could inform staffing levels at additional field offices.
Idea #25: Produce gridded forecasts for an area larger than currently established areas, where possible
An additional idea to improve the forecast process is to enable offices to forecast across multiple WFO areas of responsibility where there would be consistency and/or efficiency benefits. Given a common starting point across offices provided by the National Blend of Models, fewer staff members in a given area (for instance, a state) may be needed to adjust the forecast to meet partner needs. As the organization evolves to take advantage of a gridded forecast process that is more efficient, forecasting for larger areas could be explored.
In all cases, staff operating met watch shifts and staff operating IDSS shifts would have to work in close collaboration to ensure the forecast is provided to core partners. In these cases, close coordination and maintaining enough situational awareness at the local level to convey it confidently to partners is paramount. The OWA team envisioned a possible future model that could allow offices to provide “met watch” and potentially some warning issuance in support of other offices. The incorporation of “on-call” systems were also discussed. Examples of different potential scenarios for providing met watch and IDSS are shown in Exhibit 70 and Exhibit 71. It is important to note that no actual feasibility testing or detailed bottom-up workflow/workload analyses on these concepts were conducted during the OWA, and additional testing and demonstration would need to occur before putting any of these ideas into practice.

Note: This document catalogs the findings and ideas of the OWA; it is not an implementation plan.
86
Exhibit 70: Scenarios for providing met watch
Exhibit 71: Conceptual diagram of IDSS and met watch staff interaction to serve partners
These ideas have different resource implications to consider given that resources committed to dedicated met watch shifts cannot be used flexibly for IDSS needs. Resource usage in “met watch” scenarios is shown in Exhibit 72.
Met watch scenario Description
24/7 met watch at all
offices
▪ All offices have dedicated shift for met watch 24/7, to focus on situational awareness and
environmental intelligence
▪ Offices could be designated as “hot backup” sites for each other
▪ Increases the minimum size of a given office, as additional staff are needed beyond staff for IDSS
Met watch handover ▪ High and extreme IDSS offices have dedicated met watch shift 24/7, which provides “hot backup”
to neighboring CWAs during their operating hours and full met watch coverage when neighboring
offices are closed
▪ Medium offices have two met watch shifts per day, and low offices have one met watch shift per
day, increasing minimum size of an office
▪ Offices collaborate during events to ensure all offices have sufficient coverage for met watch,
warning production, and IDSS
Area met watch ▪ Dedicated met watch shift staffed 24/7 at ~40 offices, provides full time met watch coverage for
multiple CWAs as appropriate given size and frequency of events
▪ Offices collaborate during events to ensure all staff have situational awareness required to provide
IDSS
Possibility of a weather or
water event forecast
Weather or water event
begins to look very likely
Potential for a dangerous
event escalates Event is occurring
Partner
decision-
making
IDS
Ss
taff
▪ IDSS staff share
increasing potential for a
dangerous event with
partners, and aid in
scenario planning as
needed
▪ IDSS staff deploy if
needed
▪ Discuss forecast with
NCEP and other offices
affected to determine if
watch/outlook needed
▪ Discuss potential
scenarios and impacts
with partners
▪ Arrange overnight staff
coverage
▪ IDSS staff determine
what to communicate to
partners about the
impacts of the event,
share through best
channel for that partner,
and provide live support
as needed throughout the
event
▪ Share forecast
information and
analysis relevant to
the partner
Me
t w
atc
h
sta
ff
▪ Monitor forecasts and
observations to
remain situationally
aware
▪ Monitor forecasts and
observations to remain
situationally aware
▪ Make recommendations
to adjust staffing as
needed
▪ Collaborate with IDSS
staff on warnings
▪ Remain in constant
communication with
offices whose partners
may be affected
▪ Continue to monitor the
event and release
updates

Note: This document catalogs the findings and ideas of the OWA; it is not an implementation plan.
87
Exhibit 72: Resource usage in met watch scenarios
The OWA team also considered ideas for offices to share dedicated training coordinators who could supplement current training activities in the field, dedicated research coordinators who likewise could supplement management of university partnerships and research projects across offices, and area IDSS managers who could focus on state and other cross-CWA relationships. The OWA team also considered how managers of large offices could provide resource support to smaller offices as needed.
Idea #26: Pursue function and form changes: “unlock” staff time at WFOs to focus on activities critically supporting WRN vision
Given the vision for deep relationships IDSS, a collaborative forecast process, and a fully integrated field structure, WFOs could shift their allocation of time to unlock capacity to perform higher value activities. Exhibit 73 shows the concept that WFOs could shift time from gridded forecast production to IDSS, and to increased focus on science and training to enable the science-based service operating model. Again, it is important to note that Exhibit 73 is illustrative. Detailed testing and evaluation and feasibility studies would be required to better understand the practical limits for these theoretical shifts in forecaster allocation of time, while still retaining the forecasting expertise and situational awareness needed to provide IDSS.
1 Based on 1700 total operational field meteorologists available, including forecasters and WCMs
2 Mets available divided by mets needed (~1000, midpoint of IDSS demand plus ~250 midpoint of additional need at NCEP, ROC, etc, rounded)
Met watch
scenario
Area met watch
Met watch
handover
24/7 met watch at
all offices with
1/shift at times
24/7 met watch at
all offices
Mets
available1
1450
1150
950
750
250
550
750
950
110%
90%
75%
60%
Mets needed
for met watch
% of IDSS operating
model needs filled2

Note: This document catalogs the findings and ideas of the OWA; it is not an implementation plan.
88
Exhibit 73: From-to on WFO allocation of time
The OWA project team further investigated the IDSS demand across the nation to develop ideas for how best to shift time in WFOs and how to align staff to demand. The OWA project teams and OWC developed a methodology for evaluating the level of IDSS demand and estimating the staffing levels required to fill that demand using a workforce model (see Appendix – IDSS Staffing Level Methodology). The analysis also considered what additional investment in other offices (e.g., NCEP, ROCs, OPG, and RHQ) could be required to support the deep relationships IDSS and the collaborative forecast process operating model envisioned. Analysis of the idea suggests that there could be 2x the demand for IDSS than is being served today, and that 200-300 additional FTE may be needed to enable the operating model (Exhibit 74).
Exhibit 74: Flexibility needed to support science-based service operating model
400-900
200-300
Current IDSS
200-500
Additional IDSS needWeather IDSS need
600-700
800-1200
Total strategic staffing needAdditional need to enable IDSS
Calculations
(methodology
follows)
▪ Multiply IDSS
segmentations and
IDSS staff estimate
for each
segmentation
OWA team analysis
▪ NCEP could grow by 50-70 to
support forecast process
▪ ROC could increase staffing by 30-
80 for 24/7 coordination and
dedicated liaison roles
▪ Number of service hydrologists
could grow by 40-60
▪ OPG and test beds could grow by
10-20
▪ RHQ and regional staff could grow
by 10-30
Calculations
▪ Currently, IDSS is delivered in the field
by some dedicated staff (e.g., 122
WCMs, ~40 offices with staffed IDSS
desk at least 1 shift per day)
▪ Of the additional ~1,600 mets at
WFOs, estimated that 25-30% of their
time is spent on IDSS currently
▪ Total IDSS time today is dedicated
staff + percentage of remainder: 122
FTE + 80 FTE + 400-500 FTE
OWA team analysis
▪ Additional unforeseen
needs may increase
total need by ~10%
▪ E.g., NWC staff,
science and training
coordinators, steady-
state vacancy rate

Note: This document catalogs the findings and ideas of the OWA; it is not an implementation plan.
89
To meet the strategic staffing need, the OWA project teams and the OWC identified seven functional and form changes that can unlock time currently spent on lower-value activities in WFOs than the envisioned new science-based service operating model. To increase time for IDSS and to allow for more agility in the field structure so that new demands can be met as they arise, NWS could pursue the following “unlocks” of WFO staff time (Exhibit 75).
Exhibit 75: "Unlocks" idea to increase flexibility in WFOs
Each of the “unlocks” provide flexibility that can be redeployed on higher-value activities so that NWS can take full advantage of its field personnel. The collaborative forecast process and the met watch backup function are the most critical functional changes, and releasing one of the 24/7 requirement or the two per shift requirement is one of the most critical form changes. As of the writing of this catalog, the NWS is focusing on testing and evaluating unlocks 1, 2, and 3 (Collaborative Forecast Process, GS-5/12 Career Progression, and Auto-launchers), as explained in the concluding section “Moving forward after OWA”. Exhibit 76 shows how the functional changes build up flexibility in the workforce, and how the form changes, if not achieved, could reduce that flexibility. Exhibit 77 through Exhibit 80 show each of the unlocks and their contribution to the total flexibility that could be achieved in the staffing model. Exhibit 81 and 81 show the flexibility that will not be unlocked if provided certain constraints. Exhibit 83 shows the total unlock of WFO staff time.
Again, it is important to note that these are notional, estimated values of unlocked hours and FTE. The OWA did not perform detailed feasibility studies or detailed bottom-up workflow/workload analyses to confirm these estimates. Further testing, demonstration, evaluation and analysis would need to take place before these values could be confirmed or refuted. At stated above, at this time NWS is focusing on testing and evaluating only the collaborative forecast process, the GS-

Note: This document catalogs the findings and ideas of the OWA; it is not an implementation plan.
90
5/12 career progression, and auto-launchers). These unlocks focus on opportunities for efficiency and improvement within a forecast office.
The NWS may also pursue additional unlocks as opportunities present themselves. For instance, a shiftwork team was formed with NWS management and NWSEO participation. The recommendations from that team, once tested and evaluated, may contribute to these unlocks. In addition, opportunities for colocation with emergency management or universities, such as in Slidell, LA or Albany, NY, may also increase efficiencies.
Exhibit 76: Unlocks of WFO staff time
1DRAFT/PRE-DECISIONAL –
PROPRIETARY AND CONFIDENTIAL
OWA unlocks
Met watch
backup for
shift
scheduling
flexibility
Remaining
flexibility
unlocked
No
strategic
positioning
Flexibility
unlocked
No staffing
flexibility
Auto-
sonders
No shift
scheduling
(24/7)
flexibility
Colla-
borative
forecast
process
5-12
pathway
Tools used to achieve strategic staffing in the future operating model, FTE
Strategic
staffing
need
1 2 3 4 5 5 6Tools 7
Status
quo
SOURCE: OWA Strategic staffing team, July 2016

Note: This document catalogs the findings and ideas of the OWA; it is not an implementation plan.
91
Exhibit 77: Collaborative forecast process "unlock"
Exhibit 78: 5/12 pathway "unlock"
19DRAFT/PRE-DECISIONAL –
PROPRIETARY AND CONFIDENTIAL
Met watch
backup for
shift
scheduling
flexibility
Auto-
sonders3
5-12
pathway2
No shift
scheduling
(24/7)
flexibility
Flexibility
unlocked
No strategic
positioning
Remaining
flexibility
unlocked
No staffing
flexibility6
Colla-
borative
forecast
process
Strategic
staffing
need
Status
quo
Calculations
▪ Estimate of ~2 shifts per day at each WFO currently devoted to
grids1
▪ Collaborative forecast process frees up all of that time
▪ Estimated unlock is 4 FTEs at each WFO, ~400-500 total
Unlock from collaborative forecast process could
be 400-500 FTE
Considerations
▪ Even if equivalent of two full shifts per day aren’t spent on
grids, meteorologists still tied to their desks to meet
production deadlines and produce other forecast products
SOURCE: OWA Strategic staffing team, July 2016
Dependencies on other unlocksFocus of slide
2 PRELIMINARY
1 Estimated through interviews, site visits, and results of MIC Survey in April 2016 showing 60% of offices have separate short-term and long-term forecast
desks, with majority of offices staffing 6-8 shifts per day; met time spent generating forecast estimated at ~25-30% of shift
20DRAFT/PRE-DECISIONAL –
PROPRIETARY AND CONFIDENTIAL
Remaining
flexibility
unlocked
Flexibility
unlocked
No strategic
positioning
No shift
scheduling
(24/7)
flexibility
No staffing
flexibility
Met watch
backup for
shift
scheduling
flexibility
Auto-
sonders
Colla-
borative
forecast
process
5-12
pathway
Strategic
staffing
need
Calculations
▪ Of the total 180 GS-11s, assume 50% become GS-12s and their
time is fully unlocked (90 FTEs)
▪ Of the remaining 200 interns (GS-5-9 and remaining GS-11s)
assume 30% of their time can be unlocked due to shift in PSU
functions (60 FTEs)
▪ Total unlock is equivalent to ~150 FTEs
Unlock from GS5-12 pathway could be 100-200 FTE
Considerations
▪ Assumes time of the fully unlocked GS-11s is currently
not spent on “unlocked” functions
▪ Assumes further GS-5-9 time cannot be unlocked due to
training needs
Dependencies
▪ Assumes that this unlock does not double-count with time
spent currently launching balloons
SOURCE: OWA Strategic staffing team, July 2016
Dependencies on other unlocksFocus of slide
3
Status
quo
PRELIMINARY

Note: This document catalogs the findings and ideas of the OWA; it is not an implementation plan.
92
Exhibit 79: Auto-launchers "unlock"
Exhibit 80: Met watch backup "unlock"
21DRAFT/PRE-DECISIONAL –
PROPRIETARY AND CONFIDENTIAL
No strategic
positioning
Colla-
borative
forecast
process1
5-12
pathway2
No staffing
flexibility6
Auto-
sonders3
No shift
scheduling
(24/7)
flexibility5
Flexibility
unlocked
Met watch
backup for
shift
scheduling
flexibility4
Remaining
flexibility
unlocked
Strategic
staffing
need
Calculations
▪ At 12 Alaska WSOs, assume the full unlock of 3 FTE currently at
those locations (36 FTE)
▪ At ~80 CONUS sites, assume that 1-2 hr/day is freed up by not
launching balloons, for total of 500-1000 hrs per week. (~15-30 FTE
at 40 hrs/week)
▪ Total unlock is ~50-70 FTEs
Unlock from autosonders could be 50-70 FTE
Considerations
▪ May be further financial “unlock” if CONUS locations with
contracted staff are converted to autosonders
Dependencies
▪ At Pacific region locations, balloons currently launched at
1am. Not installing autosonders may eliminate any benefit
of reducing to below 24/7 via other unlocks because
someone would need to launch the balloon
SOURCE: OWA Strategic staffing team, July 2016
Dependencies on other unlocksFocus of slide
4
Status
quo
PRELIMINARY
22DRAFT/PRE-DECISIONAL –
PROPRIETARY AND CONFIDENTIAL
Remaining
flexibility
unlocked
Flexibility
unlocked
No strategic
positioning
No staffing
flexibility6
No shift
scheduling
(24/7)
flexibility5
Met watch
backup for
shift
scheduling
flexibility4
Auto-
sonders3
5-12
pathway2
Colla-
borative
forecast
process1
Strategic
staffing
need
Calculations
▪ At offices categorized as “low” IDSS demand, there may be very
limited regular IDSS demand outside of normal business hours.
Having a warning backup removes requirement to have a person
on-shift the other two shifts per day (4 FTE per office at 25 offices)
▪ At medium IDSS offices, assume there is very limited IDSS demand
on one shift per day (may be swing or mid shift). At each low office,
having a warning backup removes requirement to have a person on
that shift (2 FTE per office at 37 offices)
▪ Total unlock is ~150-200 FTE
Unlock from met watch back-up could be 150-200 FTE5
Considerations
▪ Does not include any savings from times where offices
“spin-up” to provide additional met watch, which could be
provided by back-up office without spinning up
Dependencies
▪ Benefits from being able to switch to a back-up to cover is
undone if all offices required to be 24/7 anyway
SOURCE: OWA Strategic staffing team, July 2016
Dependencies on other unlocksFocus of slide
Status
quo
PRELIMINARY

Note: This document catalogs the findings and ideas of the OWA; it is not an implementation plan.
93
Exhibit 81: Shift scheduling flexibility "unlock"
Exhibit 82: Shift staffing "unlock"
23DRAFT/PRE-DECISIONAL –
PROPRIETARY AND CONFIDENTIAL
Remaining
flexibility
unlocked
Flexibility
unlocked
No strategic
positioning
No staffing
flexibility6
No shift
scheduling
(24/7)
flexibility5
Met watch
backup for
shift
scheduling
flexibility4
Auto-
sonders3
5-12
pathway2
Colla-
borative
forecast
process1
Strategic
staffing
need
Calculations
▪ Equal to met watch backup unlock because with collaborative
forecast process, 5-12 pathway, autosonders, and met watch
backup, there are limited further requirements to “unlock” to enable
a change in operating hours in offices without 24/7 IDSS demands
▪ Loss of this unlock would require staffing individuals on shifts for
which there are no remaining functional responsibilities in the future
paradigm, so would represent a loss of flexibility that could have
been used for IDSS or other need
Flexibility loss from shift scheduling flexibility could
be 150-200 FTE5
Considerations
▪ Does not include any savings from times where offices
“spin-up” to provide additional met watch, which could be
provided by back-up office without spinning up
Dependencies
▪ Dependent on functional unlocks described
SOURCE: OWA Strategic staffing team, July 2016
Dependencies on other unlocksFocus of slide
Status
quo
PRELIMINARY
24DRAFT/PRE-DECISIONAL –
PROPRIETARY AND CONFIDENTIAL
No staffing
flexibility6
Remaining
flexibility
unlocked
No shift
scheduling
(24/7)
flexibility5
No strategic
positioning
Flexibility
unlocked
5-12
pathway2
Colla-
borative
forecast
process1
Auto-
sonders3
Met watch
backup for
shift
scheduling
flexibility4
Strategic
staffing
need
Calculations
▪ Medium offices add 1-2 people to mid shift where only person would
have been on met watch or met watch may not have been needed
(2-4 FTE per office at 47 offices)
▪ Low offices add 1-2 people each to otherwise unstaffed swing and
mid shifts, or shifts staffed with 1 person for met watch (4-8 FTE per
office at 25 offices)
▪ Total unlock estimated at ~200-300 FTEs
Flexibility loss from shift staffing flexibility could
be ~200-300 FTE6
Dependencies
▪ Depends significantly on how the met watch function is
conducted, and if offices are allowed to not be 24/7
▪ Would vary based on how the IDSS operations are
scheduled in an office as well. For example, if low office
was allowed to close but scheduled single IDSS staff on
two shifts per day, requirement of two/shift would require
two additional staff per day (4 FTE) across those two
shifts. If two staff on single shift and met watch backup
allowed, then two/shift would have no effect. Difference
here is 100 FTE, considering only the low segment.
SOURCE: OWA Strategic staffing team, July 2016
Dependencies on other unlocksFocus of slide
Status
quo
PRELIMINARY

Note: This document catalogs the findings and ideas of the OWA; it is not an implementation plan.
94
Exhibit 83: Total unlock of WFO staff time
As flexibility is achieved, staff can focus on IDSS functions, or to work more hours when partners need them. This increased flexibility is anticipated to have benefits for both our NWS partners and the NWS organization and workforce. In the long term, billets could be redistributed across the country based on need, as explained in the next idea.
Idea #27: Move toward a fully integrated field structure that best positions are human resources where we need them most, and based on the functions of each office
The OWA Fully Integrated Field Structure team developed initial ideas on how to estimate IDSS demand across offices using several dimensions and how to staff NWS to meet that demand. The dimensions included 1) people and property; 2) weather types; 3) weather frequency; 4) vulnerability; and, 5) presence of core and deep partners. The dimensions seek to balance quantitative indicators of demand, such as population, GDP, and hazard information, with qualitative factors, such as unique aspects of the population or geography or how decisions are made for that area. A similar methodology was used to separately estimate water services IDSS demand. Please see Appendix – IDSS Staffing Level Methodology for more information.
The Field Director team tested the idea by using an iterative approach to evaluate each office’s area of responsibility according to these dimensions and segmenting offices as having low, medium, high, or extreme IDSS demand. The Field Directors also refined the potential operating models for offices in each segment of IDSS demand, with extreme offices having the highest staffing and 24/7/365 operations,
25DRAFT/PRE-DECISIONAL –
PROPRIETARY AND CONFIDENTIAL
Function and form unlocks provide flexibility for NWS
Remaining
flexibility
unlocked
5-12
pathway2
Flexibility
unlocked
Met watch
backup for
shift
scheduling
flexibility4
Colla-
borative
forecast
process1
200-500
50-100
100-200
No
strategic
positioning
No staffing
flexibility6
No shift
scheduling
(24/7)
flexibility5
Auto-
sonders3
150-300
400-500
TBD
700-900150-200 150-200
Tools used to achieve strategic staffing in the future operating model, FTE
Strategic
staffing
need
400-900
1 2 3 4 5 5 6Tools 7
Status
quo
SOURCE: OWA Strategic staffing team, July 2016
PRELIMINARY

Note: This document catalogs the findings and ideas of the OWA; it is not an implementation plan.
95
contrasted with low offices having less staffing and business hour operations. Exhibit 84 shows that when NWS delivers IDSS, 94% is at the local level, and that additional need for IDSS is distributed across the entire field structure with every NWS office serving partners. In addition, every NWS office serves partners with additional IDSS needs and as a result, NWS must maintain local presence through the current WFO infrastructure to enhance IDSS at all locations and levels of the organization (Exhibit 84). As discussed later, this finding provides a basis for the unlock activities that are now being considered.
Exhibit 84: Estimated unmet IDSS needs across the United States
Also, as part of the analysis, a potential future IDSS staffing level for each office was then estimated using the segmentation, the IDSS need, and estimated IDSS staffing levels (Exhibit 85, below).
Note: This document catalogs the findings and ideas of the OWA; it is not an implementation plan.
96
Exhibit 85: Potential distribution of weather and water IDSS staff at WFOs (does not include staff for other critical WFO functions)
According to this staffing analysis, IDSS staff may be distributed at different levels across the country, ranging from 3-5 meteorologists in the lowest IDSS demand locations to 14+ staff in the most extreme IDSS demand locations. Importantly, these staff numbers in Exhibit 85 only represent those for the IDSS function; additional staff is required for other office functions such as “met watch,” warnings, systems support, science and training, etc. The “unlocks” allow the NWS to meet more of this currently unmet IDSS demand by increasing the efficiency and effectiveness of the forecast process within every forecast office, an important first step to determine more exactly the level of effort required at each office to address the critical IDSS requirements in each NWS office.
Idea #28: Establish formal mechanisms for offices to support each other
The findings showed there are some functions that are not effectively or efficiently performed within each WFO. If staffing becomes more asymmetric in a future model, there could be an increased need for offices to support each other – offices that are smaller may occasionally need surge support. WFOs could support each other in ensuring all offices can surge when needed and have “hot backup” from other offices.
In particular, the OWA teams saw a need to provide additional “met watch” coverage, or “hot backup,” given the increasing need to manage large volumes of data to maintain situational awareness and develop up-to-the-minute environmental intelligence for partners. Additionally, as some offices become smaller to match IDSS demand, it may be difficult for those offices to sustain operations if there is a prolonged event – they could need more backup than the current organization provides. Even in the current state, the OWA findings show that at current resource
Example distribution of IDSS staff based on partner demand today
# of IDSS staff per WFO (does not include staff for other functions)
3-5
12-16+
9-11
6-8
1 Staffing levels based on population (resident and seasonal; absolute and density), GDP, types of weather affecting the area, frequency of weather affecting the area, vulnerability of the population to weather, and presence of core and deep partners;
criteria include water drivers (e.g., drought, dams)
Partners receive IDSS support
greater than or equal to today,
with surge support as needed
▪ Staffing levels based
on quantitative and
qualitative criteria1
▪ Number of staff subject
to testing and future demand
▪ Map only shows IDSS
staff – additional staff are
needed for other critical
functions

Note: This document catalogs the findings and ideas of the OWA; it is not an implementation plan.
97
levels (and with vacancies), it is difficult for an office to sustain 24/7 met watch operations and serve IDSS partners.
There are several ideas for how to provide met watch capacity to all CWAs. All offices could operate a designated met watch shift 24/7, all offices could operate met watch during operating hours with backup when not fully staffed, or a set of offices across the country could provide met watch on behalf of broader areas that encompass multiple CWAs.
ADDITIONAL IDEAS NOT REFINED BY THE WORKSTREAMS
In addition to the ideas presented above, the workstreams identified several ideas to address gaps identified in the Phase 1 diagnostic, but these ideas were not prioritized by the OWC for further exploration due to resource constraints. Some of these ideas included creating a nationally-run IDSS review system, evaluating the HMT position in the context of a fully integrated field structure, refocusing the COOP program and OPL positions, integrating leadership training throughout the career path of all NWS employees, hiring some HQ and Field management positions under a more general management series to attract a more diverse set of applicants, and centralizing some administrative tasks at the regional level.
The benefits for the nation and for NWS staff These ideas have been designed to enable a science-based service operating model and move the National Weather Service towards a more customer-centric organization to meet its mission of providing forecasts and warnings to protect life and property and enhance the national economy. The OWA diagnostic found that deep relationships partners value the local presence and interpretive services from the NWS to help them protect lives and property from extreme weather, water, and near-term climate events. The diagnostic also found that NWS staff perceives the current field structure constrains their ability to serve their partners and to stay motivated. By working together with internal and external stakeholders the NWS can refine this vision and enact it to build a Weather-Ready Nation.
The field structure described could improve protection of life and property by:
– Providing more staff time on shifts to support preparation, mitigation, and recovery when their partners are spending time on these activities.
– Deepening the operational support available during events.
– Developing and leveraging experts across field offices.
– Coordinating forecasts and messages across offices.
– Making NWS more agile and nimble to respond to changing demands.
Note: This document catalogs the findings and ideas of the OWA; it is not an implementation plan.
98
The field structure described could also improve NWS organizational health by:
– Limiting harmful overnight/evening shift work and creating a desirable workplace for a diverse range of employees.
– Enabling staff to spend more time on high-impact meteorology and hydrology.
– Making time for staff to spend more time on what they describe as most rewarding: helping others and protecting lives and property.
– Creating additional career pathways through specialist roles and management positions at different levels.
Moving forward after OWA
VISION FOR EVOLVING NWS AND ACHIEVING A FULLY INTEGRATED FIELD STRUCTURE
During Phase 5 of the OWA, NWS began the process of developing a vision forward and incorporating selected ideas and recommendations for testing, demonstration, and evaluation that furthered that vision. This vision also addressed gaps that were identified in Phase 1 of the OWA. In building the vision, NWS sought to create an inclusive process, involving internal and external stakeholders such as the International Association of Emergency Managers (IAEM), the National Emergency Management Association (NEMA), Congress, professional organizations such as the National Academy of Public Administration (NAPA) and the American Meteorological Society (AMS), NWSEO, and staff. These stakeholders helped, and continue to help, NWS balance the amount of change required with NWS' ability to act on those requirements. Some guiding principles behind the development of the vision included:
Continue the commitment to deliver on the mission through science-based service, with robust observing networks and accurate, consistent forecasts and warnings.
Maintain local presence, given that proximity to core partners supports deep relationships IDSS and the delivery of NWS’s mission.
Consider long-term staff- and resource-neutral options and ideas
Meet societal demand for greater efficiency and productivity of government resources; maintain or improve accuracy of forecasts and warnings while increasing readiness and responsiveness and overall resilience of local communities to extreme weather, water, and climate events.
Based on the OWA, NWS aligned on long-term, visionary changes that move NWS:

Note: This document catalogs the findings and ideas of the OWA; it is not an implementation plan.
99
From a production-oriented workforce to a diverse, versatile workforce trained in a science-based service-oriented model, trained in the skills needed to serve partner needs and protect lives and property
From inconsistency in partners served across the NWS to a deep relationships IDSS philosophy to support core partners, especially those in the emergency management and water resource management communities, in making life- and property-saving decisions related to weather, water, and climate events. The NWS does this by focusing its resources on core and deep relationships partners who serve a critical public safety mission, by increasing consistency in services it provides, and by listening more deeply to customer needs. This allows the NWS to amplify its impact.
From seams and inconsistencies in forecast and duplication of effort to a collaborative forecast process in support of IDSS and a science-based service operating model that makes the best use of technology, reduces duplication, and ensures consistency. The collaborative forecast process ensures NWS provides weather, water, and climate data forecasts and warnings for the protection of life and property and the enhancement of the national economy in the most efficient and effective way possible. The collaborative forecast process develops a single source for forecasts by layering national and local expertise onto a common starting point, enabled by a National Blend of Models. By making the best use of technology, this process can reduce duplication and increase consistency across forecast offices.
From siloed field offices with overlapping roles to expertise aligned where it’s needed most through clear roles and responsibilities
From a “one-deep” operational force to field offices that support each other, creating resiliency through more eyes on target and the capability to sustain surge operations.
From a one-size-fits-all staffing and operations model at all offices to a more flexible model that aligns staff based on workload demands and partner needs.
These changes culminate in a vision for a fully integrated field structure to deliver deep relationships IDSS, enabled by a collaborative forecast process. Some characteristics of a fully integrated field structure may include:
Local offices serving as the “tip of the spear” for IDSS and WRN. Some local staff could be experts in partner needs, forecast analysis and nowcasting, assessing the impact of weather and water events, and communicating those impacts to partners, while at the same time continuing

Note: This document catalogs the findings and ideas of the OWA; it is not an implementation plan.
100
to maintain their forecasting acumen. Operating hours and staffing levels of offices could match partner needs.
Field offices supporting each other in filling gaps that can’t be best filled at the national or local level. Some offices could play an additional role in coordinating across local, regional, and national levels. Offices could work together more formally to provide resiliency and surge capabilities, to coordinate IDSS, and to support each other in research and training. National centers could collaborate with other field offices, primarily through the Regional Operation Centers (ROCs).
National offices (NCEP, OWP) delivering the initial forecast guidance, as well as analyzing impacts and providing IDSS for national partners.
Taken together, the NWS must become a much more flexible organization to provide the amount and degree of IDSS demand identified by this document. The NWS must shift from a predominately production-oriented culture to a more flexible, agile, face-to-face and on-demand customer-centric one, focused on delivering actionable information to partners in service of protecting lives and property. However, such fundamental cultural changes cannot happen overnight, which is why NWS is gradually evolving toward the new IDSS customer centric model.
MOVING TOWARDS THE VISION THROUGH TEST, EVALUATE, INVOLVE
As Part of Phase 5, NWS has considered the findings and ideas of the OWA project, and is prioritizing testing and evaluation of several of the workforce, operating model, and organization (role clarity and organizational health) ideas, as well as some of the ideas for a fully integrated field structure. Some of the ideas can be tested, evaluated, and acted upon sooner than others, while other tests will begin after results of the first set of tests are evaluated, and according to availability of resources.
As one of its last actions, the Operations and Workforce Committee (OWC) chartered and Evolve Program Management Office and adopted a set of strategic objectives to Evolve the NWS to provide better Impact-Based Decision Support Services (Exhibit 86 below).

Note: This document catalogs the findings and ideas of the OWA; it is not an implementation plan.
101
Exhibit 86: Objectives supporting vision and mission
NWS has begun testing and evaluating the workforce and operating model ideas through its normal governance process. NWS is also building on the vision of a collaborative forecast process by designing tests to leverage the National Blend of Models as a single starting point for forecasts – two tests are already underway in Fiscal Year 17. OWA has also led further design and testing of a GS-5/12 career progression by building a detailed competency model and developing plans to test the model through tabletop performance and promotion conversations. NWS has also developed the NWS 101 onboarding program, which it will refine as the first class attends. NWS also continues to refine partner definitions and core IDSS service levels in collaboration with NWS partners.
The NWS will test and demonstrate each new capability to ensure expectations are met, focusing on the “seven unlocks” that provide staff additional flexibility to meet demands of the science-based service operating model. Much of the testing will occur in Fiscal Years 17, 18, and 19 (Exhibit 87, below). The focus is on the first three unlocks in FY17 and FY18.
It is important to note that the unmet IDSS need addressed by these unlocks was only estimated by the OWA (See Appendix – IDSS Staffing Level Methodology). As a result, it is critical that NWS test and evaluate the actual impact of all initiatives prior to implementation. Through time as conditions warrant, the sequencing and priority of initiatives may also change according to an ongoing, deliberative process consistent with the NWS governance, which depends on a number of factors including availability of resources.

Note: This document catalogs the findings and ideas of the OWA; it is not an implementation plan.
102
Exhibit 87: Staff time “unlocks”
1. Collaborative Forecast Process: The Phase 1 analysis found that the current NWS forecast process is manually work intensive and duplicative. The workstreams recommended improvements in role clarity between national centers and local forecast offices as a primary means of improving the NWS forecast process and reducing duplication, resulting in the term “Collaborative Forecast Process”. Secondly, the workstreams recommended NWS leverage emerging technologies such as the National Blend of Models that will integrate numerical weather prediction inputs in a way that streamlines the time needed to produce digital forecasts. It will also provide a consistent and accurate starting point that each forecast office will use for making forecasts at the local, regional, and national scale. Over time, and through the integration of science and technology, it will become increasingly more accurate, precise, and provide new digital forecasts grids that will provide a consistent basis for all IDSS, forecasts, and warnings the NWS produces. The NBM provides additional time for IDSS and the flexibility for NWS forecasters to focus on the most critical part of the forecast period as they see fit, and on times and locations with high impact weather. The NBM, combined with a collaborative forecast process, also generates greater consistency across time and space. Over the next year or more, NWS will test its ability to use the NBM more effectively in the forecast process. It does not preclude the local knowledge which is critical to forecasting local features and to delivering impactful IDSS that our partners can make decisions on. Secondly, a national database (Impacts Catalog) containing core partner information, risk exposure, and hazard triggers will be developed to improve community readiness and responsiveness in the face of extreme events. National centers could also continue to develop higher order impact based guidance products to supplement local forecast guidance to facilitate consistency of IDSS provided across local, regional, and national interests.

Note: This document catalogs the findings and ideas of the OWA; it is not an implementation plan.
103
2. GS-5/12 Career Progression: NWS cannot fully accomplish the service
part of its mission without evolving the workforce. The GS-5/12 Career Progression Program builds the workforce needed to deliver critical IDSS services by ensuring the right competencies, training and experiences are available and to, in part, create internal shift flexibilities.
3. Auto-launchers: NWS is examining new radiosonde auto-launching technologies as part of a larger response to a presidential initiative to consolidate and conserve federal radio spectrum. By deploying new technologies like this, NWS would be able to provide flexibility in scheduling shifts to repurpose staff from upper-air releases to improve the impact of more accurate and consistent forecasts, in particular for OCONUS regions. An initial demonstration will deploy auto-launchers to 13 Upper Air sites in the Alaska Region over the next few years.
The OWA investigated how staff in local offices could be more aligned with IDSS demand versus the NWS’s current inflexible operating model. The OWA started to lay the groundwork for considering changes to our shiftwork and operating hours model, particularly within each office. The NWS may investigate the use of more flexible shift staffing and office scheduling flexibility to meet IDSS demand before, during and after extreme events and provide the ability to build resiliency in their local communities during quiet times between events. In addition, flexible shift staffing and office scheduling flexibility has also been proposed as a means for improving organizational health. These investigations will also serve to study the effects of these methods on the health of employees.
The NWS may pursue these as opportunities present themselves. For instance, a shiftwork team was formed with NWS management and NWSEO participation. The recommendations from that team, once tested and evaluated, may contribute to these unlocks. In addition, opportunities for colocation with emergency management or universities, such as in Slidell, LA or Albany, NY, may also increase efficiencies.
It is important to note that the following unlocks have not been selected for testing and demonstration at this time.
4. Shift Scheduling Flexibility: Services to partners will always remain 24/7. However, office scheduling flexibility provides ability to determine how and whether shifts in field offices should be staffed so that NWS staff can meet the IDSS needs of our partners.
5. Staffing Level Flexibility (Shift Staffing): More flexibility to determine how many people are required to meet partner’s IDSS demand.
6. Strategic Positioning with Partners: Better service to partners by working at their location either part or full time.
7. Strategic Staffing (Office Staffing Flexibility): Staff can be incrementally and systematically redistributed to areas of highest need.

Note: This document catalogs the findings and ideas of the OWA; it is not an implementation plan.
104
These unlocks are accomplished through 16 initiatives that are derived largely from the OWA ideas in Phases 2, 3, and 4, described earlier in this document. These initiatives can also be mapped into the five OWA strategies noted in the previous section (Exhibit 88).
Exhibit 88: Sixteen initiatives for accomplishing five objectives
Given the magnitude of change required for some of the unlock ideas, NWS expects the vision could be achieved in several phases, given availability of funding and resources. All activities currently decided for testing and demonstration are in Evolve 1.0. In this first phase, opportunities that could be acted on currently or in the very near-term will be sequenced. These include establishing a common starting point for the gridded forecast and testing the unlock of time through the collaborative forecast process, installing auto-launchers in some locations, and testing the unlock of time through the GS 5-12 career progression. Exhibit 89 shows a conceptual phasing of potential future activities in Evolve 2.0 and Evolve 3.0, assuming funding and resources are available, and decisions are made by the NWS to move forward with these potential future activities. Again, only activities in Evolve 1.0 have currently been decided by NWS for testing and demonstration.

Note: This document catalogs the findings and ideas of the OWA; it is not an implementation plan.
105
Exhibit 89: Phased approach to acting on OWA ideas. This phased approach depends on availability of resources, which have not yet been budgeted, and future decisions by NWS
NWS anticipates further investigation of the following questions through an inclusive process of testing, demonstration, and evaluation:
How will NWS determine how much capacity is needed to provide IDSS across the country? Further analysis and testing needed:
– Testing and refining methodology for determining IDSS demand
– Studying staff capacity needed to serve core and deep relationships partners around the country, at IDSS philosophy service levels
How will NWS “unlock” staff time to focus on IDSS or to move to an office where there is additional demand for IDSS? Further analysis and testing needed:
– NWS Operational Proving Ground (OPG) tests, field tests (i.e., executed through “hot backup”), and live demonstrations or pilots to test changes to processes and roles and responsibilities
– Time studies and service assessments to determine if the unlock is achieved and if the resulting process is high quality
How will NWS ensure the quality of the forecast and warning products, as well as services, are maintained? Further analysis and testing needed:
– Test and evaluate changes to its operating model, workflow, and organization before implementing them
– Evaluation will include product quality metrics, service metrics, and efficiency metrics – and tests will include partners when appropriate

Note: This document catalogs the findings and ideas of the OWA; it is not an implementation plan.
106
NWS has begun planning for significant testing, demonstration, and evaluation activities, to involve internal and external stakeholders. Each Region has committed to championing one of the tests and participating in one or more of them.
NWS recognizes that addressing the findings of the OWA project and acting on the ideas is a substantial undertaking, and one that is critical to evolving the NWS to deliver a Weather-Ready Nation. Through the OWA project, NWS has built alignment among senior leaders on the vision, and commitment throughout the organization to test and demonstrate several of these ideas. Other ideas will require additional discussion, analysis, decisions, or funding before testing may commence. NWS will continue to bring internal and external stakeholders into the process of testing and evaluation, and will continually refine these ideas for how to achieve the information throughout each future phase of the work.

Note: This document catalogs the findings and ideas of the OWA; it is not an implementation plan.
107
Appendix
METHODOLOGY: THE METHODOLOGY FOR OWA WAS RIGOROUS, FACT-BASED, AND INCLUSIVE, INVOLVING EMPLOYEES AND STAKEHOLDERS
The methodology for OWA included multiple sources of insight. The Phase 1 OWA diagnostic was an independent review of NWS' ability to deliver on a Weather-Ready Nation through IDSS, across its workforce model, operating model, and Organization (Workload, Role Clarity and Organizational Health), and included the following:
Data collection. Data were collected from NWS' Office of the Chief Information Officer (CIO), NWS' Office of the Chief Financial Officer (CFO), and NOAA’s Workforce Management Office (WFMO) on historical and current vacancies and positions breakdown, retirement eligibility and tenure, and hours (regular and overtime) worked. Additional data were collected on office characteristics (e.g., area of responsibility, responsibilities for terminal aerodrome forecasts (TAF)), watches, warning, and advisories (WWA) and weather event data by office. Data were also collected on the skills needed for meteorologists through interviews and an MIC survey.
Surveys. Three diagnostic surveys were conducted:
– The Organizational Health Index (OHI) surveyed NWS staff in summer of 2015. The OHI survey was voluntary, went to all NWS staff, and achieved a 49 percent response rate. A follow-up OHI Pulse survey was conducted in February 2017 with a 44 percent response rate.
– An IDSS Partner Survey, sent in 2015 through Warning Coordination Meteorologists (WCMs) to local partners, received more than 700 responses.
– A Partner customer experience (CX) survey was sent to more than 1,500 NWS partners at the stein 2016, which achieved a 38 percent completion rate. The majority of partners surveyed were EMs, but DOT, Water, Aviation, FEMA, Media and other partners were also included and made up 32 percent of the survey respondents.
Site visits and job shadowing. Forty-two offices (see Appendix) were visited during Phase 1, representing 20 different locations across the six regions that comprise the NWS' coverage map for the United States. Site visits were selected based on objective criteria. First, a list of all NWS offices was generated including data on office type (e.g., Weather Forecast Offices (WFOs), River Forecast Centers (RFCs), Regional HQs, Center Weather Service Units (CWSUs), marine- versus land-based coverage, and population density). Second, locations were randomized to be representative across the above criteria in order to ensure at least two visits, per region, in the Continental US and at least one visit in the Pacific and Alaska

Note: This document catalogs the findings and ideas of the OWA; it is not an implementation plan.
108
regions. Then, a national perspective was taken to consider NCEP locations and other factors (e.g., types of weather events, such as fire weather, as well as IDSS needs).
Interviews and focus groups. More than 560 internal and external stakeholders were interviewed through one-on-one discussions, as well as focus groups, during Phase 1. These included ~360 internal staff and ~200 external stakeholders.
Subsequent phases (phases 2 and 3), including idea generation and refinement, were conducted through an inclusive process with significant internal and external engagement on ideas. The process of aligning on vision, developing ideas, and planning for testing and evaluation included:
Core workstream teams: Four core teams consisting of ~10-20 NWS employees each were established against each work area identified in the diagnostic phase to develop ideas, address findings and advance actionable ideas. These workstream teams, led by members of the NWS Office of Organizational Excellence (OOE) or field managers (e.g., managers of local offices), held weekly conference calls, interviewed subject matter experts, consulted senior leadership, and held in-person workshops. The workstream teams were: Workforce, Operating Model, Organization, Fully Integrated Field Structure, and Communications.
NWS Field Directors: The six Regional Directors, the NCEP Director, the Acting National Water Center Director, and the Chief Operating Officer, met frequently and produced the ideas for possible versions of a future operating model and Organization (Role Clarity and Organizational Health).
Operations & Workforce Committee (OWC): Monthly meetings of the OWA’s governance body, the OWC, were held to establish the scope of possible solutions, test and refine ideas, integrate ideas across portfolios and parts of the operation, and provide guidance on team approaches. The OWC was chartered by the NWS Executive Council and chaired by the NWS Director.
OWC Executive Champions: Senior leaders from across NWS played an active role in the identification and refinement of fully integrated field structure ideas.
National Weather Service Employees Organization (NWSEO): The OWA informed NWSEO leadership of findings and ideas throughout the process, and was invited to OWC meetings. NWSEO also participated on workstream teams.
External stakeholders: OWA informed external stakeholders (e.g., International Association of Emergency Managers, National Weather Association, Congressional staff) of findings and ideas throughout the process.
Analytical tools: The OWA developed a workforce model to determine labor cost and staffing implications of fully integrated field structure ideas using historical and current data from the CFO and NOAA's Workforce Management Office (WFMO). The model used the latest data from the Table of Organization, vacancy reports, and the CFO’s cost estimation tool to create a comprehensive picture of the current state

Note: This document catalogs the findings and ideas of the OWA; it is not an implementation plan.
109
by position, series, and grade for every field office, estimating the field cost to 98 percent of the actual cost. Design options, such as staffing composition across offices, were tested through the use of this tool.
Management surveys. Surveys were sent to NWS managers (i.e., leaders of WFOs, NCEP Centers, CWSUs, and RFCs) to gather data on the current state and their perspective on design choices relating to the workforce model and operating model. Three surveys were sent on the following topics: 1) Meteorologist development model (GS-5/12 career progression idea), 2) the WFO operating model (shift duties, scheduling), and 3) Meteorologist skills needed for current and future duties.
SITE VISIT METHODOLOGY
Exhibit 90: Sites visited in diagnostic phase

Note: This document catalogs the findings and ideas of the OWA; it is not an implementation plan.
110
WORKFORCE FINDINGS
Exhibit 91: Drivers of workforce and workload statistical analysis
Exhibit 92: Experience versus lead time
19
DRAFT/PRE-DECISIONAL –
PROPRIETARY AND CONFIDENTIAL
Relationship between experience and lead time
By meteorologist across meteorologists in Central and Southern, 2007-2016
Some relationship between lead time and experience, though
further analysis is necessary to explore explanations for high
outliers
50
10
20
6
14
12
62
4
2
0
16
8
351510 30 40 455 250
Lead timeAverage minutes
ExperienceAverage tornado warnings per year
SOURCE: NWS warning database as of May 2016
INDIVIDUAL-LEVEL ANALYSIS
D

Note: This document catalogs the findings and ideas of the OWA; it is not an implementation plan.
111
IDSS FINDINGS
Exhibit 93: IDSS interpretations

Note: This document catalogs the findings and ideas of the OWA; it is not an implementation plan.
112
CHANGE MANAGEMENT APPROACH TO DESIGN
Given the NAPA findings around the need to build NWS' change management capabilities so that it can continue to innovate and evolve in the future, as well as the OHI findings on the lack of trust between management and staff29, the OWA project determined that a change management approach needed to be adopted, which included involvement from internal and external stakeholders throughout the process, and focusing on ideas that could garner enough support to be acted upon.
A range of seven options representing status quo to the greatest amount of change were presented from which to choose options to develop more rigorously (Exhibit 94). The OWC decided to focus its investigation within the solution space described by options 2-4. The OWA project did not seek to design a “clean-sheet” field structure in the interest of feasibility and due to financial, labor management, and political considerations that would prevent NWS from pursing change in the near term.
Exhibit 94: Design options
The OWC voted to pursue investigations into Options 2-4 in Exhibit 94 after consultation with stakeholders, risk assessments, and discussions with customers on needs. Option 4 was related to the need to optimize resource allocation(s) throughout
29 National Association of Public Administration, Forecast for the Future: Assuring the Capacity of the National
Weather Service, 2013

Note: This document catalogs the findings and ideas of the OWA; it is not an implementation plan.
113
the NWS field structure. As an example of optimizing NWS resources, the National Blend of Models (NBM) represents a new approach to provide a starting point for the production of NWS digital forecast products that can be used by all forecasters within the local WFO and National Centers. By using the NBM, the local forecasters will need less time manipulating grids and will have more time interacting with governmental partners in emergency, water resources, and disaster management.
Local presence at WFOs remains a critical part of the Weather-Ready Nation vision, based on the feedback from emergency management partners at the state and local levels. A “clean sheet” assessment was deemed impractical given high fixed costs of infrastructure and technology, length of time and complexity that would be required to implement, and resources available for facilities in the near term. However, strategic repositioning of some forecast offices was left open for consideration. Such repositioning could include collocating with academic/research facilities or emergency management partners at the local, State, and Federal levels.
ORGANIZATIONAL HEALTH INDEX (OHI) OVERVIEW
Exhibit 95: OHI survey and methodology
IDSS STAFFING LEVEL METHODOLOGY
Objective and need:

Note: This document catalogs the findings and ideas of the OWA; it is not an implementation plan.
114
The Operations and Workforce Analysis (OWA) diagnostic demonstrated that the cookie cutter staffing approach doesn’t match the reality of where NWS’s resources are needed today, much less where our resources are needed in the future – as NWS’s workload continues to shift in line with our Weather-Ready Nation vision, which is about best serving its core partners.
When NWS considers future changes, the organization would like to align its workforce to the most critical needs. In other words, NWS should put resources and expertise where the need is the greatest.
To do this, McKinsey & Co. built a model that allows NWS to estimate workload across each of its critical functions today and in the future, the most critical of which is the need for IDSS for its core partners, but also the expected workload for scientific development and training, met watch, observations and maintenance, administration, and leadership.
The model uses financial data from the Office of the Chief Financial Officer, including average cost by position and location, and estimates costs within three percent of total current NWS labor costs. The model also includes assumptions for vacancy rates.
Early on, the OWA identified a general mismatch between IDSS workload and workforce, with many important partners not being fully served today. Digging deeper, the OWA found there is unmet need for IDSS in many locations. This model provides the beginnings of a systematic approach to understanding these, and other, workload drivers.
Exhibit 96: High-level objective and approach for IDSS segmentation

Note: This document catalogs the findings and ideas of the OWA; it is not an implementation plan.
115
Step 1: Initial quantitative analysis
To align workforce and workload, the OWA set out to build a strategic workforce planning model, built on as many quantitative criteria as possible, supplemented with the judgment of NWS’s field leadership.
To define the quantitative criteria most important for driving our workload, the OWA FIFS team engaged the Regional Directors (RDs) and other field leaders (MICs, HICs) in a workshop, where the team built the first draft of the criteria for estimating workload for IDSS. This included data by county warning area (CWA) on people, property, and infrastructure; weather and water impact; frequency of need; vulnerability; and needs of core and deep partners.
The rationale for each criterion is as follows:
People and property. In theory, CWAs with greater numbers of people and property (all else being equal) will have greater IDSS mission. For example, populated areas may have a greater number of organizations that require support during an event. Data considered include population, population density, seasonal variation in population, and GDP. However, because NWS strives to provide an equitable level of IDSS across the NWS, and touches every county in the United States, these aren’t the only data considered.
Weather. Offices with more significant weather, water, and short-term climate events will tend to require additional IDSS. For example, there may be additional training required for emergency managers in locations impacted by hurricanes. Data considered included types of weather that affect the region and loss of life events in the region.
Frequency. Offices that contend with extreme weather more often will tend to require higher IDSS. For example, locations with more frequent floods may require additional IDSS resources to spin-up more often. Data considered include the frequency of issued watches, warnings, advisories, spot forecasts.
Vulnerability. Offices with people and property more susceptible to weather will require higher IDSS. For example, coastal areas that require evacuations before events may require additional IDSS support in making impact decisions. A vulnerability index, paired with regional expertise, can be used.
Core and deep partners. Offices with more partners in emergency management and water resource management will tend to require more IDSS staff. For example, the NYC area may require additional IDSS due to national security risks. However, this isn’t just a proxy for population. For instance, Western Region offices with high numbers of hikers and backpackers during parts of the tourism season also require additional IDSS. Data considered can include review of institutions in the area and local office partner lists.
Step 2: Initial qualitative overlay by field leadership

Note: This document catalogs the findings and ideas of the OWA; it is not an implementation plan.
116
Using quantitative and qualitative methods, the result of the workshop was an initial "segmentation" of offices -- a grouping of each of the 122 WFOs into a Low, Medium, High, or Extreme IDSS demand bucket.
Step 3: Creating a nationally consistent picture, with quantitative and
qualitative factors
To create a nationally consistent picture, the Field Director input was combined with the quantitative assessment, refining the criteria in the process and ensuring the criteria were applied uniformly across the regions. The output from this session was the next draft of the segmentation.
This session also resulted in a final list and descriptions of the criteria for estimating IDSS demand.
Step 4: Combine quantitative and qualitative into one usable model
The OWA team then built a unified, quantitative, dynamic, and replicable model based on the final list of criteria and all the data sources. The model can be updated over time to incorporate new underlying data, but the “coefficients” on each data element are able to stay the same.
The model also formally incorporates the judgment and experience overlaid by NWS leadership. In addition to the quantitative criteria, the OWA team understood that there must also be a qualitative element to capture the nuances of different partner needs, especially as NWS does not have a complete partner database at this time.
For now, we have sound, reliable data by CWA for three of the five criteria categories:
1. People and property:
– Population
– Gross domestic product (GDP)
2. Weather and water impact:
– Damage related to weather events
– Weather related fatalities
3. Weather frequency
– Number of weather events
Note: This document catalogs the findings and ideas of the OWA; it is not an implementation plan.
117
For the last two categories, some data is available but the data quality was such that the OWA team was not confident with its reliability or connection to true workload drivers at this point. These included:
4. Vulnerability:
– The team had access to data on household income, housing type, languages spoken, and other items from the U.S. Census Bureau, but were not confident that the data adequately represented the spirit of the criteria in the same way other sources did.
5. Core and deep partners:
– The only data available during the analysis was the data the team collected from each field office through a 2016 data request during the “IDSS table top exercises.” This data has been highly informative but is not mature enough to use to assess demand – offices are still working to prioritize their partners, identify unmet needs, and refine their partner lists. The team also promised the field offices at the time the data was collected for the IDSS analysis that the OWA would not use it for a demand analysis.
As such, the team did not attempt to model these two factors quantitatively at this point.
For the first three criteria, the team constructed a model that created a standard score (sometimes referred to as a z-score) for each office on every dimension and sub-dimension of the criteria. The team then aggregated those criteria using a weighting that privileged loss of life and property (among a few other considerations). This left each office with a standard score for IDSS need, expressed in terms of their distance from the mean score.
Importantly, this methodology is not purely based on population; if NWS were to staff based on population alone as the indicator of demand, Western offices could have fewer staff than in the model with the methodology used, which is not the case.

Note: This document catalogs the findings and ideas of the OWA; it is not an implementation plan.
118
Exhibit 97: Example output of the IDSS-demand segmentation model
The team then 'bucketed' offices into the same four need categories the Field Directors had used previously (Extreme, High, Medium, and Low). Offices that were half a standard deviation or more below the mean were labelled 'Low,' those between one half below and above the mean were 'Medium,' between one half and one standard deviation above the mean were 'High,' and those greater than one standard deviation above the mean were 'Extreme.'
The team then overlaid the Field Directors assessment of vulnerability and core and deep partners to create a final model-driven segmentation, which can be updated over time. Over 95% of the time, the quantitative model and the Field Directors’ assessments were within one segment. This output was used to create the estimated IDSS demand maps in Exhibit 84 and Exhibit 85. Additional testing and evaluation is needed to confirm segment assignments.
The exhibits below show some sample output from this model. It is important to note that these concepts HAVE NOT been selected for testing, demonstration, or implementation by NWS management. Further, no actual feasibility testing or bottom-up detailed workflow/workload analyses to confirm these estimates were conducted during the OWA. As a result, additional analysis, testing, and evaluation would be needed before testing and evaluating these concepts. A brief overview of the current path forward can be found in the section, “Moving forward after OWA”

Note: This document catalogs the findings and ideas of the OWA; it is not an implementation plan.
119
Exhibit 98: Hypothetical staffing levels by different demand layers
Exhibit 99: Comparison of different hypothetical staffing methodologies
This model could also be used to estimate staff for the met watch function to operate a dedicated met watch shift. There are multiple scenarios for how to allocate staff for met watch (see Ideas on Organization (Role Clarity and Organizational Health), Exhibit 70). Exhibit 100 shows one potential allocation of met watch staff, if larger WFOs provide met watch for other WFOs in their area.
IDSS by office, based on 5 dimensions
# of IDSS staff per office
3-5
12-16+
9-11
6-8
Most significant differences
IDSS by office, based on pop and GDP1
# of IDSS staff per office
1 Segmentation of offices into quartiles based on population and GDP, then combined into overall segments with equal weighting of population and GDP quartiles
3-5
12-16+
9-11
6-8

Note: This document catalogs the findings and ideas of the OWA; it is not an implementation plan.
120
Exhibit 100: Hypothetical staffing outcome with IDSS and met watch staff
On top of the IDSS and met watch staffing allocations, support staff (for science and training, systems support, and leadership and admin) could then be allocated per the strategic staffing blueprint. Exhibit 101 provides an illustrative view of what staffing could look like given IDSS workload estimates from the model, one of the met watch scenarios, and support staff aligned strategically given office size and economies of scale for groups of offices. It is important to note that the total NWS staffing level in these scenarios is consistent with the current appropriated staffing level of the NWS.
Exhibit 101: Hypothetical demand-balanced staffing outcome
1 There are offices of all sizes within these ranges, and offices could include embedded / “satellite” staff; 2 Includes staff time spent on collaboration on the forecast, creation of specific forecast products (e.g., spot forecasts); 3 Includes staff for systems
development & support, science & training, and leadership & administration
All core and deep partners
receive increased support
through:
▪ IDSS from local experts when
and where needed
▪ Focused, experienced
warning experts in their area
▪ High quality forecasts
informed by expertise at all
offices, including NCEP
and NWC, based on a common
operating picture
Example alignment of workforce to today’s workload
Office size range by WFO1
<10 30+20-2910-19IDSS2 Met watch Support3

Note: This document catalogs the findings and ideas of the OWA; it is not an implementation plan.
121
The OWA team also used the workforce planning model described above to test the implications of labor costs and hiring/attrition of any change to the field structure. There are several scenarios in which NWS could staff the fully integrated field structure within current staffing levels, although flexibility to do so is contingent on the unlock concepts described. The workforce planning model was also used to assess how long it could take NWS to transition to a fully integrated field structure given attrition rates and voluntary reassignment assumptions. Depending on the scenario input, the model suggested that NWS could transition to a fully integrated field structure within five to 10 years, with similar staffing levels to current staffing levels, and given some resources to further analyze, test, demonstrate, and evaluate these concepts.
In applying the blueprint, offices could take on many shapes and sizes based on the particular demands in the area and how they play a role in supporting other field offices. The blueprint could be applied regularly to reassess if staffing levels match workload. As new capabilities become available, as partner needs shift, and as NWS partnerships with other NOAA line offices to deliver products/services possibly develop, staffing needs could change. With the flexibility provided by the workforce, operating model, and organization ideas described in this catalog, NWS could continually adapt its fully integrated field structure.
Water services IDSS methodology
A similar process was also developed for Hydrology IDSS demand, the process for which and initial thinking are explained in the exhibits below.
Exhibit 102: Methodology for estimating water services IDSS demand
Develop
dimensions
and measures
Apply
dimensions
to each WFO
Aggregate
dimensions and
refine output
for overall IDSS
segment
Apply
operating
models
Identify
potential need
for strategic
staffing
1 2 3 4 5

Note: This document catalogs the findings and ideas of the OWA; it is not an implementation plan.
122
Exhibit 103: Dimensions for water services demand
Exhibit 104: Distribution of offices by IDSS demand
30242740
38 34 4010
48 471610
Primary criteria with quantitative measures for each
dimension Number of WFOs in each segment1
1 Segmentations used quartile ranges for raw data, then aggregated with cutoffs. Extreme had average >3.5, high average >2.5, medium average >1.5, low average >1
2 Weighted with GDP and population as 75% and river miles as 25%
492726 20
Extreme (4)High (3)Medium (2)Low (1)
Applied qualitatively by directors
Further requirements
▪ Potential demands of verifying forecast points and maintaining water
observation network
▪ High-demand partners (e.g., significant ports/dams)
Vulnerability
▪ Extent to which people and property may be disproportionately
impacted by water-related phenomena requiring IDSS
People and property2
▪ GDP and population in the area
▪ Transportation (navigable river miles)
Water supply management and drought
▪ Combination of drought types (particularly, severe)
Flooding
▪ Combination of flood warning quantity, flood warning length, and
flooding impact
Develop dimensions and measures2 Apply dimensions to each WFO3
Flooding
Vulnerability
Water supply
and management
People and
property
Further
requirements
19
33
56
14
High ExtremeMediumLow
Each region
refined output
from quantitative
model based on
local insight
1 In addition to 122 CONUS and OCONUS WFOs, strategic staffing also considered Guam in Pacific region
Aggregate dimensions for overall IDSS segmentation
Five dimensions Estimate of number of offices by IDSS segment
4

Note: This document catalogs the findings and ideas of the OWA; it is not an implementation plan.
123
Exhibit 105: Potential staffing model for water services at WFOs
TABLE OF KEY ACRONYMS
Acronym Description
CFO Chief Financial Officer
CIO Chief Information Officer
CWSU Center Weather Service Unit
CX Customer Experience
EC Executive Committee
EM Emergency Manager
EOC Emergency Operations Center
FIFS Fully Integrated Field Structure
FTE Full-Time Equivalent
HIC Hydrologist-in-Charge
IDSS Impact-based Decision Support Services
▪ To be refined after
IDSS tabletop and
further water
services meetings
Apply operating models
Description Potential roles
5
Extreme ▪ Dedicated water team, overseen by senior
hydrologist and including support from one other
hydrologist in addition to further IDSS resources
High ▪ Trained hydrologist provides support and oversees
cross-trained met (or other individual) who assists
full-time in water
Medium ▪ Individual service hydrologist dedicated to water
IDSS
▪ May be cross-trained met, depending on water
needs in area
Low
Service
hydrologist
Hydro-trained
IDSS
Water lead
(Senior SH)
Hydro-trained
IDSS
Water lead
(Senior SH)
Hydro-
trained IDSS
Service
hydrologist
Neighboring
SH
Hydro focal
point
▪ Individual with hydro training in office to provide
touch point for hydro IDSS, supported by
neighboring office

Note: This document catalogs the findings and ideas of the OWA; it is not an implementation plan.
124
KDP Key Decisions Point
MAR Modernization and Associated Restructuring
MDC Mission Delivery Council
MIC Meteorologist-in-Charge
NCEP National Centers for Environmental Prediction
NOAA National Oceanic & Atmospheric Administration
NWS National Weather Service
OHI Organizational Health Index
OOE NWS Office of Organizational Excellence
OPG Operations Proving Ground
OWA Operations and Workforce Analysis
OWC Operations and Workforce Committee
PMO Evolve Program Management Office
RFC River Forecast Center
RHQ Regional Headquarters
SOO Science and Operations Officer
WCM Warning Coordination Meteorologist
WFMO NOAA Workforce Management Office
WFO Weather Forecast Office
WPC Weather Prediction Center