OPERATIONAL RISK MEASUREMENT FOR THE INDIAN · PDF fileThe Basel II Accord is based on three...
52
OPERATIONAL RISK MEASUREMENT FOR THE INDIAN BANKING SECTOR: ALTERNATIVE MEASURES by Romar Correa & Swati Raju University of Mumbai (Department of Economics) 2008–09
Transcript of OPERATIONAL RISK MEASUREMENT FOR THE INDIAN · PDF fileThe Basel II Accord is based on three...

OPERATIONAL RISK MEASUREMENTFOR THE INDIAN BANKING SECTOR:
ALTERNATIVE MEASURES
by
Romar Correa & Swati RajuUniversity of Mumbai (Department of Economics)
2008–09


1
INTRODUCTION
Banks, as major financial intermediaries, possess an inherentadvantage in assessing the riskiness of potential borrowers.At the same time, the substantial credit, market andoperational risks they face in their operations can have asignificant impact on their earnings. Thus, risk managementwhich is synonymous with bank management is the coreactivity for any bank. The ability of a bank to be successful/survive under adverse economic conditions is related to thequality of its risk, its management processes, and to its capitaladequacy. Capital adequacy not only helps prevent individualbank failures but also helps create a sound and safe bankingsystem. While regulation exists in several industries, activeprudential regulation through the imposition of minimumregulatory capital requirements (MRCR) is special to thefinancial sector.
The discussion on the optimal level of capital requirementsor the minimum regulatory capital requirements has beencontinuing since the 1970s. Till then, the optimal level ofcapital that a bank should maintain was considered to be aninternal decision of the bank as there was no explicitrelationship expressed between the level of capital adequacyand the level of risk faced by a bank. Further, the safety andsoundness of the banking system was promoted through acontrol on the level of competition through restrictions onentry and expansion of bank branches. A shift, however, inbanking to a deregulated, competitive and internationallyactive and inter-dependent system saw regulators expressinga felt need for active prudential regulation in terms ofdevelopment of uniform capital adequacy ratios forinternationally active banks. Common minimum regulatorycapital, apart from providing a safe and sound banking system,was also expected to ensure a level playing field among banksfrom different countries. The Basel I Accord of July 1988was the first formal documentation of active prudentialregulation and established an explicit link between the level
of bank risk and its capital adequacy. The Accord prescribeda minimum level of regulatory capital for internationally activebanks which required banks to hold a minimum regulatorycapital of 8% or greater of the sum of risk-weighted bankassets (the Cooke Ratio). Further, it defined the concept ofregulatory capital and its division into Tier I (core) and TierII (supplementary) capital and also specified the risk weightsfor the different assets. The 1996 Amendment of the Basel IAccord addressed the issue of market risk and the regulatorycapital requirement for market risk was incorporated in thecapital adequacy framework through the introduction of aTier III in supplementary capital.
It is pertinent to note here that the definition of regulatorycapital is open to refinements as can be observed from thechanges introduced in the minimum required capitalrequirement under Basel II which introduced an additionalcapital requirement for operational risk and mademodifications to credit risk.
The Basel II Accord is based on three mutually reinforcingpillars – Pillar 1 Minimum Capital Requirements; Pillar 2Supervisory Review, and Pillar 3 Market Discipline. The ideais that the enforcement of minimum capital requirementsalong with an effective and strong supervisory process anddisclosure of risk and market discipline can ensure a soundfinancial system.
Pillar I Minimum Capital Requirements
The Basel II Accord introduced substantial changes underPillar I to the regulatory capital requirements as regards creditrisk and introduced an additional capital charge for operationalrisk. The total regulatory capital requirement is an additionof minimum capital requirement under credit risk, marketrisk, and operational risk. Banks under Basel II can choosefrom among any three of the following approaches for credit

374 Operational Risk Measurement for the Indian Banking Sector: Alternative Measures
risk – the Standardized Approach and between twosophisticated Internal Ratings-Based Approaches –Foundation and Advanced.
The Standardized Approach is the simplest and defines fixedrisk weights for all credit exposures. The substantial differencefrom Basel I is that exposures to the same class of risk can beassigned different risk weights depending on the asset’sexternal credit rating. Banks could alternatively adopt eitherof the more sophisticated Internal Ratings-Based Approacheswhere the risk weights assigned are a function of theprobability of default of the borrower, loss given default,exposure at default and effective maturity. In the FoundationInternal Rating-Based Approach, the bank combines theinternal estimates for probability of default with fixedparameters set by the regulator for the other three parameters,while in the Advanced Internal Ratings Based Approach allthe four parameters of concern may be provided by the bank.Vital to the Internal Ratings Based Approach is a validationof the internal process by the supervisor/regulator.
The other substantial change introduced under Basel II wasthe introduction of a capital charge for operational risk. Bankscan choose from any of three approaches – Basic IndicatorsApproach, the Standardized Approach and the AdvancedManagement Approach – whilst determining the capitalcharge for operational risk. Each of the three approaches isincreasingly complex and sophisticated. (A detaileddiscussion on operational risk is in the next section)
The overall approach under Basel II, thus, has been to givebanks the choice to adopt approaches with different levels ofsophistication with the more advanced approaches resultingin a lower level of minimum regulatory capital requirementas compared to the simpler approaches. Since regulators werenot willing to accept a reduction in average capitalrequirements, a trade-off between the approach adopted by abank and the level of capital requirement was acceptable toregulators as banks that adopted the more sophisticatedapproaches would have the advantage of better riskmeasurement and management systems. Thus, under BaselII banks could have differing capital requirements dependenton the approach selected.
Pillar 2 Supervisory Review Process
The focus under this segment is on the role of processes inbank risk management. It draws attention to the role of thenational regulator in bringing about improvements in banks’risk management techniques and procedures, provisioningpolicy, and their capital management processes. The BaselCommittee on Banking Supervision has specified thefollowing four key principles for supervisory review:
(i) Banks should have a process for assessing andmaintaining overall capital adequacy with respect totheir risk profile.
(ii) Supervisors should review banks’ internal capitaladequacy assessments and strategies, taking properactions if they are unsatisfied with those processes.
(iii) Supervisors should expect banks to operate above Pillar1 minimum regulatory capital requirements and shouldhave the ability to require banks to hold additionalcapital; and
(iv) Supervisors should look for early intervention to preventa bank from falling below the minimum regulatorycapital requirement and take remedial action if the bankis under-capitalized.
Pillar 3 Market Discipline
This facet of the Accord focuses on strengthening marketdiscipline. It concerns the pressure put on bank managementsby financial markets to provide a sound banking system. Thefocus under this segment is on qualitative and quantitativedisclosure requirements with an aim to increase thetransparency of a bank’s risk profile.
Section II of the paper contains the conceptual framework ofthe pricing and measurement of operational risk, whereinSection II.A focuses on the approaches proposed by the BaselII Accord, while Section II.B discusses the alternativeapproaches to operational risk capital measurement. SectionIII discusses the Basel II Accord and its relevance to Indiawhile the computational results of operational risk capitalcharge under different approaches and its impact on Tier Icapital of banks and the sensitivity analysis of gross incomeof a bank to the gross income from its business lines iscontained in Section IV. Section IV.A presents the results forthe Basel II Approaches while Sections IV.B and IV.C containthe results of the Alternative Approaches and sensitivityanalysis respectively. Section V concludes the paper.
II Operational Risk: Concept and Measurement
Management of credit and market risks has traditionally beenat the centre of bank risk management. Operational risk mustbe distinguished from credit risk and market risk. For onething, there is no equivalent to the concept of risk exposure.That is to say, Operational Risk does not correspond in asimple fashion to any financial indicator. Secondly, thedistribution of Operational Risk is more fat-tailed than thatof credit risk. In addition, Operational Risk is endogenousrelative to credit and market risk. In other words, the scopefor reduction of risk are greater in the case of OperationalRisk. Operational Risk is founded on the premise that a bank,

Chapter 1: Introduction 375
independent of outside factors, will fail to meet one or moreoperational targets in a given year. Operational Risk and itsmanagement has garnered substantial attention since the mid-1990s as a consequence of banking crises resulting fromhuman error, fraud and/or missing controls (e.g. BaringsBank, Daiwa Bank and Allied Irish) and due to the intent ofthe Basel Committee on Banking Supervision since 1999 tointroduce a new regulatory capital charge for Operational Riskin addition to the minimum regulatory capital requirementfor credit and market risk. Further, technology and increasedproduct complexity has led to a greater focus on themanagement of Operational Risk rather than its meremeasurement.
It is appropriate to begin with a compendium of definitionsand approaches along with their limitations (Bonsón, Escobarand Flores, 2007). The Commonwealth Bank of Australia(1999) defines Operational Risk as all risks which wouldgenerate volatility in a bank’s reserves, expenses and the valueof its business. Others would confine the measure tounpredictability in its cost structures and exclude its revenuestructure. The proposed checklist for the European Union isas follows (Oesterreichische Nationalbank, 2006): Interestincome and non-interest income include interest receivableand similar income, income payable and similar changes,income from shares and other variable/fixed-yield securities,commissions and fees receivable, commissions and feespayable, net profit and net loss on financial operators andother operating income. The following data is not to be usedin computing the indicator: Realized profits/losses from thesale of non-trading items, income from extraordinary orirregular items and income derived from insurance. Care istaken to ensure that the indicator is calculated before thededuction of provisions for operating expenses. The latterinclude fees paid for outsourcing services provided by thirdparties which are not a parent or a subsidiary of the bank or asubsidiary of a parent which is also the parent of the bank. Ifrevaluation of trading book items is part of the profit-and-loss statement, revaluation must be included in the calculationof the indicator. A limitation of these concepts is that indicatorsof interest and non interest income only reflect the volume ofbusiness in each line but not the level of Operational Risk.The risk adequacy of the capital requirement calculated onthe basis of these indicators is inadequate as bank-specificloss data is not used. Consequently, it is not possible to effecta control of Operational Risk tailored to their causes andtargeted risk management. In addition, the potentialdiversification effects between business lines is not factoredby aggregating the amounts of capital. According to the BaselCommittee on Banking Supervision (BCBS), the financial
impact of a loss event includes all out-of-pocket costs andexcludes opportunity costs and foregone revenues.
The Basel Committee on Banking Supervision has definedoperational risk as “the risk of loss resulting from inadequateor failed internal processes, people and systems or fromexternal events. This definition includes legal risk, butexcludes strategic and reputational risk” (Basel Committee,2004). Operational risk, thus, is the risk arising fromoperational loss and operational losses in turn emerge fromoperational errors. In other words, operational risk isconcerned with the risk to a bank’s performance due to themanagement of the bank as opposed to the financing of thebank. Consequently, when operational risk is not addressedsystematically it can result in inconsistent performance andearnings surprises for the stakeholders. Thus, operational riskexposures can have an impact on banks’ revenues and networth.
Operational risk, thus, generates operational losses and thelosses generated are a cost to the bank. Hence, the pricingand the consequent measurement of the operational riskcapital charge has to be adequate to cover for these losses.Therefore, to price operational risk appropriately, a bankwould need a measure of expected loss which is based on itshistory of operational losses. This would require thedevelopment of an internal as well as external database onthe sources and types of operational loss exposure in whichevery single operational loss event is recorded from whichthe mean and standard deviation of losses for the relevanttime period can be computed. However, the creation of sucha comprehensive database is fraught with several problems,namely, identifying the range of business activities acrosswhich operational loss events might be classified andallocation of a loss event to a particular area of activity.Besides, the database can only provide ex-post guidelines onthe potential sources of operational risk events but not ex-ante signals. Further, at times, bank managements could writeoff small operational losses against revenue which raisesissues regarding the credibility of the operational lossdatabase. The problem of credible databases can be redressedthrough the creation of an independent external databasewhich can be shared among banks. Another matter concernsthe appropriate time frame over which data needs to becollected for a study of operational loss exposures. Apart fromthe issues related to data collection, there are statistical issuessuch as the nature of the underlying distribution of lossexposures. The distribution of loss exposures most likelywould be non-normal and skewed as there would be a largenumber of small losses and infrequent and decreasingnumbers of large operational loss events.

376 Operational Risk Measurement for the Indian Banking Sector: Alternative Measures
Correlations between different types of operational loss eventscould pose another statistical problem and one needs toinvestigate whether these correlations are stable. Among theproblems here are the assumptions to be made about thecorrelation of operational loss events. The Basel II Accordassumes that all operational risk losses occur simultaneously.The simple summation of high percentile value at risks impliesthe simultaneous occurrence of a set of worst-case scenarios.The issue here is that it is hard to compute the degree ofcorrelation between various risk types and/or banks becauseof the absence of historical data. Both top down and bottomup approaches, elaborated upon below, rely on historical data.The latter are based on loss events in individual processeswhereas the former operate at the level of the bank movingdown business lines. Top-down models are likely to superiorat estimating capital requirements. According to the factorapproach, an attempt is made to identify importantdeterminants of Operational Risk (OR) either at the level ofthe banks or at the level of individual business lines. A formulalike
1
m
i ii
OR t F=
= α β + ε
is used. The Fis are the risk factors. The approach covers riskindicators, CAPM-like models, and predictive models. In therisk indicators methodology, regression analysis is used toidentify risk factors like the volume of operations, creditratings, and employee turnover. CAPM-based models are usedto connect the volatility of returns to OR variables. Withpredictive models, discriminant analysis is used to single outthe elements that lead to OR losses.
Correlation, if any, between operational, market, and creditrisk must be taken into consideration as it will have an impacton a bank’s capital requirements. For instance, it can lowerbank capital requirements. A failure to take into considerationsuch correlations might result in a bank being over-capitalised.The Accord specifies three distinct approaches to computecapital requirements for Operational Risk based on increasingrisk sensitivity and allows banks to adopt different approachesto different operations. Banks, however, will not be allowedto revert to a simpler approach from a sophisticated approach(except under particular circumstances). The idea is to ensurethat banks do not cherry pick among approaches to reducetheir capital charges. Further, each approach has certainqualifying qualitative and quantitative standards (King, 2001;Saita, 2007; Tripe, 2000).
II.A Operational Risk Capital Charge: Basel IIApproaches
The three approaches for computing operational risk capitalcharge are (i) the Basic Indicator Approach (BIA), (ii) theStandardized Approach (SA) and (iii) the AdvancedMeasurement Approach (AMA), each of which is detailedbelow. The identification and measurement of operational riskcan be viewed as following either the top down or the bottomup mechanism depending on the method used to calculatethe risk charge. In the top down approach, financial data isextracted from the balance sheet and Profit & Loss statement.This method may not result in the proper capturing of risksnor does it help in risk mitigation. This approach correspondswith the Basic Indicator and the Standardized Approaches ofthe Basel II Accord. The third approach of the Accord, theAdvanced Measurement Approach, is consistent with thebottom up approach in which the regulatory capitalrequirement will be defined by the estimate generated by theinternal operational risk measurement system. No eligibilitypriors are needed for using the Basic Indicators Approachbecause that approach is the “default position” designed forsmall local banks. According to the standardized approach,the business activities of a financial institution are dividedinto standardized business lines and assigned relevantindicators, net interest income and net non-interest income.In business line mapping, banks must enunciate principlesand provide documentary evidence for mapping net incomefrom their own current activities into the standardizedframework. The principles include :
1. The mutually exclusive and exhaustive nature of themapping from activities into business lines and 2. Costsgenerated in one business line and imputed to a differentbusiness line, may be reallocated to the business line to whichthey pertain. For instance, a formulation based on internaltransfer costs between the two activities may be used.
Internationally active banks or those exposed to significantOperational Risk are expected to use more elaborateapproaches than the Basic Indicators Approach. LarsSvensson notes the “Basel Paradox” here, that internationallyactive banks might not meet the eligibility criteria to usesophisticated approaches (Mussa, 2007)
(i) The Basic Indicator Approach (BIA)
The BIA is the simplest of the three approaches to calculatingoperational risk capital charges. This approach uses a singleindicator, gross income, as a proxy for a bank’s overalloperational risk exposure. Minimum capital requirementsunder BIA is a percentage α (equal to fifteen percent) of theaverage of positive gross income (GI) over the preceding three

Chapter 1: Introduction 377
years. Years with negative gross income are excluded. Grossincome is computed as net interest income plus net non-interest income, gross of any provisions and operationexpenses,
1,... *BIA nK GI n= Σ α
where
KBIA– capital charge under the Basic Indicators Approach
GI – annual gross income of a bank in a given year
n – the number of previous three years in which grossincome (GI) is positive.
The advantage of this approach lies in its simplicity and easeof implementation. The BIA can be applied universally andallows for easy comparison across banks. However, whilethis approach is suitable for small banks, internationally activebanks with substantial operational risk exposure would needto adopt a more sophisticated risk management andmeasurement approach within the overall framework.
(ii) The Standardized Approach (SA)
This approach is a refinement over the Basic IndicatorsApproach and can reflect better the differing risk profilesacross banks as reflected by their broad business activities.Under the Standardized Approach, a bank’s operational riskcapital charge is sensitive to the risk arising from the variousbusiness lines.
Under this approach, a bank’s activities are divided into anumber of standardized business units and business lines.The SA can, hence, better reflect the differing risk profilesacross banks as reflected by their broad business activities.However, similar to the BIA, the capital charge for thedifferent business lines is standardized by the supervisor. Thebusiness lines proposed under the SA reflect an industryinitiative to collect internal loss data in a consistent manner.A broad financial indicator has been specified for eachbusiness line and the indicator would reflect the size/volumeof a bank’s activity. The indicator can serve as a rough proxyfor the amount of operational risk within each of thesebusiness lines. The operational risk capital charge within eachof these business lines is calculated by multiplying a bank’sbroad financial indicator by a ‘beta’ factor. The beta providesa rough proxy for the relationship between the OperationalRisk loss experience for the industry for a given businessline and the financial indicator representing a given bank’sactivity in that particular business line. Table 1 below presentsthe eight businesses into which a banks’ activities can bedecomposed. Within each business line, gross income is the
broad indicator which serves as a proxy for the scale ofbusiness operations and the operational risk exposure withineach of these business lines. A detailed mapping of theactivities under each business line is provided in Annexure I.
Table 1. Standardized Approach – Business Unitsand Business Lines
Business Units Business Lines Beta Factors
Investment Banking Corporate Finance 18%
Trading & Sales 18%
Banking Commercial Banking 15%
Retail Banking 12%
Payment and Settlement 18%
Others Retail Brokerage 12%
Asset Management 12%
Agency Services 15%
For instance, the operational risk capital charge for thebusiness line of corporate finance under investment bankingwould be calculated as follows:
Kcorporate finance = βcorporate finance * Gross income
where
Kcorporate finance – capital requirement under corporate financebusiness line
βcorporate finance – Beta factor for the corporate financebusiness line.
It is relevant to observe that each business line has its assignedbeta factor and a respective financial indicator. Gross incomehere refers to the gross income of a bank for that particularbusiness line and does not refer to the gross income of thewhole bank. Ideally, the beta factor for each business lineshould be calibrated as per its loss experience and the goal ofthe Basel Committee is to re-calibrate the SA when crediblerisk–sensitive data (loss experience information) is available.Such a mapping will enable each bank to map its structureinto the regulatory framework. Since most banks are in theprocess of developing an internal loss database or may notchoose to incur the investment required to develop an internalloss database for all business lines (especially for thosebusiness lines that present a less material operational risk),in the interim the SA could provide the required frameworkother than the BIA to calculate their regulatory capital charge.Alternatively, the SA can provide a basis on which a bankcan move to more sophisticated approaches like the AdvancedManagement Approach that would help develop better riskmanagement techniques within banks.
The Basel Committee on Banking Supervision has setqualifying criteria that a bank must satisfy before it can adopt

378 Operational Risk Measurement for the Indian Banking Sector: Alternative Measures
the Standardized Approach (items 660-663 of BCBS Report,June 2006). The total capital charge is computed as a threeyear average of the simple summation of the regulatory capitalcharges across each of the business lines in each year. Forany given year, the negative capital charges (resulting fromnegative gross income) for a business line may offset positivecapital charges in other business lines without limit. However,if the aggregate capital charge across all business lines isnegative for a year, then the input for the numerator for thatyear would be zero. The total capital charge may be expressedas:
3 8
1 1
max ,0 maxj ji j
K Y= =
= α β
Banks may be allowed by national supervisors to adopt theAlternative Standardized Approach (ASA) in which retailbanking and commercial banking operational risk exposurescan be calculated by applying betas to a percentage ‘m’ ofoutstanding loans rather than gross income. Capital chargesfor retail and commercial banking are calculated differently.Instead of using gross income as the indicator of exposure,the value of loans and advances is used. Gross income issubstituted by a number that amounts to 0.035 times the valueof loans and advances. Thus,
K = 0.035βL
computed separately for retail and commercial banking. K isthe capital charge against retail banking, the beta assigned toit is 0.12 and L is the total outstanding loans and advances(retail banking, non risk-weighted and gross of provisions)averaged over the previous year. A bank would be allowed atthe discretion of the supervisor to adopt the ASA only whenit is able to convince the supervisor that the ASA wouldprovide a better basis for the calculation of regulatory capital.A bank would not be allowed to revert to the StandardisedApproach from the ASA without obtaining the prior sanctionof the supervisor (BCBS Report 2001, 2006; Saita, 2007).
An illustrative specification from the European UnionDirective referred to is as follows:
Corporate finance β1
Trading and sales β2 18%
Payments and settlement β6
Commercial Banking β4
Agency services β7 15%
Retail brokerage β3
Retail banking β5 12%
Asset management β8
The treatment of negative values here is not different: In eachyear, a negative capital requirement in one business lineresulting from negative gross yield may be imputed to thewhole. When, however, in a given year, the aggregate capitalcharge accruing to all business lines is negative, the elementin the numerator for the year is zero.
A criticism that has been made in this context is that riskmanagement in terms of risk control is not sufficient becausethe capital requirement is not determined by the actualOperational Risk but by the level of net interest income andnet non interest income. The assumption is that, in general,higher income can only result from accepting higherOperational Risk. However, improved performance can alsoresult from superior risk management techniques.
(iii) Advanced Management Approach (AMA)
This approach identifies potential risk areas for each line ofbusiness based on historical data and the frequency of theiroccurrence and size of loss. The AMA provides discretion toindividual banks on the use of internal loss data while themethod to calculate the required capital charge is uniform toall banks and established by the supervisor. Further, bankswhile adopting this approach will need to satisfy severalquantitative and qualitative criteria (item 664-674, BCBS,June 2006) which would ensure the integrity of themeasurement approach, data quality, and internalmeasurement processes. As the AMA is the most sophisticatedin the spectrum of approaches available to measureoperational risk capital, the Basel Committee believes thatthe adoption of this approach will incentivize banks to developa credible internal loss database. The Committee recognizesthat the industry is currently at a nascent stage in developingthe database necessary for the implementation of the AMAand, consequently, some re-calibration would be required ata later date. Thus, under the AMA, the regulatory capitalrequirement will equal the risk measure generated by thebank’s internal Operational Risk measurement system andits adoption is subject to regulator approval
Under the AMA the operational risk capital charge is to bedetermined through the following procedures:
(i) A bank’s activities are categorized into a number ofbusiness lines and a broad set of operational loss typesis defined and applied across business lines.
(ii) Within each business line/loss type combination, thesupervisor specifies an exposure indicator (EI) whichis a proxy for the size of each business line’s operationalrisk exposure.
(iii) In addition to the EI, banks measure based on theirinternal loss data a parameter that would represent the

Chapter 1: Introduction 379
probability of loss event (PE) and a parameter that wouldrepresent the loss given that event (LGE), is calculated.The product of the EI*PE*LGE is used to calculate theexpected loss (EL) for each business line.
(iv) The supervisor would supply a factor – the gamma term– for each business line which would translate theexpected loss into a capital charge. The overall capitalcharge for a particular bank is the simple sum of all theresulting products for the different business lines.
(v) Finally, to facilitate supervisory validation, banks wouldprovide the supervisor with the individual componentsof the expected loss calculation, namely the EI, PE andLGE, based on which the supervisor would calculatethe expected loss (EL) and then adjust for theunexpected loss through the gamma term so as toachieve the desired level of safety and soundness.
The business lines under the AMA would be similar to thoseunder the SA and the operational risk measure under the AMAmust guarantee standards which are comparable with creditrisk under the Internal Ratings Based Approach. Further, theregulatory capital requirement should be the sum of expectedand unexpected losses unless the bank can show that theexpected losses have been already captured and accountedfor by its internal business processes. The risk from thedifferent business lines are additive with no diversificationbenefit. However, the bank may be allowed to use internally-determined correlations after regulatory approval by thesupervisor that the system of determining the correlations issatisfactory. Thus, crucial to the success of the AdvancedMeasurement Approach is accurate risk mapping which wouldhelp identify key risk indicators which, in turn, can provideanticipatory signals and enable better monitoring and controlaction through building of internal and external loss databases.
The Basel II Accord, further, includes guidelines forconstructing internal loss databases or for avoiding doublecounting when operational losses are already included underregulatory capital for credit risk (e.g. collateral managementfailures). A bank would further monitor for changes in riskcontrol and accordingly adjust operational risk estimates.Further, under the AMA a bank is permitted to consider risk-mitigation benefits which cannot be greater than 20% of thetotal AMA operational risk capital requirement. Thepossibility of loss data being hidden by operationalmanagement can be supplemented by having an appropriateorganizational structure such as independent operational riskmanagement, and internal loss databases can be comparedwith available external databases and scenario analysis tomeasure high severity losses. Scenario Analysis contributes“by suggesting what might happen, even if it (the loss event)never happened before” (Saita, 2007, p.125).
The strategy under AMA can, thus, be summarized as: (i)Map potential risks (ii) Measure risk (iii) Implement riskmitigation measures and (iv) Predict and forecast risks.Alternatively, operational risk estimates should be derivedby a proper combination of (i) internal data (ii) relevantexternal data (iii) scenario analysis and (iv) businessenvironment and internal control systems. (BCBS, 2004,2006; Bhatia, 2002; Saita, 2007).
As banks move from the BIA to the AMA, their capital chargesare lowered. The regulatory capital requirement will becalculated on the basis of the bank’s own Operational Riskmodel. One of the objectives of the Basel II Accord is toalign regulatory capital with the economic capital determinedby the internal models of banks. Economic capital is theamount of capital that a bank must hold to protect itself, atchosen confidence intervals, from insolvency due tounexpected losses over a period of time. Under AMA, banksmust quantify Operational Risk capital requirements for seventypes of risk and eight business lines, giving a matrix withfifty-six elements. Ignoring correlation, these estimates arereduced to a summary statistic of the Operational Risk of thebank.
II.B Operational Risk Capital Charge: AlternativeApproaches
Operational risk emanates not just from the activity of banklending (which forms the core of credit risk) but from severalother activities undertaken by a bank. Consequently,operational risk costs must be built into fees and commissionsfor activities such as deposit processing, cheque issuance andall other activities that can generate operational errors/losses.The alternative approaches to the pricing of operational riskin banks focus on the volatility of non-interest expenseaccount by looking at two ratios: (i) Cost to Asset Ratio and(ii) Cost to Income Ratio. Further, the use of ratios insulatesthe operational risk capital charge from the growth observedin bank balance sheets. The operational risk capital chargeunder these approaches is linked to the volatility in the costto asset ratio and the cost to income ratio. Tripe (2000) hassuggested that the operational risk capital charge for a bankcan be computed using a multiple of the standard deviation(say three standard deviations) of the cost to asset ratio relativeto average total assets and to total income for the cost toincome ratio. He writes ‘…this multiple having been selectedfor convenience rather than to reflect any particular theoreticalrationale, it is not considered inconsistent with likely practicalapproaches’ (p.11). The rationale for employing multiplestandard deviations can be attributed to the non-normal,skewed, and fat tailed distribution of the loss exposures.

380 Operational Risk Measurement for the Indian Banking Sector: Alternative Measures
Hence, multiple standard deviations would cover a smallerproportion of the possible outcomes than that under a normaldistribution. A fall-out of this would be that banks wouldpossibly be under capitalized as compared to the actual riskexposure.
(i) Cost to Asset Ratio
The cost to asset ratio can be defined as the ratio of operating(non-interest) costs to average total assets. The operationalrisk capital charge is linked to volatility in the cost to incomeratio. The ratio of cost to average assets of a bank reflects abank’s business mix. For instance, a bank with a focus oncorporate lending or placements in the inter-bank market wouldhave a lower cost to asset ratio as compared to a bank with agreater focus on retail lending. However, a problem with thisratio is the complications for cross-border comparisons (whichis very relevant for internationally active banks). Banks indifferent countries can have different forms of constructingtheir balance sheets and this can have an impact on the costto asset ratio more than the cost to income ratio. Further, it isimportant to note that if banks are undertaking substantialefforts to reduce costs, then the variations in the cost to assetratio will be around a decreasing mean rather than around astationary mean making comparisons difficult. Also, the costto asset ratio does not capture the non-interest income whichis a significant pointer to the operational risks in a bank. Further,banks at times may adjust operating losses (small losses)against revenues. Hence pricing operational risk by studyingthe volatility in the cost to income ratio would be an alternativeto the cost to asset ratio.
(ii) Cost to Income Ratio
The cost to income ratio is also known as the EfficiencyRatio or Expense to Income Ratio. The ratio is used by bankmanagements and market analysts to assess bankperformance. The components of the ratio are cost andincome and, hence, the measure is indirectly related to bankprofitability. A reduction in costs for a given level of incomewill reflect increased profits and vice versa. Increased profits,in turn, will result in improved return on equity and shareprices of the bank which is of great interest to investors.Further, most bank costs have been reducing in response tomargin squeezes, thus lowering both costs and income. Hence,volatility in a bank’s cost to income ratio might be a bettermeasure of volatility in a bank’s cost performance.
The cost to income ratio is the ratio of non-interest (operating)costs excluding bad and doubtful debt to the net interestincome plus non-interest income of the bank. Non-interestcosts are perceived as those costs which are most amenableto management decisions and considered to be that part of a
bank’s costs which can be controlled. A focus on non-interestcosts would ensure that fluctuations in the level of interestrates do not affect the volatility seen in this ratio. The use ofthe net interest income term in the denominator will reducethe volatility that could arise from fluctuations in the generallevel of interest rates.
The rationale for the exclusion of bad and doubtful debt canbe attributed to the following: (i) Bad and doubtful debtlargely reflects bad credit decisions made in the past ratherthan current performance. (ii) The cost to income ratio wouldbe adversely affected by major write-offs, if any, undertakenat points of time in the future. (iii) Such assets can distort theratio as well as reflect high levels of operating costs and lowlevels of income.
Since the cost to income ratio is affected by changes in bothcosts as well as incomes, the ratio needs to be interpretedwith caution. An increase in the ratio on account of fallingincome needs to be studied so as to determine whether thefall in income is because of the bank’s inability to generateincome, thereby indicating inefficiency or is attributable to achange in competitive conditions which reduce margins acrossthe board or a change in overall economic conditions whichrestrict opportunities to undertake profitable business fromwhich a bank can earns fees.
The ratio is also sensitive to individual bank structure in termsof the strategy adopted for deposit mobilisation, spread ofbank branch networks and business mix. Another factor thatcan have an impact on the cost to income ratio is banks holdingexcess capital or banks that are over capitalized. Banksholding excess capital are in a position to undertake greaterwholesale lending or investment at low cost thus increasingtheir gross income with the same level of operating costsresulting in a lower cost to income ratio. Tripe (1998) hasdetailed, through several illustrations, the impact of differingbank structures on the cost to income ratio.
(iii) Range
Range between the maximum and minimum cost ratios canbe looked at as an alternative to standard deviation formeasuring the operational risk capital requirement. Such anestimate can be adopted when observations are sufficientlylarge and is based on a methodology like back simulation.However, an estimate based on range would be larger thanthat under standard deviation as the range extends on bothsides of the mean (Tripe, 1998, 2000).
III The Basel II Accord and India
The Reserve Bank of India (RBI) has adopted a consultativeapproach as regards the implementation of Basel II. A Steering

Chapter 1: Introduction 381
Committee comprising of senior officials from fourteen banks(private, public, and foreign) has been constituted alongsidea representation of the Indian Banks’ Association. Keepingin view the RBI's goal to be consistent and harmonious withinternational standards, it has been decided that at a minimum,all banks in India will adopt the Standardized Approach forcredit risk and the Basic Indicator Approach for operationalrisk with effect from March 31, 2007. After adequate skillsare developed, both in banks and at supervisory levels, somebanks may be allowed to migrate to the Internal Ratings BasedApproach after obtaining the specific approval of the ReserveBank of India. Further, the Reserve Bank of India will reviewthe capital requirements produced by the Basic IndicatorApproach for general credibility and, in the event thatcredibility is lacking, appropriate supervisory action underPillar 2 will be considered. Banks will be encouraged to movealong the spectrum of available approaches as they developmore sophisticated operational risk measurement systems andpractices (Reserve Bank of India, 2005). While the RBI hasmandated the BIA approach, banks are aware that they mustprogress toward the AMA approach. One problem that hasbeen recognised is that ‘low frequency, high impact’ data, bydefinition, must be collated. Therefore, a data exchange bythe Indian Banks’ Association has been proposed along thelines of the Global Operational Loss Database (GOLD) setup by the British Bankers Association. In India, businesscontinuity planning (BCP) is a part of Operational Risk(Reserve Bank of India, 2008A). The context is the increasedleverage of technology. In that case, ‘disaster recovery’ is animportant component of the BCP programme directed towardsthe recovery of technology. An effective BCP must factor inthe possibility of disasters covering an entire region and theresulting attrition of staff. Thus, the BCP methodologyincludes the IT continuity template and formulating recoverytime objectives (RTO) based on Business Impact Analysis.The model must be robust enough to contend with the moststressful situations. The recovery point objectives (RPO) fordata loss in the case of each critical business will have toidentified along with strategies to deal with them.
IV Pricing Operational Risk: Measurement forIndian Banks
This section presents the estimates of operational risk capitalmeasurement for Indian banks and its consequent impact onTier I capital under a broad spectrum of approaches, namely,the Basic Indicators Approach, the Standardized Approach,the Cost to Asset Ratio and the Cost to Income Ratio. Thestudy estimates the operational risk capital charge at anindividual bank level as well as bank group-wise dependingon the availability of data. When the estimates have beenpresented at the individual bank level, it covers 30 banksincluding the 27 public sector banks (19 nationalized Banksand 8 banks of the State Bank group) and the 3 leading newprivate sector banks viz. ICICI Bank, HDFC Bank and UTI/Axis Bank. The period of the study varies as per the Approachand the availability of data. The time period of the study spans2005-2008 for three of the four approaches - the BasicIndicators Approach, the cost to asset ratio and the cost toincome ratio, while it spans the period 2006-2007 for theStandardized Approach. The data has been sourced fromvarious issues of the Reserve Bank of India’s Basic StatisticalReturns of Scheduled Commercial Banks in India andStatistical Tables Relating to Banks in India and Report onthe Trend and Progress of Banking in India.
IV.A Basel II Approaches
(i) The Basic Indicators Approach
This approach is to be adopted by all banks in India fromMarch 2007. This approach, as detailed above, would requirebanks to keep aside a percentage ? (equal to 15%) of positivegross annual income over the past three years excluding anyyear where gross income is negative as operational risk capitalcharge. Table 2 presents the additional capital chargerequirement for operational risk under the Basel II Accordfor the major bank groups.
Table 2. Operational Risk Capital Charge and Impact on Tier I Capital –Bank Group-wise (Basic Indicators Approach)
Year Gross Income Annual Capital Capital Charge Networth Current Tier I Estimated Tier I(Rs. Crore) Required (Rs. Crore) (Rs. Crore) (%) (%)
Public Sector Banks
2002 48095 7214 - 57454 7.8 -
2003 58611 8792 - 65582 8.3 -
2004 71822 10773 - 79225 8.2 -
2005 75802 11370 8926 85946 7.4 6.6
2006 79276 11891 10312 115044 8.8 8.1
Table contd...

382 Operational Risk Measurement for the Indian Banking Sector: Alternative Measures
2007 85909 12886 11345 135626 8.3 7.6
2008 97039 14556 12049 174853 7.4 6.9
2009 13111
Nationalised Banks
2002 29888 4483 - 37395 7.1 -
2003 36952 5543 - 42450 7.9 -
2004 45343 6801 - 51475 8.1 -
2005 46298 6945 5609 61181 7.6 6.9
2006 46829 7024 6430 71012 9.0 8.2
2007 53945 8092 6924 84385 8.5 7.8
2008 60310 9047 7354 104325 7.5 7.0
2009 8054
State Bank Group
2002 18207 2731 - 20059 9.5 -
2003 21660 3249 - 23133 9.3 -
2004 26480 3972 - 27750 8.5 -
2005 28690 4304 3317 32764 7.9 7.1
2006 30787 4618 3842 37660 8.5 7.6
2007 30278 4542 4298 42942 7.7 6.9
2008 34437 5166 4488 61706 7.2 6.7
2009 4775
Old Private Sector Banks
2002 4451 668 - 5411 10.4 -
2003 4952 743 - 6295 10.6 -
2004 5569 835 - 7291 10.9 -
2005 4852 728 749 7926 9.0 8.1
2006 5346 802 769 9671 9.3 8.5
2007 5987 898 788 10737 11.2 10.3
2008 6838 1026 809 15315 14.1 13.4
2009 909
New Private Sector Banks
2002 4058 609 - 10514 7.5 -
2003 8205 1231 - 13404 8.2 -
2004 10163 1524 - 14846 7.0 -
2005 11507 1726 1121 18981 9.9 9.4
2006 16838 2526 1494 24314 8.8 8.3
2007 23035 3455 1925 33075 8.1 7.7
2008 32665 4899 2569 49332 10.3 9.8
2009 3627
Table contd...
It is important to mention here that even while banks in Indiaare to introduce the operational risk capital charge from March2007, we have estimated this capital charge from 2005. Apartfrom giving a historical perspective to the impact of theoperational risk capital charge, the exercise will also providea useful continuation to an early study of ICRA in this area.ICRA in its estimates had suggested that in 2005 scheduled
commercial banks would need Rs.120 billion as additionalcapital requirements for operational risk. Of this, a substantialamount would be needed by public sector banks comprisingthe nationalized banks and the State Bank group followed bythe new private sector banks and the old private sector banks.While the pattern of capital requirements remains the sameat the end of March 2007, the focus here is on the period

Chapter 1: Introduction 383
since March 2007 when Indian banks would startimplementing the Operational Risk capital charge under BIA.Table 2 details the additional capital requirement on accountof the Operational Risk capital charges for the Indian bankingsector excluding foreign banks in India and estimates indicatethat the requirements on account of operational risk capitalcharges would be of the order of Rs.14,058 crores at the endof March 2007 and Rs.15,427 crores in March 2008. Therequirement is estimated to be Rs.17,647 crores for March2009. Furthermore, the requirement at the end of March 2009is about 1.63 times greater than the requirement at the end ofMarch 2005 which was approximately Rs.10,796 crores. Asubstantial proportion – nearly 80.70% (at Rs.11,345 crores)– of the overall additional capital requirements on account ofOperational Risk capital charge would form the requirementof the public sector banks at the end of March 2007. Whilethe public sector banks have seen an increase in the absoluteamount of capital requirements, the percentage as a proportionof the overall capital requirements for public sector bankshas since declined and is estimated to be around 74.30% atRs.13,111 crores in 2009 of the overall additional capitalrequirement on account of the Operational Risk capital charge.Compare this with the new private sector bank group whoseadditional capital requirements for Operational Risk, thoughsubstantially lower than the public sector banks, witnessedan increase both in percentage terms as well as in the absoluteamount of capital required since March 2007. At end March2007, the capital requirements of new private sector bankswas estimated to be Rs.1925 crores, which was 13.69% ofthe overall requirement for the banking sector (excluding the
foreign banks) and the percentage share is estimated to bearound 20.55% (Rs.3627 crores) at the end of March 2009.The bank group of the old private sector banks has seen anincrease in absolute amount of capital requirements fromRs.788 crores at the end of March 2007 to Rs.909 crores atthe end of March 2009. The percentage share of this grouphowever remains stable in the range of 5.15 – 5.61% overthe period March 2007-09. The impact of this additionalcapital requirement has had the expected impact on loweringTier I capital across all bank groups. On an average for 2007and 2008, the impact of lowering the Tier I capital has beenthe highest for the old private sector banks at around 0.45%followed by the public sector banks at 0.6% and the lowestfor the new private sector banks at 0.45%. The OperationalRisk capital requirement for each of the individual 30 bankson an average for 2007-09 is encapsulated in Table 3 while adetailed analysis is in Annexure III. Table 3 highlights thefact that the Operational Risk capital charge for 23 of the 30banks under consideration would, on an average for 2007-08, be below Rs.500 crores. Five banks would require anoperational risk capital charge in the range of Rs.500–Rs.1000crores, while the State Bank of India at Rs.2203 crores andICICI Bank at Rs.1423 crores would need an additional capitalrequirement of above Rs.1000 crores. A graphical presentationof the comparative requirements of Operational Risk capitalcharges of each individual public sector bank vis-à-vis theoverall requirement of the public sector banks and of each ofthe three leading private sector banks vis-à-vis the overallrequirement for the new private sector banks for the period2005-2009 is presented in Annexures VI and VII respectively.
Table 3. Operational Risk Capital Requirement of Banks: Average 2007-09 Basic Indicators Approach
(Rs. Crore)
Below 250 250-500 500-1000 Above 1000
BoM (184) ALLA (315) BoB (694) ICICI (1423)
DENA (175) ANDHRA (261) BoI (643) SBI (2203)
PSB (129) CENTRAL (456) CANARA (759)
UNITED (213) CORP (267) PNB (925)
VIJAYA (198) INDIAN (330) HDFC (594)
SBBJ (198) IOB (414)
SBH (240) ORIENTAL (327)
SB-IND (117) SYND (377)
SBM (146) UCO (300)
SBP (209) UNION (466)
SBS (91) AXIS (306)
SBT (197)
Figures in parentheses represent the Operational Risk capital charge.

384 Operational Risk Measurement for the Indian Banking Sector: Alternative Measures
Considering that a substantial burden of the additional capitalrequirement on account of Operational Risk capital chargeslies on the public sector banks, it would be interesting to studyand compare the impact of the Operational Risk capitalcharges on the regulatory Tier I capital. Tables 4, 4A and 4Bsummarize the impact on Tier I capital of the additional capitalcharges for Operational Risk for nationalized banks, the StateBank group and the three major new private sector banksrespectively for 2005-08. As can be gleaned from Table 2,the introduction of the additional capital charges forOperational Risk has lowered the Tier I capital of banks. Asof end March 2005, if the operational risk capital charge wasassumed to be active, then all others remaining the same, theestimates from Table 4A indicate that nearly 9 of the 19
nationalized banks would have had a Tier I capital below 6%while two banks from the State Bank group – the State Bankof Indore and State Bank of Travancore (Table 4B) - wouldhave a Tier I capital of less than 6%. The Reserve Bank ofIndia on February 15, 2005, issued guidelines to all ScheduledCommercial Banks indicating the approach to be adoptedfor the implementation of the Basel II Accord in Indian banks.Subsequently, several nationalized and private banks boostedtheir Tier I capital through raising equity in 2005 and 2006and the Tier I capital of the following banks showedsubstantial improvement, namely Allahabad Bank, AndhraBank, Bank of Baroda, Dena Bank, Oriental Bank ofCommerce, Punjab and Sind Bank, Punjab National Bank,Syndicate Bank and Union Bank of India.
Table 4A. Impact of Operational Risk Capital Charge on Tier I CapitalBasic Indicators Approach – Nationalized Banks
Tier I Capital
Year Below 5% Between 5-6% Between 6-7% Between 7-9% Above 9%
2005 ORIENTAL ALLA BoI ANDHRA CORP
PSB CENTRAL DENA BoM BoB UNITED
IOB CANARA INDIAN
SYND VIJAYA PNB
UCO
UNION
2006 DENA BoI ALLA ANDHRA
SYND BoM CANARA BoB
UCO CENTRAL IOB CORP
UNION UNITED INDIAN
VIJAYA ORIENTAL
PSB
PNB
2007 BoI CANARA ALLA ANHDRA
BoM UNITED BoB CORP
CENTRAL VIJAYA IOB INDIAN
DENA PSB ORIENTAL
SYND PNB
UCO UNION
2008 BoM CENTRAL CANARA ALLA CORP
UCO VIJAYA DENA ANDHRA INDIAN
SYND BoB
UNION BoI
UNITED IOB
PSB
PNB
ORIENTAL

Chapter 1: Introduction 385
In addition, as indicated by the spread of banks at the end ofMarch 2007, when banks were to adopt the additionalregulatory capital requirement for Operational Risk under theBasic Indicators Approach, regulatory Tier I capital adequacywould be below 6% for 6 of the 19 nationalized banks whilenearly 10 of the 19 nationalized banks would havecomfortable levels of Tier I capital (greater than 7%). Aworrying scenario in the nationalized banks in 2008 is
observed for the Bank of Maharashtra and UCO Bank whoseTier I capital would be below 5% and two other banks –Central Bank of India and Vijaya Bank – would have a Tier Icapital in the range of 5-6%.
Annexure VIII contains a graphical presentation of theOperational Risk capital charge and the impact on Tier Icapital at an individual bank level for nationalized banks
Table 4B. Impact of Operational Risk Capital Charge on Tier I CapitalBasic Indicators Approach - State Bank Group
Tier I Capital
Year Below 5% Between 5-6% Between 6-7% Between 7-9% Above 9%
2005 SB-IND SBH SBI SBP
SBT SBM SBBJ
SBS
2006 SB-IND SBI SBP
SBM SBBJ
SBT SBH
SBS
2007 SBM SB-IND
SBT SBI
SBBJ
SBH
SBP
SBS
2008 SBM SBBJ SBI
SBH SBS
SB-IND
SBP
SBT
Table 4C. Impact of Operational Risk Capital Charge on Tier I Capital
Basic Indicators Approach – Axis Bank, HDFC Bank and ICICI Bank
Tier I Capital
Year Below 5% Between 5-6% Between 6-7% Between 7-9% Above 9%
2005 AXIS HDFC
ICICI
2006 AXIS HDFC
ICICI
2007 AXIS HDFC
ICICI
2008 AXIS
HDFC
ICICI

386 Operational Risk Measurement for the Indian Banking Sector: Alternative Measures
Table 4B presents a similar spread for the State Bank of Indiaand its associate banks. The State Bank of India and some ofits associate banks like the State Bank of Saurashtra, the StateBank of Bikaner and Jaipur, State Bank of Hyderabad andthe State Bank of Patiala, have shown comfortable levels ofcapital adequacy under Tier I capital in 2007. At the end ofMarch 2008, though, only two banks in the State Bank groupviz. the State Bank of India and the State Bank of Saurashtrashow comfortable levels of Tier I capital greater than 7%while 5 of the associate banks have Tier I levels in the rangeof 6%-7%. The State Bank of Mysore is the lone associatebank of the State Bank group to have a Tier I capital of lessthan 6% after the implementation of the Operational Riskcapital charge in 2007.
Table 4C gives the similar spread for the 3 major new privatesector banks considered in this paper. With the exception ofAxis Bank in 2007, all banks have a Tier I capital greaterthan 9% after accounting for the capital requirement underOperational Risk.
(ii) The Standardized Approach
We attempt to provide an estimate for Operational Risk capitalcharge under the Standardized Approach (SA) (though it isnot to be adopted and is the second in the spectrum ofapproaches suggested by the Basel II Accord). This approachis a refinement of the Basic Indicators Approach and underthis approach a bank’s business is divided into eight businesslines and different percentages ? are applied to each businessline’s gross income so as to arrive the Operational Risk capitalcharge. Operational Risk under the SA is sensitive to thedecomposition of income from different business lines.
Data constraints limit the computation of the Operational Riskcapital charge under this approach to 2007 and 2008 for banksgroup-wise, namely, nationalized banks, the State Bank groupand private sector (old and new) banks. Under the SA, abank’s business lines can be broadly classified into 3 majorlines – Investment Banking, Banking and Others. Each ofthese 3 lines at Level 1 are, in turn, decomposed into thefollowing (for details on Activity groups corresponding toeach business line see Annexure II).
Investment Banking – (i) Corporate Finance (ii) Trading&Sales
Banking – (i) Retail Banking (ii) Commercial Banking (iii)Payment & Settlement and (iv) Agency Services
Others – (i) Asset Management (ii) Retail Brokerage and(iii) Insurance.
For most banks in India, a one-to-one correspondence withthese business lines in terms of data availability is difficult.For instance, income from payment and settlement and agencyservices is included under Commission, Brokerage andExchange, an item under Other Income in a bank’s Profit &Loss account. Further, most banks undertake assetmanagement and insurance as joint ventures and the incomefrom this activity could be reflected to an extent under theitem Income from Investments under Interest Earned in abank’s Profit and Loss account. Consequently, the estimationof Operational Risk capital charge has been restricted to Level1 and the following heads of activity have been considered,viz. (i) corporate finance (ii) trading and sales underinvestment banking; (iii) Retail Banking and (iv) CommercialBanking under Banking. It is appropriate, here, to discussthe correspondence between the income from the differentactivity groups of a bank and available data. Data on incomefrom corporate finance is the income a bank obtains frominvestments and other income, while income from tradingand sales is the profit a bank makes from the sale of land,sale of investment assets and sale of foreign exchange, incomefrom commission and brokerage and net repo income of thebank. Net repo income is the difference between interestearned on balances with the RBI and other inter-bank fundsand the interest expended on borrowings from the RBI andother inter- bank funds. Some computations had to beundertaken to derive the income from retail and commercialbanking and is obtained as under:
Income from Retail Banking = credit outstanding against eachoccupation for individuals * the weighted average of lendingrate for each of the occupations
Credit outstanding under commercial banking = Total creditoutstanding for each occupation – credit outstanding againstindividuals
Income from commercial banking = credit outstanding undercommercial banking activity * by the weighted average oflending rate for each of the occupations
The Operational Risk capital charge is then obtained byapplying the relevant Beta to the gross income from aparticular business line. Table 5 presents the Operational Riskcapital charge and its impact on Tier I capital at the level ofthe bank group viz. nationalized banks, the State Bank groupand private sector (old and new) banks under the StandardizedApproach).

Chapter 1: Introduction 387
Table 5. Operational Risk Capital Charge and Impact on Tier I Capital– Bank Group Wise (Standardized Approach)
Year Annual Capital Networth Current Estimated
Capital Charge (Rs. Crore) Tier I Tier I
Requirement (Rs. Crore) % %
(Rs.Crore)
Nationalised Banks
2004 11273 51475 8.1
2005 13144 61181 7.6
2006 15292 71012 9.0
2007 16261 13236 84385 8.5 7.2
2008 Na 14899 104325 7.5 6.4
State Bank Group
2004 6524 27750 8.5
2005 7302 32764 7.9
2006 7857 37660 8.5
2007 8241 7228 42942 7.7 6.4
2008 Na 7800 61706 7.2 6.3
Private Sector Banks
2004 4332 22137 7.0
2005 5280 26907 9.9
2006 6880 33985 8.8
2007 8473 5497 43812 8.1 7.1
2008 Na 6877 64647 10.3 9.2
The results of Table 5 indicate the additional capitalrequirement that has to be set aside by the different bankgroups under the Standardized Approach would be higherthan that estimated under the Basic Indicators Approach(Table 2). The pattern of capital requirements though remainssimilar to that under the Basic Indicators Approach, whereinthe public sector banks would require a larger amount ofadditional capital requirements, with the nationalized banksrequired to set aside on an average nearly Rs.14,000 crores,
the State Bank group on an average would need aroundRs.7500 crores and the requirement for the private sectorbanks would be lower at around Rs.6000 on an average over2007-08. Further, the estimated decline in the Tier I capitalfor all the bank groups studied is much greater than underthe Basic Indicators Approach (Table2). Also, the extent ofthe impact is almost similar across the bank groups – theestimated Tier I capital after taking into consideration theOperational Risk capital charge is lower by 1% to 1.3% in2007 and 2008.
IV.B Alternative Approaches
The alternative approaches, as discussed in Section II.Babove, refer to the computation of the Operational Risk capitalcharges using the cost to asset and the cost to income ratios.Both these measures focus on the volatility of non-interestexpenses. While the literature suggests the using of quarterlydata, for comparison with the Basel II Approaches, theanalysis has been done using annual data.
Tables 6A, 6B and 6C show the spread of banks acrossdifferent ranges of Tier I capital, when the cost to asset ratiois used to compute the Operational Risk capital charge(Detailed results are in Annexure IV).
Table 6A underscores the severe impact of Tier I capital onthe nationalized banks using the cost to asset ratio as a measureof the Operational Risk capital charge compared to that underthe Basic Indicators Approach (see Table 4A). In 2005, thenumber of banks that had a Tier I capital below 6%, if weassumed the Operational Risk capital charge were applicable,remained the same at 9 banks as under the BIA thecomposition had reversed under the cost to asset ratio measure– 7 banks had Tier I capital below 5%, while 2 banks were inthe 5%-6% range. Likewise, the performance for the lateryears also continued to reflect the severity.
Table 6A. Impact of Operational Risk Capital Charge on Tier I Capital Cost to Asset Ratio - Nationalized Banks
Tier I Capital
Year Below 5% Between 5-6% Between 6-7% Between 7-9% Above 9%
2005 ALLA BoM BoI ANDHRA CORP
CENTRAL UCO CANARA BoB UNITED
DENA INDIAN PNB
ORIENTAL IOB VIJAYA
PSB
SYND
UNION
Table contd...

388 Operational Risk Measurement for the Indian Banking Sector: Alternative Measures
Table contd...
2006 DENA BoI CANARA ALLA ANDHRAPSB BoM UCO INDIAN BOB
CENTRAL IOB CORPSYND PNB ORIENTALUNION UNITED VIJAYA
2007 CENTRAL BoI CANARA ALLA CORPDENA BoM UNITED ANDHRA INDIANPSB UCO BoB
SYND UNION IOBVIJAYA ORIENTAL
PNB
2008 BoM PSB ALLA ANDHRA INDIANCENTRAL SYND CANARA BoB
VIJAYA UCO DENA BoIUNION CORPUNITED IOB
ORIENTALPNB
Table contd...
Some banks continued to be poor performers as regardsTier I capital (below 6%) using the cost to asset ratio vizBank of Maharashtra, Central Bank of India, Dena Bank,Syndicate Bank, UCO Bank and Vijaya Bank. The surprise asindifferent performer under the cost to asset ratio has beenPunjab and Sind Bank which has shown Tier I capital below6%, while United Bank of India and Vijaya Bank showed acontinuous decline in Tier I levels since 2005 to 2008.However, as compared to the State Bank group and the 3leading new private banks, a substantial number of nationalizedbanks maintained a Tier I capital greater than 9% as can beseen from Tables 6B and 6C. Besides, the performance ofsome nationalized banks such as Andhra Bank, Allahabad Bank,Bank of Baroda, Corporation Bank, Oriental Bank ofCommerce under the cost to asset approach for operationalrisk capital charge is similar to their performance under theBasic Indicators Approach.
The impact of the cost to asset ratio as a measure ofdetermining Operational Risk capital charges on theregulatory Tier I capital for State Bank of India and its
associates is in Table 6B and the impact has been extremelike that for the nationalized banks. There is no bank fromthe State Bank group that has a Tier I capital of above 9%while the State Bank of India, except for 2007, has had arelatively comfortable position on Tier I in the range of 7%-9%. The impact of the Operational Risk capital charge onTier I capital for the associate banks in this group has beenmixed. The associate banks that have scored badly on Tier Icapital in this group (as compared to under BIA) have beenthe State Bank of Patiala whose Tier I capital has beendeclining since 2005 and the State Bank of Bikaner and Jaipur,while the State Bank of Mysore has worsened (as comparedto the BIA) and its Tier I has consistently being below 5%under the cost to asset ratio measure.
The performance of the 3 major new private sector banksvis-à-vis Tier I capital is in Table 6C. The performance ofHDFC Bank has been stable and its Tier I capital like underthe BIA has been in the range of 7-9% while mixedperformance is observed for Axis Bank and ICICI Bank.
Table 6B. Impact of Operational Risk Capital Charge on Tier I Capital Cost to Asset Ratio – State Bank Group
Tier I Capital
Year Below 5% Between 5-6% Between 6-7% Between 7-9% Above 9%
2005 SBM
SBT SBBJ
SBH SBI-IND SBI
SBP
SBS

Chapter 1: Introduction 389
2006 SBM SBBJ SB-IND SBI
SBT SBP SBH
SBS
2007 SBBJ SBP SBI SBH
SBM SB-IND
SBS
SBT
2008 SBBJ SBH SBI
SBM SB-IND
SBP SBS
SBT
Table 6C. Impact of Operational Risk Capital Charge on Tier I Capital Cost to Asset Ratio – Axis Bank, HDFC Bank and ICICI Bank
Tier I Capital
Year Below 5% Between 5-6% Between 6-7% Between 7-9% Above 9%
2005 ICICI AXIS
HDFC
2006 AXIS HDFC
ICICI
2007 AXIS ICICI HDFC
2008 AXIS
HDFC ICICI
Table contd...
The second alternative approach adopted to estimate theoperational risk capital charge is the cost to income ratio.Tables 7A, 7B and 7C highlight the impact on the Tier I capital
of nationalised banks, the State Bank and its associate banksand the three leading private sector banks. (Detailed Resultsare in Annexure V).
Table 7A. Impact of Operational Risk Capital Charge on Tier I CapitalCost to Income Ratio – Nationalised Banks
Tier I Capital
Year Below 5% Between 5-6% Between 6-7% Between 7-9% Above 9%
2005 ALLA BoI ANDHRA BoB CORPCENTRAL BoM CANARA PNB UNITED
DENA IOB INDIANORIENTAL UNION
PSB VIJAYASYNDUCO
2006 CENTRAL BoI CANARA ALLA ANHDRADENA SYND PSB INDIAN BoBPSB UNION IOB CORPUCO VIJAYA ORIENTAL
PNBUNITEDVIJAYA
Table contd...

390 Operational Risk Measurement for the Indian Banking Sector: Alternative Measures
2007 BoM BoI CANARA ALLA ANDHRA
CENTRAL SYND PSB BoB CORP
DENA UNION IOB INDIAN
UCO VIJAYA ORIENTAL
PNB
UNITED
2008 BoM SYND BoI ALLA
CENTRAL UNITED CANARA ANDHRA
UCO VIJAYA DENA BoB
IOB CORP
PSB INDIAN
UNION PNB
ORIENTAL
Table contd...
The distribution of nationalised banks (Table 7A) for Tier Iregulatory capital maintained is similar to that under the costto asset ratio more so in the range below 5% and above 7%of Tier I capital, while some changes are observed for themiddle range of 5-7% of Tier I. While Central Bank of Indiacontinues to score poorly under the cost to income measure,its Tier I capital is the lowest in the range of 1.30 to 3.57%.The other banks that have not fared well continue to be DenaBank, Bank of Maharashtra, UCO Bank, Syndicate Bank.
Table 7B highlights the performance of the State Bank groupwhere the performance is substantially varied from that underthe cost to asset approach as well as the BIA. The State Bankof India’s Tier I capital (between 6-7%) under the cost toincome approach is lower as compared to the otherapproaches, while that of the State Bank of Bikaner and Jaipurmatches its Tier I capital with that under the BIA markedlydifferent from that under the cost to asset approach. The StateBank of Mysore also fares better as compared to the othertwo approaches.
Table 7B. Impact of Operational Risk Capital Charge on Tier I CapitalCost to Income Ratio – State Bank Group
Tier I Capital
Year Below 5% Between 5-6% Between 6-7% Between 7-9% Above 9%
2005 SB-IND SBH SBI SBBJ
SBT SBM SBP
SBS
2006 SBT SB-IND SBI
SBM SBBJ
SBH
SBS
SBP
2007 SBI SBBJ SBH
SB-IND SBS
SBM
SBP
SBT
2008 SBI SBH
SBBJ SB-IND
SBM SBP
SBT

Chapter 1: Introduction 391
Table 7C contains the results for the three major new privatesector banks and it can be observed that under the cost toincome approach as compared to the other two approaches –
BIA and cost to assets, HDFC Bank shows a Tier I capitalbelow 7% in 2006 and 2007. ICICI Bank continues to have aTier I capital greater than 9%.
Table 7C. Impact of Operational Risk Capital Charge on Tier I CapitalCost to Income Ratio (Axis Bank, HDFC Bank and ICICI Bank)
Tier I Capital
Year Below 5% Between 5-6% Between 6-7% Between 7-9% Above 9%
2005 ICICI AXIS
HDFC
ICICI
2006 AXIS HDFC ICICI
2007 AXIS HDFC ICICI
2008 AXIS
HDFC ICICI
Thus, a comparison of the estimates of the impact of theadditional operational risk capital charges on the Tier I capitalof individual banks across the different approaches and bankgroups indicates that some banks would continue to becomfortable and maintain high levels of Tier I capital (above7%) after the imposition of the additional capital requirementsespecially for end March 2007 and 2008, namely, AndhraBank, Bank of Baroda, Corporation Bank, Oriental Bank ofCommerce, Punjab National Bank, State Bank of India(except under the cost to income approach). Canara Bankcontinued to maintain a Tier I capital between 6%-7% underall approaches, while the estimates for Bank of Maharashtra,Central Bank of India , UCO Bank and State Bank of Mysoreshow a Tier I capital below 6% under all the three approaches.Among the three new private sector banks considered, AxisBank showed improved levels of Tier I capital under all thethree approaches in 2008 as compared to 2007 and the Tier Icapital of HDFC Bank is higher than 7% except for the costto income approach where it was between 6-7%. LikewiseICICI Bank has been well capitalized and has had a Tier Icapital greater than 7% except for 2007 under the cost toasset approach when its Tier I was between 6-7%. AnnexureIX presents a graphical comparison at the individual banklevel for the broad spectrum of 30 banks covering thenationalized banks, State Bank of India and its associate banksand three new private sector banks of the impact of theOperational Risk capital charge on the Tier I capital underthe Basic Indicators Approach, the cost to asset ratio, and thecost to income ratio.
IV.C Sensitivity Analysis
This section estimates the sensitivity of a bank’s gross incometo gross income from a particular business line at Level 1 of
the classification of business activity for a bank as specifiedunder the Standardized Approach. In other words it is theamount of change in gross earnings given a unit change inthe earnings from a single business line with all else heldconstant. Sensitivity analysis, thus, helps identify the businessline/activity to which a bank’s income is most sensitive.
Sensitivity analysis, thus, is the partial derivative of theearnings function with respect to a factor. It can be definedas:
ΔE/ΔX = δf/δx
where E – gross income of a bank X – income from aparticular business line.
Sensitivity analysis has been performed using the standardelasticity approach by calculating the average elasticity ofthe change in a bank’s gross income to a change in incomefrom a particular business line. While panel data analysis isbetter suited to derive the sensitivity coefficients, the lack ofa sufficient number of data points restricts the use of the paneldata technique to ensure the reliability of our estimates.Besides, the sensitivity analysis could be estimated at the levelof the bank group rather than at an individual bank level, asdata on income from retail and commercial banking whichwas computed under the Standardized Approach, wasavailable at the level of bank group. Table 8 presents theresults of the sensitivity analysis for activities under Level 1of the Standardized Approach (restricted in this study to justincome from corporate finance, trading & sales, retail bankingand commercial banking, since availability of data with aone to one correspondence for the 8 business lines specifiedunder the SA is difficult) and within trading & sales incomesensitivity to income from foreign exchange transactions andcommission & brokerage.

392 Operational Risk Measurement for the Indian Banking Sector: Alternative Measures
Table 8. Sensitivity Analysis for 2005-2007: Bank Group-wise
Bank Group Corporate Finance Trading & Retail Banking Commercial Foreign Comm. &
Sales Banking Exchange Brokerage
Nationalised 2.3912 0.2884 -0.6337 0.6390 0.2446 0.3137
State Bank 0.2562 -0.1642 0.1834 0.0229 0.7039 0.4092
Private 0.1795 0.6910 0.6789 -4.4634 0.5526 0.4993
The results of the sensitivity analysis present a mixed scenariofor the three bank groups considered – nationalized banks,State Bank group and private sector banks (old and new). Allthe three bank groups show the existence of a positiverelationship between the gross income of a bank and theincome from corporate finance. Nationalized banks show avery high degree of elasticity with reference to corporateincome. A percentage change in corporate income increasesgross income by almost 2.3%, while for the State Bank groupand the private banks (old and new) this coefficient iscomparatively smaller and a percentage increase in incomefrom corporate finance brings about a 0.25% and 0.18%increase in gross income respectively. The sensitivity of grossincome to income from trading and sales is the highest forthe private bank group indicating that a 1% increase in incomefrom trading and sales would have an impact of increasinggross income by about 0.69%, while for the nationalized banksit was comparatively lower at 0.28%. The State Bank and itsassociate banks surprisingly have a negative coefficient butthis could be explained by the fall in the income from trading& sales since 2005 for the State Bank group from a high ofRs.12858 crores in 2004 to Rs.10392 crores in 2005 and afurther decline to Rs.9911 crores in 2007. This fall in incomefrom trading and sales can be attributed to a fall in the profitfrom the sale of investments and a decline in net repo income.The estimate for net repo income would also include incomefrom the inter-bank funds market. The sensitivity of incomefrom retail banking is the highest for the private bank groupat 0.68% followed by the State Bank group where a 1%increase in income from retail banking brings about only aboutless than a quarter percent increase in gross income. The highnegative coefficient for the nationalized banks for retailbanking income seems unexpected and may perhaps beattributed to the high proportion of credit outstanding toagriculture, large credit outstanding of less than Rs.2 lakhsand other social objectives such as priority sector lendingwhere recovery is slow. These factors may also explain thesubstantial difference in the sensitivity coefficients observedbetween the State Bank group and the private sector banks.The sensitivity of the gross income to income fromcommercial banking is the highest for the nationalized banksat 0.64, whereas the sensitivity is much lower for the State
Bank group at 0.02, while the private banks are described bya negative coefficient on sensitivity to income fromcommercial banking. The private sector banks have seen adecline in income from commercial banking since 2005 andincome from commercial banking in 2007 was almost half atRs.5935 crores as compared to 2006. Within trading and sales,we have further looked at sensitivity of gross income to twomajor sources of income for a bank, namely foreign exchangetransactions and commissions and brokerage. All the threebank groups studied showed a positive sensitivity to incomefrom both these business activities. The sensitivity for boththese business activities for the private sector banks was inthe range of 0.49 to 0.55 implying thereby that a one percentincrease in income from these activities would reflect in abouthalf a percent increase in gross income of the banks. TheState Bank of India and its associate banks showed a highsensitivity of nearly 0.70 for foreign exchange transactionsand 0.40 on commission and brokerage, while the nationalizedbanks had the lowest sensitivity coefficients. The grossincome for all the bank groups is sensitive to income fromforeign exchange transactions, but this sensitivity at 0.77%is the highest for the private banks followed by the State Bankgroup and the nationalized banks. A similar pattern is observedon the sensitivity of gross income to income from commissionand brokerage.
V. Conclusion
Operational Risk, thus, generates potential losses and thispotential loss can be viewed as a cost to the bank. WhileOperational Risk exists and needs to be priced appropriately,there is a view among practitioners and analysts (Webb, 1999)that the focus should be on the elimination of OperationalRisk rather than a focus on its measurement. However, inpractice, the costs involved in the elimination of OperationalRisk could be substantially higher than the probability of aloss event actually occurring. Also, it may not be feasible toforesee all the potential future loss events. Most of the banksin India are operating at capital adequacy ratios higher thatthe prescribed Basel II requirements. Still, overall capitalrequirements are expected to go up on account of OperationalRisk (Reserve Bank of India, 2008B). The paper focuses on

Chapter 1: Introduction 393
the measurement of the Operational Risk capital charges thatbanks in India have to incorporate from 31st March 2007and the impact of this additional capital requirements on theregulatory Tier I capital of banks. The paper estimatesOperational Risk capital charges and its Tier I impact at thelevel of the bank group and for individual banks accordingto the availability of data. At the level of individual banks,the paper covers 30 banks – 19 nationalized banks, 8 banksof the State Bank group and 3 leading new private sectorbanks – Axis Bank, HDFC Bank and ICICI Bank over theperiod since 2005. We compute Operational Risk capitalcharges using two of the Basel II Approaches, namely, theBasic Indicators Approach (at the bank group as well asindividual bank level) and the Standardized Approach (at thelevel of bank groups) and alternate approaches using the costto income and cost to asset ratios. The additional capitalrequirements on account of the Operational Risk capitalcharges for the Indian banking sector excluding foreign banksin India would be to the tune of about Rs.14,058 crores at theend of March 2007 and Rs.15,427 crores in March 2008.This requirement is estimated to be Rs.17,647 crores forMarch 2009 under the Basic Indicators Approach. Of thisrequirement, approximately 80% would be needed by thepublic sector banks. The empirical estimates reveal theintroduction of the Operational Risk capital charges that willhave the expected impact of lowering the Tier I capital, butthis decline would be marginal under the Basic IndicatorsApproach. Also, in 2007 and 2008 nearly 10 of the 19nationalized banks will have a Tier I capital above 7%. TheState Bank group, though, would show a fewer number ofassociate banks with a Tier I capital higher than 7% in 2008as compared to 2007. While the State Bank of India wouldcontinue to be in the range of 7%-9% of Tier I capital in both2007 and 2008, the only associate bank in the same rangewould be the State Bank of Saurashtra. All the three privatesector banks would have a Tier I capital higher than 7% afterthe introduction of the additional capital requirement forOperational Risk. Compared to the Basic IndicatorsApproach, under the Standardized Approach, the nationalizedbanks would be required to set aside, on an average, nearlyRs.14,000 crores and the State Bank group, on an average,would need around Rs.7500 crores and the requirement forthe private sector banks would be lower at around Rs. 6000,on an average, over 2007-08. Further, Tier I capital would belower for all bank groups under the Standardized Approachas compared to the Basic Indicators Approach. The alternateapproaches which use the cost to income and cost to assets
ratio for determining the Operational Risk capital chargesshow a markedly different picture for Tier I capital. Underthe BIA, there were no banks in the Tier I range below 5% in2007 and in 2008 only two nationalized banks i.e. Bank ofMaharashtra and UCO Bank were in this category - whereasthere are at least 3 nationalized banks and 2-3 associate banksof the State Bank group with a Tier I capital lower than 5%under the alternate approaches.
A comparison of the estimates of the impact of the additionalOperational Risk capital charges on the Tier I capital ofindividual banks across the different approaches indicates thatsome banks would continue to be good performers andmaintain a high level of Tier I capital (above 7%) viz. AndhraBank, Bank of Baroda, Corporation Bank, Oriental Bank ofCommerce, Punjab National Bank, State Bank of India(except under the cost to income approach). Canara Bankwould maintain a Tier I capital between 6%-7% under allapproaches while the estimates for Bank of Maharashtra,Central Bank of India, UCO Bank and State Bank of Mysoreshow a Tier I capital below 6% under all the three approaches.Among the three new private sector banks considered, AxisBank showed improved levels of Tier I capital under all thethree approaches in 2008 as compared to 2007, while HDFCBank and ICICI Bank continue to be well-capitalized. Thelow Tier I levels of some of the nationalized banks (not takinginto account the Operational Risk capital charge) has resultedin the government agreeing to infuse capital in UCO Bank,Central Bank of India and Vijaya Bank to the tune of Rs.38billion through investment in shares in February and forUnited Bank of India to the tune of Rs.800 crores in twotranches until March 2010. Apart from the measurement ofOperational Risk capital charges and their impact on Tier I,the paper has computed some preliminary estimates of thesensitivity of gross income of a bank to the income fromdifferent business lines. Sensitivity analysis will, thus, helpidentify the potential sources of Operational Risk for a bank.
Finally, the best approach to the appropriate pricing ofOperational Risk would be the Advanced ManagementApproach which requires a bank to review its history ofoperational loss events and create a database wherein everyloss event, the frequency of its occurrence, and the size ofthe loss is recorded. Such an approach could result indeveloping key risk indicators that could signal the occurrenceof a loss event and banks would have the discretion to usetheir own internal loss data and be encouraged to developsophisticated risk measurement and risk managementtechniques.

394 Operational Risk Measurement for the Indian Banking Sector: Alternative Measures
References
Basel Committee on Banking Supervision (2001) OperationalRisk (Supportive Document to the New Basel CapitalAccord)
International Convergence of Capital Measurements andCapital Standards: A Revised Framework(Comprehensive Version) (2006)
Bhatia, M., (2002) New Basel Accord: Operational RiskManagement - Emerging Frontiers for the Profession,Information System Control Journal, vol. 1
Bonsón, Enrique, Tomás Escobar and Franscisco Flores,(2007) Issues in Operational Risk, Financial Markets,Institutions and Instruments, 16, 4, pp.167-200
Gupta, V. and K. Srinivasan (2005) Basel II Accord: Impacton Indian Banks, ICRA Rating Feature
King, J.L., (2001) Operational Risk: Measurement andModelling, John Wiley and Sons, New York.
Mussa, Imad A., (2007) Operational Risk Management,Basingstoke, Hampshire: Palgrave Macmillan
Oesterreichische Nationalbank, (2006) Guidelines inOperational Risk Management, Vienna
Reserve Bank of India (2005) Draft Guidelines forImplementation of New Capital Adequacy Framework,Reserve Bank of India, Mumbai
Reports on Currency and Finance 2003-08 Volume lV,Mumbai: Reserve Bank of India (2008A)
Reports on Currency and Finance 2003-08 Volume V,Mumbai: Reserve Bank of India (2008B)
Basic Statistical Returns of Scheduled Commercial Banks(various issues)
Report on Trends and Progress in Banking in India (variousissues)
Statistical Tables Relating to Banks in India (various issues)
Saita, F., (2007) Value at Risk and Bank Capital Management:Risk-Adjusted Performance, Capital Management andCapital Allocation Decision Making, Academic Press,London.
Sundmacher M., (2004) Operational Risk Measurement inBanks: Arbitrage, Adjustments and Alternatives http://papers.ssrn.com (Working Paper Series)
Tripe D., (1998) Cost to Income Ratios in AustralasianBanking, Centre for Banking Studies, Massey University
Pricing Operational Risk, Centre for Banking Studies, MasseyUniversity (2000)

ANNEXURE I
LIST OF ABBREVIATIONS
Abbreviation Bank Name
ALLA Allahabad Bank
ANDHRA Andhra Bank
BoB Bank of Baroda
BoI Bank of India
BoM Bank of Maharashtra
CANARA Canara Bank
CENTRAL Central Bank of India
CORP Corporation Bank
DENA Dena Bank
INDIAN Indian Bank
IOB Indian Overseas Bank
ORIENTAL Oriental Bank of Commerce
PSB Punjab and Sind Bank
PNB Punjab National Bank
SYND Syndicate Bank
UCO UCO Bank
UNION Union Bank
UNITED United Bank of India
VIJAYA Vijaya Bank
SBI State Bank of India
SBBJ State Bank of Bikaner and Jaipur
SBH State Bank of Hyderabad
SB-IND State Bank of Indore
SBM State Bank of Mysore
SBP State Bank of Patiala
SBS State Bank of Saurashtra
SBT State Bank of Travancore
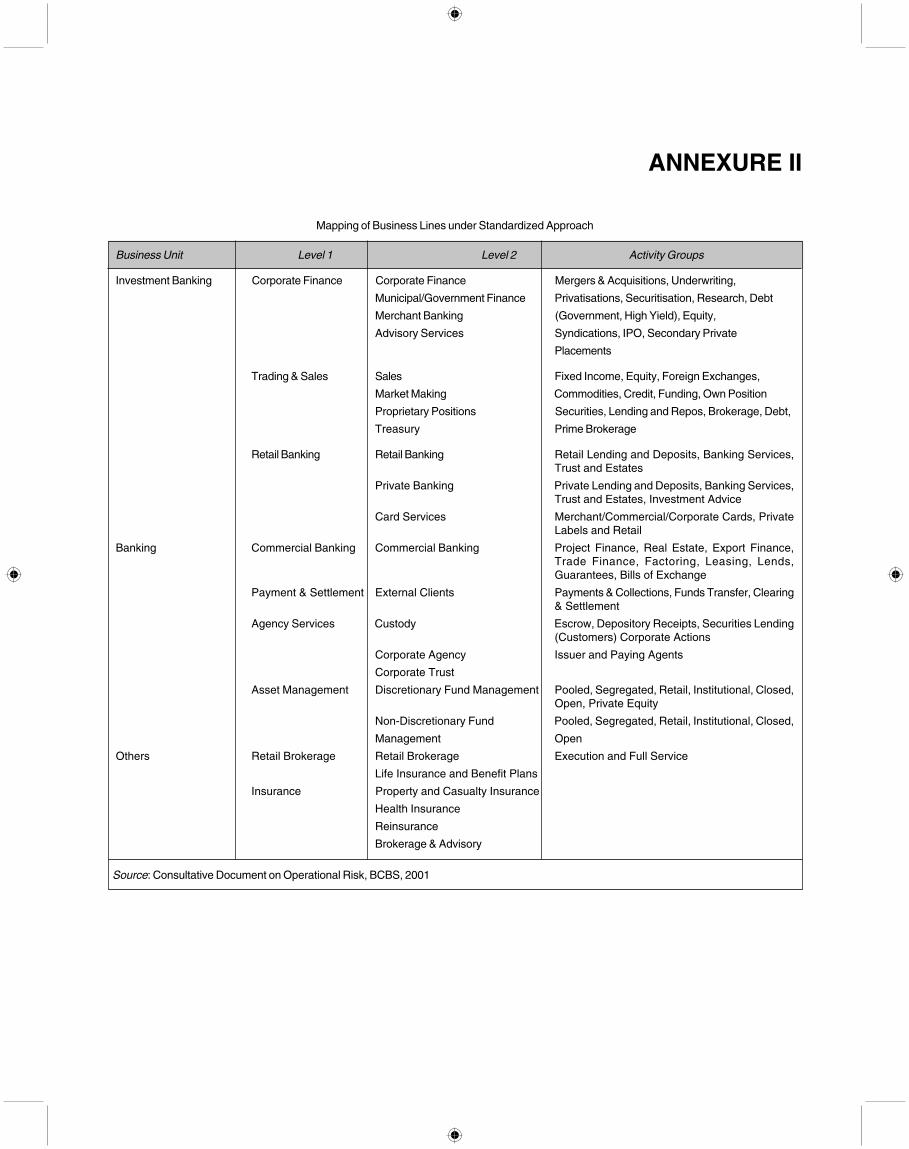
ANNEXURE II
Mapping of Business Lines under Standardized Approach
Business Unit Level 1 Level 2 Activity Groups
Investment Banking Corporate Finance Corporate Finance Mergers & Acquisitions, Underwriting,
Municipal/Government Finance Privatisations, Securitisation, Research, Debt
Merchant Banking (Government, High Yield), Equity,
Advisory Services Syndications, IPO, Secondary Private
Placements
Trading & Sales Sales Fixed Income, Equity, Foreign Exchanges,
Market Making Commodities, Credit, Funding, Own Position
Proprietary Positions Securities, Lending and Repos, Brokerage, Debt,
Treasury Prime Brokerage
Retail Banking Retail Banking Retail Lending and Deposits, Banking Services,Trust and Estates
Private Banking Private Lending and Deposits, Banking Services,Trust and Estates, Investment Advice
Card Services Merchant/Commercial/Corporate Cards, PrivateLabels and Retail
Banking Commercial Banking Commercial Banking Project Finance, Real Estate, Export Finance,Trade Finance, Factoring, Leasing, Lends,Guarantees, Bills of Exchange
Payment & Settlement External Clients Payments & Collections, Funds Transfer, Clearing& Settlement
Agency Services Custody Escrow, Depository Receipts, Securities Lending(Customers) Corporate Actions
Corporate Agency Issuer and Paying Agents
Corporate Trust
Asset Management Discretionary Fund Management Pooled, Segregated, Retail, Institutional, Closed,Open, Private Equity
Non-Discretionary Fund Pooled, Segregated, Retail, Institutional, Closed,
Management Open
Others Retail Brokerage Retail Brokerage Execution and Full Service
Life Insurance and Benefit Plans
Insurance Property and Casualty Insurance
Health Insurance
Reinsurance
Brokerage & Advisory
Source: Consultative Document on Operational Risk, BCBS, 2001

ANNEXURE III
Basic Indicators Approach
Bank-wise Operational Risk Capital Charge and Impact on Tier I Capital –
(Nationalized Banks, State Bank Group & Axis Bank, HDFC Bank & ICICI Bank)
Year Gross Income Annual Capital Capital Charge Networth Current Tier Estimated Tier I
(Rs. Crore) Required (Rs. Crore) (Rs. Crore) (Rs. Crore) I (%) Capital (%)
Allahabad Bank
2002 1116 167 1002 6.22
2003 1433 215 1190 6.35
2004 1836 275 1552 6.26
2005 2004 301 219 2328 6.46 5.85
2006 2059 309 264 3639 9.53 8.84
2007 2127 319 295 4477 8.10 7.57
2008 2637 396 310 5221 7.75 7.29
2009 341
Andhra Bank
2002 880 132 884 8.80
2003 1357 204 1116 8.19
2004 1588 238 1453 8.17
2005 1822 273 191 1837 8.03 7.19
2006 1561 234 238 2894 12.20 11.20
2007 1864 280 249 3156 9.98 9.19
2008 2001 300 262 3249 8.54 7.85
2009 271
Bank of Baroda
2002 2873 431 3827 7.56
2003 3366 505 4387 8.10
2004 4291 644 5131 8.47
2005 4284 643 527 5628 8.21 7.44
2006 4301 645 597 7845 10.98 10.14
2007 4959 744 644 8650 8.74 8.09
2008 5962 894 677 11044 7.63 7.16
2009 761
Bank of India
2002 2943 441 2845 6.37
2003 3678 552 3541 7.56
2004 3994 599 4010 7.47
2005 3393 509 531 4465 7.05 6.21
2006 3816 572 553 4984 6.75 6.00
2007 5003 750 560 5895 6.54 5.92
2008 6346 952 611 10589 7.70 7.26
2009 758
Table contd...

398 Operational Risk Measurement for the Indian Banking Sector: Alternative Measures
Bank of Maharashtra
2002 895 134 698 6.56
2003 1037 156 981 5.88
2004 1236 185 1436 7.03
2005 1267 190 158 1543 7.10 6.37
2006 1023 153 177 1573 7.47 6.63
2007 1359 204 176 1742 6.03 5.42
2008 1509 226 182 1782 5.13 4.60
2009 195
Canara Bank
2002 3250 488 3472 8.07
2003 3745 562 4149 7.85
2004 4755 713 5252 7.81
2005 4694 704 588 6109 7.29 6.59
2006 4898 735 660 7132 7.81 7.09
2007 5478 822 717 10354 7.17 6.67
2008 5751 863 754 10500 7.01 6.51
2009 806
Central Bank of India
2002 2135 320 1997 5.20
2003 2451 368 2424 5.66
2004 3086 463 2974 6.23
2005 3294 494 384 3265 6.08 5.37
2006 2911 437 442 3442 7.19 6.27
2007 2950 443 465 3790 6.32 5.55
2008 3014 452 458 5943 5.42 5.00
2009 444
Corporation Bank
2002 1008 151 2046 16.80
2003 1325 199 2370 17.30
2004 1481 222 2768 16.52
2005 1695 254 191 3054 13.55 12.70
2006 1700 255 225 3374 12.41 11.58
2007 1944 292 244 3765 11.30 10.57
2008 2144 322 267 4228 9.64 9.03
2009 289
Dena Bank
2002 795 119 977 4.36
2003 1005 151 999 5.31
2004 1209 181 1055 5.19
2005 997 150 150 1104 6.63 5.73
2006 1162 174 161 1339 5.96 5.25
2007 1248 187 168 1497 6.06 5.38
2008 1337 201 170 1801 6.75 6.11
2009 187
Table contd...

Indian Bank
2002 1033 155 4185 0.85
2003 1345 202 5130 7.51
2004 1864 280 5538 7.66
2005 1873 281 212 5936 7.60 7.33
2006 1974 296 254 2492 10.29 9.24
2007 2605 391 286 3841 12.28 11.37
2008 3060 459 323 5211 11.41 10.70
2009 382
Indian Overseas Bank
2002 1501 225 1133 6.17
2003 1742 261 1460 5.83
2004 2340 351 2081 6.74
2005 2654 398 279 2575 7.10 6.33
2006 2608 391 337 3178 8.54 7.63
2007 2948 442 380 3991 8.20 7.42
2008 3487 523 411 4857 7.86 7.20
2009 452
Oriental Bank of Commerce
2002 1446 217 1621 8.89
2003 1746 262 2110 10.72
2004 2178 327 2677 9.87
2005 2029 304 269 3327 5.42 4.98
2006 2158 324 298 5171 10.37 9.77
2007 2294 344 318 5601 10.05 9.48
2008 2299 345 324 5776 9.34 8.82
2009 338
Punjab & Sind Bank
2002 545 82 502 6.37
2003 693 104 489 6.11
2004 749 112 467 6.38
2005 829 124 99 440 5.26 4.07
2006 751 113 114 1222 10.05 9.12
2007 995 149 116 1406 9.58 8.79
2008 1103 165 129 2093 8.04 7.55
2009 142
Punjab National Bank
2002 3273 491 3381 6.34
2003 4374 656 4033 7.11
2004 5492 824 5012 7.01
2005 5683 852 657 8161 8.87 8.16
2006 5941 891 777 9376 10.06 9.23
2007 6556 983 856 10435 8.93 8.20
2008 7532 1130 909 12318 8.52 7.89
2009 1001
Table contd...
Annexure III 399

400 Operational Risk Measurement for the Indian Banking Sector: Alternative Measures
Syndicate Bank
2002 1383 207 1683 8.47
2003 1705 256 1614 7.69
2004 2205 331 1905 6.75
2005 2284 343 265 2199 6.10 5.37
2006 2442 366 310 2834 7.40 6.59
2007 2768 415 347 3623 6.24 5.64
2008 2962 444 375 4291 6.62 6.04
2009 409
UCO Bank
2002 1313 197 2762 4.89
2003 1491 224 1214 5.19
2004 1819 273 1783 6.08
2005 1925 289 231 2069 5.75 5.11
2006 1940 291 262 2462 6.09 5.44
2007 2138 321 284 2662 5.78 5.16
2008 2260 339 300 2926 5.05 4.53
2009 317
Union Bank of India
2002 1836 275 2107 6.16
2003 2323 348 2607 6.86
2004 2567 385 3087 6.47
2005 2831 425 336 3614 6.07 5.51
2006 2869 430 386 4558 7.32 6.70
2007 3477 522 413 5190 7.79 7.17
2008 4173 626 459 7348 7.45 6.98
2009 526
United Bank of India
2002 996 149 1964 8.84
2003 1147 172 1962 12.63
2004 1286 193 1960 15.04
2005 1393 209 171 1957 14.15 12.91
2006 1457 219 191 1828 10.01 8.96
2007 1498 225 207 2415 7.72 7.06
2008 1370 206 217 2661 6.74 6.19
2009 216
Vijaya Bank
2002 674 101 781 8.86
2003 990 149 962 7.42
2004 1364 205 1336 8.37
2005 1338 201 151 1590 7.59 6.87
2006 1257 189 185 1670 9.26 8.24
2007 1347 202 198 1897 7.07 6.33
2008 1362 204 197 2460 5.73 5.27
2009 198
Table contd...

State Bank of India
2002 13255 1988 15224 9.22
2003 15718 2358 17203 8.81
2004 18798 2820 20231 8.34
2005 8515 1277 2389 24072 8.04 7.24
2006 8994 1349 2152 27644 9.36 8.63
2007 21823 3273 1815 31298 8.01 7.55
2008 25716 3857 1967 49032 8.48 8.14
2009 2827
State Bank of Bikaner & Jaipur
2002 791 119 752 9.22
2003 891 134 903 8.81
2004 1208 181 1149 8.34
2005 1352 203 145 1298 8.04 7.14
2006 1241 186 173 1406 9.36 8.21
2007 1432 215 190 1654 8.01 7.09
2008 1411 212 201 1713 6.95 6.13
2009 204
State Bank of Hyderabad
2002 1014 152 998 9.86
2003 1209 181 1251 9.84
2004 1548 232 1574 8.42
2005 1384 208 189 1765 7.58 6.77
2006 1553 233 207 2114 8.95 8.07
2007 1811 272 224 2541 8.25 7.52
2008 1790 269 237 2694 7.24 6.60
2009 258 1317 7.01 5.64
State Bank of Indore
2002 567 85 413 8.15
2003 669 100 584 9.40
2004 814 122 791 8.31
2005 680 102 103 904 6.67 5.91
2006 787 118 108 1018 7.55 6.75
2007 800 120 114 1177 6.74 6.09
2008 883 132 113 1317 7.01 6.41
2009 124
State Bank of Mysore
2002 548 82 352 6.70
2003 680 102 431 7.23
2004 794 119 582 7.18
2005 931 140 101 756 7.12 6.17
2006 948 142 120 935 7.44 6.48
2007 1034 155 134 1141 6.62 5.84
2008 1184 178 146 1378 6.54 5.85
2009 158
Table contd...
Annexure III 401

402 Operational Risk Measurement for the Indian Banking Sector: Alternative Measures
Table contd...
State Bank of Patiala
2002 921 138 1142 9.97
2003 1135 170 1412 10.39
2004 1452 218 1731 9.87
2005 1332 200 175 2045 11.05 10.10
2006 1344 202 196 2235 9.96 9.09
2007 1447 217 206 2488 8.36 7.67
2008 1486 223 206 2459 6.74 6.17
2009 214
State Bank of Saurashtra
2002 453 68 568 12.11
2003 534 80 625 11.66
2004 710 107 767 10.99
2005 641 96 85 794 8.68 7.75
2006 584 88 94 977 9.02 8.15
2007 575 86 97 1043 8.17 7.41
2008 571 86 90 1145 8.06 7.43
2009 87
State Bank of Travancore
2002 655 98 618 7.79
2003 822 123 731 6.80
2004 1153 173 925 6.23
2005 1305 196 132 1130 6.17 5.45
2006 1307 196 164 1332 7.24 6.35
2007 1356 203 188 1599 7.55 6.66
2008 1446 217 198 1718 6.94 6.14
2009 205
Axis Bank
2002 616 92 694 6.42
2003 733 110 1040 6.44
2004 1106 166 1138 6.44
2005 1147 172 123 2422 8.87 8.42
2006 1808 271 149 2886 7.26 6.88
2007 2577 387 203 3403 6.42 6.04
2008 4381 657 277 8769 10.17 9.85
2009 438
HDFC Bank
2002 962 144 2132 10.81
2003 1304 196 2608 9.49
2004 1818 273 2694 8.03
2005 2428 364 204 4520 9.60 9.17
2006 3669 550 278 5299 8.55 8.10
2007 5226 784 396 6433 8.57 8.04
2008 7511 1127 566 11497 10.30 9.79
2009 820

ICICI Bank
2002 1168 175 6618 7.47
2003 4583 687 7289 7.05
2004 4944 742 8360 6.09
2005 6255 938 535 12900 7.59 7.28
2006 8890 1334 789 22556 9.20 8.88
2007 12565 1885 1004 24663 7.42 7.12
2008 16115 2417 1386 46821 11.32 10.99
2009 1879
Note: Net worth of a bank is computed as per the ReserveBank of India’s definition which is as follows: Net worthwould comprise of Paid-up capital plus Free Reservesincluding Share Premium but excluding RevaluationReserves, plus Investment Fluctuation Reserve and creditbalance in Profit & Loss account, less debit balance in Profitand Loss account, Accumulated Losses and Intangible Assets.No general or specific provisions should be included incomputation of net worth. Infusion of capital through equityshares, either through domestic issues or overseas floats after
the published balance sheet date, may also be taken intoaccount for determining the ceiling on exposure to capitalmarket.
(i) Gross Income = Net Interest Income + Non-InterestIncome
(ii) Impact on Tier I capital = capital charge/networth(iii) Estimated Tier I = (1-impact on Tier I capital)* current
Tier I
These definitions are adopted in all relevant calculations.
Annexure III 403

ANNEXURE IV
Cost-Asset Ratio
Bank-Wise Operational Risk Capital Charge and Impact on Tier I Capital –
(Nationalized Banks, State Bank Group & Axis Bank, HDFC Bank & ICICI Bank)
Year Cost-Asset Average Three Total Capital Networth Current EstimatedRatio (%) PSB (%) standard Assets Charge (Rs. Crore) Tier I (%) Tier I
deviations (%) (Rs. Crore) (Rs. Crore) Capital (%)
Allahabad Bank
2005 2.37 2.09 2.53 45145 1142 2328 6.46 3.29
2006 1.87 2.05 1.36 55292 754 3639 9.53 7.56
2007 1.52 1.77 0.88 67664 598 4477 8.10 7.02
2008 1.4 1.54 0.72 82940 595 5221 7.75 6.87
Andhra Bank
2005 2.53 2.09 1.13 3273 37 1837 8.03 7.87
2006 2.11 2.05 1.06 4067 43 2894 12.20 12.02
2007 1.96 1.77 1.02 47541 487 3156 9.98 8.44
2008 1.67 1.54 0.50 56592 286 3249 8.54 7.79
Bank of Baroda
2005 2.09 2.09 0.27 94664 256 5628 8.21 7.84
2006 2.1 2.05 0.22 113393 248 7845 10.98 10.63
2007 1.78 1.77 0.11 143146 155 8650 8.74 8.58
2008 1.63 1.54 0.22 179600 394 11044 7.63 7.36
Bank of India
2005 2.03 2.09 0.39 94978 373 4465 7.05 6.46
2006 1.88 2.05 0.50 112274 559 4984 6.75 5.99
2007 1.84 1.77 0.41 141637 581 5895 6.54 5.90
2008 1.48 1.54 0.41 178830 734 10589 7.70 7.17
Bank of Maharashtra
2005 2.19 2.09 1.09 32885 358 1543 7.10 5.45
2006 2.11 2.05 1.03 31215 321 1573 7.47 5.95
2007 1.91 1.77 0.39 39009 151 1742 6.03 5.51
2008 1.74 1.54 0.53 48151 257 1782 5.13 4.39
Canara Bank
2005 1.91 2.09 0.78 110305 865 6109 7.29 6.26
2006 1.77 2.05 0.95 132822 1263 7132 7.81 6.43
2007 1.55 1.77 0.85 165961 1405 10354 7.17 6.20
2008 1.55 1.54 0.76 180529 1364 10500 7.01 6.10
Central Bank of India
2005 2.46 2.09 1.30 68596 892 3265 6.08 4.42
2006 2.3 2.05 1.09 74681 811 3442 7.19 5.50
2007 1.81 1.77 0.95 93008 885 3790 6.32 4.84
2008 1.41 1.54 0.60 123956 748 5943 5.42 4.74
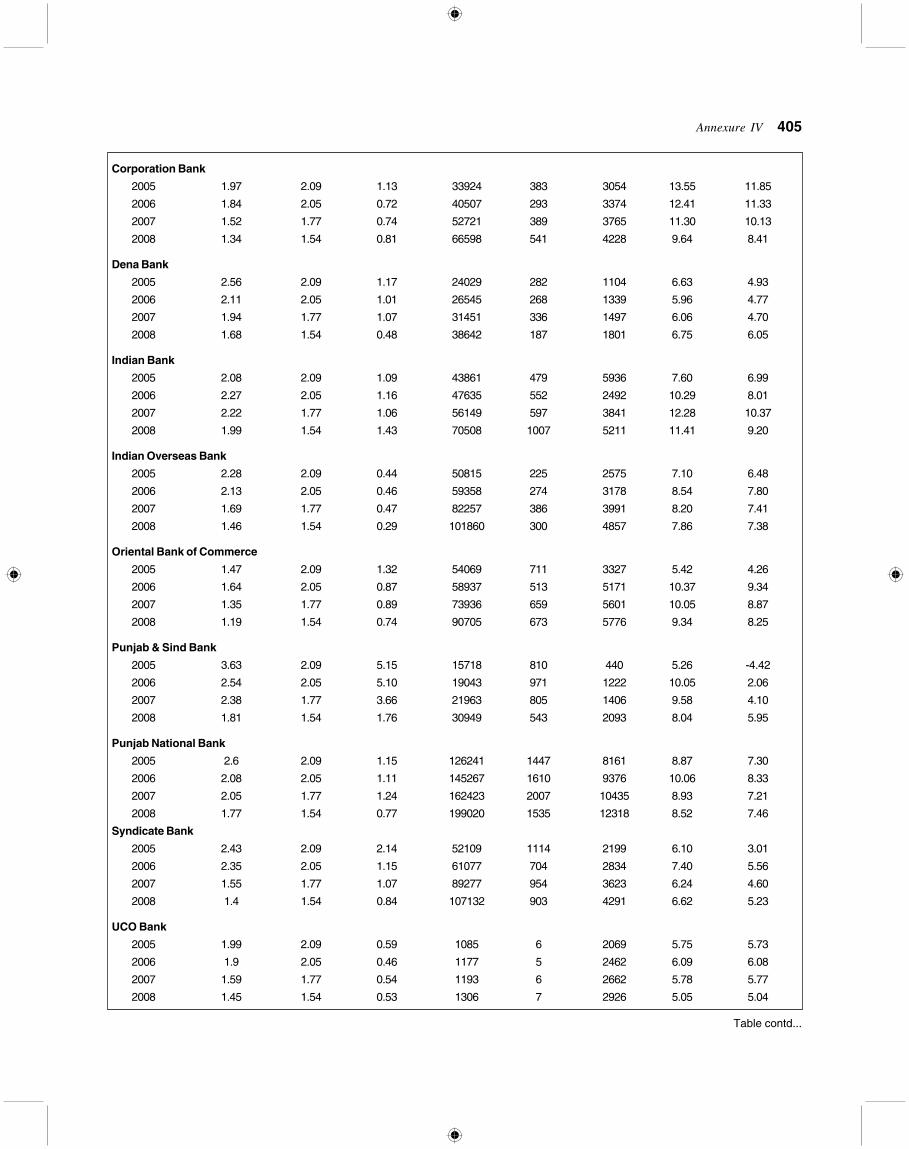
Corporation Bank
2005 1.97 2.09 1.13 33924 383 3054 13.55 11.85
2006 1.84 2.05 0.72 40507 293 3374 12.41 11.33
2007 1.52 1.77 0.74 52721 389 3765 11.30 10.13
2008 1.34 1.54 0.81 66598 541 4228 9.64 8.41
Dena Bank
2005 2.56 2.09 1.17 24029 282 1104 6.63 4.93
2006 2.11 2.05 1.01 26545 268 1339 5.96 4.77
2007 1.94 1.77 1.07 31451 336 1497 6.06 4.70
2008 1.68 1.54 0.48 38642 187 1801 6.75 6.05
Indian Bank
2005 2.08 2.09 1.09 43861 479 5936 7.60 6.99
2006 2.27 2.05 1.16 47635 552 2492 10.29 8.01
2007 2.22 1.77 1.06 56149 597 3841 12.28 10.37
2008 1.99 1.54 1.43 70508 1007 5211 11.41 9.20
Indian Overseas Bank
2005 2.28 2.09 0.44 50815 225 2575 7.10 6.48
2006 2.13 2.05 0.46 59358 274 3178 8.54 7.80
2007 1.69 1.77 0.47 82257 386 3991 8.20 7.41
2008 1.46 1.54 0.29 101860 300 4857 7.86 7.38
Oriental Bank of Commerce
2005 1.47 2.09 1.32 54069 711 3327 5.42 4.26
2006 1.64 2.05 0.87 58937 513 5171 10.37 9.34
2007 1.35 1.77 0.89 73936 659 5601 10.05 8.87
2008 1.19 1.54 0.74 90705 673 5776 9.34 8.25
Punjab & Sind Bank
2005 3.63 2.09 5.15 15718 810 440 5.26 -4.42
2006 2.54 2.05 5.10 19043 971 1222 10.05 2.06
2007 2.38 1.77 3.66 21963 805 1406 9.58 4.10
2008 1.81 1.54 1.76 30949 543 2093 8.04 5.95
Punjab National Bank
2005 2.6 2.09 1.15 126241 1447 8161 8.87 7.30
2006 2.08 2.05 1.11 145267 1610 9376 10.06 8.33
2007 2.05 1.77 1.24 162423 2007 10435 8.93 7.21
2008 1.77 1.54 0.77 199020 1535 12318 8.52 7.46
Syndicate Bank
2005 2.43 2.09 2.14 52109 1114 2199 6.10 3.01
2006 2.35 2.05 1.15 61077 704 2834 7.40 5.56
2007 1.55 1.77 1.07 89277 954 3623 6.24 4.60
2008 1.4 1.54 0.84 107132 903 4291 6.62 5.23
UCO Bank
2005 1.99 2.09 0.59 1085 6 2069 5.75 5.73
2006 1.9 2.05 0.46 1177 5 2462 6.09 6.08
2007 1.59 1.77 0.54 1193 6 2662 5.78 5.77
2008 1.45 1.54 0.53 1306 7 2926 5.05 5.04
Table contd...
Annexure IV 405

406 Operational Risk Measurement for the Indian Banking Sector: Alternative Measures
Union Bank
2005 1.74 2.09 1.19 72413 859 3614 6.07 4.63
2006 1.57 2.05 1.46 89126 1304 4558 7.32 5.23
2007 1.44 1.77 1.44 102678 1480 5190 7.79 5.57
2008 1.28 1.54 1.35 124073 1679 7348 7.45 5.75
United Bank of India
2005 2.42 2.09 1.16 29098 336 1957 14.15 11.72
2006 2.45 2.05 1.38 33248 458 1828 10.01 7.50
2007 1.84 1.77 1.11 42310 470 2415 7.72 6.22
2008 1.66 1.54 0.90 54311 488 2661 6.74 5.50
Vijaya Bank
2005 1.84 2.09 1.55 2934 45 1590 7.59 7.37
2006 1.98 2.05 0.63 3153 20 1670 9.26 9.15
2007 1.54 1.77 0.74 42357 312 1897 7.07 5.91
2008 1.25 1.54 0.80 56184 449 2460 5.73 4.68
State Bank of India
2005 2.19 2.09 0.39 459883 1778 24072 8.04 7.45
2006 2.37 2.05 0.72 494029 3569 27644 9.36 8.15
2007 2.09 1.77 0.98 566565 5570 31298 8.01 6.58
2008 1.75 1.54 1.06 721526 7636 49032 8.48 7.16
State Bank of Bikaner & Jaipur
2005 2.66 2.09 1.58 23430 370 1298 8.04 5.75
2006 2.76 2.05 2.12 27514 583 1406 9.36 5.48
2007 2.18 1.77 2.12 34507 731 1654 8.01 4.47
2008 1.82 1.54 1.84 41154 756 1713 6.95 3.88
State Bank of Hyderabad
2005 1.92 2.09 1.53 34922 534 1765 7.58 5.29
2006 2.01 2.05 1.06 40630 432 2114 8.95 7.12
2007 1.65 1.77 0.45 49052 220 2541 8.25 7.53
2008 1.3 1.54 0.58 61620 355 2694 7.24 6.29
State Bank of Indore
2005 1.94 2.09 0.37 16898 62 904 6.67 6.21
2006 1.92 2.05 0.43 20711 90 1018 7.55 6.88
2007 1.67 1.77 0.47 24527 116 1177 6.74 6.08
2008 1.47 1.54 0.38 29275 111 1317 7.01 6.42
State Bank of Mysore
2005 2.89 2.09 2.40 16553 397 756 7.12 3.38
2006 2.63 2.05 2.33 19337 451 935 7.44 3.85
2007 2.09 1.77 2.20 26843 591 1141 6.62 3.19
2008 1.87 1.54 1.57 33070 519 1378 6.54 4.08
State Bank of Patiala
2005 1.52 2.09 1.86 31503 586 2045 11.05 7.88
2006 1.48 2.05 2.06 41233 849 2235 9.96 6.18
2007 1.39 1.77 1.89 47461 897 2488 8.36 5.35
2008 1.2 1.54 1.62 59060 958 2459 6.74 4.11
Table contd...

State Bank of Saurashtra
2005 1.69 2.09 0.98 15053 148 794 8.68 7.06
2006 1.87 2.05 1.03 16530 171 977 9.02 7.45
2007 1.73 1.77 0.93 18847 176 1043 8.17 6.79
2008 1.84 1.54 0.75 21358 160 1145 8.06 6.94
State Bank of Travancore
2005 1.74 2.09 1.23 28875 354 1130 6.17 4.24
2006 1.98 2.05 1.03 31862 329 1332 7.24 5.45
2007 1.7 1.77 0.77 37993 293 1599 7.55 6.17
2008 1.56 1.54 0.21 44111 95 1718 6.94 6.56
NEW PRIVATE SECTOR BANKS
Axis Bank
2005 1.54 2.18 1.59 37744 377 2422 8.87 7.49
2006 1.64 2.41 1.94 49731 497 2886 7.26 6.01
2007 1.66 2.33 2.09 73257 733 3403 6.42 5.04
2008 1.97 1.97 1.77 109578 1096 8769 10.17 8.90
HDFC Bank
2005 2.11 2.18 0.81 51429 417 4520 9.60 8.71
2006 2.3 2.41 0.75 73506 553 5299 8.55 7.66
2007 2.65 2.33 0.73 91236 669 6433 8.57 7.68
2008 2.81 1.97 1.92 133177 2558 11497 10.30 8.01
ICICI Bank
2005 1.97 2.18 0.74 167659 1233 12900 7.59 6.86
2006 1.99 2.41 1.07 251389 2701 22556 9.20 8.10
2007 1.94 2.33 1.29 344658 4463 24663 7.42 6.08
2008 2.04 1.97 1.22 399795 4897 46821 11.32 10.14
Annexure IV 407

ANNEXURE V
Cost-Income Ratio
Bank-Wise Operational Risk Capital Charge and Impact on Tier I Capital –
(Nationalized Banks, State Bank Group & Axis Bank, HDFC Bank & ICICI Bank)
Year Cost-income Average Three Gross Capital Networth Current EstimatedRatio (%) PSB (%) standard Income Charge (Rs. Crore) Tier I (%) Tier I
deviations (Rs. Crore) (Rs. Crore) Capital (%)(decimal)
Allahabad Bank
2005 53.39 48.46 0.37 2004 735 2328 6.46 4.42
2006 50.30 51.94 0.19 2059 382 3639 9.53 8.53
2007 48.30 51.08 0.13 2127 266 4477 8.10 7.62
2008 43.90 48.32 0.12 2637 306 5221 7.75 7.30
Andhra Bank
2005 45.50 48.46 0.14 1822 259 1837 8.03 6.90
2006 54.96 51.94 0.12 1561 187 2894 12.20 11.41
2007 50.05 51.08 0.09 1864 172 3156 9.98 9.44
2008 47.18 48.32 0.07 2001 144 3249 8.54 8.16
Bank of Baroda
2005 46.27 48.46 0.08 4284 347 5628 8.21 7.70
2006 55.45 51.94 0.11 4301 473 7845 10.98 10.32
2007 51.30 51.08 0.09 4959 436 8650 8.74 8.30
2008 49.21 48.32 0.08 5962 459 11044 7.63 7.31
Bank of India
2005 56.94 48.46 0.20 3393 689 4465 7.05 5.96
2006 55.42 51.94 0.20 3816 750 4984 6.75 5.73
2007 52.13 51.08 0.20 5003 980 5895 6.54 5.45
2008 41.68 48.32 0.16 6346 1019 10589 7.70 6.96
Bank of Maharashtra
2005 56.83 48.46 0.18 1267 226 1543 7.10 6.06
2006 64.42 51.94 0.32 1023 326 1573 7.47 5.92
2007 54.89 51.08 0.33 1359 447 1742 6.03 4.48
2008 55.40 48.32 0.31 1509 475 1782 5.13 3.76
Canara Bank
2005 44.93 48.46 0.14 4694 677 6109 7.29 6.48
2006 47.92 51.94 0.16 4898 782 7132 7.81 6.95
2007 46.82 51.08 0.15 5478 794 10354 7.17 6.62
2008 48.53 48.32 0.12 5751 715 10500 7.01 6.53
Central Bank of India
2005 14.57 48.46 0.78 3294 2569 3265 6.08 1.30
2006 22.32 51.94 0.96 2911 2799 3442 7.19 1.34
2007 57.08 51.08 0.96 2950 2842 3790 6.32 1.58
2008 57.93 48.32 0.67 3014 2028 5943 5.42 3.57

Corporation Bank
2005 39.35 48.46 0.37 1695 630 3054 13.55 10.75
2006 43.94 51.94 0.29 1700 495 3374 12.41 10.59
2007 41.36 51.08 0.33 1944 641 3765 11.30 9.38
2008 41.60 48.32 0.30 2144 649 4228 9.64 8.16
Dena Bank
2005 61.79 48.46 0.30 997 296 1104 6.63 4.85
2006 48.28 51.94 0.30 1162 354 1339 5.96 4.38
2007 49.04 51.08 0.30 1248 370 1497 6.06 4.56
2008 48.62 48.32 0.09 1337 119 1801 6.75 6.30
Indian Bank
2005 48.80 48.46 0.29 1873 546 5936 7.60 6.90
2006 54.71 51.94 0.26 1974 507 2492 10.29 8.20
2007 47.87 51.08 0.09 2605 235 3841 12.28 11.53
2008 45.75 48.32 0.11 3060 322 5211 11.41 10.71
Indian Overseas Bank
2005 43.65 48.46 0.16 2654 415 2575 7.10 5.95
2006 48.39 51.94 0.13 2608 345 3178 8.54 7.61
2007 47.08 51.08 0.15 2948 449 3991 8.20 7.28
2008 42.59 48.32 0.17 3487 580 4857 7.86 6.92
Oriental Bank of Commerce
2005 39.23 48.46 0.51 2029 1032 3327 5.42 3.74
2006 44.76 51.94 0.41 2158 893 5171 10.37 8.58
2007 43.50 51.08 0.30 2294 678 5601 10.05 8.83
2008 46.98 48.32 0.22 2299 513 5776 9.34 8.51
Punjab & Sind Bank
2005 68.88 48.46 0.89 829 735 440 5.26 -3.53
2006 64.31 51.94 0.90 751 674 1222 10.05 4.51
2007 52.56 51.08 0.51 995 505 1406 9.58 6.14
2008 50.86 48.32 0.27 1103 298 2093 8.04 6.90
Punjab National Bank
2005 57.68 48.46 0.20 5683 1165 8161 8.87 7.60
2006 50.88 51.94 0.20 5941 1197 9376 10.06 8.78
2007 50.73 51.08 0.20 6556 1292 10435 8.93 7.82
2008 46.81 48.32 0.04 7532 299 12318 8.52 8.31
Syndicate Bank
2005 55.34 48.46 0.37 2284 854 2199 6.10 3.73
2006 58.76 51.94 0.25 2442 620 2834 7.40 5.78
2007 50.07 51.08 0.21 2768 572 3623 6.24 5.25
2008 50.47 48.32 0.15 2962 454 4291 6.62 5.92
UCO Bank
2005 56.36 48.46 0.26 1925 504 2069 5.75 4.35
2006 60.67 51.94 0.26 1940 497 2462 6.09 4.86
2007 55.80 51.08 0.27 2138 576 2662 5.78 4.53
2008 57.79 48.32 0.29 2260 658 2926 5.05 3.91
Table contd...
Annexure V 409

410 Operational Risk Measurement for the Indian Banking Sector: Alternative Measures
Union Bank
2005 44.40 48.46 0.15 2831 435 3614 6.07 5.34
2006 48.87 51.94 0.12 2869 357 4558 7.32 6.75
2007 42.45 51.08 0.21 3477 739 5190 7.79 6.68
2008 38.17 48.32 0.29 4173 1210 7348 7.45 6.22
United Bank of India
2005 50.54 48.46 0.17 1393 232 1957 14.15 12.47
2006 55.87 51.94 0.18 1457 260 1828 10.01 8.59
2007 51.94 51.08 0.10 1498 144 2415 7.72 7.26
2008 65.91 48.32 0.38 1370 525 2661 6.74 5.41
Vijaya Bank
2005 40.21 48.46 0.30 1338 396 1590 7.59 5.70
2006 49.64 51.94 0.26 1257 325 1670 9.26 7.46
2007 48.33 51.08 0.19 1347 257 1897 7.07 6.11
2008 51.47 48.32 0.10 1362 138 2460 5.73 5.41
State Bank of India
2005 26.72 48.46 0.47 8515 4000 24072 8.04 6.70
2006 28.34 51.94 0.69 8994 6169 27644 9.36 7.27
2007 54.18 51.08 0.68 21823 14923 31298 8.01 4.19
2008 49.03 48.32 0.51 25716 12992 49032 8.48 6.23
State Bank of Bikaner & Jaipur
2005 46.01 48.46 0.07 1352 93 1298 8.04 7.46
2006 61.24 51.94 0.21 1241 257 1406 9.36 7.65
2007 52.58 51.08 0.21 1432 296 1654 8.01 6.58
2008 53.15 48.32 0.22 1411 317 1713 6.95 5.66
State Bank of Hyderabad
2005 48.48 48.46 0.34 1384 465 1765 7.58 5.58
2006 52.54 51.94 0.23 1553 351 2114 8.95 7.47
2007 44.62 51.08 0.14 1811 249 2541 8.25 7.44
2008 44.64 48.32 0.16 1790 283 2694 7.24 6.48
State Bank of Indore
2005 48.24 48.46 0.34 680 230 904 6.67 4.97
2006 50.44 51.94 0.23 787 178 1018 7.55 6.23
2007 51.25 51.08 0.03 800 26 1177 6.74 6.59
2008 48.81 48.32 0.03 883 30 1317 7.01 6.85
State Bank of Mysore
2005 51.45 48.46 0.07 931 67 756 7.12 6.49
2006 53.69 51.94 0.08 948 75 935 7.44 6.84
2007 54.35 51.08 0.10 1034 105 1141 6.62 6.01
2008 52.11 48.32 0.11 1184 133 1378 6.54 5.91
State Bank of Patiala
2005 35.96 48.46 0.50 1332 671 2045 11.05 7.43
2006 45.54 51.94 0.42 1344 571 2235 9.96 7.42
2007 45.54 51.08 0.32 1447 463 2488 8.36 6.80
2008 47.58 48.32 0.18 1486 268 2459 6.74 6.01
Table contd...

State Bank of Saurashtra
2005 39.63 48.46 0.27 641 175 794 8.68 6.77
2006 52.74 51.94 0.27 584 156 977 9.02 7.58
2007 56.70 51.08 0.22 575 128 1043 8.17 7.17
2008 69.00 48.32 0.45 571 260 1145 8.06 6.23
State Bank of Travancore
2005 38.54 48.46 0.26 1305 342 1130 6.17 4.30
2006 48.36 51.94 0.26 1307 336 1332 7.24 5.41
2007 47.57 51.08 0.24 1356 320 1599 7.55 6.04
2008 47.51 48.32 0.11 1446 156 1718 6.94 6.31
NEW PRIVATE SECTOR BANKS
Axis Bank
2005 50.65 48.46 0.21 1147 241 2422 8.87 7.99
2006 45.02 51.94 0.30 1808 544 2886 7.26 5.89
2007 47.15 51.08 0.25 2577 634 3403 6.42 5.22
2008 49.19 48.32 0.24 4381 1073 8769 10.17 8.93
HDFC Bank
2005 44.69 48.46 0.19 2428 455 4520 9.60 8.63
2006 46.09 51.94 0.27 3669 988 5299 8.55 6.96
2007 46.33 51.08 0.29 5226 1515 6433 8.57 6.55
2008 49.87 48.32 0.23 7511 1740 11497 10.30 8.74
ICICI Bank
2005 52.74 48.46 0.10 6255 623 12900 7.59 7.22
2006 56.25 51.94 0.10 8890 881 22556 9.20 8.84
2007 53.25 51.08 0.03 12565 409 24663 7.42 7.30
2008 50.60 48.32 0.04 16115 571 46821 11.32 11.18
Annexure V 411
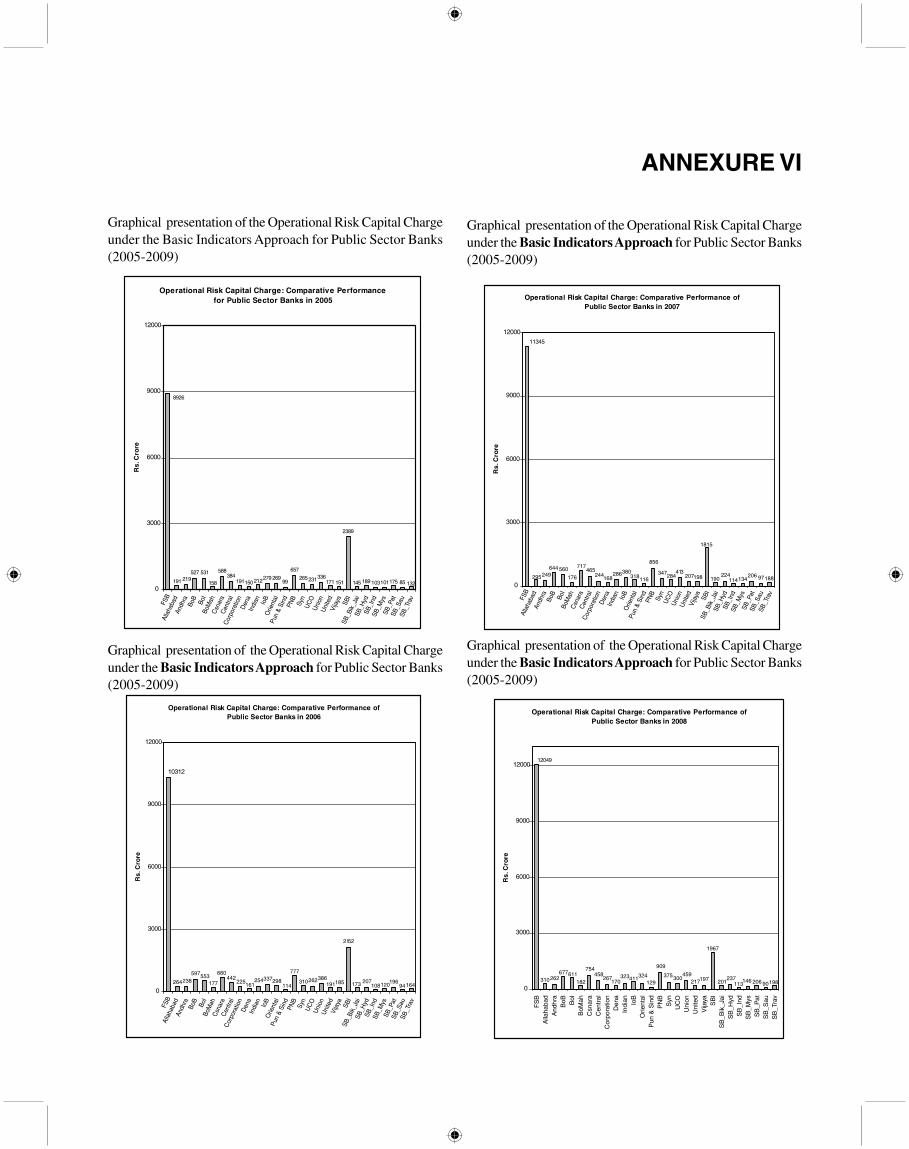
ANNEXURE VI
Graphical presentation of the Operational Risk Capital Chargeunder the Basic Indicators Approach for Public Sector Banks(2005-2009)
Operational Risk Capital Charge: Comparative Performance for Public Sector Banks in 2005
219527 531
158
588384
191191 150212279 26999
657
265231336171 151
2389
145 189 103101175 85 132
8926
0
3000
6000
9000
12000
Rs.
Cro
re
Alla
haba
dAn
dhra
BoB
BoI
BoM
ahC
snar
aC
entra
lC
orpo
ratio
nD
ena
Indi
an IoB
Orie
ntal
Pun
& Si
ndPN
BSy
nU
CO
Uni
onU
nite
dVi
jaya SB
ISB
_Bik
_Jai
SB_H
ydSB
_Ind
SB_M
ysSB
_Pat
SB_S
auSB
_Tra
v
FSB
Graphical presentation of the Operational Risk Capital Chargeunder the Basic Indicators Approach for Public Sector Banks(2005-2009)
Operational Risk Capital Charge: Comparative Performance of Public Sector Banks in 2006
264238597553
177
660442
225161
254337298114
777
310262386191185
2152
207173 108120196
164940
3000
6000
9000
12000
Rs.
Cro
re
10312
Alla
haba
dAn
dhra
BoB
BoI
BoM
ahC
snar
aC
entra
lC
orpo
ratio
nD
ena
Indi
an IoB
Orie
ntal
Pun
& Si
ndPN
BSy
nU
CO
Uni
onU
nite
dVi
jaya SB
ISB
_Bik
_Jai
SB_H
ydSB
_Ind
SB_M
ysSB
_Pat
SB_S
auSB
_Tra
v
FSB
Graphical presentation of the Operational Risk Capital Chargeunder the Basic Indicators Approach for Public Sector Banks(2005-2009)
Operational Risk Capital Charge: Comparative Performance of Public Sector Banks in 2007
295249644 560
176
717
168
465244 286380
318116 198
1815
190 114134 188
856
347284413
207 224 206 970
3000
6000
9000
12000
11345
Rs.
Cro
re
Alla
haba
dAn
dhra
BoB
BoI
BoM
ahC
snar
aC
entra
lC
orpo
ratio
nD
ena
Indi
an IoB
Orie
ntal
Pun
& Si
ndPN
BSy
nU
CO
Uni
onU
nite
dVi
jaya SB
ISB
_Bik
_Jai
SB_H
ydSB
_Ind
SB_M
ysSB
_Pat
SB_S
auSB
_Tra
v
FSB
Graphical presentation of the Operational Risk Capital Chargeunder the Basic Indicators Approach for Public Sector Banks(2005-2009)
Operational Risk Capital Charge: Comparative Performance of Public Sector Banks in 2008
262310677611
182 170 411129
754458
267 323 324
909
375300459
217197
1967
198146113201
237206 90
0
3000
6000
9000
1200012049
Rs.
Cro
re
FS
BA
llaha
bad
And
hra
BoB BoI
BoM
ahC
snar
aC
entr
alC
orpo
ratio
nD
ena
Indi
an IoB
Orie
ntal
Pun
& S
ind
PN
BS
ynU
CO
Uni
onU
nite
dV
ijaya SB
IS
B_B
ik_J
aiS
B_H
ydS
B_I
ndS
B_M
ysS
B_P
atS
B_S
auS
B_T
rav

Graphical presentation of the Operational Risk Capital Chargeunder the Basic Indicators Approach for Public Sector Banks(2005-2009)
Operational Risk Capital Charge: Comparative Performance of Public Sector Banks in 2009
341271
761758 806444289 382187195
452338 409 526
2827
204198216317
1001
142258
87214158124 2050
15000
13111
12000
9000
6000
3000
Rs.
Cro
re
Alla
haba
dAn
dhra
BoB
BoI
BoM
ahC
snar
aC
entra
lC
orpo
ratio
nD
ena
Indi
an IoB
Orie
ntal
Pun
& Si
ndPN
BSy
nU
CO
Uni
onU
nite
dVi
jaya SB
ISB
_Bik
_Jai
SB_H
ydSB
_Ind
SB_M
ysSB
_Pat
SB_S
auSB
_Tra
v
FSB
Annexure VI 413

Graphical presentation of the operational Risk Capital Chargeunder the Basic Indicators Approach for New Private SectorBanks (2005-2009)
Comparative Performance of Operational Risk Capital Charge in 2005
1121
123204
535
0
200
400
600
800
1000
1200
PVT Axis HDFC ICICI
Rs
. C
rore
Comparative Performance of Operational Risk Capital Charge in 2006
1494
149278
789
0
500
1000
1500
2000
PVT Axis HDFC ICICI
Rs
. C
rore
Comparative Performance of Operational Risk Capital Charge
Rs
. C
rore
in 2007
1925
203396
1004
0
500
1000
1500
2000
2500
PVT Ax is HDFC ICICI
Comparative Performance of Operational Risk Capital Charge
Rs
. C
rore
in 2007
1925
203396
1004
0
500
1000
1500
2000
2500
PVT Ax is HDFC ICICI
Graphical presentation of the operational Risk Capital Chargeunder the Basic Indicators Approach for New Private SectorBanks (2005-2009)
Comparative Performance of Operatinal Risk Capital Charge in 2009
3627
438820
1879
0500
1000150020002500300035004000
PVT Axis HDFC ICICI
Rs
. C
rore
ANNEXURE VII

ANNEXURE VIII
Graphical presentation of the operational risk capital chargethat individual nationalized banks have to keep aside on accountof operational risk and its impact on their Tier I capital for2005 to 2009 under the Basic Indicators Approach
Operational Risk Capital Charge (BIA) – Allahabad Bank
310
219264 295
0
100
200
300
400
2005 2006 2007 2008
Year
Rs.
Cro
re
Capital Charge
Impact on Tier I Capital (BIA) – Allahabad Bank
7.758.19.53
6.46
5.857.297.57
8.84
02468
1012
2005 2006 2007 2008Year
Per
cen
t
Current Tier I Estimated Tier I Capital
Impact on Tier I Capital (BIA) – Andhra Bank
8.03
12.29.98
8.54
7.859.19
11.20
7.19
0
5
10
15
2005 2006 2007 2008
Per
cen
t
Current Tier I Estimated Tier I Capital
Year
Impact on Tier I Capital (BIA) – Bank of Baroda
7.638.74
10.988.21
7.168.0910.14
7.44
02
468
1012
2005 2006 2007 2008Year
Per
cen
t
Current Tier I Estimated Tier I Capital
Operational Risk Capital Charge (BIA) – Bank of Baroda
677644
597527
-100
100
300
500
700
2005 2006 2007 2008
Year
Rs.
Cro
re
Capital Charge
Impact on tier I Capital (BIA) – Bank of India
7.76.546.757.05
7.265.926.21 6.00
0
2
4
6
8
10
2005 2006 2007 2008Year
Per
cen
t
Current Tier I Estimated Tier I Capital
Operational Risk Capital Charge (BIA) – Bank of India
758
531 553 560611
0
200
400
600
800
2005 2006 2007 2008 2009
Year
Rs.
Cro
re
Capital Charge
Operational Risk Capital Charge (BIA) – Bank of Maharashtra
195
182176177158
0
100
200
300
2005 2006 2007 2008 2009
Year
Rs.
Cro
re
Capital Charge

416 Operational Risk Measurement for the Indian Banking Sector: Alternative Measures
Impact on Tier I Capital (BIA) – Bank of Maharashtra
5.13
7.1 7.47 6.03
4.605.42
6.636.37
0
2
4
6
8
2005 2006 2007 2008Year
Per
cen
t
Current Tier I Estimated Tier I Capital
Operational Risk Capital Charge (BIA) – Canara Bank
806
754717660588
0
200
400
600
800
2005 2006 2007 2008 2009
Year
Rs.
Cro
re
Capital Charge
Impact on Tier I Capital (BIA) – Canara Bank
7.017.177.817.29
6.516.677.096.59
0
2
4
6
8
10
2005 2006 2007 2008Year
Per
cen
t
Current Tier I Estimated Tier I Capital
Operational Risk Capital Charge (BIA) – Central Bank of India
384442 465 458 444
0
200
400
600
2005 2006 2007 2008 2009
Year
Rs.
Cro
re
Capital Charge
Impact on Tier I Capital (BIA) – Central Bank of India
5.426.08
7.196.32
5.005.556.27
5.37
0
3
6
9
2005 2006 2007 2008Year
Per
cen
t
Current Tier I Estimated Tier I Capital
Operational Risk Capital Charge (BIA) – Corporation Bank
191 225 244 267 289
0
100
200
300
400
2005 2006 2007 2008 2009
Year
Rs.
Cro
re
Capital Charge
Impact on Tier I Capital (BIA) – Corporation Bank
9.64
13.55 12.41 11.3
9.0310.5711.58
12.70
0
5
10
15
2005 2006 2007 2008Year
Per
cen
t
Current Tier I Estimated Tier I Capital
Operational Risk Capital Charge (BIA) – Dena Bank
187
170168161150
0
100
200
2005 2006 2007 2008 2009
Year
Rs.
Cro
re
Capital Charge
Impact on Tier I Capital (BIA) – Dena Bank
6.065.966.63
5.73 5.25 5.38
0
3
6
9
2005 2006 2007Year
Per
cen
t
Current Tier I Estimated Tier I Capital
Operational Risk Capital Charge (BIA) – Indian Bank
382
212 254 286323
0
100
200
300
400
500
2005 2006 2007 2008 2009
Year
Rs.
Cro
re
Capital Charge

Impact on Tier I Capital (BIA) – Indian Bank
11.417.6
10.2912.28
10.7011.37
9.247.33
02468
101214
2005 2006 2007 2008Year
Per
cen
t
Current Tier I Estimated Tier I Capital
Operational Risk Capital Charge (BIA) – Indian Overseas Bank
452
411380337279
0
100
200
300
400
500
2005 2006 2007 2008 2009
Year
Rs.
Cro
re
Capital Charge
Impact on Tier I Capital (BIA) – Indian Overseas Bank
7.867.18.54 8.2
7.207.427.636.33
0
3
6
9
2005 2006 2007 2008Year
Per
cen
t
Current Tier I Estimated Tier I Capital
Operational Risk Capital Charge (BIA) – Oriental Bank of Commerce
338
324318298269
0
100
200
300
400
2005 2006 2007 2008 2009Year
Rs.
Cro
re
Capital Charge
Impact on Tier I Capital (BIA) – Oriental Bank of Commerce
9.3410.37 10.05
5.428.829.48
9.77
4.98
0
3
6
9
12
2005 2006 2007 2008Year
Per
cen
t
Current Tier I Estimated Tier I Capital
Operational Risk Capital Charge (BIA) – Punjab & Sind Bank
142
12911611499
0
50
100
150
2005 2006 2007 2008 2009Year
Rs.
Cro
re
Capital Charge
Impact on Tier I Capital (BIA) – Punjab & Sind Bank
5.26
10.05 9.588.04
7.558.799.12
4.07
0
2
4
6
8
10
12
2005 2006 2007 2008Year
Per
cen
t
Current Tier I Estimated Tier I Capital
Operational Risk Capital Charge (BIA) – Punjab National Bank
1001
909856777657
0
200400
600
8001000
1200
2005 2006 2007 2008 2009
Year
Rs.
Cro
re
Capital Charge
Impact on Tier I Capital (BIA) – Punjab National Bank
8.04
4.07
10.059.58
5.267.55
8.799.12
0
2
4
6
8
10
12
2005 2006 2007 2008Year
Per
cen
t
Current Tier I Estimated Tier I Capital
Operational Risk Capital Charge (BIA) – Syndicate Bank
409
375347310265
0
100
200
300
400
500
2005 2006 2007 2008 2009Year
Rs.
Cro
re
Capital Charge
Annexure VIII 417

418 Operational Risk Measurement for the Indian Banking Sector: Alternative Measures
Impact on Tier I Capital (BIA) – Syndicate Bank
6.626.17.4
6.24
6.045.64
6.59
5.37
0
2
4
6
8
2005 2006 2007 2008Year
Per
cen
t
Current Tier I Estimated Tier I Capital
Operatioal Risk Capital Charge (BIA) – UCO Bank
317
300284262
231
0
100
200
300
400
2005 2006 2007 2008 2009
Year
Rs.
Cro
re
Capital Charge
Impact on Tier I Capital (BIA) – UCO Bank
5.05
5.75 6.095.78
4.535.165.445.11
0
1
2
3
4
5
6
7
2005 2006 2007 2008Year
Per
cen
t
Current Tier I Estimated Tier I Capital
Operational Risk Capital Charge(BIA) – Union Bank
526
336386 413
459
0
100
200300
400
500
600
2005 2006 2007 2008 2009
Year
Rs.
Cro
re
Capital Charge
Impact on Tier I Capital (BIA) – Union Bank
6.077.32 7.79 7.45
6.987.176.705.51
0
2
4
6
8
10
2005 2006 2007 2008Year
Per
cen
t
Current Tier I Estimated Tier I Capital
Operational Risk Capital Charge (BIA) – United Bank
216217207
191
171
0
50
100
150
200
250
2005 2006 2007 2008 2009Year
Rs.
Cro
re
Capital Charge
Impact on Tier I Capital (BIA) – United Bank14.15
10.017.72
6.74
6.197.06
8.96
12.91
0
5
10
15
2005 2006 2007 2008Year
Per
cen
t
Current Tier I Estimated Tier I Capital
Operational Risk Capital Charge (BIA) – Vijaya Bank
198
197198185
151
0
50
100
150
200
250
2005 2006 2007 2008 2009Year
Rs.
Cro
re
Capital Charge
Impact on Tier I Capital (BIA) – Vijaya Bank
7.59 9.267.07
5.73
5.276.33
8.24
6.87
0
2
4
6
8
10
2005 2006 2007 2008Year
Per
cen
t
Current Tier I Estimated Tier I Capital

ANNEXURE IX
A graphical comparison of the impact of Operational RiskCapital Charge on Tier I Capital on Public Sector Banks andMajor New Private Sector Banks (Bank –Wise) under theBasic Indicators Approach and the alternative measures ofOperational Risk
Impact on Tier I Capital – Allahabad Bank
0
12
3
45
6
7
89
10
2005 2006 2007 2008Year
Per
cen
t
Current Tier I BIA Cost-Income Ratio Cost-Asset Ratio
Impact on Tier I Capital – Andhra Bank
0
2
4
6
8
10
12
2005 2006 2007 2008Year
Per
cen
t
Current Tier I BIA Cost-Income Ratio Cost-Asset Ratio
Impact on Tier I Capital – Bank of Baroda
0
2
4
6
8
10
12
2005 2006 2007 2008Year
Per
cen
t
Current Tier I BIA Cost-Income Ratio Cost-Asset Ratio
Impact on Tier I Capital – Bank of India
0
2
4
6
8
2005 2006 2007 2008Year
Per
cen
t
Current Tier I BIA Cost-Income Ratio Cost-Asset Ratio
Impact on Tier I Capital – Bank of Maharashtra
0
2
4
6
8
2005 2006 2007 2008Year
Per
cen
t
Current Tier I BIA Cost-Income Ratio Cost-Asset Ratio
Impact on Tier I Capital – Canara Bank
0
2
4
6
8
2005 2006 2007 2008Year
Per
cen
t
Current Tier I BIA Cost-Income Ratio Cost-Asset Ratio
Impact on Tier I Capital – Central Bank of India
0
2
4
6
8
2005 2006 2007 2008Year
Per
cen
t
Current Tier I BIA Cost-Income Ratio Cost-Asset Ratio
Impact on Tier I Capital – Corporation Bank
Year
Per
cen
t
2005 2006 2007 20080
2
4
6
8
10
12
14
Current Tier I BIA Cost-Income Ratio Cost-Asset Ratio

420 Operational Risk Measurement for the Indian Banking Sector: Alternative Measures
Impact on Tier I Capital – Dena Bank
0
2
4
6
2005 2006 2007 2008Year
Per
cen
t
Current Tier I BIA Cost-Income Ratio Cost-Asset Ratio
Impact on Tier I Capital – Indian Bank
0
2
4
6
8
10
12
2005 2006 2007 2008Year
Per
cen
t
Current Tier I BIA Cost-Income Ratio Cost-Asset Ratio
Impact on Tier I Capital – Indian Overseas Bank
0
2
4
6
8
2005 2006 2007 2008Year
Per
cen
t
Current Tier I BIA Cost-Income Ratio Cost-Asset Ratio
Impact on Tier I Capital – Oriental Bank of Commerce
0
2
4
6
8
10
2005 2006 2007 2008Year
Per
cen
t
Current Tier I BIA Cost-Income Ratio Cost-Asset Ratio
Impact on Tier I Capital – Punjab & Sind Bank
-6
-4
-2
0
2
4
6
8
10
12
2005 2006 2007 2008Year
Per
cen
t
Current Tier I BIA Cost-Income Ratio Cost-Asset Ratio
Impact on Tier I Capital – Punjab National Bank
0
2
4
6
8
10
2005 2006 2007 2008Year
Per
cen
t
Current Tier I BIA Cost-Income Ratio Cost-Asset Ratio
Impact on Tier I Capital – Syndicate Bank
0
2
4
6
8
2005 2006 2007 2008Year
Per
cen
t
Current Tier I BIA Cost-Income Ratio Cost-Asset Ratio
Impact on Tier I Capital – UCO Bank
0
1
2
3
4
5
6
7
2005 2006 2007 2008Year
Per
cen
t
Current Tier I BIA Cost-Income Ratio Cost-Asset Ratio

Impact on Tier I Capital – United Bank of India
0
2
4
6
8
10
12
14
16
2005 2006 2007 2008Year
Per
cen
t
Current Tier I BIA Cost-Income Ratio Cost-Asset Ratio
Impact on Tier I Capital – Vijaya Bank
0
2
4
6
8
10
2005 2006 2007 2008Year
Per
cen
t
Current Tier I BIA Cost-Income Ratio Cost-Asset Ratio
Impact on Tier I Capital – State Bank of India
0123456789
10
2005 2006 2007Year
Per
cen
t
Current Tier I BIA Cost-Income Ratio Cost-Asset Ratio
Impact on Tier I Capital – State Bank of Bikaner & Jaipur
0
2
4
6
8
10
2005 2006 2007 2008Year
Per
cen
t
Current Tier I BIA Cost-Income Ratio Cost-Asset Ratio
Impact on Tier I Capital – State Bank of Hyderabad
0
2
4
6
8
10
2005 2006 2007 2008Year
Per
cen
t
Current Tier I BIA Cost-Income Ratio Cost-Asset Ratio
Impact on Tier I Capital – State Bank of Indore
0
2
4
6
8
2005 2006 2007 2008Year
Per
cen
t
Current Tier I BIA Cost-Income Ratio Cost-Asset Ratio
Impact on Tier I Capital – State Bank of Mysore
0
2
4
6
8
2005 2006 2007 2008Year
Per
cen
t
Current Tier I BIA Cost-Income Ratio Cost-Asset Ratio
Impact on Tier I Capital – State Bank of Patiala
0
2
4
6
8
10
12
2005 2006 2007 2008Year
Per
cen
t
Current Tier I BIA Cost-Income Ratio Cost-Asset Ratio
Annexure IX 421

422 Operational Risk Measurement for the Indian Banking Sector: Alternative Measures
Impact on Tier I Capital – State Bank of Saurashtra
0
2
4
6
8
10
2005 2006 2007 2008Year
Per
cen
t
Current Tier I BIA Cost-Income Ratio Cost-Asset Ratio
Impact on Tier I Capital – State Bank of Travancore
0
2
4
6
8
2005 2006 2007 2008Year
Per
cen
t
Current Tier I BIA Cost-Income Ratio Cost-Asset Ratio
Impact on Tier I Capital – Axis Bank
0
2
4
6
8
10
2005 2006 2007 2008Year
Per
cen
t
Current Tier I BIA Cost-Income Ratio Cost-Asset Ratio
Impact on Tier I Capital – HDFC Bank
0
2
4
6
8
10
2005 2006 2007 2008Year
Per
cen
t
Current Tier I BIA Cost-Income Ratio Cost-Asset Ratio
Impact on Tier I Capital – ICICI Bank
0
2
4
6
8
10
12
2005 2006 2007 2008Year
Per
cen
t
Current Tier I BIA Cost-Income Ratio Cost-Asset Ratio