Operational Plan 2017-18 - City of Queanbeyan · highlighted by this Operational Plan. The...
61
Operational Plan 2017-18
Transcript of Operational Plan 2017-18 - City of Queanbeyan · highlighted by this Operational Plan. The...

Operational Plan
2017-18
Operational Plan 2017-18
2
Offices: Council headquarters – 256 Crawford St Bungendore office - 10 Majara St, Braidwood office - 144 Wallace St
Contact: Ph: 6285 6000 Fax: 6285 6666 E: [email protected] W: www.qprc.nsw.gov.au

Operational Plan 2017-18
3
Table of Contents Message from the Administrator ..................................................................................................................................................... 5About us ............................................................................................................................................................................................. 7
Merger Transition Plan ..................................................................................................................................................................................... 7Organisation structure ...................................................................................................................................................................................... 9
Community Profile .......................................................................................................................................................................... 10Strategic Directions ........................................................................................................................................................................ 12Queanbeyan-Palerang Regional Council branding ...................................................................................................................... 14Performance .................................................................................................................................................................................... 15Engagement ..................................................................................................................................................................................... 17Integrated Planning ......................................................................................................................................................................... 18Major projects .................................................................................................................................................................................. 19
Ellerton Drive Extension ................................................................................................................................................................................. 19Queanbeyan headquarters redevelopment ..................................................................................................................................................... 20Queanbeyan Sewage Treatment Plant upgrade ............................................................................................................................................. 21Major project timelines .................................................................................................................................................................................... 22Stronger Communities Fund ........................................................................................................................................................................... 23Special Rate Variation .................................................................................................................................................................................... 24
Financial Information ...................................................................................................................................................................... 25Financial Overview ......................................................................................................................................................................................... 25Capital Works Program 2017-18 ................................................................................................................................................................... ..26Summary of Strategic Directions and source of funds .................................................................................................................................... 28Summary of Services and source of funds ..................................................................................................................................................... 28Comparison of budget and financial assumptions (Percy Allen)...................................................................................................................... 29Overview of Fees and Charges for 2016-17 ................................................................................................................................................... 30
Strategic Direction 1 - Community ................................................................................................................................................. 33

Operational Plan 2017-18
4
Strategic Direction 2 - Choice ........................................................................................................................................................ 38Strategic Direction 3 - Character.................................................................................................................................................... 41Strategic Direction 4 - Connection ................................................................................................................................................. 47Strategic Direction 5 - Capability ................................................................................................................................................... 54

Operational Plan 2017-18
5
Message from the Administrator Welcome to the first consolidated Operational Plan for Queanbeyan-Palerang Regional Council.
Since the merger announcement on 12 May 2016, Council staff have been busily working on bringing the two former organisations together into one. This has not been an easy task, however more than one year on from the creation of Queanbeyan-Palerang Regional Council, I am proud to say that significant progress has been made – highlighted by this Operational Plan. The development of this Operational Plan, which includes our budget for the 2017-18 financial year, was a challenging task, but as you will see through this document we have produced a budget that delivers projects to all corners of the Local Government Area and provides the services that were available prior to the merger.
A key feature of this year’s Operational Plan is the inclusion of $9m in funding from the NSW Government’s Stronger Communities Fund. This funding was provided to all merged councils and has allowed us to allocate funds to more than 20 community infrastructure projects across the new Local Government Area. These projects include CBD improvements, drainage upgrades, sporting facility enhancements and much more. The injection of this funding has been warmly received in the community, with a further $1m allocated to community groups and not for profit organisations.
Some of the other key projects in this year’s budget include: More than $19m worth of road maintenance and upgrades Start of construction of the Ellerton Drive Extension $900,000 for the Bungendore landfill reinstatement $700,000 for the Macs Reef landfill reinstatement $2.75m for the Braidwood Waste Transfer Station construction $6.5m towards the design and planning for the upgraded Queanbeyan Sewage Treatment Plant $25m towards the redevelopment of the Council Headquarters, Queanbeyan
Many of the projects mentioned above and included in this document originated from studies and strategies undertaken by the former councils.
The NSW Budget for 2017-18 included some significant funding for projects within the Queanbeyan-Palerang Local Government Area. Of significant note was the $70m roads package that will allow us to seal the remainder of Nerriga Rd, complete the duplication of Old Cooma Rd from the Edwin Land Parkway Extension to the Googong entrance and the construction of a roundabout at the intersection of Molonglo/Malbon Sts in Bungendore.

Operational Plan 2017-18
6
Staff will also be progressing a number of the actions and projects contained in the Transition Plan that was developed following the merger. This will allow the organisation to continue to transform.
Developing a budget for a large organisation such as this Council always presents challenges, however through the hard work of staff, we have prepared a budget with a small surplus of $17,000. This was made difficult when one considers that the rate peg was set at 1.5%. This means Council was only able to increase its income from general rates by 1.5%, despite staff Award increases of 2.5% basically consuming that increased revenue. To provide certainty to communities, the NSW Government’s policy position is that rating structures and categories in place prior to the establishment of the new Council will be maintained for a period of four years. So until 2020-21, Council will be operating under the same rate structures of the former councils, with no harmonisation possible until then.
During the first 12 months of Queanbeyan-Palerang Regional Council, the organisation has focused on due diligence and thorough reviewing of strategies, plans and policies of the former councils. Council has also been looking at asset standards and levels of service and obtaining community views to enable the newly-elected Council to make informed decisions on what projects, levels of service and asset standards should apply in the Delivery Program.
I would like to thank the eight members of Council’s Local Representation Committee for their assistance since the merger. The LRC was made up of councillors from the former Queanbeyan and Palerang councils and provided key advice and recommendations on a number of matters during the year.
On 9 September 2017, the community will elect 11 members to form the first Council for QPRC. In preparation for the new Council taking up office, staff have been revising systems and structures. Since the former councils merged, the Local Government legislation has changed, with new councillors required to be inducted to the organisation and the system of Local Government in NSW, undertake professional development as a councillor, and take an oath of office.
This Operational Plan will be implemented during the 2017-18 financial year. From 2018-19 – 2020-21, the incoming Council will develop a Delivery Program in response to the Community Strategic Plan.
Administrator Mr Tim Overall

Operational Plan 2017-18
7
Abo
ut u
s Queanbeyan-Palerang Regional Council was created by proclamation by the NSW Governor on 12 May 2016 following the merger of the former Queanbeyan and Palerang councils. As with all merged councils, an Administrator was appointed to undertake the roles and responsibilities of the elected Council until the local government elections for merged councils in September 2017. The former Mayor of Queanbeyan City Council, Mr Tim Overall was appointed Administrator.
At the 9 September 2017 election, the community will elect 11 councillors and the Mayor will be elected to a two-year term by councillors. The proclamation did not include any wards in the Local Government Area.
Merger Transition Plan Following the merger, Council developed a Transition Plan to cover the years 2016-19. The Transition Plan will be managed through four phases:
The activities included are the due diligence and discovery elements of transitioning two former entities into one and includes: finalising the Integrated Planning and Reporting suite for the new entity; the creation of a new organisational structure; a review of services delivered; current services under contract; and the alignment and merging of the systems that the councils use to support service delivery.
While it is expected direct savings will be lower than Government predictions, significant benefits should be realised from the merger.
In order to achieve the outcomes in the Transition Plan, Council has proposed a program of projects over a 3-4 year period with a total spend of around $9m from the Stronger Communities Fund provided by the NSW Government. The NSW Government has also provided $5m towards the merger transition, with the remaining funding to be sourced from savings achieved through the development of the Operational Plan and Delivery Program.

Operational Plan 2017-18
8
The due diligence and ‘discovery’ phase involved an extensive stocktake and analysis to understand the current state and determine the desired future state. The stocktake included the analysis of Council’s systems of asset and financial management; the scope, scale and delivery of services; the planning and rollout of technology and workforce support; and their integration into the next Resourcing Strategy scheduled for mid-2017.
Strategic Workforce Plan Synergistics Culture BEF Benchmark HRIS Fit Skills

Operational Plan 2017-18
9
Organisation structure Having entered phase 2 of the adopted Transition Plan, Council has now implemented the Transition Organisational Structure.
The Transition Structure was developed following a review of the services provided by QPRC, aligned to the Strategic Directions (see Page 12). Recruitment for the four Portfolio General Managers was undertaken in April 2017, with level 3 Service Managers appointed in June. It is not expected that there will be significant changes to roles underneath the level 4 coordinators. The conditions of employed staff under the Local Government State Award are protected for three years following the merger. As reported to Council in January 2017, the new structure halved the size of the former councils’ executive, saving around $900,000. Some of those staff will be redeployed to service manager roles and specialist roles to support merger projects identified in the Transition Plan.
Interim General Manager
Peter Tegart
Portfolio General Manager Community
ChoiceJacqui Richards
Recreation and Culture
Community and Education
Business and Innovation
Customer and Communication
Portfolio General Manager Natural and
Built CharacterMichael Thompson
Development
Urban Landscapes
Natural Landscapes and Health
Land-Use Planning
Portfolio General Manager Community
ConnectionsPhil Hansen
Transport and Facilitiies
Utilities
Contracts and Projects
Asset Specialist
Portfolio General Manager Organisation
CapabilityVacant
Workplace
Culture and Performance
Digital
Legal and Risk
Project Managerment Office - Merger
TransitionFinance
Interim General Manager's Office

Operational Plan 2017-18
10
Com
mun
ity P
rofil
e

Operational Plan 2017-18
11

Operational Plan 2017-18
12
Stra
tegi
c D
irect
ions

Operational Plan 2017-18
13

Operational Plan 2017-18
14
Queanbeyan-Palerang Regional Council branding One of the key requirements of the NSW Department of Premier and Cabinet (DPC) following the merger was the establishment of a brand for the new organisation. Immediately following the merger, Council implemented an interim brand with a permanent brand to be developed in consultation with the community prior to June 2017. Council engaged ACT branding experts ‘Coordinate’ to develop a brand for the organisation. During the development of the brand, ‘Coordinate’ held community and staff workshops to gather an understanding of what makes up our region. Coordinate summarised the process by saying: The outcomes of our workshops revealed that the QPRC local government area can consistently be described as eclectic, diverse, creative, humble, accessible, genuine and homely. The region is sentimental yet forward thinking. It offers country living with city benefits and an affordable lifestyle with so much choice. The people and places are charming yet quietly determined….. And under QPRC, all parts are now linked together as one….. The one word that summarised the essence of the region is ‘heart’ – which led to the positioning statement “One Heart. Many parts”. This thinking underpins our creative direction and creates a solid foundation on which to build a strong brand. The preferred and adopted concept brand reflected the creative, eclectic and diverse nature of the region and was shown in mosaic form. The branding has been integrated into Council’s stationary, clothing and other branding.

Operational Plan 2017-18
15
Perf
orm
ance
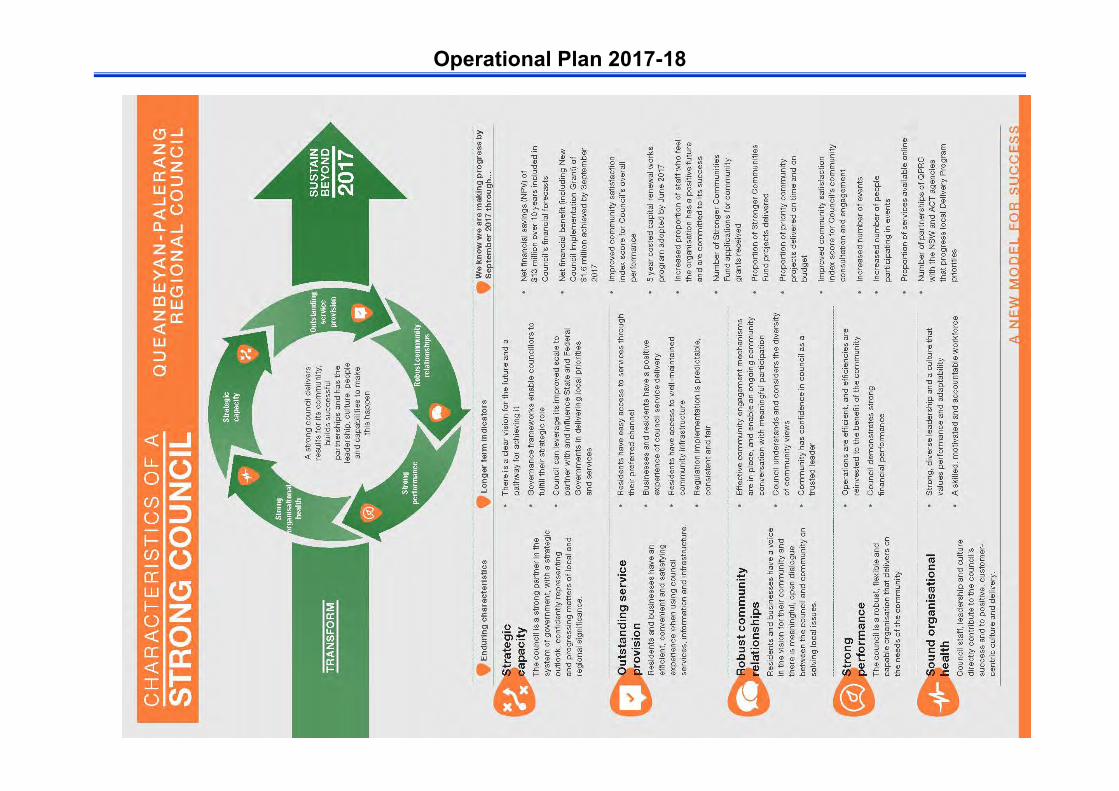
The NSW Department of Premier and Cabinet worked with the 20 merged councils to develop a ‘Stronger Councils Framework’, with a Council mission to ‘deliver results for its community, build successful partnerships, and have the leadership, culture, people and capabilities to make this happen’. The diagram on the following page identifies five key characteristics with indicators and measures of progress.
In addition, DPC arranged a survey of community views on the service performance of the merged councils in September 2016. QPRC fared well compared to other merged councils. The areas that will be considered in shaping the next Community Strategic Plan and service areas include:
Queanbeyan
Being a well-run andmanaged Council
Providing value for money Water and Sewerage
Services Emergency and Disaster
Management Decisions made in the
interest of the community Informing the community Ease of access to services Condition of the sealed
roads Condition of local streets
and footpaths Community services
Urban Fringe
Being a well-run andmanaged Council
Providing value for money Emergency and Disaster
Management Decisions made in the
interest of the community Condition of sealed roads Environmental
Sustainability Informing the community Community consultation
and engagement Waste management The appearance of public
areas
Urban Village
Providing value for money Being a well-run and
managed Council Decisions being made in
the best interests of thecommunity
Informing the community Water and sewerage Emergency and disaster
management Condition of the sealed
roads Community Services Ease of access to services Community consultation
and engagement
Rural
Condition of the sealedroads
Providing value for money Being a well-run and
managed Council Decisions made in the
interest of the community Maintenance of unsealed
roads Waste management Community consultation
and engagement Emergency and disaster
management Condition of local streets
and footpaths Informing the community
Operational Plan 2017-18
16

Operational Plan 2017-18
17
Enga
gem
ent
Queanbeyan-Palerang Regional Council has a commitment to consulting and engaging the community. While a broader community engagement strategy is currently under development, Council has provided a list of the tools and activities it may use to consult and engage with residents on a number of levels, as outlined in the internationally-recognised International Association for Public Participation’s (IAP2) Public Participation Spectrum. The Spectrum shows the different levels of participation we intend to undertake with the community and staff.
In this year’s Operational Plan, Council has provided the community and the incoming Council with an indication of the level of engagement that may be undertaken with each of its projects. The level of engagement may increase or decrease as the project progresses. It is intended that level of engagement will be reported alongside the projects in the six-monthly and annual reports. This provides an indication of some of the tools that may be used.
Council’s approach to engagement has been enhanced by the launch of the Your Voice online engagement hub (http://yourvoice.qprc.nsw.gov.au) The Integrated Planning and Reporting Framework works in the following way (see diagram on right for visual representation):
Level What we’re doing Some tools we may choose to use Inform We’ve got something we’d like to let
you know about when/where/how etc
Social media Website Customer service display Councillor briefing Letterbox drop QPRC News Variable message board Media release Advertising Road signage Internal communications Annual Report Six-monthly reports
Consult We’ve got some ideas, but we want to run them past you to get your thoughts and input
Consultation process Community-wide consultation Stakeholder consultation Survey Poll Social media Advertising QPRC news Information sessions Pop-up sessions at shopping centres, markets etc
Involve We will work with you to ensure your concerns and wishes are included in the options developed
Surveys Workshops Community reference group Pop-up sessions at shopping centres, markets etc
Collaborate We need your help to work with us to build a solution
Detailed workshops Co-designing a solution Surveys Community reference group Vox pops
Empower You’re in charge – we will implement whatever the public decides
Citizen jury Survey Panels Referendum
Note: Tools may be used for different levels of engagement.

Operational Plan 2017-18
18
Inte
grat
ed P
lann
ing
Community Strategic Plan – A document with a 10-year horizon that outlines the aspirations of the community. This may include actions that are outside the influence of Council, however it may result in Council taking up an advocacy role. The elected Council does not have any role in shaping this document, instead it is based on a high level of community engagement during the development of the plan and during the development of other plans and strategies the Council has in place. This is the top-level document in the Integrated Planning and Reporting Framework.
Resourcing Strategy – As part of the Resourcing Strategy, Council must look at its assets, workforce and financial situation and develop plans and strategies aligned to each strategic direction. In addition, Council will evaluate its risks and opportunities with technology. The idea of the Resourcing Strategy is that the elected Council can look at the aspirations of its community and then cross-check those with the realities of Council’s resources. If Council doesn’t have the resources to meet some of the aspirations of the community, the Council must then consider how it wishes to progress with framing its Delivery Program.
Delivery Program – Having regard for the Community Strategic Plan and the realities of the Resourcing Strategy, the elected Council must develop a Delivery Program (generally covers four years). This is Council’s response to the Community Strategic Plan and shows what actions, projects and advocacy it will undertake during its term in office to move the community closer to its aspirations. Council will undertake a high level of engagement with the community during the development of the Delivery Program. The first Delivery Program for the new Council will be three years to 2020-21.
Operational Plan – This is essentially a one-year snapshot of the Delivery Program and shows the actions and projects Council intends to undertake for a specific financial year. The Operational Plan includes a detailed budget and is supported by the Revenue Policy (rates) and Fees and Charges. Consultation is undertaken with the community on the draft Operational Plan, Revenue Policy and Fees and Charges.

Operational Plan 2017-18
19
Maj
or p
roje
cts
Ellerton Drive Extension
Project cost: $86m
Funding source: $25m Federal Government, $25m State Government, $36m low interest loan obtained by Council and repaid by developer contributions over 20 years. The Government funding for the project will be spent first, with Council allocating $8.25m in 2017-18. Project description: The 4.6km Ellerton Drive Extension provides an alternative route around the CBD and connects east and west Queanbeyan to the new southern population growth areas. The extension runs from the current end point of Ellerton Drive, near Yass Road/Bungendore Road, in Queanbeyan East to the Old Cooma Road/Edwin Land Parkway intersection in Karabar. The EDE includes a 120m bridge across the Queanbeyan River to provide flood-free access to the city.
Queanbeyan-Palerang Regional Council and NSW Roads and Maritime Services are working together to deliver the project, which will be managed by the RMS.
The key features of the extension include: One lane in each direction with climbing lanes Bridge crossing over Queanbeyan River and Barracks
Flat Drive Shared off-road cyclist and pedestrian pathway Provision of space for on-road cyclists Additional access points for Fairlane Estate Emergency egress for Greenleigh Estate at Lonergan
Drive and the East Queanbeyan reservoir
Stormwater drainage system, including pavementsurface drainage
Three fauna under-passes and three rope crossings Potential for a pedestrian undercrossing at Jumping
Creek Estate Noise mitigation measures Edwin Land Parkway Intersection upgrade.
Artist’s impression – Old Cooma Rd, Ellerton Drive Extension intersection

Operational Plan 2017-18
20
Queanbeyan headquarters redevelopment
Project cost: $35m, $25m in loan funding in 2017-18 Funding source: Low interest loan, with rental income to offset loan
Project description: The redevelopment of the Queanbeyan administration headquarters has been considered for a number of years and has changed size and scale on a few occasions. A refurbishment of the existing building was originally considered, however did not progress.
Due to the interest of a major tenant, Council has been able to progress planning for a complete redevelopment which will deliver a six-storey building.
The rent received will offset the cost of the borrowings for the estimated $35m redevelopment. It is expected the redevelopment will include basement carparking and significant new public domain, such as a town square and also a smart hub.
The redevelopment of the Queanbeyan headquarters will free up some valuable and under-utilised Council assets around the CBD for potential acquisition which would provide Council with the funding source for further public domain works identified in the CBD Masterplan. This will also lead to increased office and residential developments in the CBD which will bring life and investment to the area.
A concept design (pictured above) and development application will be progressed during 2017, with construction planned to commence in 2018. Occupancy is expected in early-mid 2019.

Operational Plan 2017-18
21
Queanbeyan Sewage Treatment Plant upgrade
Project cost: While estimated at more than $100m, the construction cost is to be determined. $6.5m is committed in 2017-18 for design and planning
Funding source: Reserve funding, grants and borrowings
Project description: The Queanbeyan Sewage Treatment Plant was constructed in the mid-1930s and treats Queanbeyan's effluent prior to discharge into the Molongolo River. While maintenance and works are regularly undertaken, the existing plant is nearing the end of its service life and is fully loaded to its capacity to safely treat sewage.
Council is now planning to upgrade this vital infrastructure to around 60,000 equivalent persons (EP) from its current 40,000 EP design. Planning is well advanced, with master planning complete and the concept design to be developed during 2017-18. Council will explore a ‘best for region’ approach to treat some sewage load from the ACT and aim to improve water flow, quality and discharge from the new plant into the river, which subsequently flows into Lake Burley Griffin.
The Sewage Treatment Plant Masterplan was adopted in March 2017 and outlines the proposed upgrade.

Operational Plan 2017-18
22
Major project timelines
August 2009
Involve
September 2011 Involve
August 2013 Involve
December 2014 Consult
June 2016
June 2016 Consult
January 2017 Inform
April 2017 Inform
Mid-2017 Inform
Mid 2020Inform
Planning and scoping (internal)
Procurement for concept design
Concept design
Final design
Development consent
Construction to commence
Googong and Tralee Traffic Study Adopted
Concept design and environmental studies
Detailed design
Review of Environmental Factors exhibited
NSW Government concurrence for Determination Report
Council agrees to proceed with extension
Preliminary works undertaken
Tenders for major construction called
Construction commences
Completion
2016 Consult
(internally)
March 2017
July 2017 Collaborate
September 2017 Involve
Late-2017 Consult
Late 2017 Inform
Project inception and planning
Master planning
Concept design
Detailed design
Regulatory approvals
Development approval
Construction
March 2017
April 2017 Involve
June 2019 Collaborate
December 2020 Collaborate
Ongoing
TBD Consult
January 2021 Inform
Ellerton Drive Extension Queanbeyan Headquarters redevelopment Queanbeyan Sewage Treatment Plant
Operational Plan 2017-18
23
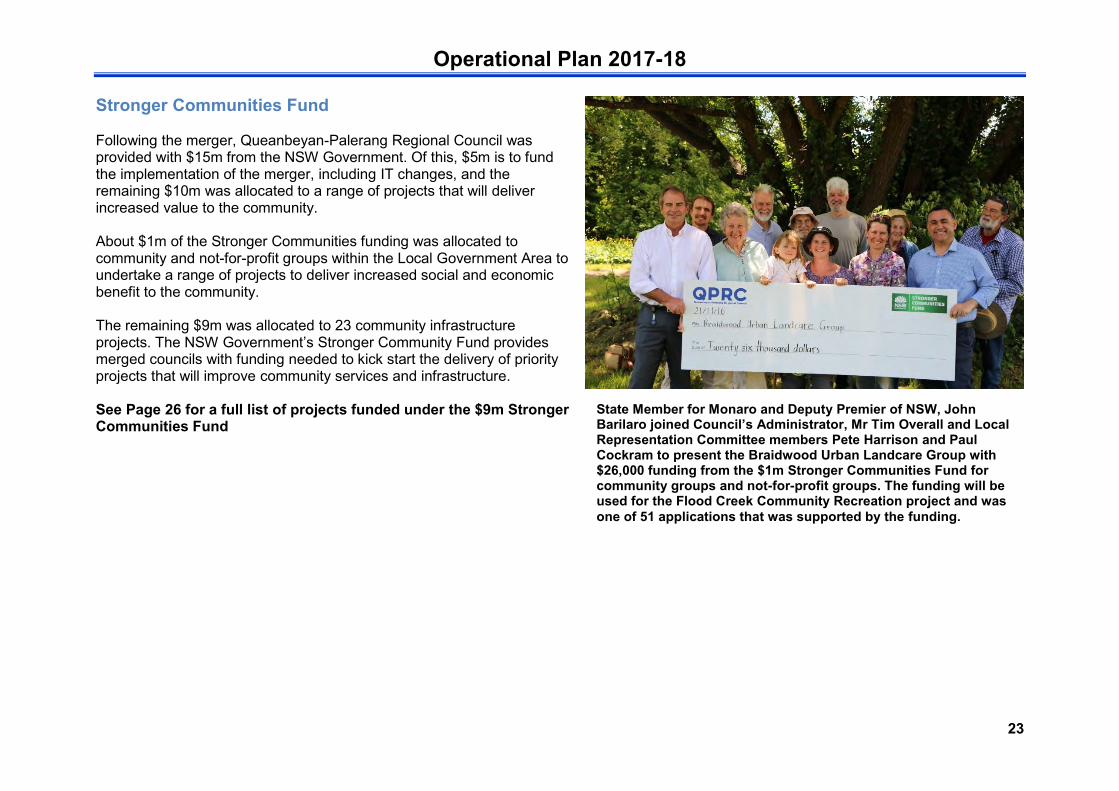
Stronger Communities Fund
Following the merger, Queanbeyan-Palerang Regional Council was provided with $15m from the NSW Government. Of this, $5m is to fund the implementation of the merger, including IT changes, and the remaining $10m was allocated to a range of projects that will deliver increased value to the community.
About $1m of the Stronger Communities funding was allocated to community and not-for-profit groups within the Local Government Area to undertake a range of projects to deliver increased social and economic benefit to the community.
The remaining $9m was allocated to 23 community infrastructure projects. The NSW Government’s Stronger Community Fund provides merged councils with funding needed to kick start the delivery of priority projects that will improve community services and infrastructure.
See Page 26 for a full list of projects funded under the $9m Stronger Communities Fund
State Member for Monaro and Deputy Premier of NSW, John Barilaro joined Council’s Administrator, Mr Tim Overall and Local Representation Committee members Pete Harrison and Paul Cockram to present the Braidwood Urban Landcare Group with $26,000 funding from the $1m Stronger Communities Fund for community groups and not-for-profit groups. The funding will be used for the Flood Creek Community Recreation project and was one of 51 applications that was supported by the funding.

Operational Plan 2017-18
24
Special Rate Variation In order to address a backlog of infrastructure maintenance, the former Queanbeyan City Council applied for and was granted a 5.8% Special Rate Variation in 2011-12. This resulted in a one-off 5.8% increase to Council’s rate base in 2011-12. Each year following 2011-12, rates in the former Queanbeyan area have increased by the rate peg amount announced by the Independent Pricing and Regulatory Tribunal. At the time of the merger, the NSW Government announced that councils would continue along the same rating path that was in place prior to the merger. For Queanbeyan-Palerang, this includes the Special Rate Variation for the Queanbeyan area only. The 5.8% Special Rate Variation raises around $1.2 million per year to be spent on the CityCare program of works, which includes the maintenance and renewal of the city’s roads, footpaths, parks and sportsfields. Council acknowledged that the increase would have an impact on the more vulnerable in the community and agreed to provide an extra $40 rebate for pensioners.
Special Rate Variation - Former Queanbeyan City Council 2017-18 Budget
$,000 SRV - Footpath Grinding 50 SRV - Footpath Replacement 195 Pavement Rehabilitation 225 Bitumen Reseal 448 SRV-Riverside - Upgrade Lights 175 SRV- Hayley Park East - Replace furniture, landscape upgrade 40 SRV-Ingleside Park-Upgrade Softfall and Shade 40 SRV- Jane Hodgsen Park- Upgrade equipment and Softfall 52 Total SRV Program Works 1,225

Operational Plan 2017-18
25
Fina
ncia
l Inf
orm
atio
n Financial Overview
Description 17-18 Budget $,000
Expenses Employee expenses 42,687
Borrowing Costs 1,280
Materials and Contracts 32,615
Depreciation and Amortisation 20,959
Other Expenses 24,180
Interest and Investment Losses 2,524
Transfer to Reserves 15,437
Internal Recharges (1,744)
Internal Distribution Attribution 0
Total Expenses 137,941 Income Rates, Levies and Annual Charges (66,577)
User charges and fees (29,069)
Interest and Investment Revenue (4,315)
Other Income (1,701)
Grants, subsidies, contributions and donations - Operating (10,872)
Grants, subsidies, contributions and donations - Capital (22,076)
Proceeds from the sale of assets (3)
Transfer from Reserve (7,034)
Total Income 0
Capital Project Expenditure Borrowing Costs 73 Materials & Contracts 71,192 Other Expenses 9 Other Expenses - Travel 24 Interest & Investment Losses 94 Transfer to Reserves 8 Internal Recharge 2,539 Total Capital Project Expenditure 73,943 Capital Project Income User charges and fees (94)
Other Income (27,750)
Grants, subsidies, contributions and donations - Operating (704)
Grants, subsidies, contributions and donations - Capital (3,329)
Proceeds from the sale of assets (830)
Transfer from Reserve (37,087)
Total Capital Project Income (69,796) Total Income (211,448) Total Expenditure 211,885 Budget Result 437 Less Depreciation 20,959 Plus Non Cash (20,509) (Surplus)/Deficit (13)
Activity cost attribution and distribution of governance Council has implemented an attribution and distribution policy to its budget for 2017-18. Full cost attribution seeks to determine the ‘true’ cost of providing a good or service by tracking and accumulating the total cost of the process to create and distribute the good or service. Definitions:
Attribution - The assignment of apportioned corporate support costs to activities
Distribution – The assignment of apportioned governance cost to funds
Attributed Costs:
Human resources and payroll Information and communications (ICT) Accounting, budget and payables Records management General administration Risk, insurances, legal Customer service Community engagement Store Occupancy (offices, depots)
Distributed Costs:
Elected members Elections Meetings Public information/GIPA Executive office Financial reporting Integrated Planning and Reporting and land use planning Property data, rating and billing

Operational Plan 2017-18
26
Capital Works Program 2017-18 Source of Funding
Project No Description
Budget 2017-18
$,000 Project
Category
Rates Revenue/
SRV Funding $,000
User Fees and Charges
$,000
Grants and Contributions
$,000 Interest
$,000 Loans and
Leases $,000
Asset Sales $,000
Reserve Movements
$,000
S01 – Culture 100684 Stronger Communities $9m –Rusten House Queanbeyan 550 Enhance 0 0 0 0 0 0 (550,000) 107001 Rusten House Arts Centre 250 Enhance (125) 0 (125) 0 0 0 0 Total S01 - Culture 800 (125) 0 (125) 0 0 0 (550) S04 – recreation 100688 Stronger Communities $9m – Wet Play Area Queanbeyan Aquatic 450 Enhance 0 0 0 0 0 0 (450) 100698 Stronger Communities $9m – Aquatic Centre paint and restore 150 Enhance 0 0 0 0 0 0 (150) Total S04 - Recreation 600 0 0 0 0 0 0 (600) S12 – Health 760502 New Cemetery - Royalla 168 New asset (168) 0 0 0 0 0 0 Total S12 - Health 168 (168) 0 0 0 0 0 0 S23 - Urban landscapes 100786 Replace Cricket pitch Wright Park Lower 15 Renewal (15) 0 0 0 0 0 0 100189 Fernleigh Park Community Hall refurbishment 5 Enhance 0 0 0 0 0 0 (5) 100214 Arts Cafe - Outdoor Dining Enclosed 8 Enhance 9 (18) 0 0 0 0 0 100683 Stronger Communities $9m – Town Centre Improvements Bungendore 500 Enhance 0 0 0 0 0 0 (500) 100686 Stronger Communities $9m - Dog Park Googong 125 Enhance 0 0 0 0 0 0 (125) 100687 Stronger Communities $9m – Refurbish Netball Courts Karabar 175 Enhance 0 0 0 0 0 0 (175) 100689 Stronger Communities $9m – Showground Grandstand Queanbeyan 350 Enhance 0 0 0 0 0 0 (350) 100690 Stronger Communities $9m -Seiffert Oval Lights Queanbeyan 200 Enhance 0 0 0 0 0 0 (200) 100691 Stronger Communities $9m – BWD Rec Ground Stage 2 Braidwood 300 Enhance 0 0 0 0 0 0 (300) 100692 Stronger Communities $9m – BGD Rec Ground Stage 1 Bungendore 1,500 Enhance 0 0 0 0 0 0 (1,500) 100694 Stronger Communities $9m – Streetscape improvements, Karabar 46 Enhance 0 0 0 0 0 0 (46) 100695 Stronger Communities $9m – Queanbeyan Park central playground 250 Enhance 0 0 0 0 0 0 (250) 100696 Stronger Communities $9m – Glebe Park Playground Queanbeyan 90 Enhance 0 0 0 0 0 0 (90) 100697 Stronger Communities $9m – Henderson Road Recreation Area Qu 125 Enhance 0 0 0 0 0 0 (125) 100699 Stronger Communities $9m – Seiffert Oval spectator entrance 200 Enhance 0 0 0 0 0 0 (200) 100700 Stronger Communities $9m – Upgraded community facilities Cap 100 Enhance 0 0 0 0 0 0 (100) 100701 Stronger Communities $9m – Lascelles Street upgrade Braidwood 800 Enhance 0 0 0 0 0 0 (800) 100702 Stronger Communities $9m – Upgrade Lighting Margaret Donohue 200 Enhance 0 0 0 0 0 0 (200) 100703 Stronger Communities $9m – Queens Bridge approach enhancement 200 Enhance 0 0 0 0 0 0 (200) 100731 SRV-Riverside - Upgrade Lights 175 Enhance (145) 0 0 0 0 0 (29,294) 100732 SRV- Hayley Park East - Replace Furniture landscape upgrade 40 Renewal (40) 0 0 0 0 0 0 100733 SRV-Ingleside Park-Upgrade Softfall and Shade 40 Enhance (40) 0 0 0 0 0 0 100734 SRV- Jane Hodgsen Park- Upgrade equipment &Softfall 52 Enhance (52) 0 0 0 0 0 0 Total S23 - Urban Landscapes 5,496 (283) (18) 0 0 0 0 (5,195) S31 - Transport 100004 Network - Water - Capital 30 Enhance 0 0 0 0 0 0 (30) 100150 Ellerton Drive Extension 8,250 Enhance 0 0 0 0 0 0 (8,250) 100205 Bicycle Paths - River Corridor Stage 1 134 Enhance 0 0 (134) 0 0 0 0 100548 Bungendore Landfill Reinstatement 900 Rehab 0 0 0 0 0 0 (900) 100549 Macs Reef Landfill Reinstatement 750 Rehab 0 0 0 0 0 0 (750) 100693 Stronger Communities $9m – River path incl. low level foot bridge 760 Enhance 0 0 0 0 0 0 (760) 101002 Local Roads Capital - Budget Only 3,508 Renewal (3,478) 0 (30) 0 0 0 0 102002 MR92 - Nerriga Rd - Capital 50 Renewal 0 0 (50) 0 0 0 0 102006 MR270 - Captains Flat Rd - Capital 281 Enhance 0 0 (281) 0 0 0 0 102026 Back Creek Bridge replacement (MR270) 1,750 Enhance 0 0 (875) 0 0 0 (875) 102028 MR270 17/18 RRRP Rehab Molonglo Rv Dr to Douglas Cl 600 Enhance 0 0 (600) 0 0 0 0 102031 MR92 16/17 R2R Const and seal Grants Rd toward Charleyong 1,792 Enhance 0 0 (1,792) 0 0 0 0 102043 MR584 RRRP Rehabilitation 7.4-9.2km from Rutledge St 146 Rehab 0 0 (146) 0 0 0 0 Total S31 - Transport 18,952 (3,478) 0 (3,909) 0 0 0 (11,565)
Operational Plan 2017-18
27
Source of Funding
Project No Description
Budget 2017-18
$,000 Project
Category
Rates Revenue/
SRV Funding $,000
User Fees and Charges
$,000
Grants and Contributions
$,000 Interest
$,000 Loans and
Leases $,000
Asset Sales $,000
Reserve Movements
$,000
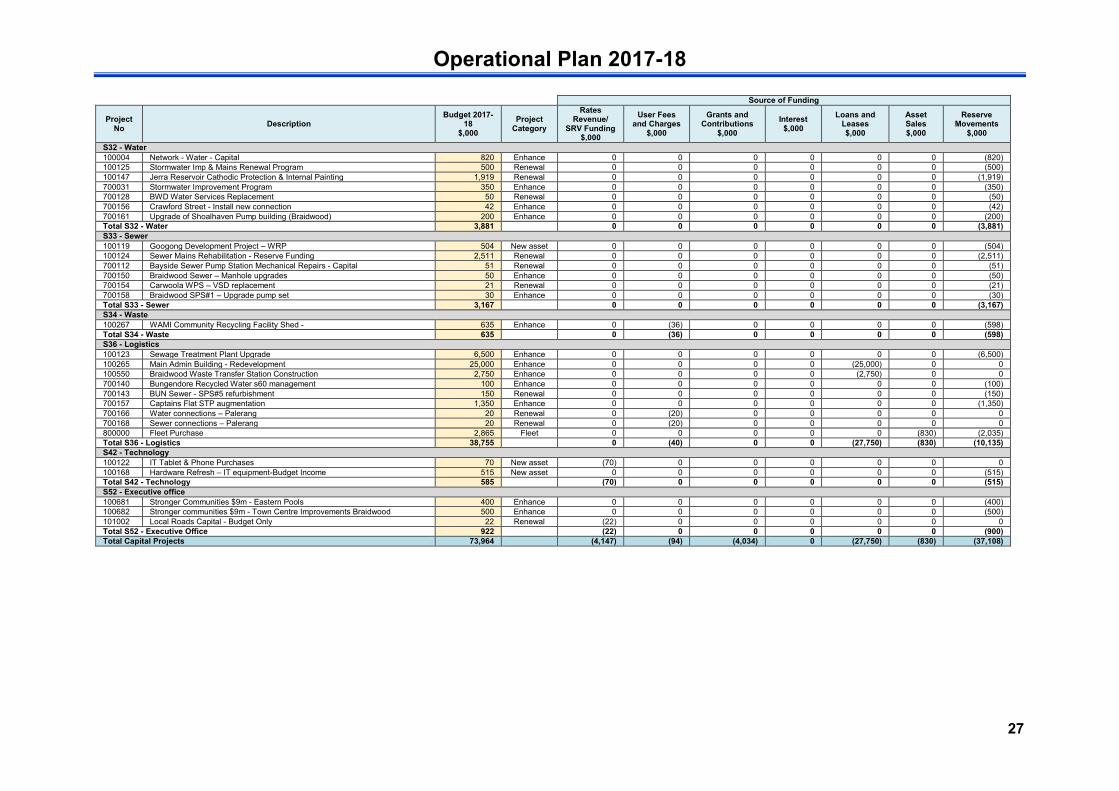
S32 - Water 100004 Network - Water - Capital 820 Enhance 0 0 0 0 0 0 (820) 100125 Stormwater Imp & Mains Renewal Program 500 Renewal 0 0 0 0 0 0 (500) 100147 Jerra Reservoir Cathodic Protection & Internal Painting 1,919 Renewal 0 0 0 0 0 0 (1,919) 700031 Stormwater Improvement Program 350 Enhance 0 0 0 0 0 0 (350) 700128 BWD Water Services Replacement 50 Renewal 0 0 0 0 0 0 (50) 700156 Crawford Street - Install new connection 42 Enhance 0 0 0 0 0 0 (42) 700161 Upgrade of Shoalhaven Pump building (Braidwood) 200 Enhance 0 0 0 0 0 0 (200) Total S32 - Water 3,881 0 0 0 0 0 0 (3,881) S33 - Sewer 100119 Googong Development Project – WRP 504 New asset 0 0 0 0 0 0 (504) 100124 Sewer Mains Rehabilitation - Reserve Funding 2,511 Renewal 0 0 0 0 0 0 (2,511) 700112 Bayside Sewer Pump Station Mechanical Repairs - Capital 51 Renewal 0 0 0 0 0 0 (51) 700150 Braidwood Sewer – Manhole upgrades 50 Enhance 0 0 0 0 0 0 (50) 700154 Carwoola WPS – VSD replacement 21 Renewal 0 0 0 0 0 0 (21) 700158 Braidwood SPS#1 – Upgrade pump set 30 Enhance 0 0 0 0 0 0 (30) Total S33 - Sewer 3,167 0 0 0 0 0 0 (3,167) S34 - Waste 100267 WAMI Community Recycling Facility Shed - 635 Enhance 0 (36) 0 0 0 0 (598) Total S34 - Waste 635 0 (36) 0 0 0 0 (598) S36 - Logistics 100123 Sewage Treatment Plant Upgrade 6,500 Enhance 0 0 0 0 0 0 (6,500) 100265 Main Admin Building - Redevelopment 25,000 Enhance 0 0 0 0 (25,000) 0 0 100550 Braidwood Waste Transfer Station Construction 2,750 Enhance 0 0 0 0 (2,750) 0 0 700140 Bungendore Recycled Water s60 management 100 Enhance 0 0 0 0 0 0 (100) 700143 BUN Sewer - SPS#5 refurbishment 150 Renewal 0 0 0 0 0 0 (150) 700157 Captains Flat STP augmentation 1,350 Enhance 0 0 0 0 0 0 (1,350) 700166 Water connections – Palerang 20 Renewal 0 (20) 0 0 0 0 0 700168 Sewer connections – Palerang 20 Renewal 0 (20) 0 0 0 0 0 800000 Fleet Purchase 2,865 Fleet 0 0 0 0 0 (830) (2,035) Total S36 - Logistics 38,755 0 (40) 0 0 (27,750) (830) (10,135) S42 - Technology 100122 IT Tablet & Phone Purchases 70 New asset (70) 0 0 0 0 0 0 100168 Hardware Refresh – IT equipment-Budget Income 515 New asset 0 0 0 0 0 0 (515) Total S42 - Technology 585 (70) 0 0 0 0 0 (515) S52 - Executive office 100681 Stronger Communities $9m - Eastern Pools 400 Enhance 0 0 0 0 0 0 (400) 100682 Stronger communities $9m - Town Centre Improvements Braidwood 500 Enhance 0 0 0 0 0 0 (500) 101002 Local Roads Capital - Budget Only 22 Renewal (22) 0 0 0 0 0 0 Total S52 - Executive Office 922 (22) 0 0 0 0 0 (900) Total Capital Projects 73,964 (4,147) (94) (4,034) 0 (27,750) (830) (37,108)

Operational Plan 2017-18
28
Summary of Strategic Directions and source of funds
Summary of Services and source of funds
Council adopted a framework comprising 24 services, supported by over 120 programs. A set of service statements has been prepared outlining the objective, scope, deliverables and performance expectations for those services and program.
Source of Funds
Strategic Direction
Total Expenditure
$,000 Total Income
$,000
Budget Result (Net
Cost) $,000
Rates Funding Required
$,000
Rates Revenue
$,000
Annual Charges
$,000
User Fees and Charges
$,000
Grants and Contributions
$,000 Interest
$,000
Loans, Leases and
Other $,000
Asset Sales $,000
Reserve Funded
$,000 Depreciation
$,000 Non Cash
Contributed $,000
SD1 - Community 14,925 (6,044) 8,881 8,590 0 0 (2,894) (1,756) 0 (110) (3) (1,279) 290 0 SD2 - Choice 1,698 (520) 1,177 1,137 0 0 (289) (167) 0 (1) 0 (6) 40 0 SD3 - Character 28,366 (32,019) (3,652) 15,887 0 0 (3,631) (22,486) 0 (469) 0 (5,431) 968 (20,509) SD4 - Connection 152,172 (74,171) 78,000 60,663 0 0 (5,421) (6,424) (115) (28,509) (830) (32,871) 17,337 0 SD5 - Capability 4,180 (780) 3,399 2,870 0 0 (65) 0 0 (131) 0 (583) 529 0 SD6 - Council 10,519 (97,911) (87,391) (89,186) (34,332) (32,244) (16,861) (6,148) (4,200) (230) 0 (3,893) 1,794 0
211,885 (211,448) 437 (13) (34,332) (32,244) (29,164) (36,984) (4,315) (29,451) (833) (44,122) 20,959 (20,509)
Source of Funds
Service Total
Expenditure $,000
Total Income $,000
Budget Result (Net Service
Cost) $,000
Rates Funding Required
$,000
Rates Revenue
$,000
Annual Charges
$,000
User Fees and Charges
$,000
Grants and Contributions
$,000 Interest
$,000
Loans, Leases
and Other $,000
Asset Sales $,000
Reserve Funded
$,000 Depreciation
$,000 Non Cash
Contributed $,000
S01 - Culture 4,480 (1,800) 2,680 2,669 0 0 (1,055) (125) 0 (43) 0 (575) 11 0 S02 - Community 2,687 (1,564) 1,122 1,122 0 0 (94) (1,398) 0 (2) 0 (69) 1 0 S03 - Education 4,274 (442) 3,831 3,626 0 0 (151) (233) 0 (54) (3) 0 204 0 S04 - Recreation 3,483 (2,237) 1,246 1,172 0 0 (1,593) 0 0 (10) 0 (634) 73 0 S11 - Business 1,509 (484) 1,024 984 0 0 (253) (167) 0 (1) 0 (63) 40 0 S12 - Health 189 (36) 153 153 0 0 (36) 0 0 0 0 0 0 0 S21 - Urban Development 6,153 (2,714) 3,438 3,438 0 0 (2,702) 0 0 (12) 0 0 1 0 S23 - Urban Landscapes 13,972 (6,468) 7,503 6,594 0 0 (706) (41) 0 (447) 0 (5,274) 908 0 S24 - Natural Landscapes 4,204 (715) 3,489 3,430 0 0 (104) (513) 0 (10) 0 (87) 59 0 S25 - Sustainability 244 (10) 234 234 0 0 0 0 0 0 0 (10) 0 0 S26 – Land-use Planning 3,791 (22,109) (18,318) 2,190 0 0 (118) (21,932) 0 0 0 (59) 0 (20,509) S31 - Transport 32,869 (22,104) 10,764 4,827 0 0 (3,722) (5,860) (15) (438) 0 (12,067) 5,937 0 S32 - Water 28,327 (4,572) 23,755 18,810 0 0 (59) 0 0 (2) 0 (4,511) 4,944 0 S33 - Sewer 21,345 (4,685) 16,659 12,293 0 0 (235) 0 0 0 0 (4,450) 4,366 0 S34 - Waste 6,720 (2,223) 4,496 4,353 0 0 (1,200) 0 0 (157) 0 (865) 143 0 S35 - Facilities 113 0 113 113 0 0 0 0 0 0 0 0 0 0 S36 - Logistics 62,795 (40,584) 22,211 20,265 0 0 (203) (563) (100) (27,910) (830) (10,976) 1,945 0 S41 - People 28 (79) (50) (54) 0 0 (10) 0 0 (1) 0 (68) 3 0 S42 - Technology 1,218 (520) 698 173 0 0 (5) 0 0 0 0 (515) 524 0 S43 - Financial 2,657 (94,200) (91,543) (91,555) (34,332) (32,244) (16,843) (6,148) (4,200) (230) 0 (200) 11 0 S45 - Risk 2,162 (175) 1,987 1,986 0 0 (44) 0 0 (131) 0 0 1 0 S46 - Property 253 (110) 143 (1,562) 0 0 0 0 0 0 0 (110) 1,706 0 S51 - Strategy 770 (5) 765 765 0 0 (5) 0 0 0 0 0 0 0 S52 - Executive Office 7,608 (3,601) 4,007 3,931 0 0 (18) 0 0 0 0 (3,583) 75 0
211,885 (211,448) 437 (13) (34,332) (32,244) (29,164) (36,984) (4,315) (29,451) (833) (44,122) 20,959 (20,509)

Operational Plan 2017-18
29
Comparison of budget and financial assumptions (Percy Allen)
Prior to the merger, the former Queanbeyan City Council engaged Professor Percy Allen and Associates to undertake a Financial and Asset Sustainability Review of the organisation. Following the merger, a similar exercise was undertaken on the former Palerang council assets and finances. It is noted that the Percy Allen review excluded indexation – i.e general rates has indexed by the rate peg of1.5% for 2017-.
This provided a snapshot of the financial and asset position of the new entity and allowed the development of a Financial Strategy for QPRC. This included a number of assumptions, with 2017-18 being the first year in which the assumptions have been assessed alongside the realities of the budget, which can be seen on the right.
Consolidated funds 2017-18
Percy Allen assumptions
$,000
2017-18 budget
$,000
Operating Budget (all projections expressed in constant 2016-17 dollars) Rates and annual charges 63,703 66,578 Fees and user charges 24,550 29,070 Government operating grants 10,666 10,873 Operating contributions and other revenue n.e.i. (incl interest income) 6,931 6,020 Dividends from commercial operations (water and sewerage) 0,000 0,000
Total Revenue 105,850 112,541 Service provision (opex minus interest, maintenance and depreciation expenses) 71,589 77,217 Interest expense 1,562 2,619 Asset maintenance 14,290 22,266 Asset depreciation 22,967 20,960
Total Expenses 110,408 123,062 Operating Surplus/ (Deficit) (4,558) (10,521)
Capital Budget (all projections expressed in constant 2016-17 dollars) Government capital grants 10,741 4,897 Capital contributions (cash) 7,517 0,799 Asset sales 0,873 0,830 Cashflow generated by annual depreciation charge 22,967 20,960
Total Receipts 42,098 27,486 Infrastructure rehabilitation 5,495 1,796 Infrastructure renewals 15,099 8,878 Infrastructure enhancements 61,983 56,451 Acquisition of non-infrastructure assets 3,881 4,123
Total Payments 86,458 71,247 Capital Surplus/ (Deficit) (44,360) (43,761)
OVERALL SURPLUS/(DEFICIT) (48,918) (54,283)
Key sustainability indicators Operating Performance Ratio (% of Total Operating Revenue) -4.3% -9.3%Infrastructure Backlog Ratio (% of Infrastructure WDV) 5.9% -1.5%Debt Service Ratio (% of Total Operating Revenue) 2.8% 3.0%

Operational Plan 2017-18
30
Overview of Fees and Charges for 2016-17
This year a number of factors have impacted on the development of the Operational Plan; these consist of:
Rate Pegging Each year the Independent Pricing and Regulatory Tribunal (IPART) sets a maximum level that councils can increase their rates by. In December 2016, IPART announced that the percentage increase to apply in the 2017-18 financial year would be 1.5%. The rate peg was determined by IPART using a local government cost index and a productivity factor. The Local Government Cost Index (LGCI) increased by 1.47% in the year to September 2016. IPART has a zero adjustment for productivity. This resulted in a rate peg of 1.47% which was rounded to 1.5% for 2017-18.
The total general income for 2016-17 is increased by 1.5% to determine the total general income yield which can be levied in 2017-18. This does not mean that each individual rate assessment will increase by that percentage, but does mean that Council’s total income from ordinary rates cannot exceed this percentage increase, excluding new properties.
Freeze on rate paths In May 2016 the NSW Government announced that there would be a rate freeze policy for newly-merged councils. The rate path freeze policy declares that the general income for each pre-merger council area should follow the trajectory as if the merger had not occurred, and that new councils should not be permitted to equalise ordinary rates across their pre-merger council areas during the period of the rate freeze. The effect of this Bill means that the rate structures for the two former councils of Queanbeyan City and Palerang cannot begin to harmonise until the rating year 2020-21.
Valuation A General Valuation was carried out for all NSW councils to unify the valuation base date across the state in order to levy the Fire and Emergency Services Levy (FESL). In May 2017, the NSW Government announced the indefinite delay of the introduction of the FESL on to Council rates. These valuations with a base date of 1 July 2016, will be used to calculate and levy the 2017-18 ordinary rate.
All properties in the Queanbeyan-Palerang Local Government Area were revalued as at 1 July 2016 by the Valuer General, with valuations increasing by 1.46% in the former Queanbeyan area, and 3.81% for the former Palerang area giving an overall increase of 2.16%. Residential categories in former Queanbeyan increased by an average of 1.48%, while there was an increase of 2.08% in the Farmland category and a decrease of 0.43% in the Business categories. In the former Palerang area Residential properties increased by 4.07%, Farmland by 2.98% and Businesses by 4.85%.

Operational Plan 2017-18
31
Base Charge System Council uses the base charge rating system when developing its rating structure. When using base rating, Council determines a percentage of its rating yield that will be subject to the base rate. The percentage can be up to a maximum of 50%. This amount of the yield is then divided by the number of assessments to determine the base rate. The remainder of the yield is divided by the total land value to determine the ad valorem rate. Therefore base rating has two parts:
a set rate (base rate) and a variable rate (ad valorem) multiplied by the land value (cents in the dollar land valuation).
In 2017-18 these rates will be
Rating Sub-Category Ad Valorem Rate Base Amount $
Former Queanbeyan City Council area Residential – Ordinary 0.1428 475.70 Residential – Urban 0.3763 310.70 Residential – Googong 0.4723 383.20 Residential – Tralee 0.4723 383.20 Rural Residential 0.1428 475.70 Farmland 0.0917 828.10 Business - Ordinary 1.316 421.00 Business - CBD 1.776 621.90 Business - Industrial 0.7888 422.10 Business - Karabar 2.13 508.70 Business – Jerrabomberra 2.13 508.70 Business – Googong 2.13 508.70 Former Palerang area Residential 0.1781 475.00 Business 0.1886 403.00 Farmland 0.1816 1,116.50 Mining 0.5006 1,034.50
Fire and Emergency Services Levy The NSW Government had planned to collect the Fire and Emergency Services Levy via Council rates from 1 July 2017 onwards. However, in May 2017, the NSW Government decided to defer this amendment to allow further investigation to take place.
Example If you own a residential (urban) property in Queanbeyan with its land valued at $200,000 your rates would be: Base rate: $310.70 Ad Valorem: (200,000 x 0.3763) = $762.60 Total: $1,073.30 If you own a residential property in Bungendore or Braidwood with its land valued at $200,000 your rates would be: Base rate: $475 Ad Valorem: (200,000 x 0.1781) = $356.20 Total: $831 Please note: water, sewer and waste fees are charged separately depending on the size of your water meter, consumption levels and waste service provided.

Operational Plan 2017-18
32
Water charges Council has two charges for water – a fixed annual charge and a consumption charge. In 2017-18, water charges will be increasing in line with CPI (2.2%). This will see an increase of $6 per year to $257 for properties with a 20mm meter in the former Queanbeyan City Council area. Annual water charges for residential properties in the former Palerang area will increase from $429 to $440.
Googong residents are levied an access charge for the potable and an additional access charge for the recycled water supply systems separately, as both systems require maintenance and are subject to different operational costs.
Water consumption charges will also increase by 2.2%. In Queanbeyan, residents are charged $3.80 per kilolitre regardless of consumption. While former Palerang operates under a two-tier structure with the first 200kl used per year charged at $2.31 per kilolitre and anything in excess of 200kl is charged at $3.62.
Recycled water charges To promote water conservation, the pricing of recycled water has been calculated at the rate of 5% less than the potable water price. A charge will be raised for the use of the recycled water supply service on a quarterly basis based on the usage recorded through the water meter or meters servicing each property.
Sewerage charges Sewerage charges will increase by 2.2% in 2017-18. Residents in the former Queanbeyan City Council area with a 20mm water meter will see an increase of $14 to $657 per year. While residential properties in the former Palerang area will be charged $1,022 for sewer access, an increase of $22 from 2016-17.
Waste charges Waste charges will increase by 4% in 2017-18. Residents of the two former councils will have access to the same waste services as they did prior to the merger.
Borrowing As previously adopted by Council, the following loan funding will be utilised during 2017-18:
Ellerton Drive Extension – Total project cost $86m, Government contribution $50m, Council loan $36m Queanbeyan Headquarters Redevelopment - $25m loan Braidwood Waste Transfer Station - $2.7m loan
Investments Council has $146m worth of cash investments, with $116m of that held in internally or externally restricted funds. Council forecasts a return of $4.1m for the 2017-18 year.

Com
mun
ity
A safe harmonious, happy and healthy community leading fulfilled lives

Operational Plan 2017-18
34
Community event Budget
$,000 Community events Budget $,000
Seniors Week 3 Christmas Party – Queanbeyan 22 Queanbeyan River Festival 28 Christmas Party - Bungendore 22 Carols in the Park 8 Christmas Party - Braidwood 22 Australia Day Event 22 Kanga Cup 15 Multicultural Festival 25 Queanbeyan Gift (donation) 10 Oktoberfest 25 Christmas in July 25 Music By the River 29
Service - Culture Service
objective: Develop the cultural capacity of the community through the availability and participation in arts,
performance, community and cultural gatherings, events and exhibitions in the Local Government Area.
Service budget 2017-18 $,000
Expenditure Income 4,480 (1,800)
Service Manager Program Net program cost
2017-18 $,000
Project/Action Expenditure $,000
Expected timeframe
Level of engagement
Recreation and Culture
Cultural Development 423 Rusten House Arts Centre 800 Quarter 2 Involve Performing Arts 550 Season shows – The Q 627 Quarter 1-4 Inform Community Gathering 1,159
Events 487
Community events (see list below) 211 Quarter 1-4 Inform, Involve Events brand creation 7 Quarter 2 Inform, Involve Christmas Party Celebrations – Queanbeyan, Bungendore, Braidwood
66 Quarter 2 Consult, Involve
Community and Education Museums 59
Service performance measures
Increased community participation in cultural events and exhibitions and utilisation of centres Improved net returns from performance programs
Service Statement Culture (clickable link)

Operational Plan 2017-18
35
Service - Community Service
objective: Develop the sense of community through the availability and participation in aged, youth, children and
indigenous services, and support for disability services in the Local Government Area
Service budget 2017-18 $,000
Expenditure Income 2,687 (1,564)
Service Manager Program Net program cost
2017-18 $,000
Project/Action Expenditure $,000
Expected timeframe
Level of engagement
Community and Education
Children 72 Youth 478 Youth projects 4 Quarter 4 Involve Community development 556 Domestic Violence initiatives 5 Quarter 4 Collaborate
Reconciliation Walk 4 Quarter 4 Involve Customer and Communications
Community engagement 16
Service performance measures
Increased community participation in community service programs Improved net result from fee funded programs
Service Statement – Community (clickable link)

Operational Plan 2017-18
36
Service - Education Service
objective: Develop the knowledge capacity of the community through the availability and participation in library,
historical and museum services in the Local Government Area
Service budget 2017-18 $,000
Expenditure Income 4,274 442
Service Manager Program Net program cost 2017-18 $,000 Project/Action Expenditure
$,000 Expected timeframe
Level of engagement
Community and Education
Library 2,727 Purchase of E-Books 48 Ongoing Inform Records 1,268
Customer and Communications Animals (165)
Service performance measures
Increased community patronage and borrowings from libraries Improved net result from fee-funded programs
Service Statement – Education (clickable link)

Operational Plan 2017-18
37
Service - Recreation Service
objective: Support the active recreational, sporting and health pursuits of the community through availability of facilities
and participation in programs and events in the Local Government Area
Service budget 2017-18 $,000
Expenditure Income 3,383 (2,237)
Service Manager Program Net program cost 2017-18 $,000 Project/Action Expenditure
$,000 Expected timeframe
Level of engagement
Recreation and Culture
Indoor Sports 174
Aquatic 1,071 Wet Play Area Queanbeyan Aquatic 450 Q2-3 Consult, Inform
Aquatic Centre Paint and Restore 150 Q2-3 Inform Service performance measures
Increased community participation in sporting events and competitions Improved net result from indoor sports and aquatic centres
Service Statement – Recreation (clickable link)

Cho
ice
A diverse, resilient and smart economy that creates choice and job opportunities
Operational Plan 2017-18
39
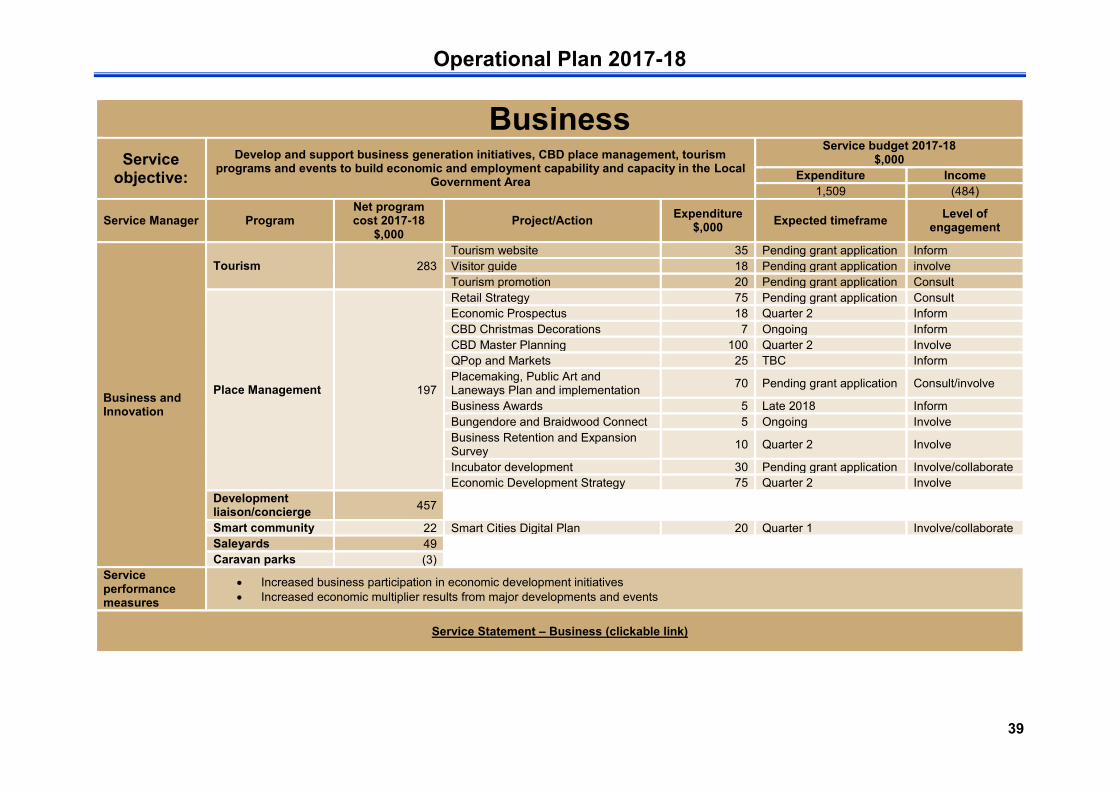
Business Service
objective: Develop and support business generation initiatives, CBD place management, tourism
programs and events to build economic and employment capability and capacity in the Local Government Area
Service budget 2017-18 $,000
Expenditure Income 1,509 (484)
Service Manager Program Net program cost 2017-18
$,000 Project/Action Expenditure
$,000 Expected timeframe Level of engagement
Business and Innovation
Tourism 283 Tourism website 35 Pending grant application Inform Visitor guide 18 Pending grant application involve Tourism promotion 20 Pending grant application Consult
Place Management 197
Retail Strategy 75 Pending grant application Consult Economic Prospectus 18 Quarter 2 Inform CBD Christmas Decorations 7 Ongoing Inform CBD Master Planning 100 Quarter 2 Involve QPop and Markets 25 TBC Inform Placemaking, Public Art and Laneways Plan and implementation 70 Pending grant application Consult/involve
Business Awards 5 Late 2018 Inform Bungendore and Braidwood Connect 5 Ongoing Involve Business Retention and Expansion Survey 10 Quarter 2 Involve
Incubator development 30 Pending grant application Involve/collaborate Economic Development Strategy 75 Quarter 2 Involve
Development liaison/concierge 457
Smart community 22 Smart Cities Digital Plan 20 Quarter 1 Involve/collaborate Saleyards 49 Caravan parks (3)
Service performance measures
Increased business participation in economic development initiatives Increased economic multiplier results from major developments and events
Service Statement – Business (clickable link)

Operational Plan 2017-18
40
Service - Health Service
objective: Manage public and environmental health risk through the determination of applications and monitoring
compliance of air, water, food, skin, sewage and cemeteries activities in the LGA
Service budget 2017-18 $,000
Expenditure Income 189 (36)
Service Manager Program Net program cost 2017-18 $,000 Project/Action Expenditure
$,000 Expected timeframe
Level of engagement
Urban Landscapes Cemetery 153 New cemetery 168 Quarter 1-4 Involve, consult
Service performance measures
Nil public health incidents through incomplete premise compliance inspections Nil environmental health incidents through incomplete premise compliance inspections
Service Statement – Health (clickable link)

Cha
ract
er
A clean, green community that cherishes its natural and physical character

Operational Plan 2017-18
42
Service – Development Service
objective: Support the sustainable growth of the Local Government Area through assessment, determination of
development, subdivision and buildings and manage risk through monitoring their compliance
Service budget 2017-18 $,000
Expenditure Income 6,153 (2,714)
Service Manager Program Net program cost 2017-18 $,000 Project/Action Expenditure
$,000 Expected timeframe
Level of engagement
Development Development Certification 3,434
Service performance measures
Growth in development applications, signalling robust construction sector Improved turnaround of applications in line with statutory period
Service Statement – Development (clickable link)
Operational Plan 2017-18
43
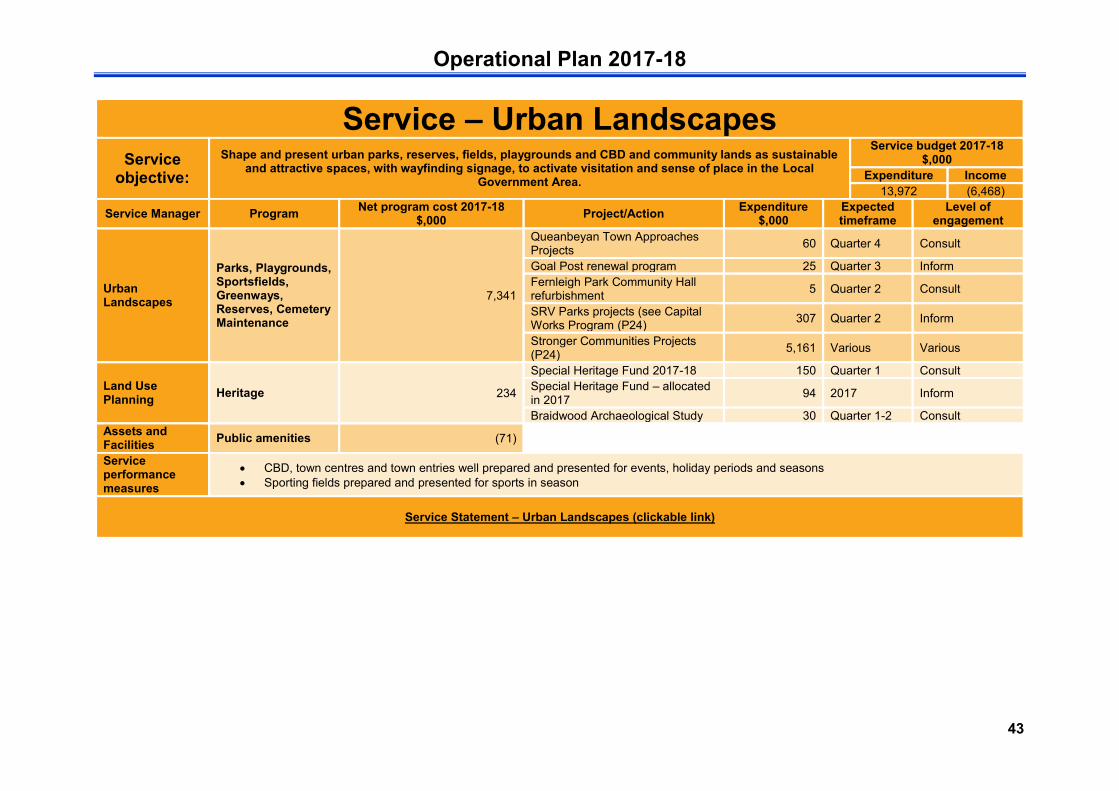
Service – Urban Landscapes Service
objective: Shape and present urban parks, reserves, fields, playgrounds and CBD and community lands as sustainable
and attractive spaces, with wayfinding signage, to activate visitation and sense of place in the Local Government Area.
Service budget 2017-18 $,000
Expenditure Income 13,972 (6,468)
Service Manager Program Net program cost 2017-18 $,000 Project/Action Expenditure
$,000 Expected timeframe
Level of engagement
Urban Landscapes
Parks, Playgrounds, Sportsfields, Greenways, Reserves, Cemetery Maintenance
7,341
Queanbeyan Town Approaches Projects 60 Quarter 4 Consult
Goal Post renewal program 25 Quarter 3 Inform Fernleigh Park Community Hall refurbishment 5 Quarter 2 Consult
SRV Parks projects (see Capital Works Program (P24) 307 Quarter 2 Inform
Stronger Communities Projects (P24) 5,161 Various Various
Land Use Planning Heritage 234
Special Heritage Fund 2017-18 150 Quarter 1 Consult Special Heritage Fund – allocated in 2017 94 2017 Inform
Braidwood Archaeological Study 30 Quarter 1-2 Consult Assets and Facilities Public amenities (71)
Service performance measures
CBD, town centres and town entries well prepared and presented for events, holiday periods and seasons Sporting fields prepared and presented for sports in season
Service Statement – Urban Landscapes (clickable link)

Operational Plan 2017-18
44
Service – Natural Landscapes Service
objective: Sustain the natural qualities of topography, vegetation and waterways to support the environmental and
economic functioning of bio-connections and landscapes, and minimise risk through natural hazards
Service budget 2017-18 $,000
Expenditure Income 4,204 (715)
Service Manager Program Net program cost 2017-18 $,000 Project/Action Expenditure
$,000 Expected timeframe
Level of engagement
Natural Landscapes and Health
Natural resource management, biodiversity
214
Bushland Maintenance 15 Ongoing Consult Platypus Conservation projects 52 Quarter 1-4 Collaborate Trees for Cars/ National Tree Day 7 Quarter 1 Involve Footpath to Suspension Bridge 20 Quarter 1-2 Inform
Vegetation, weeds, hazard reduction 1,999
Environmental health, water, onsite sewage management system monitoring and reporting
1,275
Jerrabomberra Lake Cleanout 80 Quarter 1-4 Inform River Water Sampling Plan 13 Quarter 1-4 Inform Native Fish Restocking of Queanbeyan River 3 Quarter 1-4 Involve
River Rehab - River Drive 37 Quarter 1-4 Inform Sustainability workshops (3) 10 Quarter 1-4 Involve Biosecurity Weed Management contract - Crown Land 25 Quarter 1-4 Inform Biosecurity Weed Management Contract - LLS Land 5 Quarter 1-4 Inform Save our Scarlet Robin Weed Management project 10 Quarter 1-4 Involve
Googong Surface and Ground water monitoring 15 Quarter 1-4 Inform
Service performance measures
Reduced level of weed infestation in productive rural areas Urban interface and rural corridors hazard reduced in advance of fire season, in accord with Rural Fire Service requirement
Service Statement – Natural Landscapes (clickable link)

Operational Plan 2017-18
45
Service – Sustainability Service
objective: Increase awareness, change behaviours and generate offsets to reduce energy and water consumption and
waste generation sourced from non-renewables in community buildings, and through business and residential activity
Service budget 2017-18 $,000
Expenditure Income 244 (10)
Service Manager Program Net program cost 2017-18 $,000 Project/Action Expenditure
$,000 Expected timeframe
Level of engagement
Customer and Communications Education 12 Community events 20 Quarter 2 Involve
Natural Landscapes and Health
Monitoring and reporting 2
Sustainability projects 219 Smarter Action Squad 5 Quarter 1-4 Involve
Service performance measures
Reduced levels of energy consumption from council buildings, sourced from fossil fuel generation Reduced levels of potable water consumption in Council buildings
Service Statement – Sustainability (clickable link)
Operational Plan 2017-18
46
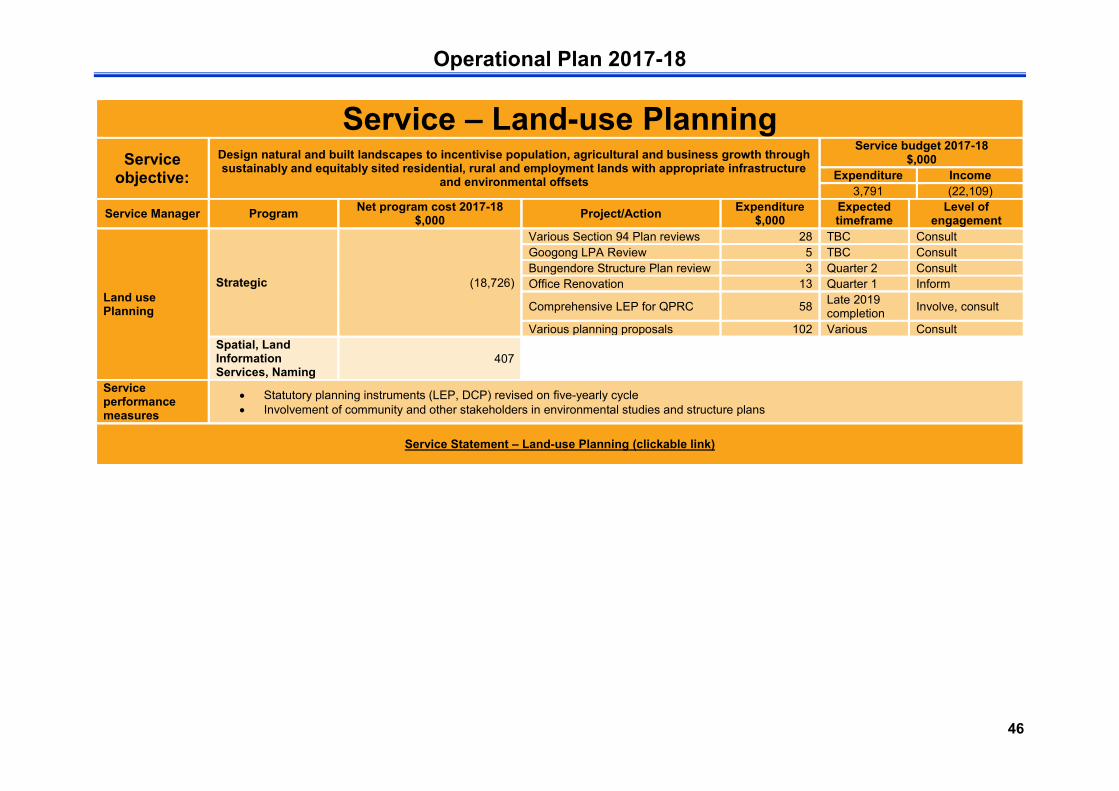
Service – Land-use Planning Service
objective: Design natural and built landscapes to incentivise population, agricultural and business growth through sustainably and equitably sited residential, rural and employment lands with appropriate infrastructure
and environmental offsets
Service budget 2017-18 $,000
Expenditure Income 3,791 (22,109)
Service Manager Program Net program cost 2017-18 $,000 Project/Action Expenditure
$,000 Expected timeframe
Level of engagement
Land use Planning
Strategic (18,726)
Various Section 94 Plan reviews 28 TBC Consult Googong LPA Review 5 TBC Consult Bungendore Structure Plan review 3 Quarter 2 Consult Office Renovation 13 Quarter 1 Inform
Comprehensive LEP for QPRC 58 Late 2019 completion Involve, consult
Various planning proposals 102 Various Consult Spatial, Land Information Services, Naming
407
Service performance measures
Statutory planning instruments (LEP, DCP) revised on five-yearly cycle Involvement of community and other stakeholders in environmental studies and structure plans
Service Statement – Land-use Planning (clickable link)
Con
nect
ion
Cap
abili
ty
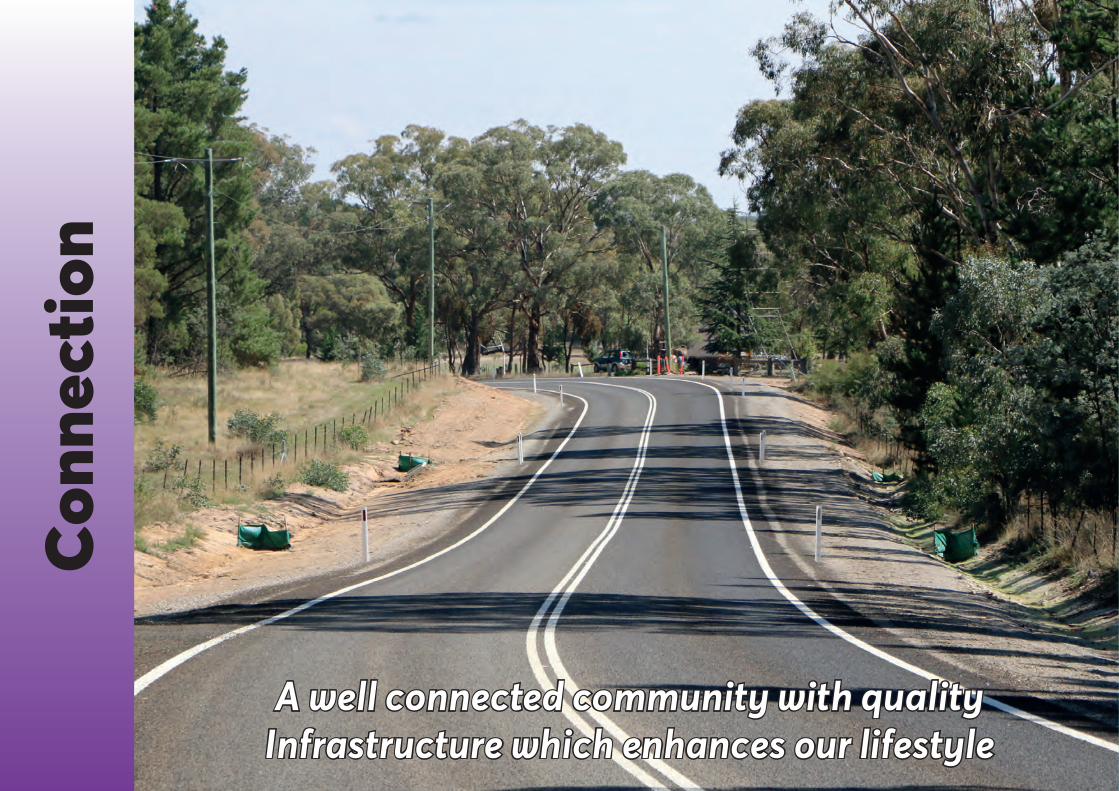
A well connected community with quality Infrastructure which enhances our lifestyle

Operational Plan 2017-18
48
Service – Transport Service
objective: Support the safe and equitable movement of commuters, visitors and freight into and through the Local
Government Area through contemporary maintained and renewed roads, bridge and paths infrastructure and public transport facilities
Service budget 2017-18 $,000
Expenditure Income 32,869 (22,104)
Service Manager Program
Net program cost 2017-18
$,000 Project/Action Expenditure
$,000 Expected timeframe
Level of engagement
Transport
Roads 9,461
Local Roads Operations 4,006 Ongoing Inform Ellerton Drive Extension 1,900 See Page 22 Inform Roads to Recovery Program 278 To be allocated Main road operations 884 Ongoing Inform Regional road operations 324 Ongoing Inform State roads operations 3,717 Ongoing Inform MR92 - Nerriga Rd - resheeting 50 Quarter 2 Inform
MR270 - Captains Flat Rd 281 Resheeting Quarter 2 Reseal Quarter 3
Inform
MR270 Regional Roads Repair Program Rehab Molonglo River Dr to Douglas Cl 600 Quarter1 Inform
MR92 Roads to Recovery Construct and seal Nerriga Rd (Grants Rd toward Charleyong) 1,792 Quarter 3 Inform
MR584 Regional Roads Repair Program Rehabilitation Old Cooma Rd 146 Quarter 2 Inform
Bridges 136 Back Creek Bridge replacement (MR270) 1,750 Quarter 3 Inform
Paths, cycleways 769
SRV - Footpath improvements 245 Ongoing Inform
Bicycle Paths - River Corridor Stage 1 134, plus Stronger Communities Fund
and grant income Quarter 2-3 Consult
Traffic, safety 180 Road Safety Projects 16 Reliant on grant funding TBC
Carparking 106 Public Transport 86 SEWOL, parking 24
Service performance measures
Reduced level of traffic incidents on local roads, due to poor maintenance Reduced levels of congestion, due to well planned, designed and timed upgrades to transport network
Service Statement – Transport (clickable link)

Operational Plan 2017-18
49
Service – Water Service
objective: Support public health and growth through integrated water cycle management and the safe and
equitable delivery of potable water supply to residents and business in the Local Government Area
Service budget 2017-18 $,000
Expenditure Income 28,327 (4,572)
Service Manager Program Net program cost 2017-18 $,000 Project/Action Expenditure
$,000 Expected timeframe
Level of engagement
Utilities
Water operations 21,657
Googong Surface and Ground water monitoring 40 Ongoing Inform
Water and Sewerage Recovery Action Plans 10 Ongoing Internal
Water Supply operations 378 Ongoing Inform Ground Water Monitoring 26 Quarter 2 Inform Water and sewer telemetry upgrade 200 Quarter 3 Inform
Water infrastructure 214
Network capital 820 Ongoing Jerrabomberra Reservoir Cathodic Protection and Internal Painting 1,919 Quarter 3 Inform
Braidwood Water Services Replacement 50 Ongoing Inform
Upgrade of Shoalhaven Pump building (Braidwood) 200 Quarter 3 Inform
Stormwater 1,882 Queanbeyan Stormwater Network Maintenance 233 Ongoing Inform
Stormwater Improvements 350 Ongoing Inform Service performance measures
Reduced consumption of potable water consumed by residential and business properties Reduced incidence of water network failures
Service Statement – Water (clickable link)
Operational Plan 2017-18
50
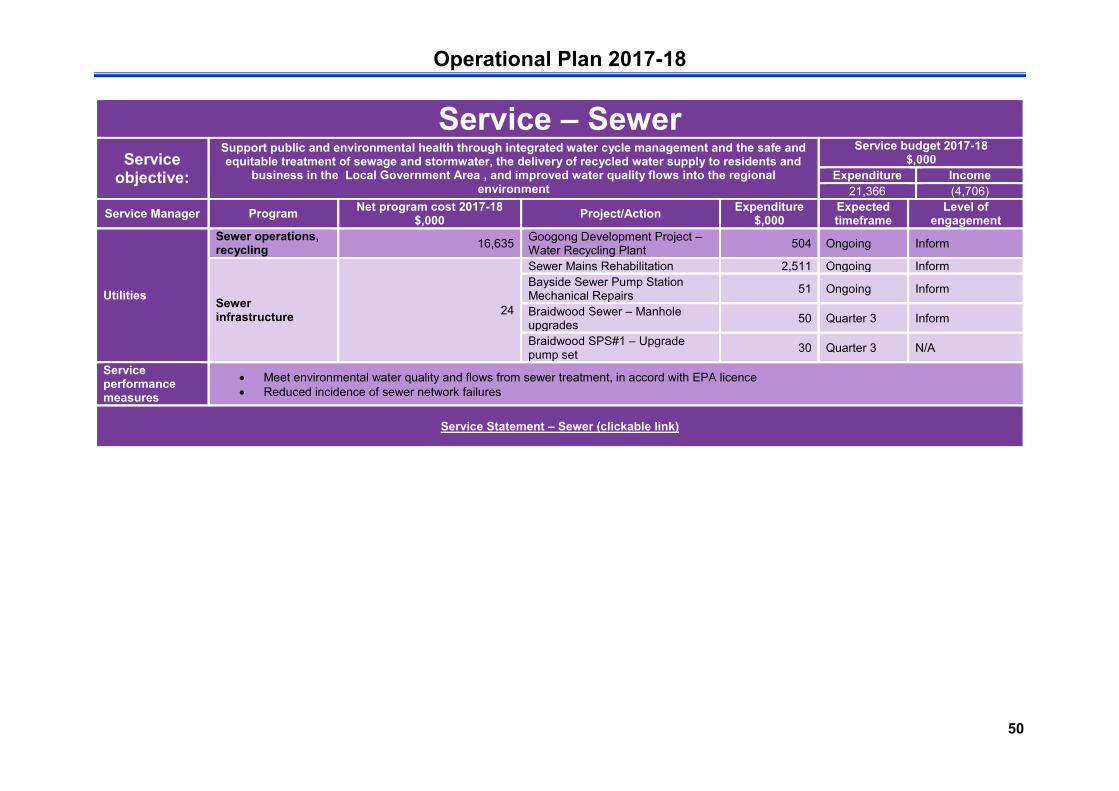
Service – Sewer Service
objective:
Support public and environmental health through integrated water cycle management and the safe and equitable treatment of sewage and stormwater, the delivery of recycled water supply to residents and
business in the Local Government Area , and improved water quality flows into the regional environment
Service budget 2017-18 $,000
Expenditure Income 21,366 (4,706)
Service Manager Program Net program cost 2017-18 $,000 Project/Action Expenditure
$,000 Expected timeframe
Level of engagement
Utilities
Sewer operations, recycling 16,635 Googong Development Project –
Water Recycling Plant 504 Ongoing Inform
Sewer infrastructure 24
Sewer Mains Rehabilitation 2,511 Ongoing Inform Bayside Sewer Pump Station Mechanical Repairs 51 Ongoing Inform
Braidwood Sewer – Manhole upgrades 50 Quarter 3 Inform
Braidwood SPS#1 – Upgrade pump set 30 Quarter 3 N/A
Service performance measures
Meet environmental water quality and flows from sewer treatment, in accord with EPA licence Reduced incidence of sewer network failures
Service Statement – Sewer (clickable link)

Operational Plan 2017-18
51
Service – Waste Service
objective: Support public and environmental health and generation of business through changing community and
business behaviours, minimisation of waste to landfill and greater utilisation of recycled waste
Service budget 2017-18 $,000
Expenditure Income 6,720 (2,223)
Service Manager Program Net program cost 2017-18 $,000 Project/Action Expenditure
$,000 Expected timeframe
Level of engagement
Utilities Waste operations 4,496 WAMI Community Recycling Facility Shed 635 Quarter 2 Inform
Service performance measures
Reduced levels of waste generated by residential and business properties, entering landfill Reduced incidence of waste collection failures
Service Statement – Waste (clickable link)
Operational Plan 2017-18
52
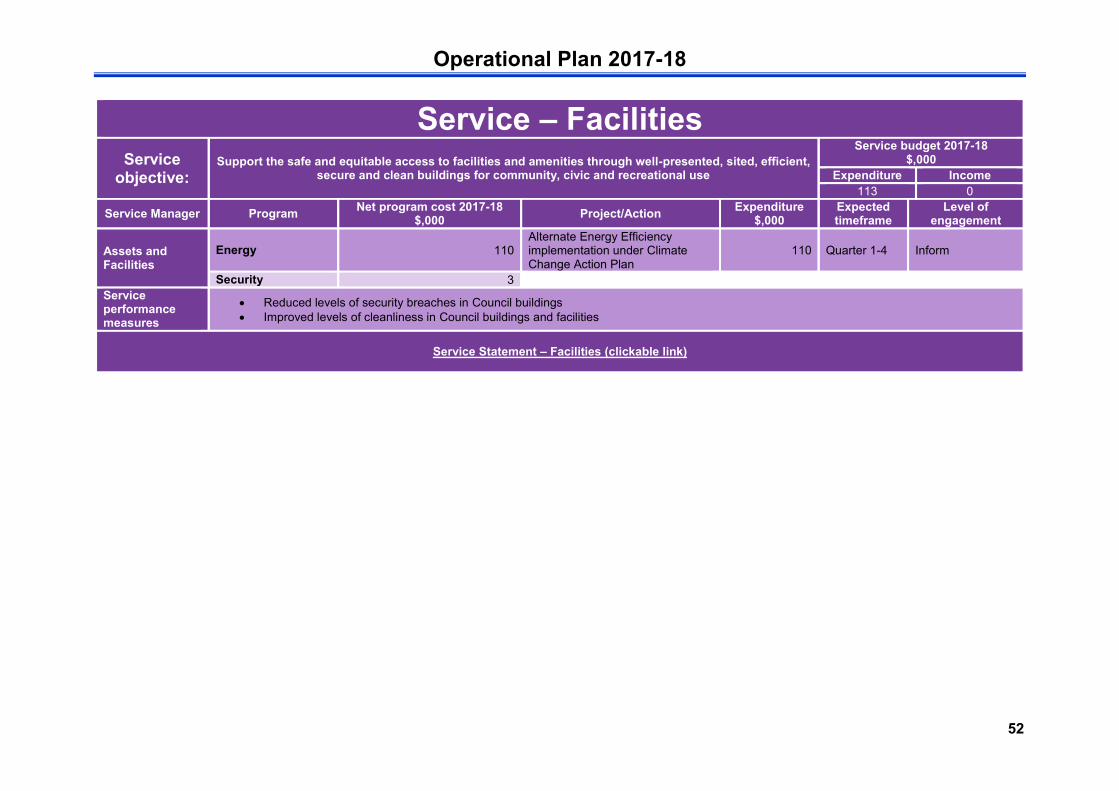
Service – Facilities Service
objective: Support the safe and equitable access to facilities and amenities through well-presented, sited, efficient,
secure and clean buildings for community, civic and recreational use
Service budget 2017-18 $,000
Expenditure Income 113 0
Service Manager Program Net program cost 2017-18 $,000 Project/Action Expenditure
$,000 Expected timeframe
Level of engagement
Assets and Facilities
Energy 110 Alternate Energy Efficiency implementation under Climate Change Action Plan
110 Quarter 1-4 Inform
Security 3 Service performance measures
Reduced levels of security breaches in Council buildings Improved levels of cleanliness in Council buildings and facilities
Service Statement – Facilities (clickable link)

Operational Plan 2017-18
53
Service – Assets and Logistics Service
objective: Provide the asset management logistics for the organisation through well planned, sited and
designed infrastructure and support facilities
Service budget 2017-18 $,000
Expenditure Income 62,795 (40,584)
Service Manager Program Net program cost
2017-18 $,000
Project/Action Expenditure $,000
Expected timeframe
Level of engagement
Contract and Projects Design 56
Assets and Facilities
Asset planning 99
Recycled Water Audit 35 Ongoing Inform Water/Sewer Pricing and Section 64 policy review/development 100 Quarter 1 Consult
Braidwood Inflow/Infiltration Study 200 Quarter 2 Consult Queanbeyan Sewage Treatment Plant Upgrade 6,500 See Page 22 Consult, Involve
Main Admin Building - Redevelopment 25,000 See Page 22 Involve, Consult
Braidwood Waste Transfer Station Construction 2,750 Quarter 1
Consultation complete Inform during construction
Bungendore Recycled Water s60 management 100 Quarter 1 Consult
Bungendore Sewer - SPS#5 refurbishment 150 Quarter 2-3 Inform Captains Flat STP augmentation 1,350 Quarter 2 Consult Water/sewer connections 40 Ongoing Inform
Emergency 567 Plant, fleet, workshop 1,683 Fleet purchases 2,865 Ongoing Inform
Contract and Projects
Contract management/RMS 19,449
Project management 383 Private works (28)
Service performance measures
Asset backlog less than 2% over 10-year cycle Asset renewal and plant replacement cycle retained in line with asset management plans
Service Statement – Assets and Logistics (clickable link)

Cap
abili
tyA capable organisation that leads a community
which is engaged and participative

Operational Plan 2017-18
55
Service – People and Quality Service
objective:
Recruit, retain and remunerate a safe and harmonious workforce placed in the right position at the right time, through contemporary industrial and wellbeing practice, driven by business excellence
frameworks Develop and support contemporary quality frameworks designed to streamline and improve systems
and processes, reduce red tape and promote innovation in work practices
Service budget 2017-18 $,000
Expenditure Income
28 (79)
Service Manager Program Net program cost 2017-18 $,000 Project/Action Expenditure
$,000 Expected timeframe
Level of engagement
Workplace
Human resource management, Industrial Relations
(1) Corporate Development Plan 225 Quarter 1-4 Consult
WHS/wellbeing (68) Culture and Performance
Capability and development 23
Customer and Communications Customer triage (5)
Service performance measures
Reduced level of staff turnover Reduced level of staff unplanned absences Advancement towards quality assurance accredited systems Improvements lead to increased contribution to annual productivity dividend
Service Statement – People (clickable link)
Service Statement – Quality (clickable link)

Operational Plan 2017-18
56
Service – Technology Service
objective: Develop and support a reliable and secure digital and communications platform designed to provide smart and authoritative self-service and mobile services to staff, residents and business in the Local
Government Area
Service budget 2017-18 $,000
Expenditure Income 1,218 (520)
Service Manager Program Net program cost 2017-18 $,000 Project/Action Expenditure
$,000 Expected timeframe
Level of engagement
Digital Network 416 IT Tablet and Phone Purchases 70 Ongoing Inform Hardware Refresh – IT equipment-Budget Income 515 Ongoing Inform
Applications 281 Service performance measures
Reduced level of unplanned network and integration failure Increased level of user maturity with applications
Service Statement – Technology (clickable link)

Operational Plan 2017-18
57
Service – Financial Service
objective: Develop and support a reliable financial management, accounting and reporting environment aligned to
service and project frameworks, to enable authoritative and prompt decisions by the organisation
Service budget 2017-18 $,000
Expenditure Income 2,657 (94,200)
Service Manager Program Net program cost 2017-18 $,000 Project/Action Expenditure
$,000 Expected timeframe
Level of engagement
Chief Financial Officer
Accounting (5,371) Revenue (87,189) Procurement 261 Budget 756
Service performance measures
Fit for Future financial benchmarks retained over five-year cycle Statutory and management reporting cycles met
Service Statement – Financial (clickable link)

Operational Plan 2017-18
58
Service – Risk Service
objective: Positively mitigate jurisdictional and organisational risk through management of risk appetite, risk
controls and collaborative work practices
Service budget 2017-18 $,000
Expenditure Income 2,162 (175)
Service Manager Program Net program cost 2017-18 $,000 Project/Action Expenditure
$,000 Expected timeframe
Level of engagement
Executive Support
Risk (70) Insurances 2,127 Internal audit (105) Business continuity 35
Service performance measures
Reduced levels of incidents convert to insurance claims Unqualified external and internal audits
Service Statement – Risk (clickable link)

Operational Plan 2017-18
59
Service – Property Service
objective: Administer property conveyancing, and strategically invest and generate appropriate returns on
divestment or development of council property
Service budget 2017-18 $,000
Expenditure Income 253 (110)
Service Manager Program Net program cost 2017-18 $,000 Project/Action Expenditure
$,000 Expected timeframe
Level of engagement
Property Coordinator
Property strategy / disposal 143
Service performance measures
Returns from property leasing and sales in line with financial forecasts, to minimise future increases in rates revenue
Service Statement – Property (clickable link)

Operational Plan 2017-18
60
Service – Strategy Service
objective: Establish level of trust and service satisfaction with community and business through multi-channelled,
well-placed and targeted community involvement in planning and projects, information sharing and survey
Service budget 2017-18 $,000
Expenditure Income 770 (5)
Service Manager Program Net program cost 2017-18 $,000 Project/Action Expenditure
$,000 Expected timeframe
Level of engagement
Customer and Communications
Integrated Planning and Reporting, Performance
32 State of the City – End of Term Report 5 Quarter 1 Inform
Communications 733 Chief Financial Officer Financial 0
Service performance measures
Clear line of sight of strategic directions to services and projects, and into budgets and workforce plans Clear reporting of strategic responses, and their success and impacts
Service Statement – Strategy (clickable link)

Operational Plan 2017-18
61
Service – Executive Office Service
objective: Integrate actions and initiatives from strategies and plans, into Community Strategic Plan, and
assess their impacts and success to improve seamless delivery of service and projects
Service budget 2017-18 $,000
Expenditure Income 7,608 (3,601)
Service Manager Program Net program cost 2017-18
$,000 Project/Action Expenditure
$,000 Expected timeframe
Level of engagement
Executive Support
Code and Complaints (0)
Meetings 33 Legal and conveyancing 22
Governance 3,941 Elections 0 CBRJO (0)
Service performance measures
Reduction of legal proceedings against Council Reduction in unacted or delayed resolutions of Council
Service Statement – Executive Office (clickable link)


![Operational Plan - Shire of Quilpie · Doc ID: 98637 [ 2 ] 1 – OPERATIONAL PLANNING PROCESS About the Operational Plan Council’s Operational Plan is the detailed business and](https://static.fdocuments.us/doc/165x107/5b512dd87f8b9a56588bc16c/operational-plan-shire-of-quilpie-doc-id-98637-2-1-operational-planning.jpg)