operational plan 2016-2017 - Home - MidCoast Council€¦ · tourism, timber production, oyster...
74
Great Lakes delivery program 2013-2017 operational plan 2016-2017
Transcript of operational plan 2016-2017 - Home - MidCoast Council€¦ · tourism, timber production, oyster...

1
Great Lakes
delivery program 2013-2017 operational plan 2016-2017

2
ow to find out what's going on at Council The best way to find out information about Council is to read the meeting agenda papers, read the Communicator quarterly newsletter and read Council's weekly ad in local newspapers (the Advocate and
Chronicle), visit the website, or drop into a Council office in Forster, Tea Gardens or Stroud.
ow to contact us
In person Forster customer service centre Breese Pde, Forster Monday to Friday, 8.30am - 4.30pm Tea Gardens customer service centre Myall St, Tea Gardens Monday to Friday, 9.00am - 4.00pm Stroud customer service centre 6 Church Ln, Stroud Monday to Friday, 9.00am - 12.00pm
Phone 02 6591 7222 (main number) 02 4997 0182 (Tea Gardens) 02 4994 5204 (Stroud)
Fax 02 6591 7200
Mail PO Box 450, Forster NSW 2428
Email [email protected]
Web www.midcoast.nsw.gov.au
H
H

3
Contents
Section 1 - Introduction
Section 3 - Statement of Revenue Policy
…………..………………………………………………………... 6 Council's budget………………………………………………. 46
How Council works……………………………………………. 7 Financial Reports – Base Case…………………………. 47
Meetings………………………………………………………… 7 Financial Reports – SRV Scenario………………………………. 52
……………………..……………………………………………... 8 Ordinary Rates…………………………………………………. 57
Our region………………………………………………………. 9 Valuations………………………………………………………. 57
Population………………………………………………………. 10 Compensation of land……………………………………….. 58
Economy………………………………………………………… 10 Rating structure………………………………………………... 59
Employment……………………………………………………. 11 Proposed 2016-2017 rate structure 1.8% increase……… 60
About the plan………………………………………………… 12 Proposed 2016-2017 rate structure 6.5% increase……… 61
NSW Government Merger Proposal ……………………… 12 Interest charges……………………………………………….. 62
Integrated Planning and Reporting Framework………… 13 Annual charges………………………………………………... 62
How do the documents fit together?................................ 13 Pensioner concession………………………………………… 65
Community Strategic Plan - Great Lakes…………………. 14 Hardship…………………………………………………………. 66
Vision……………………………………………………………... 14 Borrowings………………………………………………………. 66
Key Directions - Objectives - Strategies - Performance Outcome Indicators…………………………………………...
15 Section 4 - Asset Management Program (Capital Works)
How we will implement the plan…………………………… 17 2015 - 2016 asset management program (capital works)……………………………………………………………..
68
Organisational structure……………………………………… 17
How we will report on progress……………………………... 18
Section 2 - Delivery Program & Operational Plan
How to read this document………………………….……… 20
2013-2017 delivery program & 2015-2016 operational plan 21 Future projects/programs………………………….………. 42

4
This page has been intentionally left blank

5
section one introduction

6
This page has been intentionally left blank
Sect
ion
1 - i
ntro
duct
ion

7
ow Council works
Council’s main sources of revenue are rates, government grants, investments, fees and other charges. This income is used to provide the community with a range of services. The responsibilities of Council are derived from the Local Government Act 1993 and other Acts enacted by the Parliament of NSW. The Local Government Act and its Regulations serve as an administrative and structural blueprint for all councils in NSW.
eetings
Ordinary Council meetings are open to the public and are generally held on the second and fourth Wednesday of the month. Council also holds other meetings including Traffic Committee. Each Ordinary Council meeting agenda includes a ‘Meet the Public’ session where community members can address Council on matters of interest to them.
H M Section 1 - introduction

8
This page has been intentionally left blank
Sect
ion
1 - i
ntro
duct
ion

9
ur region The Great Lakes region,
covering an area of 3,373 km2 houses an estimated resident population at 2014 of approximately 36,171* and is located about three hours drive north of Sydney on the Mid-North Coast between Port Stephens in the south, Taree in the north. It has a total coastline of 145 kilometres which represents close to one-third of the total open coastline of the Hunter, Central and Lower North Coast Region. A spectacular environment characterised by unspoilt lakes, rivers, beaches, national parks, mountain ranges, hinterland, flora and fauna provide for a lifestyle that many residents and tourists have come to enjoy. Our natural environment is our greatest asset and requires ongoing protection and management to ensure its preservation for the present and future generations. The Great Lakes district was originally home to the Biripi, who inhabited the area between Tuncurry, Taree and Gloucester, and the Worimi, who occupied the land between Barrington Tops and Forster in the north and Maitland and the Hunter River in the south. The Great Lakes is comprised of two main population centres - Forster/ Tuncurry in the north and Tea Gardens/Hawks Nest to the south. In addition there are a number of towns and villages within the region, each with their own unique character, including Stroud, Bulahdelah, Coolongolook, Nabiac, Boomerang Beach, Pacific Palms and Blueys Beach.
*(source: Australian Bureau of Statistics)
O Section 1 - introduction
10
opulation The Great Lakes region has a population of approximately 36,171 and has experienced significant population growth over the last 10 years,
with retirees strongly represented in this growth. Recent population projections suggest that this trend will continue into the foreseeable future. The population characteristics of the Great Lakes local government area are characterised by a significantly higher proportion of people in the older age groups (60+) and a lower proportion of people in the younger age groups (under 15), compared to regional NSW. People aged 60+ years currently represent more than one-third of the Great Lakes total population at 39.5%, making it one of the oldest communities in NSW, double the state average and well above the regional average of 24.5%. From 2006 to 2011, Great Lakes Council area's population increased by 1,667 people (5.1%). This represents an average annual population change of 1.0% per year over the period with the largest changes in age structure in the following age groups:
• 65 to 69 (+411 persons) • 60 to 64 (+396 persons) • 70 to 74 (+383 persons) • 85 and over (+376 persons)
The population forecast for 2036 is 45,850, with a significant 44.7% forecast in the older age groups of 60+. Knowledge of how the age structure of the population is changing is essential for planning age-based facilities and services, such as child care, recreation and aged care.
(source: Australian Bureau of Statistic & population.id & forecast.id) At present 83.3% of our population are Australian born, with 3.8% identifying as being Aboriginal or Torres Strait Islander. English is the main language spoken by 97.8% of our population, and 3.38% of our population are from a non- English speaking background.
conomy Although agriculture remains an important contributor to local economic activity, in more recent years the area has emerged as a popular
‘lifestyle region' with increasing numbers of retirees, people seeking an alternative or coastal lifestyle, and holiday makers. The main industries are tourism, timber production, oyster farming, fishing and grazing. According to the 2011 ABS Census, the majority of jobs in the Great Lakes (around 46%) were generated from ‘In-person Services’ - including retail, accommodation and food services, health care and social assistance, education and training. A further 20% of jobs came from ‘Goods Producing Industries’ including agriculture, forestry and fishing, manufacturing and
P
E
Sect
ion
1 - i
ntro
duct
ion

11
construction, and a further 16% came from ‘Knowledge and Business Services’. A much smaller proportion of employment was generated from ‘Goods Related Industries’ including wholesale trade, transport, postal and warehousing. The majority of the recent growth in jobs has been in the population-driven services of health care and social assistance; with mining, retail and education and training also seeing increases.
mployment The Great Lakes has a higher incidence of part-time employment (especially in tourism and service related industries) and much lower
workforce participation rates (explained in part by the significant proportion of the population who are retired, in addition to the attraction of residents seeking a ‘sea’ or ‘tree’ change and to move out of the workforce), relative to regional NSW. Of the total labour force of 12,071 at the 2011 ABS Census, the local unemployment rate was 8.3% compared with 6.1% for regional NSW. Unemployment, especially amongst young people, remains an important concern for the community. The Great Lakes continues to have one of the highest unemployment rates amongst local government areas within the Hunter Region. Our most recent unemployment figures however are comparable to other coastal local government areas.
The 2011 ABS Census also revealed 80.5% of our employed residents work within the Great Lakes area, with an additional 12.4% travelling from Greater Taree to work in the Great Lakes. The majority of the 19.5% residents who work outside the Great Lakes area travel to Greater Taree (7.2%), followed by Port Stephens and Newcastle to the south. The figures show approximately 793 people travel from the Great Lakes to Taree to work and approximately 1,156 travel from Taree to the Great Lakes.
E
Section 1 - introduction

12
bout the plan This plan combines Council's Delivery Program 2013-2017, and the Operational Plan and Budget for 2016-2017. It is designed as the
single point of reference to outline the Objectives and Strategies from the Community's Strategic Plan - Great Lakes 2030 - that Council will focus on during its 4 year term in office. The Delivery Program covers a four year period from 1 July 2013 - 30 June 2017 while the Operational Plan applies to 1 July 2016 - 30 June 2017. The Operational Plan outlines in more detail the individual activities, services, key projects and capital works that Council will deliver in the year. The plan sets out a program of activities across the full range of Council's services, focussing directly on the Key Directions, Objectives and Strategies outlined in Great Lakes 2030 which are within Council's realm of responsibility and that are supported through the Resourcing Strategy. It includes measures to track our progress in achieving the activities. The Budget for 2016-2017 shows income, expenditure and capital programs. The document also includes information on rates for 2016-2017. Council's fees and charges for 2016-2017 are contained in a separate document available on Council's website. Two budgets have been prepared for 2016-2017 to reflect Council's application to the Independent Pricing and Regulatory Tribunal (IPART) for a special variation to its general income. One budget reflects the application which seeks a 6.5% increase in 2016-2017 followed by 3 annual increases of 4.25% (rate peg inclusive). The second budget is based on the announced rate peg of 1.8% with 2.5% annual increases thereafter.
SW Government Merger Proposal In early Mach 2016, the Minister for Local Government referred a merger proposal to the Chief Executive Officer of the Office of Local
Government for examination by an appointed Delegate. The proposal recommends the merging of Great Lakes Council with Greater Taree City Council and Gloucester Shire Council. The 2016-2017 Operational Plan has been prepared on the basis of Great Lakes Council continuing to function as a separate entity in 2016-2017 pursuing the objectives and strategies previously endorsed and adopted in the Community Strategic Plan - Great Lakes 2030 and the Delivery Program 2013-2017. Announcements concerning the future of Great Lakes Council are expected during June 2016.
A N Se
ctio
n 1
- int
rodu
ctio
n

13
ntegrated Planning and Reporting Framework All NSW Councils are required by legislation to develop short-term, medium-term and long-term plans under the NSW Integrated Planning
and Reporting Framework (IPR). IPR allows Council to draw their various plans together, to understand how they interact and to get the maximum leverage from their efforts by planning holistically for the future of the Great Lakes local government area. Council's integrated planning documents include the following:
► Community Strategic Plan (Great Lakes 2030) ► Delivery Program ► Operational Plan ► Resourcing Strategy (including a Long Term Financial Plan, Asset
Management Strategy & Plans and a Workforce Management Plan) This integrated framework is represented below.
ow do the documents fit together? Community Strategic Plan - Great Lakes 2030 The community's plan for the future, representing the long term aspirations for the area. Council has a role in preparing and monitoring the plan on behalf of the community. Many agencies, groups, partners and the community play a role in delivering the plan. Key elements of the plan:
- 20 year plan - Overarching vision developed by the community - Defines Objectives and Strategies to achieve community goals - Reviewed each four years following the election of Councillors
Delivery Program The Councillor's commitment to delivering on the goals and objectives the community outlined in Great Lakes 2030. Key elements of the program:
- Four year timeframe - Aligned with Council term of office - Sets out principal activities to be undertaken to deliver on Great
Lakes 2030 - All plans, projects, activities and funding allocation must be linked to
this Program
Operational Plan Council's annual plan including the individual projects and activities to be undertaken in that year to achieve the Delivery Program. Key elements of the plan:
- One year timeframe - Provides information on Council's activities, services and projects - Includes Council's Statement of Revenue Policy and estimated
income and expenditure - Sets performance measures
Resourcing Strategy Suite of three documents that set out Council's ability to provide the resources - time, money, assets and people - to carry out the Delivery Program and Operational Plan, and to achieve the community's long-term aspirations. The Strategy focuses in detail on matters that are the responsibility of Council. Key elements of the strategy:
- Long Term Financial Plan - 10 years - Asset Management Strategy & Plans - 10 years - Workforce Management Plan - 4 years
I H Section 1 - introduction
14
ommunity Strategic Plan - Great Lakes 2030
Great Lakes 2030 is about planning a sustainable future for the Great Lakes area and was developed as a collaborative effort between the community and Council. It describes the community's vision for the future of the area and includes four focus areas (expressed as key directions) addressing environmental, economic, social and civic leadership issues in an integrated manner. These key directions have strategies designed to achieve the
objectives of each key direction.
The Plan is Council's guide for informing the Resourcing Strategy, Delivery Program and Operational Plan to deliver the needs of our community over the 20 year period. The key directions, objectives and strategies contained in Great Lakes 2030 are outlined below.
C Se
ctio
n 1
- int
rodu
ctio
n
Vision A unique and sustainably managed environment balanced with quality lifestyle opportunities created through appropriate development, inf rast ructure and serv ices.

15
ey Directions - Objectives - Strategies - Performance Outcome Indicators
Key Direction 1 Our environment
Objective 1: Protect and maintain the natural environment so it is healthy and diverse
1.1 Undertake an active management program to support a healthy environment that also provides for economic, recreational and cultural opportunities
1.2 Encourage and support the community to embrace environmentally friendly behaviours and sustainable business practices
1.3 Manage the balance between natural siltation in our lakes and the provision of access for recreation and economic purposes
1.4 Reduce the impact of noxious weeds and invasive species in our environment through strategic management and education
1.5 Monitor and report on the health, productivity and diversity of the Great Lakes environment
Objective 2: Ensure that development is sensitive to our natural environment
2.1 Base strategic land use planning on ecologically sustainable principles Objective 3: Prepare for the impact of sea level rise and climate change
3.1 Establish a risk based adaptation response to sea level rise and climate change
Objective 4: Sustainably manage our waste
4.1 Seek to reduce, reuse or recycle all waste 4.2 Manage residual waste to minimise impact on the environment 4.3 Implement waste minimisation programs throughout the community Performance outcome indicators - Improved standards of water quality in our lakes and catchments - A reduction per capita of tonnes of waste to landfill - Areas of environmental value are protected by appropriate Local
Environmental Plan provisions while at the same time land is rezoned to provide for population growth
- Environmental management system developed, adopted and implemented; number of actions achieved
Key Direction 2 Strong local economies
Objective 5: Promote the Great Lakes as an area that is attractive for residents and visitors
5.1 Market the Great Lakes as an area that offers a range of opportunities for all
5.2 Explore new and emerging opportunities to promote the Great Lakes Objective 6: Establish and maintain a supportive business environment that encourages job opportunities
6.1 Support our existing business community and encourage the development of new business
6.2 Pursue improved and equitable access to telecommunication services 6.3 Encourage skill development that reflects local business needs Objective 7: Provide transport infrastructure that meets current and future needs
7.1 Identify transport network needs based on recognised asset management processes
7.2 Maintain transport network infrastructure to current service standard 7.3 Develop facilities that provide for safe pedestrian and cycle traffic Performance outcome indicators
- Upgraded and improved transport asset infrastructure reflecting the community’s priorities
- Community satisfaction level with the quality of Council’s transport asset infrastructure
- Community satisfaction level with support provided to local businesses
K Section 1 - introduction

16
Key Direction 3 Vibrant & connected communities
Objective 8: Provide the right places and spaces
8.1 Ensure community, sporting, recreational and cultural facilities and services reflect current and future needs
8.2 Maintain community infrastructure to current service standards Objective 9: Plan for sustainable growth and development
9.1 Manage growth to reflect current and future needs 9.2 Manage urban development and ensure it respects the character of the
area in which it is located Objective 10: Increase and improve access to education for all ages
10.1 Enable opportunities to experience lifelong learning through improved access to educational facilities
Objective 11: Encourage a positive and supportive place for young people to thrive
11.1 Provide activities and opportunities for young people Objective 12: Develop and support healthy and safe communities
12.1 Improve access to health services that meet local needs 12.2 Encourage and promote healthy lifestyles 12.3 Promote community safety as a shared responsibility Objective 13: Build on the character of our local communities and promote the connection between them
13.1 Increase community inclusion, cohesion and social interaction 13.2 Attract new events, activities and exhibitions that are respectful of local
community character Performance outcome indicators
- Improved Council facilities reflecting the community's priorities - Community satisfaction level with Council's facilities and services - Community satisfaction level with town planning - Number of events supported and levels of participation
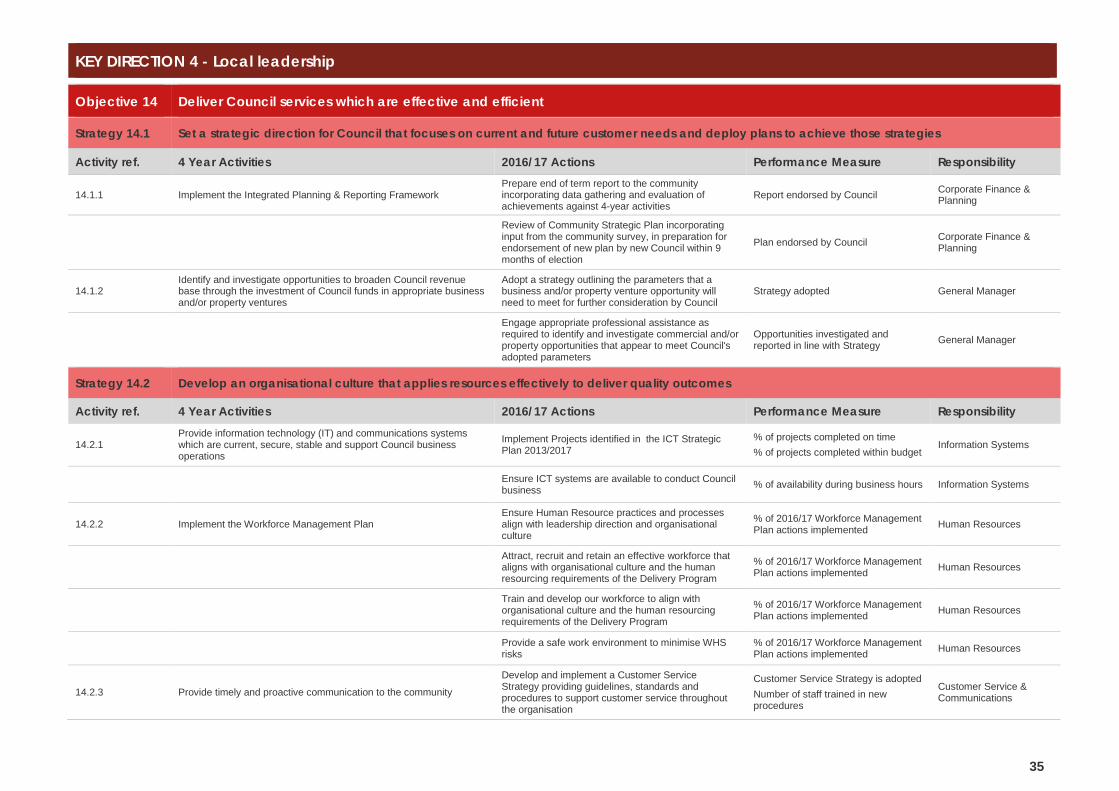
Key Direction 4 Local leadership
Objective 14: Deliver Council services which are effective and efficient
14.1 Set a strategic direction for Council that focuses on current and future customer needs and deploy plans to achieve those strategies
14.2 Develop an organisational culture that applies resources effectively to deliver quality outcomes
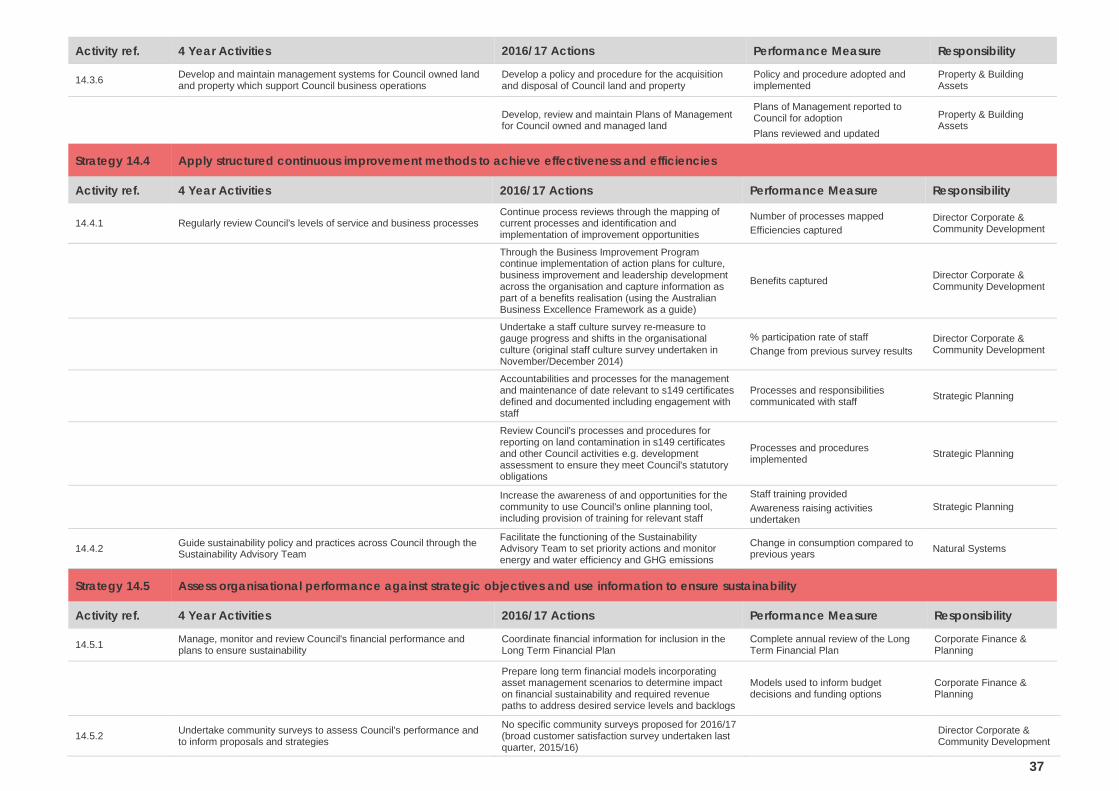
14.3 Provide good governance 14.4 Apply structured continuous improvement methods to achieve
effectiveness and efficiencies 14.5 Assess organisational performance against strategic objectives and use information to ensure sustainability Objective 15: Strengthen community participation
15.1 Encourage an informed community to enable meaningful participation Objective 16: Represent the community's interests through regional partnerships
16.1 Advocate local interest with State and Federal government 16.2 Actively contribute to regional initiatives that benefit the local area Performance outcome indicators
- Community satisfaction level with the overall performance of Council - Community satisfaction level with the overall communication and information
from Council - Organisational performance is reviewed in accordance with a recognised
improvement framework - Advocacy undertaken on behalf of the community on identified community
priorities in the long term Community Strategic Plan
Sect
ion
1 - i
ntro
duct
ion

17
ow we will implement the plan The Delivery Program outlines the priorities to be pursued by Council during its term of office, and the Operational Plan provides details of the projects, works and services being undertaken in the year ahead. Council as an organisation is responsible for delivering the Operational Plan.
The General Manager, Director Corporate & Community Development, Director Engineering Services and Director Planning & Environmental Services form the Management Executive Team and are supported by the following structure.
rganisational structure
H O
General Manager
Corporate & Community
Development
Planning & Environmental Services
Corporate Finance & Planning
Community Engagement
Ageing & Disability Services
Information Systems
Library Services
Human Resources
Customer Services
Property & Building Assets
Marketing & Tourism
Design & Investigation
Transport Asset Management & Maintenance
Parks & Recreation
Operations
Development Assessment
Building Assessment
Natural Resource Management
Strategic Land Use Planning
Waste, Health & Regulatory Services
Elected Council & Committees
Engineering Services
Section 1 - introduction

18
ow we will report on progress It is important to both the community and Council that Council as an organisation reports regularly on its progress toward delivering the
activities, services and projects in the integrated set of plans, and ultimately in delivering Great Lakes 2030. Budget review
- Quarterly - Reports on performance against the adopted budget
Performance report
- Six monthly - Reports on performance in implementing the activities in the Delivery
Program and Operational Plan Annual report
- Annually - Focuses on Council's implementation of the Delivery Program and
Operational Plan - Includes information required by legislation such as audited financial
reports End of term report
- Four yearly - The outgoing Council's report to the community on Council's progress
in implementing Great Lakes 2030 during its term - Focuses on actions and initiatives over which Council has direct
influence State of Environment report
- Four yearly - Produced as part of the Annual Report in the year of the ordinary
election - Reports on environmental objectives in Great Lakes 2030
H Se
ctio
n 1
- int
rodu
ctio
n

19
section two delivery program 2013-2017 operational plan 2016-2017

20
ow to read this document This document is structured around the four Key Directions and associated Objectives and Strategies that form the foundation of the Community Strategic Plan.
The Key Directions define the community’s priorities while the Objectives identify what we are trying to achieve. Supporting these are the Strategies that tell us how we are going to get there and what we will focus on, and the Measures help us know if we're making progress. The Activities for both the four and one year period included in the Delivery Program and Operational Plan indicate Council’s commitment to achieving the outcomes that the community desires, for those strategies that fall within Council’s realm of responsibility.
Those items that are the responsibility of others either solely or in association with Council are identified in Great Lakes 2030, including where Council’s activities link to the NSW State Plan. Potential future projects and programs identified by Council as being aligned with the Community Strategic Plan and the specific capital works program for 2016-2017 follows on from the Delivery Program and Operational Plan. The final section is Council's Statement of Revenue Policy which includes the proposed rates, fees and charges for 2016-2017. The fees and charges for the period are presented in a separate document.
H
Our environment page 21
Strong local economies
page 25
Vibrant & connected
communities page 28
Local leadership page 35

21
KEY DIRECTION 1 - Our environment
Objective 1 Protect and maintain the natural environment so it is healthy and diverse
Strategy 1.1 Undertake an active management program to support a healthy environment that also provides for economic, recreational and cultural opportunities
Activity ref. 4 Year Activities 2016/17 Actions Performance Measure Responsibility
1.1.1 Develop and implement adopted plans and strategies aimed at improving water quality and biodiversity throughout the Great Lakes area
Continued implementation of the Tops to Lakes Strategy with a focus on the upper Karuah River and Branch River catchments
% of annual program implemented Natural Systems
Continue vegetation mapping of Wallis Lake foreshores and wetlands
% of wetlands and foreshores mapped Natural Systems
Develop and implement a biodiversity strategy focussing on reducing key threats Strategy implementation commenced Natural Systems
Implement wetland management program with focus on the protection and rehabilitation of wetlands and foreshore on the lower Wallamba River
% of wetland program implemented Natural Systems
Implement management plans for Darawakh Creek, Kore Kore Creek, Bulahdelah wetland, Wallamba Riverbank restoration and lower Wallamba River wetlands
% of maintenance works completed as per site restoration plan Natural Systems
Develop a stormwater quality management plan for Coomba Park to improve the quality of urban stormwater discharged to Wallis Lake
Stormwater plan adopted by Council Natural Systems
Develop a Foreshore Reserve Management Plan for Southern Wallis Lake from Coomba Park to Tiona Foreshore Plan adopted by Council Natural Systems
Develop and implement an annual program for the implementation of the: -Wallis Lake Estuary and Catchment Plan -Smiths Lake Estuary Coastal Zone Plan -Karuah River Catchment Plan -Great Lakes Water Quality Improvement Plan -Lower Wallamba Rivercare Plan
% of annual program implemented Natural Systems
Ongoing implementation of the Forster Tuncurry Stormwater Plan with a focus on the Dunns Creek catchment water quality improvements and investigation of the Duck Swamp and catchment in Tuncurry
% of annual program implemented Natural Systems
1.1.2 Develop and implement strategies that protect and enhance our natural areas and foreshores, while providing recreational and cultural use
Complete the Federal Governments' Clean Energy Future Biodiversity Fund - Enhance ecosystem resilience & protect biodiversity in the Great Lakes grant, which programs for the protection of biodiversity in the Seal Rocks and Forster area in partnership with NPWS Great Lakes
Hectares of land enhanced for ecosystem resilience Parks & Recreation
22
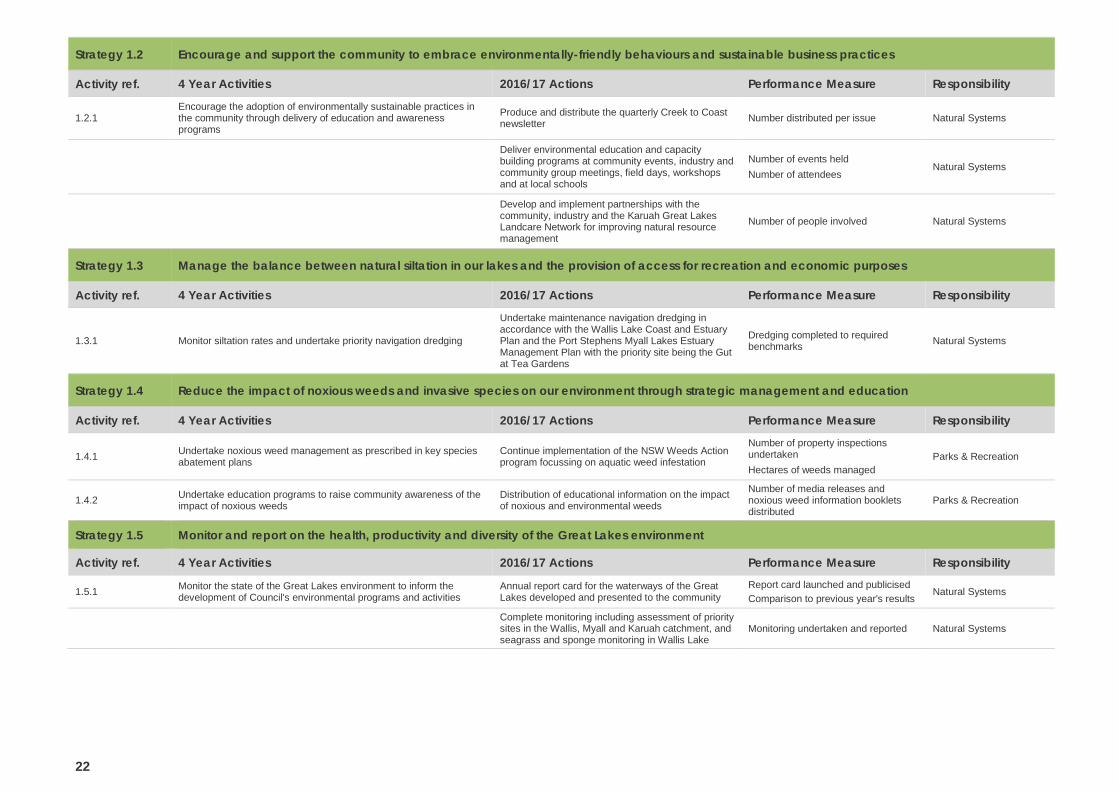
Strategy 1.2 Encourage and support the community to embrace environmentally-friendly behaviours and sustainable business practices
Activity ref. 4 Year Activities 2016/17 Actions Performance Measure Responsibility
1.2.1 Encourage the adoption of environmentally sustainable practices in the community through delivery of education and awareness programs
Produce and distribute the quarterly Creek to Coast newsletter Number distributed per issue Natural Systems
Deliver environmental education and capacity building programs at community events, industry and community group meetings, field days, workshops and at local schools
Number of events held Number of attendees
Natural Systems
Develop and implement partnerships with the community, industry and the Karuah Great Lakes Landcare Network for improving natural resource management
Number of people involved Natural Systems
Strategy 1.3 Manage the balance between natural siltation in our lakes and the provision of access for recreation and economic purposes
Activity ref. 4 Year Activities 2016/17 Actions Performance Measure Responsibility
1.3.1 Monitor siltation rates and undertake priority navigation dredging Undertake maintenance navigation dredging in accordance with the Wallis Lake Coast and Estuary Plan and the Port Stephens Myall Lakes Estuary Management Plan with the priority site being the Gut at Tea Gardens
Dredging completed to required benchmarks Natural Systems
Strategy 1.4 Reduce the impact of noxious weeds and invasive species on our environment through strategic management and education
Activity ref. 4 Year Activities 2016/17 Actions Performance Measure Responsibility
1.4.1 Undertake noxious weed management as prescribed in key species abatement plans
Continue implementation of the NSW Weeds Action program focussing on aquatic weed infestation
Number of property inspections undertaken Hectares of weeds managed
Parks & Recreation
1.4.2 Undertake education programs to raise community awareness of the impact of noxious weeds
Distribution of educational information on the impact of noxious and environmental weeds
Number of media releases and noxious weed information booklets distributed
Parks & Recreation
Strategy 1.5 Monitor and report on the health, productivity and diversity of the Great Lakes environment
Activity ref. 4 Year Activities 2016/17 Actions Performance Measure Responsibility
1.5.1 Monitor the state of the Great Lakes environment to inform the development of Council's environmental programs and activities
Annual report card for the waterways of the Great Lakes developed and presented to the community
Report card launched and publicised Comparison to previous year's results
Natural Systems
Complete monitoring including assessment of priority sites in the Wallis, Myall and Karuah catchment, and seagrass and sponge monitoring in Wallis Lake
Monitoring undertaken and reported Natural Systems
23
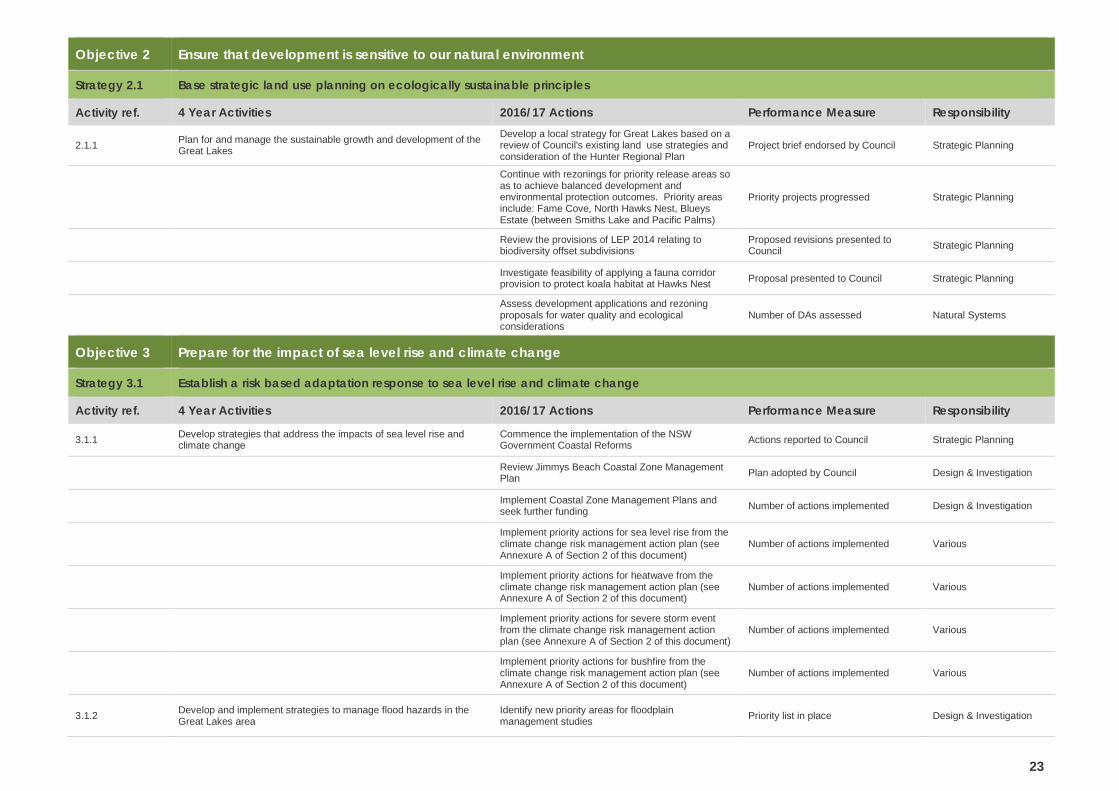
Objective 2 Ensure that development is sensitive to our natural environment
Strategy 2.1 Base strategic land use planning on ecologically sustainable principles
Activity ref. 4 Year Activities 2016/17 Actions Performance Measure Responsibility
2.1.1 Plan for and manage the sustainable growth and development of the Great Lakes
Develop a local strategy for Great Lakes based on a review of Council's existing land use strategies and consideration of the Hunter Regional Plan
Project brief endorsed by Council Strategic Planning
Continue with rezonings for priority release areas so as to achieve balanced development and environmental protection outcomes. Priority areas include: Fame Cove, North Hawks Nest, Blueys Estate (between Smiths Lake and Pacific Palms)
Priority projects progressed Strategic Planning
Review the provisions of LEP 2014 relating to biodiversity offset subdivisions
Proposed revisions presented to Council Strategic Planning
Investigate feasibility of applying a fauna corridor provision to protect koala habitat at Hawks Nest Proposal presented to Council Strategic Planning
Assess development applications and rezoning proposals for water quality and ecological considerations
Number of DAs assessed Natural Systems
Objective 3 Prepare for the impact of sea level rise and climate change
Strategy 3.1 Establish a risk based adaptation response to sea level rise and climate change
Activity ref. 4 Year Activities 2016/17 Actions Performance Measure Responsibility
3.1.1 Develop strategies that address the impacts of sea level rise and climate change
Commence the implementation of the NSW Government Coastal Reforms Actions reported to Council Strategic Planning
Review Jimmys Beach Coastal Zone Management Plan Plan adopted by Council Design & Investigation
Implement Coastal Zone Management Plans and seek further funding Number of actions implemented Design & Investigation
Implement priority actions for sea level rise from the climate change risk management action plan (see Annexure A of Section 2 of this document)
Number of actions implemented Various
Implement priority actions for heatwave from the climate change risk management action plan (see Annexure A of Section 2 of this document)
Number of actions implemented Various
Implement priority actions for severe storm event from the climate change risk management action plan (see Annexure A of Section 2 of this document)
Number of actions implemented Various
Implement priority actions for bushfire from the climate change risk management action plan (see Annexure A of Section 2 of this document)
Number of actions implemented Various
3.1.2 Develop and implement strategies to manage flood hazards in the Great Lakes area
Identify new priority areas for floodplain management studies Priority list in place Design & Investigation

24
Activity ref. 4 Year Activities 2016/17 Actions Performance Measure Responsibility
Implement floodplain risk management plans and seek further funding Number of actions implemented Design & Investigation
Complete stormwater drainage management strategy for North Arm Cove and Bulahdelah Drainage strategy completed Design & Investigation
Identify new priority areas for stormwater drainage strategies Priority list in place Design & Investigation
Objective 4 Sustainably manage our waste
Strategy 4.1 Seek to reduce, reuse or recycle all waste
Activity ref. 4 Year Activities 2016/17 Actions Performance Measure Responsibility
4.1.1 Construct and operate transfer stations that enhance diversion rates Accept tender for and commence construction of the Tuncurry Waste Transfer Station % Transfer Station constructed Waste, Health &
Regulatory
Accept tender for and commence construction of the Tuncurry Community Recycling Centre (CRC) % CRC is constructed Waste, Health &
Regulatory
Accept tender for the operation of the Tuncurry Waste Transfer Centre (TWTC) and the Tuncurry Community Recycling Centre (CRC)
Contract signed for the operation of the TWTC and CRC
Waste, Health & Regulatory
4.1.2 Implement strategies that minimise the quantity of residual waste going to landfill
Implement the adopted master plan for the Tuncurry Waste Management Centre % of master plan implemented Waste, Health &
Regulatory
4.1.3 Align services with the NSW State Strategy targets where possible Complete a local Waste Strategy Action Plan Plan adopted by Council Waste, Health & Regulatory
4.1.4 Utilise 'Waste Less Recycle More' funding to guide future programs Make application for grant funding % of applications lodged are successful
Waste, Health & Regulatory
Strategy 4.2 Manage residual waste to minimise impact on the environment
Activity ref. 4 Year Activities 2016/17 Actions Performance Measure Responsibility
4.2.1 Improve landfill operations to reduce environmental impact Progressively cap Tuncurry Landfill % of landfill capped Waste, Health & Regulatory
Prepare Great Lakes Landfill (Minimbah) for waste disposal % of project completed for 1st cell Waste, Health &
Regulatory
Undertake groundwater monitoring at all landfill sites % of reports containing adverse findings
Waste, Health & Regulatory
Operate landfills in accordance with EPA licence conditions Number of breaches Waste, Health &
Regulatory
4.2.2 Operate Waste Transfer Stations to reduce environmental impact Operate Transfer Stations in accordance with licence conditions
No breaches of licence environmental impact
Waste, Health & Regulatory

25
Strategy 4.3 Implement waste minimisation programs throughout the community
Activity ref. 4 Year Activities 2016/17 Actions Performance Measure Responsibility
4.3.1 Deliver education programs regarding sustainable management of waste to raise awareness throughout the community Delivery of Education Plan activities % of activities implemented Waste, Health &
Regulatory
Undertake Materials Recovery Facility tours Number of tours Number of attendees
Waste, Health & Regulatory
KEY DIRECTION 2 - Strong local economies
Objective 5 Promote the Great Lakes as an area that is attractive for residents and visitors
Strategy 5.1 Market the Great Lakes as an area that offers a range of opportunities for all
Activity ref. 4 Year Activities 2016/17 Actions Performance Measure Responsibility
5.1.2
Ensure the Great Lakes has a strong, vibrant, proactive and successful tourism industry characterised by coordinated and effective leadership that is mindful of its social, cultural, environmental and financial responsibilities
Manage the Great Lakes Partners Program % change in Partners from previous period Community Engagement
Promote the value of tourism to the Great Lakes community
Continue local public relations and support local activities Community Engagement
Provide exceptional products, services and experiences that reflect the unique character of the Great Lakes and matches consumer demand
A database is maintained of Great Lakes product and experiences Support is provided to existing and new products
Community Engagement
5.1.3 Ensure that outstanding levels of customer service are achieved at all levels of customer interaction Manage and resource a skilled Visitor Services Team % of customers indicating satisfaction
with visitor services Community Engagement
5.1.4 Undertake marketing activities that position the Great Lakes as a primary tourist destination in NSW and support the Great Lakes brand
Produce marketing collateral that reflects the region's unique character, actively promotes the region and matches customer demand
Marketing material is produced Community Engagement
Support third party marketing collateral that best reflects the regions unique character and aligns with the Great Lakes brand
Number of involvements in third party marketing Community Engagement
Promote the Great Lakes to identified key source markets as resources allow Number of promotions undertaken Community Engagement
Provide a website that reflects the Great Lakes product and experiences and is available on a variety of devices
% change in number of visitors from same period previous year % change in number of unique visitors from same period previous year % change in bounce rate from previous period on mobile devices
Community Engagement
Communicate the Great Lakes brand message across all media & communication mediums. Website, Social Media, Print, new Signage (highway billboards & banners), emails, correspondence etc
Number and variety of mediums used Community Engagement
26
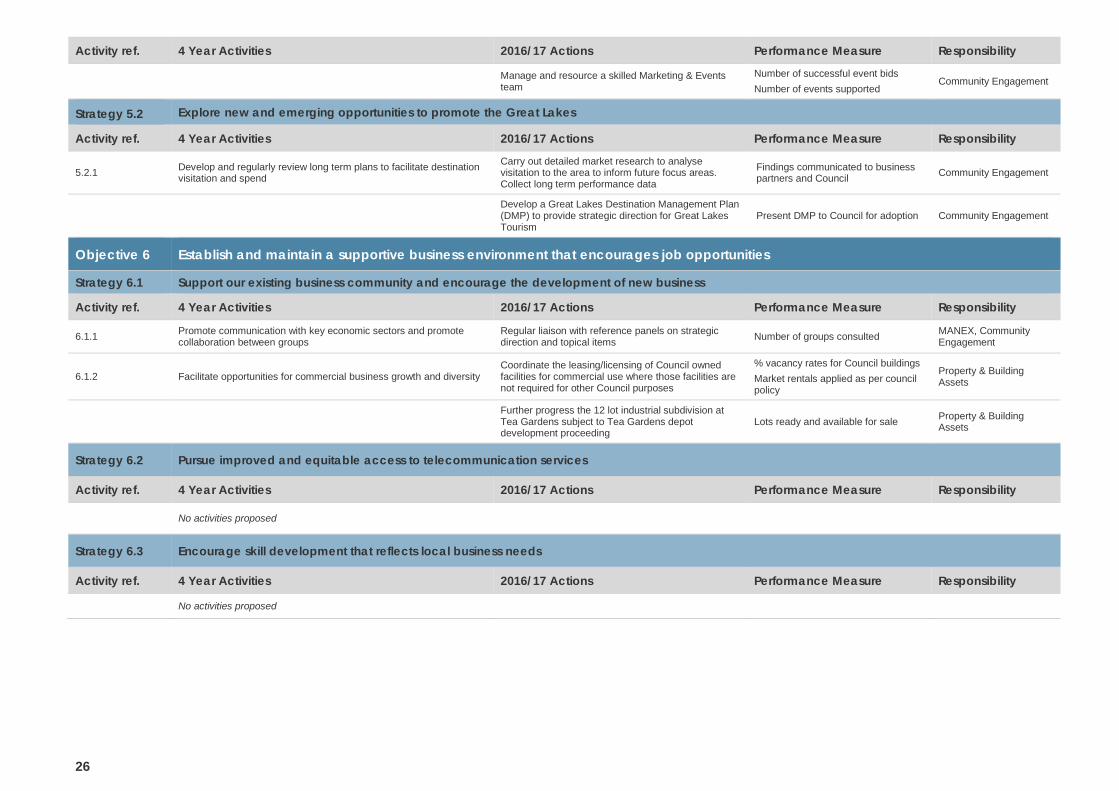
Activity ref. 4 Year Activities 2016/17 Actions Performance Measure Responsibility
Manage and resource a skilled Marketing & Events team
Number of successful event bids Number of events supported
Community Engagement
Strategy 5.2 Explore new and emerging opportunities to promote the Great Lakes
Activity ref. 4 Year Activities 2016/17 Actions Performance Measure Responsibility
5.2.1 Develop and regularly review long term plans to facilitate destination visitation and spend
Carry out detailed market research to analyse visitation to the area to inform future focus areas. Collect long term performance data
Findings communicated to business partners and Council Community Engagement
Develop a Great Lakes Destination Management Plan (DMP) to provide strategic direction for Great Lakes Tourism
Present DMP to Council for adoption Community Engagement
Objective 6 Establish and maintain a supportive business environment that encourages job opportunities
Strategy 6.1 Support our existing business community and encourage the development of new business
Activity ref. 4 Year Activities 2016/17 Actions Performance Measure Responsibility
6.1.1 Promote communication with key economic sectors and promote collaboration between groups
Regular liaison with reference panels on strategic direction and topical items Number of groups consulted MANEX, Community
Engagement
6.1.2 Facilitate opportunities for commercial business growth and diversity Coordinate the leasing/licensing of Council owned facilities for commercial use where those facilities are not required for other Council purposes
% vacancy rates for Council buildings Market rentals applied as per council policy
Property & Building Assets
Further progress the 12 lot industrial subdivision at Tea Gardens subject to Tea Gardens depot development proceeding
Lots ready and available for sale Property & Building Assets
Strategy 6.2 Pursue improved and equitable access to telecommunication services
Activity ref. 4 Year Activities 2016/17 Actions Performance Measure Responsibility
No activities proposed
Strategy 6.3 Encourage skill development that reflects local business needs
Activity ref. 4 Year Activities 2016/17 Actions Performance Measure Responsibility
No activities proposed

27
Objective 7 Provide transport infrastructure that meets current and future needs
Strategy 7.1 Identify transport network needs based on recognised asset management processes
Activity ref. 4 Year Activities 2016/17 Actions Performance Measure Responsibility
7.1.1 Maintain Asset Management Plans (AMPs) for Transport Assets infrastructure
Ongoing updating of asset information in AMP
Asset database is current and accurate Transport Assets
7.1.2 Prepare prioritised transport asset and infrastructure renewal, enhancement and maintenance programs within allocated budget
Provide and monitor renewal and maintenance programs and associated budgets to Operations Reductions in backlog amount Transport Assets
7.1.3 Improve the safety of roads and roadside environment Undertake accident analysis LGA wide
Number of accidents recorded LGA wide Accident analysis informs works program
Design & Investigation
Install traffic calming facilities within allocated budget Number of traffic calming facilities installed Design & Investigation
Strategy 7.2 Maintain transport network infrastructure to current service standard
Activity ref. 4 Year Activities 2016/17 Actions Performance Measure Responsibility
7.2.1 Deliver transport asset and infrastructure renewal, enhancement and maintenance programs within allocated budgets
Deliver annual programs for: - urban, rural and regional road renewal and construction - urban, rural and regional road maintenance - bridge upgrade/replacement - stormwater upgrade - risk management inspections in accordance with allocated budgets
% of individual programs completed % of individual programs budget expended
Operations
7.2.2 Deliver Road & Maritime Services (RMS) state road maintenance and renewal programs in accordance with the Road Maintenance Council Contract
Deliver renewal, rehabilitation, resurfacing and maintenance program as per RMS contract specifications
% of individual programs completed within contract specifications Operations
Strategy 7.3 Develop facilities that provide for safe pedestrian and cycle traffic
Activity ref. 4 Year Activities 2016/17 Actions Performance Measure Responsibility
7.3.1 Develop and deliver a cycleway network program within allocated budget
Undertake review of the GLC 2010 Bike Plan and associated priorities and actions
Updated programme adopted by Council Design & Investigation
Deliver cycleway projects within allocated budget Number of metres of cycleway installed Design & Investigation
7.3.2 Provide walking and cycling paths that link the area's foreshores, parks and reserves
Connect walking paths in the vicinity of Little Street and Memorial Drive, and enhance and expand foreshore green space for public enjoyment
Metres of walking path installed Increase in square metres of foreshore green space
Parks & Recreation
Continue to develop the 'Great Walks' program that aims to connect and expand on existing walking trails across the Great Lakes
Plan developed Strategic Planning

28
Activity ref. 4 Year Activities 2016/17 Actions Performance Measure Responsibility
7.3.3 Implement Great Lakes Council's Road Safety Strategic Plan Implement actions identified in Road Safety Strategic Plan
Number of road safety projects delivered Design & Investigation
Revise Road Safety Strategic Plan Revised Plan reported to Council Design & Investigation
KEY DIRECTION 3 - Vibrant & connected communities
Objective 8 Provide the right places and spaces
Strategy 8.1 Ensure community, sporting, recreational and cultural facilities and services reflect current and future needs
Activity ref. 4 Year Activities 2016/17 Actions Performance Measure Responsibility
8.1.1 Maintain Asset Management Plans (AMPs) for community buildings and recreation infrastructure
Review, maintain and update community buildings AMPs to reflect acquisitions, disposals and building renewals
Plans updated at least annually Property & Building Assets
Undertake a condition audit of community buildings and update asset management system and AMP
Audit report completed and reported to Council
Property & Building Assets
Select a corporate building asset management system in accordance with the ICT Strategy System selected Property & Building
Assets
Undertake asbestos audits of buildings not previously inspected
Asbestos management plans prepared
Property & Building Assets
8.1.2 Provide and maintain parks and recreation facilities which meet the varied needs of the community
Undertake capital renewal works as identified in the Asset Management Plans and within allocated budgets
Projects completed within budget Parks & Recreation
Continue investigations into 'Free Camping' option within the Great Lakes and present findings to Council for consideration
Options presented to Council Director Planning & Environmental Services
Implement improvements to boating infrastructure across the Great Lakes area through the successful 'Boating Now' grant funding received from the Roads and Maritime Services (RMS)
% of works completed Parks & Recreation
8.1.3 Provide and maintain public buildings which meet the varied needs of the community
Ensure Council buildings that are used by community groups and organisations are subject to a lease or licence arrangement
% of Council buildings subject to a lease or licence agreement
Property & Building Assets
Develop annual works program for the maintenance, upgrade and improvement of public buildings that reflect the needs of the users and AMPs
Works programmed Property & Building Assets
Undertake maintenance and renewal of public buildings in accordance with works programs
% of maintenance budget allocation expended % of capital work program undertaken
Operations
8.1.4 Maintain the Great Lakes Aquatic and Leisure Centre (GLALC) and services provided at a level that meets the needs of the community
Review and monitor programs each quarter to ensure needs of the various sections of the community are met - including the aged, youth, indigenous and people with a disability
GLALC management report reviewed Property & Building Assets

29
Activity ref. 4 Year Activities 2016/17 Actions Performance Measure Responsibility
Review customer surveys undertaken by contract management to determine level to which the facility meets customer needs
% of customers indicating high level of satisfaction
Property & Building Assets
Develop and deliver a works program for the maintenance, upgrade and improvement of the GLALC that reflects the needs of the users and AMPs
% of works program undertaken
Property & Building Assets
8.1.5 Provide library programs, resources and facilities that offer opportunities for education and leisure and which meet the varied needs of the community
Provide library programs, resources and facilities that offer opportunities for education and leisure and which meet the varied needs of the community
Number of visitations at library service points per 6 month period. Number items held in the collection and eResources Number of home visits Number of internet hours booked
Library Services
Assess Library against State Library Standards and Guidelines as a benchmark for future development
% of indicators meeting or exceeding benchmark Library Services
Provide customer feedback mechanisms to monitor provision of high level customer service
% of customers indicating dissatisfaction with library services Number of positive comments
Library Services
Assist residents of the local community to improve literacy levels and to improve their quality of life through the “Better Reading Better Community” initiative
Number tutors active Library Services
8.1.6 Implement the Great Lakes Cultural Plan within available funding and resource levels
Develop revised Cultural Plan after consultation with community Plan adopted by Council Community Engagement
Develop a Heritage Management Conservation Plan for Bulahdelah Court House Plan adopted by Council Community Engagement
8.1.7 Provide financial support to and strategic management of the operation of the Great Lakes Band S355 Committee
Support the activities of the Great Lakes Band. Great Lakes Band performs at Council functions as requested
Number of performances by band Community Engagement
8.1.8 Provide appropriate cemetery services to meet the needs of the community
Implement the recommendations of the 2013 Service Level Review and adopted Cemetery Policy
Number of recommendations implemented Number of recommendations outstanding
Community Engagement
Continually review processes to ensure the best customer service outcomes
Number of processes reviewed Number of customer compliments and complaints received
Community Engagement
Strategy 8.2 Maintain community infrastructure to current service standard
Activity ref. 4 Year Activities 2016/17 Actions Performance Measure Responsibility
8.2.1 Deliver park assets and community buildings enhancement and maintenance programs within allocated budgets
Deliver programs for: - risk management inspections of Parks & Recreation assets - recreation facility maintenance
% of quarterly inspections completed on time % of individual programs completed % of individual programs budget expended
Parks & Recreation
Delivery of construction and renewal programs per adopted capital work program % of program completed Operations

30
Objective 9 Plan for sustainable growth and development
Strategy 9.1 Manage growth to reflect current and future needs
Activity ref. 4 Year Activities 2016/17 Actions Performance Measure Responsibility
9.1.1 Monitor and update Council's land use planning framework to ensure it is responsive to the community's social, economic and environmental expectations
Monitor, review and provide input on new State Government policy and legislation that has implications for Council's strategic land use planning
Submissions made to the State Government Strategic Planning
Finalise planning proposals for amendments to LEP 2014 based on submissions received on the draft plan (e.g. flexible zone boundary provisions and zone adjustment Macwood Rd, Smiths Lake)
Planning proposals are exhibited e.g.. Strategic Planning
Finalise high priority planning proposals for amendments to the LEP for matters raised since the introduction of LEP 2014 (e.g. update of heritage schedule, revised coastal erosion mapping, rezoning Council land to environmental conservation)
Planning proposals exhibited Strategic Planning
Review format, structure and layout of Great Lakes DCP to make it more user friendly for online customers
Draft revised DCP exhibited Strategic Planning
Undertake high priority amendments to Great Lakes DCP (e.g. provisions for tree management)
High priority DCP amendments considered by Council Strategic Planning
Finalise a planning proposal for the review of zones in the Hawks Nest town centre
Planning proposal is made by the Minister Strategic Planning
Prepare and finalise other planning proposals, that are endorsed by Council as high priority, in accordance with available resources
Number of planning proposals adopted by Council Strategic Planning
Prepare a community engagement strategy to progress the Tea Gardens Recreational and Cultural Precinct project, in conjunction with planning proposal for the reconfiguration of zones in the vicinity of Myall Quays shopping centre at Riverside, Tea Gardens
Masterplan presented to Council Planning proposal exhibited
Strategic Planning
Amend Great Lakes LEP 2014 Flood Planning Area maps as required in response to new flood study data
Planning proposal is prepared Strategic Planning
Strategy 9.2 Manage urban development and ensure it respects the character of the area in which it is located
Activity ref. 4 Year Activities 2016/17 Actions Performance Measure Responsibility
9.2.1 Provide pre-development advice to applicants to assist in preliminary assessment of development applications and improve the quality of applications lodged
Continue operation of the Development Assessment Panel (DAP)
Number of individual proposals considered by DAP Number of DAs lodged that have been to DAP Number of those DAs that meet required standard
Development Assessment
Continue provision of the Duty Planner service Number of enquiries in the period Development Assessment

31
Activity ref. 4 Year Activities 2016/17 Actions Performance Measure Responsibility
9.2.2 Determine development applications and certificates in accordance with legislation and Council's plans and policies Assess and process development applications
Number of DAs received Number of DAs determined Number of DAs determined within required timeframe
Development Assessment
Issue construction certificates to ensure buildings are designed and constructed in accordance with the relevant legislation
Number of applications received Number of applications determined
Building Assessment
9.2.3 Implement effective building regulation and compliance activities Undertake critical stage inspections of buildings under construction where Council is the principal certifying authority
% of critical stage inspections undertaken Building Assessment
9.2.4 Manage and preserve the cultural heritage of the Great Lakes area Refer all applications with heritage implications to the Heritage Adviser for specialist advice Number of applications referred Strategic Planning
9.2.5 Manage the urban landscape to enhance our towns and villages Town entrance planting to continue in Tuncurry at Cassandra Crescent, Tuncurry % of works completed Parks & Recreation
Objective 10 Increase and improve access to education for all ages
Strategy 10.1 Enable opportunities to experience lifelong learning through improved access to educational facilities
Activity ref. 4 Year Activities 2016/17 Actions Performance Measure Responsibility
10.1.1 Advocate to increase access to tertiary education for local residents and businesses by encouraging a cooperative approach between education providers at a local and regional level
No action proposed for 2016/17 General Manager
Objective 11 Encourage a positive and supportive place for young people to thrive
Strategy 11.1 Provide activities and opportunities for young people
Activity ref. 4 Year Activities 2016/17 Actions Performance Measure Responsibility
11.1.1 Advocate for and provide activities and services targeted at youth Install wet play facility within Nabiac Pool complex. Wet play facility installed. Parks & Recreation
Provide programs through Library Services including: HSC study nights, homework help program, pre-school storytime services, school holiday activities and Code Club
Number of activities held Number of participants in programs
Library
Objective 12 Develop and support healthy and safe communities
Strategy 12.1 Improve access to health services that meet local needs
Activity ref. 4 Year Activities 2016/17 Actions Performance Measure Responsibility
12.1.1 Provide Ageing and Disability Support Services to meet the needs of the Great Lakes community
Manage Ageing & Disability Services to support residents to remain in their own homes across the Great Lakes, Gloucester and Manning areas in accordance with approved contracts and business plans
% of operating plan targets met % of budget expended
Community Engagement
32
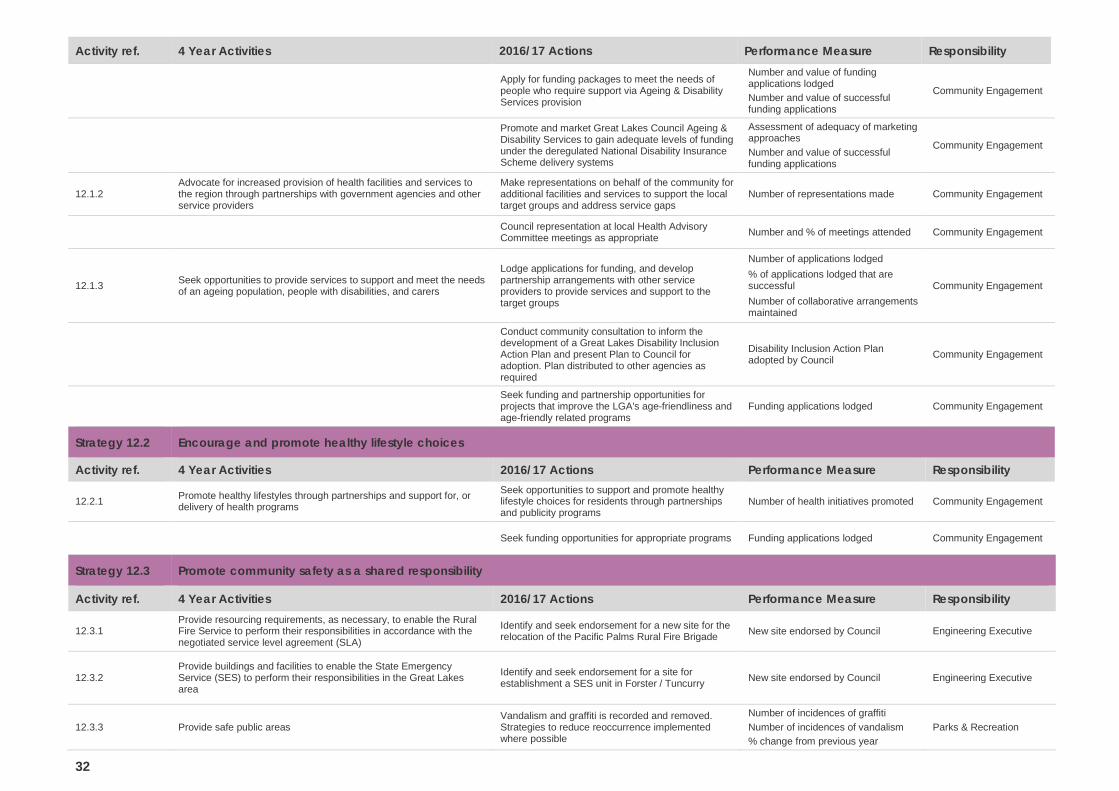
Activity ref. 4 Year Activities 2016/17 Actions Performance Measure Responsibility
Apply for funding packages to meet the needs of people who require support via Ageing & Disability Services provision
Number and value of funding applications lodged Number and value of successful funding applications
Community Engagement
Promote and market Great Lakes Council Ageing & Disability Services to gain adequate levels of funding under the deregulated National Disability Insurance Scheme delivery systems
Assessment of adequacy of marketing approaches Number and value of successful funding applications
Community Engagement
12.1.2 Advocate for increased provision of health facilities and services to the region through partnerships with government agencies and other service providers
Make representations on behalf of the community for additional facilities and services to support the local target groups and address service gaps
Number of representations made Community Engagement
Council representation at local Health Advisory Committee meetings as appropriate Number and % of meetings attended Community Engagement
12.1.3 Seek opportunities to provide services to support and meet the needs of an ageing population, people with disabilities, and carers
Lodge applications for funding, and develop partnership arrangements with other service providers to provide services and support to the target groups
Number of applications lodged % of applications lodged that are successful Number of collaborative arrangements maintained
Community Engagement
Conduct community consultation to inform the development of a Great Lakes Disability Inclusion Action Plan and present Plan to Council for adoption. Plan distributed to other agencies as required
Disability Inclusion Action Plan adopted by Council Community Engagement
Seek funding and partnership opportunities for projects that improve the LGA's age-friendliness and age-friendly related programs
Funding applications lodged Community Engagement
Strategy 12.2 Encourage and promote healthy lifestyle choices
Activity ref. 4 Year Activities 2016/17 Actions Performance Measure Responsibility
12.2.1 Promote healthy lifestyles through partnerships and support for, or delivery of health programs
Seek opportunities to support and promote healthy lifestyle choices for residents through partnerships and publicity programs
Number of health initiatives promoted Community Engagement
Seek funding opportunities for appropriate programs Funding applications lodged Community Engagement
Strategy 12.3 Promote community safety as a shared responsibility
Activity ref. 4 Year Activities 2016/17 Actions Performance Measure Responsibility
12.3.1 Provide resourcing requirements, as necessary, to enable the Rural Fire Service to perform their responsibilities in accordance with the negotiated service level agreement (SLA)
Identify and seek endorsement for a new site for the relocation of the Pacific Palms Rural Fire Brigade New site endorsed by Council Engineering Executive
12.3.2 Provide buildings and facilities to enable the State Emergency Service (SES) to perform their responsibilities in the Great Lakes area
Identify and seek endorsement for a site for establishment a SES unit in Forster / Tuncurry New site endorsed by Council Engineering Executive
12.3.3 Provide safe public areas Vandalism and graffiti is recorded and removed. Strategies to reduce reoccurrence implemented where possible
Number of incidences of graffiti Number of incidences of vandalism % change from previous year
Parks & Recreation

33
Activity ref. 4 Year Activities 2016/17 Actions Performance Measure Responsibility
12.3.4 Undertake Fire Management responsibilities on public land On ground maintenance works are undertaken in line with current fire mitigation plans
% of total area in plans maintained % of works program completed
Parks & Recreation
Review and update Pindimar / Bundabah Fire Mitigation Plan and Forster Fire Mitigation Plan
Number of plans reviewed and updated Parks & Recreation
12.3.5 Implement regulatory and compliance services and programs to maximise public health and safety Undertake fire safety audits as resources allow
Number of audits taken % of audits outstanding
Building Assessment
Undertake inspections in accordance with the adopted Swimming Pool Inspection Program
Number of applications for compliance certificates received Number of inspections undertaken Number of compliance certificates issued
Building Assessment
Receive fire safety statements and follow up overdue statements
% of received and overdue statements followed up Building Assessment
Undertake Companion Animal Act responsibilities Number of dog attacks investigated Number of Companion Animal declarations issued
Waste, Health & Regulatory
Undertake regulatory responsibilities in relation to parking and road matters
Number of parking related fines issued
Waste, Health & Regulatory
Undertake regulatory responsibilities under other legislation Number of fines issued Waste, Health &
Regulatory
Undertake legislative responsibilities in relation to food premises
Number of fines issued Number of premises inspected
Waste, Health & Regulatory
Undertake legislative responsibilities in relation to on-site septic systems
Number of fines issued Number of premises inspected
Waste, Health & Regulatory
Provide regular newsletters to promote food safety within the retail food sector Number of newsletters distributed Waste, Health &
Regulatory
12.3.6
Promote safety through liaison and communication with the NSW Police Force and implementation of crime prevention plans as appropriate
Represent Council at Community Safety Precinct Committee meetings with the Manning Great Lakes Police Command and report matters to Council as required
Number of meetings attended Community Engagement
Continued liaison with NSW Police to improve safety at large public events
Number of events where liaison occurs Community Engagement
12.3.7 Ensure the Great Lakes Emergency Management Plan (EMPLAN) remains current, in collaboration with member agencies of the Local Emergency Management Committee
Present new EMPLAN to the local and regional Emergency Management Committees for adoption EMPLAN adopted Engineering Executive
Objective 13 Build on the character of our local communities and promote the connection between them
Strategy 13.1 Increase community inclusion, cohesion and social interaction
Activity ref. 4 Year Activities 2016/17 Actions Performance Measure Responsibility
13.1.1 Implement the Great Lakes Active Ageing Strategy and pursue other initiatives to support more inclusive communities
Seek funding opportunities and implement projects that improve the age-friendliness of the community in line with Council's commitment as a member of the WHO Global Network of Age-friendly Cities and Communities
Number of projects undertaken Community Engagement

34
Activity ref. 4 Year Activities 2016/17 Actions Performance Measure Responsibility
Seek funding opportunities and implement strategies outlined in GL Active Ageing Strategy. Number of strategies undertaken Community Engagement
Continue active participation in WHO Global Network of Age-friendly Cities and Communities (GNAFCC)
Number of interactions with WHO GNAFCC annual progress report submitted
Community Engagement
13.1.2 Administer grant programs for community organisations that assist them in providing services and infrastructure which address needs and build capacity in the Great Lakes
Coordinate Council's Community Grants Program Number of applications submitted Number of community groups supported
Community Engagement
Administer Clubs NSW ClubGRANTS program ClubGRANTS funding distributed to priority groups Community Engagement
13.1.3 Support the establishment and development of community organisations that promote well-being and social cohesion
Assist community groups through provision of information and advice including grant funding opportunities
Number of groups assisted Number of grant opportunities promoted
Community Engagement
13.1.4 Advocate for the provision of improved community transport services within population centres
Continued liaison and support to the Manning Great Lakes Community Transport Group for the provision of community transport services
Regular communication and liaison with local service providers Community Engagement
Liaison with the NSW Ministry of Transport to identify service gaps and gain additional public transport services
Community transport needs communicated to funding bodies Community Engagement
13.1.5 Support community volunteers throughout the organisation to enhance Council's services, facilities and natural areas while providing opportunities for social interaction and activity
Engage community volunteers to assist with the delivery of services
Number of volunteer groups Number of overall volunteers Number of appreciation activities
Community Engagement Library Services Parks & Recreation
13.1.6 Encourage Aboriginal partnership programs where possible to increase local community involvement in the management of the natural environment
Contract bush regeneration contractors who employ Aboriginal staff, to undertake environmental programs
Number of environmental programs undertaken Parks & Recreation
13.1.7 Conduct and/or support local events that strengthen communities Support local events that provide a variety of social, cultural, environmental and economic benefit to the area
Number of events supported Community Engagement
Coordinate and host Community Network (interagency) meetings, provide appropriate training where possible
Number of meetings held Community Engagement
Provide support for projects that address community needs Number of projects supported Community Engagement
Strategy 13.2 Attract new events, activities and exhibitions that are respectful of local community character
Activity ref. 4 Year Activities 2016/17 Actions Performance Measure Responsibility
13.2.1 Manage an event program that is unique to the Mid North Coast, promotes the region's character, reflects demand, connects with the brand and adds value to the Great Lakes experience
Support local events that provide a variety of social, cultural, environmental and economic benefit to the area.
Number of events supported (new and existing) Number of participants per event
Community Engagement
Source new events where gaps exist within calendar or across region Number and location of new events Community Engagement
13.2.2 Conduct events and programs through the Library that emphasise the Library's role as a cultural and social interaction centre for the community
Promote and conduct a variety of cultural events and help promote community organisations
Number of events held Number people attending Number of displays provided
Library Services
35
KEY DIRECTION 4 - Local leadership
Objective 14 Deliver Council services which are effective and efficient
Strategy 14.1 Set a strategic direction for Council that focuses on current and future customer needs and deploy plans to achieve those strategies
Activity ref. 4 Year Activities 2016/17 Actions Performance Measure Responsibility
14.1.1 Implement the Integrated Planning & Reporting Framework Prepare end of term report to the community incorporating data gathering and evaluation of achievements against 4-year activities
Report endorsed by Council Corporate Finance & Planning
Review of Community Strategic Plan incorporating input from the community survey, in preparation for endorsement of new plan by new Council within 9 months of election
Plan endorsed by Council Corporate Finance & Planning
14.1.2 Identify and investigate opportunities to broaden Council revenue base through the investment of Council funds in appropriate business and/or property ventures
Adopt a strategy outlining the parameters that a business and/or property venture opportunity will need to meet for further consideration by Council
Strategy adopted General Manager
Engage appropriate professional assistance as required to identify and investigate commercial and/or property opportunities that appear to meet Council's adopted parameters
Opportunities investigated and reported in line with Strategy General Manager
Strategy 14.2 Develop an organisational culture that applies resources effectively to deliver quality outcomes
Activity ref. 4 Year Activities 2016/17 Actions Performance Measure Responsibility
14.2.1 Provide information technology (IT) and communications systems which are current, secure, stable and support Council business operations
Implement Projects identified in the ICT Strategic Plan 2013/2017
% of projects completed on time % of projects completed within budget
Information Systems
Ensure ICT systems are available to conduct Council business % of availability during business hours Information Systems
14.2.2 Implement the Workforce Management Plan Ensure Human Resource practices and processes align with leadership direction and organisational culture
% of 2016/17 Workforce Management Plan actions implemented Human Resources
Attract, recruit and retain an effective workforce that aligns with organisational culture and the human resourcing requirements of the Delivery Program
% of 2016/17 Workforce Management Plan actions implemented Human Resources
Train and develop our workforce to align with organisational culture and the human resourcing requirements of the Delivery Program
% of 2016/17 Workforce Management Plan actions implemented Human Resources
Provide a safe work environment to minimise WHS risks
% of 2016/17 Workforce Management Plan actions implemented Human Resources
14.2.3 Provide timely and proactive communication to the community
Develop and implement a Customer Service Strategy providing guidelines, standards and procedures to support customer service throughout the organisation
Customer Service Strategy is adopted Number of staff trained in new procedures
Customer Service & Communications

36
Activity ref. 4 Year Activities 2016/17 Actions Performance Measure Responsibility
Develop and implement a new automated customer request system for use by customers and staff
System implemented and available online Number of staff trained in its use
Customer Service & Communications
Undertake media promotions, prepare media responses, releases and statements as required Number of media releases issued Customer Service &
Communications
Continue to survey our customers and provide feedback to the relevant business units about the customer experience
% change in customer satisfaction Customer Service & Communications
Keep the community informed of Council activities via website, newsletter, in-house promotions, social media and local media channels
Number of hits on Council's website per quarter Degree of social media engagement per quarter Appearances in various forms of media Number of newsletters distributed
Customer Service & Communications
Keep the community informed of library activities via website, newsletter, in-house promotions, social media and local media
Appearances in the media Monthly newsletter published Likes on Library Facebook page Visits to library webpages
Library Services
14.2.4 Implement Procurement Improvement Program to ensure efficient and transparent processes, achieve financial savings and comply with legislative requirements
Continued implementation of Procurement Improvement Action Plan
Number of items from Action Plan implemented
Corporate Finance & Planning
Implement computer system modules to improve internal controls and achieve efficiencies in procurement processes
Number of staff trained Corporate Finance & Planning
Strategy 14.3 Provide good governance
Activity ref. 4 Year Activities 2016/17 Actions Performance Measure Responsibility
14.3.1 Provide, plan, maintain and develop financial systems that meet Council’s strategic financial objectives
Manage accounting systems and registers to meet legislative reporting requirements
All returns/reports lodged with relevant bodies by required deadlines
Corporate Finance & Planning
14.3.2 Ensure Corporate Governance practices meet legislative requirements and reflect current community standards of 'good governance'
Audit Committee and Internal Audit function resourced and operating
4 Audit Committee meetings held Internal Audit annual work plan completed
Corporate Finance & Planning
14.3.3 Ensure that appropriate avenues exist to allow the community and staff to access and provide information regarding Council's operations and decisions
Ensure day to day GIPA issues handled in accordance with statutory requirements
% of formal GIPA determined within timeframe
Corporate Finance & Planning
14.3.4 Implement Risk Management Systems that identify, manage and control risk
Continue implementation of Council's Risk Management Plan and development and review of the corporate Risk Register
Review of register completed Corporate Finance & Planning
Continued implementation of Risk Management Action Plan throughout the organisation Number of actions completed Corporate Finance &
Planning
14.3.5 Provide efficient Records Management and Information access services
Continued implementation of policies and procedures regarding information management
% of staff informed or responsibilities in relation to digital records Information Systems
37
Activity ref. 4 Year Activities 2016/17 Actions Performance Measure Responsibility
14.3.6 Develop and maintain management systems for Council owned land and property which support Council business operations
Develop a policy and procedure for the acquisition and disposal of Council land and property
Policy and procedure adopted and implemented
Property & Building Assets
Develop, review and maintain Plans of Management for Council owned and managed land
Plans of Management reported to Council for adoption Plans reviewed and updated
Property & Building Assets
Strategy 14.4 Apply structured continuous improvement methods to achieve effectiveness and efficiencies
Activity ref. 4 Year Activities 2016/17 Actions Performance Measure Responsibility
14.4.1 Regularly review Council's levels of service and business processes Continue process reviews through the mapping of current processes and identification and implementation of improvement opportunities
Number of processes mapped Efficiencies captured
Director Corporate & Community Development
Through the Business Improvement Program continue implementation of action plans for culture, business improvement and leadership development across the organisation and capture information as part of a benefits realisation (using the Australian Business Excellence Framework as a guide)
Benefits captured Director Corporate & Community Development
Undertake a staff culture survey re-measure to gauge progress and shifts in the organisational culture (original staff culture survey undertaken in November/December 2014)
% participation rate of staff Change from previous survey results
Director Corporate & Community Development
Accountabilities and processes for the management and maintenance of date relevant to s149 certificates defined and documented including engagement with staff
Processes and responsibilities communicated with staff Strategic Planning
Review Council's processes and procedures for reporting on land contamination in s149 certificates and other Council activities e.g. development assessment to ensure they meet Council's statutory obligations
Processes and procedures implemented Strategic Planning
Increase the awareness of and opportunities for the community to use Council's online planning tool, including provision of training for relevant staff
Staff training provided Awareness raising activities undertaken
Strategic Planning
14.4.2 Guide sustainability policy and practices across Council through the Sustainability Advisory Team
Facilitate the functioning of the Sustainability Advisory Team to set priority actions and monitor energy and water efficiency and GHG emissions
Change in consumption compared to previous years Natural Systems
Strategy 14.5 Assess organisational performance against strategic objectives and use information to ensure sustainability
Activity ref. 4 Year Activities 2016/17 Actions Performance Measure Responsibility
14.5.1 Manage, monitor and review Council's financial performance and plans to ensure sustainability
Coordinate financial information for inclusion in the Long Term Financial Plan
Complete annual review of the Long Term Financial Plan
Corporate Finance & Planning
Prepare long term financial models incorporating asset management scenarios to determine impact on financial sustainability and required revenue paths to address desired service levels and backlogs
Models used to inform budget decisions and funding options
Corporate Finance & Planning
14.5.2 Undertake community surveys to assess Council's performance and to inform proposals and strategies
No specific community surveys proposed for 2016/17 (broad customer satisfaction survey undertaken last quarter, 2015/16)
Director Corporate & Community Development

38
Activity ref. 4 Year Activities 2016/17 Actions Performance Measure Responsibility
14.5.3 Fulfil statutory reporting requirements, publicise results to the community and utilise results to review performance against objectives
Prepare quarterly financial budget reviews and six-monthly Delivery Program reviews
Reports presented to Council within legislative timeframes
Corporate Finance & Planning
Prepare Annual Report as per legislative requirement Report completed and lodged by due date
Customer Service & Communications
14.5.4 Implement an integrated performance measurement framework across the organisation
Develop a performance reporting framework using the 'Results and Sustainable Performance' category of the Australian Business Excellence Framework as a guide
Framework presented to Council Corporate Finance & Planning
Implement performance planning software system System installed % of staff utilising system
Corporate Finance & Planning
Continue participation in the PWC Organisational Effectiveness Program Results reported to Council General Manager
Objective 15 Strengthen community participation
Strategy 15.1 Encourage an informed community to enable meaningful participation
Activity ref. 4 Year Activities 2016/17 Actions Performance Measure Responsibility
15.1.1 Provide appropriate community engagement and consultation opportunities to ensure community input into decisions and plans that affect them
Conduct community meetings and/or other appropriate community engagement opportunities in towns and villages on a regular basis
Number of meetings/engagement opportunities conducted Number of participants
Management Executive Team
Finalise local plans for Nabiac and Coolongolook and develop local plans for Bulahdelah, North Arm Cove, Coomba Park, Pacific Palms and Tea Gardens
Number of people involved in engagement Plans presented to Council for information
Community Engagement
Commence preparations for 2016 Local Government election including conduct of candidate information sessions
Number of information sessions held Corporate Finance & Planning
Objective 16 Represent the community's interests through regional leadership
Strategy 16.1 Advocate local interests with State and Federal government
Activity ref. 4 Year Activities 2016/17 Actions Performance Measure Responsibility
16.1.1 Provide representation on relevant Federal, State and Regional task forces and groups to further local issues
Retain membership and involvement with Local Government NSW, Pacific Highway Action Group, SeaChange Taskforce etc and other relevant groups
Number of initiatives/matters reported to Council General Manager
Respond to State Government local government reform initiatives with the best interests of the local community in mind
Information provided to Council and community General Manager
Strategy 16.2 Actively contribute to regional initiatives that benefit the local area
Activity ref. 4 Year Activities 2016/17 Actions Performance Measure Responsibility
16.2.1 Maintain membership of Hunter Councils and support activities of the Board, Advisory Groups, various teams and taskforces
Participate in Hunter Councils activities and support lobbying issues
Number of initiatives/matters reported to Council General Manager

39
Activity ref. 4 Year Activities 2016/17 Actions Performance Measure Responsibility
Participate in State Government pilot activities associated with the Hunter Joint Organisation to build better working relationships between councils and State Government agencies
Updates provided to Council General Manager
16.2.2 Provide representation on and contribute to regional committees and groups to further local issues
Elected members and staff attend and participate in regional group meetings
Number of meetings attended Number of groups with Council representation
Various
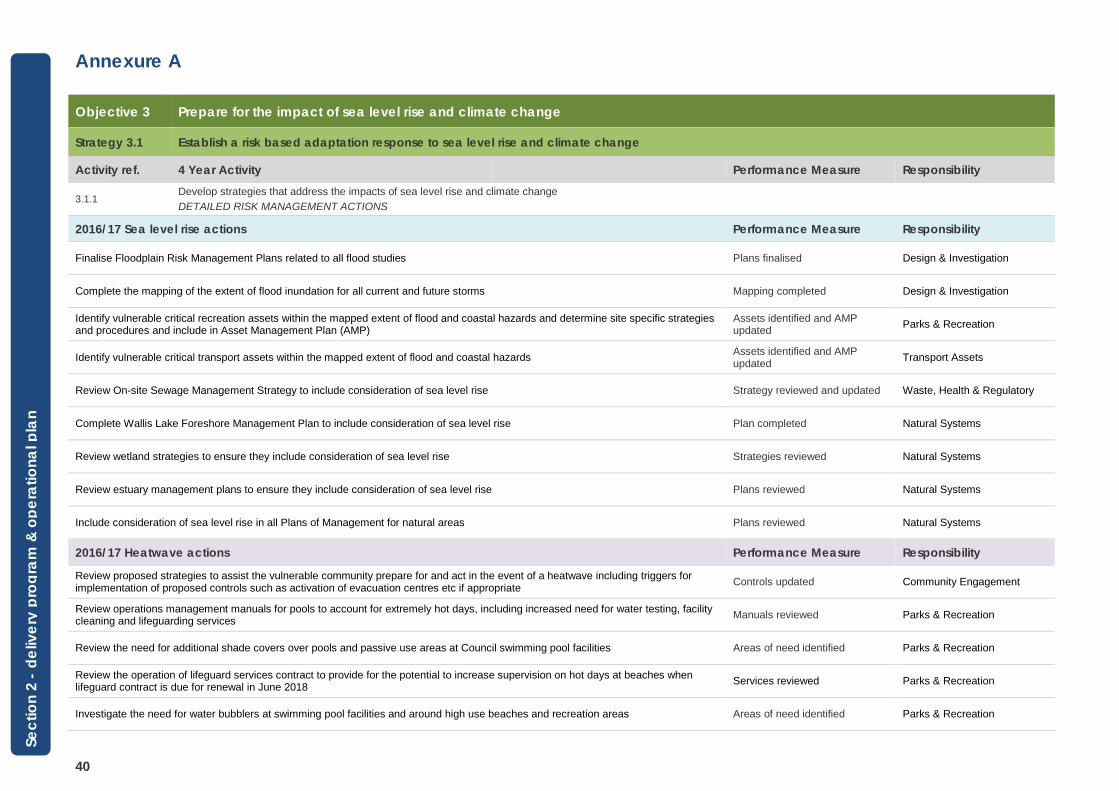
40
Annexure A
Objective 3 Prepare for the impact of sea level rise and climate change
Strategy 3.1 Establish a risk based adaptation response to sea level rise and climate change
Activity ref. 4 Year Activity Performance Measure Responsibility
3.1.1 Develop strategies that address the impacts of sea level rise and climate change DETAILED RISK MANAGEMENT ACTIONS
2016/17 Sea level rise actions Performance Measure Responsibility
Finalise Floodplain Risk Management Plans related to all flood studies Plans finalised Design & Investigation
Complete the mapping of the extent of flood inundation for all current and future storms Mapping completed Design & Investigation
Identify vulnerable critical recreation assets within the mapped extent of flood and coastal hazards and determine site specific strategies and procedures and include in Asset Management Plan (AMP)
Assets identified and AMP updated Parks & Recreation
Identify vulnerable critical transport assets within the mapped extent of flood and coastal hazards Assets identified and AMP updated Transport Assets
Review On-site Sewage Management Strategy to include consideration of sea level rise Strategy reviewed and updated Waste, Health & Regulatory
Complete Wallis Lake Foreshore Management Plan to include consideration of sea level rise Plan completed Natural Systems
Review wetland strategies to ensure they include consideration of sea level rise Strategies reviewed Natural Systems
Review estuary management plans to ensure they include consideration of sea level rise Plans reviewed Natural Systems
Include consideration of sea level rise in all Plans of Management for natural areas Plans reviewed Natural Systems
2016/17 Heatwave actions Performance Measure Responsibility
Review proposed strategies to assist the vulnerable community prepare for and act in the event of a heatwave including triggers for implementation of proposed controls such as activation of evacuation centres etc if appropriate Controls updated Community Engagement
Review operations management manuals for pools to account for extremely hot days, including increased need for water testing, facility cleaning and lifeguarding services Manuals reviewed Parks & Recreation
Review the need for additional shade covers over pools and passive use areas at Council swimming pool facilities Areas of need identified Parks & Recreation
Review the operation of lifeguard services contract to provide for the potential to increase supervision on hot days at beaches when lifeguard contract is due for renewal in June 2018 Services reviewed Parks & Recreation
Investigate the need for water bubblers at swimming pool facilities and around high use beaches and recreation areas Areas of need identified Parks & Recreation
Sect
ion
2 - d
eliv
ery
prog
ram
& o
pera
tiona
l pla
n

41
2016/17 Heatwave actions Performance Measure Responsibility
Review the need for additional shade over playgrounds, trees within passive recreation areas, additional shade covers and seating in spectator areas and additional trees at sports fields Areas of need identified Parks & Recreation
Investigate options to make drinking water available in Council's library buildings Options presented including costings Library Services
Investigate what actions are required to integrate heatwave resilience planning into LEPs / DCPs / BASIX and other relevant planning documents Actions identified Strategic Planning
2016/17 Severe storm event actions Performance Measure Responsibility
Document response mechanisms and service level agreements / procedures required to manage severe storm events Procedures produced
Parks & Recreation Operations Transport Assets Property & Building Assets Engineering Executive
Map alternative routes for major road corridors and determine how they can be communicated to the public in the event of a severe storm
Maps and communication plan produced
Transport Assets Design & Investigation
2016/17 Bushfire actions Performance Measure Responsibility
Undertake a review of the current bushfire mapping in conjunction with Rural Fire Service Review undertaken Director Engineering Services and Director Planning & Environmental Services
Section 2 - delivery program & operational plan

42
uture projects/programs During the initial preparation of this Delivery Program in 2013 Council identified projects and program enhancements that align with the
community strategic plan that may be pursued during their term of office. Project plans and financial planning models may have been developed for selected projects and if these were to proceed, the projects would be reflected in future Operational Plans developed under the 2013-2017 Delivery Program.
The projects and programs identified are listed below and do not appear in any specific order or priority. A number of the projects and programs have now commenced and the current status of each is noted in the table below.
Projects Description Status
Civic/Community Centre Precinct - Forster
Development in accordance with master plan adopted in principle by Council on 12 May 2009 and the facilities and services that could be incorporated into the site adopted at the Strategic Committee Meeting 9 February 2010
Council is progressing the planning of the Civic Precinct on the former School site on the corner of Lake and West Streets Forster. Expressions of Interest from the private sector for development partners have been sought and Council is progressing through the procurement process to identify a suitable partner. Council has received $6 million from the Federal Government's National Stronger Regions Fund towards this development.
Tea Gardens Recreational and Cultural Precinct
Relocation of existing Council/Community facilities to a central location at Myall River Downs
Women's respite centre - Forster/Tuncurry
To provide women’s respite facilities in Forster-Tuncurry which can be leased and operated by the relevant support agencies
Council has assisted through advocacy and financial contributions to the establishment of a women's refuge within Forster / Tuncurry.
Tuncurry Town Centre improvements Physical Town Centre improvements including beautification, marketing programs and business development activities
Alternative energy supply (green energy development)
To provide an alternative energy facility in the Great Lakes area through a partnership with either other levels of Government or the private sector (potential for a partnership with Mid Coast Water)
No action taken to date
North Tuncurry Regional Sporting Complex
Next stages of upgrade plan including floodlighting, car parking, stage 2 grandstand and new field development
Forster Town Centre improvements Physical Town Centre improvements including beautification, marketing programs and business development activities
Outdoor entertainment/performance space - Forster/Tuncurry
To provide a purpose built outdoor entertainment and performance space in Forster-Tuncurry (potential links to Civic Centre Precinct project)
Forster car parking Improve car parking in the Forster Town Centre area Council purchased the Wallis Street Car Park and extended it to provide additional car parking for the Town Centre area.
Marine Education Centre To promote and facilitate the establishment of a Marine Education Centre in the Great Lakes (Ballina Marine Discovery and Resource Centre is an example of a similar facility) No action taken to date
F Se
ctio
n 2
- del
iver
y pr
ogra
m &
ope
ratio
nal p
lan
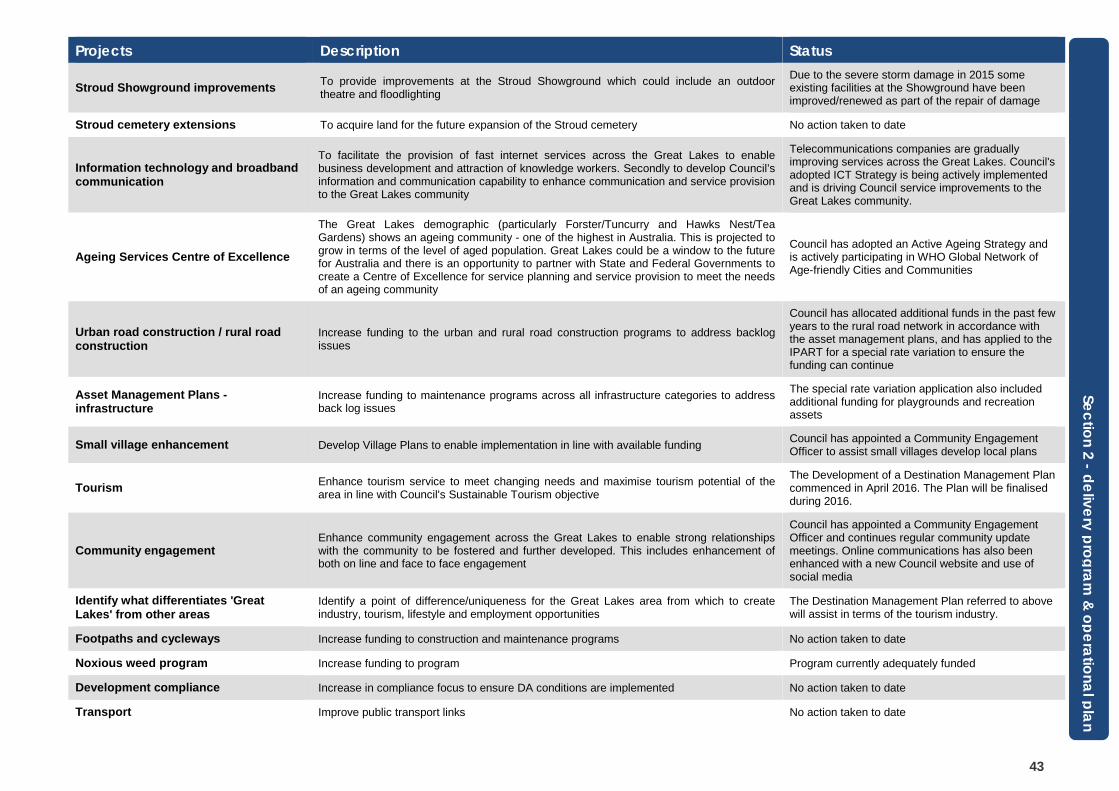
43
Projects Description Status
Stroud Showground improvements To provide improvements at the Stroud Showground which could include an outdoor theatre and floodlighting
Due to the severe storm damage in 2015 some existing facilities at the Showground have been improved/renewed as part of the repair of damage
Stroud cemetery extensions To acquire land for the future expansion of the Stroud cemetery No action taken to date
Information technology and broadband communication
To facilitate the provision of fast internet services across the Great Lakes to enable business development and attraction of knowledge workers. Secondly to develop Council’s information and communication capability to enhance communication and service provision to the Great Lakes community
Telecommunications companies are gradually improving services across the Great Lakes. Council's adopted ICT Strategy is being actively implemented and is driving Council service improvements to the Great Lakes community.
Ageing Services Centre of Excellence
The Great Lakes demographic (particularly Forster/Tuncurry and Hawks Nest/Tea Gardens) shows an ageing community - one of the highest in Australia. This is projected to grow in terms of the level of aged population. Great Lakes could be a window to the future for Australia and there is an opportunity to partner with State and Federal Governments to create a Centre of Excellence for service planning and service provision to meet the needs of an ageing community
Council has adopted an Active Ageing Strategy and is actively participating in WHO Global Network of Age-friendly Cities and Communities
Urban road construction / rural road construction
Increase funding to the urban and rural road construction programs to address backlog issues
Council has allocated additional funds in the past few years to the rural road network in accordance with the asset management plans, and has applied to the IPART for a special rate variation to ensure the funding can continue
Asset Management Plans - infrastructure
Increase funding to maintenance programs across all infrastructure categories to address back log issues
The special rate variation application also included additional funding for playgrounds and recreation assets
Small village enhancement Develop Village Plans to enable implementation in line with available funding Council has appointed a Community Engagement Officer to assist small villages develop local plans
Tourism Enhance tourism service to meet changing needs and maximise tourism potential of the area in line with Council's Sustainable Tourism objective
The Development of a Destination Management Plan commenced in April 2016. The Plan will be finalised during 2016.
Community engagement Enhance community engagement across the Great Lakes to enable strong relationships with the community to be fostered and further developed. This includes enhancement of both on line and face to face engagement
Council has appointed a Community Engagement Officer and continues regular community update meetings. Online communications has also been enhanced with a new Council website and use of social media
Identify what differentiates 'Great Lakes' from other areas
Identify a point of difference/uniqueness for the Great Lakes area from which to create industry, tourism, lifestyle and employment opportunities
The Destination Management Plan referred to above will assist in terms of the tourism industry.
Footpaths and cycleways Increase funding to construction and maintenance programs No action taken to date
Noxious weed program Increase funding to program Program currently adequately funded
Development compliance Increase in compliance focus to ensure DA conditions are implemented No action taken to date
Transport Improve public transport links No action taken to date
Section 2 - delivery program & operational plan

44
Projects Description Status
Crime prevention Increase crime prevention programs with relevant government agencies No specific programs implemented by Council, however it does continue to liaise with NSW Police and assist government agencies where appropriate.
Boat ramps, wharves, jetties Increase funding to construction and maintenance programs Grant funding received through Better Boating program enabling an increase in this area
Creative, attractive area for entertainers Provide the physical and regulatory environment to stimulate live performance activity Considered as part of the Forster Civic Centre project
Cultural officer Employ a cultural officer to develop and implement cultural programs across the Great Lakes No action taken to date
Sect
ion
2 - d
eliv
ery
prog
ram
& o
pera
tiona
l pla
n

45
section three statement of revenue policy
2016-2017 f inancial year

46
ouncil’s budget
Council has developed two budget scenarios for 2016-2017. The budget summaries for these scenarios follow.
Expenditures and other revenue sources have generally been forecast to increase in line with the parameters utilised in the Long Term Financial Plan. Growth in rate income across the life of the Long Term Financial Plan has been amended from 3% per annum to 2.5% per annum to reflect advice from the Office of Local Government. Further information on Council's financial position can be found in the Long Term Financial Plan. Council's Statement of Revenue Policy is also included.
The first scenario or ‘Base Case’ reflects growth in rates of 1.8% in 2016/2017, being the rate peg announced by IPART. Rates are then forecast to increase at the rate of 2.5% per annum thereafter. A review of expenditure was undertaken in this scenario to reflect the lower revenue projections. The second scenario reflects the Special Rate Variation application previously identified. This shows a 6.5% increase in general income in 2016/2017 followed by 3 years of 4.25% increases before returning to 2.5% per annum annual growth. A program of works is associated with the second scenario. These works programs will not proceed should the Special Rate Variation be unsuccessful. Council will continue to utilise its Quarantine Reserve to fund the predicted deficits in both scenarios. The reports show that further significant reviews of the ‘Base Case’ will be required to improve the projected long term outlook.
C Se
ctio
n 3
- sta
tem
ent o
f rev
enue
pol
icy

47
Scenario: Base Case 2016/17 2017/18 2018/19 2019/20 2020/21 2021/22 2022/23 2023/24 2024/25 2025/26$ $ $ $ $ $ $ $ $ $
Income from Continuing OperationsRevenue:Rates & Annual Charges 41,162,536 42,061,062 43,432,329 44,766,986 46,050,070 47,375,049 48,338,662 49,343,822 50,360,144 51,400,594 User Charges & Fees 7,227,873 7,374,112 7,588,678 7,797,885 8,021,970 8,260,115 8,488,715 8,726,599 8,966,091 9,187,700 Interest & Investment Revenue 1,958,000 2,058,000 2,128,000 2,183,000 2,228,000 2,273,000 2,323,000 2,393,000 2,433,000 2,433,000 Other Revenues 1,802,277 1,881,104 1,910,179 1,965,921 2,018,750 2,073,974 2,088,537 2,103,516 2,120,858 2,051,150 Grants & Contributions provided for Operating Purposes 14,028,144 13,966,707 14,147,890 14,330,134 14,514,483 14,704,717 14,889,152 15,145,467 15,437,011 15,692,749 Grants & Contributions provided for Capital Purposes 2,912,000 1,432,339 1,432,339 1,432,339 1,432,339 1,432,339 1,432,339 1,432,339 1,432,339 1,432,339 Total Income from Continuing Operations 69,090,830 68,773,324 70,639,416 72,476,265 74,265,611 76,119,194 77,560,405 79,144,743 80,749,442 82,197,531
Expenses from Continuing OperationsEmployee Benefits & On-Costs 25,148,349 25,891,051 26,371,845 27,265,079 28,181,084 29,206,163 30,269,511 31,373,227 32,564,621 33,732,922 Borrowing Costs 2,448,725 2,488,629 2,293,236 2,006,643 1,716,384 1,442,822 1,171,627 1,022,964 907,657 802,550 Materials & Contracts 16,113,914 16,100,541 16,563,535 16,797,069 17,399,726 17,704,627 18,181,236 18,468,987 18,885,213 19,297,417 Depreciation & Amortisation 16,403,205 16,403,205 16,403,205 16,403,205 16,403,205 16,403,205 16,403,205 16,403,205 16,403,205 16,403,205 Other Expenses 9,268,440 9,261,677 9,585,323 9,893,931 10,473,158 10,587,451 10,893,379 11,266,324 11,897,210 12,027,862 Total Expenses from Continuing Operations 69,382,633 70,145,103 71,217,145 72,365,927 74,173,556 75,344,268 76,918,959 78,534,707 80,657,906 82,263,955
Operating Result from Continuing Operations (291,803) (1,371,779) (577,729) 110,338 92,056 774,926 641,446 610,036 91,536 (66,425)
Net Operating Result for the Year (291,803) (1,371,779) (577,729) 110,338 92,056 774,926 641,446 610,036 91,536 (66,425)
Net Operating Result before Grants and Contributions provided for
Capital Purposes (3,203,803) (2,804,118) (2,010,068) (1,322,001) (1,340,283) (657,413) (790,893) (822,303) (1,340,803) (1,498,764)
Great Lakes Council
INCOME STATEMENT - GENERAL FUND10 Year Financial Plan for the Years ending 30 June 2026
Projected Years
ncome statement – consolidated – base case
I
Section 3 - statement of revenue policy
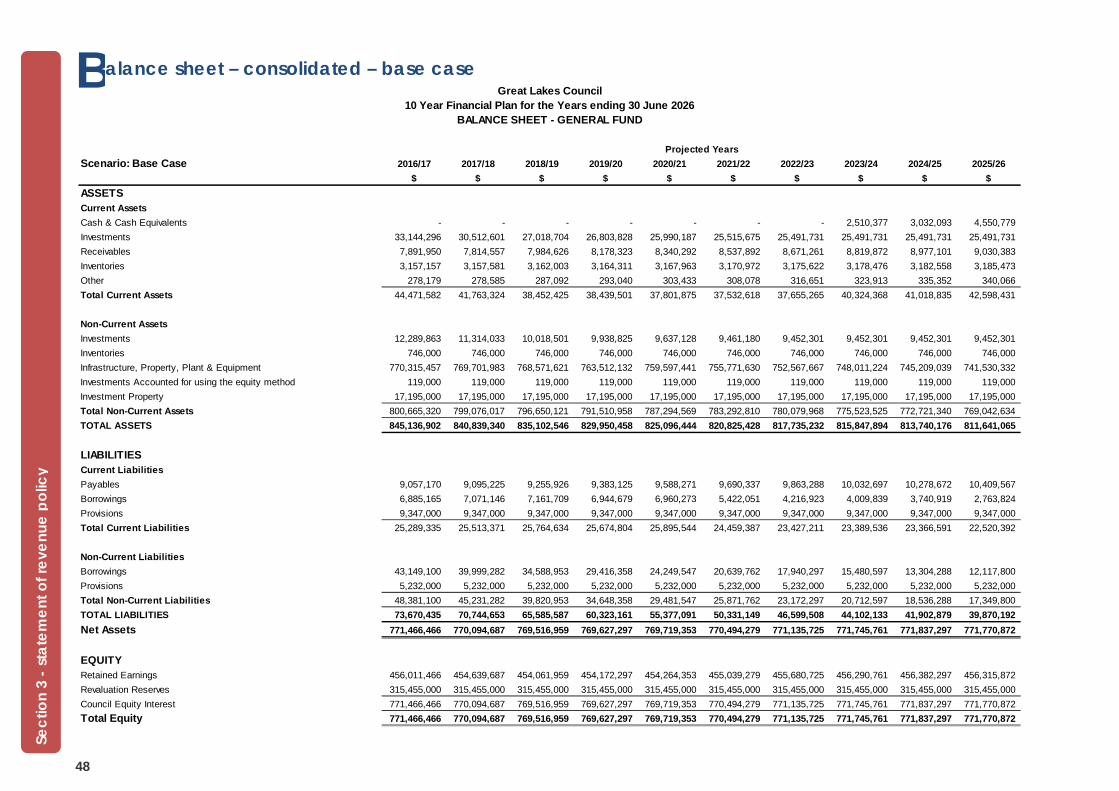
48
Scenario: Base Case 2016/17 2017/18 2018/19 2019/20 2020/21 2021/22 2022/23 2023/24 2024/25 2025/26$ $ $ $ $ $ $ $ $ $
ASSETSCurrent AssetsCash & Cash Equivalents - - - - - - - 2,510,377 3,032,093 4,550,779 Investments 33,144,296 30,512,601 27,018,704 26,803,828 25,990,187 25,515,675 25,491,731 25,491,731 25,491,731 25,491,731 Receivables 7,891,950 7,814,557 7,984,626 8,178,323 8,340,292 8,537,892 8,671,261 8,819,872 8,977,101 9,030,383 Inventories 3,157,157 3,157,581 3,162,003 3,164,311 3,167,963 3,170,972 3,175,622 3,178,476 3,182,558 3,185,473 Other 278,179 278,585 287,092 293,040 303,433 308,078 316,651 323,913 335,352 340,066 Total Current Assets 44,471,582 41,763,324 38,452,425 38,439,501 37,801,875 37,532,618 37,655,265 40,324,368 41,018,835 42,598,431
Non-Current AssetsInvestments 12,289,863 11,314,033 10,018,501 9,938,825 9,637,128 9,461,180 9,452,301 9,452,301 9,452,301 9,452,301 Inventories 746,000 746,000 746,000 746,000 746,000 746,000 746,000 746,000 746,000 746,000 Infrastructure, Property, Plant & Equipment 770,315,457 769,701,983 768,571,621 763,512,132 759,597,441 755,771,630 752,567,667 748,011,224 745,209,039 741,530,332 Investments Accounted for using the equity method 119,000 119,000 119,000 119,000 119,000 119,000 119,000 119,000 119,000 119,000 Investment Property 17,195,000 17,195,000 17,195,000 17,195,000 17,195,000 17,195,000 17,195,000 17,195,000 17,195,000 17,195,000 Total Non-Current Assets 800,665,320 799,076,017 796,650,121 791,510,958 787,294,569 783,292,810 780,079,968 775,523,525 772,721,340 769,042,634 TOTAL ASSETS 845,136,902 840,839,340 835,102,546 829,950,458 825,096,444 820,825,428 817,735,232 815,847,894 813,740,176 811,641,065
LIABILITIESCurrent LiabilitiesPayables 9,057,170 9,095,225 9,255,926 9,383,125 9,588,271 9,690,337 9,863,288 10,032,697 10,278,672 10,409,567 Borrowings 6,885,165 7,071,146 7,161,709 6,944,679 6,960,273 5,422,051 4,216,923 4,009,839 3,740,919 2,763,824 Provisions 9,347,000 9,347,000 9,347,000 9,347,000 9,347,000 9,347,000 9,347,000 9,347,000 9,347,000 9,347,000 Total Current Liabilities 25,289,335 25,513,371 25,764,634 25,674,804 25,895,544 24,459,387 23,427,211 23,389,536 23,366,591 22,520,392
Non-Current LiabilitiesBorrowings 43,149,100 39,999,282 34,588,953 29,416,358 24,249,547 20,639,762 17,940,297 15,480,597 13,304,288 12,117,800 Provisions 5,232,000 5,232,000 5,232,000 5,232,000 5,232,000 5,232,000 5,232,000 5,232,000 5,232,000 5,232,000 Total Non-Current Liabilities 48,381,100 45,231,282 39,820,953 34,648,358 29,481,547 25,871,762 23,172,297 20,712,597 18,536,288 17,349,800 TOTAL LIABILITIES 73,670,435 70,744,653 65,585,587 60,323,161 55,377,091 50,331,149 46,599,508 44,102,133 41,902,879 39,870,192 Net Assets 771,466,466 770,094,687 769,516,959 769,627,297 769,719,353 770,494,279 771,135,725 771,745,761 771,837,297 771,770,872
EQUITYRetained Earnings 456,011,466 454,639,687 454,061,959 454,172,297 454,264,353 455,039,279 455,680,725 456,290,761 456,382,297 456,315,872 Revaluation Reserves 315,455,000 315,455,000 315,455,000 315,455,000 315,455,000 315,455,000 315,455,000 315,455,000 315,455,000 315,455,000 Council Equity Interest 771,466,466 770,094,687 769,516,959 769,627,297 769,719,353 770,494,279 771,135,725 771,745,761 771,837,297 771,770,872 Total Equity 771,466,466 770,094,687 769,516,959 769,627,297 769,719,353 770,494,279 771,135,725 771,745,761 771,837,297 771,770,872
Great Lakes Council10 Year Financial Plan for the Years ending 30 June 2026
BALANCE SHEET - GENERAL FUND
Projected Years
alance sheet – consolidated – base case B
Sect
ion
3 - s
tate
men
t of r
even
ue p
olic
y

49
Scenario: Base Case 2016/17 2017/18 2018/19 2019/20 2020/21 2021/22 2022/23 2023/24 2024/25 2025/26$ $ $ $ $ $ $ $ $ $
Cash Flows from Operating ActivitiesReceipts:Rates & Annual Charges 41,130,573 42,016,987 43,365,064 44,701,517 45,987,130 47,310,055 48,291,394 49,294,516 50,310,290 51,349,556 User Charges & Fees 7,227,873 7,374,112 7,588,678 7,797,885 8,021,970 8,260,115 8,488,715 8,726,599 8,966,091 9,187,700 Interest & Investment Revenue Received 1,948,018 2,044,235 2,106,992 2,162,553 2,208,343 2,252,701 2,308,238 2,377,601 2,417,430 2,417,060 Grants & Contributions 16,833,455 15,613,675 15,554,996 15,737,092 15,921,148 16,110,562 16,295,804 16,542,109 16,828,746 17,089,471 Other 1,626,023 1,808,847 1,863,381 1,893,238 1,973,150 1,998,006 2,050,246 2,062,979 2,077,421 2,107,024 Payments:Employee Benefits & On-Costs (25,148,349) (25,891,051) (26,371,845) (27,265,079) (28,181,084) (29,206,163) (30,269,511) (31,373,227) (32,564,621) (33,732,922) Materials & Contracts (16,189,176) (16,053,481) (16,395,064) (16,656,979) (17,187,226) (17,590,580) (18,006,508) (18,302,094) (18,648,524) (19,168,321) Borrowing Costs (2,434,033) (2,505,601) (2,323,700) (2,037,507) (1,745,882) (1,472,302) (1,193,987) (1,038,235) (921,659) (814,940) Other (9,268,440) (9,261,677) (9,585,323) (9,893,931) (10,473,158) (10,587,451) (10,893,379) (11,266,324) (11,897,210) (12,027,862)
Net Cash provided (or used in) Operating Activities 15,725,944 15,146,044 15,803,179 16,438,790 16,524,392 17,074,942 17,071,011 17,023,924 16,567,964 16,406,767
Cash Flows from Investing ActivitiesReceipts:Sale of Investment Securities 2,460,230 3,607,525 4,789,430 294,551 1,115,339 650,459 32,823 - - - Sale of Infrastructure, Property, Plant & Equipment 763,000 787,174 1,216,131 431,506 851,728 924,452 1,158,768 484,698 1,397,709 563,084 Payments:Purchase of Infrastructure, Property, Plant & Equipment (21,514,749) (16,576,905) (16,488,973) (11,775,223) (13,340,242) (13,501,847) (14,358,009) (12,331,461) (14,998,729) (13,287,582)
Net Cash provided (or used in) Investing Activities (18,291,519) (12,182,207) (10,483,413) (11,049,165) (11,373,175) (11,926,935) (13,166,418) (11,846,763) (13,601,020) (12,724,498)
Cash Flows from Financing ActivitiesReceipts:Proceeds from Borrowings & Advances 8,637,655 3,813,991 1,644,043 1,664,747 1,686,125 1,704,929 1,410,121 1,442,802 1,457,273 1,470,000 Payments:Repayment of Borrowings & Advances (6,072,080) (6,777,828) (6,963,809) (7,054,372) (6,837,342) (6,852,936) (5,314,714) (4,109,586) (3,902,502) (3,633,582)
Net Cash Flow provided (used in) Financing Activities 2,565,575 (2,963,837) (5,319,766) (5,389,625) (5,151,217) (5,148,007) (3,904,593) (2,666,784) (2,445,229) (2,163,582)
Net Increase/(Decrease) in Cash & Cash Equivalents - - - - - - - 2,510,377 521,716 1,518,686
Cash, Cash Equivalents & Investments - end of the year 45,434,159 41,826,634 37,037,205 36,742,653 35,627,314 34,976,855 34,944,032 37,454,409 37,976,125 39,494,811
Great Lakes Council10 Year Financial Plan for the Years ending 30 June 2026
CASH FLOW STATEMENT - GENERAL FUND
Projected Years
ash flow statement – consolidated – base case
C
Section 3 - statement of revenue policy

50
Scenario: Base Case 2016/17 2017/18 2018/19 2019/20 2020/21 2021/22 2022/23 2023/24 2024/25 2025/26
New Note 13 RatiosOperating Performance Ratio -4.84% -4.16% -2.90% -1.86% -1.84% -0.88% -1.04% -1.06% -1.69% -1.86%Own Source Operating Revenue Ratio 75.48% 77.61% 77.94% 78.25% 78.53% 78.80% 78.96% 79.05% 79.11% 79.17%Unrestricted Current Ratio 2.70 2.49 2.27 2.29 2.19 2.38 2.58 2.84 2.90 3.18Debt Service Cover Ratio 1.84 1.74 1.80 1.89 1.96 2.07 2.59 3.24 3.32 3.54Rates, Annual Charges, Interest & Extra Charges Outstanding Percentage 6.03% 6.03% 6.04% 6.03% 6.03% 6.03% 6.03% 6.03% 6.03% 6.03%
Projected Years
Great Lakes Council10 Year Financial Plan for the Years ending 30 June 2026
FINANCIAL PERFORMANCE INDICATORS - GENERAL FUND
inancial performance indicators – base case F
Sect
ion
3 - s
tate
men
t of r
even
ue p
olic
y

51
Scenario: Base Case 2016/17 2017/18 2018/19 2019/20 2020/21 2021/22 2022/23 2023/24 2024/25 2025/26$ $ $ $ $ $ $ $ $ $
Program Description Net Result Net Result Net Result Net Result Net Result Net Result Net Result Net Result Net Result Net Result CIVIC GOVERNMENT (354,007) (363,256) (372,758) (382,520) (412,608) (402,856) (413,447) (424,330) (456,015) (447,010) ECONOMIC DEVELOPMENT (701,983) (712,955) (724,285) (735,987) (748,075) (760,561) (771,785) (785,110) (797,877) (813,151) PROGRAM MANAGEMENT & SUPPORT (1,571,899) (1,596,322) (1,685,635) (1,766,857) (2,075,971) (2,156,991) (2,244,241) (2,334,551) (2,434,788) (2,549,825) TOURISM PROMOTION (763,696) (787,695) (812,484) (838,090) (864,543) (891,872) (920,108) (949,284) (979,434) (1,012,694) CORPORATE FINANCES 35,272,932 36,094,110 37,424,767 38,567,307 39,960,885 39,822,360 40,518,733 41,395,510 42,222,142 42,987,304 INFORMATION TECHNOLOGY SERVICES (1,723,350) (1,707,733) (1,849,649) (1,838,221) (1,922,558) (1,911,239) (2,060,986) (1,893,184) (1,945,031) (1,998,428) ADMINISTRATION (574,400) (593,686) (613,616) (634,212) (655,496) (677,340) (699,917) (723,249) (747,362) (772,282) PROPERTY MANAGEMENT (507,378) (523,122) (783,469) (784,598) (797,173) (815,663) (834,856) (854,872) (794,167) (815,912) COMMERCIAL SERVICES (610,120) (610,202) (624,922) (636,856) (654,683) (673,394) (653,104) (673,719) (695,356) (620,529) LIBRARY SERVICES (1,299,208) (1,341,621) (1,385,738) (1,430,973) (1,477,754) (1,526,089) (1,567,907) (1,611,437) (1,656,490) (1,705,171) HUMAN RESOURCE MANAGEMENT (836,325) (779,433) (803,838) (829,067) (855,148) (882,110) (909,982) (938,796) (968,583) (999,377) COMMUNITY SERVICES (985,264) (1,004,246) (1,050,753) (1,083,348) (1,108,364) (1,145,462) (1,156,608) (1,197,802) (1,240,293) (1,286,269) DEVELOPMENT CONTROL (238,000) (246,523) (255,419) (264,702) (274,388) (284,493) (295,034) (306,026) (317,489) (329,439) STRATEGIC PLANNING (581,058) (548,318) (566,144) (584,555) (603,571) (623,212) (643,498) (664,450) (686,091) (708,444) BUILDING SERVICES (520,877) (536,742) (553,671) (570,699) (588,332) (606,591) (633,203) (660,276) (698,768) (717,209) REGULATORY CONTROL (141,116) (144,633) (148,284) (152,076) (156,013) (160,101) (164,346) (168,483) (172,780) (177,245) WASTE MANAGEMENT - - - - - - - - - - ENVIRONMENTAL HEALTH & PROTECTION (104,373) (106,868) (109,443) (112,100) (114,843) (117,673) (120,595) (123,610) (126,722) (129,933) ROADS & DRAINAGE SERVICES (17,542,173) (18,341,644) (18,717,101) (19,347,661) (19,928,102) (20,208,096) (19,887,264) (19,295,634) (19,878,142) (20,341,585) PARKS & RECREATION SERVICES (5,010,010) (5,005,764) (5,166,245) (5,328,789) (5,431,043) (5,609,204) (5,793,489) (5,984,125) (6,181,344) (6,382,589) TECHNICAL SUPPORT SERVICES (676,948) (589,958) (609,769) (630,302) (651,585) (673,648) (696,499) (720,212) (745,803) (768,327) PRIVATE WORKS-PUBLIC & PRIVATE 30,000 29,138 28,247 27,325 26,372 25,387 24,368 23,315 22,226 21,099 RURAL FIRE SERVICES (560,747) (582,526) (619,791) (643,018) (667,009) (691,792) (717,396) (743,852) (771,193) (798,615) NATURAL SYSTEMS - - - - - - - - - 0
- - - - - (970,638) (641,162) 365,824 (49,360) (365,631)
Great Lakes Council10 Year Financial Plan for the Years ending 30 June 2026
SUMMARY OF BUDGET POSITION BY PROGRAM - GENERAL FUND
ummary of all centres – base case
S
Section 3 - statement of revenue policy

52
Scenario: 6.5% Special Rate Variation 2016/17 2017/18 2018/19 2019/20 2020/21 2021/22 2022/23 2023/24 2024/25 2025/26$ $ $ $ $ $ $ $ $ $
Income from Continuing OperationsRevenue:Rates & Annual Charges 42,665,737 44,195,468 46,238,914 48,288,854 49,659,976 51,075,195 52,131,302 53,231,269 54,344,768 55,484,823 User Charges & Fees 7,174,246 7,369,186 7,584,835 7,792,880 8,016,932 8,256,284 8,483,625 8,721,491 8,960,970 9,183,702 Interest & Investment Revenue 1,958,000 2,058,000 2,128,000 2,183,000 2,228,000 2,273,000 2,323,000 2,393,000 2,433,000 2,458,000 Other Revenues 1,803,472 1,882,323 1,911,790 1,967,932 2,021,171 2,076,816 2,091,811 2,107,231 2,125,026 2,057,334 Grants & Contributions provided for Operating Purposes 14,028,181 13,966,644 14,147,727 14,329,971 14,514,520 14,704,754 14,889,189 15,145,504 15,437,048 15,692,786 Grants & Contributions provided for Capital Purposes 2,912,000 1,432,339 1,432,339 1,432,339 1,432,339 1,432,339 1,432,339 1,432,339 1,432,339 1,432,339 Total Income from Continuing Operations 70,541,636 70,903,960 73,443,606 75,994,976 77,872,939 79,818,388 81,351,266 83,030,834 84,733,150 86,308,985
Expenses from Continuing OperationsEmployee Benefits & On-Costs 25,239,831 26,060,664 26,543,785 27,435,123 28,353,560 29,379,548 30,443,835 31,548,522 32,730,420 33,815,068 Borrowing Costs 2,448,725 2,488,629 2,293,236 2,006,643 1,716,384 1,442,822 1,171,627 1,022,964 907,657 802,550 Materials & Contracts 16,432,256 16,329,578 16,817,286 17,030,871 17,394,341 17,714,459 18,194,878 18,486,536 18,895,758 19,419,239 Depreciation & Amortisation 16,403,205 16,403,205 16,403,205 16,403,205 16,403,205 16,403,205 16,403,205 16,403,205 16,403,205 16,403,205 Other Expenses 9,216,796 9,330,540 9,656,197 9,966,900 10,548,306 10,664,873 10,973,171 11,348,570 11,982,020 12,115,446 Total Expenses from Continuing Operations 69,740,813 70,612,616 71,713,709 72,842,741 74,415,797 75,604,907 77,186,716 78,809,796 80,919,060 82,555,508
Operating Result from Continuing Operations 800,823 291,344 1,729,897 3,152,235 3,457,142 4,213,482 4,164,550 4,221,038 3,814,090 3,753,477
Net Operating Result for the Year 800,823 291,344 1,729,897 3,152,235 3,457,142 4,213,482 4,164,550 4,221,038 3,814,090 3,753,477
Net Operating Result before Grants and Contributions provided for Capital Purposes (2,111,177) (1,140,995) 297,558 1,719,896 2,024,803 2,781,143 2,732,211 2,788,699 2,381,751 2,321,138
Great Lakes Council10 Year Financial Plan for the Years ending 30 June 2026
INCOME STATEMENT - GENERAL FUND
Projected Years
ncome statement – consolidated – srv scenario
I
Sect
ion
3 - s
tate
men
t of r
even
ue p
olic
y

53
Scenario: 6.5% Special Rate Variation 2016/17 2017/18 2018/19 2019/20 2020/21 2021/22 2022/23 2023/24 2024/25 2025/26
$ $ $ $ $ $ $ $ $ $ASSETSCurrent AssetsCash & Cash Equivalents - - - 1,113,288 1,683,662 2,785,475 4,552,454 8,912,220 11,342,153 14,845,774 Investments 35,879,505 33,488,945 30,523,824 30,523,824 30,523,824 30,523,824 30,523,824 30,523,824 30,523,824 30,523,824 Receivables 7,984,849 7,951,064 8,166,715 8,407,690 8,604,540 8,809,335 8,949,778 9,105,809 9,270,626 9,333,328 Inventories 3,160,310 3,159,650 3,164,451 3,166,646 3,170,273 3,173,493 3,178,247 3,181,208 3,185,294 3,189,343 Other 281,193 281,674 290,631 296,473 306,863 311,771 320,487 327,897 339,368 345,397 Total Current Assets 47,305,857 44,881,333 42,145,620 43,507,921 44,289,163 45,603,898 47,524,790 52,050,958 54,661,266 58,237,666
Non-Current AssetsInvestments 13,304,075 12,417,658 11,318,195 11,318,195 11,318,195 11,318,195 11,318,195 11,318,195 11,318,195 11,318,195 Receivables - - - - - - - - - - Inventories 746,000 746,000 746,000 746,000 746,000 746,000 746,000 746,000 746,000 746,000 Infrastructure, Property, Plant & Equipment 767,608,348 768,304,274 768,720,626 765,251,401 762,983,426 760,840,482 759,355,179 756,555,451 755,560,581 753,717,801 Investments Accounted for using the equity method 119,000 119,000 119,000 119,000 119,000 119,000 119,000 119,000 119,000 119,000 Investment Property 17,195,000 17,195,000 17,195,000 17,195,000 17,195,000 17,195,000 17,195,000 17,195,000 17,195,000 17,195,000 Total Non-Current Assets 798,972,423 798,781,932 798,098,821 794,629,596 792,361,621 790,218,677 788,733,374 785,933,646 784,938,776 783,095,996 TOTAL ASSETS 846,278,280 843,663,266 840,244,441 838,137,518 836,650,784 835,822,575 836,258,164 837,984,604 839,600,042 841,333,662
LIABILITIESCurrent LiabilitiesPayables 9,105,922 9,163,401 9,334,447 9,464,913 9,672,255 9,778,571 9,954,202 10,126,389 10,372,965 10,516,691 Borrowings 6,885,165 7,071,146 7,161,709 6,944,679 6,960,273 5,422,051 4,216,923 4,009,839 3,740,919 2,763,824 Provisions 9,347,000 9,347,000 9,347,000 9,347,000 9,347,000 9,347,000 9,347,000 9,347,000 9,347,000 9,347,000 Total Current Liabilities 25,338,088 25,581,547 25,843,155 25,756,592 25,979,527 24,547,622 23,518,125 23,483,228 23,460,884 22,627,516
Non-Current LiabilitiesBorrowings 43,149,100 39,999,282 34,588,953 29,416,358 24,249,547 20,639,762 17,940,297 15,480,597 13,304,288 12,117,800 Provisions 5,232,000 5,232,000 5,232,000 5,232,000 5,232,000 5,232,000 5,232,000 5,232,000 5,232,000 5,232,000 Total Non-Current Liabilities 48,381,100 45,231,282 39,820,953 34,648,358 29,481,547 25,871,762 23,172,297 20,712,597 18,536,288 17,349,800
TOTAL LIABILITIES 73,719,188 70,812,829 65,664,108 60,404,950 55,461,074 50,419,384 46,690,422 44,195,825 41,997,172 39,977,316 Net Assets 772,559,092 772,850,436 774,580,333 777,732,568 781,189,710 785,403,192 789,567,742 793,788,779 797,602,870 801,356,346
EQUITYRetained Earnings 457,104,092 457,395,436 459,125,333 462,277,568 465,734,710 469,948,192 474,112,742 478,333,779 482,147,870 485,901,346 Revaluation Reserves 315,455,000 315,455,000 315,455,000 315,455,000 315,455,000 315,455,000 315,455,000 315,455,000 315,455,000 315,455,000 Council Equity Interest 772,559,092 772,850,436 774,580,333 777,732,568 781,189,710 785,403,192 789,567,742 793,788,779 797,602,870 801,356,346 Total Equity 772,559,092 772,850,436 774,580,333 777,732,568 781,189,710 785,403,192 789,567,742 793,788,779 797,602,870 801,356,346
Great Lakes Council10 Year Financial Plan for the Years ending 30 June 2026
BALANCE SHEET - GENERAL FUND
Projected Years
alance sheet - consolidated – srv scenario
B Section 3 - statem
ent of revenue policy

54
Scenario: 6.5% Special Rate Variation 2016/17 2017/18 2018/19 2019/20 2020/21 2021/22 2022/23 2023/24 2024/25 2025/26
$ $ $ $ $ $ $ $ $ $Cash Flows from Operating ActivitiesReceipts:Rates & Annual Charges 42,560,037 44,120,430 46,138,677 48,188,298 49,592,719 51,005,774 52,079,497 53,177,312 54,290,147 55,428,900 User Charges & Fees 7,174,246 7,369,186 7,584,835 7,792,880 8,016,932 8,256,284 8,483,625 8,721,491 8,960,970 9,183,702 Interest & Investment Revenue Received 1,924,989 2,034,565 2,096,695 2,151,595 2,206,995 2,251,319 2,306,821 2,376,149 2,415,941 2,440,534 Grants & Contributions 16,833,487 15,613,626 15,554,847 15,736,929 15,921,157 16,110,599 16,295,841 16,542,146 16,828,783 17,089,508 Other 1,639,930 1,811,039 1,866,827 1,898,382 1,948,351 2,000,058 2,052,995 2,065,997 2,080,893 2,110,867 Payments:Employee Benefits & On-Costs (25,239,831) (26,060,664) (26,543,785) (27,435,123) (28,353,560) (29,379,548) (30,443,835) (31,548,522) (32,730,420) (33,815,068) Materials & Contracts (16,473,774) (16,266,047) (16,643,459) (16,891,662) (17,181,583) (17,597,231) (18,018,314) (18,317,741) (18,659,137) (19,280,430) Borrowing Costs (2,434,033) (2,505,601) (2,323,700) (2,037,507) (1,745,882) (1,472,302) (1,193,987) (1,038,235) (921,659) (814,940) Other (9,216,796) (9,330,540) (9,656,197) (9,966,900) (10,548,306) (10,664,873) (10,973,171) (11,348,570) (11,982,020) (12,115,446)
Net Cash provided (or used in) Operating Activities 16,768,255 16,785,992 18,074,739 19,436,893 19,856,822 20,510,080 20,589,473 20,630,027 20,283,498 20,227,628
Cash Flows from Investing ActivitiesReceipts:Sale of Investment Securities 1,809,420 3,276,977 4,064,584 - - - - - - - Sale of Infrastructure, Property, Plant & Equipment 860,810 787,174 1,216,131 431,506 851,728 924,452 1,158,768 484,698 1,397,709 563,084 Payments:Purchase of Infrastructure, Property, Plant & Equipment (22,405,450) (17,886,305) (18,035,688) (13,365,486) (14,986,958) (15,184,713) (16,076,670) (14,088,175) (16,806,044) (15,123,509)
Net Cash provided (or used in) Investing Activities (19,735,220) (13,822,155) (12,754,973) (12,933,980) (14,135,230) (14,260,261) (14,917,902) (13,603,477) (15,408,335) (14,560,425)
Cash Flows from Financing ActivitiesReceipts:Proceeds from Borrowings & Advances 8,637,655 3,813,991 1,644,043 1,664,747 1,686,125 1,704,929 1,410,121 1,442,802 1,457,273 1,470,000 Repayment of Borrowings & Advances (6,072,080) (6,777,828) (6,963,809) (7,054,372) (6,837,342) (6,852,936) (5,314,714) (4,109,586) (3,902,502) (3,633,582)
Net Cash Flow provided (used in) Financing Activities 2,565,575 (2,963,837) (5,319,766) (5,389,625) (5,151,217) (5,148,007) (3,904,593) (2,666,784) (2,445,229) (2,163,582)
Net Increase/(Decrease) in Cash & Cash Equivalents (401,389) - - 1,113,288 570,374 1,101,813 1,766,979 4,359,766 2,429,933 3,503,620
Cash, Cash Equivalents & Investments - end of the year 49,183,580 45,906,603 41,842,019 42,955,307 43,525,681 44,627,494 46,394,473 50,754,239 53,184,173 56,687,793
Great Lakes Council10 Year Financial Plan for the Years ending 30 June 2026
CASH FLOW STATEMENT - GENERAL FUND
Projected Years
ash flow statement - consolidated – srv scenario C
Sect
ion
3 - s
tate
men
t of r
even
ue p
olic
y

55
Scenario: 6.5% Special Rate Variation 2016/17 2017/18 2018/19 2019/20 2020/21 2021/22 2022/23 2023/24 2024/25 2025/26
Note 13 RatiosOperating Performance Ratio -3.12% -1.64% 0.41% 2.31% 2.65% 3.55% 3.42% 3.42% 2.86% 2.73%Own Source Operating Revenue Ratio 75.99% 78.28% 78.79% 79.26% 79.52% 79.78% 79.94% 80.03% 80.09% 80.16%Unrestricted Current Ratio 3.02 2.83 2.67 2.82 2.85 3.27 3.70 4.12 4.35 4.99Debt Service Cover Ratio 1.96 1.92 2.05 2.22 2.36 2.49 3.13 3.94 4.09 4.40Rates, Annual Charges, Interest & Extra Charges Outstanding Percentage 6.04% 6.04% 6.04% 6.04% 6.03% 6.03% 6.03% 6.03% 6.03% 6.03%
Great Lakes Council10 Year Financial Plan for the Years ending 30 June 2026
FINANCIAL PERFORMANCE INDICATORS - GENERAL FUND
Projected Years
inancial performance indicators – srv scenario
F
Section 3 - statem
ent of revenue policy

56
Scenario: 6.5% Special Rate Variation 2016/17 2017/18 2018/19 2019/20 2020/21 2021/22 2022/23 2023/24 2024/25 2025/26$ $ $ $ $ $ $ $ $ $
Program Description Net Result Net Result Net Result Net Result Net Result Net Result Net Result Net Result Net Result Net Result
CIVIC GOVERNMENT (382,057) (380,221) (390,149) (400,348) (430,883) (421,590) (432,651) (444,016) (476,195) (467,697) ECONOMIC DEVELOPMENT (804,309) (827,535) (851,508) (876,256) (899,610) (923,644) (946,705) (972,163) (997,365) (1,025,389) PROGRAM MANAGEMENT & SUPPORT (1,603,576) (1,620,285) (1,695,632) (1,708,953) (1,781,183) (1,855,109) (1,935,095) (2,017,967) (2,110,588) (2,217,795) TOURISM PROMOTION (772,018) (796,373) (821,533) (847,527) (874,244) (901,846) (930,363) (959,829) (990,278) (1,023,877) CORPORATE FINANCES 36,598,210 38,025,757 39,783,977 41,333,088 42,298,083 43,165,612 44,127,862 45,094,863 46,013,976 46,898,931 INFORMATION TECHNOLOGY SERVICES (1,828,550) (2,004,063) (2,157,600) (2,158,307) (2,255,315) (2,257,231) (2,409,953) (2,245,202) (2,300,175) (2,356,776) ADMINISTRATION (576,688) (596,042) (616,042) (636,710) (658,068) (679,990) (702,645) (726,058) (750,255) (775,262) PROPERTY MANAGEMENT (523,810) (539,890) (800,904) (802,534) (815,438) (834,279) (853,841) (874,246) (813,853) (836,068) COMMERCIAL SERVICES (610,250) (610,366) (625,124) (637,096) (654,963) (673,716) (653,471) (674,131) (695,818) (620,901) LIBRARY SERVICES (1,312,969) (1,355,919) (1,400,596) (1,446,415) (1,493,740) (1,542,642) (1,585,027) (1,629,147) (1,674,815) (1,724,136) HUMAN RESOURCE MANAGEMENT (847,451) (780,799) (805,452) (830,938) (857,285) (884,521) (912,677) (941,784) (971,875) (1,002,982) COMMUNITY SERVICES (1,092,248) (1,064,710) (1,111,816) (1,147,331) (1,173,576) (1,211,941) (1,224,369) (1,266,888) (1,311,224) (1,359,097) DEVELOPMENT CONTROL (238,500) (247,036) (255,944) (265,241) (274,940) (285,059) (295,613) (306,620) (318,098) (330,064) STRATEGIC PLANNING (581,558) (548,835) (566,679) (585,108) (604,143) (623,803) (644,109) (665,082) (686,745) (709,120) BUILDING SERVICES (522,202) (538,101) (555,065) (572,129) (589,799) (608,095) (634,746) (661,859) (689,891) (718,874) REGULATORY CONTROL (155,192) (159,054) (163,076) (167,248) (171,576) (176,066) (180,722) (185,262) (189,973) (194,862) WASTE MANAGEMENT - - - - - - - - - - ENVIRONMENTAL HEALTH & PROTECTION (104,373) (106,868) (109,443) (112,100) (114,843) (117,673) (120,595) (123,610) (126,722) (129,933) ROADS & DRAINAGE SERVICES (18,291,697) (19,543,728) (20,134,652) (20,786,070) (21,387,894) (21,689,810) (21,391,450) (20,822,857) (21,428,983) (21,915,402) PARKS & RECREATION SERVICES (5,117,958) (5,101,389) (5,264,639) (5,430,048) (5,535,145) (5,716,245) (5,903,567) (6,097,340) (6,297,804) (6,502,602) TECHNICAL SUPPORT SERVICES (701,056) (635,100) (655,994) (677,661) (700,003) (723,171) (747,176) (772,095) (798,946) (822,716) PRIVATE WORKS-PUBLIC & PRIVATE 30,000 29,138 28,247 27,325 26,372 25,387 24,368 23,315 22,226 21,099 RURAL FIRE SERVICES (561,748) (598,579) (621,363) (644,902) (668,945) (693,782) (719,442) (745,956) (773,355) (800,837) NATURAL SYSTEMS - - - - - - - - - -
- - 209,013 627,492 382,862 370,789 928,015 1,986,067 1,633,246 1,385,639
Great Lakes Council10 Year Financial Plan for the Years ending 30 June 2026
SUMMARY OF BUDGET POSITION BY PROGRAM - GENERAL FUND
ummary of all centres – srv scenario
S
Se
ctio
n 3
- sta
tem
ent o
f rev
enue
pol
icy

57
rdinary rates
In December 2015 the Independent Pricing and Regulatory Tribunal (IPART) determined a general rate increase of 1.8% for NSW councils for the 2016-2017 financial year. This represents the maximum amount that Council can increase its general income for the rating year commencing 1 July 2016. Great Lakes Council has resolved to apply for a Section 508A Special Rate Variation to increase its general income above the 1.8% rate peg limit. The Section 508A application is for a 6.5% increase in general income in 2016-2017, followed by 3 annual increase of $.25%. These increases are inclusive of the 2016-2017 rate peg of 1.8% and forecast increases of 2.5% per annum thereafter. Council has resolved not to increase income from non-urban land (i.e. properties not permitted to have a dwelling erected upon them). If Council’s application is successful all residential, business, mining and farmland properties (excepting non-urban land) will be subject to an increase in rates of approximately 6.5% in 2016-2017. The 6.5% increase will be impacted by the redistribution of the amount applicable to the non-urban land across all other rateable properties. In addition the rate structures include a ‘catch-up’ of income lost due to property valuation objections. As such the increase will not be uniform and as such some increases on individual properties will be slightly higher or lower than Council's overall increase in revenue of 6.5%. .
aluations In NSW council rates are levied based on the rateable land value of each parcel of land as supplied by the Valuer General. Rates for
2016-2017 will be calculated using property values with a base date of 1 July 2014.
O
V Section 3 - statem
ent of revenue policy

58
ategorisation of land Council is required to categorise all rateable land into one of four broad categories. These categories are Farmland, Residential, Business and Mining. Council may also create sub categories within each of these categories.
The categories are principally determined by the "dominant use" of the land and not by the zoning of the land. Zoning may be considered when determining the category of vacant land. The following categories and sub-categories are to be used in the 2016-2017 rating period.
Category Sub-category Definition of use
Residential
Dominant use of land is for residential purposes. Includes vacant land zoned to permit use for residential purposes.
Residential Towns Separate sub-categories based on "centres of population" for Nabiac, Stroud, Bulahdelah, Forster, Tuncurry, Green Point, Pacific Palms, Hawks Nest, Tea Gardens, Seal Rocks, Pindimar, Coomba Park, North Arm Cove and Winda Woppa. Includes vacant land within those areas that are zoned to permit residential purposes.
Business
Includes all properties which cannot be categorised as Residential or Farmland. Includes vacant land zoned to permit business.
Business Towns Separate sub-category for business properties in the towns of Forster and Tuncurry and the Council Administration Centre in Forster. Includes vacant land zoned for purposes such as business, commercial or industrial use.
Farmland All land deemed to be Farmland in accordance with the provisions of Section 515 Local Government Act 1993.
All residential type blocks such as at North Arm Cove and Pindimar which are zoned Zone RU2 - Rural Landscape. These properties cannot receive building approval, however limited agricultural use may be permitted.
Mining Land is to be categorised as mining if it is a parcel of rateable land and its dominant use is for a coal or metalliferous mine.
Maps showing the sub-category of all rateable land are available for inspection at Council’s administration building in Breese Parade, Forster. A computer listing showing individual categorisation for all properties in the Farmland, Business and Mining categories is also available for inspection at Council’s administration building in Breese Parade, Forster. Ratepayers who believe that their property has been incorrectly categorised can seek amendment to the categorisation. Further details can be obtained from Council’s Rates Section.
C Se
ctio
n 3
- sta
tem
ent o
f rev
enue
pol
icy

59
ating structure Each year Council determines a rating policy for the next financial year,
in determining its rating structure, Council considers the need for equity amongst all ratepayers. Council has previously decided that it will use a two part rating structure consisting of a base amount and an ad valorem amount. In determining its rating structure consideration was given to all the rating structure options available, Council has also examined the valuation range across its rate base. It is of the opinion that rates levied wholly as an ad valorem rate would not result in an equitable distribution of the rates. As such, Council uses base amounts to obtain a more equitable distribution of the rate burden. Council considers the requirements of Section 536 of the Local Government Act in determining the level of the various base amounts.
(1) base amount:
► the base amount is a fixed amount and must be the same for every property subject to a particular rate;
► the base amount should not collect more than 50% of the total amount of rates payable for a category or sub-category.
(2) ad valorem amount:
► the ad valorem amount is calculated by multiplying the rateable value of a property by a rate set on the dollar by Council;
► the higher the value of a property the higher the ad valorem component;
R Section 3 - statem
ent of revenue policy

60
016-2017 rate structure 1.8% increase
Categories/sub categories Assessments Base % Amount Value Rate in $ Total Rates Residential Forster 7,155 45.14% $549.00 1,131,431,210 0.00422000 $ 8,702,734.71 Tuncurry 3,138 47.93% $549.00 443,559,818 0.00422000 $ 3,594,584.43 Green Point 309 46.32% $549.00 46,580,200 0.00422000 $ 366,209.44 Total Forster Tuncurry Green Point Rate 10,602 1,621,571,228 $12,663,528.58 Hawks Nest 1,379 42.82% $549.00 260,767,400 0.00387700 $ 1,768,066.21 Tea Gardens 1,394 45.18% $549.00 239,518,236 0.00387700 $ 1,693,918.20 North Arm Cove 398 40.03% $549.00 84,430,500 0.00387700 $ 545,839.05 Pindimar 191 39.97% $549.00 40,617,700 0.00387700 $ 262,333.82 Seal Rocks 61 17.82% $549.00 39,822,000 0.00387700 $ 187,878.89 Total Lower Coastal Rate 3,423 665,155,836 $ 4,458,036.18 Winda Woppa Rate 167 20.33% $549.00 83,748,000 0.00429000 $ 450,961.92 Pacific Palms Rate 992 32.13% $549.00 355,036,570 0.00324000 $ 1,694,926.49 Coomba Park Rate 647 48.97% $483.00 35,245,460 0.00924000 $ 638,169.05 Nabiac Rate 246 49.14% $501.00 29,595,000 0.00431000 $ 250,800.45 Bulahdelah Rate 492 49.84% $501.00 43,823,832 0.00566000 $ 494,534.89 Stroud Rate 306 49.05% $501.00 36,953,070 0.00431000 $ 312,573.73 Residential Rate 4,341 49.96% $602.00 857,598,380 0.00305200 $ 5,230,672.26
Farmland Rate 4,138 44.06% $323.00 498,283,000 0.0034060 $ 3,033,725.90 Business Forster Business Rate 386 15.58% $634.00 135,904,874 0.00976000 $ 1,571,155.57 Tuncurry Business Rate 214 15.75% $634.00 74,351,523 0.00976000 $ 861,346.86 Council Admin Centre Business Rate 1 9.58% $634.00 4,500,000 0.00133000 $ 6,619.00 Business Rate 443 30.64% $634.00 104,075,012 0.00611000 $ 916,760.32 Mining Rate 4 4.19% $634.00 8,046,000 0.00720000 $ 60,467.20 Total 26,402 4,553,887,785 $32,644,278.40
Note: the above ad valorem rates/base amounts and estimated yields may change slightly due to new supplementary valuations being received by Council for the purpose of rating prior to this Operational Plan being adopted.
2 Se
ctio
n 3
- sta
tem
ent o
f rev
enue
pol
icy

61
016-2017 rate structure 6.5% increase
Categories/sub categories Assessments Base % Amount Value Rate in $ Total Rates Residential Forster 7,155 45.04% $574.00 1,131,431,210 0.00443000 $ 9,119,210.26 Tuncurry 3,138 47.83% $574.00 443,559,818 0.00443000 $ 3,766,181.99 Green Point 309 46.22% $574.00 46,580,200 0.00443000 $ 383,716.29 Total Forster Tuncurry Green Point Rate 10,602 1,621,571,228 $ 13,269,108.54 Hawks Nest 1,379 42.72% $574.00 260,767,400 0.00407000 $ 1,852,869.32 Tea Gardens 1,394 45.08% $574.00 239,518,236 0.00407000 $ 1,774,995.22 North Arm Cove 398 39.93% $574.00 84,430,500 0.00407000 $ 572,084.14 Pindimar 191 39.87% $574.00 40,617,700 0.00407000 $ 274,948.04 Seal Rocks 61 17.77% $574.00 39,822,000 0.00407000 $ 197,089.54 Total Lower Coastal Rate 3,423 665,155,836 $ 4,671,986.25 Winda Woppa Rate 167 20.28% $574.00 83,748,000 0.00450000 $ 472,724.00 Pacific Palms Rate 992 32.12% $574.00 355,036,570 0.00339000 $ 1,772,981.97 Coomba Park Rate 647 49.13% $505.00 35,245,460 0.00960000 $ 665,091.42 Nabiac Rate 246 49.07% $524.00 29,595,000 0.00452000 $ 262,673.40 Bulahdelah Rate 492 49.72% $524.00 43,823,832 0.00595000 $ 518,559.80 Stroud Rate 306 48.98% $524.00 36,953,070 0.00452000 $ 327,371.88 Residential Rate 4,341 49.91% $630.00 857,598,380 0.00320000 $ 5,479,144.82
Farmland Rate 4,138 42.47% $320.00 498,283,000 0.0036000 $ 3,117,978.80 Business Forster Business Rate 386 15.48% $664.00 135,904,874 0.01030000 $ 1,656,124.20 Tuncurry Business Rate 214 15.65% $664.00 74,351,523 0.01030000 $ 907,916.69 Council Admin Centre Business Rate 1 9.53% $664.00 4,500,000 0.00140000 $ 6,964.00 Business Rate 443 30.63% $664.00 104,075,012 0.00640000 $ 960,232.08 Mining Rate 4 4.22% $664.00 8,046,000 0.00750000 $ 63,001.00
Total 26,402 4,553,887,785 $
34,151,858.84 Note: the above ad valorem rates/base amounts and estimated yields may change slightly due to new supplementary valuations being received by Council for the purpose of rating prior to this Operational Plan being adopted.
2 Section 3 - statem
ent of revenue policy

62
nterest charges (extra charges) Interest is charged on all overdue rates and annual charges in accordance
with section 566 of the Local Government Act. The maximum interest rate is set by the Minister for Local Government. It is proposed that Council calculate interest at the maximum percentage per annum permitted and that such interest be calculated daily on a simple interest basis.
nnual charges
Waste management charge The (s501) waste management charge will continue to apply to all properties where waste services are available. This waste management charge will be used to fund principal repayments on loans and any excess funds will be placed in reserves to assist in funding future expenditure. The charge is to be applied to each property where the service is available including vacant land, it is proposed to increase the section 501 waste management charge from $40.50 to $44.15.
► Properties containing more than one dwelling or utilising more than one service will be levied a waste management charge for each dwelling or service provided. (includes units/retirement villages and other multiple dwellings where bulk bin containers may be supplied). Example 15 units/dwellings the charge will be the equivalent to 15 x waste management charge (s501).
Particulars Number Charge per unit Yield $
Waste management charge (s501)
25,043 44.15 1,105,648.45
ther waste management charges
There are a number of non domestic properties that utilise Council’s mobile garbage bin services. These include commercial and
industrial premises that are not currently being serviced by a privately arranged bulk bin service
To ensure that these properties contribute to the overall cost of providing the mobile garbage bin/kerbside recycling service, it is proposed that a waste service charge be levied on all such properties. It is proposed that waste service charges be kept at the same level as 2015-2016. Properties subject to these charges will also be subject to the waste management charge of $44.15 detailed previously in this policy statement. The charge is to be levied in respect of each service provided. Properties commencing a service after 1 July 2016 will be subject to a reduction in the charge based on the number of weeks that have expired before the service is commenced.
Particulars Number Charge per unit Yield $
Waste management commercial / industrial (standard) 745 440.50 328,172.50
Waste management commercial / industrial (weekly) 11 502.00 5,522.00
Commercial 240 ltr rubbish bin 146 338.50 49,421.00 240 ltr recycling bin (fortnightly) 19 192.00 3,648.00 240 ltr recycling bin (weekly) 4 338.50 1354.00 240 ltr organic bin (fortnightly) 17 158.50 2,694.50
I
A O
Sect
ion
3 - s
tate
men
t of r
even
ue p
olic
y

63
omestic waste management Council is required to levy a domestic waste charge on ALL rateable
land where the service is deemed available, including vacant land. Rate pegging legislation is not applicable to domestic waste charges however the domestic waste function is required to be self funding. This means that waste charges are set by Council to cover the cost of domestic waste collection services, landfill and waste processing costs, education and promotion, provision for future planning and all other associated services. It is proposed that the domestic waste service charge be kept at the same level as 2015-2016. All properties subject to domestic waste charges will also be subject to the waste management charge of $44.15 detailed previously in this policy statement. The domestic waste collection area incorporates the entire Council area with the exception of properties/areas deemed inaccessible or not cost effective, and non-urban land (i.e. properties not permitted to have a dwelling erected upon them). The current comprehensive domestic waste service includes the following:
► a weekly kerbside collection of garbage using a 140L mobile garbage bin
► a fortnightly kerbside recycling collection using a 240L mobile garbage bin
► a fortnightly kerbside organic collection using a 240L mobile garbage bin (not available in some rural areas)
► Council will determine the most appropriate bin type and size to suit particular properties. In instances where properties contain a large number of dwellings (such as retirement villages) it may not be practical to issue individual mobile garbage bins. Bulk bin containers or a mixture of mobile bins and bulk bins may be supplied
► one kerbside clean-up campaign each year which will comprise of two separate collections of whitegoods/scrap metal and general waste
► contribution to the provision of the public place litter and recycling bin service
► contribution to the provision and operation of landfills and landfill recycling services
► contribution to the provision and operations of waste transfer stations ► contribution to the provision of a public weighbridge located at the
Tuncurry Waste Management Centre ► community programs (Clean Up Australia Day etc.) ► community education for waste management services ► management and administration services ► technical advice
It is proposed that:
► A domestic waste service charge for the removal of household waste (including kerbside recycling and organic where available) be applied to each domestic premises/non rateable property where the service is deemed to be available or for the use of a common collection point.
► Every dwelling in a strata lot is to be taken as a separate parcel and levied a separate charge
► The charge may be expressed as the number of individual units or dwellings forming part of a single assessment. Properties containing more than one habitable dwelling, may be in a single ownership, will be subject to an additional domestic waste service charge for each habitable dwelling (includes units, retirement villages and other multiple occupancy dwellings where bulk bin containers may be supplied). Example a property containing 15 units/dwellings the charge will be the equivalent to 15 x domestic waste service charge
► a vacant domestic waste management charge to meet a proportion of the cost of administrative and fixed cost of the domestic waste management service will be applied to all vacant land where the service is deemed available
► properties that require additional bins will be charged for the additional services as detailed in the table below
► where the service to any premises is commenced after 1 July 2016 the charge/charges shall be reduced in proportion to the number of weeks that have expired before such service commences
D Section 3 - statem
ent of revenue policy
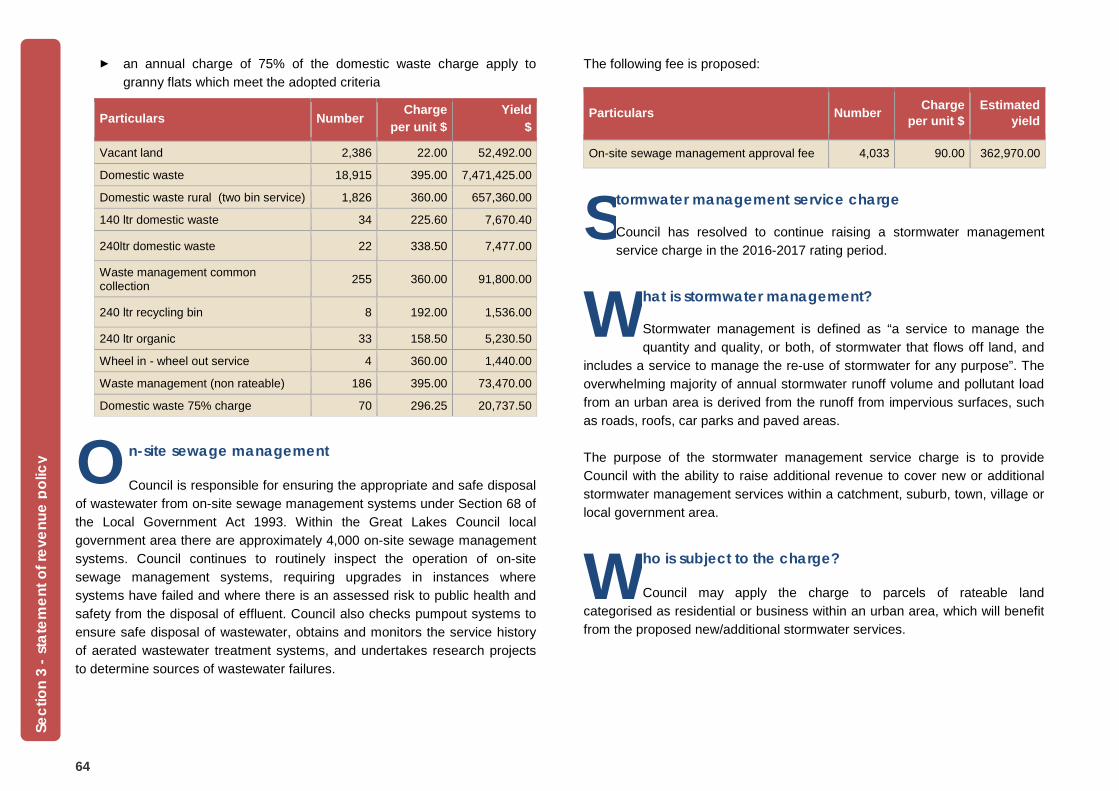
64
► an annual charge of 75% of the domestic waste charge apply to granny flats which meet the adopted criteria
Particulars Number Charge per unit $
Yield $
Vacant land 2,386 22.00 52,492.00
Domestic waste 18,915 395.00 7,471,425.00
Domestic waste rural (two bin service) 1,826 360.00 657,360.00
140 ltr domestic waste 34 225.60 7,670.40
240ltr domestic waste 22 338.50 7,477.00
Waste management common collection 255 360.00 91,800.00
240 ltr recycling bin 8 192.00 1,536.00
240 ltr organic 33 158.50 5,230.50
Wheel in - wheel out service 4 360.00 1,440.00
Waste management (non rateable) 186 395.00 73,470.00
Domestic waste 75% charge 70 296.25 20,737.50
n-site sewage management Council is responsible for ensuring the appropriate and safe disposal
of wastewater from on-site sewage management systems under Section 68 of the Local Government Act 1993. Within the Great Lakes Council local government area there are approximately 4,000 on-site sewage management systems. Council continues to routinely inspect the operation of on-site sewage management systems, requiring upgrades in instances where systems have failed and where there is an assessed risk to public health and safety from the disposal of effluent. Council also checks pumpout systems to ensure safe disposal of wastewater, obtains and monitors the service history of aerated wastewater treatment systems, and undertakes research projects to determine sources of wastewater failures.
The following fee is proposed:
Particulars Number Charge per unit $
Estimated yield
On-site sewage management approval fee 4,033 90.00 362,970.00
tormwater management service charge Council has resolved to continue raising a stormwater management service charge in the 2016-2017 rating period.
hat is stormwater management? Stormwater management is defined as “a service to manage the quantity and quality, or both, of stormwater that flows off land, and
includes a service to manage the re-use of stormwater for any purpose”. The overwhelming majority of annual stormwater runoff volume and pollutant load from an urban area is derived from the runoff from impervious surfaces, such as roads, roofs, car parks and paved areas. The purpose of the stormwater management service charge is to provide Council with the ability to raise additional revenue to cover new or additional stormwater management services within a catchment, suburb, town, village or local government area.
ho is subject to the charge? Council may apply the charge to parcels of rateable land
categorised as residential or business within an urban area, which will benefit from the proposed new/additional stormwater services.
O
S W
W
Sect
ion
3 - s
tate
men
t of r
even
ue p
olic
y

65
ow much will it cost?
The Local Government Act provides that the following maximum charges can be applied:
► residential property containing a dwelling is to be charged a maximum
of $25 ► residential strata unit is to be charged a maximum of $12.50 per unit ► business properties are to be charged at the rate of $25 per 350m2 of
land containing impervious surfaces ► business strata units are to be charged at the rate of $25 per 350m2.
The calculation includes common land and is divided between the units on a unit entitlement basis. Council may introduce a minimum charge for business strata units.
ow will the funds be spent?
In addition to the normal stormwater management programs provided by Council the following additional projects are proposed
for 2016-2017:
► Lee Street/Crawford Street/Stroud Street, Bulahdelah ► Cove Boulevard, North Arm Cove - strategy works
Category Number Proposed charge $ Estimated yield $
Residential 12,375 25.00 309,375.00
Residential strata 4,689 12.50 58,612.50
Business strata 236 12.50 2,950.00
Business < 700m2 129 25.00 3,225.00
Business 701m2 - 1,400m2 167 50.00 8,350.00
Business 1,401m2 - 2,100m2 79 75.00 5,925.00
Business 2,101m2 - 2,800m2 34 100.00 3,400.00
Business 2,801m2 - 3,500m2 21 150.00 3,150.00
Business 3,501m2 - 6,300m2 50 200.00 10,000.00
Business 6,301m2 - 10,150m2 14 350.00 4,900.00
Business > 10,150m2 29 500.00 14,500.00
Total 17,823 424,387.50
ensioner concession The Local Government Act provides for eligible pensioners to receive a
reduction in their rates. This pensioner rate concession is generally 50% of the combined total of ordinary rates and the domestic waste management charge to a maximum of $250. The State Government reimburses Council 55% of each rebate given (normally $137.50) with Council writing off the balance of $112.50. Ratepayers receiving the pensioner rate concession will be entitled to a further concession of $10 on the residential stormwater management charge of $25 and $5 on the residential strata unit stormwater management charge of $12.50. This additional rebate is fully funded by Council.
H
H
P
Section 3 - statement of revenue policy
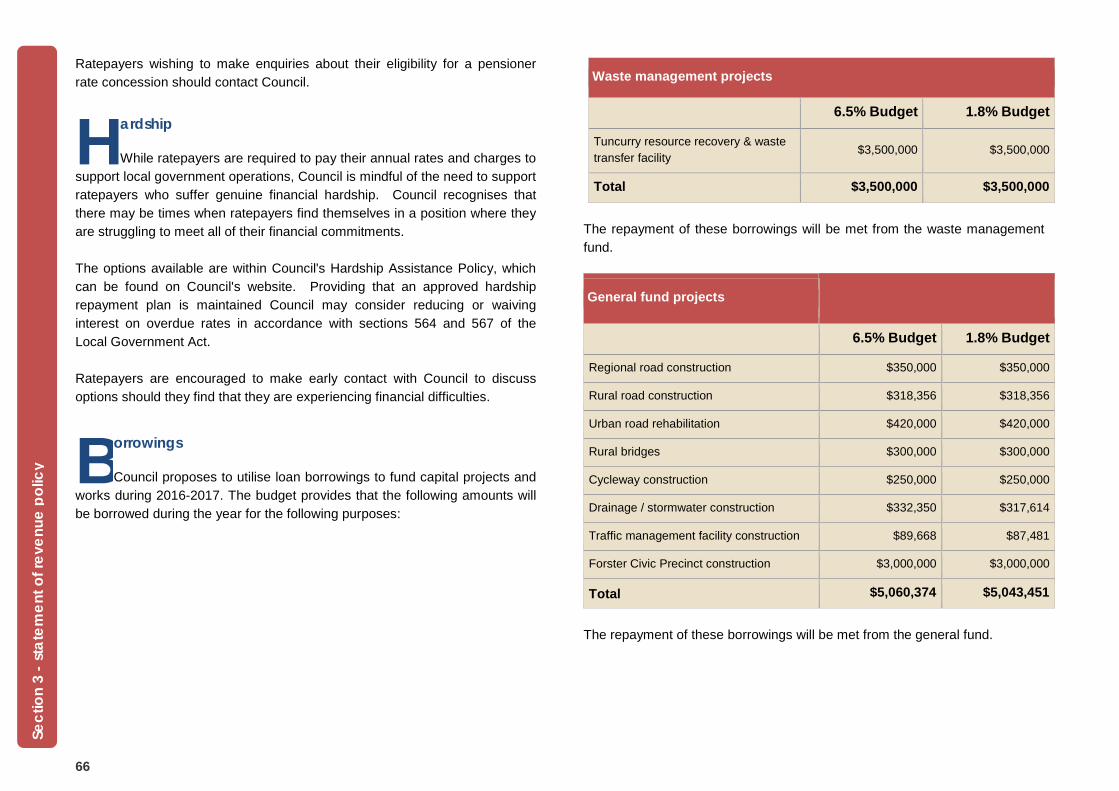
66
Ratepayers wishing to make enquiries about their eligibility for a pensioner rate concession should contact Council.
ardship While ratepayers are required to pay their annual rates and charges to
support local government operations, Council is mindful of the need to support ratepayers who suffer genuine financial hardship. Council recognises that there may be times when ratepayers find themselves in a position where they are struggling to meet all of their financial commitments. The options available are within Council's Hardship Assistance Policy, which can be found on Council's website. Providing that an approved hardship repayment plan is maintained Council may consider reducing or waiving interest on overdue rates in accordance with sections 564 and 567 of the Local Government Act. Ratepayers are encouraged to make early contact with Council to discuss options should they find that they are experiencing financial difficulties.
orrowings Council proposes to utilise loan borrowings to fund capital projects and
works during 2016-2017. The budget provides that the following amounts will be borrowed during the year for the following purposes:
Waste management projects
6.5% Budget 1.8% Budget
Tuncurry resource recovery & waste transfer facility
$3,500,000 $3,500,000
Total $3,500,000 $3,500,000
The repayment of these borrowings will be met from the waste management fund.
General fund projects
6.5% Budget 1.8% Budget
Regional road construction $350,000 $350,000
Rural road construction $318,356 $318,356
Urban road rehabilitation $420,000 $420,000
Rural bridges $300,000 $300,000
Cycleway construction $250,000 $250,000
Drainage / stormwater construction $332,350 $317,614
Traffic management facility construction $89,668 $87,481
Forster Civic Precinct construction $3,000,000 $3,000,000
Total $5,060,374 $5,043,451
The repayment of these borrowings will be met from the general fund.
H
B
Sect
ion
3 - s
tate
men
t of r
even
ue p
olic
y
67
section four asset management program
capital works

68
016 - 2017 asset management program (capital works) 2011 - 2012 asset management program The provision of quality infrastructure facilities is one of the core business activities of local government. The information provided below indicates the capital works that Council proposes to undertake to community infrastructure during 2016-2017. Roads, bridges, footpaths and drainage make up the majority of the program with a total expenditure of approximately $10.5 million on these assets.
Council has priority programs relating to urban and rural road construction and rehabilitation, rural bridge construction and stormwater drainage upgrades. These programs are based on detailed condition ratings regularly undertaken by Council. Council utilises the condition data and asset hierarchy as the basis for developing asset management plans. Based on these plans, the priority projects for 2016-2017 are as follows. Additional information on the priority of a particular road can be obtained by contacting Council’s Transport Assets Section.
PLANNED CAPITAL WORKS PROGRAMS NOTES Included in 6.5% Budget
Included in 1.8% Budget
Roads, Bridges, Footpaths & Drainage
Urban road rehabilitation Stroud St/Southern Side Stuart - Northern Side Richmond - Bulahdelah Macwood Rd/Matthew St - Third Ridge Rd - Smiths Lake Marine Dr - Charles St to end - including Charles St) - Tea Gardens Charles St/Myall St - Marine Drive - Tea Gardens Breese Parade - The Lakes Way Roundabout - Stockland Roundabout - Forster $1,673,500 $1,673,500
Urban road construction Pleasant View Parade (Bundabah Rd to end) - Bundabah Cove Ave (Pleasant View Pde to Second Ave) - Bundabah Wharf St (Donaldson St to end) - Nabiac Gloucester St - Memorial St to Erin St - Stroud Second Ave (Bundabah to end) - Bundabah Roads to Recovery funding $450,000 $450,000
Urban road reseals Resurfacing works (Forster, Bulahdelah, Hawks Nest, Nerong, Seal Rocks, Coolongolook) $1,000,000 $1,000,000
Rural road reseals Resurfacing works - various locations
$1,349,509 $1,348,721
Rural road rehabilitation Bombah Point Rd (segment 60) - Bulahdelah Limekilns Rd/Hough - 0.6km) - Tea Gardens Willina Rd (Highway to 0.4km) - Bunyah Toonang Dr (Petrel - Kooraru 1.869 km) - Tea Gardens Manns Rd/MR692 - End of Seal - Darawank
Partial Roads to Recovery funding $2,110,773
$1,710,773
2 Se
ctio
n 4
– as
set m
anag
emen
t pro
gram
cap
ital w
orks

69
PLANNED CAPITAL WORKS PROGRAMS NOTES Included in 6.5% Budget
Included in 1.8% Budget
Roads, Bridges, Footpaths & Drainage
Rural road construction - (sealing unsealed roads) Willina Road Bombah Point Road Wattley Hill Road
Roads to Recovery funding $1,000,000 $1,000,000
Rural road gravel re-sheeting Gravel re-sheeting works
$580,471 $567,103
Rural bridge construction Minimbah Road Bridge 10 $300,000 $300,000
Regional road rehabilitation / reconstruction The Lakes Way - Bungwahl Village Stage 2 (Funded) The Bucketts Way - Weismantles & Limeburners Creek (grant dependant)
Roads & Maritime Services (RMS) repair program RMS
block grant $1,000,000 $1,000,000
Regional road reseals Sealing works
Roads & Maritime Services (RMS) block grant $200,000 $200,000
Footpath / cycleway construction Tarean Road, Karuah Marine Drive, Tea Gardens Coupland Avenue, Tea Gardens
$250,000 $250,000
Traffic facilities management $89,668 $87,481
Stormwater drainage construction North Arm Cove - Cove Boulevard Bulahdelah - with Lee/Crawford/Stroud St Road reconstruction. Green Point Drive Drainage
Partially funded by stormwater management charge $561,156 $545,414
Culvert construction Replace culverts - various locations $300,000 $300,000
Section 4 – asset managem
ent program capital w
orks

70
PLANNED CAPITAL WORKS PROGRAMS NOTES Included in 6.5% Budget
Included in 1.8% Budget
Roads, Bridges, Footpaths, Drainage TOTAL $10,865,077 $10,432,992
Parks & Reserves
Plant purchases - community groups $39,000 $39,000
Nabiac Sports Field - Cricket pitch upgrade $20,000 $20,000
Bulahdelah Sport Complex - Cricket pitch upgrade $10,000 $10,000
Tuncurry Rockpool - Retaining Wall Rehabilitation $135,000 $135,000
Playground Equipment Replacement Program $100,000 $0
Beach Showers Renewal Program $10,000 $10,000
Mountain Park Bulahdelah - Facility Improvements $40,000 $40,000
Parks & Reserves TOTAL $354,000 $254,000
Works Operations
Plant & Fleet Replacement Program $2,155,000 $2,155,000
Tuncurry Depot - Fuel Bowser Replacement $85,000 $85,000
Tuncurry Depot - Renovate MCW area following their exit from depot $30,000 $30,000
Bulahdelah Depot - Washdown bay enhancements $20,000 $20,000
Works Operations TOTAL $2,290,000 $2,290,000
Environmental Protection
Wallis Lake Wetland Strategy Implementation - Land Purchases $213,264 $213,264
Pipers Creek Retrofit Project $100,000 $100,000
Environmental Protection TOTAL $313,264 $313,264
Sect
ion
4 –
asse
t man
agem
ent p
rogr
am c
apita
l wor
ks

71
PLANNED CAPITAL WORKS PROGRAMS NOTES Included in 6.5% Budget
Included in 1.8% Budget
Waste Management
Tuncurry Resource Recovery & Waste Transfer Facility $4,000,000 $4,000,000
Public Place Recycling Facilities $25,000 $25,000
Water Refill Station Program $5,000 $5,000
Stroud Landfill $250,000 $250,000
Great Lakes Landfill (Minimbah) $500,000 $500,000
Waste Management TOTAL $4,780,000 $4,780,000
Great Lakes Leisure & Aquatic Centre
Renewal of 25m pool heat pumps $100,000 $100,000
Great Lakes Leisure & Aquatic Centre TOTAL $100,000 $100,000
Public Buildings
Public Building Improvement Program- includes the following projects (subject to change) Refurbishment/renewal of Little Street amenities, Forster Construction of new sports ground amenities, Nabiac (Aub Ferris Sporting Complex Amenities) - (subject to grant funding) Renew sections of roof, Forster Community Centre Refurbishment of amenities, Bulahdelah Showground (incl. provide equal access facilities) (subject to grant funding) Refurbishment of amenities, John Debert Reserve, Smiths Lake (incl. provide equal access facilities)
$411,000 $310,000
Public Buildings TOTAL $411,000 $310,000
Section 4 – asset managem
ent program capital w
orks

72
PLANNED CAPITAL WORKS PROGRAMS NOTES Included in 6.5% Budget
Included in 1.8% Budget
Library Services
Literacy Resource Program $12,713 $12,500
Furniture & Equipment Replacement Program $7,547 $7,500
Computer Hardware Purchase & Replacement Program $37,738 $37,738
Library Book & Resource Purchases $194,950 $194,900
Library Local Special Projects Program $32,350 $32,350
Great Lakes Bookstart Program $3,040 $3,040
MidCoast Water Book Collection Program $1,500 $1,500
Library Services TOTAL $289,838 $289,528
Cemeteries
Forster Cemetery Stage one of sealing lower roadway and creating turning circle Sectional signage and various works
$30,000 $30,000
Tuncurry Cemetery Continuation of bush clearing for new burial areas Supply and installation of new columbarium wall, and construction of new lawn cemetery beams if demand requires
$30,000 $30,000
Tea Gardens Cemetery Supply and installation of new columbarium wall, signage
$27,500 $10,000
Bulahdelah Cemetery Construct new lawn cemetery beam to accommodate burial needs
$10,000 $5,000
Cemeteries TOTAL $97,500 $75,000
Sect
ion
4 –
asse
t man
agem
ent p
rogr
am c
apita
l wor
ks

73
PLANNED CAPITAL WORKS PROGRAMS NOTES Included in 6.5% Budget
Included in 1.8% Budget
Community Services
Stroud Court House - Heritage Conservation Management Plan Works $9,000 $9,000
Bulahdelah Court House - Heritage Conservation Management Plan Works $5,000 $5,000
Community Services TOTAL $14,000 $14,000
Information Technology
Computer hardware upgrade program $10,000 $10,000
Computer software upgrade program $120,000 $120,000
Computer & office equipment upgrade program $50,000 $50,000
Information Technology TOTAL $180,000 $180,000
TOTAL CAPITAL WORKS FOR 2016-2017 $19,694,679 $19,038,784
SPECIAL PROJECT Forster Civic Precinct Project Budget includes Council funds and government grants for construction of library and other community facilities only - Project is subject to Expressions of Interest from the private sector for development partners and Council is progressing through the procurement process to identify a suitable partner. Eventual project value may change based on development partners contribution and agreed final development plan.
(includes $6 million Federal Gov't funding)
$12,000,000 $12,000,000
Section 4 – asset managem
ent program capital w
orks

74
This page has been intentionally left blank