
Aerial Fertilization –Operational Considerations Aerial Fertilization Operational Considerations.

Operational Considerations and Troubleshooting for Oracle Enterprise Manager 13c O R A C L E W H I T E P A P E R | O C T O B E R 2 0 1 6

OPERATIONAL CONSIDERATIONS AND TROUBLESHOOTING FOR ORACLE ENTERPRISE MANAGER 13C
Table of Contents
Introduction 1
Infrastructure Components 1
Oracle Management Service (OMS) 1
Systems and Services 1
EM Jobs Service 1
EM Console Service 1
Oracle Management Agent 2
Oracle Management Repository 2
Oracle Management Plug-ins 2
JVMD Engine 2
Business Intelligence (BI) Publisher 2
Enterprise Manager Cloud Control Console 2
EM CLI 3
Diagnostic Tools 3
EMDIAG 3
REPVFY 4
OMSVFY 4
AGTVFY 4
Best Practices Configuration 4
Staffing Recommendations 4
Administrator Responsibilities 4
Maximum Availability 5

OPERATIONAL CONSIDERATIONS AND TROUBLESHOOTING FOR ORACLE ENTERPRISE MANAGER 13C
Oracle Management Service Backups 5
Management Repository Backups 6
Software Library Backups 8
BI Publisher Backups 8
Management Agent Backups 8
Increased High Availability and Disaster Recovery Options 9
Notifications 9
Out-of-Bound Notifications 10
Patching 10
Agent Patching 10
Repository Patching 13
OMS Patching 13
Plug-ins 14
Always-On Monitoring 14
Audit Log Data 14
EM Auditing 14
Repository Database Auditing 15
Archive the audit data 16
Purge the records 16
Maintaining Enterprise Manager 17
EM Encryption 18
Availability 18
Oracle Management Servers 18

OPERATIONAL CONSIDERATIONS AND TROUBLESHOOTING FOR ORACLE ENTERPRISE MANAGER 13C
Repository Database 19
Software Library 20
General Availability 21
EM Internal Subsystems 21
EM Page Performance 22
Overview 22
Page Level Performance 22
DBMS Scheduler 23
Database Advanced Queuing (AQ) 25
Loader Subsystem 26
Loader report 28
Notification Subsystem 29
Task Subsystem 30
EM Job System 33
Agent Health 35
Events and Incidents 37
Log & Trace Files 39
Maintaining Log and Trace Files 40
Management Agent Log and Trace Files 40
OMS Trace and Log Files 40
Database Trace and Log Files 42
Incident Files 43
OMS Incident Files 43

OPERATIONAL CONSIDERATIONS AND TROUBLESHOOTING FOR ORACLE ENTERPRISE MANAGER 13C
Agent Incident Files 44
Troubleshooting 44
Conclusion 46

1 | OPERATIONAL CONSIDERATIONS AND TROUBLESHOOTING FOR ORACLE ENTERPRISE MANAGER 13C
Introduction
Oracle Enterprise Manager (EM) 13c has become a valuable component in monitoring and
administering an enterprise environment. The more critical the application, servers and services that
are monitored and maintained via EM, the more critical the EM environment becomes. Therefore, EM
must be as available as the most critical target it manages. This whitepaper will assist in defining the
proper configuration, monitoring and maintenance activities to ensure that EM stays highly available.
There are many areas that need to be discussed when talking about managing Enterprise Manager in
a data center. Some of these are as follows:
» Recommendations for staffing roles and responsibilities for EM administration
» Understanding the components that make up an EM environment
» Backing up and monitoring EM itself
» Maintaining a healthy EM system
» Patching the EM components
» Troubleshooting and diagnosing guidelines
This whitepaper will help define administrator requirements and responsibilities, and guide you in
setting up the proper monitoring and maintenance activities to keep Oracle Enterprise Manager 13c
healthy.
Infrastructure Components
Oracle Management Service (OMS)
The Oracle Management Service performs several important tasks in an EM environment. It is the web-based
application that communicates with the Oracle Management Agents and Oracle Management Plug-ins to discover,
monitor and manage targets as well as store the information in the Oracle Management Repository. It is also
responsible for running the user interface for the Enterprise Manager Cloud Control Console.
Systems and Services
In EM, an application can be modeled as a service that runs on a group of targets called a system. A system is
created to define the infrastructure required to host a specific application. Then, the application can be defined as a
service allowing monitoring and management of the application. Out of the box, the EM components are combined
into a system called “Management Services and Repository”. Services have been created on this system for
specific functions within EM itself as described below.
EM Jobs Service
The EM Jobs Service is a service using the Management Services and Repository system and consists of all
components required for the EM jobs to function properly. The availability of the EM Jobs System as a whole
depends on the availability of each of the underlying components defined in this service.
EM Console Service

2 | OPERATIONAL CONSIDERATIONS AND TROUBLESHOOTING FOR ORACLE ENTERPRISE MANAGER 13C
The EM Console Service is a service using the Management Services and Repository system and consists of all
components required for the EM Console to function properly. The availability of the EM Console System as a
whole depends on the availability of each of the underlying components defined in this service as well as a defined
“EM Console Service Test” and the “EM Management Beacon”.
Oracle Management Agent
The Oracle Management Agent is deployed on each host to be managed by an EM environment. It is responsible
for managing and monitoring all of the targets on that host (including the host itself) and communicating all
information to the Oracle Management Service.
Oracle Management Repository
The Oracle Management Repository is used for storing all of the data received from the Oracle Management
Agents. It organizes the data so that the Oracle Management Service can retrieve it and display it in the Enterprise
Manager Cloud Control Console.
Oracle Management Plug-ins
The core Enterprise Manager Cloud Control features for managing and monitoring the different Oracle components
are provided via separate components called plug-ins. This allows the flexibility of updating EM with the latest
product releases for one or more component releases without having to upgrade to a later Cloud Control release.
These provide a more “pluggable” framework.
JVMD Engine
The JVMD Engine provides the ability to diagnose performance problems in Java applications in the production
environment. As part of the EM 13c install, one JVMD Engine is installed and configured by default each OMS
server.
Business Intelligence (BI) Publisher
The BI Publisher is the primary reporting tool for creating, maintaining and delivering reports. It is installed and
configured by default on each OMS server.
Enterprise Manager Cloud Control Console
The Enterprise Manager Cloud Control Console is the user interface that provides one central location for monitoring
and administrating an entire environment.
Shown below is a picture of a typical environment showing how the above components relate.

3 | OPERATIONAL CONSIDERATIONS AND TROUBLESHOOTING FOR ORACLE ENTERPRISE MANAGER 13C
Figure1: EM Components
EM CLI
EM CLI is the Enterprise Manager Command Line Interface. Not only can this interface be executed from an
operating system console, it also allows administrators to run many EM commands via scripts and thereby allows
customers to create workflows based on their business needs. Using this interface, you can do many things such as
manage credentials, define service targets/templates and setup incidents. For more information about using EM CLI
refer to the Enterprise Manager Command Line Interface document.
Diagnostic Tools
EMDIAG
The EMDIAG Toolkit is a set of utilities that collect data from Cloud Control OMS, Repository and Agents to assist in
troubleshooting and maintenance. EMDIAG consists of REPVFY, OMSVFY and AGTVFY Tools. Many of the
recommendations in this whitepaper will utilize the EMDIAG tools. See EMDIAG Troubleshooting Kits Master Index
[421053.1] for more information.

4 | OPERATIONAL CONSIDERATIONS AND TROUBLESHOOTING FOR ORACLE ENTERPRISE MANAGER 13C
REPVFY
The EMDIAG REPVFY 13c kit is designed to collect data from a Cloud Control Management Repository 13c to
assist in the diagnosis and correction of Cloud Control issues. For detailed installation instructions see EMDIAG
REPVFY Kit for Cloud Control 12c,13c - Download, Install/De-Install and Upgrade [ID 1426973.1]. For details on
utilizing REPVFY see EMDIAG Repvfy 12c/13c Kit - How to Use the Repvfy 13c kit [ID 1427365.1].
OMSVFY
OMSVFY is installed on each OMS server and collects data on the OMS configuration and patches. There are also
several utilities available to help in searching log files, zipping the files for transfer to support, and identifying trouble
areas on the OMS. See note EMDIAG Omsvfy 12c/13c Kit - Download and Install [ID 1374450.1] for detailed
installation instructions.
AGTVFY
AGTVFY gets installed on the each Agent server. This is a good component to become familiar with and use when
troubleshooting agent issues. For detailed install instructions see EMDIAG Agtvfy 12c/13c Kit - Download and
Install [ID 1374441.1].
Best Practices Configuration
Enterprise Manager 13c Cloud Control is an enterprise application that manages and monitors the infrastructure in
your environment as well as the applications running on top of that infrastructure. The system itself requires some
care and feeding to ensure that it is performing properly and that the data available is timely and accurate. One of
the most common questions is who should manage EM and how much effort will it require. This all depends on
what functions you plan to leverage, how critical the targets are, and the size of the environment.
Staffing Recommendations
As EM is a very broad application on its own, the recommendation is to have at least 2 people trained and
responsible for managing EM who know the system very well and maintain its health. Depending on the size and
scope of your environment, this may be 2-4 people who spend 25-50% of their time on EM. This ensures backup
coverage during vacation or extended illnesses. Someone with knowledge of Oracle Database and WebLogic
Server is extremely helpful as these are the main backbones of EM; however EM Administrators also need to
understand your entire enterprise. Integration into authentication and ticketing systems, placement in
network/firewall rules, configuration of the Software Load Balancer, and segregation between support groups and
organizations are all areas where the EM Administrator will be required to interface during initial setup and continued
operations.
Administrator Responsibilities
Implementing EM and managing an enterprise will require involvement from various teams. Companies divide the
roles and responsibilities differently based on the size of the implementations and the different data center
responsibilities. There needs to be a well defined, agreed upon list of tasks that identifies the individual or team
responsible for particular tasks. This is often referred to as a RACI diagram (Responsible, Accountable, Consulted
and Informed). The EM Administrator should own architecture and installation, overall agent deployment
procedures, agent patching procedures, OMS patching and user administration. It is also important for the EM
Administrator to know the baseline functionality and performance of their EM environment to more easily identify
existing or pending problems. Knowing the baseline environment consists of two items. The first item is to
understand and document the architecture of the environment (i.e. topology, key components). This will help in
understanding the impact of any architecture change. The second item is for the EM Administrator to understand

5 | OPERATIONAL CONSIDERATIONS AND TROUBLESHOOTING FOR ORACLE ENTERPRISE MANAGER 13C
the normal baseline operations of the environment. This consists of understanding the environment and the
expected load (i.e. how much data to expect in a day). Things like deploying agents, discovering targets, solving
agent issues and solving target availability can all be delegated to target owners. The RACI diagram below is an
example of defining this responsibility and is a starting point for your organization to define the roles and
responsibilities in your environment even if multiple roles are performed by the same person.
TABLE 1: ENTERPRISE MANAGER 13C RACI
TASK RESPONSIBLE ACCOUNTABLE CONSULTED INFORMED
Define Monitoring
Requirements
Target Owners,
Infrastructure Teams, EM
Admin
EM Admin
Installation Planning and
Architecture
Infrastructure Teams, EM
Admin EM Admin
Target Owners,
Infrastructure Teams
Installation and
Configuration of EM EM Admin EM Admin
Defining Agent
Deployment and Patching
Procedures and Processes
EM Admin EM Admin Target Owners
Security and User
Administration
EM Admin/Security
Admin EM Admin
Admin Group Creation EM Admin EM Admin Target Owners
Agent Deployment (can be
performed by target
owners)
Target Owners Target Owners EM Admin
Agent Patching (can be
performed by target
owners)
Target Owners Target Owners EM Admin
Target Configuration and
Availability Target Owners Target Owners
Agent Troubleshooting Target Owners, EM
Admin EM Admin
Target Troubleshooting Target Owners Target Owners EM Admin
Weekly/Monthly/Quarterely
Maintenance EM Admin EM Admin Target Owners
OMS Patching EM Admin EM Admin Target Owners
Maximum Availability
Since EM plays an important role in managing and monitoring the enterprise environment, it is important to ensure
that the environment is configured for maximum availability. This includes regular backups as well as architecting
the environment for disaster recovery. The Oracle Enterprise Manager Cloud Control Advanced Installation and
Configuration Guide provides details on backing up the Enterprise Manager environment. As part of an overall
backup strategy, it is important to take regular backups as well as backups before any patching or plug-in update is
applied for the following components:
Oracle Management Service Backups
Backups for the OMS should consist of the following:

6 | OPERATIONAL CONSIDERATIONS AND TROUBLESHOOTING FOR ORACLE ENTERPRISE MANAGER 13C
» Software Homes: The EM 13c install now only consists of a single OMS home for all of the components installed
on the OMS server. This includes the Fusion Middleware home, the OMS software home, the Web Tier oracle
home and the Plug-in Homes. A filesystem level backup of the software home and the Oracle inventory files
should be taken whenever patches/patchsets are applied or new plug-ins deployed.
» Instance Homes/Administration Server/OMS Configuration: The configuration for the OMS can be backed up by
issuing the emctl exportconfig oms command on each of the oms servers. This command saves a point in time
snapshot of the configuration for the Instance Homes as well as the Administration Server so that if necessary, it
can be restored.
Refer to the Oracle Enterprise Manager Cloud Control Advanced Installation and Configuration Guide for further
details on backing up the OMS server(s).
Management Repository Backups
The backup strategies for the repository are the same as for the Oracle Database. This includes having the
database in archivelog mode and performing regular hot backups with RMAN which consists of a full backup and
then incremental backups. EM provides a simple way to setup database backups via the option for Oracle
suggested backups. This backup strategy will create a full database backup followed by an incremental backup on
each subsequent run. The database backup will be recovered using these incremental backups thus creating a
backup that is equivalent (for database recovery) to an image copy of the data files at the time of the last
incremental level 1 backup. For further detail on the setup of Oracle Recommended Backups, refer to the Oracle
Database 2 Day DBA document. The steps for configuring the backup in EM are documented below.
1. Click on Targets / Databases. Select the EM Repository database.
Figure 1: Databases
2. From the database home page, click on Availability / Backup & Recovery / Schedule Backups…
3. On the Schedule Backup page, select the proper login credentials for the database owner under the Host
Credentials section and then click on Schedule Oracle-Suggested Backup

7 | OPERATIONAL CONSIDERATIONS AND TROUBLESHOOTING FOR ORACLE ENTERPRISE MANAGER 13C
Figure 2: Schedule Backup
4. Select the destination media for the backup and click Next
Figure 3: Backup Destination
5. Set the backup settings for the backup based on the destination chosen above (a disk backup was
selected for this example). Click Next
Figure 4: Backup Setup

8 | OPERATIONAL CONSIDERATIONS AND TROUBLESHOOTING FOR ORACLE ENTERPRISE MANAGER 13C
6. Select the day and time to start the backups. Click Next.
Figure 5: Backup Schedule
7. Review the backup details and if the information is correct, click Submit Job
Figure 6: Backup Review
Software Library Backups
The Software library is a central location for storing software patches, application software images and other scripts.
This library is required by specific EM features to function properly and therefore it is important to backup the
software library storage location. The frequency of these backups may vary depending on how often content is
added/removed but a good recommendation is to take a backup at the same time as the repository backup to
maintain consistency. Not doing this may require running software library verifications after a recovery.
BI Publisher Backups
If the EM environment is setup with multiple OMSs, the BI Publisher requires a shared storage for storing the
components that are shared between all BI Publisher instances. This should also be backed up at a at the same
time as the repository backup.
Management Agent Backups

9 | OPERATIONAL CONSIDERATIONS AND TROUBLESHOOTING FOR ORACLE ENTERPRISE MANAGER 13C
For the management agent, a reference agent should be maintained and kept current with patches so that if a
management agent is lost, it can be reinstalled via cloning of this reference agent.
Increased High Availability and Disaster Recovery Options
As the importance of Enterprise Manager grows, so do the availability requirements. For some customers, it is just
not enough to have a single OMS monitoring their entire database or WebLogic infrastructure. There are additional
HA configurations available to meet specific business requirements. The table below details the different degrees of
high availability that can be implemented for Oracle Enterprise Manager. Additional information on High Availability
configurations can be found in the Enterprise Manager Cloud Control Advanced Installation and Configuration
Guide.
TABLE 2: HIGH AVAILABILITY CONFIGURATIONS
LEVEL DESCRIPTION MINIMUM NODES RECOMMENDED
NODES
LOAD BALANCER
REQUIREMENTS
Level 1 OMS and Repository database each
reside on their own host, no failover. 1 2 None
Level 2
OMS installed on shared storage with
VIP based failover. Database replicated
with Data Guard.
2 4 None
Level 3 OMS in Active/Active configuration.
Database is using RAC + Data Guard. 3 5 Local load balancer
Level 4
OMS on the primary site in Active/Active
Configuration. Repository deployed
using Oracle RAC.
Duplicate hardware deployed t the
standby site.
DR for OMS. Software Library, and BI
Publisher using Storage Replication
between primary and standby sites.
Database DR using Oracle Data Guard.
Note: Level 4 is a MAA Best Practice,
achieving highest availability in the most
cost effective, simple architecture.
4 8
Required: Local load
balancer for each site.
Optional: Global load
balancer
Notifications
To properly monitor your EM environment, you need to receive notifications on events, incidents and problems that
occur on the infrastructure components. In addition to your standard notifications for Database, FMW and Host
targets Oracle recommends you set up notifications for the EM infrastructure. To receive notifications on the OMS
and Repository components that consist of your EM infrastructure, create an Incident Rule Set specifically for these
targets. The steps to do this are detailed in the section Setting Up Your Incident Management Environment of the
Administrator’s Guide. The best practice is to create a rule set for incoming Events on the OMS and Repository
target that creates an incident and sends a notification (via e-mail, ticket or SNMP traps) to the EM Administrators
for the categories listed below. The OMS and Repository target is an internal target type that will contain all of the
EM components such as the infrastructure hosts, repository database, listeners, management services, etc. For the
steps on how to create this rule set, refer to the My Oracle Support (MOS) note Oracle Enterprise Manager 13c
Configuration Best Practices [2139083.1].

10 | OPERATIONAL CONSIDERATIONS AND TROUBLESHOOTING FOR ORACLE ENTERPRISE MANAGER 13C
TABLE 3: INCIDENT RULE RECOMMENDATIONS
CATEGORY FILTERS ACTION
Metric Alert Severity in Critical, Warning E-mail/Ticket EM Administrators
Metric Alert All If event open > 7 days, clear the event
Metric Evaluation Error Severity in Critical, Warning E-mail/Ticket EM Administrators
Target Unreachable Target Availability (Agent, Host) E-mail/Ticket EM Administrators
Target Down Target Availability E-mail/Ticket EM Administrators
High Availability Severity in Critical E-mail/Ticket EM Administrators
Target Error Target Availability E-mail/Ticket EM Administrators
Out-of-Bound Notifications
Out-of-Bound Notifications for Enterprise Manager 13c can be configured to send an email or trigger a script when
certain fatal conditions occur. This then allows the EM administrator to receive notifications when there is a failure in
an EM component. The notification is triggered in the following scenarios:
» single OMS environment, if the OMS is down, but the Agent is up
» multi-OMS environment, if all OMSs are down, but the Agent is up
» if Repository database is unavailable (down, archiver hung, listener down, etc)
» if the notification job is broken or has an invalid schedule
Configure Out-of-Bound Notifications by following the steps in note How To Setup Out Of Bound Email Notification
In 12c [1472854.1]. Even though this note was created for EM 12c, it is still applicable and works in EM 13c.
Patching
As with any application, regular patch maintenance is key. The recommended patches for Enterprise Manager,
Agent and various Plug-ins can be found and downloaded from My Oracle Support. Oracle recommends setting up
a planned maintenance window for the EM environment. This window would provide time for regular patching and
activities that may require downtime (i.e. plug-in updates). A good recommendation is to schedule this planned
maintenance on a quarterly basis and to check for the latest recommended patches at this same time (may vary
according to the requirements of the individual companies). Note that the patching for the different components (i.e.
agent) may be performed by different people or groups within your organization based on the roles and
responsibilities as mentioned in Table 1: Enterprise Manager 13c RACI above. For additional information on
guidelines for patching an Enterprise Manager environment, refer to Oracle Enterprise Manager Software Planned
Maintenance. Also, a MOS note is published after each quarterly patch release providing a list of recommended
patches for EM along with the installation steps. This MOS note is Applying Enterprise Manager Recommended
Patches [ID 1664074.1].
Agent Patching
Keeping the Enterprise Manager Agent patched is a critical component to efficient and accurate monitoring as the
collection scripts reside in the agent. Enterprise Manager offers a couple different methods that can be used for
patching agents and the agent plugin components.
Manual Agent Patching

11 | OPERATIONAL CONSIDERATIONS AND TROUBLESHOOTING FOR ORACLE ENTERPRISE MANAGER 13C
Manual patching is the process of downloading the patch to the server where the agent is running and following the
instructions provided in the README file for manually apply the patch to the AGENT HOME. This is not the
recommended method for maintaining the patch levels on all of the agents as it would be very time-consuming,
however this option is available if required.
Enterprise Manager Agent Patch Plans
By using the automated patching feature in Enterprise Manager it is possible to create a patch plan from tested and
approved agent patches, and deploy to many agents at one time or in batches. Recommended patches can be
found by clicking Enterprise / Provisioning & Patching / Patches & Updates and then selecting the
Recommended Patch Advisor. Select Enterprise Manager Base Platform – Agent for the product, and the
correct Release and Platform. The Agent uses its internal credentials to Patch itself. Privileged credentials will need
to be provided for any patch/upgrade requiring execution of the root.sh script if wanting EM to execute if as part of
the patch apply. The account used to perform patching requires the Manage Target Patch and Patch Plan
privileges. Full step by step instructions can be found in the Oracle Enterprise Manager Cloud Control
Administrator’s Guide.
Agent Gold Images
Starting with EM 13c, a new feature called Management Agent Gold Images has been introduced. This feature
allows administrators to maintain a customized image of an agent including the agent binaries, plug-ins and patches.
The Management Agent gold image is created from an existing management agent that has the desired
configuration, referred to as the source agent.
The following capabilities are provided when using a Management Agent gold image:
» Provisioning a new management agent that will match the configuration of this gold image
» Updating any existing management agent including the tasks below:
» Upgrade agent (upgrading the agent software)
» Deploy new plug-ins to an agent
» Upgrading the existing plug-ins that are currently deployed to a specific agent
» Deploy patches on an agent
» Deploy patches on the plug-ins that are currently deployed to a specific agent
» Check the compliance level across all agents to determine the percentage matching the gold image
» Track the Management Agent gold image activities (i.e. gold image jobs submitted and the associated activity of
those jobs)
To create and manage the Management Agent gold images in EM, click on Setup / Manage Cloud Control / Gold
Agent Images. This will open the Gold Agent Images console. From here, all images can be created and/or
managed by clicking on “Manage All Images” as seen in the example image below:

12 | OPERATIONAL CONSIDERATIONS AND TROUBLESHOOTING FOR ORACLE ENTERPRISE MANAGER 13C
Figure 9: Gold Agent Images
For more details on creating and managing Agent Gold Images, refer to the Enterprise Manager Cloud Control
Advanced Installation and Configuration Guide.
Custom Plug-in Updates
Custom Plug-in updates provide the capability for the creation of a custom ‘package’ for an Agent-side plug-in that
includes any required patches and updates. This is accomplished by applying all of the required patches to a
specific plug-in and then creating a custom plug-in update. This custom plug-in update becomes a gold image of
the plug-in with all of the required patches applied. With this feature, each deployment of that plug-in to an Agent
will deploy the updated version of that plug-in preventing the need to patch a newly deployed plug-in. To create an
updated/revised Agent-side plug-in, follow these steps (for more details on this process, refer to the Oracle
Enterprise Manager Cloud Control Administrator’s Guide):
1. Update and patch the plug-in on one agent with all of the required changes
2. Run this EMCLI command to create the custom plug-in version based on this modified agent:
$ emcli create_custom_plugin_update \
-agent_name=”<patched agent name>” \
-plugin_id=”<internal ID of the plugin>”
Note: To overwrite an existing custom plug-in, use the overwrite option as seen below:
$ emcli create_custom_plugin_update \
-agent_name=”<patched agent name>” \
-plugin_id=”<internal ID of the plugin>” \
-overwrite

13 | OPERATIONAL CONSIDERATIONS AND TROUBLESHOOTING FOR ORACLE ENTERPRISE MANAGER 13C
3. To get the list of plug-ins and their ID’s for an Agent, use this EMCLI command:
$ emcli list_plugins_on_agent –agent_names=”<patched agent name>”
To get a list of all custom plug-in updates created, use this EMCLI command:
$emcli list_custom_plugin_udpates
Once this custom plug-in is created, any push of that plug-in (with the same version) to the Agent will result in the
custom updated plug-in being pushed. You can tell if a custom plug-in exists for a specific plug-in from the Plug-ins
home page. (Setup / Extensibility / Plug-ins) If a custom plug-in has been created, a picture of a wrench and a
plug will be displayed next to that version number as seen in the image below.
Figure 8: Custom Plug-in
Repository Patching
The recommended Database patches can be found on My Oracle Support /Patches & Updates by selecting the
Recommended Patch Advisor and selecting Oracle Database for the product and the appropriate Release and
Platform.
OMS Patching
For the OMS, patches must be manually applied with OMSPatcher. OMSPatcher is a utility that helps automate
OMS patching by creating custom patching instructions based on the environment (single OMS or multi-OMS) and
then automatically applying the patch. This utility functions much like the opatchauto command in EM 12c.
OMSPatcher will require the Admin server URL as well as the WebLogic Administration Server username and
password. Some patches require all OMS servers to be down during the application of any post-patch scripts. In
multi-OMS environments, it is possible to shorten the patching cycle by following the procedure below:
1. Shut down the 1st OMS
2. Use OMSPatcher to apply the patch. This will generate scripts that will be used to apply the patch to each
OMS server after they have been shutdown
3. Shutdown the remaining OMSs
4. Run the post patch scripts on the 1st OMS
5. Apply any other potential one-off patches to the 1st OMS
6. Restart the 1st OMS to reduce downtime
7. Patch the remaining OMS servers and then restart them
To see a list of the patches applied to an OMS home, use the following command:
OMSPatcher lspatches
For further details on OMS patching see the Enterprise Manager Cloud Control Advanced Installation and
Configuration Guide. Oracle is now creating rolling OMS patches which provide even higher availability since all

14 | OPERATIONAL CONSIDERATIONS AND TROUBLESHOOTING FOR ORACLE ENTERPRISE MANAGER 13C
OMSs do not have to be shutdown to apply the patch but it can be applied in a rolling fashion. Not all patches are
able to be rolling patches so it is important to check the individual patch README.txt file.
Plug-ins
To make the Enterprise Manager 13c framework extensible, the plug-ins contain all the binaries needed for specific
components; therefore each plug-in has its own ORACLE_HOME on the OMS and sometimes the Agent. For
example, a database plug-in is deployed on the OMS and Agent. The scripts that collect metrics from the database
reside in the plug-in home. There will be plug-in specific patches for these components. They can be found in My
Oracle Support by looking for Enterprise Manager for Oracle Database or Enterprise Manager for Fusion Apps, etc..
These patches also require that the OMS be shutdown during patching so it is a good idea to combine them in the
same patching window as any OMS patch requiring downtime.
The individual OMS-side plug-in bundles are grouped into a System Patch each month. Therefore, this bundle patch
will contain any available patches for all plug-ins. Each month includes the patches from the previous months
unless a patch has been updated in which case the patch is replaced with the current plug-in patch. Patches that
are not required will be skipped during patch application. For more details on plug-ins and how to maintain them,
see the Enterprise Manager Cloud Control Administrator’s Guide. For more information on the EM Patch Bundles
and Patching EM see the following support note:
Enterprise Manager 13.1.0.0.0 (PS3) Master Bundle Patch List (Doc ID 2124038.1)
Figure 10: Patch Advisor
Always-On Monitoring
A common concern for customers is how to continue to monitor and receive notifications about targets when EM is
down for patching. EM 13c introduces a new utility called Always-On Monitoring (AOM). AOM provides customers
with the capability of receiving critical target status and metric alerts on a controlled list of targets. This is very useful
during EM planned downtime. AOM requires its own repository and can be setup with multiple AOM instances for
high availability. It is a good practice to setup and configure AOM and then to enable notifications ahead of planned
EM downtime. For more details on AOM, refer to the Always-On Monitoring chapter in the Enterprise Manger Cloud
Control Administrator’s Guide.
Audit Log Data
Certain security operations should be audited to ensure compliance with the Sarbanes-Oxley Act of 2002 (SAS 70).
In the EM environment, there is auditing for both the EM application and repository database.
EM Auditing
Enterprise Manager offers over 150 options for auditing that can be configured using EMCLI but by default, it audits
a few basic and infrastructure operations and this auditing cannot be turned off. The audit data is stored in the

15 | OPERATIONAL CONSIDERATIONS AND TROUBLESHOOTING FOR ORACLE ENTERPRISE MANAGER 13C
repository and the volume of this data can impact the performance of the system so it is important to externalize or
archive the data at regular intervals. An API called EM_AUDIT_EXTERNALIZATION is provided to externalize the
data. The data is stored in XML format and the files are named <file-prefix>NNNNN.xml where <file-prefix> is a
configurable value and NNNNN is a number. The audit externalization service is enabled/configured using the
EMCLI update_audit_settings command and the externalization of the audit data is performed by a repository job
called EM Audit Externalization Service. The status of this job can be seen in Cloud Control by clicking on Setup /
Manage Cloud Control / Repository.
To enable and configure the externalization of the audit data, follow the commands below:
1. Connect to the database as sysdba and create an external directory
SQL> CONNECT / AS sysdba;
SQL> CREATE DIRECTORY EM_AUDIT AS '/u01/app/oracle/em_audit'; GRANT
SQL> READ,WRITE ON DIRECTORY EM_AUDIT to SYSMAN;
2. Execute the command below to configure the externalization: NOTE: be sure the select the specific
operations that should be audited. Setting this to the value of “ALL” will mostly likely create more audit
files than necessary.
$ emcli update_audit_settings
-audit_switch="ENABLE"
-operations_to_enable="ALL"
-externalization_switch="ENABLE "
-directory="EM_AUDIT”
-file_prefix="EMAudit"
-data_retention_period="30"
3. The following command will show the settings:
$ emcli show_audit_settings;
The above commands will enable the externalization of the audit data using a name such as EMAudit00001.xml and
will save the files in the directory /u01/app/oracle/em_audit. Once this is done, archiving of the mandatory audit
records from the operating system can be done via Oracle Audit Vault or tape/disk backups.
For more information, refer to the Enterprise Manager Cloud Control Security Guide.
Repository Database Auditing
Oracle always audits certain operations regardless of the database audit settings. This is referred to as Mandatory
Auditing and the audit records are written to the operating system in the destination specified by the initialization
parameter AUDIT_FILE_DEST.
Mandatory auditing includes these operations:
» SYSDBA and SYSOPER logins
» CREATE/ALTER/DROP AUDIT POLICY
» AUDIT/NOAUDIT

16 | OPERATIONAL CONSIDERATIONS AND TROUBLESHOOTING FOR ORACLE ENTERPRISE MANAGER 13C
» EXECUTE of the DBMS_FGA PL/SQL package
» EXECUTE of the DBMS_AUDIT_MGMT PL/SQL package
» ALTER TABLE attempts on the AUDSYS audit trail table
» Top level statements by the administrative users SYS, SYSDBA, SYSOPER, SYSASM, SYSBACKUP, SYSDG,
and SYSKM, until the database opens. When the database opens, Oracle Database audits these users using the
audit configurations in the system.
» All configuration changes that are made to Oracle Database Vault
The agent that resides on each OMS server logs into the repository every few minutes for self monitoring and
generates an audit record for each login. Therefore, it is very important that the audit records are regularly archived
and purged. The steps for doing this may vary according to a company’s security requirements but a sample setup
is provided below.
Archive the audit data
Archiving of the mandatory audit records from the operating system can be done via Oracle Audit Vault or tape/disk
backups. For further details on using Oracle Audit Vault, refer to Oracle Audit Vault and Database Firewall
Administrator's Guide.
Purge the records
This can be done manually or via a purge job that performs the purge at a specified time interval. The
recommendation is to setup a job that will purge the records at a specified time interval and is the approach in the
example shown below. Note that purging a large audit trail can take time to complete so it is wise to schedule the
job so that it runs during a time when the database is not too busy. For further details on the process and an
explanation for each parameter used in the example, refer to the Database Security Guide.
1. Initialize the audit trail cleanup operation.
SQL> begin
dbms_audit_mgmt.init_cleanup(
AUDIT_TRAIL_TYPE => DBMS_AUDIT_MGMT.AUDIT_TRAIL_ALL,
DEFAULT_CLEANUP_INTERVAL => 12);
end;
/
2. Setup an archive timestamp for the audit records. The RAC_INSTANCE_NUMBER refers to the instance
number when using a RAC database. This must be set for each instance since the mandatory audit records
are stored on the operating system and therefore for each instance. If this is a standalone database, use the
number 0.
SQL> begin
DBMS_AUDIT_MGMT.SET_LAST_ARCHIVE_TIMESTAMP(
AUDIT_TRAIL_TYPE => DBMS_AUDIT_MGMT.AUDIT_TRAIL_OS,
LAST_ARCHIVE_TIME => TO_DATE('2013-07-29 09:00:00','YYYY-MM-DD HH:MI:SS'),
RAC_INSTANCE_NUMBER => 1);
END;
/
3. Create and schedule the purge job
SQL> BEGIN
DBMS_AUDIT_MGMT.CREATE_PURGE_JOB(
AUDIT_TRAIL_TYPE => DBMS_AUDIT_MGMT.AUDIT_TRAIL_ALL,

17 | OPERATIONAL CONSIDERATIONS AND TROUBLESHOOTING FOR ORACLE ENTERPRISE MANAGER 13C
AUDIT_TRAIL_PURGE_INTERVAL => 12,
AUDIT_TRAIL_PURGE_NAME => 'Standard_Audit_Trail_Cleanup',
USE_LAST_ARCH_TIMESTAMP => TRUE);
END;
/
Maintaining Enterprise Manager
To ensure Enterprise Manager is configured and optimized properly, implementation planning should take into
account the sizing recommendations provided in the Oracle Enterprise Manager Cloud Control Advanced
Installation and Configuration Guide. Sizing is based on a combination of the number of agents, targets and
concurrent users. After implementation, review the system sizing and usage on a regular basis to account for
system growth.
The OMS servers process incoming and outgoing tasks. The incoming tasks are telemetry data and alert
information coming in from the agents. A problem occurs if there is more data coming in than the network can
handle. This is seen via the following:
» Network statistics (bandwidth/IO throughput/collisions)
» Loader backlog
» Job backlog (only if there is a backlog and a low number of available threads)
The outgoing tasks are created when the OMS sends requests out to the agents (configuration updates and
job/tasks to perform on the managed targets) and when the OMS process sends out the notifications. To detect if
an OMS server is having a bottleneck with outgoing tasks, look for the following:
» A job backlog even though a significant number of jobs are processed (sufficient throughput)
» Notification backlog even though there is a significant ‘churn’ on getting stuff out.
An additional OMS may need to be added into an environment based on the following situations. Note that the more
incoming/outgoing stress on the system, the more likely the need for an additional OMS.
» load (number of agents and number of Admins) and whether or not that load is increasing
» backlog for incoming or outgoing tasks (as discussed above)
In addition to proper sizing and configuration, there are a few areas that should be checked on a regular basis using
the EM Cloud Control Console itself as well as EMDIAG. Both of these tools provide a good way to make sure any
issues that occur in the EM components can be identified and resolved. Below are the recommended tasks and
frequency to maintain a healthy Enterprise Manager environment. The need to review the daily tasks should lessen
as proper notifications and incidents are setup and the EM Admin has established a good baseline and
understanding of the data components.
TABLE 4: RECOMMENDED MAINTENANCE TASKS
TASK DAILY BIWEEKLY MONTHLY QUARTERLY
Review critical EM component availability X
Review events, incidents and problems for EM
related infrastructure X
Review overall health of the system including
the job system, backlog, load, notifications and
task performance
X

18 | OPERATIONAL CONSIDERATIONS AND TROUBLESHOOTING FOR ORACLE ENTERPRISE MANAGER 13C
Review agent issues for obvious problems (i.e.
large percentage of agents with an unreachable
status)
X
Review agent issues (deeper/more detailed
review of agents with consistent or continual
problems)
X
Review metric trending for anything out of
bounds X
Evaluate database (performance, sizing,
fragmentation) X
Check for updates in Self Update (plug-ins,
connectors, agents, etc.) Note that there is an
out-of-obx ruleset that will provide notification
for the availability of new updates
X
Check for recommended patches X
EM Encryption
Due to changes driven by the need to use the newer more secure algorithms the new version of JDK no longer
supports X.509 certificates containing MD5-based digital signature algorithm. As of Enterprise Manager 13.2, this
new version of JDK is used which means that the communication between the Oracle Management Service, agents
and targets will be affected if the MD5-based X.509 certificates are configured. If these certificates are used, they
must be remediated prior to upgrading to EM 13.2.
Availability
When confirming the health of the EM 13c environment the first place to start is to verify the status of the key
components that make up this environment. Enterprise Manager is dependent upon many components for a
complete working system. The Repository database, OMS, Console and PBS services, and WebLogic servers all
have to be available for EM to function properly. A key component that is down could impact performance as well
as availability. The goal is to keep the infrastructure components in an available status and to resolve any critical
errors occurring in each one
Oracle Management Servers
The Management Servers page provides a more detailed status of the OMS services. In Cloud Control, click on
Setup / Manage Cloud Control / Management Servers.

19 | OPERATIONAL CONSIDERATIONS AND TROUBLESHOOTING FOR ORACLE ENTERPRISE MANAGER 13C
Figure 11: Manage Cloud Control Management Servers
The figures above show the information about the Management Servers. It includes details such as a summary of
the job executions, graphs showing loader performance and any open incidents. Verify that the Management
Servers show an Up status, including the status of the Console and Platform Background Service (PBS) for each
Management Server.
Repository Database
Verify the status of the Repository database and underlying instances in the case of a RAC database. Click on
Setup / Manage Cloud Control / Health Overview. Click on the name of the Database or Cluster Database under
the Repository Details section.
Figure 12: Manage Cloud Control Repository
In the case of a standalone database, the top section of this page will show the Up Time for the database. If
implemented with Level 3 or Level 4 High Availability, verify the status of the standby database by clicking on High
Availability located on the left side of the page.

20 | OPERATIONAL CONSIDERATIONS AND TROUBLESHOOTING FOR ORACLE ENTERPRISE MANAGER 13C
In the case of a RAC cluster database, the top section of this page will show the number of Instances for this
database and the status summary. Verify that each instance is in a “good” status. If implemented with Level 3 or
Level 4 High Availability, verify the status of the standby database by clicking on High Availability located on the
left side of the page.
EM 13c now provides more details on the Management Services and Repository target home page (Setup /
Manage Cloud Control / Repository). It includes three tabs of information called Repository, Metrics, and
Schema. Each tab includes the following data:
Repository
This page provides a quick view of some details about the repository database including the following:
» Configuration Details
» Repository Volume Trend – this graph shows the total space allocated to tablespaces in the repository database
and the total space used. Verify that the database is not running out of disk space and if so, make sure additional
space is added or the autoextend options are set for the tablespaces.
» Initialization Parameter Compliance – verify that none of the initialization parameters are listed as non-compliant.
If so, adjust the parameter to the recommended value.
» Repository Job Status – verify that none of the scheduler jobs are listed as down.
» Collection Performance – details for this graph are provided in the Task Subsystem section later in this paper.
» Metric Rollup Performance – this graph shows the number of records rolled up and the throughput per minute.
These values may increase over time as more targets are added in the environment but on a daily basis, they
should remain somewhat level. A large spike could indicate a communication problem between agents and the
OMS. If there are not a large number of agent communication problems, then the number of worker threads can
be increased by clicking on “Configure”. The default value is 1. Do not increase the number of workers above 5
without consulting Oracle Support.
Metrics
This tab provides graphs showing the rollup of key repository performance measurements. Use this data to help
identify the target types and/or metric alerts that are the highest in volume and then further analysis the cause of the
metric alerts. The information includes the following:
» Top 25 Metric Data Loading Target Types In Last 30 Days
» Top 10 Data Loading Metrics In Last 30 Days
» Metric Alerts Per Day In Last 30 Days
» Top 10 Metric Collection Errors By Target Type In Last 30 Days
Schema
The Schema tab provides data pertaining to the repository database schema. The information includes the
following:
» Tablespace Growth Rate – use this data to help maintain the proper space in the repository database
» Top 20 Tables With Unused Space In Repository
» Purge Policies – this section provides the retention time (in hours) defined for the purging of data. The retention
time can be modified for the different Policies/Groups from this page by clicking on “Modify”/
» Partition Retention - this section provides the retention time (in days) defined for the partitions in the database.
The retention period can be modified for the different partitions from this page by clicking on “Modify”/
Software Library

21 | OPERATIONAL CONSIDERATIONS AND TROUBLESHOOTING FOR ORACLE ENTERPRISE MANAGER 13C
EM now provides metrics for monitoring the software library. To view these metrics, click on Setup / Manager
Cloud Control / Repository. Click on the drop down menu for OMS and Repository. Select Monitoring / All
Metrics / Software Library Upload Locations. From here, make sure the software library is accessible and check
the available space. Make sure the below metrics are set to warn when available space is running low and to notify
in the event the software library is not accessible.
Available Space (MB) for Software Library Storage Location: Under the All Metrics, click on Software Library Upload
Storage Locations and then on Available Space (MB) for Software Library Storage Location. Click on the row for the
software library defined in your environment. This will populate the details for this metric. To set the threshold for
this metric, click on “Modify Thresholds”. Use the average value and low/high values provided on this page to help
determine the value for the thresholds.
Is Accessible: Under the All Metrics, click on Software Library Upload Storage Locations and then on Is Accessible.
Click on the row for the software library defined in your environment. This will populate the details for this metric.
This metric is configured by default to alert if the software library is not accessible so this metric should not need to
be modified.
General Availability
To confirm the overall health of the complete list of EM components from the Enterprise Manager Console navigate
to Setup / Manage Cloud Control / Health Overview where the overall status is displayed. To drill further into
each component, click on the menu bar for OMS and Repository / Members / Show All.
Check the status of the key components such as the EM services, application deployments, and WebLogic
Deployments as described above. The status should show Up. Clicking on the status icon will drill down to show
availability details. Each component represents a target in EM. If any components are down, use the information
provided on the target’s home page (i.e. errors/alerts) to assist in diagnosing and resolving the availability issue. For
additional information on High Availability configurations, see the Enterprise Manager Cloud Control Advanced
Installation and Configuration Guide.
Figure 13: OMS and Repository All Members
EM Internal Subsystems
There are several internal subsystems that work in the background to process incoming data, evaluate alerts and
severities, send notifications and perform internal housekeeping for EM. This section will review some of the critical
internal subsystems and provide guidance as to what to look for when maintaining EM performance and availability.

22 | OPERATIONAL CONSIDERATIONS AND TROUBLESHOOTING FOR ORACLE ENTERPRISE MANAGER 13C
EM Page Performance
In EM 13c, a feature has been added allowing for the capability of finding and diagnosing performance issues in the
EM pages. The performance pages are found by clicking on either Setup / Manage Cloud Control / Health
Overview or Setup / Manage Cloud Control / Repository. From either of these two pages, click on the drop
down menu for OMS and Repository. From here, select Monitoring / Page Performance. There are three tabs
on this page. Below is a quick description of each tab.
Overview
If there appears to be an issue in the performance of the EM pages, this page will assist in narrowing down a
possible cause for the slowness. This page provides detail on the following:
» Page Accesses and Sessions
» Current Page Accesses and Sessions Distribution across OMS – use this graph to determine if one OMS is doing
more work than another. This could indicate a problem with the SLB configuration or a potential problem with a
specific OMS.
» Page Processing Time (Overall statistics) – use this graph to help determine in which area most of the page
processing time is spent between the network, repository or OMS. This information can then be used to further
analysis the component with the largest processing time.
» OMS and Repository Details (Page processing time across OMS for last 24 hours)
» Page Processing Time (Overall Statistics for last 24 hours
» Repository Details
Page Level Performance
This page provides detail on the list of pages accessed in the last 24 hours. This table provides information such as
the page processing time total and broken down to the time spent processing on the OMS and processing in the
repository. You can also get details on the requests per page, SQL/PL SQL executions per page, page accesses,
etc. Clicking on a specific page will populate a graph at the bottom showing the page processing time in the
Network, Repository and OMS.
Performance Correlation
This tab shows graphs on Page Accesses and Sessions, Page Processing Time, and SQL/PL SQL executions
allowing for the ability to correlate performance trends.
EM will trigger a symptom diagnosis when the set metric threshold for overall page processing time is exceeded.
This symptom diagnosis can be triggered for the overall page processing time and for the individual page times. If
the symptom diagnosis has triggered, it can be accessed via an icon on the Overview tab in the Overall Statistics
section as shown by the graphic below.

23 | OPERATIONAL CONSIDERATIONS AND TROUBLESHOOTING FOR ORACLE ENTERPRISE MANAGER 13C
Figure 14: OMS and Repository All Members
If this icon is present, it means that the overall performance of the Enterprise Manger pages has exceeded the
threshold in the last 10 minutes. Click on the icon and review the details of the diagnosis. This diagnosis should
indicate the root cause for the overall page performance issue. It should help determine if the issue is due to the
network, OMS or repository.
DBMS Scheduler
The DBMS Scheduler is a database feature and is used to execute SQL and PL/SQL at specific times. If any of the
system jobs are running behind schedule or are down completely, they can cause significant performance problems,
stale and incorrect availability data, as well as missing critical alerts and notifications. For the repository jobs to run,
the DBMS_SCHEDULER must be enabled and db initialization parameter JOB_QUEUE_PROCESSES must be set
to a non-zero value. It is common to set JOB_QUEUE_PROCESSES to 0 during upgrades or patches, so be sure
to reevaluate this parameter often.
To view the Job status click on Setup / Manage Cloud Control / Repository. The Repository Scheduler Jobs
Status is shown in its own section on this page. This window can be set to show only those jobs with a Down status
or to show all jobs.

24 | OPERATIONAL CONSIDERATIONS AND TROUBLESHOOTING FOR ORACLE ENTERPRISE MANAGER 13C
Figure 15: Repository Jobs
In the Repository Scheduler Jobs Status section, check the following items:
1. Status - Make sure all jobs are in an “up” status. If there are errors, click on the error to get more details. A job
that is down can be restarted by clicking on the job name and clicking on the “Restart Job” button.
2. Duration – Seconds per hour for a job. If a job is consistently running at higher durations, there may be a
resource problem in the database. The overall health and performance of the database should be checked and
any issues resolved if found to make sure the database does not start to fall behind and thereby create a
permanent backlog problem. If the duration time increases and runs consistently high, this is a problem and it
may mean a need to increase resources for the repository server.
3. Next Scheduled Run - If the next scheduled time is not correct or empty, the database has stopped scheduling
the job. The job that is not running can be resubmitted by selecting the job and clicking on the “Restart Job”
button at the top right of that window. It also provides an edit option for high cost performance jobs to provide
the ability to reschedule the next runtime. Only change the frequency of runtime under guidance of Oracle.
4. For jobs deemed as high cost jobs that require more resources and can impact repository performance, EM
allows the administrator to modify the schedule as to when this job is executed. For these jobs, a pencil icon
will be displayed under the Edit column. To modify the next run time, click on the pencil icon.
A few of the more critical system jobs are listed below with a description of the tasks that they control:
TABLE 5: KEY SCHEDULER JOBS
JOB NAME SCHEDULER JOB NAME TASK
Agent Ping EM_PING_MARK_NODE_STATUS
Keeps track of the health of the host targets in EM. A
nonzero number means there are machines that are
suspected to be down. As long as this number is low
relative to the total number of machines in EM
(considering that some may be in blackout or offline),
there is not a major health issue for EM. There is a
potential problem if the processing time is showing 30-
40% or higher and should be diagnosed further.
EM Daily Maintenance EM_DAILY_MAINTENANCE
This job performs the daily repository maintenance
tasks such as partition maintenance, stats updates,
etc. If this job is not running, you will eventually stop
receiving information into the repository.
Job Step Scheduler EM_JOBS_STEP_SCHED This is the job that puts the work into the queues that
are ready to be dispatched to the agents

25 | OPERATIONAL CONSIDERATIONS AND TROUBLESHOOTING FOR ORACLE ENTERPRISE MANAGER 13C
Repository Metrics
<number>
MGMT_COLLECTION.Collection
Subsystem
This job shows the amount of work done for the
repository metrics. This metric will have a number
associated with it (i.e. Repository Metrics 71) and
represent the short and long task workers. The short
task workers handle tasks that should run in a minute
or less and the long task workers handle the longer
tasks. The best thing to look for here is that the
duration time for all Repository Metric jobs are fairly
close to each other.
Rollup EM_ROLLUP_SCHED_JOB
This job indicates the amount of data involved in the
rollup job. This number may increase over time as
more targets are added to the system but on a daily
basis should remain about the same. Large spikes
could indicate that agents are not communicating
properly to the OMS.
Database Advanced Queuing (AQ)
Both the OMS and the repository rely heavily on Advanced Queues. This then implies that the Advanced Queues
have to be ‘up’ and healthy. To confirm the status of the Advanced Queues in EM, do the following:
5. Click on Setup / Manage Cloud Control / Health Overview
6. In the drop down list next to “OMS and Repository” select Monitoring/All Metrics
7. Look at the Metric for Management Services AQ Status as seen in the figure below.
Figure 16: Advanced Queuing Metrics
The current severity status of the underlying components can be checked by clicking on the Dequeue Status or
Enqueue Status for a particular Management Services AQ as seen in the figure below.

26 | OPERATIONAL CONSIDERATIONS AND TROUBLESHOOTING FOR ORACLE ENTERPRISE MANAGER 13C
Figure 17: Advanced Queuing Status
If system performance deviates from previously experienced levels, it is possible that the AQ have become
fragmented. Refer to the MOS note on AQ performance tuning for further details: Performance Tuning Advanced
Queuing Databases and Applications [102926.1].
Loader Subsystem
All the data collected by agents has to be loaded to the repository as the data is not stored on the OMS server. The
efficiency of this process can greatly impact the performance and health of your system overall. When an OMS is
overloaded and not able to process the files sent by the agent, then the OMS will send what is called a Backoff
Request to notify the agent about its condition. A graph showing the Backoff Requests can be found by doing the
following:
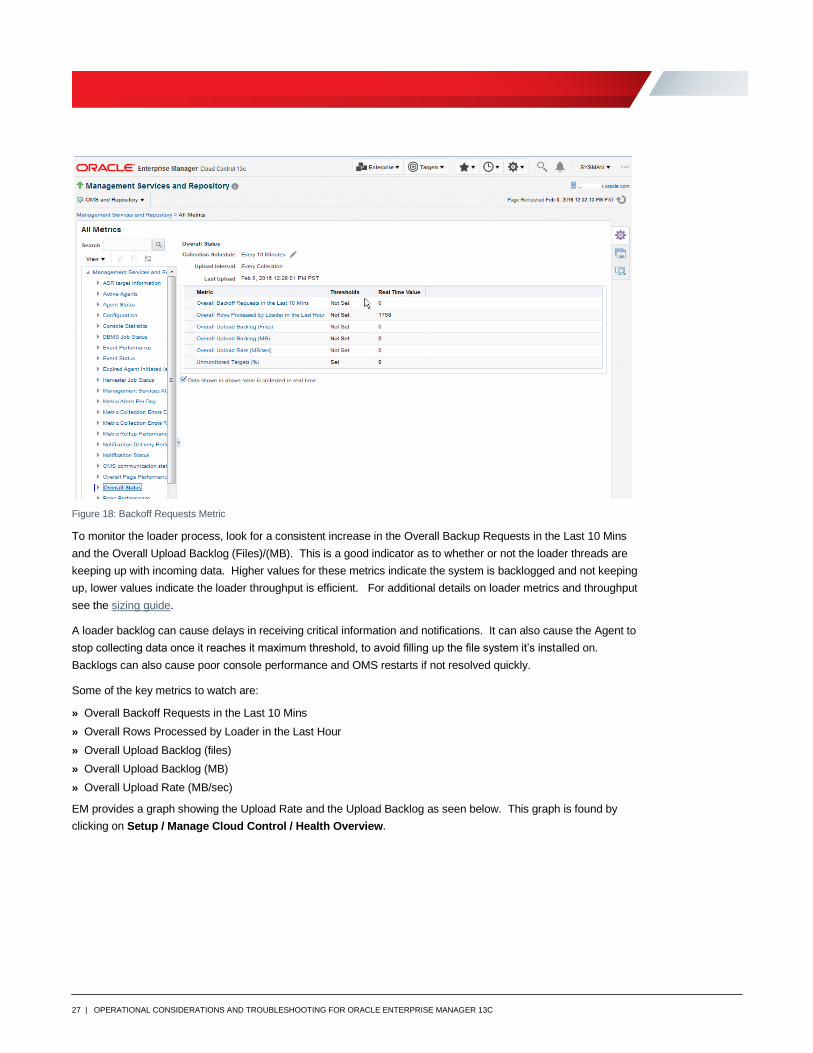
1. Click on Setup / Manage Cloud Control / Health Overview
2. In the drop down list next to “OMS and Repository” select Monitoring/All Metrics
3. Look at the Metric for Overall Status as seen in the figure below.
27 | OPERATIONAL CONSIDERATIONS AND TROUBLESHOOTING FOR ORACLE ENTERPRISE MANAGER 13C
Figure 18: Backoff Requests Metric
To monitor the loader process, look for a consistent increase in the Overall Backup Requests in the Last 10 Mins
and the Overall Upload Backlog (Files)/(MB). This is a good indicator as to whether or not the loader threads are
keeping up with incoming data. Higher values for these metrics indicate the system is backlogged and not keeping
up, lower values indicate the loader throughput is efficient. For additional details on loader metrics and throughput
see the sizing guide.
A loader backlog can cause delays in receiving critical information and notifications. It can also cause the Agent to
stop collecting data once it reaches it maximum threshold, to avoid filling up the file system it’s installed on.
Backlogs can also cause poor console performance and OMS restarts if not resolved quickly.
Some of the key metrics to watch are:
» Overall Backoff Requests in the Last 10 Mins
» Overall Rows Processed by Loader in the Last Hour
» Overall Upload Backlog (files)
» Overall Upload Backlog (MB)
» Overall Upload Rate (MB/sec)
EM provides a graph showing the Upload Rate and the Upload Backlog as seen below. This graph is found by
clicking on Setup / Manage Cloud Control / Health Overview.

28 | OPERATIONAL CONSIDERATIONS AND TROUBLESHOOTING FOR ORACLE ENTERPRISE MANAGER 13C
Figure 19: Upload Graph
Loader report
If an OMS is busy processing the uploaded XML files, it may send a backoff request to an agent, asking the agent to
backoff sending the XML files for a specified period of time. EM provides a graph showing the overall backoff
requests for a 24 hour period. A sample of this graph is shown below and can be found by clicking on Setup /
Manage Cloud Control / Health Overview.
Figure 20: Backoff Requests Graph
EM also provides an out-of-the-box report showing loader statistics including the configured loader resource
allocation, loader performance and the agent count broken down by agent priority level. The available values are
None, Mission Critical, Production, Staging, Test, and Development. This report is found under Enterprise /
Reports / BI Publisher Enterprise Reports / Enterprise Manager Health / Loader Statistics. If the Loader
Performance (Last 3 hour) chart shows a high number of backoff requests and there has not been a recent
downtime, it is an indication that the OMS cannot keep up with the load from the agent. This report will also provide
the priority level of the agents that can be used by the EMDIAG loader_health report as mentioned below.
EMDIAG also provides a report for the health of the loader subsystem. By using repvfy dump loader_health you
can generate a report of loader health and statistics. The loader_health report will break down the backoff requests
based on agent priority level (the lifecycle stages of the agent target). It is important to watch for backoff requests

29 | OPERATIONAL CONSIDERATIONS AND TROUBLESHOOTING FOR ORACLE ENTERPRISE MANAGER 13C
for mission critical and production agents. If there are issues with these agents, contact Oracle Support for help in
diagnosing the issue.
Notification Subsystem
The notification system controls all e-mail, ticket connectors and custom notification methods. For each event, the
notification job checks to see if there’s a required action and submits the task for processing. A backlog in
notifications can cause a delay in alerts being sent, or missing an alert all together.
To check the health of the notification subsystem, in the Console click on Setup / Manage Cloud Control / Health
Overview. Check the Notification Performance section for a notification backlog. A steady increase needs to be
evaluated further using the guidelines below.
Figure 21: Notification Performance Graph
Select OMS and Repository / Monitoring / All Metrics. From here, validate Notification Status metric is Up.
Figure 22: Notification Status

30 | OPERATIONAL CONSIDERATIONS AND TROUBLESHOOTING FOR ORACLE ENTERPRISE MANAGER 13C
To determine if a specific notification queue is having a problem, select Pending Notifications Count metric within
Notification Delivery Performance as seen below.
Figure 23: Pending Notification Count
There are 4 performance metrics for Notification delivery. By default, there are no Warning/Critical thresholds.
Once you have your system running, evaluate the trend in these metrics and set a Warning/Critical threshold based
on this baseline. The metrics below can be found by selecting Setup / Manage Cloud Control / Health Overview.
Under the drop down list next to the OMS and Repository target, select Monitoring / All Metrics. From here, click
on Notification Delivery Performance and review the following detail.
Average Notification Time (seconds) / Notification Processing Time (% of Last Hour) – This shows the
average time for notification delivery and the total amount of processing time for notification delivery. If the average
delivery time and notification processing time are both steadily increasing, you have a performance or capacity
problem which will create a risk of not receiving notifications in a timely manner. If the system is not experiencing a
general performance problem, examine the notification queue detail to look for an issue with a specific queue. If a
specific issue is not found, contact Oracle Support.
Notifications Processed (Last Hour) - The total number of notifications delivered by the Management Service over
the previous 10 minutes. The metric is collected every 10 mins and no alerts will be generated. If the number of
notifications processed is continually increasing over several days, consider adding another Management Service.
Pending Notifications Count – This shows the number of notifications waiting to be delivered. If this number is
continually increasing there is a notification backlog. Look at the view to determine which queue has an issue and
use this to further diagnose the issue.
In addition, you can use the repvfy dump notif_health command to generate a detailed report to identify
Notification statistics and backlogs.
Task Subsystem
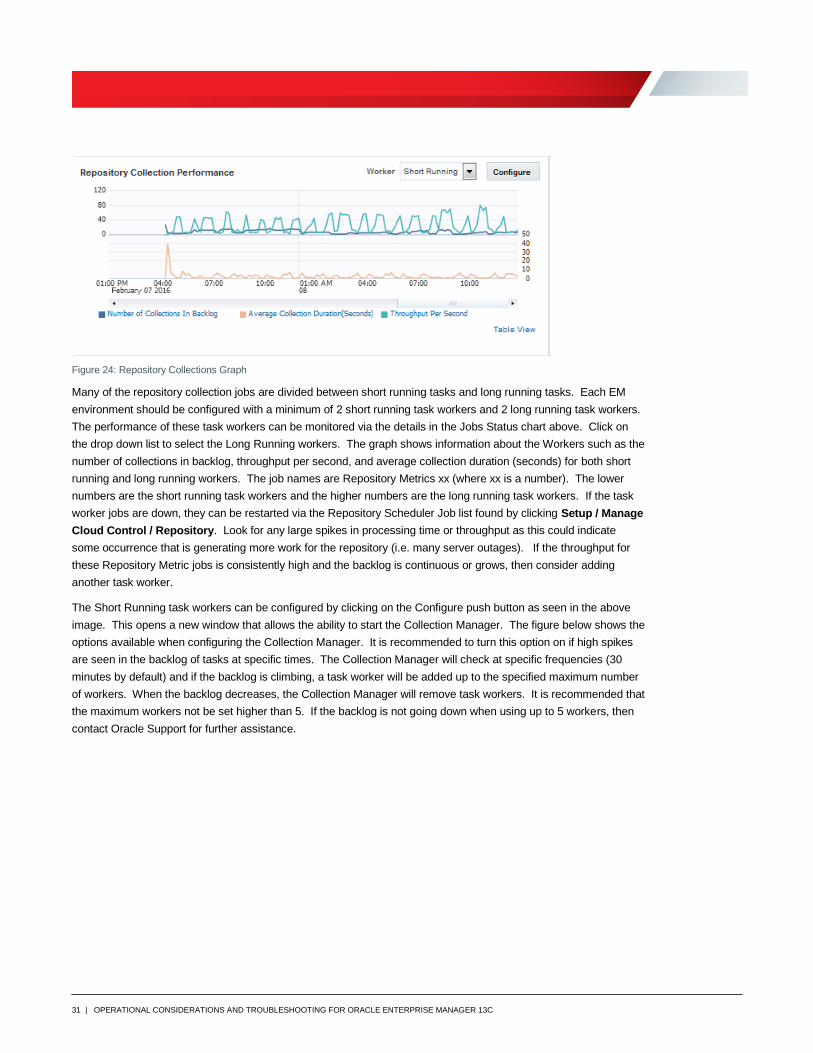
EM provides a chart to display the backlog performance of the repository collections as seen in the image below.
This chart can be found by clicking on Setup / Manage Cloud Control / Repository. A steady increase in backlog
indicates a problem that needs to be evaluated.
31 | OPERATIONAL CONSIDERATIONS AND TROUBLESHOOTING FOR ORACLE ENTERPRISE MANAGER 13C
Figure 24: Repository Collections Graph
Many of the repository collection jobs are divided between short running tasks and long running tasks. Each EM
environment should be configured with a minimum of 2 short running task workers and 2 long running task workers.
The performance of these task workers can be monitored via the details in the Jobs Status chart above. Click on
the drop down list to select the Long Running workers. The graph shows information about the Workers such as the
number of collections in backlog, throughput per second, and average collection duration (seconds) for both short
running and long running workers. The job names are Repository Metrics xx (where xx is a number). The lower
numbers are the short running task workers and the higher numbers are the long running task workers. If the task
worker jobs are down, they can be restarted via the Repository Scheduler Job list found by clicking Setup / Manage
Cloud Control / Repository. Look for any large spikes in processing time or throughput as this could indicate
some occurrence that is generating more work for the repository (i.e. many server outages). If the throughput for
these Repository Metric jobs is consistently high and the backlog is continuous or grows, then consider adding
another task worker.
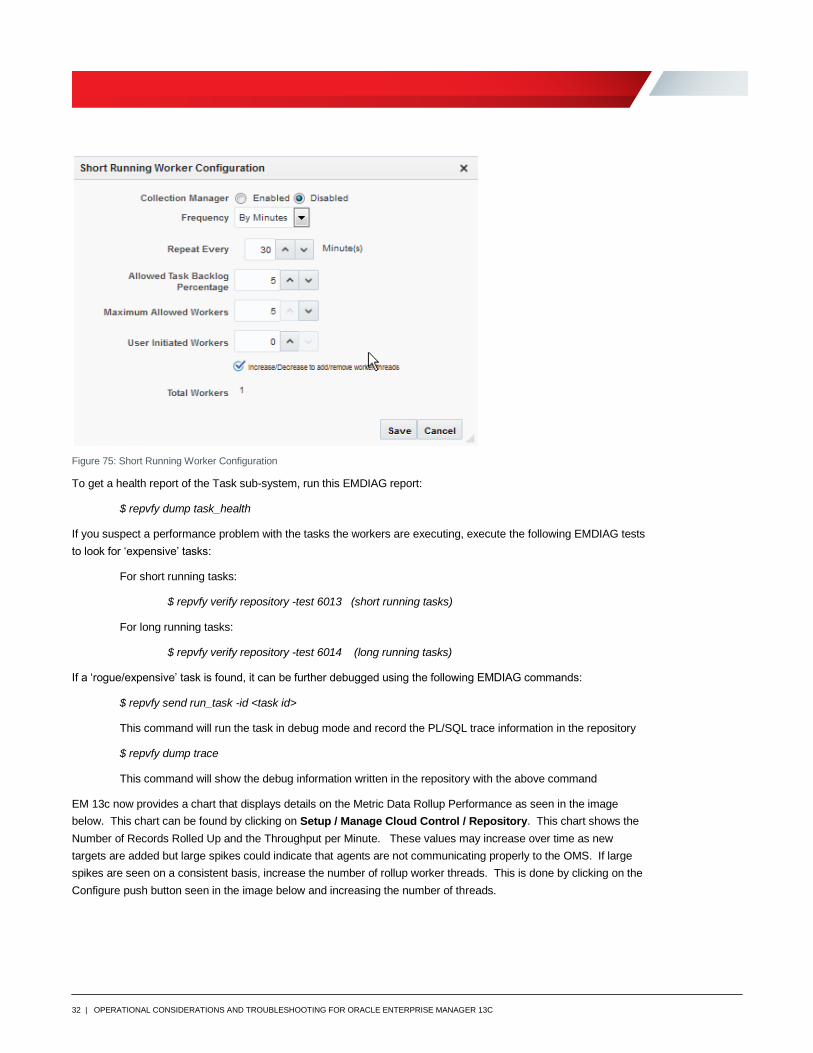
The Short Running task workers can be configured by clicking on the Configure push button as seen in the above
image. This opens a new window that allows the ability to start the Collection Manager. The figure below shows the
options available when configuring the Collection Manager. It is recommended to turn this option on if high spikes
are seen in the backlog of tasks at specific times. The Collection Manager will check at specific frequencies (30
minutes by default) and if the backlog is climbing, a task worker will be added up to the specified maximum number
of workers. When the backlog decreases, the Collection Manager will remove task workers. It is recommended that
the maximum workers not be set higher than 5. If the backlog is not going down when using up to 5 workers, then
contact Oracle Support for further assistance.
32 | OPERATIONAL CONSIDERATIONS AND TROUBLESHOOTING FOR ORACLE ENTERPRISE MANAGER 13C
Figure 75: Short Running Worker Configuration
To get a health report of the Task sub-system, run this EMDIAG report:
$ repvfy dump task_health
If you suspect a performance problem with the tasks the workers are executing, execute the following EMDIAG tests
to look for ‘expensive’ tasks:
For short running tasks:
$ repvfy verify repository -test 6013 (short running tasks)
For long running tasks:
$ repvfy verify repository -test 6014 (long running tasks)
If a ‘rogue/expensive’ task is found, it can be further debugged using the following EMDIAG commands:
$ repvfy send run_task -id <task id>
This command will run the task in debug mode and record the PL/SQL trace information in the repository
$ repvfy dump trace
This command will show the debug information written in the repository with the above command
EM 13c now provides a chart that displays details on the Metric Data Rollup Performance as seen in the image
below. This chart can be found by clicking on Setup / Manage Cloud Control / Repository. This chart shows the
Number of Records Rolled Up and the Throughput per Minute. These values may increase over time as new
targets are added but large spikes could indicate that agents are not communicating properly to the OMS. If large
spikes are seen on a consistent basis, increase the number of rollup worker threads. This is done by clicking on the
Configure push button seen in the image below and increasing the number of threads.

33 | OPERATIONAL CONSIDERATIONS AND TROUBLESHOOTING FOR ORACLE ENTERPRISE MANAGER 13C
Figure 86: Metric Data Rollup Performance Graph
EM Job System
The EM job system is crucial to Enterprise Manager’s health. The majority of background processes and tasks are
run via a series of jobs. Included in these jobs are loading metric data, calculating availability of composite targets,
rollup and purge of metric data and notifications. This Job System is an OMS subsystem and includes a Job
Scheduler and Job Workers. The Job Scheduler in turn consists of two components, the Job Step Scheduler and
the Job Dispatcher. Each of these components are described in further detail below.
Job Step Scheduler – The Job Step Scheduler is a global component so there is only one per EM environment. It
is scheduled to run by the DBMS Scheduler. The primary purpose of this component is to look for jobs that need to
be executed. Make sure that this job is up. This can be seen by clicking on Setup / Manage Cloud Control /
Repository and looking for the status of the Job Step Scheduler in the Repository Scheduler Jobs Status section as
seen below:
Figure 27: Job Step Scheduler
Job Dispatcher - The EM Job system also has a notion of a 'short' and 'long' jobs (based on execution time) and
has separate worker pools in the OMS (not in the database as with the job workers) to handle those requests. The
Job Dispatcher runs locally on each OMS and its purpose is to dispatch the jobs found by the Job Step Scheduler to
the job workers. If the dispatcher cannot keep up with the work in the queue, a backlog is created. This is not a
problem as long as the backlog is temporary. If it is not temporary, then either the dispatcher is not able to keep up
with the amount of work which could mean it may be necessary to add another OMS server or there is a problem
with the job workers and they are not able to accept the work from the dispatcher (see the next section below for
details on how to diagnose a job worker problem.
Job Workers – The Job Workers take work from the Job Dispatcher, send it to the appropriate agent and also
receive information from the agents. If Job Workers are always busy and never free, then capacity needs to be

34 | OPERATIONAL CONSIDERATIONS AND TROUBLESHOOTING FOR ORACLE ENTERPRISE MANAGER 13C
added either by adding another OMS server or by increasing the number of job workers and potentially increasing
the number of db connections (each job worker takes a connection to the database). EM provides a way to tell if the
Job Workers are keeping up with the dispatched work. If the amount of work the dispatcher is able to give to the job
workers approaches zero, then the workers are not keeping up.
To see the Job Worker details for each OMS server, select Setup / Manage Cloud Control / Management
Servers. The top right quarter of the window is titled “Job System”. Under the “Recent Job Executions Summary”
table, click on the link called “More Details…”. This will open a new window showing two tabs: Job Executions and
Job Dispatchers. Click on the Job Dispatcher tab to see the details for each OMS server. In that table, the
Configured Threads column is the number of threads configured for each thread pool. The Avg. Threads Available
is the number of threads that are waiting to take work from the dispatcher. See the screenshot below (note the
Configured Threads shown below are the defaults).
Figure 28: Job Dispatcher Threads
» The number of Configured Threads should be the same for each OMS server. The values in the Avg. Steps
Dispatched/Min and Avg. Threads Available columns should be approximately the same for each OMS while EM
is running. If the values are consistently different then one OMS is working harder than the others. At this point, it
is best to contact Oracle Support for further diagnosing.
» If the number for Avg. Threads Available is getting close to zero then it means the dispatcher cannot dispatch to
all the workers in a timely fashion.
» If the Avg. Steps Dispatched/Min is high, there is a resource problem, and the environment could probably benefit
from more worker threads. However do not go beyond 'doubling' the size of the threads. If doubling the number
of threads does not seem high enough, contact Oracle as it might be better to add an additional OMS.
» If the Avg. Steps Dispatched/Min is low, but the number of available threads per cycle is also low, this typically
means that either a thread is stuck, or is 'busy for too long'. If this persists, refer to the section “Omsvfy
Commands” in the Use of the emctl dump Options to Collect OMS Log Files [ID 1369918.1] for steps on how to
take a thread dump of the OMS processes. It is also possible to use EMDIAG for this information with this
command:
$ omsvfy snapshot oms
If the Avg Steps Dispatched/Min numbers are all zero, the Avg Threads Available numbers are all zero and there
is an increase in the Job Backlog (steps) (found on the Health Overview page under the Job System Status
section), then it is most likely that the Job Dispatcher process is stuck. The Job Dispatcher is responsible for

35 | OPERATIONAL CONSIDERATIONS AND TROUBLESHOOTING FOR ORACLE ENTERPRISE MANAGER 13C
updating the numbers on the Thread Pool Utilization charts and if it is not working, it cannot update the numbers
and thus they all show zero.
In both of these cases described where the Avg Threads Available is zero or approaching zero, the most likely
cause is a stuck thread and related to known Bug 22910732. This bug is fixed in EM 13.2. For earlier releases of
EM, a restart of the OMS servers is required to work around this bug.
To get a health report of the Job system, run this EMDIAG report:
$ repvfy dump job_health
This report will provide details about items such as the OMS configuration, operational data for Job steps and
backlogs, performance and throughput statistics and a list of the job system errors. To get more detailed
diagnostics for any of the jobs returned in the output, there are additional EMDIAG commands that can be executed
using the identified jobs:
repvfy dump execution –guid <job execution id>
repvfy dump job –guid <job id>
repvfy dump step –id <job step id>
Agent Health
The overall health of the environment can also be seen by the status of the Agents. The central view for all agents
can be seen from Setup / Manage Cloud Control / Agents. From here you can evaluate agents that are blacked
out, unreachable, pending or blocked.
Figure 29: Manage Cloud Control Agents Page
This is a very powerful page for EM Administrators as you can issue various agent control commands from this
page, including: startup, shutdown, block, unblock, restart, secure, unsecure. It is possible to edit agent properties
(emd.properties file) or submit a job to edit properties for multiple agents at one time. For additional details on
managing and configuring Agents, see Controlling and Configuring Management Agents in the Oracle Enterprise
Manager Cloud Control Administrator’s Guide.
A significant percentage of agents down or not responding indicates an unhealthy environment and a lack of proper
monitoring. The goal is to have 100% agent availability. Spot check the agent health daily watching for a significant
increase in the percentage of problem agents and checking the alerts for the problem agents, correcting those that

36 | OPERATIONAL CONSIDERATIONS AND TROUBLESHOOTING FOR ORACLE ENTERPRISE MANAGER 13C
are creating issues (pinging, etc). On a bi-weekly basis, take the time to fix those agents that have shown problems
for several days.
A large number of agents in the “Agent Unreachable”, “Status Pending” and/or “Blocked/Misconfigured” status
indicate that these targets are not being properly monitored. Click on the status type in the summary line with the
most problematic agents to get a list of these agents and begin diagnosing to resolve the issues. EM will attempt to
perform initial troubleshooting of unreachable/pending status issues. To view the output from these checks, click on
the symptom diagnosis icon next to the Agent Status as seen in the image below. This will open a page providing
the top causes for the agent unreachable status. Be aware that if the OMS and Agent are not able to communicate,
then the diagnosis will base its findings on the data available in the repository which may not reflect the actual cause
of the availability issue.
Figure 30: Manage Cloud Control Agents Page
Basic agent troubleshooting steps to be followed:
TABLE 6: AGENT TROUBLESHOOTING
CHECK NOTES
Host Up
Check to verify if the host is up.
If not, is the host still valid? Many times hosts are decommissioned but not removed from
monitoring.
Agent Up Check to verify if the agent is up: emctl status agent
Start agent if necessary
Agent Uploading In the emctl status agent, check for messages about heartbeat/upload. Attempt upload with
emctl upload agent
OMS Reachable Ping the oms from the agent, and agent from the OMS, ensure ports are not blocked by
firewalls
Check Logs
$EMSTATE/sysman/log/ (Ex: /u01/app/oracle/em/agent_inst/sysman/log)
gcagent.log – contains trace, debug, information, error or warning messages
from the agent.
gcagent_skd.trc – logging about fetchlets and receivelets

37 | OPERATIONAL CONSIDERATIONS AND TROUBLESHOOTING FOR ORACLE ENTERPRISE MANAGER 13C
gcagent_mdu.log – tracks the metadata updates to the agent
emctl.log – information from the execution of the emctl commands
Agent Dump
If the agent is still not uploading or reachable, run a target and availability dump on the
agent target from repvfy.
repvfy dump availability -name <agent:port>
repvfy dump target -name <agent:port>
REPVFY can also be used to get an overview of agent health by running a repvfy dump agent_health report. The
command will provide details about the agent such as agent ping statistics, agent down statistics and system errors.
Events and Incidents
It is also necessary to review Critical or Warning errors which could indicate an underlying issue and lead to an
outage. Also, large amounts of alerts cause a performance impact on the EM system. Metric errors indicate that
data is not being collected or monitored properly, and these should be resolved to have an accurate picture of the
current system status. For a detailed look at using Incident Manager see the Oracle Enterprise Manager 13c Cloud
Control Administrator’s Guide. Below is a list of some of the places to check for events and/or incidents.
1. OMS and Repository Events and Incidents – Click on Setup / Manage Cloud Control / Health Overview.
Then from the target menu select OMS and Repository / Monitoring / Incident Manager. This will filter the
events and incidents to those related to the OMS and Repository targets. The default view is all open incidents.
Figure 31: Open Incidents Page
To see additional events, click on “Events without incidents”. Depending on your incident rules, you may not be
receiving an incident for each event. For details on how to create the recommended rule set to ensure notifications
are sent to the EM administrator, refer to Oracle Enterprise Manager 13c Configuration Best Practices [2139083.1]..

38 | OPERATIONAL CONSIDERATIONS AND TROUBLESHOOTING FOR ORACLE ENTERPRISE MANAGER 13C
Figure 32: Open Events Page
Clicking on an individual message will provide more details for that particular alert. Look for repeating messages
and address these first. Some alerts must be manually closed, such as TNS errors or alert log errors. These will
have an additional action of Close as seen below. Clearing these errors regularly helps maintain a clean
environment. This can also be done with the EM CLI utility using the clear_stateless_alerts flag.
Figure 33: Event Detail
Note: You may see BEA-337 [WebLogicServer] errors coming from WebLogic Server. By default WLS will ping
applications and wait for a response for up to 600 seconds. EM will keep threads running as long as there is work in
the queue so they will not respond to a heartbeat, causing WLS to timeout and error. To stop these alerts, modify
the EM WLS xml configuration file and set the StuckThread flag to “false”. Note that this should only be done for the
EM WebLogic server. To set this flag, edit the
<gc_inst>/user_projects/domains/GCDomain/config/diagnostics/Module-FMWDFW-2818.xml file and change the
flag for StuckThread to “false”. This will require a restart of the OMS server.
2. Target Incidents - Click on Enterprise / Monitoring / Incident Manager. The list of incidents can be sorted
by clicking on the column heading. To find the highest number of repeating error messages to address first,
click on the Summary column to sort by error message.
3. System Errors – EM provides a system error log page. This page details the errors found on the repository
and/or the management services. The URL to this page is
http[s]://your_em_link/em/console/health/healthSystemError. This page will provide information such as the

39 | OPERATIONAL CONSIDERATIONS AND TROUBLESHOOTING FOR ORACLE ENTERPRISE MANAGER 13C
component type, the agent monitoring that component, date and time of the error, level, and the error message
text. It is used for advanced fault research and should only need to be reviewed to help resolve a problem that
has not been resolved through any of the other event and incident management tools. It is best to work with
Oracle Support for help in resolving these issues.
Figure 34: Health System Error Page
Log & Trace Files
As part of diagnosing problems with the different EM components, it is important to review the log and trace files for
these components. The table below details the standard location for log and trace files broken down by the different
components. For more details on managing log files, refer to Enterprise Manager Cloud Control Administrator’s
Guide.
TABLE 7: LOG/TRACE FILES
EM
COMPONENT LOG FILES TRACE FILES
Oracle
Management
Agent
$EMSTATE/sysman/log (“emctl getemhome” will return
the location for $EMSTATE)
Ex:
/u01/app/oracle/em/agent_inst/sysman/log
$EMSTATE/diag/ofm/emagent/emagent/tra
ce
Oracle
Management
Service
$EM_INSTANCE_BASE/em/<OMSNAME>/sysman/log
Ex:
/u01/app/oracle/em/agent_inst/em/OMS1/sysman/log
$EM_INSTANCE_BASE/user_projects/domains/<DOMAI
N>/servers/<OMSNAME>/logs
Ex:
/u01/app/oracle/gc_inst/user_projects/domains/GCDomain/serve
rs/OMS1/logs
$EM_INSTANCE_BASE/user_projects/domaings/<DOMAI
N>/servers/<OMSNAME>/sysman/log
Ex:
$EM_INSTANCE_BASE/em/<OMSNAME>/
sysman/log
$EM_INSTANCE_BASE/user_projects/dom
aings/<DOMAIN>/servers/<OMSNAME>/sy
sman/log
(where $EM_INSTANCE_BASE is the gc_inst
location and OMSNAME is the name of the oms
instance ex: EMGC_OMS1)

40 | OPERATIONAL CONSIDERATIONS AND TROUBLESHOOTING FOR ORACLE ENTERPRISE MANAGER 13C
/u01/app/oracle/gc_inst/user_projects/domains/GCDomain/serve
rs/OMS1/sysman/logs
(where $EM_INSTANCE_BASE is the gc_inst location and
OMSNAME is the name of the oms instance ex: EMGC_OMS1)
Oracle HTTP
Server (OHS)
$EM_INSTANCE_BASE/user_projects/domains/<domain_
name>/servers/<ohs_name>/logs
Ex:
/u01/app/oracle/gc_inst/user_projects/domains/GCDomain/serve
rs/ohs1/logs
Oracle WebLogic
$EM_INSTANCE_BASE/user_projects/domains/<domain_
name>/servers/<server_name>/logs/<server_name>.log
Ex:
/u01/app/oracle/MWare/gc_inst/user_projects/domains/GCDoma
in/servers/EMGC_OMS1/logs
Maintaining Log and Trace Files
In an EM environment, the majority of the log and trace files for the OMS, WebLogic Server, HTTP Server, Agent
and database are maintained automatically. However, there are a few exceptions. For these exceptions, the
size/retention of the files must be maintained manually. Also, for most of the automated methods, the details such
as file size and number of files to retain can also be controlled. This is an important item to understand to help
ensure that log and trace files are maintained for the expected period of time and that the amount of disk space
consumed by these type of files is also maintained. Below are some helpful tips for managing these files as well as
pointers to MOS notes and Oracle documentation for further information.
Management Agent Log and Trace Files
Agent logs are segmented and have a limited overall size and hence need not be deleted or managed. The log files
are segmented (archived) into a configurable number of segments of a configurable size. These settings are
controlled by properties in emd.properties and can be modified via the EMCTL utility. The latest segment is always
filename.log and the oldest is the filename.log.X where X is the highest number. For more details on the
Management Agent log and trace files, refer to the Oracle Enterprise Manager Cloud Control Administrator’s Guide.
» Control the size of the logs: The size of each of the individual agent log files is controlled by the property
<handler>.totalSize. This property will specify the total size in MB for the file segments. Once the file reaches
this size, it will be archived to a new file. The default setting is 100M. Here is an example of finding the value for
the gcagent.log file in 12c: emctl getproperty agent –name “Logger.log.totalSize”. For more details on setting the
max size of the agent log files, refer to the documentation link above.
» Control when the agent writes to log files: The amount of data that an agent will log is controlled by the property
<handler>.level where the possible levels are DEBUG, INFO, WARN, ERROR, and FATAL. By default, this is set
to INFO which means that logs messages with the level of INFO and above (WARN, ERROR, and FATAL) will be
logged. The recommendation is to keep the default setting unless debugging an agent issue. Then, set the
logging level to DEBUG for specific modules only rather than changing the root logging level. For more details on
setting the agent logging level, refer to the documentation link above.
» Control when to purge log files: The number of archived log segments that will be maintained is specified by the
property <handler>.segment.count. The default setting varies by log file. Here is an example of finding the value
for the gcagent.log file: emctl getproperty agent –name “Logger.log.segment.count”. For more details on setting
the number of log files to retain, refer to the documentation lins above.
OMS Trace and Log Files

41 | OPERATIONAL CONSIDERATIONS AND TROUBLESHOOTING FOR ORACLE ENTERPRISE MANAGER 13C
The maintenance of trace and log files on the OMS servers can be handled automatically via properties set for the
different components.
Oracle Management Service (OMS) Log and Trace Files
The OMS log and trace files are segmented (archived) into a configurable number of segments of a configurable
size so they do not need to be manually deleted or managed. These settings are controlled by properties in
emomslogging.properties and can be modified via the EMCTL utility. For more details on the OMS log and trace
files, refer to the Oracle Enterprise Manager Cloud Control Administrator’s Guide.
» Control the size of the logs and trace files: the size of the individual log and trace files are controlled by the
properties log4j.appender.emlogAppender.MaxFileSize and log4j.appender.emtrcAppender.MaxFileSize
respectively. These properties will specify the total size in bytes for the file segments. Once a file reaches this
size, it will be archived to a new file. Here is an example of finding the value for the gcagent.log file: emctl get
property –name “log4j.appender.emlogAppender.MaxFileSize”. For more details on setting the max size of the
OMS log files, refer to the documentation link above.
» Control when the OMS writes to log files: The amount of data that an OMS will log is controlled by the property –
value “<LEVEL>” where the possible levels are DEBUG, INFO,WARN, ERROR, and FATAL. The specific
category or logging module name must also be specified. The recommendation is to keep the default setting
unless debugging an issue. Then, set the logging level to DEBUG for specific modules only rather than changing
the root logging level which can cause a lot of messages to be written to the trace files and potentially slowing
down the system. For more details on setting the OMS logging level, refer to the documentation link above
» Control when to purge log files: The number of archived log and trace files that will be maintained is specified by
the properties log4j.appender.emlogAppender.MaxBackupIndex and
log4j.appender.emtrcAppender.MaxBackupIndex respectively. Here is an example of finding the value for the
gcagent.log file: emctl get property –name “log4j.appender.emlogAppender.MaxBackupIndex”. For more
details on setting the max number of OMS log and trace files to retain, refer to the documentation link above.
Oracle WebLogic Server and HTTP Server Log Files
The different WebLogic Server components generate their own log files. These files are stored under different sub-
directories in the middleware_home/gc_inst location. For the majority of these log files, the size and number of files
can be maintained automatically. To maintain the size and number of backup files, the log files are segmented
(archived) into a new segment of a configurable size based on a configurable rotation type. These settings can be
set in the WebLogic Server Administration Console or via the WLST utility. Starting with the 12.1.0.2 OMS release
onwards, the log file rotation and retention options are set out-of-the box for the GCDomain.log*,
EMGC_ADMINSERVER.log* and access.log* files. For more details on the WebLogic and HTTP Server log files,
refer to the Oracle Fusion Middleware Administering Oracle Fusion Middleware Guide and the Oracle Enterprise
Manager Cloud Control Administrator’s Guide.
» Control the size of the logs files: the size of the individual log files can be based on file size or time. If the
Rotation type “By Size” is selected, the log file will be archived to a new segment once the file reaches a specified
size. If the Rotation type “By Time” is selected, the log file will be archived to a new segment according to the
specified Rotation interval (in hours). The default setting is a rotation type of “By Size” and a files size of 5M.
These default settings should be sufficient for most EM installations. If needed, the settings can be modified by
connecting to the Oracle WebLogic Server Administration Console. For more details on how to modify this
setting, refer to the documentation links above.
» Control when the WebLogic and HTTP servers write to log files: The amount of data that will be logged can be
controlled by specifying the level for the log and different message destinations. Some of the different levels are
Debug, Info, Notice, Warning, Trace, Error, Critical, Alert, Emergency and Off. The default setting is Warning for
the log files and Error for the domain log broadcaster file. These settings should be sufficient for most EM
installations. If needed, the settings can be modified by connecting to the Oracle WebLogic Server Administration
Console.

42 | OPERATIONAL CONSIDERATIONS AND TROUBLESHOOTING FOR ORACLE ENTERPRISE MANAGER 13C
» Control when to purge log files: The maximum number of archived log files that will be maintained can be
controlled by selecting the option to limit the number of retained files and then specifying the number of files to
retain. This number does not include the current log file. The default setting is to retain 10 files and should be
sufficient for most EM installations. If needed, this setting can be modified by connecting to the Oracle WebLogic
Server Administration Console. For more details on how to modify this setting, refer to the documentation links
above.
NOTE: The following log files need to be maintained and manually purged. One method for addressing these
files would be to create a cronjob that would find all files older than a specific period of time and delete them.
Here is an example crontab entry to remove all of the *.out* files under the OMS instance domain directory that
are older than 30 days:
00 * * * * cd /u01/app/oracle/gc_inst/user_projects/domain;find . -name "*.out*" -mtime +30 -exec rm {} \;
All files under middleware_home/gc_inst/WebTierIH1/diagnostics/logs/OHS/ohs#/.
Log files under the admin server and emgc_oms server:
o middleware_home/gc_inst/user_projects/domains/<domain_name>/servers/EMGC_ADMINSER
VER/logs/*.out*
o middleware_home/gc_inst/user_projects/domains/<domain_name>/servers/EMGC_OMS#/logs/*
.out*
Database Trace and Log Files
All diagnostic data including the alert log is stored in the Automatic Diagnostic Repository (ADR). Each instance of
each product stores diagnostic data underneath its own ADR home directory. The ADR homes are grouped
together under the same directory referred to as the ADR Base. This location is set via the DIAGNOSTIC_DEST
initialization parameter. The different ADR home directories that are known to the Automatic Diagnostic Repository
Command Interpreter (ADRCI) utility can be seen by issuing a “show homes” command. To execute any
commands such as purge or list, the ADRCI utility must be told which home to operate against via the “set home
adr_home” command. Failure to do this will result in this error: DIA-48448: This command does not support multiple
ADR homes.
Alert Log
The alert log is stored as an XML file in the ADR and can be viewed with Enterprise Manager and with the ADRCI
utility. Oracle also provides a text-formatted version of the alert log for backward compatibility. For details on using
the ADRCI PURGE command, refer to the Oracle Database Utilities 12c Release 1 (12.1) guide.
» Control the size of the text based alert log: the size of the alert log must be controlled manually. It is safe to
delete the alert log while the instance is running but it is recommended to create an archived copy first for
possible future reference.
» Control when to purge the XML based alert log file: The ADRCI utility can be used to purge the XML-formatted
alert log file. The content is only automatically purged based on these purging policies. Therefore, data in the
files that does not meet the time in the purging policy is maintained. Alert log content is subject to purging after
one year (long-lived or LONGP_POLICY). To see the default purging policies for long-lived ADR content, issue
the SHOW CONTROL command in ADRCI. The values are specified in hours. The default values should be
sufficient for most database installations. NOTE: if you have multiple homes on the server, you must issue the
SET HOMEPATH command to a specific home before issuing a SHOW CONTROL command. The content can
also be purged manually. Here is an example of a command to purge the alert log content older than 30 days
(note that the age is specified in minutes): purge -age 43200 -type alert. For further details on the ADRCI utility
refer to the Oracle Database Utilities 12c Release 1 (12.1) guide.
43 | OPERATIONAL CONSIDERATIONS AND TROUBLESHOOTING FOR ORACLE ENTERPRISE MANAGER 13C
Trace Files
Trace files are created by server and background processes, the SQL trace facility and also by enabling SQL tracing
for a session or an instance. The file extension for trace files is .trc (i.e. orcl_ora_762.trc). Trace files are
sometimes accompanied by a corresponding trace map file which contains structural information about trace files.
These trace map files use the file extension .trm.
» Control the size of the trace files: the maximum size of all trace files can be controlled using the initialization
parameter MAX_FILE_SIZE. This will limit the size of trace files to a specific number of operating system blocks.
» Control when the database writes to trace files: The only background process that allows this control is the ARCn
process. This is controlled via the LOG_ARCHIVE_TRACE initialization parameter. There are multiple trace
levels that can be set which control the amount of trace data written. For more details, refer to the Oracle
Database Administrator’s Guide 11c Release 1 (12.1) guide.
» Control when to purge trace files: Trace files can be purged from the ADR home based on purging policies. The
content is only purged based on these purging policies. Therefore, data in the files that does not meet the time in
the purging policy is maintained. Incidents and incident dump content are subject to purging after one year (long-
lived or LONGP_POLICY) however the trace files, core dumps and incident packaging information are subject to
purging after 30 days (short-lived or SHORTP_POLICY). Some Oracle products (Oracle Database) automatically
purge diagnostic data at the end of its life cycle. The default values should be sufficient for most database
installations. To see the default purging policies for short and long-lived ADR content, issue the SHOW
CONTROL command in ADRCI. The values are specified in hours. NOTE: if you have multiple homes on the
server, you must issue the SET HOMEPATH command to a specific home before issuing a SHOW CONTROL
command. The content can also be purged manually. Here is an example of a command to purge the trace files
(including dumps) older than 30 days (note that the age is specified in minutes): purge -age 43200 -type trace.
For further details on the ADRCI utility refer to the Oracle Database Utilities 12c Release 1 (12.1) guide.
Listener Log Files
The listener log, much like the alert log, is stored in the ADR home for the listener in an xml file. It is also stored in a
text-formatted version for backward compatibility.
» Control the size of the trace files: When the XML-formatted listener file (log.xml) reaches 10MB in size, it will be
archived into a file named log_1.xml, log_2.xml, etc. This only applies to the XML-formatted file.
» Purge listener log files: Listener log files and information within a listener log are not purged via the automatic
purge. Unlike the RDBMS product, the network products have not supported purging. Therefore, the
maintenance of the listener log and trace files is manual. This includes the log files for the SCAN_LISTENERS in
a RAC cluster. The XML-formatted files can be purged using the ADRCI utility as with the XML-formatted alert
logs.
NOTE: The ADR location for the LISTENER trace and log files may not be the same as for the SCAN LISTENER
log and trace files. When connecting into the ADRCI utility, it will show one ADR Base location only. This can be
seen when issuing the “show base” command. To point to the ADR Base for the Oracle Grid install, issue the “set
base” command. For example: set base /u01/app/grid. After issuing the set base command, then a “show
homes” will show all of the diag locations that can be controlled. Be sure to issue the “set home” command
before purging trace files. The locations are as follows: ADR Base for LISTENER and SCAN_LISTENER log and
trace files is based on the DIAGNOSTIC_DEST initialization parameter.
Incident Files
OMS Incident Files
Any errors in these log files indicate product defects (bugs). Open an SR with Oracle Support for these issues.
There are two different locations for the Automatic Diagnostic Repository (ADR) incidents created on the OMS
servers. These are as follows:

44 | OPERATIONAL CONSIDERATIONS AND TROUBLESHOOTING FOR ORACLE ENTERPRISE MANAGER 13C
WebLogic Server incidents:
<EM_INSTANCE_BASE>/user_projects/domains/<domain_name>/servers/<SERVER_NAME>/adr/diag/ofm/EMGC
_DOMAIN/EMOMS/incident
Ex:
/u01/app/oracle/gc_inst/user_projects/domains/GCDomain/servers/EMGC_OMS1/adr/diag/ofm/EMGC_DOMAIN/E
MOMS/incident
This command will show the WLS incident details:
$ omsvfy show wlsincidents
Refer to the My Oracle Support (MOS) note Oracle Enterprise Manager 13c Configuration Best Practices
[2139083.1] for more information on stopping a common WLS related incident.
OMS incidents:
<EM_INSTANCE_BASE>/user_projects/domains/<domain_name>/servers/<SERVER_NAME>/adr/diag/ofm/<dom
ain_name>/<SERVER_NAME>/incident
Ex:
/u01/app/oracle/gc_inst/user_projects/domains/GCDomain/servers/EMGC_OMS1/adr/diag/ofm/GCDomain/EMGC_
OMS1/incident
This command will show the OMS incident details:
$ omsvfy show emincidents
Agent Incident Files
The ADR incidents created for the Agent are found here: $EMSTATE/diag/ofm/emagent/emagent/incident
Ex:
/u01/app/oracle/em/agent_inst/diag/ofm/emagent/emagent/incident
This command will show the agent incident details:
$ agtvfy show incidents
Troubleshooting
The following are high-level process flows for troubleshooting various issues with Enterprise Manager.
TABLE 8: TROUBLESHOOTING
ISSUE COMPONENT
Performance
RUN REPVFY EXECUTE OPTIMIZE (FOR FURTHER DETAILS ON THIS
REPVFY COMMAND, REFER TO ORACLE ENTERPRISE MANAGER 13C
CONFIGURATION BEST PRACTICES [2139083.1].
1. Evaluate DB Performance, locks, waits, etc.
2. Look for ADDM recommendations

45 | OPERATIONAL CONSIDERATIONS AND TROUBLESHOOTING FOR ORACLE ENTERPRISE MANAGER 13C
3. Validate SYSMAN statistics
4. Run repvfy dump performance
5. Run repvfy dump errors
Jobs
1. Check DBMS_SCHEDULER Status
2. Check value of JOB_QUEUE_PROCESSES
3. Run repvfy dump job_health
4. Check for errors relating to a specific job failure (see MOS note
744645.1 to identify the job)
5. Refer to MOS notes 783357.1 and 1520580.1 for further help in
diagnosing an issue with Jobs
Notifications – if a notification is
missing or late
1. Check event/incident details to see if Notification was triggered
2. Check EM Jobs Service – Notification Job
3. Run repvfy dump notif_health
Events – missing event or incident
1. Check for loader backlog (repvfy dump loader_health)
2. Check agent status (not blocked, uploading?)
3. Check target thresholds
4. Check incident rules
OMS Availability
1. Verify that the repository database and listener are up
2. Verify that the sysman, sysman_opss, sysman_mds user accounts in
the repository database are open
3. Check log files
emctl - $EM_INSTANCE_BASE/em/EMGC_OMSn/sysman/log
HTTP_SERVER -
$EM_INSTANCE_BASE/user_projects/domains/GCDomain/serve
rs/ohs1/logs
EM Node Manager -
$EM_INSTANCE_BASE/user_projects/domains/GCDomain/node
manager
Admin Server -
$EM_INSTANCE_BASE/user_projects/domains/GCDomain/serve
rs/EMGC_ADMINSERVER/logs
EM Managed Server -
$EM_INSTANCE_BASE/user_projects/domains/GCDomain/serve
rs/EMGC_OMS1/logs
4. For diagnosing issues with connectivity between OMS and the
Repository
Target Availability
1. Check gcagent.log for ERROR messages
2. Run repvfy dump target
3. Run repvfy dump availability

46 | OPERATIONAL CONSIDERATIONS AND TROUBLESHOOTING FOR ORACLE ENTERPRISE MANAGER 13C
Conclusion
As an environment grows for any enterprise, the dependency on Oracle Enterprise Manager 13c to help monitoring
and administer the environment becomes very important. This also means that the EM environment itself must be
supported, maintained and treated as highly available as the most highly available target it manages. Therefore, this
means that EM must be properly configured, monitored, maintained and high performing to provide the daily
monitoring and administration capabilities that an enterprise requires to maintain their environment.

Oracle Corporation, World Headquarters Worldwide Inquiries
500 Oracle Parkway Phone: +1.650.506.7000
Redwood Shores, CA 94065, USA Fax: +1.650.506.7200
Copyright © 2016, Oracle and/or its affiliates. All rights reserved. This document is provided for information purposes only, and the
contents hereof are subject to change without notice. This document is not warranted to be error-free, nor subject to any other warranties or conditions, whether expressed orally or implied in law, including implied warranties and conditions of merchantability or fitness for a particular purpose. We specifically disclaim any liability with respect to this document, and no contractual obligations are formed either directly or indirectly by this document. This document may not be reproduced or transmitted in any form or by any means, electronic or mechanical, for any purpose, without our prior written permission. Oracle and Java are registered trademarks of Oracle and/or its affiliates. Other names may be trademarks of their respective owners. Intel and Intel Xeon are trademarks or registered trademarks of Intel Corporation. All SPARC trademarks are used under license and are trademarks or registered trademarks of SPARC International, Inc. AMD, Opteron, the AMD logo, and the AMD Opteron logo are trademarks or registered trademarks of Advanced Micro Devices. UNIX is a registered trademark of The Open Group. 0615 Operational Considerations and Troubleshooting for Oracle Enterprise Manager 13c October 2016 Author: Bethany Lapaglia, Werner DeGruyter, Courtney Llamas Contributing Authors: Jim Viscusi, Curtis Dinkel
C O N N E C T W I T H U S
blogs.oracle.com/oracle
facebook.com/oracle
twitter.com/oracle
oracle.com