Operational Agricultural Drought Assessment -...
18
Operational Agricultural Drought Assessment Government of India Ministry of Agriculture & Farmers’ Welfare Department of Agriculture, Cooperation & Farmers’ Welfare Mahalanobis National Crop Forecast Centre, New Delhi Karan Choudhary [email protected]
-
Upload
phunghuong -
Category
Documents
-
view
216 -
download
0
Transcript of Operational Agricultural Drought Assessment -...
Operational Agricultural Drought Assessment
Government of India
Ministry of Agriculture & Farmers’ Welfare
Department of Agriculture, Cooperation & Farmers’ Welfare
Mahalanobis National Crop Forecast Centre, New Delhi
Karan [email protected]

2
Indian Agriculture
Net Area Sown : 141.6 Mha (43%)
Foodgrain production: 252 Mt• (Kharif: 128 Mt, Rabi: 124 Mt)
Horticulture Production: 281 Mt
Net Irrigated Area: 65.3 Mha(46.4%)
Agrl. Share of GDP(%): 13.9
Employment Opportunity: 54.6%
Average Field size: 1.15 ha

Drought Occurrence Frequency
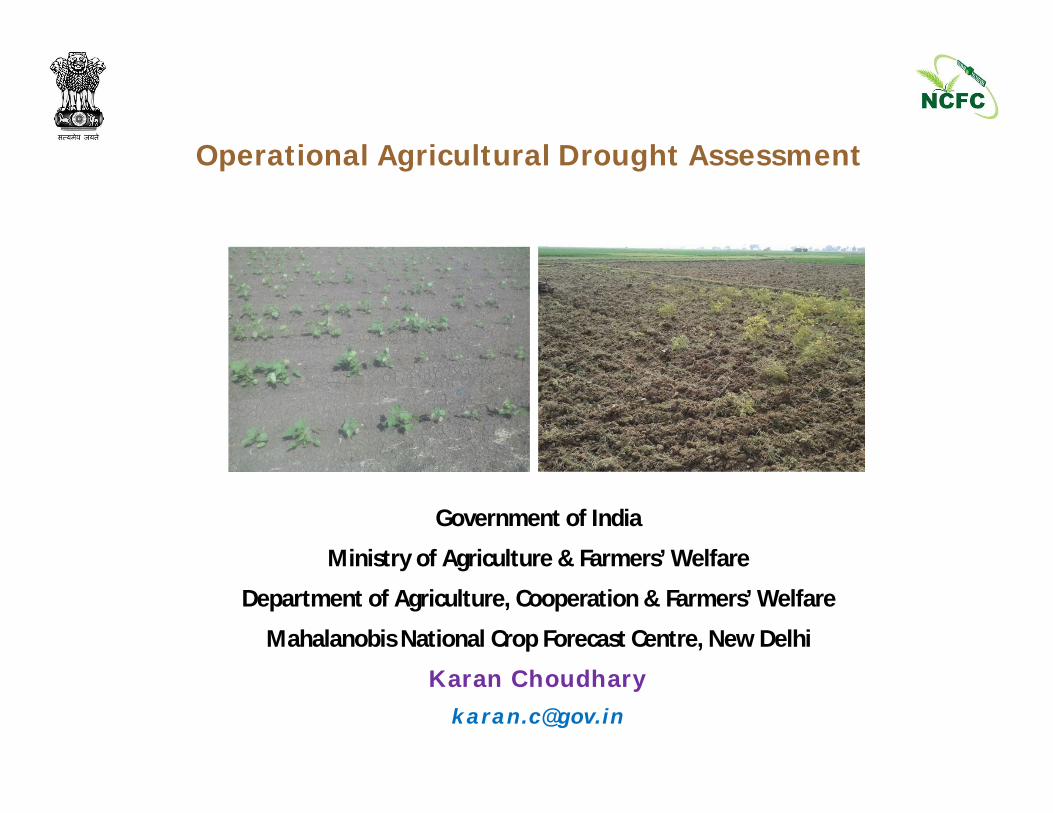
Central Agencies involved with Drought Monitoring/Management in India
• Overall coordination, Inter-Ministerial Crop Weather Watch Group (CWWG), Leading IMCT for Drought Assessment
Ministry of Agriculture & Farmers’ Welfare
• Weather Forecasting, Rainfall Data
India Meteorological Department
• Monitoring Reservoirs and Ground water situation
MoWR,RD&GR (CWC, CGWB)
• Space based inputs
Indian Space Research Organization
• Contingency planning
ICAR- CRIDA
• PMKSY-Watershed Development-Water Harv. Str. /Irrigation/Water Use efficiency
DOLR/ MOWR/DAC&FW
• Agricultural Drought Monitoring : NADAMS
Mahalanobis National Crop Forecast Centre, DAC&FW
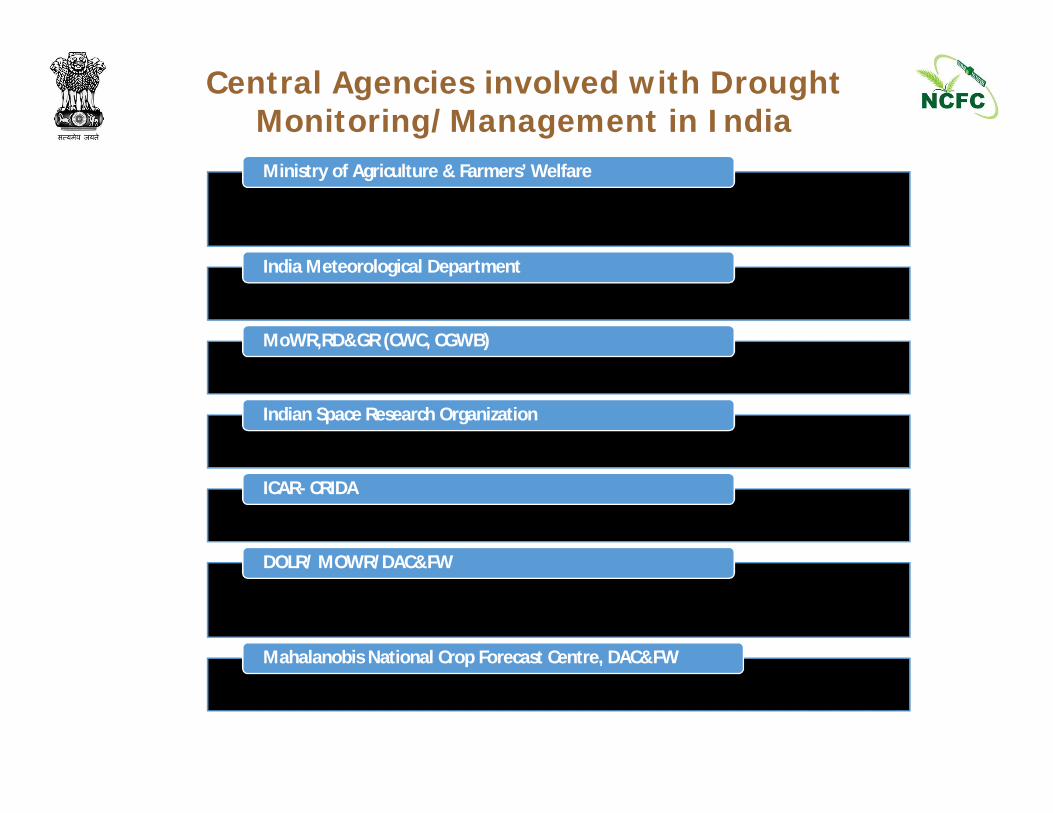
Partners TasksAdditional Secretary, DAC&FW & Central Drought Relief Commissioner
Chairperson of the Group: overall coordination
Economics & Statistical Advisor, DAC&FW Report behavior of agro-climatic andmarket indicators
Agriculture Commissioner Crop conditions: Availability of Inputs; Contingency Planning
Animal Husbandry Commissioner Livestock health; Fodder availabilityIndia Meteorological Department Rainfall forecast and monsoon conditions.Central Water Commission & Central Ground Water Board
Monitoring data on Important reservoirs / groundwater.
Ministry of Power Availability of power Indian Council of Agricultural Research Technical input and contingency planningNational Centre for Medium RangeWeather Forecasting
Provide medium-term forecasts
Mahalanobis National Crop Forecast Centre
Agricultural Drought Information
Indian Space Research Organisation Technical inputs on drought parameters
Crop Weather Watch Group
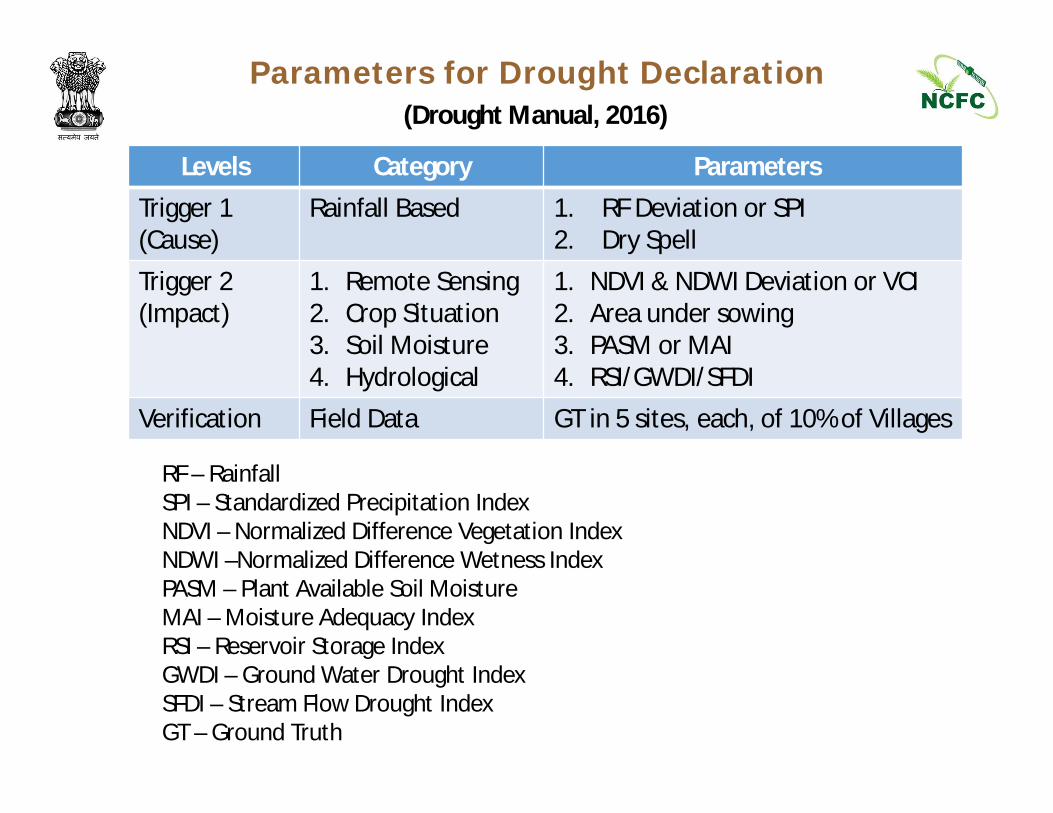
Parameters for Drought Declaration(Drought Manual, 2016)
Levels Category ParametersTrigger 1(Cause)
Rainfall Based 1. RF Deviation or SPI2. Dry Spell
Trigger 2(Impact)
1. Remote Sensing2. Crop Situation3. Soil Moisture4. Hydrological
1. NDVI & NDWI Deviation or VCI2. Area under sowing3. PASM or MAI4. RSI/GWDI/SFDI
Verification Field Data GT in 5 sites, each, of 10% of Villages
RF – RainfallSPI – Standardized Precipitation IndexNDVI – Normalized Difference Vegetation IndexNDWI –Normalized Difference Wetness IndexPASM – Plant Available Soil MoistureMAI – Moisture Adequacy IndexRSI – Reservoir Storage IndexGWDI – Ground Water Drought IndexSFDI – Stream Flow Drought IndexGT – Ground Truth
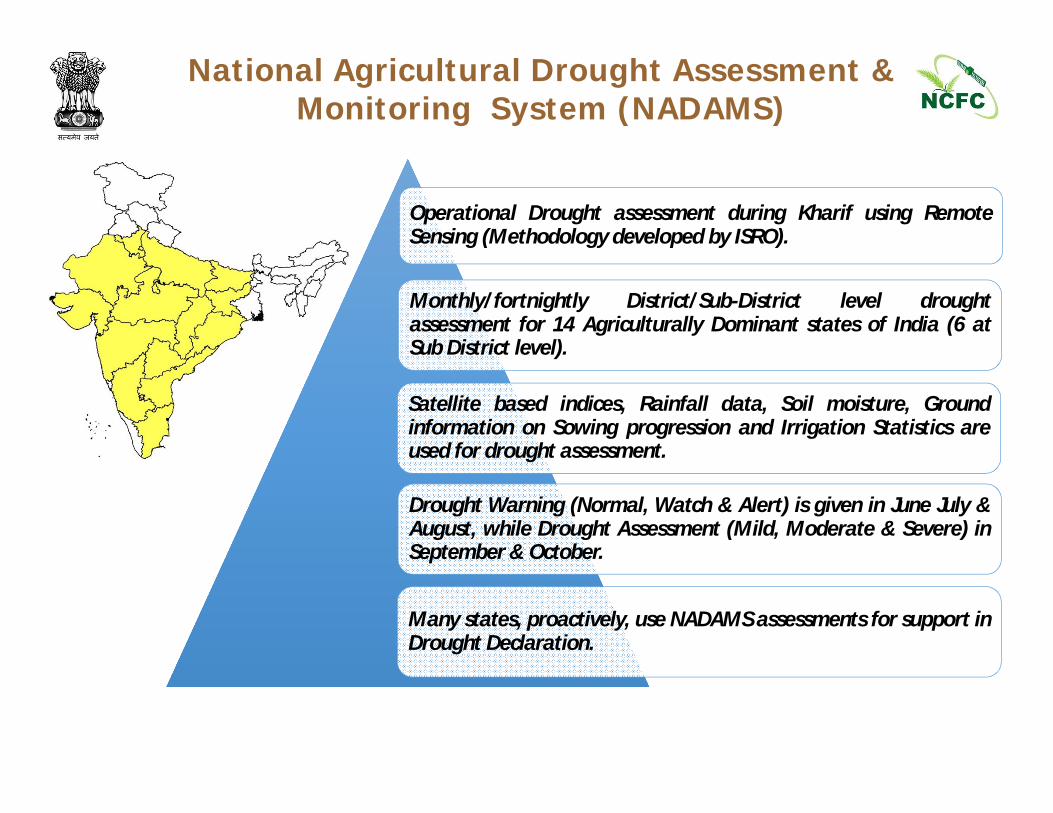
National Agricultural Drought Assessment & Monitoring System (NADAMS)
Operational Drought assessment during Kharif using RemoteSensing (Methodology developed by ISRO).
Monthly/fortnightly District/Sub-District level droughtassessment for 14 Agriculturally Dominant states of India (6 atSub District level).
Satellite based indices, Rainfall data, Soil moisture, Groundinformation on Sowing progression and Irrigation Statistics areused for drought assessment.
Drought Warning (Normal, Watch & Alert) is given in June July &August, while Drought Assessment (Mild, Moderate & Severe) inSeptember & October.
Many states, proactively, use NADAMS assessments for support inDrought Declaration.

Methodology
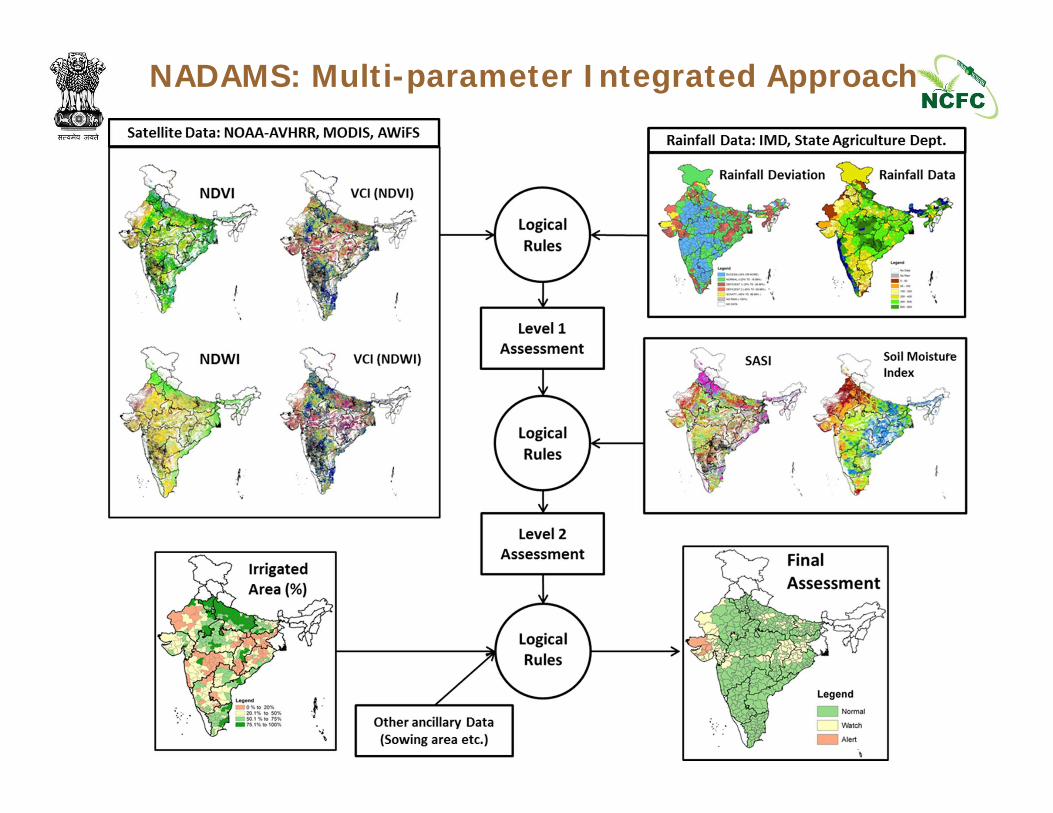
NADAMS: Multi-parameter Integrated Approach
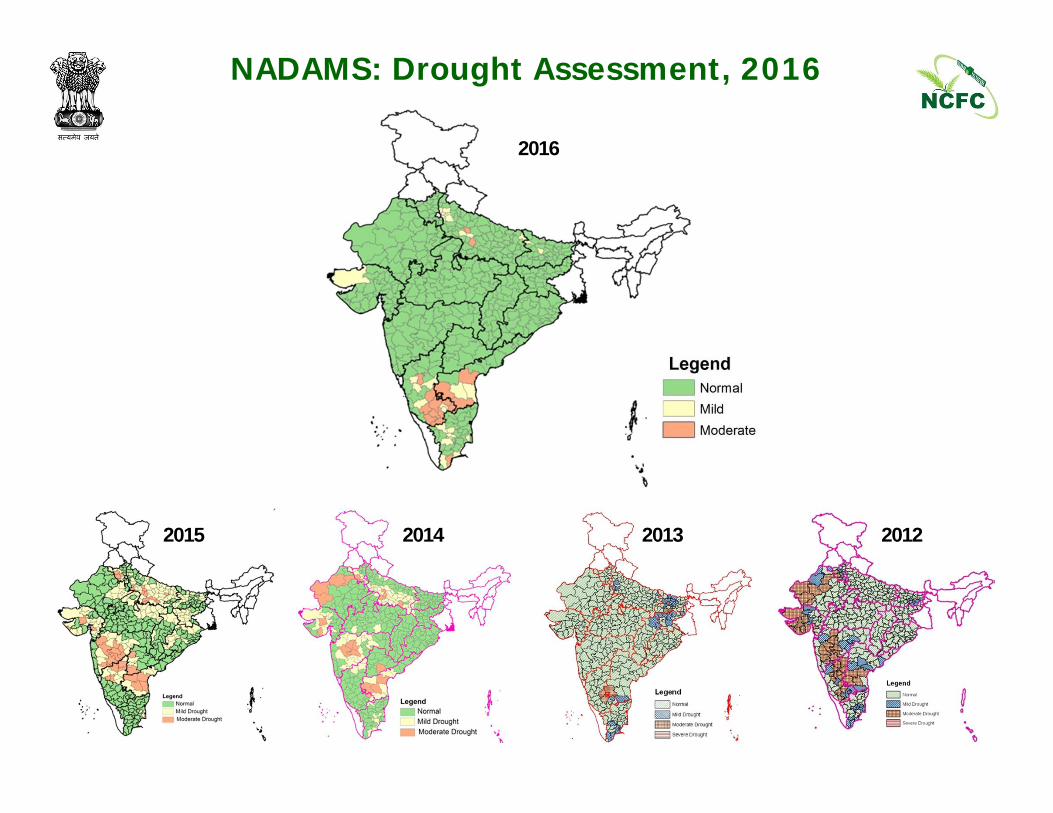
NADAMS: Drought Assessment, 2016
2015 2014 2013 2012
2016

Taluk level crop condition – Ahmadnagar districtNormal year (2010) and Drought year (2015)
September 2010September 2015
September 2010 September 2015
Karjat Taluk
Shri Gonda Taluk

Agricultural Drought situation in Maharashtra Kharif 2012
Crop area Affected by agriculturalDrought situation are showing lowerNDVI/NDWI compared to Normal, in2012 Kharif in Maharashtra State
NDVI Deviation
NDWI Deviation
Agriculture Drought Assessment Kharif 2012
Rainfall Kharif 2012
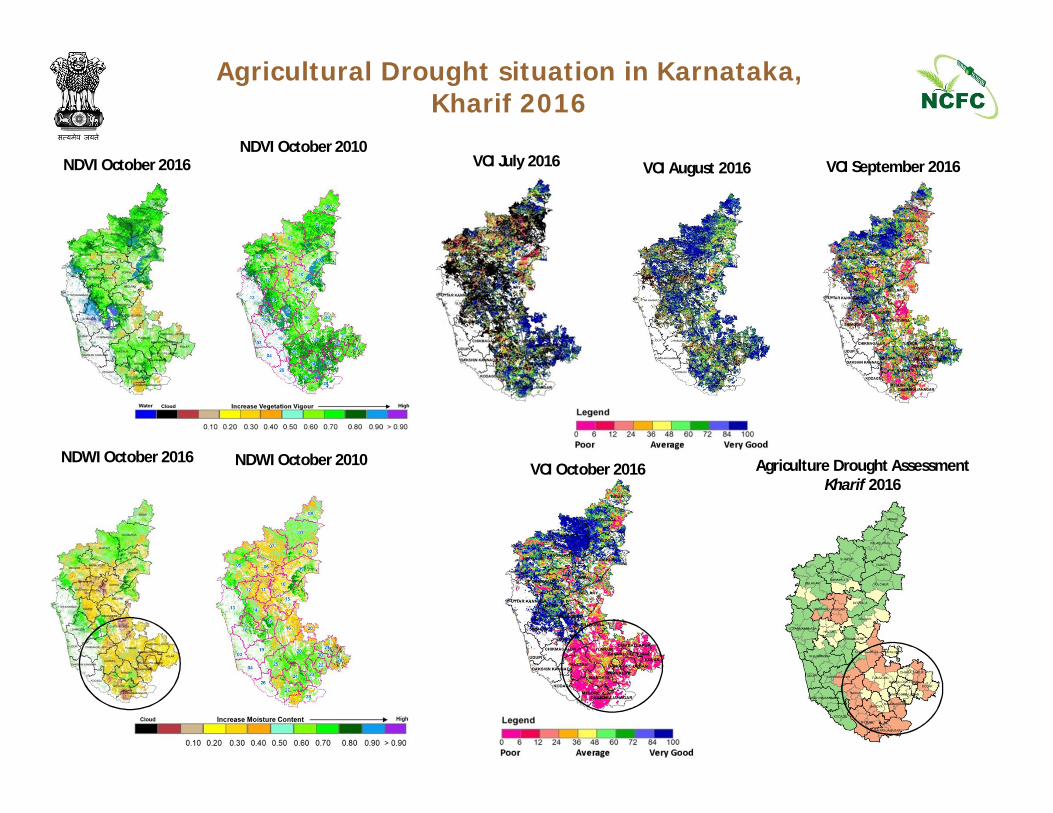
Agricultural Drought situation in Karnataka, Kharif 2016
VCI October 2016
VCI September 2016VCI August 2016VCI July 2016
Agriculture Drought Assessment Kharif 2016
NDVI October 2016NDVI October 2010
NDWI October 2016 NDWI October 2010

Usage of Drought Reports
Many States i.e Andhra Pradesh regularly uses MNCFC’s reports for Drought declaration in the State.

0%
20%
40%
60%
80%
100%
Matching %
2012
2013
2014
2015
Average
State 2012 2013 2014 2015 AverageAndhra Pradesh 77% 92% 85% 85% 85%Bihar 84% 50% 95% 61% 72%Chhattisgarh 100% 89% 100% 22% 78%Gujarat 77% 100% 65% 35% 69%Haryana 38% 100% 52% 43% 58%Jharkhand 100% 58% 96% 67% 80%Karnataka 83% 40% 80% 47% 63%Madhya Pradesh 100% 100% 94% 40% 84%Maharashtra 86% 97% 60% 74% 79%Odisha 100% 100% 100% 47% 87%Rajasthan 76% 12% 88% 30% 52%Tamilnadu 34% 84% 78% 91% 72%Telangana 80% 100% 90% 70% 85%Uttar Pradesh 100% 92% 72% 82% 86%Total 14 state 84% 79% 82% 58% 76%
Matching % No. of Cases< 50 % 11 (19.6%)
50 % -60 % 4 (7%)60 % -70 % 4 (7%)70 %- 80 % 7 (12.5%)80 % -90 % 11 (19.6%)90 % -100 % 19 (33.9%)
Total 56
Matching between State Declarations band NADAMS Assessments
Total 14 States , 4 years = 56 Cases

Drought frequency Maps Comparison

Vegetation Health Index (VHI)
VHI = 0.5*VCI + 0.5*TCI
Though the vegetation condition is very good in Northern and central states, there istemperature stress, thereby affecting overall vegetation health.
Vegetation Condition Index Temperature Condition Index
Agricultural Condition Assessment in Rabi Season(upto 16th Jan, 2017)
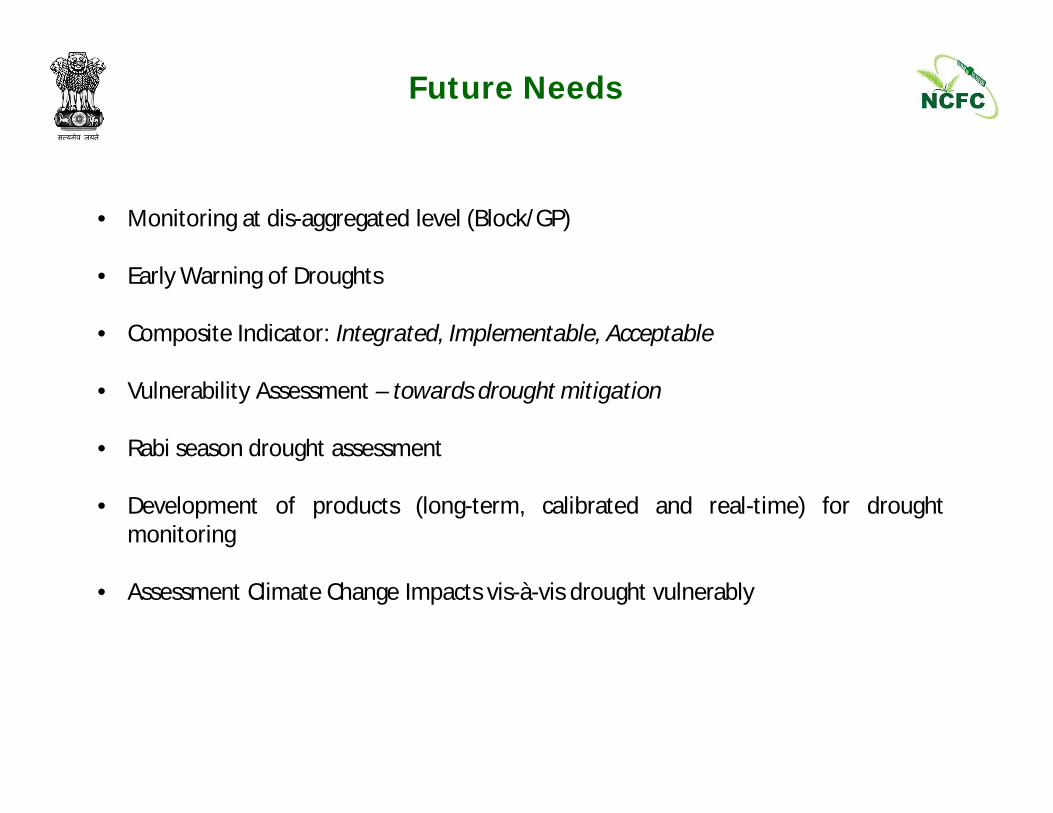
Future Needs
• Monitoring at dis-aggregated level (Block/GP)
• Early Warning of Droughts
• Composite Indicator: Integrated, Implementable, Acceptable
• Vulnerability Assessment – towards drought mitigation
• Rabi season drought assessment
• Development of products (long-term, calibrated and real-time) for droughtmonitoring
• Assessment Climate Change Impacts vis-à-vis drought vulnerably