Operation and Maintenance of VDI/VDE 3517, Process Control ... · by Dipl.-Ing (TH) Volker Teuchert...
41
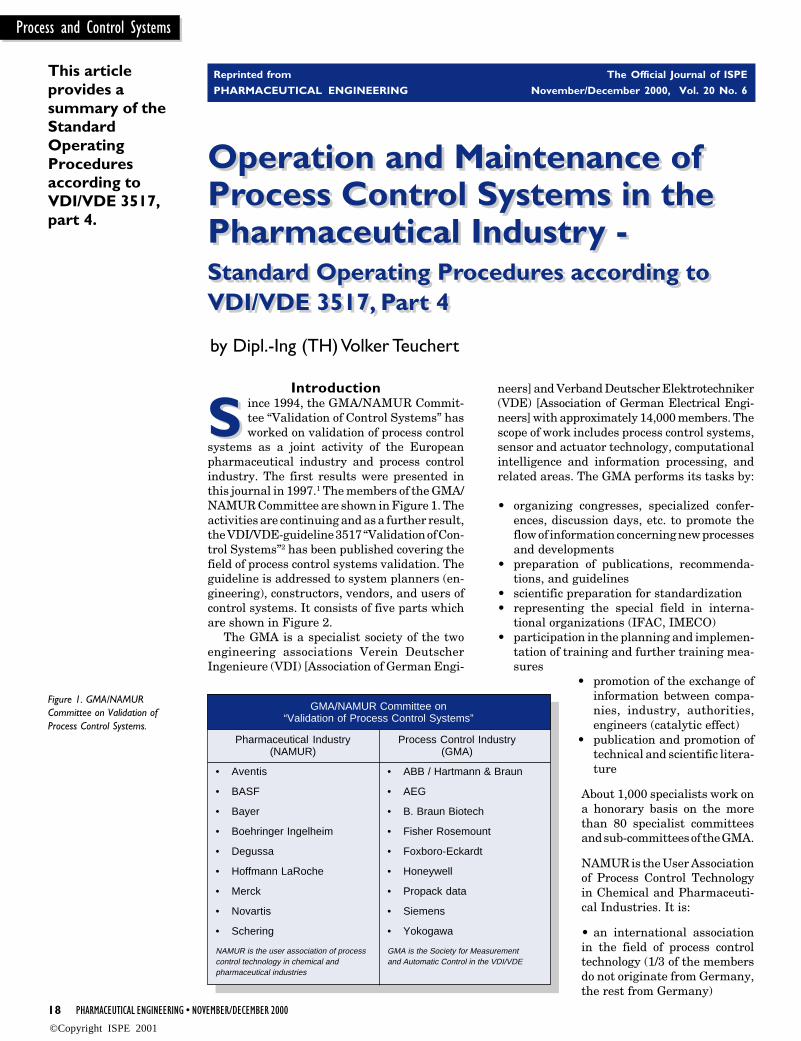
18 PHARMACEUTICAL ENGINEERING • NOVEMBER/DECEMBER 2000 Process and Control Systems Operation and Maintenance of Process Control Systems in the Pharmaceutical Industry - Standard Operating Procedures according to VDI/VDE 3517, Part 4 Operation and Maintenance of Process Control Systems in the Pharmaceutical Industry - Standard Operating Procedures according to VDI/VDE 3517, Part 4 S by Dipl.-Ing (TH) Volker Teuchert This article provides a summary of the Standard Operating Procedures according to VDI/VDE 3517, part 4. Introduction S ince 1994, the GMA/NAMUR Commit- tee “Validation of Control Systems” has worked on validation of process control systems as a joint activity of the European pharmaceutical industry and process control industry. The first results were presented in this journal in 1997. 1 The members of the GMA/ NAMUR Committee are shown in Figure 1. The activities are continuing and as a further result, the VDI/VDE-guideline 3517 “Validation of Con- trol Systems” 2 has been published covering the field of process control systems validation. The guideline is addressed to system planners (en- gineering), constructors, vendors, and users of control systems. It consists of five parts which are shown in Figure 2. The GMA is a specialist society of the two engineering associations Verein Deutscher Ingenieure (VDI) [Association of German Engi- Figure 1. GMA/NAMUR Committee on Validation of Process Control Systems. GMA/NAMUR Committee on “Validation of Process Control Systems” Pharmaceutical Industry (NAMUR) • Aventis • BASF • Bayer • Boehringer Ingelheim • Degussa • Hoffmann LaRoche • Merck • Novartis • Schering NAMUR is the user association of process control technology in chemical and pharmaceutical industries Process Control Industry (GMA) • ABB / Hartmann & Braun • AEG • B. Braun Biotech • Fisher Rosemount • Foxboro-Eckardt • Honeywell • Propack data • Siemens • Yokogawa GMA is the Society for Measurement and Automatic Control in the VDI/VDE neers] and Verband Deutscher Elektrotechniker (VDE) [Association of German Electrical Engi- neers] with approximately 14,000 members. The scope of work includes process control systems, sensor and actuator technology, computational intelligence and information processing, and related areas. The GMA performs its tasks by: • organizing congresses, specialized confer- ences, discussion days, etc. to promote the flow of information concerning new processes and developments • preparation of publications, recommenda- tions, and guidelines • scientific preparation for standardization • representing the special field in interna- tional organizations (IFAC, IMECO) • participation in the planning and implemen- tation of training and further training mea- sures • promotion of the exchange of information between compa- nies, industry, authorities, engineers (catalytic effect) • publication and promotion of technical and scientific litera- ture About 1,000 specialists work on a honorary basis on the more than 80 specialist committees and sub-committees of the GMA. NAMUR is the User Association of Process Control Technology in Chemical and Pharmaceuti- cal Industries. It is: • an international association in the field of process control technology (1/3 of the members do not originate from Germany, the rest from Germany) Reprinted from The Official Journal of ISPE PHARMACEUTICAL ENGINEERING November/December 2000, Vol. 20 No. 6 ©Copyright ISPE 2001
Transcript of Operation and Maintenance of VDI/VDE 3517, Process Control ... · by Dipl.-Ing (TH) Volker Teuchert...
18 PHARMACEUTICAL ENGINEERING • NOVEMBER/DECEMBER 2000
Process and Control Systems
Operation and Maintenance ofProcess Control Systems in thePharmaceutical Industry -Standard Operating Procedures according toVDI/VDE 3517, Part 4
Operation and Maintenance ofProcess Control Systems in thePharmaceutical Industry -Standard Operating Procedures according toVDI/VDE 3517, Part 4
S
by Dipl.-Ing (TH) Volker Teuchert
This articleprovides asummary of theStandardOperatingProceduresaccording toVDI/VDE 3517,part 4.
Introduction
S ince 1994, the GMA/NAMUR Commit-tee “Validation of Control Systems” hasworked on validation of process control
systems as a joint activity of the Europeanpharmaceutical industry and process controlindustry. The first results were presented inthis journal in 1997.1 The members of the GMA/NAMUR Committee are shown in Figure 1. Theactivities are continuing and as a further result,the VDI/VDE-guideline 3517 “Validation of Con-trol Systems”2 has been published covering thefield of process control systems validation. Theguideline is addressed to system planners (en-gineering), constructors, vendors, and users ofcontrol systems. It consists of five parts whichare shown in Figure 2.
The GMA is a specialist society of the twoengineering associations Verein DeutscherIngenieure (VDI) [Association of German Engi-
Figure 1. GMA/NAMURCommittee on Validation ofProcess Control Systems.
GMA/NAMUR Committee on“Validation of Process Control Systems”
Pharmaceutical Industry(NAMUR)
• Aventis
• BASF
• Bayer
• Boehringer Ingelheim
• Degussa
• Hoffmann LaRoche
• Merck
• Novartis
• Schering
NAMUR is the user association of processcontrol technology in chemical andpharmaceutical industries
Process Control Industry(GMA)
• ABB / Hartmann & Braun
• AEG
• B. Braun Biotech
• Fisher Rosemount
• Foxboro-Eckardt
• Honeywell
• Propack data
• Siemens
• Yokogawa
GMA is the Society for Measurementand Automatic Control in the VDI/VDE
neers] and Verband Deutscher Elektrotechniker(VDE) [Association of German Electrical Engi-neers] with approximately 14,000 members. Thescope of work includes process control systems,sensor and actuator technology, computationalintelligence and information processing, andrelated areas. The GMA performs its tasks by:
• organizing congresses, specialized confer-ences, discussion days, etc. to promote theflow of information concerning new processesand developments
• preparation of publications, recommenda-tions, and guidelines
• scientific preparation for standardization• representing the special field in interna-
tional organizations (IFAC, IMECO)• participation in the planning and implemen-
tation of training and further training mea-sures
• promotion of the exchange ofinformation between compa-nies, industry, authorities,engineers (catalytic effect)
• publication and promotion oftechnical and scientific litera-ture
About 1,000 specialists work ona honorary basis on the morethan 80 specialist committeesand sub-committees of the GMA.
NAMUR is the User Associationof Process Control Technologyin Chemical and Pharmaceuti-cal Industries. It is:
• an international associationin the field of process controltechnology (1/3 of the membersdo not originate from Germany,the rest from Germany)
Reprinted from The Official Journal of ISPE
PHARMACEUTICAL ENGINEERING November/December 2000, Vol. 20 No. 6
©Copyright ISPE 2001

NOVEMBER/DECEMBER 2000 • PHARMACEUTICAL ENGINEERING 19
Process and Control Systems
• a German speaking association (the working language isGerman, publications are in German, in some cases inEnglish)
• an association of users from the chemical and pharmaceu-tical industry as well as related branches of industry (rep-resentatives of vendors and public authorities are onlyallowed to participate in sessions as guests)
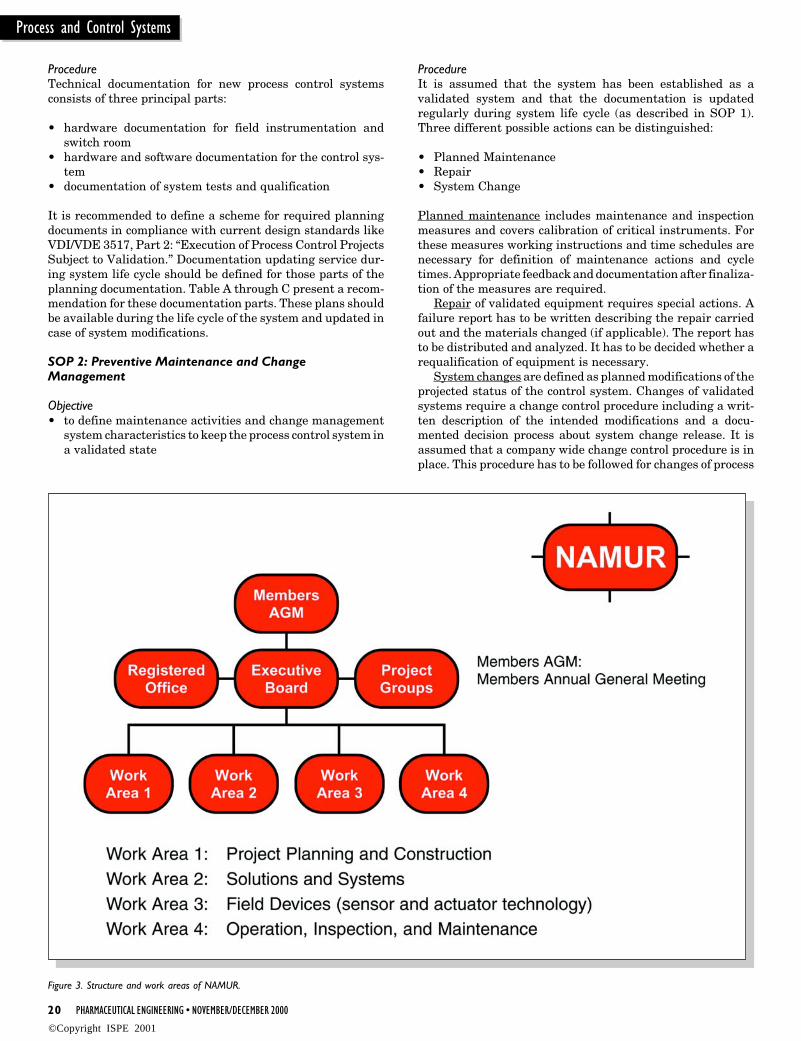
The main goal of NAMUR is to increase added value formember companies by exchanging experiences for the use ofinter-corporate synergies, adjusting requirements for furthertechnical development and influencing authorities, supervi-sion organizations, and standardization bodies in a coordi-nated manner. The actual NAMUR-structure and areas ofwork can be seen in Figure 3.
A close partnership between the GMA/NAMUR Committeeand the GAMP initiative on validation of computerized sys-tems has been established. The GMA/NAMUR guidelineshave been integrated into version 3 of the “GAMP-Guide forValidation of Automated Systems in Pharmaceutical Manu-facture”3 as examples for best practices. A preliminary versionof the VDI/VDE 3517, Part 4 on Operation and Maintenance ofvalidated process control systems in the Pharmaceutical In-dustry can be found here. This article provides a summary ofVDI/VDE 3517, part 4.
Guideline on Operation and Maintenance ofProcess Control Systems in the
Pharmaceutical IndustryStructureFor optimal applicability, the guideline is structured as a setof generic Standard Operating Procedures (SOPs). However,these SOPs should be adapted to project-specific or system-specific needs. For example:
• control system aspects may have to be integrated intogeneral purpose SOPs or existing, other company-specific,regulations
• the SOPs must be adjusted to reflect organizational re-sponsibilities in a company
• greater detail may have to be integrated into SOPs
The following 11 principal SOPs for control system operationand maintenance are included in VDI/VDE 3517, part 4:
SOP 1: Structuring and Updating the Process Control Docu-mentation
SOP 2: Preventive Maintenance and Change Management
SOP 3: Controlled Access and Access Rights for ProcessControl Systems
SOP 4: Software Backup and Software Archiving
SOP 5: Modem Operations
SOP 6: Audits
SOP 7: Risk Analysis
SOP 8: Requalification
SOP 9: Procedure for the Event of System Malfunctions andSystem Failures
SOP 10: Change of Release, Upgrade of Hardware, Update ofFirmware
SOP 11: Training
These SOPs are cross-referenced. Therefore, the cross-refer-ences should be observed when applying the SOPs to a specificproject or company. All SOPs are subdivided into the followingsections:
1. Scope
2. Objective
3. Procedure
4. Responsibilities
5. Documentation/Records
6. Review
7. Supplemental Documents
8. Abbreviations, Definitions
9. Attachments, Forms, Examples
In the following part of this article, a summary of objectivesand procedures of the 11 SOPs is given. It has to be taken intoaccount that the original paper goes into greater detail –additional flow charts, forms, examples, and tables can befound there. If VDI/VDE 3517, part 4 is used as guidance forcreation of SOPs, the original version should form the basis. Itis expected to publish the full version in English within thenext few months.
Standard Operating ProceduresSOP 1: Structuring and Updating the Process ControlDocumentation
ObjectiveTo determine structure and extent of and responsibility forcreation of documentation for new process control systems. Todetermine that part of documentation which has to be updatedduring system life cycle.
VDI/VDE-Guideline 3517: Validation of Control Systems
Part 1: Principles of Validation and Qualification of ControlSystems
Part 2: Execution of Process Control Projects subject toValidation
Part 3: Retrospective Validation
Part 4: Operation and Maintenance of Validated Systems(Ongoing Validation)
Part 5: Validation Support by Applications of Process ControlSystems (DCS/PLC)
Figure 2. VDI/VDE-Guideline 3517: Validation of Control Systems.
©Copyright ISPE 2001
20 PHARMACEUTICAL ENGINEERING • NOVEMBER/DECEMBER 2000
Process and Control Systems
ProcedureTechnical documentation for new process control systemsconsists of three principal parts:
• hardware documentation for field instrumentation andswitch room
• hardware and software documentation for the control sys-tem
• documentation of system tests and qualification
It is recommended to define a scheme for required planningdocuments in compliance with current design standards likeVDI/VDE 3517, Part 2: “Execution of Process Control ProjectsSubject to Validation.” Documentation updating service dur-ing system life cycle should be defined for those parts of theplanning documentation. Table A through C present a recom-mendation for these documentation parts. These plans shouldbe available during the life cycle of the system and updated incase of system modifications.
SOP 2: Preventive Maintenance and ChangeManagement
Objective• to define maintenance activities and change management
system characteristics to keep the process control system ina validated state
ProcedureIt is assumed that the system has been established as avalidated system and that the documentation is updatedregularly during system life cycle (as described in SOP 1).Three different possible actions can be distinguished:
• Planned Maintenance• Repair• System Change
Planned maintenance includes maintenance and inspectionmeasures and covers calibration of critical instruments. Forthese measures working instructions and time schedules arenecessary for definition of maintenance actions and cycletimes. Appropriate feedback and documentation after finaliza-tion of the measures are required.
Repair of validated equipment requires special actions. Afailure report has to be written describing the repair carriedout and the materials changed (if applicable). The report hasto be distributed and analyzed. It has to be decided whether arequalification of equipment is necessary.
System changes are defined as planned modifications of theprojected status of the control system. Changes of validatedsystems require a change control procedure including a writ-ten description of the intended modifications and a docu-mented decision process about system change release. It isassumed that a company wide change control procedure is inplace. This procedure has to be followed for changes of process
Figure 3. Structure and work areas of NAMUR.
©Copyright ISPE 2001

NOVEMBER/DECEMBER 2000 • PHARMACEUTICAL ENGINEERING 21
Process and Control Systems
DOCUMENT
User requirements specification
Control system architecture
Supplier´s documentation on system standard software(operating system, firmware, configuration tools...)
Supplier´s documentation on system hardware
Supplier´s manuals for system service
Software structure plan
Documentation of equipment modules, control modules,typicals
Function plans, documentation of automatic locking
Documentation of sequential control
Documentation of recipe structure
Documentation of records (incl. batch records)
Realization of system access rights
Realization of software archiving
Operator manuals
Table B. Hardware and software documentation for the control system.
Table C. Documentation of system tests and qualification.
Test plans Hardware and Software
Test protocols Hardware and Software
Protocol of finalization of assembly check
IQ test plan
OQ test plan
IQ protocol
OQ protocol
Protocols of requalification tests
Table A. Hardware documentation for field instrumentation and switch room.
DOCUMENT
P+I flow charts
Loop list
List of quality relevant loops
Instrument specifications and certificates
Loop sheets
Loop function sheets
Load list
Circuit list
Package unit documentation
Field instrumentation documentation
Service cabinet documentation
Wiring list
Power supply scheme
Switch room documentation
control systems. Figure 4 shows an example for planning andexecution of system changes.
SOP 3: Controlled Access and Access Rights for ProcessControl Systems
Objective• to avoid unauthorized operation and maintenance actions
on validated control systems
ProcedureControlled access to process control systems is supportedeffectively by current system technologies. Thus, in modernplants, the access can be arranged by control system functions.A personal identification can be defined and is supervised bythe system. Dedicated functions are connected to differentpersonal identifications. User groups with similar qualifica-tions and tasks should be combined to common access profilesto make access management more transparent.
Existing plants may be equipped with control systems thatdo not carry these features. In these cases, it is possible toensure controlled system access by structural or organiza-tional measures (controlled physical access to control rooms).
SOP 4: Software Backup and Software Archiving
ObjectiveTo establish methods for software backup and softwarearchiving (data and programs) of process control systems.Note: Software backup means short-time protection againstphysical loss or inadvertent deletion, archiving means long-term protection of data and programs on an external datacarrier; archived software can be deleted from the originalsystem.
ProcedureData of a process control system are:• Raw Data• Evaluated Data
Programs of a process control system are:• System Software (Operating System, Firmware, Configu-
ration Tools)• Application-Specific Programs.
1. Data BackupData usually are backed-up automatically by the processcontrol system, e.g. on hard disks. If necessary, the hard diskscan be designed redundant or mirrowed. Additional cyclicbackup of data on external media may be recommendable.Data backup can be limited to cGMP-relevant data.
2. Data ArchivingData archiving assures the availability of cGMP-relevant dataduring the legally required period of time, e.g. 10 years afterrelease of product. Data are being archived on an external datacarrier and have to be checked regularly for correctness. It maybe advantageous to copy data on this occasion to a new datacarrier. The following items need to be defined:
• responsibility for applications for and execution of dataarchiving
• type and labelling of data carrier
©Copyright ISPE 2001

22 PHARMACEUTICAL ENGINEERING • NOVEMBER/DECEMBER 2000
Process and Control Systems
Figure 4. Flow chart for system changes.
©Copyright ISPE 2001

NOVEMBER/DECEMBER 2000 • PHARMACEUTICAL ENGINEERING 23
Process and Control Systems
• software used for archiving and data format• software and hardware necessary for data reading and
printing• storage conditions and storage place for data carrier• responsibility for maintenance of archiving conditions• archiving period• checking method for archived data
3. Backup and Archiving of ProgramsBackup of programs is carried out to guarantee availability ofthe latest program version in case of system failures (e.g.memory failures), or in case of malfunctions in the controlledplant as a result of programming errors in the application-specific software. It is recommended to backup programs on acyclic basis, e.g. once a year, or after every program modifica-tion (in the latter case, incremental backup of the modifiedcode part is sufficient). Programs are backed-up on externaldata carriers twice, if possible. The backup copies are to bestored at different places in different fire-risk areas. Programbackup has to be performed up to the end of the system’s lifecycle. In exceptional cases, it may be necessary to store thelatest program version even longer for analysis and assess-ment of archived data (recipes, batch control, etc.). In thesecases, the program versions need to be handled and archivedlike data.
SOP 5: Modem Operations
Objective• to protect data communication with process control systems
via public networks for the purpose of remote troubledetection and system service
ProcedureSystem access, data exchange, and finalization of communica-tion have to be controlled.
By access control, it needs to be assured that no unallowedcallers be able to enter data or programs of the process controlsystem during usage of remote service lines. This can beachieved by different measures, e.g. call-back modems and/orinstallation of modems in access-controlled areas.
Start-up of data exchange needs to be released by autho-rized personnel of the control system operating company. Theidentification of the external communication partner has to bechecked and the modem interface must be compatible to theprocess control system. Upon fulfillment of these conditions,transparent data exchange normally will be guaranteed.
After completion of modem operation, a controlled connec-tion clear-down needs to be performed.
SOP 6: Audits
Objective• to ensure the required reproducible quality of internal and
external suppliers by means of audits on the field of processcontrol technology
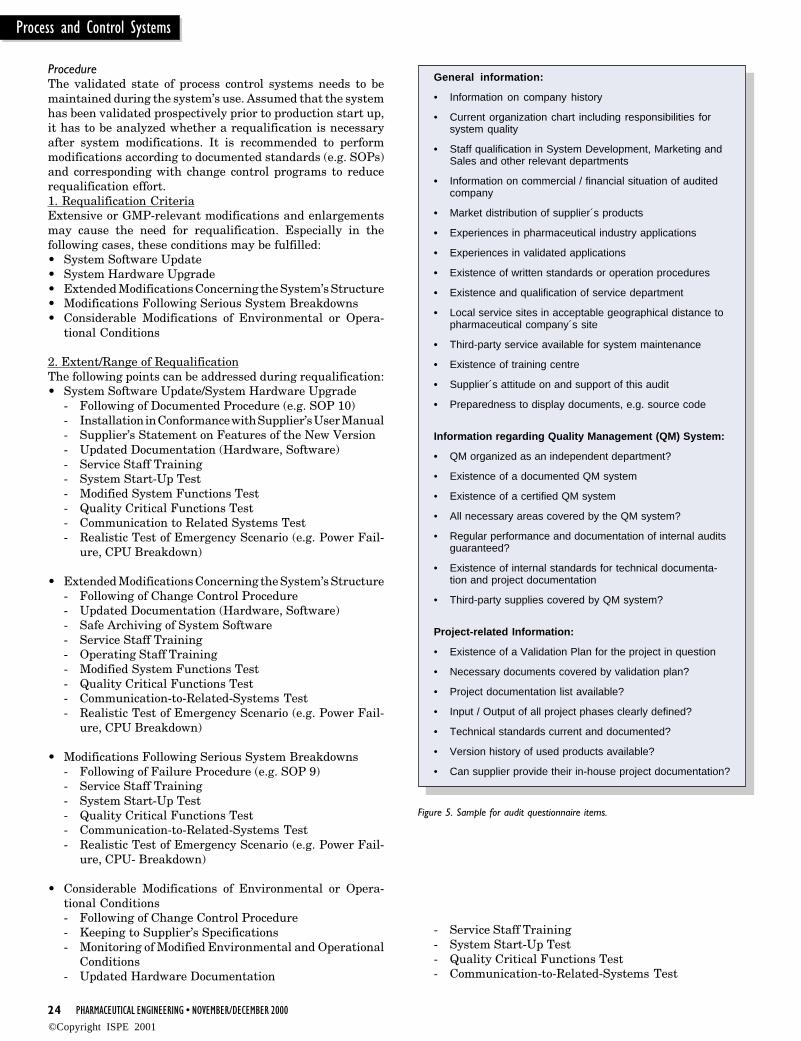
ProcedureAn audit should be performed by an internal audit teammainly representing Engineering, Quality Assurance, andProduction Departments. As an introduction, a questionnaireshould be prepared and sent to the audited supplier. A writtenanswer to this questionnaire is expected. A sample for typicalquestionnaire items can be found in Figure 5, an example foran audit flow chart in Figure 6.
After evaluation of the completed questionnaire, it has to bedecided whether a local audit at the supplier’s site needs to beperformed and which areas are to be looked at closer during thefollowing parts of the audit.
In the audit report, a summary of the final results can befound. Be it necessary, correction measures should be checkedby adequate means, e.g. self-declaration or a repeated audit.
SOP 7: Risk Analysis
Objective• to identify quality relevant functions of a process control
system, including control loops and further functions likebatch records, data records, dosage control etc.
Procedure1. Risk Determination and ClassificationAt the beginning of the process, those risks that may impactquality attributes of the product will be determined. In thisphase, not only process control system-based risks are beinganalyzed, but also risks caused by process, plant, operatingconditions, or operator actions. The identified risks are beingclassified in an appropriate way. The classification forms thebasis of the effort to risk management.
2. Risk ManagementMeasures of risk management will be analyzed and defined.These include process or plant modifications or additionalorganizational measures for plant operation. With respect toprocess control technology, the following measures are suit-able for quality-related risk management (examples):
• redundant design of process control equipment and/or soft-wareFor fault determination, usually double copies are suffi-cient, for automatic fault correction, triplicate copies arenecessary.
• implementation of plausibility checks into control systemsoftware (e.g. watchdog timers)
• integration of quality-relevant control loops into arecalibration program
For quality related risk management, all those measures thatare used for ensuring plant safety are suitable.
3. DocumentationIt is recommendable to carefully document the results of thequality risk analysis. The documentation can be structured asfollows:
• list of identified risks• risk classification• measures for risk management• list of quality-relevant functions of the process control
system, including calibration-relevant control loops, redun-dancy determinations, plausibility checks, and further de-terminations
SOP 8: Requalification
Objective• to define criteria for process control system requalification
including recommendations for scope and execution
©Copyright ISPE 2001
24 PHARMACEUTICAL ENGINEERING • NOVEMBER/DECEMBER 2000
Process and Control Systems
General information:
• Information on company history
• Current organization chart including responsibilities forsystem quality
• Staff qualification in System Development, Marketing andSales and other relevant departments
• Information on commercial / financial situation of auditedcompany
• Market distribution of supplier´s products
• Experiences in pharmaceutical industry applications
• Experiences in validated applications
• Existence of written standards or operation procedures
• Existence and qualification of service department
• Local service sites in acceptable geographical distance topharmaceutical company´s site
• Third-party service available for system maintenance
• Existence of training centre
• Supplier´s attitude on and support of this audit
• Preparedness to display documents, e.g. source code
Information regarding Quality Management (QM) System:
• QM organized as an independent department?
• Existence of a documented QM system
• Existence of a certified QM system
• All necessary areas covered by the QM system?
• Regular performance and documentation of internal auditsguaranteed?
• Existence of internal standards for technical documenta-tion and project documentation
• Third-party supplies covered by QM system?
Project-related Information:
• Existence of a Validation Plan for the project in question
• Necessary documents covered by validation plan?
• Project documentation list available?
• Input / Output of all project phases clearly defined?
• Technical standards current and documented?
• Version history of used products available?
• Can supplier provide their in-house project documentation?
Figure 5. Sample for audit questionnaire items.
ProcedureThe validated state of process control systems needs to bemaintained during the system’s use. Assumed that the systemhas been validated prospectively prior to production start up,it has to be analyzed whether a requalification is necessaryafter system modifications. It is recommended to performmodifications according to documented standards (e.g. SOPs)and corresponding with change control programs to reducerequalification effort.1. Requalification CriteriaExtensive or GMP-relevant modifications and enlargementsmay cause the need for requalification. Especially in thefollowing cases, these conditions may be fulfilled:• System Software Update• System Hardware Upgrade• Extended Modifications Concerning the System’s Structure• Modifications Following Serious System Breakdowns• Considerable Modifications of Environmental or Opera-
tional Conditions
2. Extent/Range of RequalificationThe following points can be addressed during requalification:• System Software Update/System Hardware Upgrade
- Following of Documented Procedure (e.g. SOP 10)- Installation in Conformance with Supplier’s User Manual- Supplier’s Statement on Features of the New Version- Updated Documentation (Hardware, Software)- Service Staff Training- System Start-Up Test- Modified System Functions Test- Quality Critical Functions Test- Communication to Related Systems Test- Realistic Test of Emergency Scenario (e.g. Power Fail-
ure, CPU Breakdown)
• Extended Modifications Concerning the System’s Structure- Following of Change Control Procedure- Updated Documentation (Hardware, Software)- Safe Archiving of System Software- Service Staff Training- Operating Staff Training- Modified System Functions Test- Quality Critical Functions Test- Communication-to-Related-Systems Test- Realistic Test of Emergency Scenario (e.g. Power Fail-
ure, CPU Breakdown)
• Modifications Following Serious System Breakdowns- Following of Failure Procedure (e.g. SOP 9)- Service Staff Training- System Start-Up Test- Quality Critical Functions Test- Communication-to-Related-Systems Test- Realistic Test of Emergency Scenario (e.g. Power Fail-
ure, CPU- Breakdown)
• Considerable Modifications of Environmental or Opera-tional Conditions- Following of Change Control Procedure- Keeping to Supplier’s Specifications- Monitoring of Modified Environmental and Operational
Conditions- Updated Hardware Documentation
- Service Staff Training- System Start-Up Test- Quality Critical Functions Test- Communication-to-Related-Systems Test
©Copyright ISPE 2001

NOVEMBER/DECEMBER 2000 • PHARMACEUTICAL ENGINEERING 25
Process and Control Systems
Figure 6. Example for an audit flow chart.
©Copyright ISPE 2001

26 PHARMACEUTICAL ENGINEERING • NOVEMBER/DECEMBER 2000
Process and Control Systems
SOP 9: Procedure for the Event of System Malfunctionsand System Failures
Objective• to define strategies and measures for systematic detection,
classification, mastering, and documentation of failuresand malfunctions of process control system components
ProcedureThe following principal steps are being passed:
1. Fault Detection and IdentificationFault detection and identification can be supported effectivelyby self-diagnosis tools of process control systems. Failures thatare not detected by these tools have to be identified by trainedpersonnel.
2. ClassificationFault classification shall support a quick evaluation of pos-sible consequences. Examples for criteria are:• Hardware/Software Failure?• Critical/Not Critical Fault ?• Consequences for Process, Personnel, Environment or Batch
Release ?
Further criteria may be added in correspondence with existingalert plans.
3. Fault MasteringIn this part, only immediate actions are described. These caninclude:
• Reduced Operation- Manual or Semi-Manual Operation of Plant- Fault Treatment Delay to a Later Point of Time
• Immediate Fault Clearance Actions During Running Opera-tion- Switchover to Redundant Systems- Switchover to Emergency Power Supply
• System Restart- Observing Start-Up Sequence
• Initiation of Repair- Initiation of Immediate Repair- Feeding in of Backups- Exchange of Components
4. DocumentationAll activities are documented in the system logbook or byanother appropriate documentation system.
SOP 10: Change of Release, Upgrade of Hardware,Update of Firmware
Objective• to keep the validated status of the process control system inaccordance with release changes, hardware upgrades, andfirmware updates
ProcedureChanges of the system software and standard hardware arecovered. Application-related changes are controlled by SOP 1:“Preventive Maintenance and Change Management.”
Release changes (including software patches), updates, andupgrades have to be performed in compliance with servicerecommendations of the manufacturers. It has to be observed:
• if they can be carried out during operation of the processcontrol system, or if a system shutdown is necessary, and
• if application-related software has to be modified (in thiscase, an independent development system should be used,or an appropriate system shutdown has to be scheduled).
In all cases, detailed information by the system supplier has tobe provided and analyzed. Figure 7 shows typical supplier’sinformation for support of release changes, firmware update,and hardware upgrade.
SOP 11: Training
Objective• to ensure the appropriate information and training status
on process control technology for staff involved in systemdesign and operation
ProcedureDefinition of qualification profiles for operators, project engi-neers, maintenance staff, external personnel, and key person-nel. It is recommendable to set up qualification programs for
Figure 7. Recommended information for release changes, software updates, andhardware upgrades.
Information supporting release changes and firmwareupdates:
• Hardware requirements for new software version
• Description of all new features
• Description of corrected failures
• Confirmation
• Confirmation of compatibility with predecessor-version andwith non-updated parts of firmware
• Confirmation of compatibility with application-relatedsoftware indication of those parts of the application-relatedsoftware that have to be checked after firmware updateespecially
• Confirmation of compatibility with archived and backed updata formats (if necessary indication of data formatconversion)
• Installation manual
Information supporting hardware upgrades:
• Description of all new features
• Description of corrected failures and function restrictions
• Confirmation of compatibility with predecessor-componentand with non-upgraded parts of hardware
• Installation manual
• Updated standard documentation of hardware
©Copyright ISPE 2001

NOVEMBER/DECEMBER 2000 • PHARMACEUTICAL ENGINEERING 27
Process and Control Systems
the different groups of people and document the training activi-ties.
Summary and OutlookA set of 11 generic SOPs for operation and maintenance ofprocess control systems in the pharmaceutical industry ispresented in this article. These SOPs are the outcome of aEuropean joint committee “Validation of Control Systems.”According to the committee, the subjects dealt with in theseSOPs should be covered for process control systems in thepharmaceutical production. However, it is possible that com-pany or project specific additional aspects have to be handledor aspects can be omitted. If, for instance, change controlmanagement, document management, or requalification arecontrolled by existing regulations, there is no need for specificprocess control SOPs. Complete information can be found inthe original version of VDI/VDE 3517, part 4 that will bepublished in English.
The complete guideline VDI/VDE 35172 is a first importantresult of the work of the GMA/NAMUR Committee. The guide-line is being used in practical business; members of thecommittee are reporting regularly on current applications, e.g.on ISPE/GAMP3-seminars in Zürich and Amsterdam (1999)and in Zürich (2000). The further direction of the committee’swork is being discussed intensively at present. Topics ofinterest include the validation of control systems in packageunits, the validation of manufacturing execution systems(MES) or GMP requirements of asset management tools andCAE systems.
References1. Dannapel, B. et.al.: Validation of Control Systems: A JointEffort of GMA and NAMUR, Pharmaceutical Engineering 17(2), pp. 76-92, ISPE 1997.
2. VDI/VDE guideline 3517: Validation of Control Systems,VDI/VDE(GMA) 1998 (ongoing).
3. GAMP Guide for Validation of Automated Systems in Phar-maceutical Manufacture, Volume 2: Best Practice for Users andSuppliers Version: V3.0, GAMP Forum 1998.
AcknowledgementsThe author wishes to thank all members of the GMA/NAMURCommittee “Validation of Control Systems” for their contribu-tions to the presented guideline. Especially he wishes to thankhis colleagues of the editorial committee for their valuablesupport: Dr. Manfred Brombacher (of Bayer AG), Dipl.-Ing.Bruno Dannapel (of Bayer AG), Prof. Dr. Hartmut Hensel (ofUniversity of Applied Sciences Harz), Dipl.-Ing. Wilfried Kappel(of B. Braun Biotech), Dr. Bernd Möckel (of Schering AG), Dr.Thomas Müller-Heinzerling (of Siemens AG) and Dr. AndreasOtto (of Schering AG).
About the AuthorDipl.-Ing. Volker Teuchert is the Director of Plant Engi-neering at Aventis Behring GmbH. In this position, he isresponsible for engineering services, maintenance, and criti-cal systems’ operation of Aventis Behring’s plasma proteinresearch and manufacturing site in Marburg/Germany.Teuchert studied physics and engineering at different univer-sities and holds a degree as Diplom-Ingenieur in mechanicalengineering from Technische Hochschule Aachen (Germany).He is a member of VDI(GMA) and ISPE and is representingAventis Behring GmbH in the NAMUR. Teuchert works in theGMA/NAMUR joint committee “Validation of Control Sys-tems”.
Aventis Behring GmbH, Postfach 1230, 35002 Marburg,Germany. [email protected]
©Copyright ISPE 2001

50 PHARMACEUTICAL ENGINEERING • NOVEMBER/DECEMBER 2000
Fluid Bed Spray Drying
Fluid Bed Spray Drying of aProtein Formulation - A Case StudyA Possible Alternative to Spray Drying and FreezeDrying for Production of Solid Dosage Forms
Fluid Bed Spray Drying of aProtein Formulation - A Case StudyA Possible Alternative to Spray Drying and FreezeDrying for Production of Solid Dosage Forms
T
by Orapin Rubino
This articleaddresses a casestudy of thedevelopment of afluid bed spraydrying processfor a protein foragricultural uses.
Introduction
T he trend in the pharmaceuti-cal and
chemical industries in recent years hasbeen toward the use of biological mol-
ecules. Advances in molecular biology, analyti-cal and separation techniques have led to sig-nificant advancements in uses of proteins andbiological products in the agricultural (such asfertilizers, insecticides, or fungicides), pharma-ceutical, and other industries. Proteins also arewidely used in the food industry. Some ex-amples include dairy products such as milk,baby formulas, and nutritional supplements.
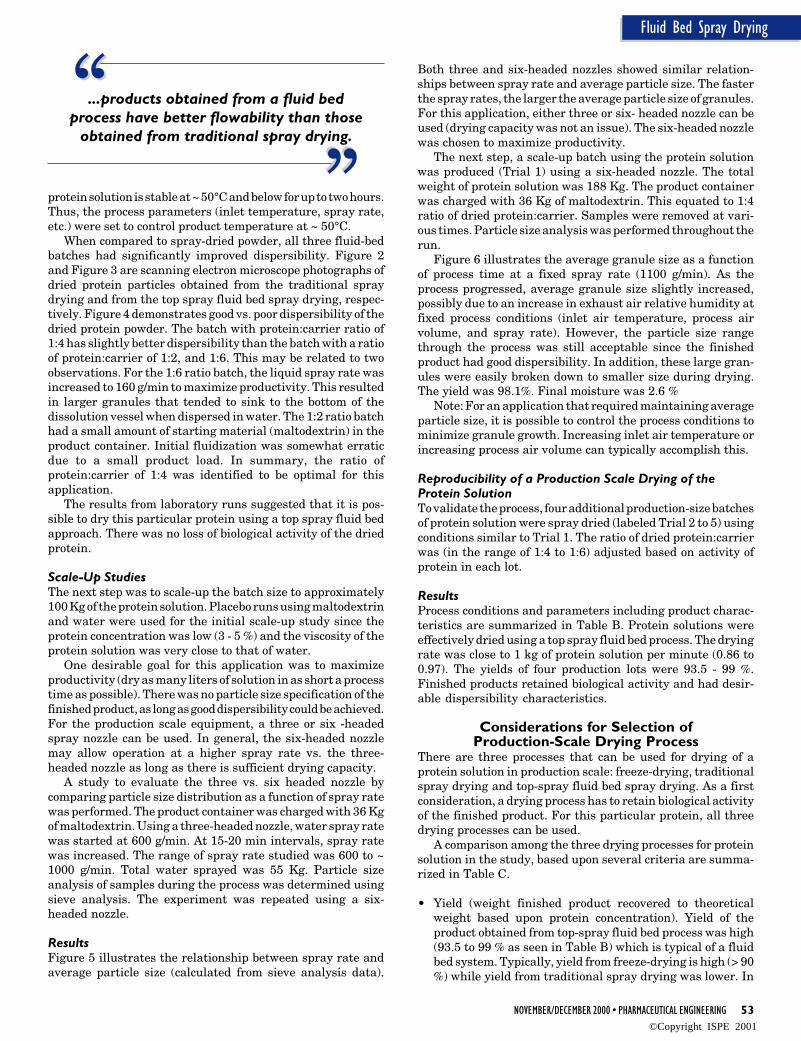
This article addresses a case study of thedevelopment of a fluid bed spray drying processfor a protein for agricultural uses. The proteinin this study was dried using freeze drying andtraditional spray drying process initially; how-ever, the dried protein obtained from spraydrying exhibited poor dispersion characteris-
tics. Dispersibility is the ability of dried productto get wetted throughout and dissolved in water.It is an important characteristic for applicationswhere the finished product is mixed with waterat point of use. Examples of products that re-quire good dispersibility include milk and milkproducts, instant drink mixes, and dried medi-cation powders. For this particular product, gooddispersibility is required because the users needto disperse and dissolve the product in waterbefore applying the product to the plants. Thefreeze-drying of this particular protein also wasperformed on a small scale. However, the cost ofthe freeze-drying process was too high for com-mercial production of this product. The fluid bedspray drying process was investigated to deter-mine the feasibility of drying and agglomerationof powders to achieve desirable dispersibility atreasonable manufacturing cost while maintain-ing biological activity.
Figure 1. A schematic diagramof a typical spray dryer and atop spray fluid bed dryer.
Reprinted from The Official Journal of ISPE
PHARMACEUTICAL ENGINEERING November/December 2000, Vol. 20 No. 6
©Copyright ISPE 2001

NOVEMBER/DECEMBER 2000 • PHARMACEUTICAL ENGINEERING 51
Fluid Bed Spray Drying
The development of a formulation and process scale-up of aprotein solution from a lab scale (< 400 g) to a production scale(> 100 Kg) is discussed. The desirable product characteristicsinclude good dispersibility, low moisture content (~ 2 - 3 %),and good flowability. A comparison between fluid bed spraydrying and traditional spray drying also is reviewed. Finally,an evaluation of three drying processes (top spray fluid bedspray drying, traditional spray drying and freeze-drying) in-cluding operating cost, capital cost, and product quality also ispresented. The focus of the comparison of the three dryingmethods of proteins was for solid dosage forms.
Protein molecules are composed of several amino acids in aspecific sequence.1 In solution, protein molecules are in certainconformation (folding) stages. The folding of a protein mol-ecule is responsible for its stability in solution. High tempera-tures can cause proteins to unfold, expose hydrophobic groupsand form aggregates or precipitates. This phenomenon iscalled thermal denaturation.2 The temperature of denatur-ation (Td) of a specific protein in solution can be determinedusing a simple capillary melting point device to look for a“cloud point” or via a more sophisticated thermal analyticaldevice such as a differential scanning calorimeter (DSC).Proteins are generally more stable in a dried or solid form thanin liquid form.1,2
Traditionally, proteins are dried by freeze-drying.3-6 Freeze-drying has been used mainly in the pharmaceutical industry toproduce proteins for parenterals. The freeze-drying processhas been long recognized as a “safe” process for drying ofproteins, especially those that have low Td. The main disad-vantages of freeze drying are the high capital and operationcost. A typical freeze drying cycle of a protein solution can beas long as several days. Protein formulations and processconditions during freeze-drying can play an important role instability of the finished products.5,6
Spray drying of proteins has been used as an alternative tofreeze-drying, especially in the food industry for the drying ofdairy products. In some cases, protein denaturation during thespray drying process has been reported.7,8 Protein denatur-ation in a fluid bed processor also was reported.9 Each proteinhas a unique amino acid sequence and has a unique conforma-tion. Thermal denaturation and shear denaturation are prob-ably the two main degradation pathways during spray drying
or fluid bed drying. For proteins that have some heat and shearstability, selecting optimal process conditions that minimizethe denaturation are a key to achieving success in spray dryingor fluid bed drying of a particular protein solution.
Traditional spray drying is known to have low thermalefficiency. Thermal efficiency is defined as the fraction of totalheat supplied to the dryer used in the evaporation process.Overall thermal efficiency increases when inlet air tempera-ture increases for fixed outlet and ambient conditions.10 Typi-cally, a spray drying process requires a high inlet air tempera-ture, in many cases exceeding 200°C10,11 to improve thermalefficiency. The product temperature during processing is lowerthan the inlet temperature due to evaporative cooling. Resi-dence time in a spray dryer is short, in the order of 5-100 sec.10
However, the chance for thermal denaturation of a proteincould be a concern when operating at an extremely high inlettemperature.
Fluid bed processes operate on the principle of air suspen-sion of particles using high operating air volume. Therefore,thermal efficiency of a fluid bed process is significantly higherthan that of a spray drying process due to dynamic heat andmass transfer of the fluid bed process. Typical inlet air tem-peratures of fluid bed processing are below 100°C, which issignificantly lower than typical inlet air temperature of spraydrying.
In general, powders obtained from a traditional spraydrying process are small and have poor flowability.12,13 A postdrying agglomeration step is often required for gooddispersability. Masters10 described several layouts of two-stage spray/fluid bed drying systems to overcome the disad-vantages of a traditional spray dryer as compared to fluid bed.However, such a two-stage system tends to be more costly thana simple fluid bed system.
A top spray fluid bed process has been widely used foragglomeration, granulation, or coating of particles in variousindustries for more than 30 years.14-17 An instantizing processis an agglomeration process that uses water as the sprayingmedium. It is a process that is generally utilized to achievegood dispersibility of powders.18 A fluid bed spray dryingprocess is a combination of spray drying and an agglomerationprocess using air suspension technology.
Figure 1 shows a schematic diagram of air and material flow
Figure 2. Scanning Electron Micrograph of dried protein particles obtained from atraditional spray drying process.
Figure 3. Scanning Electron Micrograph of dried protein particles obtained from atop spray fluid bed spray drying process.
©Copyright ISPE 2001

quantity of the finished product in order to obtain an effectivedosage of protein. It is necessary to determine an optimal ratioof protein to seed material for a particular application (toachieve good dispersibility at high productivity). In the presentstudy, the ratio of protein to seed material was varied from 1:2to 1: 6.
ResultsTable A summarizes the conditions and process parametersused for three batches of product at the ratio of protein to seedmaterial of 1:2; 1:4; 1:6. Preliminary data showed that the
Figure 4. Dispersibility of the protein powders produced by spray drying (left)compared to the protein powders prepared by fluid bed spray drying process(right).
through a typical spray dryer and a top spray fluid bed dryer.There are variations in spray dryer models that can offerdifferent air flow pattern and spray nozzle position.10 One mainadvantage of a fluid bed dryer over a traditional spray dryer isability to further dry the product to a certain moisture level.For a fluid bed process, product is fluidized and remained inthe chamber. For a spray dryer, product is removed from thedrying chamber to cyclone for collection.
The characteristics of granules prepared using a fluid bedprocess are loose and porous, which also allows for gooddissolution. In addition, products obtained from a fluid bedprocess are generally larger in size and have better dispersibilityand flowability when compared to those obtained from atraditional spray drying process.
Development of a Fluid-BedSpray Drying Process
Feasibility StudiesThe protein solution in this study was purified using conven-tional protein separation methods. The molecular weight wasabout 40 KD. The final solution contains 3 - 5 % protein (driedweight). The dispersibility of finished product is a desirablecharacteristic. Traditional spray-drying of this protein solu-tion resulted in a powder that had poor dispersibility. The fluidbed process was evaluated because of its ability to improvedispersibility of products through agglomeration or granula-tion of powders.
Incorporation of “Seed” MaterialIn general, formulations of proteins contain some stabilizers.Sugars, especially di-saccharides, have been used to stabilizeproteins in solution.6 Using sugars or other inert materials as“seed” materials allows the initial stage of the fluid bed spraydrying process to occur relatively fast. Maltodextrin was se-lected as seed material for this application based upon compat-ibility in the formulation and good dispersibility characteris-tics. Maltodextrin is a commonly used excipient in solid dosageforms. Its use as a stabilizer for protein also has been re-ported.19
At constant process conditions, the more seed materialintroduced at the start of the process, the faster the acceptablerate of liquid (protein solution) addition. The ability to sprayrapidly leads to high productivity. However, increasing thequantity of seed material results in the need for a larger
Table A. Summary of process conditions and results of feasibility studies todetermine an optimal ratio of protein:carrier.
Protein:Carrier 1:2 ratio 1:4 ratio 1:6 ratioProperty
Protein solution weight (Kg) 15 7.5 7.5
Run time (min) 158 77 63
Product Temperature (°C) ~ 52 ~ 50 ~ 51
Max Spray rate (g/min) 120 120 160
Yield (%) 88.9 102 95
Final Moisture (%) 0.9 1.2 1.1
Dispersibility + +++ ++(compare to spray-dried powder)
Biological Activity of Yes Yes Yesfinished product
©Copyright ISPE 2001
NOVEMBER/DECEMBER 2000 • PHARMACEUTICAL ENGINEERING 53
Fluid Bed Spray Drying
protein solution is stable at ~ 50°C and below for up to two hours.Thus, the process parameters (inlet temperature, spray rate,etc.) were set to control product temperature at ~ 50°C.
When compared to spray-dried powder, all three fluid-bedbatches had significantly improved dispersibility. Figure 2and Figure 3 are scanning electron microscope photographs ofdried protein particles obtained from the traditional spraydrying and from the top spray fluid bed spray drying, respec-tively. Figure 4 demonstrates good vs. poor dispersibility of thedried protein powder. The batch with protein:carrier ratio of1:4 has slightly better dispersibility than the batch with a ratioof protein:carrier of 1:2, and 1:6. This may be related to twoobservations. For the 1:6 ratio batch, the liquid spray rate wasincreased to 160 g/min to maximize productivity. This resultedin larger granules that tended to sink to the bottom of thedissolution vessel when dispersed in water. The 1:2 ratio batchhad a small amount of starting material (maltodextrin) in theproduct container. Initial fluidization was somewhat erraticdue to a small product load. In summary, the ratio ofprotein:carrier of 1:4 was identified to be optimal for thisapplication.
The results from laboratory runs suggested that it is pos-sible to dry this particular protein using a top spray fluid bedapproach. There was no loss of biological activity of the driedprotein.
Scale-Up StudiesThe next step was to scale-up the batch size to approximately100 Kg of the protein solution. Placebo runs using maltodextrinand water were used for the initial scale-up study since theprotein concentration was low (3 - 5 %) and the viscosity of theprotein solution was very close to that of water.
One desirable goal for this application was to maximizeproductivity (dry as many liters of solution in as short a processtime as possible). There was no particle size specification of thefinished product, as long as good dispersibility could be achieved.For the production scale equipment, a three or six -headedspray nozzle can be used. In general, the six-headed nozzlemay allow operation at a higher spray rate vs. the three-headed nozzle as long as there is sufficient drying capacity.
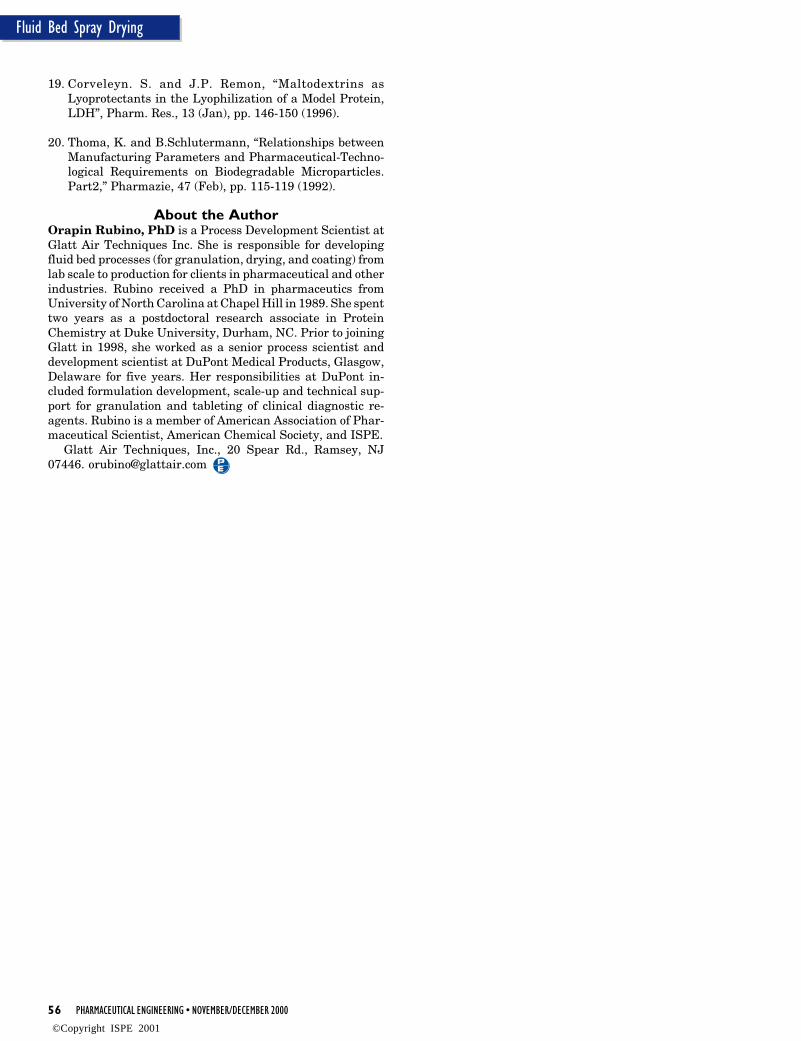
A study to evaluate the three vs. six headed nozzle bycomparing particle size distribution as a function of spray ratewas performed. The product container was charged with 36 Kgof maltodextrin. Using a three-headed nozzle, water spray ratewas started at 600 g/min. At 15-20 min intervals, spray ratewas increased. The range of spray rate studied was 600 to ~1000 g/min. Total water sprayed was 55 Kg. Particle sizeanalysis of samples during the process was determined usingsieve analysis. The experiment was repeated using a six-headed nozzle.
ResultsFigure 5 illustrates the relationship between spray rate andaverage particle size (calculated from sieve analysis data).
““ ““...products obtained from a fluid bedprocess have better flowability than those
obtained from traditional spray drying.
Both three and six-headed nozzles showed similar relation-ships between spray rate and average particle size. The fasterthe spray rates, the larger the average particle size of granules.For this application, either three or six- headed nozzle can beused (drying capacity was not an issue). The six-headed nozzlewas chosen to maximize productivity.
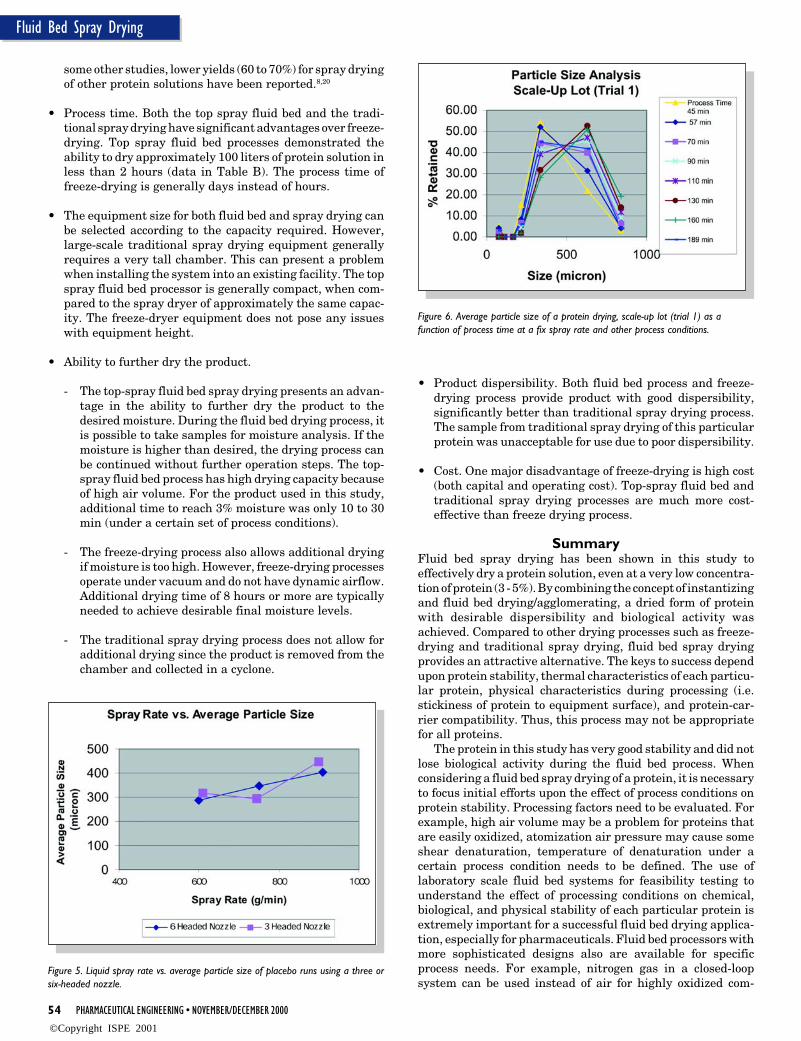
The next step, a scale-up batch using the protein solutionwas produced (Trial 1) using a six-headed nozzle. The totalweight of protein solution was 188 Kg. The product containerwas charged with 36 Kg of maltodextrin. This equated to 1:4ratio of dried protein:carrier. Samples were removed at vari-ous times. Particle size analysis was performed throughout therun.
Figure 6 illustrates the average granule size as a functionof process time at a fixed spray rate (1100 g/min). As theprocess progressed, average granule size slightly increased,possibly due to an increase in exhaust air relative humidity atfixed process conditions (inlet air temperature, process airvolume, and spray rate). However, the particle size rangethrough the process was still acceptable since the finishedproduct had good dispersibility. In addition, these large gran-ules were easily broken down to smaller size during drying.The yield was 98.1%. Final moisture was 2.6 %
Note: For an application that required maintaining averageparticle size, it is possible to control the process conditions tominimize granule growth. Increasing inlet air temperature orincreasing process air volume can typically accomplish this.
Reproducibility of a Production Scale Drying of theProtein SolutionTo validate the process, four additional production-size batchesof protein solution were spray dried (labeled Trial 2 to 5) usingconditions similar to Trial 1. The ratio of dried protein:carrierwas (in the range of 1:4 to 1:6) adjusted based on activity ofprotein in each lot.
ResultsProcess conditions and parameters including product charac-teristics are summarized in Table B. Protein solutions wereeffectively dried using a top spray fluid bed process. The dryingrate was close to 1 kg of protein solution per minute (0.86 to0.97). The yields of four production lots were 93.5 - 99 %.Finished products retained biological activity and had desir-able dispersibility characteristics.
Considerations for Selection ofProduction-Scale Drying Process
There are three processes that can be used for drying of aprotein solution in production scale: freeze-drying, traditionalspray drying and top-spray fluid bed spray drying. As a firstconsideration, a drying process has to retain biological activityof the finished product. For this particular protein, all threedrying processes can be used.
A comparison among the three drying processes for proteinsolution in the study, based upon several criteria are summa-rized in Table C.
• Yield (weight finished product recovered to theoreticalweight based upon protein concentration). Yield of theproduct obtained from top-spray fluid bed process was high(93.5 to 99 % as seen in Table B) which is typical of a fluidbed system. Typically, yield from freeze-drying is high (> 90%) while yield from traditional spray drying was lower. In
©Copyright ISPE 2001
54 PHARMACEUTICAL ENGINEERING • NOVEMBER/DECEMBER 2000
Fluid Bed Spray Drying
some other studies, lower yields (60 to 70%) for spray dryingof other protein solutions have been reported.8,20
• Process time. Both the top spray fluid bed and the tradi-tional spray drying have significant advantages over freeze-drying. Top spray fluid bed processes demonstrated theability to dry approximately 100 liters of protein solution inless than 2 hours (data in Table B). The process time offreeze-drying is generally days instead of hours.
• The equipment size for both fluid bed and spray drying canbe selected according to the capacity required. However,large-scale traditional spray drying equipment generallyrequires a very tall chamber. This can present a problemwhen installing the system into an existing facility. The topspray fluid bed processor is generally compact, when com-pared to the spray dryer of approximately the same capac-ity. The freeze-dryer equipment does not pose any issueswith equipment height.
• Ability to further dry the product.
- The top-spray fluid bed spray drying presents an advan-tage in the ability to further dry the product to thedesired moisture. During the fluid bed drying process, itis possible to take samples for moisture analysis. If themoisture is higher than desired, the drying process canbe continued without further operation steps. The top-spray fluid bed process has high drying capacity becauseof high air volume. For the product used in this study,additional time to reach 3% moisture was only 10 to 30min (under a certain set of process conditions).
- The freeze-drying process also allows additional dryingif moisture is too high. However, freeze-drying processesoperate under vacuum and do not have dynamic airflow.Additional drying time of 8 hours or more are typicallyneeded to achieve desirable final moisture levels.
- The traditional spray drying process does not allow foradditional drying since the product is removed from thechamber and collected in a cyclone.
• Product dispersibility. Both fluid bed process and freeze-drying process provide product with good dispersibility,significantly better than traditional spray drying process.The sample from traditional spray drying of this particularprotein was unacceptable for use due to poor dispersibility.
• Cost. One major disadvantage of freeze-drying is high cost(both capital and operating cost). Top-spray fluid bed andtraditional spray drying processes are much more cost-effective than freeze drying process.
SummaryFluid bed spray drying has been shown in this study toeffectively dry a protein solution, even at a very low concentra-tion of protein (3 - 5%). By combining the concept of instantizingand fluid bed drying/agglomerating, a dried form of proteinwith desirable dispersibility and biological activity wasachieved. Compared to other drying processes such as freeze-drying and traditional spray drying, fluid bed spray dryingprovides an attractive alternative. The keys to success dependupon protein stability, thermal characteristics of each particu-lar protein, physical characteristics during processing (i.e.stickiness of protein to equipment surface), and protein-car-rier compatibility. Thus, this process may not be appropriatefor all proteins.
The protein in this study has very good stability and did notlose biological activity during the fluid bed process. Whenconsidering a fluid bed spray drying of a protein, it is necessaryto focus initial efforts upon the effect of process conditions onprotein stability. Processing factors need to be evaluated. Forexample, high air volume may be a problem for proteins thatare easily oxidized, atomization air pressure may cause someshear denaturation, temperature of denaturation under acertain process condition needs to be defined. The use oflaboratory scale fluid bed systems for feasibility testing tounderstand the effect of processing conditions on chemical,biological, and physical stability of each particular protein isextremely important for a successful fluid bed drying applica-tion, especially for pharmaceuticals. Fluid bed processors withmore sophisticated designs also are available for specificprocess needs. For example, nitrogen gas in a closed-loopsystem can be used instead of air for highly oxidized com-
Figure 5. Liquid spray rate vs. average particle size of placebo runs using a three orsix-headed nozzle.
Figure 6. Average particle size of a protein drying, scale-up lot (trial 1) as afunction of process time at a fix spray rate and other process conditions.
©Copyright ISPE 2001

NOVEMBER/DECEMBER 2000 • PHARMACEUTICAL ENGINEERING 55
Fluid Bed Spray Drying
pounds.Although the top spray fluid bed process has been used in
many industries for more than 30 years, the concept of fluidbed spray drying is not widely explored. It can potentially be analternative drying process for some proteins. Thus, top sprayfluid bed spray drying can be used to achieve one-step dryingand granulating of some liquid proteins or biological actives forsolid dosage forms. At this time, the design of a top spray fluidbed is suitable to achieve the particle size of dried products inthe range of approximately 100 to 800 microns. It is notintended as a process to produce very small and very narrowparticle size as required for inhalation. The particle size offinished product obtained from the fluid bed process can becontrolled to be in a suitable range for tableting.
In addition, products obtained from a fluid bed processhave better flowability than those obtained from traditionalspray drying. Furthermore, the cost effectiveness of a fluid-bedprocess (due to its high drying capacity) provides an attractivechoice for drying of compounds on a large production scale forcertain applications.
References1. Creighton, T.E., Proteins Structures and Molecular Prop-
erties, W.H. Freeman and Co., San Franscisco (1983).
2. Lapanje, S., Physicochemical Aspects of Protein Denatur-ation, John Wiley & Sons Inc. (1978).
3. Pikal, M.J., “Freeze-Drying of Proteins,” BioPharm., Sep-tember, pp. 18-27 (1990).
4. Chang, B.S., G.Reeder, and J.F. Carpenter, “Developmentof a Stable Freeze-Dried Formulation of RecombinantHuman Interleukin-1 Receptor Antagonist,” Pharm. Res.,13 (2), pp. 243-249 (1996).
5. Chen, T., “Formulation Concerns of Protein Drugs,” DrugDev. Ind. Pharm., 18 (11&12), pp. 1311-1354 (1992).
6. Arakawa, T. et al., “Factors Affecting Short-Term andLong-Term Stabilities of Proteins,” Advanced Drug Deliv-ery Reviews, 10, pp. 1-28 (1993).
7. Mumenthaler, M., L.L. Hsu, and R. Pearlman, “FeasibilityStudy on Spray-Drying Pharmaceuticals: RecombinantHuman Growth Hormone and Tissue-Type Plasminogen
Activator,” Pharm. Res., 11 (Jun), pp. 12-20 (1994).
8. Broadhead, J., Edmond R.SIC., Hau, I., and Rhodes, CT.,“Effect of Process and Formulation Variables on the Prop-erties of Spray-Dried Beta-Galactosidase,” J. Pharm.Pharmaco., 46 (Jun), pp. 458-467 (1994).
9. Maa, Y.F., P.A. Nguyen, and C.C.Hsu, “Spray Coating ofrhDNase on Lactose: Effect of System Design, OperationalParameters and Protein Formulation,” Int. J. Pharm., 144(Nov 22): pp. 47-59 (1996).
10. Masters, K., Spray Drying Handbook, 5th Edition, LongmanScientific & Technical, John Wiley & Sons, New York.(1991).
11. Risch, S.J. and G. A. Reineccius, Flavor Encapsulation,ACS Symposium Series 370, ACS, Washington D.C., pp.60,79 (1988).
12. Lin, S.Y. and Y.H. Kao, “Solid Particulates of Drug-Beta-Cyclodextrin Inclusion Complexes Directly Prepared by aSpray Drying Technique,” Int. J. Pharm. 56 (Dec1): pp.249-259 (1989).
13. Foster, T.P. and M.W.Leatherman, “Powder Characteris-tics of Proteins Spray-Dried from Different Spray-Dryers,”Drug Dev. Ind. Pharm., 21 (15), pp. 1705-1723 (1995).
14. Jones, D.M., “Factors to Consider in Fluid-Bed Process-ing,” Pharm. Tech., 9 (4), pp. 50-62 (1985).
15. Jones, D.M., “Fluidized Bed Processing and Drying,” Pharm.Eng, pp. 1-7 (1991).
16. Olsen, K.W., “Batch Fluid-Bed Processing Equipment-ADesign Overview: Part I,” Pharm. Tech., Jan, pp. 34-46(1989).
17. Olsen, K.W., “Batch Fluid-Bed Processing Equipment-ADesign Overview: Part II,” Pharm. Tech., June, pp. 39-48(1989).
18. Rubino, O., “Fluid Bed Technology: Overview and Criteriafor Process Selection,” Pharm. Tech., June (1999).
Table C. Comparison of the three drying processes for production scale (where 1 =least desirable and 3 = most desirable).
Property Top Spray Traditional Freeze-Fluid Bed Spray Drying
Drying
Yield 3 2 3
Process Time 2 or 3 2 or 3 1
Equipment Size 3 1 3
Ability to further dry to 3 1 2desired moisture
Product Dispersibility 3 1 3
Capital Cost 2 or 3 2 or 3 1
Operation Cost 3 3 1
Table B. Summary of process conditions and results of large scale drying of theprotein solution.
Property Trial 2 Trial 3 Trial 4 Trial 5
Total weight of 94.4 149 63.1 107.2Protein solution (kg)
Process Time (min) 109 154 73 123
Drying rate (kg/min) 0.87 0.97 0.86 0.87
Final Moisture (%) 2.4 2.8 3.1 2.3
Yield (%) 94.4 98.7 93.5 99.0
Ratio 1:5 1:6.4 1:4 1:4(dried protein:carrier)
Dispersibility Good Good Good Good
Biological Activity Yes Yes Yes Yes
©Copyright ISPE 2001
56 PHARMACEUTICAL ENGINEERING • NOVEMBER/DECEMBER 2000
Fluid Bed Spray Drying
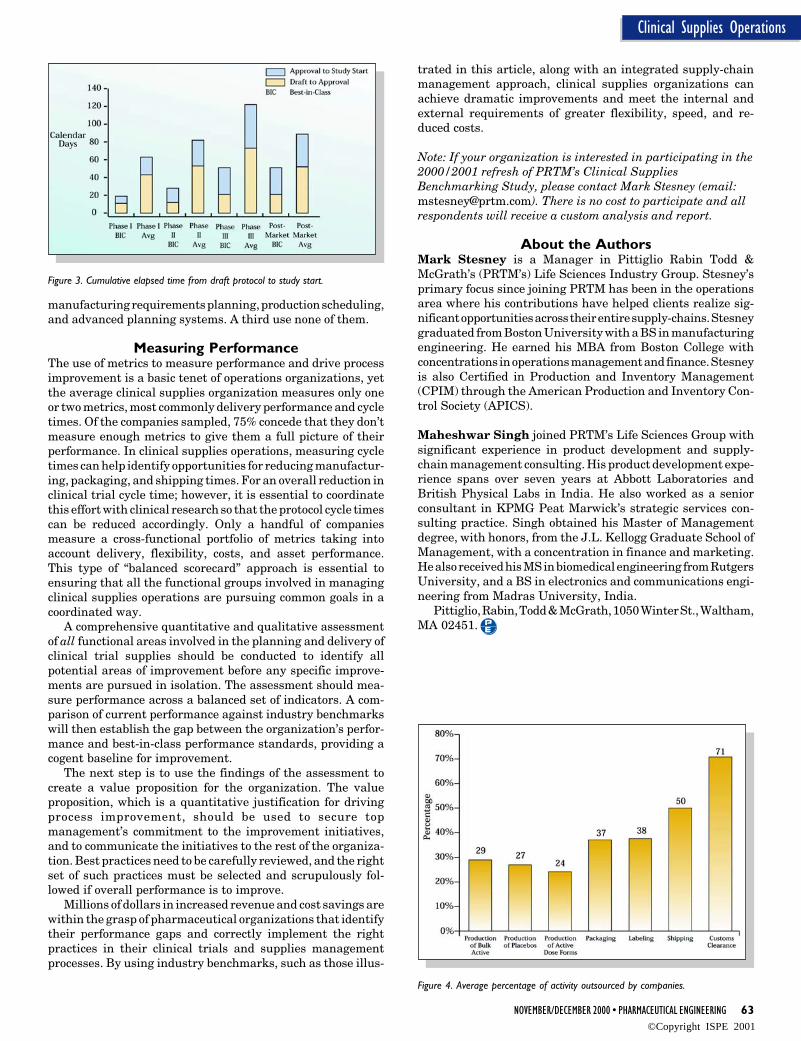
19. Corveleyn. S. and J.P. Remon, “Maltodextrins asLyoprotectants in the Lyophilization of a Model Protein,LDH”, Pharm. Res., 13 (Jan), pp. 146-150 (1996).
20. Thoma, K. and B.Schlutermann, “Relationships betweenManufacturing Parameters and Pharmaceutical-Techno-logical Requirements on Biodegradable Microparticles.Part2,” Pharmazie, 47 (Feb), pp. 115-119 (1992).
About the AuthorOrapin Rubino, PhD is a Process Development Scientist atGlatt Air Techniques Inc. She is responsible for developingfluid bed processes (for granulation, drying, and coating) fromlab scale to production for clients in pharmaceutical and otherindustries. Rubino received a PhD in pharmaceutics fromUniversity of North Carolina at Chapel Hill in 1989. She spenttwo years as a postdoctoral research associate in ProteinChemistry at Duke University, Durham, NC. Prior to joiningGlatt in 1998, she worked as a senior process scientist anddevelopment scientist at DuPont Medical Products, Glasgow,Delaware for five years. Her responsibilities at DuPont in-cluded formulation development, scale-up and technical sup-port for granulation and tableting of clinical diagnostic re-agents. Rubino is a member of American Association of Phar-maceutical Scientist, American Chemical Society, and ISPE.
Glatt Air Techniques, Inc., 20 Spear Rd., Ramsey, NJ07446. [email protected]
©Copyright ISPE 2001

60 PHARMACEUTICAL ENGINEERING • NOVEMBER/DECEMBER 2000
Clinical Supplies Operations
Using Clinical SuppliesOperations as a CompetitiveAdvantage
Using Clinical SuppliesOperations as a CompetitiveAdvantage
Fby Mark Stesney and Maheshwar Singh
This article willdiscuss the tools,techniques, andpractices that toppharmaceuticalperformers useto turn their trialsuppliesoperations into acompetitiveadvantage. Theinformation wascompiled from adatabase ofclinical trialsoperationsmanagementbenchmarks, aswell as from fieldexperience inhelping drugcompaniesassemble fasterand less wastefulsupply chains forclinical trialmaterials.
F or clinical supplies groups, the time isnow to step-up and deliver results. At atime when some are struggling to keep
pace, internal and external changes requiremore from these groups in terms of flexibility,speed, and cost control.
As competition increases and technologicaladvances accelerate the discovery of new chemi-cal lead compounds, pharmaceutical companiesface mounting pressure to develop effective andinnovative new drug compounds and bring themto market more quickly and cost-effectively thanever before. Companies are spending largeamounts of resources on improving the clinicaltrial management processes, and an increas-ingly critical aspect of the trial managementprocess is the management of clinical trial sup-ply operations.
This focus upon clinical trial managementprocesses is beginning to dramatically shrinkthe time that compounds spend in the clinicalphases of development. Companies are usingleading-edge technology to provide value to boththemselves and the clinics and researchers theyserve. Protocols are being written and approvedcollaboratively with research partners. TheInternet is being used to recruit and matchpatients to trials. Clinics are being providedupstream inventory and delivery visibility. Dataare being collected by wireless handheld com-puters and e-mailed to central collection data-bases. These practices, in-turn, are forcing theclinical supplies operations groups of these com-panies to respond aggressively.
Clinical supplies operations groups are notnecessarily moving away from their traditional
Figure 1. Clinical SuppliesEffectiveness Map.
Reprinted from The Official Journal of ISPE
PHARMACEUTICAL ENGINEERING November/December 2000, Vol. 20 No. 6
©Copyright ISPE 2001

NOVEMBER/DECEMBER 2000 • PHARMACEUTICAL ENGINEERING 61
Clinical Supplies Operations
roles of ensuring that the correct compounds are manufactured,packaged, labeled, and delivered to trial sites on time and in thequantities required. They are redefining themselves to supportthe new clinical trial management approaches so as to providea competitive advantage to the company. These competitiveadvantages are typically centered around reliability, respon-siveness, speed, and cost.
Learning from the BestA comparative survey of pharmaceutical companies’ clinicalsupply operations practices reveals clear opportunities forenhancing pharmaceutical development efficiency:
• Best-in-class companies deliver materials to clinical trialsites 56% faster than average companies. This added speedcan help reduce total drug development time by weeks oreven months.
• Leading companies waste significantly less investigationaldrug material. They require 15-20% fewer subject kits thanaverage companies. The use of Interactive Voice Response(IVR) systems and clinical supply planning coordinatorsappears to have the greatest impact upon minimizing in-ventory requirements and waste.
• Clinical supplies operations have been slow to adopt basicsoftware planning tools. Only 25% of the companies sur-veyed used material requirements planning, advanced plan-ning, and execution systems, while 33% used no systems atall.
• Performance metrics are significantly underutilized in man-aging clinical supplies operations. In contrast to most opera-tions environments in other industries, clinical suppliesoperations rarely use metrics to evaluate and improve theiroverall performance.
Speed, Reliability, ParsimonyThere appear to be three key performance indicators in clinicalsupplies operations management. First, how rapidly can clini-cal supplies be prepared, packaged, and shipped? Second, howreliably can supplies be delivered to sites so that trials can belaunched and enrollment maintained? Third, how effectivelycan inventory and overage requirements be managed to avoidwasting limited investigational drugs or comparators?
To understand the payoffs from adoption of best practices,the performance of the companies in the database were mappedagainst the use of industry best practices. An operationalperformance score was calculated based upon the cycle time toprepare, package, and deliver clinical trial supplies, on-timedelivery performance, and supplies overage. A best-practicesscore was then calculated based upon the use of managementprocesses and tools such as cross-functional planning teams,performance metrics, and software applications. The ClinicalSupplies Effectiveness Map attests to the fact that as compa-nies invest in and implement industry best practices, theiroperational performance improves accordingly - Figure 1.
Tightening the Cycle-Time LoopA pharmaceutical organization’s ability to start a clinical trialquickly and on schedule depends upon both the protocol devel-opment and the clinical supplies cycle time, the latter beingdefined as the time from start order entry for the manufacture
of bulk dosage material to delivery of the packaged kits to thetrial sites. Best-in-class companies command a 56% advantagein delivery cycle time over average performers - Figure 2.
Starting a clinical trial requires more than simply gettingthe clinical supplies to the study site. Those conducting theclinical research need to develop the protocol, prepare systemsfor data collection, and obtain site and agency approvals.These activities typically occur in parallel with the manufac-ture and packaging of clinical supplies. As measured fromdraft protocol to protocol approval, and from approved protocolto commencement of the clinical trial, best-in-class companiesachieve 45-75% shorter times than average performers, de-pending upon phase - Figure 3.
It is critical for pharmaceutical companies to get theirclinical trials started on time and to keep subjects enrolledthroughout the entire trial. On-time delivery measures theability to deliver clinical supplies to the trial sites by therequested date. The average on-time delivery performance forthe companies sampled is high - 95%. However, that figureslips slightly as the number of shipments increases. As compa-nies grow, their planning functions and operations becomemore complex. Clinical supplies organizations must under-stand these complexities and appropriately modify their pro-cesses to maintain high on-time delivery performance.
A good deal of uncertainty surrounds the planning andexecution of clinical trials. Factors contributing to this uncer-tainty include late changes in protocol design, the need to alterthe trial based upon preliminary results, insufficient enroll-ment, and unexpected discontinuation rates among enrollees.All this uncertainty, combined with the common need toprovide all treatment group kits to all sites, leads the averagecompany to package 15-20% more patient kits than it expectsto dispense during the trial. Best-in-class companies havereduced this overage to 5% in all trial phases by investing inplanning processes that promote flexibility in delivering sup-plies.
Practicing Best PracticesBest practices in clinical supplies operations fall into threebroad categories: commonly used, selectively used, andunderutilized. Commonly used best practices, such as thedeployment of cross-functional planning teams, tend to berelatively straightforward. Selectively used best practices,such as the use of Interactive Voice Response systems, tend tobe more complex, and require a good deal of cross-functionalsupport and process changes. The best practices that havebeen conspicuously underutilized by clinical supplies organi-zations, such as the use of software planning tools, demandserious attention, since they can immediately improve opera-tional performance.
All the companies in our database employ cross-functionalplanning teams. These teams are involved in the planning ofclinical supplies, and are usually created during the earlyphases of compound testing. Typical functions represented onthese teams include formulation development, planning, manu-facturing, packaging, and shipping. Ninety percent of thecompanies examined include clinical research personnel - theprimary customers of clinical supplies operations—on theircross-functional planning teams. Since these teams are in-volved in evaluating the tradeoffs between demand require-ments and supply constraints, clinical research involvement iscrucial to the timely delivery of clinical supplies.
Another common best practice in clinical supplies planning
©Copyright ISPE 2001

62 PHARMACEUTICAL ENGINEERING • NOVEMBER/DECEMBER 2000
Clinical Supplies Operations
is the use of planning coordinators. These coordinators, who arepresent in 50% of the companies surveyed, focus upon planningand orchestrating all operational aspects of clinical supplies.Planning coordinators also closely interact with clinical re-search to determine demand requirements and the necessaryresponses of the operational functions in order to ensure thetimely processing and delivery of clinical supplies. Planningcoordinators also can help reduce overall material wastage bypooling the excess planned material across multiple trials andprojects when possible.
IVR systems are used in many industries, from air carriersto credit-card companies, and are selectively used by pharma-ceutical organizations to manage the quantities and distribu-tion of clinical trial materials. IVR systems allow clinicalsupplies operations to postpone the assignment of subject kitsto specific individual patients until the last possible moment.(Once assigned and labeled, a kit cannot usually be reassignedto another subject.) This postponement ability allows theorganization to maintain its subject-kit supplies in a genericform at a central location, minimizing overall inventory re-quirements and accommodating last-minute design changesin clinical trials. Using real-time information on subject enroll-ments and discontinuations, IVR systems can limit materialoverage to less than 5%.
More than 63% of the companies in the database studied useIVR systems. Their use is more widespread in Phase II and III
trials, where the availability of material may be severelylimited. Best-in-class companies have reduced their plannedkit overage, to 5%, through the use of IVR systems. Thesesystems, in other words, can enable a company to complete aclinical trial even when the bulk active is truly scarce. Inaddition, material saved in one trial can be used to start otherrequired trials concurrently, thus reducing time-to-market.Companies also can dramatically reduce the cost of compara-tors by using IVR systems, to the tune of millions of dollars.
While remaining a selectively applied practice, successfulclinical supply operations have begun to leverage the highlyspecialized competencies of third-party providers to help man-age peak workloads and expand capabilities. The strategicoutsourcing of key activities, such as manufacturing, packag-ing, shipping, distribution, and customs clearance, has en-abled these organizations to increase their production whilekeeping pace with accelerated drug development objectives.By building long-term relationships with reliable third-partyproviders, pharmaceutical companies can establish effectivesatellite operations that can be counted to deliver productquickly as the demand arises - Figure 4.
The use of planning and execution software tools is a bestpractice among technology-based companies. These tools canhelp identify and resolve demand and supply imbalances, thusensuring the timely delivery of product. Only 25% of thecompanies in survey use all three types of these software tools:
Figure 2. Elapsed time from start order entry to arrival at domestic sites.
Best practices in clinical supplies operations fall into three broad categories:commonly used, selectively used, and underutilized.
““ ““©Copyright ISPE 2001
NOVEMBER/DECEMBER 2000 • PHARMACEUTICAL ENGINEERING 63
Clinical Supplies Operations
Figure 3. Cumulative elapsed time from draft protocol to study start.
Figure 4. Average percentage of activity outsourced by companies.
manufacturing requirements planning, production scheduling,and advanced planning systems. A third use none of them.
Measuring PerformanceThe use of metrics to measure performance and drive processimprovement is a basic tenet of operations organizations, yetthe average clinical supplies organization measures only oneor two metrics, most commonly delivery performance and cycletimes. Of the companies sampled, 75% concede that they don’tmeasure enough metrics to give them a full picture of theirperformance. In clinical supplies operations, measuring cycletimes can help identify opportunities for reducing manufactur-ing, packaging, and shipping times. For an overall reduction inclinical trial cycle time; however, it is essential to coordinatethis effort with clinical research so that the protocol cycle timescan be reduced accordingly. Only a handful of companiesmeasure a cross-functional portfolio of metrics taking intoaccount delivery, flexibility, costs, and asset performance.This type of “balanced scorecard” approach is essential toensuring that all the functional groups involved in managingclinical supplies operations are pursuing common goals in acoordinated way.
A comprehensive quantitative and qualitative assessmentof all functional areas involved in the planning and delivery ofclinical trial supplies should be conducted to identify allpotential areas of improvement before any specific improve-ments are pursued in isolation. The assessment should mea-sure performance across a balanced set of indicators. A com-parison of current performance against industry benchmarkswill then establish the gap between the organization’s perfor-mance and best-in-class performance standards, providing acogent baseline for improvement.
The next step is to use the findings of the assessment tocreate a value proposition for the organization. The valueproposition, which is a quantitative justification for drivingprocess improvement, should be used to secure topmanagement’s commitment to the improvement initiatives,and to communicate the initiatives to the rest of the organiza-tion. Best practices need to be carefully reviewed, and the rightset of such practices must be selected and scrupulously fol-lowed if overall performance is to improve.
Millions of dollars in increased revenue and cost savings arewithin the grasp of pharmaceutical organizations that identifytheir performance gaps and correctly implement the rightpractices in their clinical trials and supplies managementprocesses. By using industry benchmarks, such as those illus-
trated in this article, along with an integrated supply-chainmanagement approach, clinical supplies organizations canachieve dramatic improvements and meet the internal andexternal requirements of greater flexibility, speed, and re-duced costs.
Note: If your organization is interested in participating in the2000/2001 refresh of PRTM’s Clinical SuppliesBenchmarking Study, please contact Mark Stesney (email:[email protected]). There is no cost to participate and allrespondents will receive a custom analysis and report.
About the AuthorsMark Stesney is a Manager in Pittiglio Rabin Todd &McGrath’s (PRTM’s) Life Sciences Industry Group. Stesney’sprimary focus since joining PRTM has been in the operationsarea where his contributions have helped clients realize sig-nificant opportunities across their entire supply-chains. Stesneygraduated from Boston University with a BS in manufacturingengineering. He earned his MBA from Boston College withconcentrations in operations management and finance. Stesneyis also Certified in Production and Inventory Management(CPIM) through the American Production and Inventory Con-trol Society (APICS).
Maheshwar Singh joined PRTM’s Life Sciences Group withsignificant experience in product development and supply-chain management consulting. His product development expe-rience spans over seven years at Abbott Laboratories andBritish Physical Labs in India. He also worked as a seniorconsultant in KPMG Peat Marwick’s strategic services con-sulting practice. Singh obtained his Master of Managementdegree, with honors, from the J.L. Kellogg Graduate School ofManagement, with a concentration in finance and marketing.He also received his MS in biomedical engineering from RutgersUniversity, and a BS in electronics and communications engi-neering from Madras University, India.
Pittiglio, Rabin, Todd & McGrath, 1050 Winter St., Waltham,MA 02451.
©Copyright ISPE 2001

8 PHARMACEUTICAL ENGINEERING • NOVEMBER/DECEMBER 2000
Factory Acceptance Testing
Factory Acceptance Testing (FAT)of Pharmaceutical EquipmentFactory Acceptance Testing (FAT)of Pharmaceutical Equipment
Wby Matthew G. Roberge, PE
This articlediscusses howadvance planningcan maximizethe benefitsobtained fromFATs, anddemonstrateshow optimizingthe time andmoney spent onFAT can result ina smoothtransition fromdesign toinstallation tovalidatedproduction.
W ith the growing demand for vali-dated computer controlled process-ing systems, testing of new equip-
ment has become a large portion of the costsassociated with a pharmaceutical project. How-ever, there are several ways to optimize thetime and money spent on equipment acceptancetesting.
The General Need and Approachesthat can be Taken
There are two objectives of a FAT equipment: 1.to ensure that you are getting what you pay for,and 2. to begin the execution process of thevalidation plan. There are numerous testing
philosophies that can be used to carry out theFAT ranging from a cursory physical inspectionto a detailed physical and operational verifica-tion. All have their place depending upon thecircumstances.
Decide on the Testing Approach tobe Taken for FATs at the Beginning
of the ProjectAll parties involved in selecting a testing ap-proach for the FAT must agree upon the testingprogram philosophy at the start of a project toallow for the best use of resources. This philoso-phy should be outlined in the validation planand/or quality plan for the project. Knowing and
understanding the degree to which adesign will be challenged serves sev-eral practical purposes, but perhapsthe most important is defining theobjectives and deliverables to theproject team. As the project teamprocures equipment and services, itwill have the ability to align theproject’s expectations with thevendor’s deliverables.
Reputable vendors have quality-testing programs and an assembly ofdocuments that they supply as a stan-dard package to demonstrate thattheir product is suitable for the givenapplication. If the vendor’s standardis different from the objectives out-lined in the validation/quality plan,changes can be made to correct thisdiscrepancy. An early understand-ing of the required testing will en-sure that any changes to the vendor’sapproach will be made with minimalschedule or monetary impact.
For the purposes of illustration,consider the following hypotheticalexample: If a large PC/PLC-con-trolled equipment system (Figure 1)with numerous ancillary items andutility requirements has been or-dered and is to be tested, the vendorwill usually include a 3-5 day factoryinspection and review of related docu-ments. These tests usually entail a
Figure 1. Example equipmentsetup for FAT testing.
Reprinted from The Official Journal of ISPE
PHARMACEUTICAL ENGINEERING November/December 2000, Vol. 20 No. 6
©Copyright ISPE 2001
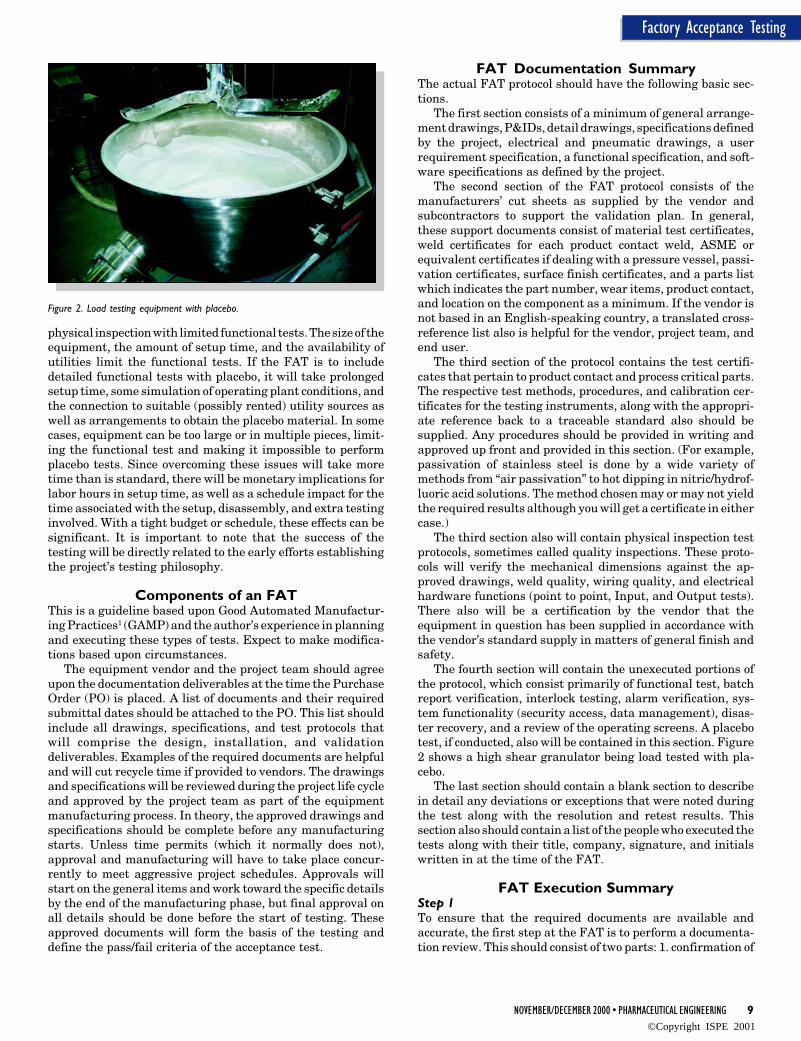
NOVEMBER/DECEMBER 2000 • PHARMACEUTICAL ENGINEERING 9
Factory Acceptance Testing
physical inspection with limited functional tests. The size of theequipment, the amount of setup time, and the availability ofutilities limit the functional tests. If the FAT is to includedetailed functional tests with placebo, it will take prolongedsetup time, some simulation of operating plant conditions, andthe connection to suitable (possibly rented) utility sources aswell as arrangements to obtain the placebo material. In somecases, equipment can be too large or in multiple pieces, limit-ing the functional test and making it impossible to performplacebo tests. Since overcoming these issues will take moretime than is standard, there will be monetary implications forlabor hours in setup time, as well as a schedule impact for thetime associated with the setup, disassembly, and extra testinginvolved. With a tight budget or schedule, these effects can besignificant. It is important to note that the success of thetesting will be directly related to the early efforts establishingthe project’s testing philosophy.
Components of an FATThis is a guideline based upon Good Automated Manufactur-ing Practices1 (GAMP) and the author’s experience in planningand executing these types of tests. Expect to make modifica-tions based upon circumstances.
The equipment vendor and the project team should agreeupon the documentation deliverables at the time the PurchaseOrder (PO) is placed. A list of documents and their requiredsubmittal dates should be attached to the PO. This list shouldinclude all drawings, specifications, and test protocols thatwill comprise the design, installation, and validationdeliverables. Examples of the required documents are helpfuland will cut recycle time if provided to vendors. The drawingsand specifications will be reviewed during the project life cycleand approved by the project team as part of the equipmentmanufacturing process. In theory, the approved drawings andspecifications should be complete before any manufacturingstarts. Unless time permits (which it normally does not),approval and manufacturing will have to take place concur-rently to meet aggressive project schedules. Approvals willstart on the general items and work toward the specific detailsby the end of the manufacturing phase, but final approval onall details should be done before the start of testing. Theseapproved documents will form the basis of the testing anddefine the pass/fail criteria of the acceptance test.
FAT Documentation SummaryThe actual FAT protocol should have the following basic sec-tions.
The first section consists of a minimum of general arrange-ment drawings, P&IDs, detail drawings, specifications definedby the project, electrical and pneumatic drawings, a userrequirement specification, a functional specification, and soft-ware specifications as defined by the project.
The second section of the FAT protocol consists of themanufacturers’ cut sheets as supplied by the vendor andsubcontractors to support the validation plan. In general,these support documents consist of material test certificates,weld certificates for each product contact weld, ASME orequivalent certificates if dealing with a pressure vessel, passi-vation certificates, surface finish certificates, and a parts listwhich indicates the part number, wear items, product contact,and location on the component as a minimum. If the vendor isnot based in an English-speaking country, a translated cross-reference list also is helpful for the vendor, project team, andend user.
The third section of the protocol contains the test certifi-cates that pertain to product contact and process critical parts.The respective test methods, procedures, and calibration cer-tificates for the testing instruments, along with the appropri-ate reference back to a traceable standard also should besupplied. Any procedures should be provided in writing andapproved up front and provided in this section. (For example,passivation of stainless steel is done by a wide variety ofmethods from “air passivation” to hot dipping in nitric/hydrof-luoric acid solutions. The method chosen may or may not yieldthe required results although you will get a certificate in eithercase.)
The third section also will contain physical inspection testprotocols, sometimes called quality inspections. These proto-cols will verify the mechanical dimensions against the ap-proved drawings, weld quality, wiring quality, and electricalhardware functions (point to point, Input, and Output tests).There also will be a certification by the vendor that theequipment in question has been supplied in accordance withthe vendor’s standard supply in matters of general finish andsafety.
The fourth section will contain the unexecuted portions ofthe protocol, which consist primarily of functional test, batchreport verification, interlock testing, alarm verification, sys-tem functionality (security access, data management), disas-ter recovery, and a review of the operating screens. A placebotest, if conducted, also will be contained in this section. Figure2 shows a high shear granulator being load tested with pla-cebo.
The last section should contain a blank section to describein detail any deviations or exceptions that were noted duringthe test along with the resolution and retest results. Thissection also should contain a list of the people who executed thetests along with their title, company, signature, and initialswritten in at the time of the FAT.
FAT Execution SummaryStep 1To ensure that the required documents are available andaccurate, the first step at the FAT is to perform a documenta-tion review. This should consist of two parts: 1. confirmation of
Figure 2. Load testing equipment with placebo.
©Copyright ISPE 2001

10 PHARMACEUTICAL ENGINEERING • NOVEMBER/DECEMBER 2000
Factory Acceptance Testing
Figure 3. Electrical hardware check.
the availability of the approved design documents and specifi-cations, and 2. confirmation that all support documentation isavailable and accurate.
Step 2The execution team should form groups to perform the nextstep, a physical inspection of the electrical hardware, and themechanical inspection concurrently (unless there is a safety ormanpower issue). Figure 3 shows a remote control panel beingchecked against wiring drawings. Any notes or markups to theapproved drawings should be added to the original documentsfrom the FAT protocol.
As previously mentioned, the third section contains physi-cal inspection (quality test) protocols. The vendor can executethis section prior to the customer’s arrival on site, or the projectteam can execute these protocols with the vendor, dependingupon how much time was budgeted for testing. It is generallymore efficient to have the vendor do this prior to the testingteam’s arrival. During the FAT execution, the team will pref-erentially spot check those tests performed by the vendor, spot-checking those items that are critical to the project, ie, buildinginterface dimensions and non-standard I/O. Assuming thatthe results are satisfactory, testing can continue. If the resultsare not satisfactory, full checking (100%) of the pre-executedwork should be performed with appropriate deviations/resolu-tions being noted. If the resolution is to be performed at a laterdate, this also should be noted in the appropriate section. It isnot common practice to include nuts/bolts and small electricalconduits on arrangement drawings. For this reason, floor,ceiling, and wall intersections with the equipment should bemarked with string or tape to assess the impact of theseelements upon the eventual architectural finish.
Step 3Once the electrical and hardware checks are completed, thefunctional testing can begin. The physical checks usuallycannot be performed concurrently with the functional checkssince the electrical and mechanical checks may involve person-nel exposure to unprotected moving or electrical parts thatmay start or become energized automatically during the func-tional test. Further, the physical checks involve a certainamount of disassembly of the equipment, which could renderthe unit non-functional.
The functional tests should proceed as outlined in theprotocol. Any tests that require support documentation can besupported with printouts of data from the PC that is control-ling the equipment. If deviations from the approved protocoloccur or if the end-user requests changes, these deviationsshould be reviewed by the project team, agreed upon, and thenhand-marked in the original protocol with an initial and date.Deviations should be noted and corrective actions listed. Timecan be saved during this portion of testing if the computerscreens and screen layouts are reviewed and the comments aresent to the vendor before the actual FAT.
Step 4At the conclusion of testing, the team reviews the FAT resultsand specifies any corrective action that the vendor should take.The FAT team has the option of specifying how and when thecorrective actions will be made. In the worst case, the testingteam can return at a later date to retest the resolutions (or theentire FAT). More typically, the resolutions and required duedates can be agreed upon with acceptance being given condi-tionally, or the resolutions can be implemented as they occurwith the equipment being accepted and shipped at the end ofthe FAT.
Examples of deviations that could be accepted conditionalupon the vendor correcting the deviation are missing paper-work, wording changes in the functional specification, or thepolishing out of an external scratch. More significant devia-tions that involve electrical or software modifications have tobe retested in a subsequent FAT addendum or in the SiteAcceptance Test (SAT). It is a project decision when the retest
““ ““The execution time for the FAT will depend upon the level to whichthe vendor and the project FAT team have prepared
and the end user's documentation and testing requuirements.
©Copyright ISPE 2001
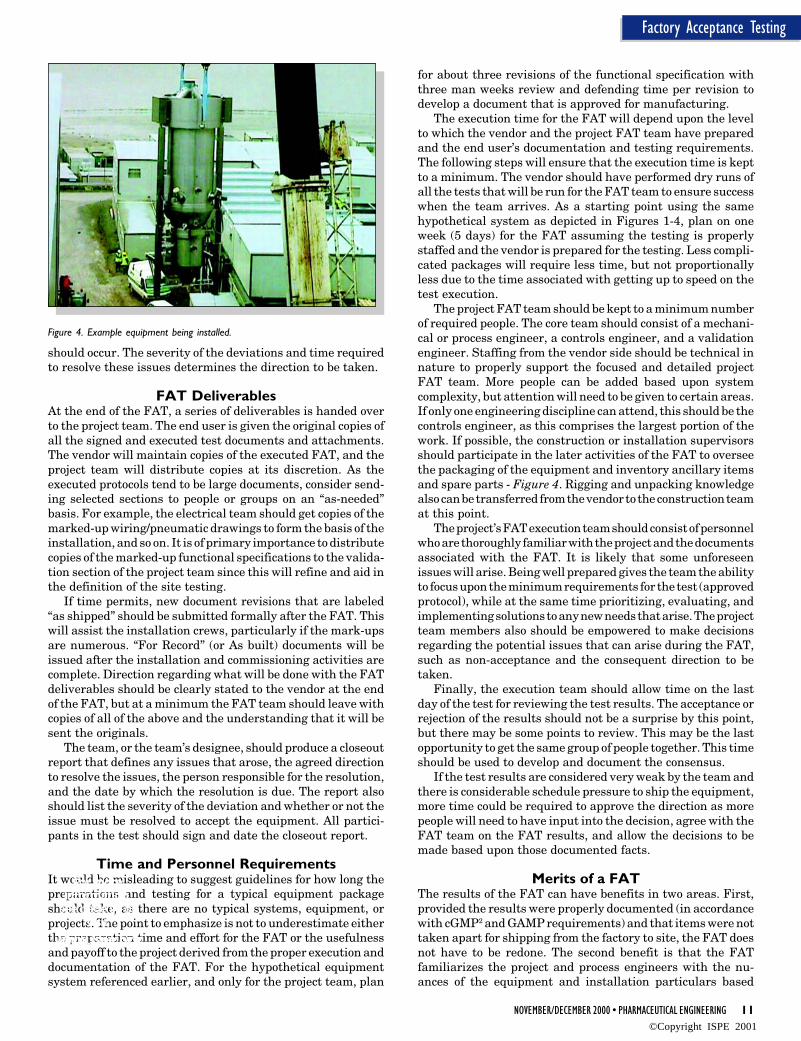
NOVEMBER/DECEMBER 2000 • PHARMACEUTICAL ENGINEERING 11
Factory Acceptance Testing
Figure 4. Example equipment being installed.
for about three revisions of the functional specification withthree man weeks review and defending time per revision todevelop a document that is approved for manufacturing.
The execution time for the FAT will depend upon the levelto which the vendor and the project FAT team have preparedand the end user’s documentation and testing requirements.The following steps will ensure that the execution time is keptto a minimum. The vendor should have performed dry runs ofall the tests that will be run for the FAT team to ensure successwhen the team arrives. As a starting point using the samehypothetical system as depicted in Figures 1-4, plan on oneweek (5 days) for the FAT assuming the testing is properlystaffed and the vendor is prepared for the testing. Less compli-cated packages will require less time, but not proportionallyless due to the time associated with getting up to speed on thetest execution.
The project FAT team should be kept to a minimum numberof required people. The core team should consist of a mechani-cal or process engineer, a controls engineer, and a validationengineer. Staffing from the vendor side should be technical innature to properly support the focused and detailed projectFAT team. More people can be added based upon systemcomplexity, but attention will need to be given to certain areas.If only one engineering discipline can attend, this should be thecontrols engineer, as this comprises the largest portion of thework. If possible, the construction or installation supervisorsshould participate in the later activities of the FAT to overseethe packaging of the equipment and inventory ancillary itemsand spare parts - Figure 4. Rigging and unpacking knowledgealso can be transferred from the vendor to the construction teamat this point.
The project’s FAT execution team should consist of personnelwho are thoroughly familiar with the project and the documentsassociated with the FAT. It is likely that some unforeseenissues will arise. Being well prepared gives the team the abilityto focus upon the minimum requirements for the test (approvedprotocol), while at the same time prioritizing, evaluating, andimplementing solutions to any new needs that arise. The projectteam members also should be empowered to make decisionsregarding the potential issues that can arise during the FAT,such as non-acceptance and the consequent direction to betaken.
Finally, the execution team should allow time on the lastday of the test for reviewing the test results. The acceptance orrejection of the results should not be a surprise by this point,but there may be some points to review. This may be the lastopportunity to get the same group of people together. This timeshould be used to develop and document the consensus.
If the test results are considered very weak by the team andthere is considerable schedule pressure to ship the equipment,more time could be required to approve the direction as morepeople will need to have input into the decision, agree with theFAT team on the FAT results, and allow the decisions to bemade based upon those documented facts.
Merits of a FATThe results of the FAT can have benefits in two areas. First,provided the results were properly documented (in accordancewith cGMP2 and GAMP requirements) and that items were nottaken apart for shipping from the factory to site, the FAT doesnot have to be redone. The second benefit is that the FATfamiliarizes the project and process engineers with the nu-ances of the equipment and installation particulars based
should occur. The severity of the deviations and time requiredto resolve these issues determines the direction to be taken.
FAT DeliverablesAt the end of the FAT, a series of deliverables is handed overto the project team. The end user is given the original copies ofall the signed and executed test documents and attachments.The vendor will maintain copies of the executed FAT, and theproject team will distribute copies at its discretion. As theexecuted protocols tend to be large documents, consider send-ing selected sections to people or groups on an “as-needed”basis. For example, the electrical team should get copies of themarked-up wiring/pneumatic drawings to form the basis of theinstallation, and so on. It is of primary importance to distributecopies of the marked-up functional specifications to the valida-tion section of the project team since this will refine and aid inthe definition of the site testing.
If time permits, new document revisions that are labeled“as shipped” should be submitted formally after the FAT. Thiswill assist the installation crews, particularly if the mark-upsare numerous. “For Record” (or As built) documents will beissued after the installation and commissioning activities arecomplete. Direction regarding what will be done with the FATdeliverables should be clearly stated to the vendor at the endof the FAT, but at a minimum the FAT team should leave withcopies of all of the above and the understanding that it will besent the originals.
The team, or the team’s designee, should produce a closeoutreport that defines any issues that arose, the agreed directionto resolve the issues, the person responsible for the resolution,and the date by which the resolution is due. The report alsoshould list the severity of the deviation and whether or not theissue must be resolved to accept the equipment. All partici-pants in the test should sign and date the closeout report.
Time and Personnel RequirementsIt would be misleading to suggest guidelines for how long thepreparations and testing for a typical equipment packageshould take, as there are no typical systems, equipment, orprojects. The point to emphasize is not to underestimate eitherthe preparation time and effort for the FAT or the usefulnessand payoff to the project derived from the proper execution anddocumentation of the FAT. For the hypothetical equipmentsystem referenced earlier, and only for the project team, plan
For moreinformation,
see page 92 orvisit
www.ispe.org
©Copyright ISPE 2001

ment must have calibration certificates demonstrating trace-ability against a national standard.
The point concerning no disassembly pertains to the factthat items are often assembled at the factory, disassembled forshipping, and reassembled at site. The reassembly at site hasto be verified. For example, if a remote control cabinet withinterconnecting wires was installed at the factory for testing,then had the interconnecting wires removed and reinstalled atsite, the interconnections need to be checked to ensure theywere performed in accordance with the design.
Limitations of FAT ResultsAlthough FATs have a definite purpose in the project life cycle,they also have limitations. Understanding these will aid in theprocess of deciding how much emphasis to place on the FAT.The size and complexity of the equipment will determine theamount of time required to construct the system in the factoryto the point where it can run as intended. There also will betime associated with taking the system down and packaging itfor shipment. In the case of a large system that can take severalweeks just in setup time, a limited FAT should be considered.This type of FAT will still have the elements previouslymentioned; however, the functional tests will be limited towhat can run and what can be simulated. Figure 5 shows asimulated air handling unit where the control flaps and valvesare mounted to a bench and wired back to the control panel fortesting.
Test PLCs can be setup to simulate other systems thatinterface with the package being tested. If the expense of a testPLC is not justifiable, a manual switch box can be used.However, since simulation of the tests will have to be redone inthe field, this portion of testing will only minimize the risk ofgross non-performance in the field. Simulation is not as reliableas testing under real conditions, therefore caution should beexercised in reviewing this data for schedule improvement vs.cost. If non-standard functions have been added to the equip-ment, there will be a benefit to simulation of these items. Therewill be limited benefit from simulating standard machineoptions.
Since many large systems cannot be shipped in whole, thedegree to which the system must be disassembled can limit thereuse of data. Although the control system can be well wrungout, the tests themselves would have to be re-executed to verifythe new installation. This is a good way to reduce the possibil-ity of failure during on-site testing, and there can be a highdegree of expectation of success if only the installation needsto be checked. The controls system check should go veryquickly with limited deviations.
ConclusionAddressing the following five points will minimize the timecommitment and maximize the benefits obtained from theeffort put into the FATs. This will result in a smooth transitionfrom design to installation to validated production.
1. In the project-planning phase, decide upon the emphasisthat will be placed on the FATs for the process equipment.This will vary depending upon the size and complexity ofeach system.
2. Incorporate the FATs and related data into the project’svalidation plan, and plan on reusing FAT data whereverpossible.
upon the experience of the people who built the equipment. Thiswill benefit the project at the installation end as the FAT teamwill have a detailed and tangible understanding of the operat-ing needs and special requirements of the package that can becommunicated to the construction crafts, ultimately quicken-ing the installation process.
Another FAT benefit is that it is the first time project andprocess people get a hands-on inspection of the equipment.Some projects send operations personnel to the FATs for keypieces of equipment, as the user’s perspective is invaluable inassessing usability type issues. This will be the first chance toverify that the design and the end results perform as expected.If the results are not as required, it is easier and less costly tohave the original manufacturer correct problems in its ownshop, rather than on site.
Leading up to the FAT, mechanical/equipment people havebeen the most involved in the equipment design developmenton a day-to-day basis. The FAT serves as an opportunity to getthe process and validation personnel involved in the system totransition the involvement from the project to the operationsgroup.
ValidationRegardless of the decision to reuse data from the FAT for theSite Acceptance Test (SAT) or Operational Qualification (OQ),the test protocols and specifications developed for and ex-ecuted at the FAT can be used as the basis for the writing of theSAT and OQ protocols. Electronic copies of these documentsare usually obtainable from the vendor. Much of the protocolcan be cut and pasted from the electronic files. Additions to theFAT are made taking into account that the equipment is nowconnected to the intended utilities and interfaces with thebuilding and other systems are now permanent. Priority can beplaced on areas that were not considered adequately tested atthe FAT.
The FAT results can be re-used via reference in the SAT(meaning the actual test will not be performed again) providedthe results remain valid (no disassembly has taken place) andthe documentation was done in a manner consistent withcGMP and GAMP. This means that the validation plan at thebeginning of the project has to include data reuse as an optionand that the various design specifications and drawings gothrough a proper review cycle and are approved by the project’srepresentatives. Further, all test results must be signed andcounter-signed by approved personnel, and all testing equip-
Figure 5. Simulated air handling unit at an FAT.
©Copyright ISPE 2001

NOVEMBER/DECEMBER 2000 • PHARMACEUTICAL ENGINEERING 13
Factory Acceptance Testing
3. Send a minimum number of people to the FAT who arefamiliar with the project and who have the ability to producethe deliverables required to support the remaining projectactivities.
4. Allow enough time for protocol review and FAT executionincluding contingency time to address surprises. The timeallocated for each system will vary with complexity andexperience with the vendor.
5. Disseminate the information obtained at the FAT in atimely fashion.
References1. GAMP Guide for Validation of Automated Systems in Phar-
maceutical Manufacture, Version 3, Volume 1, Part 1 and 2,ISPE, March 1998.
2. Title 21 (cGMP): Part 210 – Current Good ManufacturingPractice in Manufacturing, Processing, Packaging, or Hold-ing of Drugs; General, and Part 211 – Current Good Manu-facturing Practice for Finished Pharmaceuticals.
About the AuthorMatthew G. Roberge, PE graduated with a bachelors ofmechanical engineering from Villanova University in 1990.Roberge has more than 10 years of industry experience inoperating plants and A, E&C firms, and is currently a processmechanical engineer with Jacobs Engineering in Philadel-phia, PA. He has been involved with several design, construc-tion, start-up, and validation efforts both in the US andEurope. Roberge is a Registered Professional Engineer in thestate of PA.
Jacobs Engineering Group, Inc., 3 Tower Bridge, 2 Ash St.,Suite 3000, Conshohocken, PA 19428-2074.
©Copyright ISPE 2001

66 PHARMACEUTICAL ENGINEERING • NOVEMBER/DECEMBER 2000
R&D Facility Design
Meeting the Challenges of R&DFacility Design in a DynamicTechnology Business (Part 2)
Meeting the Challenges of R&DFacility Design in a DynamicTechnology Business (Part 2)
T
This articlediscusses themanagement ofR&D projectswith a globalperspectivetoward creating aproduct andprocessresponsive tochange.
by Joseph M. Phillips, AIA, and Jay Shoemaker, AIA
Introduction
T his two part article identifies how evolv-ing trends and current patterns effectboth the process and result. Part 1
dealt with design strategies and specific solu-tions which support the emerging trends inpharmaceutical R&D (September/October 2000PE). Part 2 considers the management of theR&D facilities project with a global perspectivetoward creating a product and process respon-sive to change.
In pharmaceutical and biopharmaceuticalorganizations, management has recognized thatwhatever supports good scientific process favor-ably impacts speed and quality of product dis-covery, development, and release. Simplisti-cally, the equation is time and knowledge aremoney. For R&D, the flow and relationshipsamong ideas, people, materials, equipment, etc.play a beneficial role in the time-to-marketcycle. The challenge architects and engineerscontinuously face is to provide the researchcommunity with physical environments thatare safe and effective tools for supporting opti-mized R&D activities. The challenge comes witha catch: design and construct the most respon-sive research facilities, but do so at the lowestcost possible in the shortest cycle time.
Identifying Needs and Costs: TheFacility and Its Relationship to the
BusinessThe first challenge is to determine what perfor-mance outcome is needed and what is the rea-sonable cost to provide it. Part 1 describedsignificant trends in the sciences highlightingthe need to develop new design prototypes.Doing so and assigning costs are not always onconvergent paths. There is frequently an as-sumption that facility costs should always belower than the previous project. While innova-
tion and improvement need not carry a higherprice tag than previous projects, implementingnew ideas applying old cost solutions, and lowercost assumptions comes with the risk of short-changing the science or guaranteeing cost over-runs when it becomes apparent what is genu-inely needed was not in the initial budget.
Attention to cost is understandable if overemphasized. Facility projects are tangible. Pro-jected revenue from an investment in a facilityinnovation is not. Costs are readily quantifi-able, therefore, novel designs with non-quanti-fiable justifications become easy targets in anydebate of value. Resisting innovations solely onthe basis of cost, however, carries high risk ofadversely affecting the science that will eventu-ally generate market-responsive products andthe income stream. Put another way, moneysaved is not money earned.
Is there a cost-benefit analysis reckoning thecost of the “best” tools, techniques, and environ-ments with the value of the scientist’s workafforded by these improvements? This is not aneasy metric to establish, but the question ispersistent in R&D facility design. To addressthis question one has to perform a thoroughcomparative analysis. Such an analysis requiresan in-depth understanding of cost, basis of de-sign, operating assumptions, and scope for bothexisting and new facilities. This simple, butdemanding comparison will articulate assump-tions of R&D activities and management em-bedded in cost models for facilities and identifywhy costs differ among projects. The technologyorigins of assumptions for costing solutionswhich match scientific needs has been coveredin Part 1 in the discussion of benchmarking anddesign solutions. It is sufficient here to re-emphasize the issue by pointing out the generaltrend is to provide each scientist with moretechnical resources to enhance productivity.
Reprinted from The Official Journal of ISPE
PHARMACEUTICAL ENGINEERING November/December 2000, Vol. 20 No. 6
©Copyright ISPE 2001
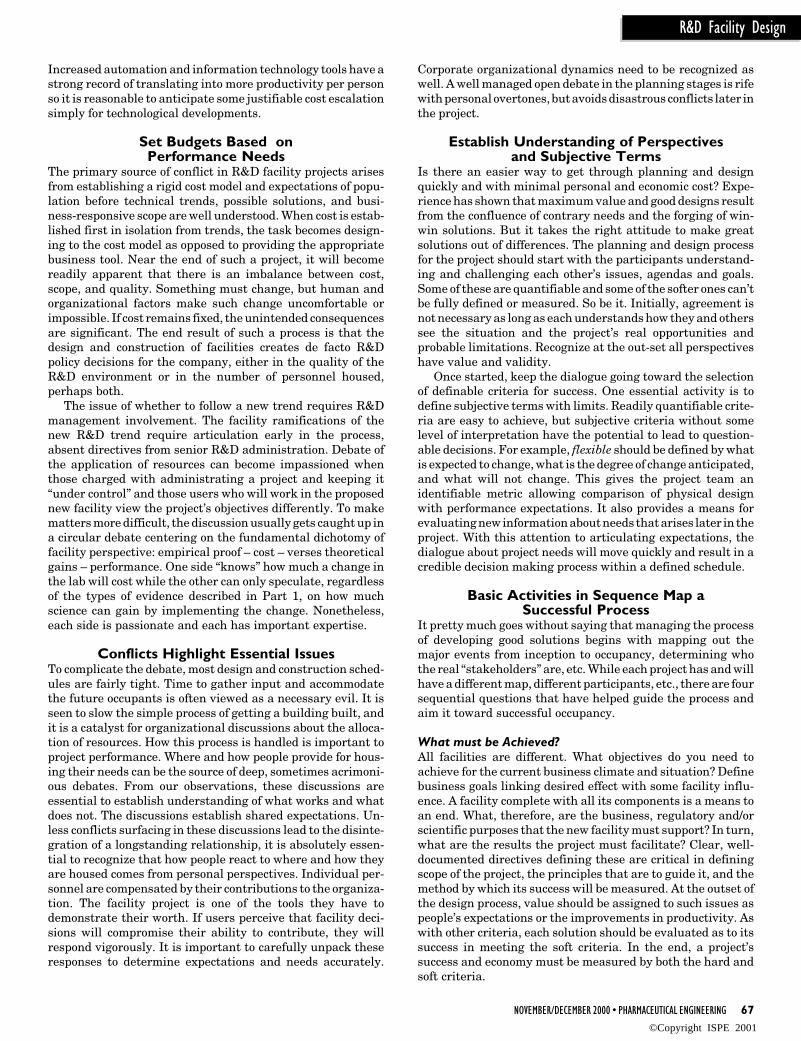
NOVEMBER/DECEMBER 2000 • PHARMACEUTICAL ENGINEERING 67
R&D Facility Design
Increased automation and information technology tools have astrong record of translating into more productivity per personso it is reasonable to anticipate some justifiable cost escalationsimply for technological developments.
Set Budgets Based onPerformance Needs
The primary source of conflict in R&D facility projects arisesfrom establishing a rigid cost model and expectations of popu-lation before technical trends, possible solutions, and busi-ness-responsive scope are well understood. When cost is estab-lished first in isolation from trends, the task becomes design-ing to the cost model as opposed to providing the appropriatebusiness tool. Near the end of such a project, it will becomereadily apparent that there is an imbalance between cost,scope, and quality. Something must change, but human andorganizational factors make such change uncomfortable orimpossible. If cost remains fixed, the unintended consequencesare significant. The end result of such a process is that thedesign and construction of facilities creates de facto R&Dpolicy decisions for the company, either in the quality of theR&D environment or in the number of personnel housed,perhaps both.
The issue of whether to follow a new trend requires R&Dmanagement involvement. The facility ramifications of thenew R&D trend require articulation early in the process,absent directives from senior R&D administration. Debate ofthe application of resources can become impassioned whenthose charged with administrating a project and keeping it“under control” and those users who will work in the proposednew facility view the project’s objectives differently. To makematters more difficult, the discussion usually gets caught up ina circular debate centering on the fundamental dichotomy offacility perspective: empirical proof – cost – verses theoreticalgains – performance. One side “knows” how much a change inthe lab will cost while the other can only speculate, regardlessof the types of evidence described in Part 1, on how muchscience can gain by implementing the change. Nonetheless,each side is passionate and each has important expertise.
Conflicts Highlight Essential IssuesTo complicate the debate, most design and construction sched-ules are fairly tight. Time to gather input and accommodatethe future occupants is often viewed as a necessary evil. It isseen to slow the simple process of getting a building built, andit is a catalyst for organizational discussions about the alloca-tion of resources. How this process is handled is important toproject performance. Where and how people provide for hous-ing their needs can be the source of deep, sometimes acrimoni-ous debates. From our observations, these discussions areessential to establish understanding of what works and whatdoes not. The discussions establish shared expectations. Un-less conflicts surfacing in these discussions lead to the disinte-gration of a longstanding relationship, it is absolutely essen-tial to recognize that how people react to where and how theyare housed comes from personal perspectives. Individual per-sonnel are compensated by their contributions to the organiza-tion. The facility project is one of the tools they have todemonstrate their worth. If users perceive that facility deci-sions will compromise their ability to contribute, they willrespond vigorously. It is important to carefully unpack theseresponses to determine expectations and needs accurately.
Corporate organizational dynamics need to be recognized aswell. A well managed open debate in the planning stages is rifewith personal overtones, but avoids disastrous conflicts later inthe project.
Establish Understanding of Perspectivesand Subjective Terms
Is there an easier way to get through planning and designquickly and with minimal personal and economic cost? Expe-rience has shown that maximum value and good designs resultfrom the confluence of contrary needs and the forging of win-win solutions. But it takes the right attitude to make greatsolutions out of differences. The planning and design processfor the project should start with the participants understand-ing and challenging each other’s issues, agendas and goals.Some of these are quantifiable and some of the softer ones can’tbe fully defined or measured. So be it. Initially, agreement isnot necessary as long as each understands how they and otherssee the situation and the project’s real opportunities andprobable limitations. Recognize at the out-set all perspectiveshave value and validity.
Once started, keep the dialogue going toward the selectionof definable criteria for success. One essential activity is todefine subjective terms with limits. Readily quantifiable crite-ria are easy to achieve, but subjective criteria without somelevel of interpretation have the potential to lead to question-able decisions. For example, flexible should be defined by whatis expected to change, what is the degree of change anticipated,and what will not change. This gives the project team anidentifiable metric allowing comparison of physical designwith performance expectations. It also provides a means forevaluating new information about needs that arises later in theproject. With this attention to articulating expectations, thedialogue about project needs will move quickly and result in acredible decision making process within a defined schedule.
Basic Activities in Sequence Map aSuccessful Process
It pretty much goes without saying that managing the processof developing good solutions begins with mapping out themajor events from inception to occupancy, determining whothe real “stakeholders” are, etc. While each project has and willhave a different map, different participants, etc., there are foursequential questions that have helped guide the process andaim it toward successful occupancy.
What must be Achieved?All facilities are different. What objectives do you need toachieve for the current business climate and situation? Definebusiness goals linking desired effect with some facility influ-ence. A facility complete with all its components is a means toan end. What, therefore, are the business, regulatory and/orscientific purposes that the new facility must support? In turn,what are the results the project must facilitate? Clear, well-documented directives defining these are critical in definingscope of the project, the principles that are to guide it, and themethod by which its success will be measured. At the outset ofthe design process, value should be assigned to such issues aspeople’s expectations or the improvements in productivity. Aswith other criteria, each solution should be evaluated as to itssuccess in meeting the soft criteria. In the end, a project’ssuccess and economy must be measured by both the hard andsoft criteria.
©Copyright ISPE 2001

68 PHARMACEUTICAL ENGINEERING • NOVEMBER/DECEMBER 2000
R&D Facility Design
Remember: facilities are only part of the means to achievingthese objectives, and never the objectives themselves. Experi-ence indicates that this is seldom a one-way, top-down, singlepass process. Both the crystallization of the objective then thedevelopment of the solution goes through iterative stages thatrequire ongoing dialogue with those who initially set theobjectives.
Rare are the pharmaceutical scientific processes or labora-tory design and construction projects that do not demand greateffective responses to the scientific needs, speed, and rigid costcontainment. Therefore, to make good decisions it is importantto establish the scientific, scheduled, cost criteria, and othercritical criteria against which solutions will be judged. Allsubsequent design options must include information on thesecriteria. For example, if cost is a major controller, then theevaluation of each option must include a cost comparison withthe other options as well as with the original budget criteria.It is best to hit these issues straight on.
Soft issues also must be evaluated. It is a continuing themein this article that these may have a greater impact on theoverall economic issues a company may be facing than theactual cost of building and operating R&D facilities. At theheart are issues about people and how they work together andwhat they want their environment to be. As these were coveredin Part 1, it is sufficient here to note that any programmaticstatement of needs should describe and diagram these moresubjective requirements in explicit terms. Some, access tonatural light and a view of the outside, for example, can behighly controversial issues that will impact the shape of labsand influence where people gather. Therefore, design optionsshould be evaluated as to their relative effectiveness in meet-ing these softer criteria.
What are the Current Conditions?What is the starting point for this project? These are the factsand assumptions that exist at the point in time when decisionsare made. It is essential to document these facts and assump-tions for later reference. Over the lengthy period of a construc-tion project, conditions generally change. What once was aperfect solution may be completely wrong if the operatingconditions change. For example, a construction schedule andbudget may be adversely influenced by the introduction ofanother project competing for local resources within the samegeographic region. If the assumptions about labor availabilitywere established with the initial budget, it is easier to under-stand the forces which may lead to bid escalation.
How Can Creative Solutions to Meet These Needs beFostered?Predetermination of the “right” solution must be avoided. Likethe scientific process, untested assumptions and preconceivedideas inevitably get in the way of good work. Architecture andengineering requires a creative leap backed by a lot of hardwork. Design is the process of seeking alternative solutions forbridging the gap between current reality and desired futureoutcomes. Workable concepts are saved while rationally filter-ing out weaker possibilities.
Good solutions arise from testing alternative ideas againstthe objectives and requirements of the project. And for each,alternative ways to obtain the same result should be identi-fied. In a cGMP process development facility, the objective ofmaximizing return on investment leads to the need to turn overfewer rooms. A similar response may maximize the use of
equipment, which, in turn meant limiting fixed equipment. Thishad the added advantage of allowing the equipment to be sentto a specialized area retooling. At the end, a concept survivesthat coalesces need with limitations and restrictions.
As with any criteria, it is essential to define subjectiveterms. Workable concept has many perspectives. Along the wayit is important to do a reality check: Are the concepts and whatit takes to implement them possible? For example, does thecost outweigh the gain? Does the proven technology exist tosupport a new approach? A project won’t get very far until theobjectives and what is needed to achieve them are in align-ment.
A useful sorting process to develop workable solutions is tolook at each issue in a comprehensive way that is a microcosmof the overall approach. First, each issue seeks its own level ofapplication in a project, from broad, non-scalar issues such asbusiness mission to narrow, highly refined performance de-tails. Second, each issue should be examined for its own set ofstarting conditions, future goals, workable bridging concepts,and implementation needs. Finally, each concept is testedagainst the considerations of budget, schedule, form, andfunction.
The disciplined search for alternative solutions has anadditional advantage in that hereto-unrecognized problems orother probable solutions may surface.
What are the Specific Needs to Make a Concept Work?It is essential to understand what needs to happen to achievethe objectives via a specific concept. What are the activities,functions, equipment, relationships, flow, codes, regulations,etc. that need to align to produce the desired result? Eachshould be challenged to confirm the validity of its contributionto the initial objectives. The result is both a catalogue ofconstituent activities and an enlightened understanding ofopportunities for intervention. This becomes the statement ofneeds for the project. It is well documented, supported bybusiness objectives, and identifies the simplest and mostdirect route to implementation.
To achieve a well defined needs statement, begin with anexamination of the constituent parts and understand theirrelationships and interactions. It is important to test eachrequirement as you progress. Successfully converting objec-tives into needs requires a careful understanding of how theproject will work: what size, processes, flow, activities, skills,special equipment, documentation, etc. are required. At thispoint, it is now possible to identify all the components of theorganization who can verify their needs will be addressed.
The lessons learned from this exercise will identify whatneeds have changed from the previous generation of designsolutions. This knowledge of current and potential facility useactivities helps to anticipate change and push off obsolescence.
A Summary of Management Basics forImplementing Emerging Trends
Here are some basic tools for successfully implementing projectsin a dynamic technology business. While most of these haveapplication to every project, they are essential for projects withcontinuously evolving needs.
• Be objective. Define requests and needs as justifications,not simply as requirements.
• Define subjective terms with limits and specific expecta-tions.
©Copyright ISPE 2001
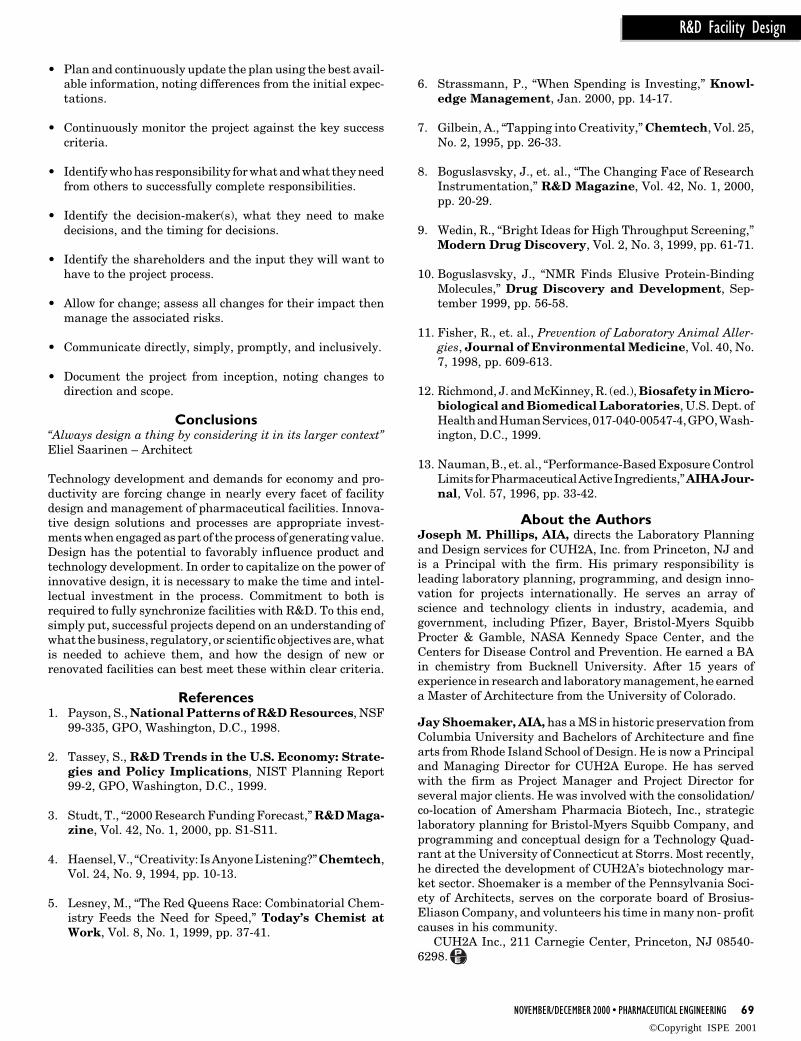
NOVEMBER/DECEMBER 2000 • PHARMACEUTICAL ENGINEERING 69
R&D Facility Design
• Plan and continuously update the plan using the best avail-able information, noting differences from the initial expec-tations.
• Continuously monitor the project against the key successcriteria.
• Identify who has responsibility for what and what they needfrom others to successfully complete responsibilities.
• Identify the decision-maker(s), what they need to makedecisions, and the timing for decisions.
• Identify the shareholders and the input they will want tohave to the project process.
• Allow for change; assess all changes for their impact thenmanage the associated risks.
• Communicate directly, simply, promptly, and inclusively.
• Document the project from inception, noting changes todirection and scope.
Conclusions“Always design a thing by considering it in its larger context”Eliel Saarinen – Architect
Technology development and demands for economy and pro-ductivity are forcing change in nearly every facet of facilitydesign and management of pharmaceutical facilities. Innova-tive design solutions and processes are appropriate invest-ments when engaged as part of the process of generating value.Design has the potential to favorably influence product andtechnology development. In order to capitalize on the power ofinnovative design, it is necessary to make the time and intel-lectual investment in the process. Commitment to both isrequired to fully synchronize facilities with R&D. To this end,simply put, successful projects depend on an understanding ofwhat the business, regulatory, or scientific objectives are, whatis needed to achieve them, and how the design of new orrenovated facilities can best meet these within clear criteria.
References1. Payson, S., National Patterns of R&D Resources, NSF
99-335, GPO, Washington, D.C., 1998.
2. Tassey, S., R&D Trends in the U.S. Economy: Strate-gies and Policy Implications, NIST Planning Report99-2, GPO, Washington, D.C., 1999.
3. Studt, T., “2000 Research Funding Forecast,” R&D Maga-zine, Vol. 42, No. 1, 2000, pp. S1-S11.
4. Haensel, V., “Creativity: Is Anyone Listening?” Chemtech,Vol. 24, No. 9, 1994, pp. 10-13.
5. Lesney, M., “The Red Queens Race: Combinatorial Chem-istry Feeds the Need for Speed,” Today’s Chemist atWork, Vol. 8, No. 1, 1999, pp. 37-41.
6. Strassmann, P., “When Spending is Investing,” Knowl-edge Management, Jan. 2000, pp. 14-17.
7. Gilbein, A., “Tapping into Creativity,” Chemtech, Vol. 25,No. 2, 1995, pp. 26-33.
8. Boguslasvsky, J., et. al., “The Changing Face of ResearchInstrumentation,” R&D Magazine, Vol. 42, No. 1, 2000,pp. 20-29.
9. Wedin, R., “Bright Ideas for High Throughput Screening,”Modern Drug Discovery, Vol. 2, No. 3, 1999, pp. 61-71.
10. Boguslasvsky, J., “NMR Finds Elusive Protein-BindingMolecules,” Drug Discovery and Development, Sep-tember 1999, pp. 56-58.
11. Fisher, R., et. al., Prevention of Laboratory Animal Aller-gies, Journal of Environmental Medicine, Vol. 40, No.7, 1998, pp. 609-613.
12. Richmond, J. and McKinney, R. (ed.), Biosafety in Micro-biological and Biomedical Laboratories, U.S. Dept. ofHealth and Human Services, 017-040-00547-4, GPO, Wash-ington, D.C., 1999.
13. Nauman, B., et. al., “Performance-Based Exposure ControlLimits for Pharmaceutical Active Ingredients,” AIHA Jour-nal, Vol. 57, 1996, pp. 33-42.
About the AuthorsJoseph M. Phillips, AIA, directs the Laboratory Planningand Design services for CUH2A, Inc. from Princeton, NJ andis a Principal with the firm. His primary responsibility isleading laboratory planning, programming, and design inno-vation for projects internationally. He serves an array ofscience and technology clients in industry, academia, andgovernment, including Pfizer, Bayer, Bristol-Myers SquibbProcter & Gamble, NASA Kennedy Space Center, and theCenters for Disease Control and Prevention. He earned a BAin chemistry from Bucknell University. After 15 years ofexperience in research and laboratory management, he earneda Master of Architecture from the University of Colorado.
Jay Shoemaker, AIA, has a MS in historic preservation fromColumbia University and Bachelors of Architecture and finearts from Rhode Island School of Design. He is now a Principaland Managing Director for CUH2A Europe. He has servedwith the firm as Project Manager and Project Director forseveral major clients. He was involved with the consolidation/co-location of Amersham Pharmacia Biotech, Inc., strategiclaboratory planning for Bristol-Myers Squibb Company, andprogramming and conceptual design for a Technology Quad-rant at the University of Connecticut at Storrs. Most recently,he directed the development of CUH2A’s biotechnology mar-ket sector. Shoemaker is a member of the Pennsylvania Soci-ety of Architects, serves on the corporate board of Brosius-Eliason Company, and volunteers his time in many non- profitcauses in his community.
CUH2A Inc., 211 Carnegie Center, Princeton, NJ 08540-6298.
©Copyright ISPE 2001

42 PHARMACEUTICAL ENGINEERING • NOVEMBER/DECEMBER 2000
Capability Study
Application of a Capability Studyto a Syringe Filling OperationPart 1 of 2: Validation, Capability Theory, andProtocol Design
Application of a Capability Studyto a Syringe Filling OperationPart 1 of 2: Validation, Capability Theory, andProtocol Design
Tby Peter A. Hugunin
This two partarticle describesthe steps fromthe purchase andsales agreement,throughqualification andcapability studies,to setting in-process controlspecifications.
This two part article describes the stepsfrom the purchase and sales agreement,through qualification and capability
studies, to setting in-process control specifica-tions. It ties the purchase and sales agreementas well as manufacturing specifications, throughthe study design, execution, and analysis, to themission of validation as well as to manufactur-ing and regulatory affairs requirements.
Part 1 offers several organizational and philo-sophical perspectives and tools including a clearand meaningful distinction between machineand process capability as well as between shortterm and long term studies. The value of equip-ment qualification is discussed as it relates toprocess validation. Part 1 concludes with thediscussion of an actual protocol designed for atypical filling machine.
Part 1: Validation, Capability Theory,and Protocol Design
Introduction and Justification forCapability StudyThe focus of all qualification and validationefforts is the generation of productive knowl-edge, i.e. knowledge useful in the understand-ing, and where economically or ethically re-quired, control or elimination of unacceptablevariation. Nothing is more important to manu-facturing than advance assurance that a ma-chine or process will be able to hold the toler-ances. Capability studies offer an approach tomeasuring and summarizing the inherent vari-ability in machines and processes (Natural Pro-cess Limits) and are often the best tool availablefor qualification and validation activities.Broadly speaking, there are two types of capa-bility studies: The machine capability studywith its indices and the process capability studywith its indices.1-3 A capability index is a ratiostatistic which relates the equipment or processcenter and variation to the applicable tolerance- Table A.
The machine capability study varies from
the process capability study not in the statisti-cal approach or models employed, but only in itscomplexity. It is an evaluation of the equipment’s“natural process limits” and exploration of itsability to meet predefined tolerances. It is oftenconducted for Factory Acceptance Testing (FAT)or periodically to test the functionality of theequipment and forms the foundation for a ca-pable process.1 If short-term it may be viewed asa best-case scenario.3 The process capabilitystudy considers all process variables which mayhave an impact upon the product’s quality at-tribute under study. This scope difference makesit a far more formidable task than the machinecapability study. Also, because quantity pro-ducible over time, re-tooling, and maintenancewill always be of production and hence manage-ment concerns, the further distinction betweenshort-term and long-term capabilities is rel-evant.
As can be seen from a review of the statistics(Table A), this quality tool provides only ameans of summarizing the relationship betweenthe “natural” limit of the machine or process --- given the then current state of control --- to theacceptable tolerance limits. Additional qualifi-cation work must define and document the stateof control as well as relate the indices (Cm, Cmk
and Cp, Cpk)* to an acceptable rate and/or quan-tity of production. Although it may be used tosupport a validated process and set up Statisti-cal Process Control (SPC) it is not a stand alonetool for the elimination of systematic processvariation, or reduction of cycle time except forthe clear reduction of in-process sampling.
* Although no information is gained by view-ing the inverse of these ratios they are alsoemployed in describing capability.
With an understanding of the statistic and itslimitations, it is now possible to review theapplication with a better understanding. In thecase problem presented, a syringe filling opera-
Reprinted from The Official Journal of ISPE
PHARMACEUTICAL ENGINEERING November/December 2000, Vol. 20 No. 6
©Copyright ISPE 2001

NOVEMBER/DECEMBER 2000 • PHARMACEUTICAL ENGINEERING 43
Capability Study
tion, the cost of failure was categorized as potentially cata-strophic from both an economic and ethical prospective; fur-thermore, the specified tolerance for this new piece of equip-ment --- awaiting delivery and installation --- was 0.2ml +/- 5%.A “best-case” FAT application involving the machine’s naturalprocess limits thus presented itself. Additionally, since therewas a pre-defined tolerance, quantifiable with a quality at-tribute measurable on a ratio scale, it would be possible torelate this tolerance to the NPL in both a Cm and eventually aCmk index. Hence, the application of a straight-forward short-term machine capability study was indicated.1
Pre-Site Preparation and the Test ProtocolThe Fishbone: Organizing the VariablesIn the preparation for any qualification or validation effort, allsources of variation must be considered; however, it is criticalthat assignable causes of variation be evaluated in light of bothcosts and impact upon meeting actual operating specificationand not solely from an engineering or statistical perspective.Otherwise, costs will outweigh benefits if resources do not runout first. Several approaches may be used finding these vari-ables for the test protocol(s). Typically in our industry, this isaddressed by the validation team and those on the review list.This approach functions very much like an expert panel.Whatever approach is used, it is best to organize these variablesin some fashion prior to designing the actual test protocol.
Generally, the capability study will be one of several partsin a test protocol set, therefore, organizing the known andsuspected sources of variation early on will be of use through-out the project and the equipment life-cycle. The objective ofthis exercise is to first list then organize the process variablesso that they might be addressed and not to establish cause-and-effect relationships. The Fishbone (Cause-Effect) Dia-grams utilizes the five basic categories into which all variablesmight be thrown Materials, Man, Method, Machine, and Mi-lieu.4 Other suitable frameworks also may be applied.5-6 It isadvisable to avoid lengthy theoretical discussions as to whichcategory a variable might better fall into. For example: specificplacement of ancillary equipment such as racks. Man orMethod? If there is no SOP available, perhaps place in the Mancategory; if there is an SOP available, than place in the Methodcategory.
Depending upon your organization, it may become neces-sary to further identify those variables/factors which areeconomically addressable, assignable, controllable, non-con-
Figure 1. Partial fishbone.
trollable, random, non-random, etc. for cost analysis and prior-ity setting. Again, avoid unproductive theoretical discussionswith respect to cost calculations (engineering vs. cost models vs.cost-of-poor quality models).
In any machine capability study, the focus is necessarilyupon the machine. This study was considered a best casescenario especially since the equipment manufacturer wasavailable to assist. Keep in mind, it is not necessary to have allsources of variation (whether random or nonrandom) undercontrol prior to beginning a capability study. Some sources ofvariation may be explored in the study itself, others may not beeconomically addressable, and yet others may have no impactupon meeting the operating specification and hence receive nopriority from management. It is necessary to have resources,personnel, materials, and suitable test equipment to conductthe planned study. It is also necessary to have the major factorsknown or suspected to have an impact upon the target (fill)under control. In the case presented, several variables wererequired to be in control prior to start: the pumps, the syringes,the fill fluid, the fill needles, and the level of both the machineand trays - Figure 1.
The Design Concept and Sampling PlanOur first encouragement came when a review of the Purchaseand Sales Agreement revealed that the intended use wouldaccept a variation much larger than the vendor reported(approximately 3 1/3 times larger).
Tolerances reported by Tolerances set byVendor in Purchase and Manufacturing/Owner:Sales Agreement:Fill Volume Srel
From 0.2 till 0.6 ml ± 1.5% 0.2ml ± 5% 0.2ml ± 0.01mlFrom 0.6 till 1 ml ± 1.0% 1.0ml ± 5% 1.0ml ± 0.05ml
_C = Srel = (S/ x) (100%)
z2σ2
To use the sample size calculation formula, n = ____, we needh2
only an estimate for σ2, the population variance. Two ap-proaches to obtaining this estimate are available. First, usethe vendor-reported worst-case scenario and second, performa pilot study. Upon inquiries the need for a pilot study, basedprimarily upon a good vendor relationship, was ruled out.
Under the selected approach each fill range and associated
©Copyright ISPE 2001

44 PHARMACEUTICAL ENGINEERING • NOVEMBER/DECEMBER 2000
Capability Study
RSD would be reviewed to yield the worst-case estimate of σ2.This was found to be at the vender reported RSD of 1.5% and0.6mL fill volume. In simple terms, this may be viewed as(0.6mL) (0.015) = 0.009mL. Alternately, it may be viewed as
s1.5 = ____ 100. Solving for S, the standard deviation, we again
0.6obtain 0.009mL. Our estimate therefore for σ2 is (0.009)2.
The allowable half-width, h, in the error of measurementwas set at 0.01mL/2 or 0.005mL. And, the selected confidencecoefficient of 99% [cc = 99% ( 1- α/2)] yields a z-value of 2.576,i.e. z(0.995) = 2.576. Finally, this resulted in the sample sizecalculation below:
(2.576)2 (0.009)2
n = ________________ = 22, hence, for reasons which will(0.005)2
become clear in Part 2 of this article, a sample size of 24 wasselected.
The basic design would call for production at maximumspeed for at least 12,000 units while 5 subsamples each of size24 would be drawn. This would permit some process controlduring the study; the building of a 99% confidence interval(C.I.) on the population mean for each of the planned fivesubgroups; and, would be sufficient to form the foundations ofour capability study as well as build control charts for produc-tion purposes. Note, that a sample size of 24 is not alonesufficient to determine machine capability. Sampling wasplanned for several hours of production from which a system-atic sample in time-ordered sequence was to be taken andanalyzed. This model necessarily assumes that target andvariation between samples is constant. The test fluid wasselected by the owner/manufacturer to substantially matchthe viscosity and density of an actual product.Additional General ConsiderationsIt can not be overemphasized that the central issue is one ofprediction limits (a confidence band on the population distri-bution) and not confidence limits on a summary statistic suchas the population mean. In a capability study, the interest liesin calculating from process data the limits which will containall future observations (production units) and not with defin-ing an interval within which a population statistic, such as themean, lies. This is not peculiar to the pharmaceutical industry,but rather characteristic of all machine and process capabilitystudies whether for parenterals, nuts and bolts, or cardboardboxes. Only the measures and the tolerances vary from oneproject/industry to the next.
It is not possible to have perfect knowledge of the machine’soperating characteristics prior to starting first time qualifica-tion testing so plan accordingly: over plan. Collect, time per-mitting, more data than necessary. It may be a long way to thevendor or customer site (in our case Schabish Hall, Germany)so plan accordingly. You may have only one chance at collect-ing the information and data. Investigate additional factors orparameters only if time permits. The trip to Schwabish Hall,Germany, was planned well in advance and included a sched-ule for data collection for the capability study. It was furtherarranged that the vender would assist by assigning one tech-nician full time and others ad-hoc to our studies and the owner/manufacturer provided an electrician thus making an execu-tion team of size three.
Capability may be calculated in various ways:1. using a frequency distribution and histogram2. using probability paper3. using control charts4. using other methods ... graphic analysis, DOE, or ANOVATable A. The tool and its applications.
Juran, J.M. and Frank M. Gryna Jr.5
No distinction between machine and process capability studies• to predict the extent to which the process will be able to hold
tolerances• to choose from among competing processes that is most appro-
priate for the tolerances to be met• to plan the interrelation of sequential processes. For example,
one process may distort the precision achieved by a predeces-sor process, as in hardening of gear teeth. Quantifying therespective process capabilities often points the way to a solution.
• to provide a quantified basis for establishing a schedule ofperiodic process control checks and readjustments
• to assign machines to classes of work for which they are bestsuited
• to test theories of cause of defects during quality improvementprograms
• to serve as a basis for specifying the quality requirements forpurchased machines
It is not necessary to remove all assignable causes of variation priorto start of study and generation of Cp index.
Ott, Ellis R., and Edward G. Schilling2
No distinction between machine and process capability studies.Short-run capability study termed a “Process-performance Check”Study:• investigation of process through Control Charts• elimination of nonrandom behavior when justified economically
or qualityIt is necessary to remove all (economic) assignable causes ofvariation prior to start of study and generation of Cp index.Process capability can only be measured when the process itself isin control.
Wheeler, Donald J., and David S. Chambers3
Distinguishes between:• Short Term Capability• Hypothetical Process Capability• Capability
Blank, Hans-Peter et al.1
MFU (Machine Capability)• the examination of a machine’s actual capability to meet pre-
defined production tolerances• the basis for factory acceptance of a new machineShort-term planning.PFU (Process Capability)• the testing of process parameters• the elimination of all systematic process variation• the minimization of testing and failure costs• the reduction of cycle timeLong-term planning.(translated from the original German by Peter A. Hugunin)
Min UTL – µandµ – LTL UTL – LTLCmk = ____________________ Cm = __________
3σ 6σ
This author finds the distinction between machine and processcapability studies to be useful for theoretical, organizational, andpractical reasons. Additionally, because quantity producible overtime, re-tooling, and maintenance will always be of production andhence management concerns the distinction between short andlong-term will always be necessary. The calculation of a hypotheti-cal capability3 also shows some utility. It may be shown, for example,that in the case problem presented, Cmk is equivalent to the hypo-thetical process capability.
Although capability statistics are a useful stand-alone quality toolthey are best used in conjunction with other quality tools such asDesign Of Experiment (DOE); process re-engineering and flow-diagramming; Statistical Process Control (SPC); and, Failure ModeEffect Analysis (FMEA).
©Copyright ISPE 2001

NOVEMBER/DECEMBER 2000 • PHARMACEUTICAL ENGINEERING 45
Capability Study
Abbreviation Term’s Meaning
UTL – LTLCm Machine Capability: Cm = __________
6σMin UTL – µandµ – LTL
Cmk One sided machine capability: Cmk = ____________________. This analysis recognizes that the machine will not operateprecisely at the set-point. 3σ
Cp Process Capability: Statistically the same as Cmk but the analysis is for the process and not just the machine.
Cpk One sided process capability.
(s)C (Srel , RSD) The Relative Standard Deviation: RSD = Srel = C = 100 ____
x
d2 This is an adjustment factor taken from a statistical table. See Ott, Ellis R., and Edward G. Schilling2 (p. 213 and Table A.11).
FAT Factory Acceptance Test(ing). Any testing done prior to the Sit Acceptance Testing (SAT).
h Desired Half-width of the confidence interval (CI). How close must the estimate (sample mean) be to the population meanfor it to be meaningful to the application?
k The k factor is a function of the confidence coefficient, the percent of the population to be included within the tolerancelimits, and the sample size. See Juran, J.M. and Frank M. Gryna Jr.7 (p. 299 and Appendix Table K).
ng The subgroup sample size from which range, xbar, xmax and xmin values are calculated. This, in our analysis, is the number ofcolumns, i.e. 4. It represents the smallest number of filled syringes analyzed as one group.
NPL Natural Process Limit. The limits within which virtually all individual observations/values will fall for any system which_displays a reasonable degree of statistical control. = R =
In Part 2 of this paper this will be examined under two approaches: NPL = x ± 3 ___ and NPL = x ± kSm.d2
OEM Original Equipment Manufacturer.
nsi
Σ Rri_ i = 1R The mean range. Rsi = ________
_ nsi
Rsi is the range of the ith Sample Group (S1, S2, S3, S4, or S5). _nsi, is the Sample size with respect to individual range calculation, Rsi. This is three for Sample Group S1, and is five for all others.Rsi, is the Range of the rth row in the ith Sample Group.This will become clear in Part 2 of this article where samples are actually drawn, organized, analyzed and turned into productive information.
RSD (C,Srel) Relative Standard Deviation.
s (Sm) Sample Standard Deviation. s represents the filling variation as calculated from OEM provided information in the purchaseand sales agreement. Sm simply indicates those calculated in our studies.
n _ _ nSm = √ Σ ( xi - x )2 / n-1 x = Σ i = 1
xi / ni = 1
UTL and LTL Upper Tolerance Level and Lower Tolerance Level. This is also known as USL and USL, Upper and Lower SpecificationLimit. Not to be confused with Upper Control Limit and with Lower Control Limit which will be set up in Part 2 of this articlefor Statistical Process Control (SPC) purposes.
z The distance, in standardized deviations, a point (X) is from the mean under a normal standard distribution curve, i.e. adistribution with a mean of 0 and a standard deviation of 1. Note: The standard normal distribution may be denoted by N(0/1) and our actual distribution may be denoted by N(φ/σ2). Any N(φ/σ2) may be normalized.
_ _ _(X – µ) (x – E {x}) x – µ
Z = __________ or, for the sample distribution: Z = __________ = __________σ σ{ x} σ/√n
ANOVA ANalysis Of VAriance
cc Confidence Coefficient (1 - α). The degree of confidence with which the estimate falls within the given interval.
C.I. Confidence Interval. The interval within which the estimate will fall.
DOE Design of Experiment._R Mean of the Ranges.
=x Grand mean or average of the averages.
xi An individual observation (of syringe fill weight or empty syringe weight)._ =
µ Population mean - in practical terms this is the set-point. Estimates for this include x and x.
Table B. Index of abbreviations and terms used in Part 1.
©Copyright ISPE 2001

46 PHARMACEUTICAL ENGINEERING • NOVEMBER/DECEMBER 2000
Capability Study
Sometimes a simple plot of individual units against tolerancelimits, with no statistical analysis, is sufficient to draw conclu-sions7 — as will be seen in Part 2 of this article. The finalapproach and solutions to our particular case are outlined inthe protocol below.
OQ- Machine Capability Study (Cm and Cmk)Objectives and Acceptance Criteria1. The machine is operator adjustable to a target of 0.2ml.2. Once set, the machine is capable of filling at least 12,000
syringes, without intervention, which meet the requiredspecification, i.e. 0.2ml +/- 0.01ml.
3. Cmk ≥ 1.33
Procedure1. General
1.1 Collected data are to be entered into the table formatprovided.
1.2 Test instrument accuracy and precision is to be atleast 4 times better than +/- 0.01ml (+/- 0.01g) , i.e. +/- 0.0025ml (+/- 0.0025g).
1.3 WFI water cooled to ambient is to be used as the testfluid.
1.4 Confidence interval about µ is to be at least 99%.
1.5 Data are to be entered into an electronic formatsuitable for electronic spreadsheet analysis, e.g. Ex-cel.
1.6 After start of data collection, there are to be nomachine adjustments.
1.7 Record the ambient temperature, relative humidity,and test fluid temperature.
2. Data Evaluation2.1 The sample data sequence is to be maintained in the
table and the charts._
2.2 Construct an x and xmin/xmax chart.
2.3 The population is tested for fit to normal distribution.=2.4 Construct an x and xmin/xmax charts.
2.5 Calculate the natural process limits of this machine.= __x ± 3 R /d2 ng = 4 ∴ d2 = 2,059
ReferencesDoc. ID Document Description or Title205-A-001-00 Sales and Purchase AgreementDIN 55350-33 German Industrial Norm specify-
ing acceptance limits and interpre-tation of the capability index.
MIL-STD 4566A (1988) Calibration System Requirements
NoteMIL-STD 4566A (1988) was used rather than DIN ISO 10012Part 1 (Quality assurance required for measuring equipmentPart 1: Meteorological confirmation system for measuring equip-ment) because under DIN ISO 10012 Teil 1 Section 4.3 Guid-ance error attributable to the calibration may be up to 33%whereas under MIL-STD 4566A (1988) section 5.2 this attrib-utable error may be a maximum of 25%. It was felt the extra 8%would reduce both the alpha and beta risks in decision making.It also was available at no additional costs.
References1. Blank, Hans-Peter., Ekbert Hering, and Jürgen Triemel,
“Maschinenfähigkeitsuntersuchung (MFU) und statistischeProzeßregelung (SPC),” Qualitätsmanagement fürIngenierure, Dritte überarbeitete Auflage, Düsseldorf:VDI-Verlag GmbH, 1996, pp. 196-226.
2. Ott, Ellis R., and Edward G. Schilling, “On ImplementingStatistical Process Control,” Process Quality Control, 2nd.Edition, New York NY: McGraw-Hill, Inc., 1990, pp. 171-219.
3. Wheeler, Donald J, and David S. Chambers, “Capability,Stability, and World Class Quality,” Understanding Statis-tical Process Control, 2nd Edition Knoxville, Tenn.: SPCPress Inc., 1992, pp. 117-147.
4. Blank, Hans-Peter., Ekbert Hering, and Jürgen Triemel,“Qualitätsmanagement im Klein- und Mittelbetrieb,”Qualitätsmanagement für Ingenierure, Dritte überarbeiteteAuflage, Düsseldorf: VDI-Verlag GmbH, 1996, pp. 395-421.
5. Juran, J.M. and Frank M. Gryna Jr., “Quality Improvement- Management Controllable Defects,” Quality Planning andAnalysis (From Product Development through Use), 2nd
Edition, NY New York: McGraw-Hill Publishing Company,1980, pp. 99-137.
6. Wheeler, Donald J., and David S. Chambers, “GettingStarted,” Understanding Statistical Process Control, 2nd
Edition Knoxville, Tenn.: SPC Press Inc., 1992, pp. 309-320.
7. Juran, J.M. and Frank M. Gryna Jr., “Manufacture - Statis-tical Aids,” Quality Planning and Analysis (From ProductDevelopment through Use), 2nd Edition, NY New York:McGraw-Hill Publishing Company, 1980, pp. 283-313.
About the AuthorPeter A. Hugunin is currently a Validation Engineer atWatson Laboratories in Corona, CA. He has held field serviceengineering and sales engineering positions prior to enteringa validation career. His validation experience has ranged fromdesigning and implementing quality systems and master vali-dation plans, to qualification as well as validation work atseveral cGMP facilities. He holds a BS degree from SUNYPlattsburg and an MBA from Syracuse University. He hasbeen a member of various professional organizations includingASQC, PDA, and ISPE.
Watson Laboratories, 311 Bonnie Circle, Corona, CA91720.
©Copyright ISPE 2001

34 PHARMACEUTICAL ENGINEERING • NOVEMBER/DECEMBER 2000
Hot Water Sanitization
Hot Water Sanitization ofContinuous ElectrodeionizationSystems
Hot Water Sanitization ofContinuous ElectrodeionizationSystems
T
by Jonathan Wood, Junya Hirayama, and Shigeaki Satoh
This article willdiscussconstruction ofhot watersanitizable CEDImodules andsystems, as wellas sanitizationprocedures. Datawill be presentedshowing theeffect of the hotwatersanitization onCEDI moduleperformance,including productwaterconductivity andTOC.
Introduction
T he process of continuous elec-trodeionization (CEDI) uses ion ex-change membranes, ion exchange res-
ins, and a DC electrical potential to removeionizable materials from water. This processhas been in use for more than 10 years in theproduction of USP Purified Water, as an alter-native to mixed-bed deionization. One of themain advantages of the process is that it doesnot require chemicals to regenerate the ionexchange resins since the DC field regeneratesthe resins electrochemically. Another advan-tage is that the electric field helps minimizebacteria growth in the resin bed. CEDI is usu-ally installed downstream of a Reverse Osmosis(RO) system to remove contaminants that havenot been (or can not be) removed by the RO.
In most cases, it is desirable to be able toperiodically sanitize the RO system as well asthe CEDI system. Until recently, constructionof RO and CEDI devices has required thatdisinfection be performed chemically, using non-oxidizing biocides. There are a number of poten-tial advantages to sanitizing with hot water(65-80°C), including avoidance of chemical han-dling and disposal; better penetration and inac-tivation of biofilm; faster rinseup and easiervalidation. RO membranes and systems ca-pable of hot water sanitization have been avail-able for a few years, but only recently have hot-water sanitizable CEDI modules become avail-able.
Water Quality SpecificationsThe U.S. Pharmacopeia (USP) dictates the pu-rity of water used for the manufacture of phar-maceuticals. The compendial grades of watermust meet a specification for conductivity andtotal organic carbon (TOC).1 In order to meetthese specifications it is often necessary to usea membrane process such as RO orUltraFiltration (UF) in combination with an ionexchange process such as CEDI or service deion-ization (SDI). Using membrane processes alonemay not be sufficient because even double-pass
RO does not effectively remove dissolved gasessuch as carbon dioxide (CO2) or ammonia (NH3).2
Adjustment of the RO inlet pH can ionize one ofthese gases so that it can be removed by the RO.Unfortunately, the optimum pH is much differ-ent for these two contaminants. This problem isbecoming more widespread as more municipalwater supplies are treated with chloramines tolimit the formation of disinfection byproducts,which increases the likelihood that ammoniawill be present in the RO feed water. The ionexchange processes mentioned above are ca-pable of simultaneously removing both CO2 andNH3 to very low levels, and when combined withRO provide a high level of assurance that theTOC and conductivity specifications will be met.
While there is no USP specification for bac-teria, the recommended “action level” is 100colony-forming-units per milliliter (cfu/mL) forPurified Water and 10 cfu/100 mL for Water ForInjection,3 and many companies have set loweraction levels. In practice, the large majority ofsystems are maintained at bacteria counts wellbelow the USP action levels. In order to main-tain the microbial levels below these recom-mended maxima, it is usually necessary to peri-odically sanitize the water purification system.
In most cases, it is practical to meet thePurified Water action level with a properlydesigned RO/CEDI system and periodic chemi-cal sanitization. However, the use of chemicaldisinfectants has a number of disadvantages,including the handling and disposal of hazard-ous chemicals, and validating that all traces ofthe sanitant have been removed before thesystem is returned to service. If the chemicalsolution is not properly prepared and applied, itis possible to permanently damage the expen-sive RO membranes or CEDI cells. Therefore analternative to chemical sanitization is desir-able. Hot water has already been successfullyapplied for sanitization of ion exchange resinbeds4 and reverse osmosis membranes5,6 and istherefore an excellent candidate for CEDI sys-tems.
Reprinted from The Official Journal of ISPE
PHARMACEUTICAL ENGINEERING November/December 2000, Vol. 20 No. 6
©Copyright ISPE 2001

CEDI Module ConstructionThe CEDI process uses ion-selective membranes and a DCelectrical potential to remove salts from solutions by transfer-ring ions from the product stream to a concentrate, or rejectstream. CEDI uses a conductive filler, such as ion exchangeresin, in some or all of the flow compartments, allowing theproduction of ultrapure water.
The most common CEDI devices are plate and frame de-vices consisting of alternating anion and cation ion-exchangemembranes. The ion exchange membranes are not permeableto water (counterions diffuse through water that is trapped inthe matrix of the ion exchange material). The spaces betweenthe membranes are configured to create liquid flow compart-ments with inlets and outlets. These compartments are hy-draulically in parallel and electrically in series. A transverseDC electrical field is imposed by an external power sourceusing electrodes at the ends of the membranes and compart-ments, attracting ions in the liquid to their respective oppo-sitely charged electrodes.
The result is that the ions transfer from the product com-partments (bounded by the anion membrane facing the anodeand the cation membrane facing the cathode) into the reject, orconcentrate compartments (bounded by the anion membrane
““ ““Operation in the laboratory...hasshown that it is possible to constructa CEDI device that can be repeatedly
sanitized with hot water at 65°C.
Figure 1. CEDI device - concentrate screens.
facing the cathode and cation membrane facing the anode).About 80-95% of the water fed to the device becomes purifiedproduct water, while the other 5-20% becomes a concentrate,or reject stream.
The majority of CEDI devices have been constructed withelectrically active media in the product compartments, butusing a non-conductive gasketed screen for the reject compart-ments, as shown in Figure 1. The ion-exchange media en-hances the transport of ions and can also participate as asubstrate for controlled electrochemical reactions. Many dif-ferent media configurations are possible, such as mixed bed,layered bed or single (separate) bed. The performance isstrongly dependent upon the type of ion exchange filler.7
For CEDI devices that are fed low conductivity RO perme-ate, the electrical resistance of the concentrate compartmentsmay limit the passage of current and therefore the removal ofsalt. One of the most recent advances in CEDI has been toincorporate a conductive filler in the concentrate as well as theproduct compartments. This type of CEDI module construc-tion is shown in Figure 2.
The wetted components of a CEDI module include the ionexchange resins, ion exchange membranes, the resin “com-partment,” the electrodes and the manifold blocks used for thepiping connections to direct solutions to and from the device. Inall cases the materials must be selected for compatibility withhot water. In addition, the module must be designed to allowfor any thermal expansion that might occur during the heatsanitization.
This paper will describe results obtained for two differentCEDI systems, one which was a laboratory test unit, andanother that is a commercial system which has now operatedsuccessfully for about 24 months.
Figure 2. CEDI Device - all filled spacers.
©Copyright ISPE 2001
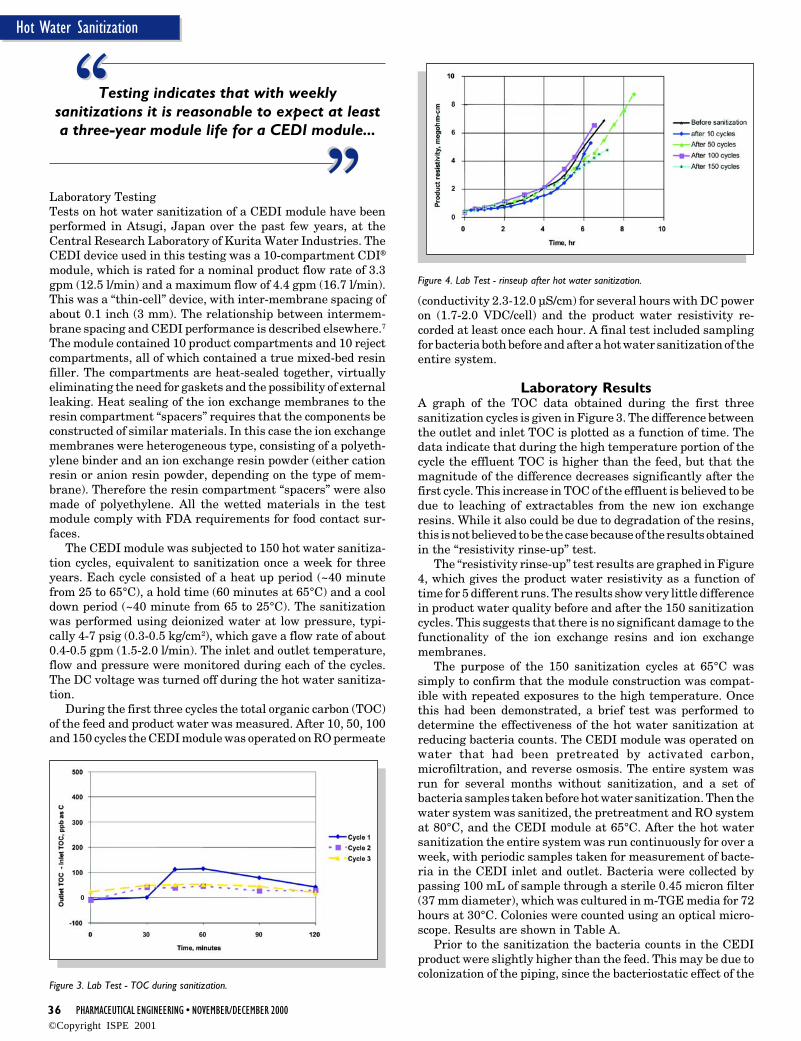
36 PHARMACEUTICAL ENGINEERING • NOVEMBER/DECEMBER 2000
Hot Water Sanitization
(conductivity 2.3-12.0 µS/cm) for several hours with DC poweron (1.7-2.0 VDC/cell) and the product water resistivity re-corded at least once each hour. A final test included samplingfor bacteria both before and after a hot water sanitization of theentire system.
Laboratory ResultsA graph of the TOC data obtained during the first threesanitization cycles is given in Figure 3. The difference betweenthe outlet and inlet TOC is plotted as a function of time. Thedata indicate that during the high temperature portion of thecycle the effluent TOC is higher than the feed, but that themagnitude of the difference decreases significantly after thefirst cycle. This increase in TOC of the effluent is believed to bedue to leaching of extractables from the new ion exchangeresins. While it also could be due to degradation of the resins,this is not believed to be the case because of the results obtainedin the “resistivity rinse-up” test.
The “resistivity rinse-up” test results are graphed in Figure4, which gives the product water resistivity as a function oftime for 5 different runs. The results show very little differencein product water quality before and after the 150 sanitizationcycles. This suggests that there is no significant damage to thefunctionality of the ion exchange resins and ion exchangemembranes.
The purpose of the 150 sanitization cycles at 65°C wassimply to confirm that the module construction was compat-ible with repeated exposures to the high temperature. Oncethis had been demonstrated, a brief test was performed todetermine the effectiveness of the hot water sanitization atreducing bacteria counts. The CEDI module was operated onwater that had been pretreated by activated carbon,microfiltration, and reverse osmosis. The entire system wasrun for several months without sanitization, and a set ofbacteria samples taken before hot water sanitization. Then thewater system was sanitized, the pretreatment and RO systemat 80°C, and the CEDI module at 65°C. After the hot watersanitization the entire system was run continuously for over aweek, with periodic samples taken for measurement of bacte-ria in the CEDI inlet and outlet. Bacteria were collected bypassing 100 mL of sample through a sterile 0.45 micron filter(37 mm diameter), which was cultured in m-TGE media for 72hours at 30°C. Colonies were counted using an optical micro-scope. Results are shown in Table A.
Prior to the sanitization the bacteria counts in the CEDIproduct were slightly higher than the feed. This may be due tocolonization of the piping, since the bacteriostatic effect of the
Figure 4. Lab Test - rinseup after hot water sanitization.
Laboratory TestingTests on hot water sanitization of a CEDI module have beenperformed in Atsugi, Japan over the past few years, at theCentral Research Laboratory of Kurita Water Industries. TheCEDI device used in this testing was a 10-compartment CDI®
module, which is rated for a nominal product flow rate of 3.3gpm (12.5 l/min) and a maximum flow of 4.4 gpm (16.7 l/min).This was a “thin-cell” device, with inter-membrane spacing ofabout 0.1 inch (3 mm). The relationship between intermem-brane spacing and CEDI performance is described elsewhere.7
The module contained 10 product compartments and 10 rejectcompartments, all of which contained a true mixed-bed resinfiller. The compartments are heat-sealed together, virtuallyeliminating the need for gaskets and the possibility of externalleaking. Heat sealing of the ion exchange membranes to theresin compartment “spacers” requires that the components beconstructed of similar materials. In this case the ion exchangemembranes were heterogeneous type, consisting of a polyeth-ylene binder and an ion exchange resin powder (either cationresin or anion resin powder, depending on the type of mem-brane). Therefore the resin compartment “spacers” were alsomade of polyethylene. All the wetted materials in the testmodule comply with FDA requirements for food contact sur-faces.
The CEDI module was subjected to 150 hot water sanitiza-tion cycles, equivalent to sanitization once a week for threeyears. Each cycle consisted of a heat up period (~40 minutefrom 25 to 65°C), a hold time (60 minutes at 65°C) and a cooldown period (~40 minute from 65 to 25°C). The sanitizationwas performed using deionized water at low pressure, typi-cally 4-7 psig (0.3-0.5 kg/cm2), which gave a flow rate of about0.4-0.5 gpm (1.5-2.0 l/min). The inlet and outlet temperature,flow and pressure were monitored during each of the cycles.The DC voltage was turned off during the hot water sanitiza-tion.
During the first three cycles the total organic carbon (TOC)of the feed and product water was measured. After 10, 50, 100and 150 cycles the CEDI module was operated on RO permeate
Figure 3. Lab Test - TOC during sanitization.
““ ““Testing indicates that with weeklysanitizations it is reasonable to expect at leasta three-year module life for a CEDI module...
©Copyright ISPE 2001
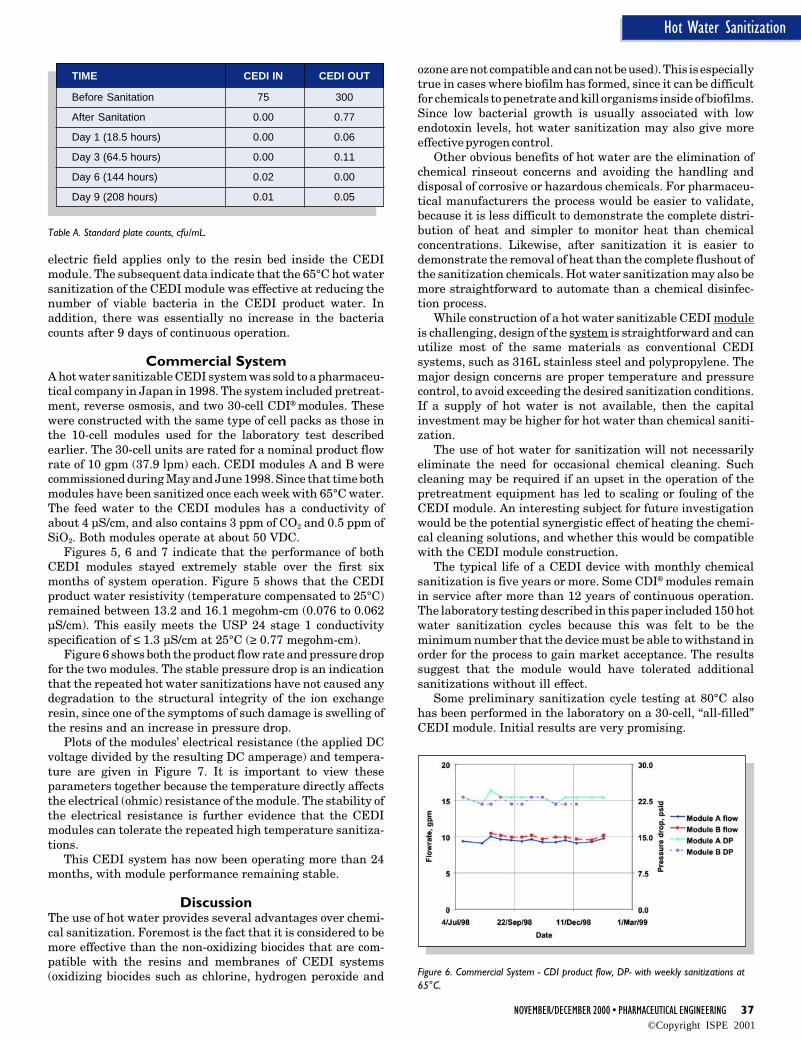
NOVEMBER/DECEMBER 2000 • PHARMACEUTICAL ENGINEERING 37
Hot Water Sanitization
electric field applies only to the resin bed inside the CEDImodule. The subsequent data indicate that the 65°C hot watersanitization of the CEDI module was effective at reducing thenumber of viable bacteria in the CEDI product water. Inaddition, there was essentially no increase in the bacteriacounts after 9 days of continuous operation.
Commercial SystemA hot water sanitizable CEDI system was sold to a pharmaceu-tical company in Japan in 1998. The system included pretreat-ment, reverse osmosis, and two 30-cell CDI® modules. Thesewere constructed with the same type of cell packs as those inthe 10-cell modules used for the laboratory test describedearlier. The 30-cell units are rated for a nominal product flowrate of 10 gpm (37.9 lpm) each. CEDI modules A and B werecommissioned during May and June 1998. Since that time bothmodules have been sanitized once each week with 65°C water.The feed water to the CEDI modules has a conductivity ofabout 4 µS/cm, and also contains 3 ppm of CO2 and 0.5 ppm ofSiO2. Both modules operate at about 50 VDC.
Figures 5, 6 and 7 indicate that the performance of bothCEDI modules stayed extremely stable over the first sixmonths of system operation. Figure 5 shows that the CEDIproduct water resistivity (temperature compensated to 25°C)remained between 13.2 and 16.1 megohm-cm (0.076 to 0.062µS/cm). This easily meets the USP 24 stage 1 conductivityspecification of ≤ 1.3 µS/cm at 25°C (≥ 0.77 megohm-cm).
Figure 6 shows both the product flow rate and pressure dropfor the two modules. The stable pressure drop is an indicationthat the repeated hot water sanitizations have not caused anydegradation to the structural integrity of the ion exchangeresin, since one of the symptoms of such damage is swelling ofthe resins and an increase in pressure drop.
Plots of the modules’ electrical resistance (the applied DCvoltage divided by the resulting DC amperage) and tempera-ture are given in Figure 7. It is important to view theseparameters together because the temperature directly affectsthe electrical (ohmic) resistance of the module. The stability ofthe electrical resistance is further evidence that the CEDImodules can tolerate the repeated high temperature sanitiza-tions.
This CEDI system has now been operating more than 24months, with module performance remaining stable.
DiscussionThe use of hot water provides several advantages over chemi-cal sanitization. Foremost is the fact that it is considered to bemore effective than the non-oxidizing biocides that are com-patible with the resins and membranes of CEDI systems(oxidizing biocides such as chlorine, hydrogen peroxide and
Table A. Standard plate counts, cfu/mL.
TIME CEDI IN CEDI OUT
Before Sanitation 75 300
After Sanitation 0.00 0.77
Day 1 (18.5 hours) 0.00 0.06
Day 3 (64.5 hours) 0.00 0.11
Day 6 (144 hours) 0.02 0.00
Day 9 (208 hours) 0.01 0.05
ozone are not compatible and can not be used). This is especiallytrue in cases where biofilm has formed, since it can be difficultfor chemicals to penetrate and kill organisms inside of biofilms.Since low bacterial growth is usually associated with lowendotoxin levels, hot water sanitization may also give moreeffective pyrogen control.
Other obvious benefits of hot water are the elimination ofchemical rinseout concerns and avoiding the handling anddisposal of corrosive or hazardous chemicals. For pharmaceu-tical manufacturers the process would be easier to validate,because it is less difficult to demonstrate the complete distri-bution of heat and simpler to monitor heat than chemicalconcentrations. Likewise, after sanitization it is easier todemonstrate the removal of heat than the complete flushout ofthe sanitization chemicals. Hot water sanitization may also bemore straightforward to automate than a chemical disinfec-tion process.
While construction of a hot water sanitizable CEDI moduleis challenging, design of the system is straightforward and canutilize most of the same materials as conventional CEDIsystems, such as 316L stainless steel and polypropylene. Themajor design concerns are proper temperature and pressurecontrol, to avoid exceeding the desired sanitization conditions.If a supply of hot water is not available, then the capitalinvestment may be higher for hot water than chemical saniti-zation.
The use of hot water for sanitization will not necessarilyeliminate the need for occasional chemical cleaning. Suchcleaning may be required if an upset in the operation of thepretreatment equipment has led to scaling or fouling of theCEDI module. An interesting subject for future investigationwould be the potential synergistic effect of heating the chemi-cal cleaning solutions, and whether this would be compatiblewith the CEDI module construction.
The typical life of a CEDI device with monthly chemicalsanitization is five years or more. Some CDI® modules remainin service after more than 12 years of continuous operation.The laboratory testing described in this paper included 150 hotwater sanitization cycles because this was felt to be theminimum number that the device must be able to withstand inorder for the process to gain market acceptance. The resultssuggest that the module would have tolerated additionalsanitizations without ill effect.
Some preliminary sanitization cycle testing at 80°C alsohas been performed in the laboratory on a 30-cell, “all-filled”CEDI module. Initial results are very promising.
Figure 6. Commercial System - CDI product flow, DP- with weekly sanitizations at65°C.
©Copyright ISPE 2001
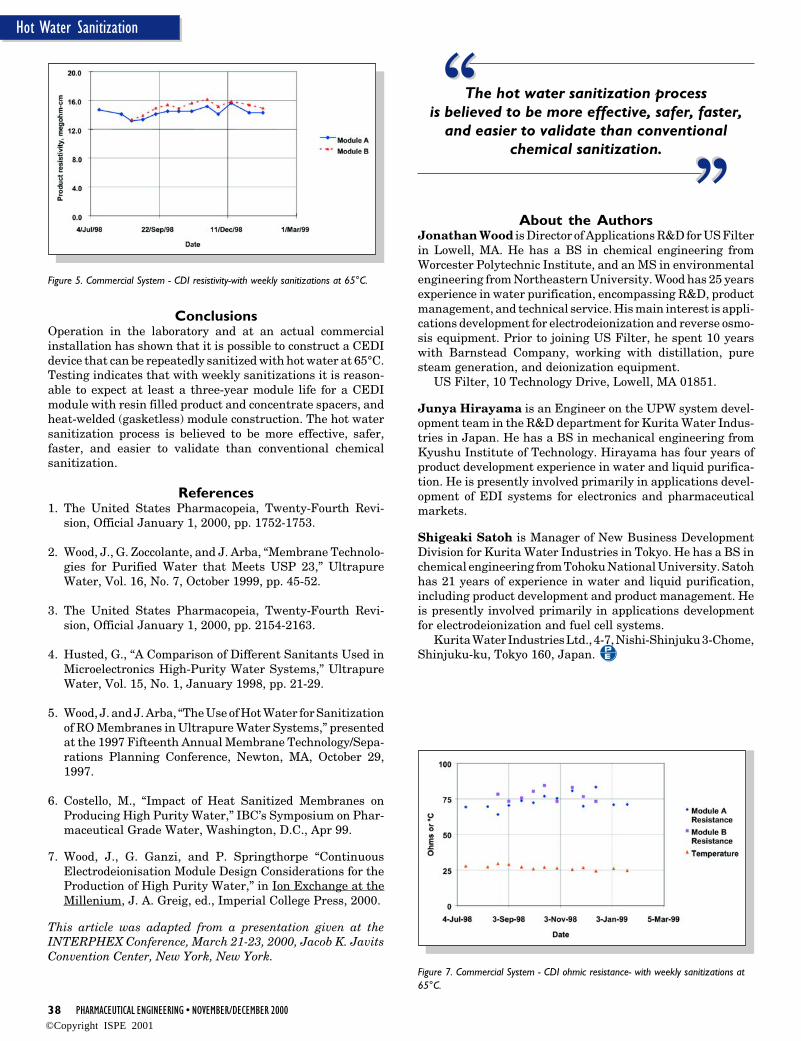
38 PHARMACEUTICAL ENGINEERING • NOVEMBER/DECEMBER 2000
Hot Water Sanitization
““ ““The hot water sanitization processis believed to be more effective, safer, faster,
and easier to validate than conventionalchemical sanitization.
Figure 5. Commercial System - CDI resistivity-with weekly sanitizations at 65°C.
ConclusionsOperation in the laboratory and at an actual commercialinstallation has shown that it is possible to construct a CEDIdevice that can be repeatedly sanitized with hot water at 65°C.Testing indicates that with weekly sanitizations it is reason-able to expect at least a three-year module life for a CEDImodule with resin filled product and concentrate spacers, andheat-welded (gasketless) module construction. The hot watersanitization process is believed to be more effective, safer,faster, and easier to validate than conventional chemicalsanitization.
References1. The United States Pharmacopeia, Twenty-Fourth Revi-
sion, Official January 1, 2000, pp. 1752-1753.
2. Wood, J., G. Zoccolante, and J. Arba, “Membrane Technolo-gies for Purified Water that Meets USP 23,” UltrapureWater, Vol. 16, No. 7, October 1999, pp. 45-52.
3. The United States Pharmacopeia, Twenty-Fourth Revi-sion, Official January 1, 2000, pp. 2154-2163.
4. Husted, G., “A Comparison of Different Sanitants Used inMicroelectronics High-Purity Water Systems,” UltrapureWater, Vol. 15, No. 1, January 1998, pp. 21-29.
5. Wood, J. and J. Arba, “The Use of Hot Water for Sanitizationof RO Membranes in Ultrapure Water Systems,” presentedat the 1997 Fifteenth Annual Membrane Technology/Sepa-rations Planning Conference, Newton, MA, October 29,1997.
6. Costello, M., “Impact of Heat Sanitized Membranes onProducing High Purity Water,” IBC’s Symposium on Phar-maceutical Grade Water, Washington, D.C., Apr 99.
7. Wood, J., G. Ganzi, and P. Springthorpe “ContinuousElectrodeionisation Module Design Considerations for theProduction of High Purity Water,” in Ion Exchange at theMillenium, J. A. Greig, ed., Imperial College Press, 2000.
This article was adapted from a presentation given at theINTERPHEX Conference, March 21-23, 2000, Jacob K. JavitsConvention Center, New York, New York.
About the AuthorsJonathan Wood is Director of Applications R&D for US Filterin Lowell, MA. He has a BS in chemical engineering fromWorcester Polytechnic Institute, and an MS in environmentalengineering from Northeastern University. Wood has 25 yearsexperience in water purification, encompassing R&D, productmanagement, and technical service. His main interest is appli-cations development for electrodeionization and reverse osmo-sis equipment. Prior to joining US Filter, he spent 10 yearswith Barnstead Company, working with distillation, puresteam generation, and deionization equipment.
US Filter, 10 Technology Drive, Lowell, MA 01851.
Junya Hirayama is an Engineer on the UPW system devel-opment team in the R&D department for Kurita Water Indus-tries in Japan. He has a BS in mechanical engineering fromKyushu Institute of Technology. Hirayama has four years ofproduct development experience in water and liquid purifica-tion. He is presently involved primarily in applications devel-opment of EDI systems for electronics and pharmaceuticalmarkets.
Shigeaki Satoh is Manager of New Business DevelopmentDivision for Kurita Water Industries in Tokyo. He has a BS inchemical engineering from Tohoku National University. Satohhas 21 years of experience in water and liquid purification,including product development and product management. Heis presently involved primarily in applications developmentfor electrodeionization and fuel cell systems.
Kurita Water Industries Ltd., 4-7, Nishi-Shinjuku 3-Chome,Shinjuku-ku, Tokyo 160, Japan.
Figure 7. Commercial System - CDI ohmic resistance- with weekly sanitizations at65°C.
©Copyright ISPE 2001