Operation and Design of Energy Systems … Impact of 13% increase of distribution networks loads at...
25
Transcript of Operation and Design of Energy Systems … Impact of 13% increase of distribution networks loads at...

Operation and Design of Energy Systems Infrastructure
Gas and Electricity Infrastructure Interaction
Professor Phil TaylorDirector of the National Centre for Energy Systems Integration
Siemens Professor of Energy Systems

Overview
• CESI
• Coupled Gas and Electricity Modelling and Simulation
• Full Scale Demonstrators
• Supergen Energy Networks
3

EPSRC National Centre for Energy Systems Integration
• Spatial and Temporal Detail, Full scale multi vector Demonstrators
International Scientific Advisory Board
4

CESI Work Package StreamsCo
mm
erci
al, r
egul
ator
y an
d po
licy
aspe
cts
• Energy Policy• Sector Regulation• Social interaction• Commercial• Behaviour
Ener
gy su
pply
• Multi –Vector Generation
• Interconnection• Spatio-temporal
Infr
astr
uctu
re
and
stor
age
• Systems modelling• Storage • Networks and
Infrastructure
Ener
gy D
eman
d
• Multi-vector Consumer Demand
• Buildings• Transport• Highly temporal
Dem
onst
ratio
n an
d Va
lidat
ions
• Cross-vector demonstration
• Validation within living labs
• Real-time data Mul
ti-Sc
ale
Arch
itect
ures
• Whole systems planning tool
• Co-evolution cycles• Integration of models• Stochastic
optimisation
5

Co-Evolution Methodology (Process not a model)
Stage 1co-evolution cycles
Trilemma Evaluation - Energy Systems Community and UKERC (Assessment of planning and operation models and development of scenarios)
Industrial Innovation Board - System Architect - International Advisory Committee
Stage 2co-evolution cycles
Stage 3co-evolution cycles
Initial, essential energy system
models, scenarios and vectors.
2030 – 2040 - 2050
Refined, additional energy system
models, scenarios and vectors.
2030 – 2040 - 2050
Calibrated and comprehensive set of
energy system models, scenarios
and vectors.2030 – 2040 - 2050
PolicySupplyInfrastructureDemandDemonstrators
Architectures
DeliverablesRobust transition pathwaysCommon FrameworkDetailed modelsAdvance test and demo facilitiesWorkshops, engagement

Whole Systems Cross-Vector InfrastructureValue of a whole systems approach ?
InTEGReL – Integrated Transport Electricity and Gas Research Laboratory
7
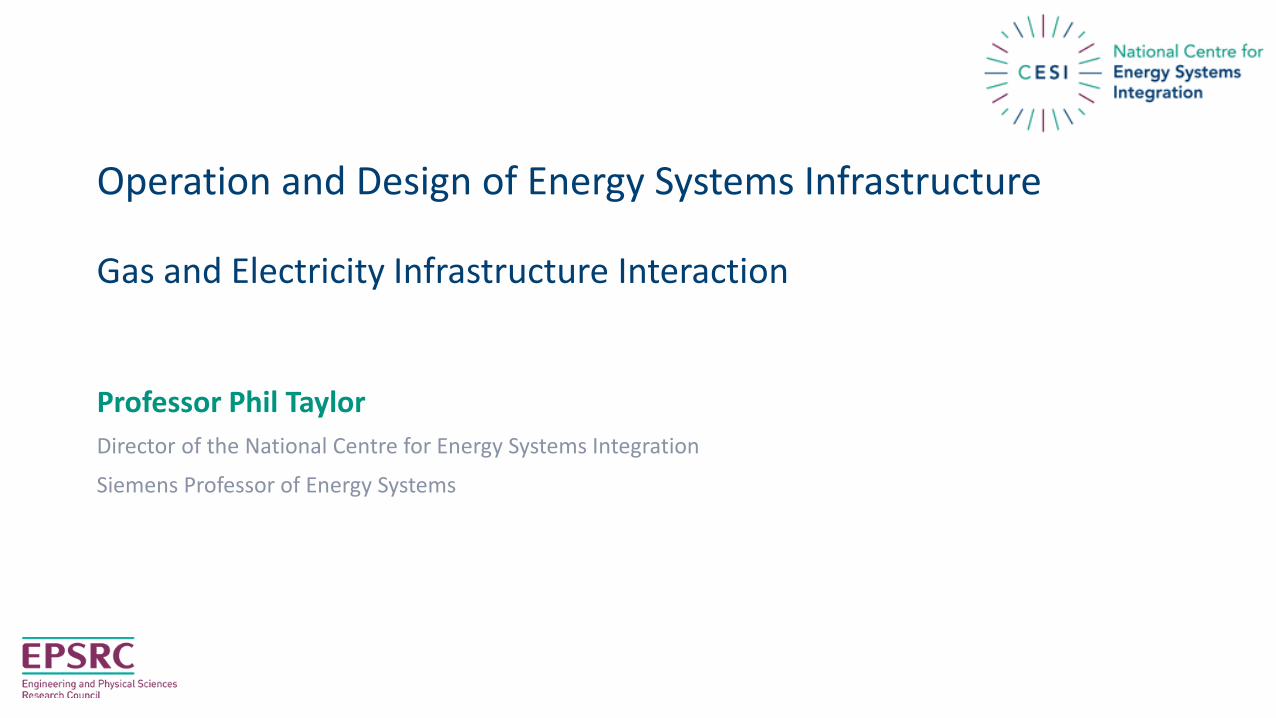
Framework developed for power flow analysis of integrated electricity and gas networks
Gas turbine
P2G
CHP
ELY+P2G
Gasnetwork
Electricitynetwork
Gasnetwork
Electricitynetwork
Transmission level
Distribution level
Integrated powerflow analysis
Integrated powerflow analysis
8

Unified Gas and Power Flow Solution
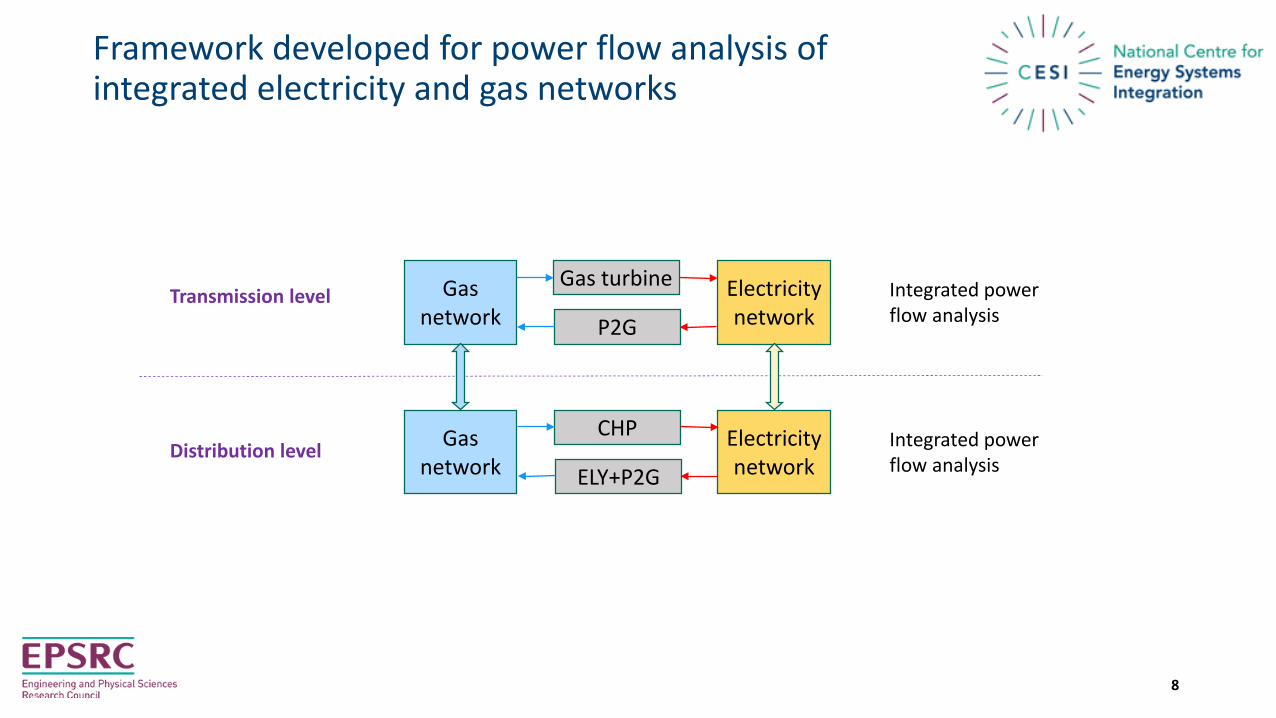
Steady state modelling and simulation
9
The proposed unified solution approach consists of applying Newton’s method to providean approximate solution to the total set of equality constraints:
by solving for:
Steady state modelling and simulation
10

Distribution networks:Base case
1E
2E
4E
6E
7E
8E
3E
1E
1G
7G
6G
5G
2G
3G
4G
1G
2G
3G
5G
4G
9G
10G
8G
6G
7GCHP
ELY+P2G
7E Branch number 7 in the electric network
3G Branch number 3 in the gas network
6E Bus number 6 in the electric network
2G Node number 2 in the gas network
ELY+P2G Electrolyser and Power-to-Gas (not operating)
5E
2E
3E
4E
5E
7E 6E
Supply from gas transmission network
Electricity distribution network
Gas distribution network
Apparent energy(MVAh)
Real energy(MWh) tonCO2*
Electricity 120.2 86.2 46.7Gas -- 191 17.2Total -- 277.2 63.9
*: values for one hour of operation of the network
11

Distribution networks: Scenario1: Fault in the electricity network
1E
2E
4E
6E
7E
8E
3E
1E
1G
7G
6G
5G
2G
3G
4G
1G
2G
3G
5G
4G
9G
10G
8G
6G
7GCHP
ELY+P2G
7E Branch number 7 in the electric network
3G Branch number 3 in the gas network
6E Bus number 6 in the electric network
2G Node number 2 in the gas network
ELY+P2G Electrolyser and Power-to-Gas (operating)
5E
2E
3E
4E
5E
7E 6E
Supply from gas transmission network
Electricity distribution network
Gas distribution network
Apparent energy(MVAh)
Real energy(MWh) tonCO2*
Electricity 129.2 97.8 52.4Gas -- 182.3 16.4Total -- 280.1 68.8
*: values for one hour of operation of the network
inj.
inj. Molar fraction: 70% natural gas + 30% Hydrogen12

Distribution networks: Scenario2: 10% reduction in supply from gas transmission
1E
2E
4E
6E
7E
8E
3E
1E
1G
7G
6G
5G
2G
3G
4G
1G
2G
3G
5G
4G
9G
10G
8G
6G
7GCHP
ELY+P2G
7E Branch number 7 in the electric network
3G Branch number 3 in the gas network
6E Bus number 6 in the electric network
2G Node number 2 in the gas network
ELY+P2G Electrolyser and Power-to-Gas (operating)
5E
2E
3E
4E
5E
7E 6E
Supply from gas transmission network
Electricity distribution network
Gas distribution network
Apparent energy(MVAh)
Real energy(MWh) tonCO2*
Electricity 140.5 111.6 59.2Gas -- 172 15.4Total -- 283.6 74.6
*: values for one hour of operation of the network
inj.
inj. Molar fraction: 70% natural gas + 30% Hydrogen13

Transmission networks – Base Case
G1 G2
2G
1G3G
4G
5G7G
9G
6G
8G11G
10G13G14G16G
12G15G
17G
1G4G6G8G10G
2G5G7G9G11G
3G12G
14G
13G
P2G
GT
1E 2E 3E
4E 5E 6E
1E
2E3E
4E
6E7E
5E8E
9E
10E 11E
EL1 EL2 EL3
GL2
GL1
GL3
GL4
C1
C2
C3
C4 Supply from gas source
Supply from gas source
Gas Transmission Network
Electricity Transmission Network
*: values for one hour of operation of the network
Apparent energy(MVAh)
Real energy(MWh) tonCO2*
Electricity 667.9 667.6 427.78Gas -- 4111.2 370Total -- 4778.8 797.78
14
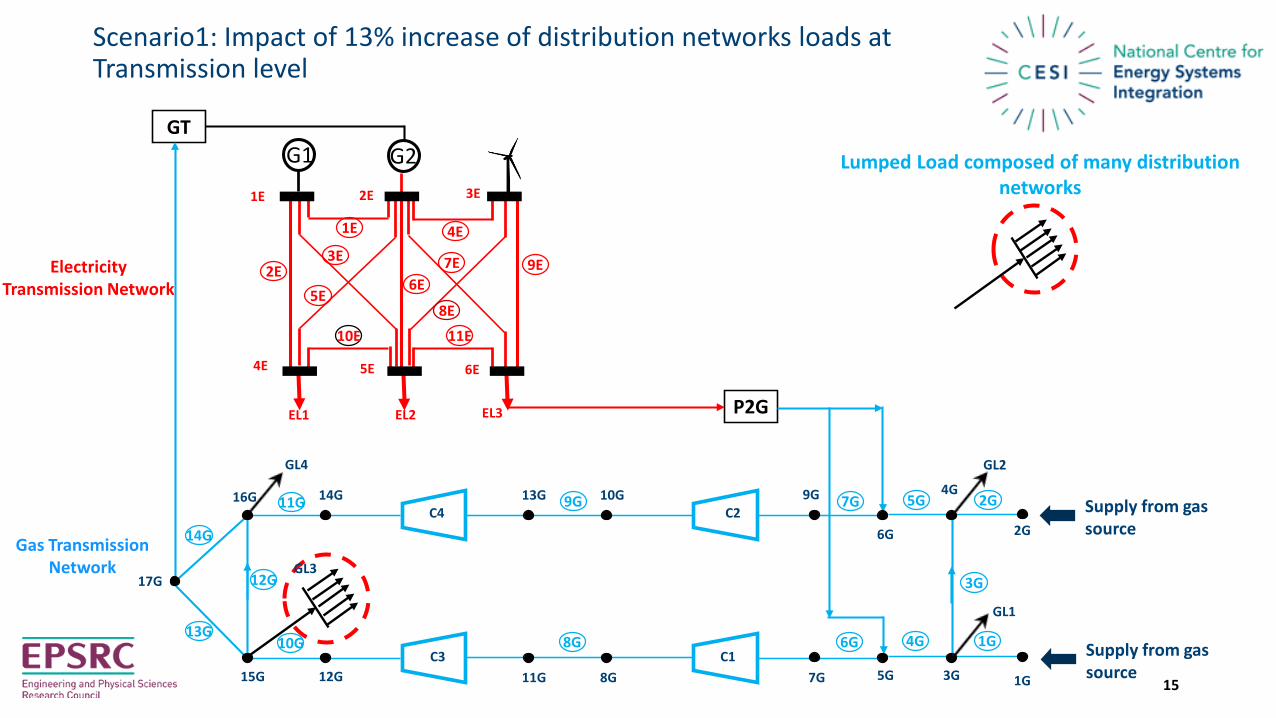
Scenario1: Impact of 13% increase of distribution networks loads at Transmission level
G1 G2
2G
1G3G
4G
5G7G
9G
6G
8G11G
10G13G14G16G
12G15G
17G
1G4G6G8G10G
2G5G7G9G11G
3G12G
14G
13G
P2G
GT
1E 2E 3E
4E 5E 6E
1E
2E3E
4E
6E7E
5E8E
9E
10E 11E
EL1 EL2 EL3
GL2
GL1
GL3
GL4
C1
C2
C3
C4 Supply from gas source
Supply from gas source
Gas Transmission Network
Electricity Transmission Network
Lumped Load composed of many distribution networks
15

Scenario1: Impact of 13% increase of distribution networks loads at Transmission level
0
10
20
30
40
50
60
3 4 15 16 17
Pres
sure
(abs
. bar
)
Node number
Case 1 Case 2
The pressures at the farthest nodes from the sources are nearly zero (estimated in mbar).
Can the electricity transmission network help to solve this problem?
*: values for one hour of operation of the network
Apparent energy(MVAh)
Real energy(MWh) tonCO2*
Electricity 667.9 667.6 427.78Gas -- 4344 391Total -- 5011.6 818.78
Case1: Base case,Case2: Increase the gas demand by 13%
16

Scenario 2: Mitigating the effect of gas load increase using P2G in the integrated system
Storage
G G
2G
1G3G
4G
5G7G
9G
6G
8G11G
10G13G14G16G
12G15G
17G
1G4G6G8G10G
2G5G7G9G11G
3G12G
14G
13G
P2G
GT
1E 2E 3E
4E 5E 6E
1E
2E3E
4E
6E7E
5E8E
9E
10E 11E
EL1 EL2 EL3
GL2
GL1
GL3
GL4
C1
C2
C3
C4 Supply from gas source
Supply from gas source
Gas Transmission Network
Electricity Transmission Network
Scenario description:- The electricity demand is low, which can happen during thenight hours.- The wind blows so the wind energy farm will be operatedat its maximum power estimated by 50 MW.- All the wind power is converted by P2G units, and theresulting gas is stored. This happens during the night hoursestimated by 6 hours.
17

Scenario 2: Mitigating the effect of gas load increase using P2G in the integrated system
Stored gas = 23502 m3 = 243.2457 MW
Scenario description (con.):- The stored gas will be used to overcome the problem of pressure decrease which happenedwhen the gas demand increased by 13%.
0
10
20
30
40
50
60
3 4 15 16 17
Pres
sure
(abs
. bar
)
Node number
Case 1 Case 2 Case 3
Case1: Base case,Case2: Increase the gas demand by 13%,Case 3: Using the stored gas during 1 hour.
*: values for one hour of operation of the network
Results of Case 2
Results of Case 3Apparent energy
(MVAh)Real energy
(MWh) tonCO2*
Electricity 667.9 667.6 427.78Gas -- 4102 369.18Total -- 4769.6 796.96
Apparent energy(MVAh)
Real energy(MWh) tonCO2*
Electricity 667.9 667.6 427.78Gas -- 4344 391Total -- 5011.6 818.78
18

Industrial Partners
Lead Industrial Partner Government Support
Leading Energy Industry Partners
Supply Infrastructure and Storage Demand19

Unique collection of Whole Systems Demonstrators:
EPSRC National Centre for Energy Systems Integration

A Unique Collaboration between:• EPSRC National Centre for Energy Systems Integration (CESI)• Northern Gas Networks• Northern PowergridA UK research and demonstration facility to: • Explore how energy systems can be integrated in real physical environment• Develop cross-vector and multi-vector approaches• Develop and deploy SMART energy system technologies• Cross pollination of ideas between utilitiesBenefits• Help minimise costs in the Energy System• Provide an open facility for 3rd parties, particularly SMEs• Contribute to UK innovation and growth• Develop solutions and tools we need to address the energy trilemma• Support the development of ideas and their commercialisation in the UK
InTEGReL – Integrated Transport Electricity and Gas Research Laboratory
21

Gateshead
• Sector Training and Skills Hub• Stand-by gas distribution control and
data centre• Visitor Centre and Research Office
• Cross Vector Telemetry• 11kV Transformer and Substation• Electrical Energy Storage • Pressure Reduction (38Bar to 19Bar)
• Gas Fired CHP• 4MW Wind Turbine• PV Array• PEM Electrolyser• AD with Bio methane Injection• Hydrogen Storage and Grid
Injection
• Electric, CNG, Hydrogen refuelling stations for zero and ultra-low emission vehicles
• Capable of utilising onsite generated fuels
• 6 different archetype demo homes
• Trial novel domestic space and district heating systems
• UK’s 1st Pumped Heat Energy Storage system (PHES)
• Dedicated SME innovation testing and demonstration space
• Independent ‘Trial’ gas network
InTEGReL – Integrated Transport Electricity and Gas Research Laboratory
22
Conclusions
- Developed the modelling and simulation tools to investigate the interactions between Gas and Electricity
infrastructure
- Aim is to understand the value of a whole systems approach
- Cost
- Carbon
- Resilience
- Working with Gas and Electricity Network Operators to gather data and create realistic scenarios
- Launched a full scale Gas and Electric Demonstrator to provide data and validate the models/simulations
- Policy
- Aligned Gas and Electricity Regulation
- Supergen Energy Networks Hub
23

EPSRC Supergen Energy Networks Supergen Energy Networks hub- Addressing Energy Network research challenges with a Whole Systems View
24