Investigación y reporte de incidentes en mina. chungar (Cerro de Pasco PERU)

Management Discussion and Analysis
1
Volcan Compañía Minera S.A.A. and Subsidiaries Management Discussion and Analysis
First Quarter 2017
Principal Results:
Consolidated Volcan Jan-Mar
2017
Jan-Mar
2016 var %
Sales Prices
Zinc (USD/MT) 2,708 1,671 62.0
Lead (USD/MT) 2,276 1,764 29.0
Copper (USD/MT) 5,882 4,773 23.2
Silver (USD/Oz) 17.7 14.9 18.4
Gold (USD/Oz) 1,221 1,165 4.8
Financial Results (MM USD)
Sales before adjustments 199.1 172.1 15.7
Volcan Production 190.8 158.5 20.3
Commercialization Business 8.4 13.6 -38.6
Sales Adjustments 6.4 11.3 -43.4
Settlement of prior period adjustments 5.0 -7.0
Adjustments for open positions1 -1.5 6.5
Hedging results 2.9 11.8 -75.8
Sales after adjustments 205.5 183.4 12.0
Net profit 23.5 19.3 21.7
Earnings per share - EPS (USD) 0.006 0.005 21.7
EBITDA 80.2 75.8 5.8
Operating Results
Mineral treatment2 (thousands MT) 1,917 1,943 -1.3
Zinc Production (thousands FMT) 59.5 71.4 -16.7
Lead Production (thousands FMT) 11.2 15.1 -25.8
Copper Production (thousands FMT) 1.1 1.2 -8.4
Silver Production (millions Oz) 3.8 5.8 -33.7
Gold Production (thousands Oz) 1.6 1.5 9.5
Unit Cost (USD/MT) 50.4 48.2 4.5
Total Investments (MM USD) 32.4 18.5 75.3
Source: Volcan Cia. Minera
2 Includes treated tons at Oxides Plant
1 Adjustments for open commercial positions refer to shipments without final settlement, which are
therefore exposed to possible adjustments from variations of future metals prices. These financial
provisions, embedded derivative and sales adjustments, reflect this exposure according to a
forward-price curve.

Management Discussion and Analysis
2
1. Executive Summary
During 1Q17, the average sales price of metals produced by the Company
increased, as compared to the same period of the previous year. The average
sales price of zinc rose from 1,671 USD/MT in 1Q16 to 2,708 USD/MT in 1Q17
(+62.0%), lead from 1,764 USD/MT to 2,276 USD/MT (+29.0%)
and silver from 14.9 USD/Oz to 17.7 USD/Oz (+18.4%).
Better average metals prices resulted in an increase in sales from the
Company's own concentrate by 20.3%, from USD 158.5 MM in 1Q16 to USD
190.8 MM in 1Q17. In turn, third-party concentrates sales declined by 38.6%,
from USD 13.6 MM to USD 8.4 MM. Total sales before adjustments increased
by 15.7%, from USD 172.1 MM in 1Q16 to USD 199.1 MM in 1Q17.
Sales adjustments were reduced from USD 11.3 MM in 1Q16 to USD 6.4 MM in
1Q17, including final settlements of USD 5.0 MM, provisions related to open
commercial positions of USD -1.5 MM and hedging results of USD 2.9 MM.
Sales after adjustments increased by 12.0%, from USD 183.4 MM in 1Q16 to
USD 205.5 MM in 1Q17.
Gross margin increased from 26% in 1Q16 to 33% in 1Q17. Net profit increased
from USD 19.3 MM in 1Q16 to USD 23.5 MM in 1Q17. Likewise, EBITDA
increased from USD 75.8 MM in 1Q16 to USD 80.2 MM in 1Q17. It is worth
noting that 1Q16 results included an extraordinary gain of USD 12.9 MM related
to the partial buyback of bonds issued in 2012.
During 1Q17, treated ore volumes treated decreased sby 1.3% compared to the
same period of the previous year. This is explained by lower treated ore
volumes at the Yauli and Chungar units and the Oxides Plant, partially offset by
larger ore volumes from Cerro de Pasco and Alpamarca. It is worth noting that,
in February 2017, the Oxides Plant suffered a 17-day paralyzation resulting
from the plant's access road being blocked by a community company
ECOSERM Rancas. Moreover, a review of the safety at the Islay Mine
(Chungar Unit) partially affected ore contribution from this mine in March.
Furthermore, in view of the restrictions to road and rail transportation caused by
the coastal El Niño, a decision was made to limit supplies at the operating units.
Mining operations were partially affected by this, especially the Yauli Unit.
The reduction of treated ore volumes at the Yauli (-18.2%) and Chungar (-7.3%)
units and the Oxides Plant (-20.9%), as well as lower average head grades in
1Q17, resulted in a decrease of fine production of zinc by 16.7%, of lead by
25.8% and of silver by 33.7%.
The operation's consolidated unit cost increased by 4.5%, from 48.2 USD/MT in
1Q16 to 50.4 USD/MT in 1Q17, mainly due to a higher unit cost at Yauli and
Chungar, resulting from the increase of mine preparations and lower extraction
and treatment volumes at these units.

Management Discussion and Analysis
3
Total investments increased by 75.3%, from USD 18.5 MM in 1Q16 to
USD 32.4 MM in 1Q17, mainly due to higher investments in exploration,
developments, tailings dams and mine and energy infrastructure at the
operating units. Moreover, greenfield exploration investments have been
increased to develop the main projects that represent the future growth of the
Company.
2. Consolidated Results
2.1 Production
Table 1: Consolidated Production
During 1Q17, Volcan increased extraction volumes by 1.2% as compared to the same
quarter of the previous year. This is mainly explained by the contribution of low grade
polymetallic ore from stockpiles at the Cerro de Pasco Unit, which was partially offset
by lower extracted ore volumes at the Yauli (-15.2%) and Chungar (-4.9%) units, and
lower ore volumes from the Oxides Plant stockpiles (-20.9%).
Ore volumes treated at the plants decreased by 1.3% as compared to 1Q16, mainly
due to lower treatment volumes at the (-18.2%), Chungar (-7.3%) units, and the Oxides
Plant (-20.9%). The Oxides Plant halted operations for 17 days as a result the plant's
access road being blocked by a group of people and vehicles related to the community
company ECOSERM Rancas. Moreover, at the Chungar Unit, a review of the safety
was carried out at the Islay Mine and partially affected its ore contribution in March.
Furthermore, in view of the restrictions to road and rail transportation caused by the
coastal El Niño, a decision was made to limit supplies at the operating units, especially
Consolidated
Production
Jan-Mar
2017
Jan-Mar
2016 var %
Mineral extraction (thousands MT) 1,925 1,901 1.2
Polymetallic ore 1,746 1,675 4.2
Oxides ore1 178 226 -20.9
Mineral treatment (thousands MT) 1,917 1,943 -1.3
Concentrator Plants 1,739 1,718 1.2
Silver Oxides Plant 178 226 -20.9
Fine Content
Zinc (thousands FMT) 59.5 71.4 -16.7
Lead (thousands FMT) 11.2 15.1 -25.8
Copper (thousands FMT) 1.1 1.2 -8.4
Silver (millions Oz) 3.8 5.8 -33.7
Gold (thousands Oz) 1.6 1.5 9.5
Source: Volcan Cia. Minera

Management Discussion and Analysis
4
the Yauli and Chungar units, which partially affected the normal development of mining
operations.
As a result of lower volumes treated at the Yauli and Chungar units and the Oxides
Plant, and lower average head grades, the production of fine zinc decreased by 16.7%,
from 71.4 thousand FMT in 1Q16 to 59.5 thousand FMT during 1Q17. Production of
fine lead decreased by 25.8%, from 15.1 thousand FMT to 11.2 thousand FMT.
Production of fine copper registered an 8.4% decrease, from 1.2 thousand FMT to 1.1
thousand FMT, while silver ounces decreased by 33.7%, from 5.8 million to 3.8 million.
Meanwhile, gold ounces produced increased by 9.5%, from 1.5 thousand ounces to 1.6
thousand ounces.
2.2 Cost of Production
Table 2: Consolidated Cost of Production
The cost of production in absolute terms increased by 4.6%, from USD 92.5 MM in
1Q16 to USD 96.8 MM in 1Q17. This is mainly explained by the treatment of low grade
polymetallic ore stockpiles in Cerro de Pasco and the increase of mine preparations at
the Yauli and Chungar units.
The consolidated unit cost of operations increased by 4.5%, from 48.2 USD/MT in
1Q16 to 50.4 USD/MT in 1Q17, mainly due to a higher unit cost at Yauli and Chungar,
resulting from lower extraction and treatment volumes.
The Company is permanently focused on reducing and controlling operating costs
across all units. In addition to the continuous-improvement system, specialized teams
were created at the corporate level to identify specific opportunities for fixed-cost
reductions and operating efficiency improvement.
The evolution of the consolidated unit cost of production over the last 3 years is shown
in the chart below.
Consolidated
Production Cost
Jan-Mar
2017
Jan-Mar
2016 var %
Production Cost (MM USD) 96.8 92.5 4.6
Mine Cost 52.9 52.1 1.5
Plant and Other Cost 43.9 40.4 8.7
Unit Cost (USD/MT) 50.4 48.2 4.5
Mine Cost 27.5 27.4 0.3
Plant and Other Cost 22.9 20.8 10.2
Source: Volcan Cia. Minera

Management Discussion and Analysis
5
Chart 1: Evolution of the Unit Cost of Production (USD/MT)
2.3 Total Investments
Table 3: Consolidated Investment
Mining investments necessary to ensure the continuity and flexibility of the Company's
operations and its growth increased in an environment of recovering metals prices.
Accordingly, total mining investments grew by 92.0%, from USD 16.7 MM in 1Q16 to
USD 32.1 MM in 1Q17.
Operating unit investments increased by 89.6%, from USD 16.1 MM in 1Q16 to
USD 30.6 MM in 1Q17, mainly in mine development (+65%), plants & tailings dams
75.5
70.5
59.7
65.4 66.163.5 63.5 63.1
56.855.3
53.4
50.048.2
50.7 50.548.8
50.4
1Q13 2Q13 3Q13 4Q13 1Q14 2Q14 3Q14 4Q14 1Q15 2Q15 3Q15 4Q15 1Q16 2Q16 3Q16 4Q16 1Q17
Source: Volcan Cia. Minera
Consolidated Investment
(MM USD)
Jan-Mar
2017
Jan-Mar
2016 var %
Mining 32.1 16.7 92.0
Mining Units 30.6 16.1 89.6
Local Exploration 2.1 0.1 3,051.2
Development 15.8 9.6 65.5
Plants and Tailings Facilities 5.6 1.6 237.9
Mine and Infrastructure 5.3 4.1 28.5
Energy in Units 1.1 0.5 115.9
Support and Others 0.7 0.2 207.8
Regional Explorations 1.5 0.4 257.0
Growth and Others 0.0 0.2 -80.6
Energy 0.3 1.7 -84.5
Total 32.4 18.5 75.3
Source: Volcan Cia. Minera

Management Discussion and Analysis
6
(+238%) and local exploration (3,051%). Regional exploration investments (greenfield
or early-stage projects) increased by 257.0%, from USD 0.4 MM in 1Q16 to
USD 1.5 MM in 1Q17, in line with the strategy of the Company to expedite the
incorporation of resources to our main projects.
Energy investments in 1Q17 were USD 0.3 MM versus USD 1.7 MM in 1Q16, mainly
due to the completion of the construction of the Rucuy Hydroelectric Plant.
Total investment increased by 75.3%, from USD 18.5 MM in 1Q16 to USD 32.4 MM in
1Q17.
2.4 Income Statement
Table 4: Income Statement
Income Statement
(MM USD)
Jan-Mar
2017
Jan-Mar
2016var %
Sales before adjust. 199.1 172.1 15.7
Sett. of prior periods adjust. 5.0 -7.0
Adj. open positions -1.5 6.5
Hedging 2.9 11.8 -75.8
Sales after adjust. 205.5 183.4 12.0
Cost of Goods Sold -138.3 -135.8 1.8
Gross Profit 67.2 47.6 41.1
Gross Margin 33% 26% 7 pp
Administrative Expenses -10.5 -9.3 12.4
Sales Expenses -7.7 -6.6 16.5
Other Income (Expenses) 1 -1.6 9.8
Operating Profit 47.4 41.5 14.2
Operating Margin 23% 23% 0 pp
Financial Income (Expenses) -9.4 -8.6 10.1
Exchange difference (net) 0.1 0.7 -80.5
Royalties -3.8 -1.4 161.3
Income Tax -10.7 -12.8 -15.8
Net Profit 23.5 19.3 21.7
Net Margin 11% 11% 1 pp
EBITDA 80.2 75.8 5.8
EBITDA Margin 39% 41% -2 pp
Source: Volcan Cia. Minera
1 Includes the sales and cost of sales of the energy division. In 1Q16, other
income include extraordinary income of USD 12.9 MM associated with the
partial repurchase of the international bonds

Management Discussion and Analysis
7
Table 5: Financial Results per Business
Sales Analysis
Table 6: Average Sales Prices
Jan-Mar
2017
Jan-Mar
2016var %
Sales 194.7 168.8 15.3
Cost of Goods Sold -130.9 -123.6 5.9
Gross Profit 63.8 45.2 41.2
Gross Margin 33% 27% 6 pp
Net Profit 21.4 18.0 18.8
EBITDA1 76.9 73.7 4.4
EBITDA Margin 40% 44% -4 pp
Sales 10.8 14.6 -26.1
Cost of Goods Sold -7.4 -12.2 -39.3
Gross Profit 3.4 2.4 40.1
Gross Margin 31% 17% 15 pp
Net Profit 2.2 1.3 60.5
EBITDA 3.2 2.1 54.6
EBITDA Margin 30% 14% 16 pp
Sales 205.5 183.4 12.0
Cost of Goods Sold -138.3 -135.8 1.8
Gross Profit 67.2 47.6 41.1
Gross Margin 33% 26% 7 pp
Net Profit 23.5 19.3 21.7
EBITDA1 80.2 75.8 5.8
EBITDA Margin 39% 41% -2 pp
Source: Volcan Cia. Minera
1 In 1Q16, includes the extraordinary income of USD 12.9 MM associated with the partial
repurchase of the international bonds
Income Statement by Business
(MM USD)
Volcan
Production
Commercializat
ion Business
Jan-Mar
2017
Jan-Mar
2016 var %
Zinc (USD/MT) 2,708 1,671 62.0
Lead (USD/MT) 2,276 1,764 29.0
Copper (USD/MT) 5,882 4,773 23.2
Silver (USD/Oz) 17.7 14.9 18.4
Gold (USD/Oz) 1,221 1,165 4.8
Source: Volcan Cia. Minera
Sales Prices
Management Discussion and Analysis
8
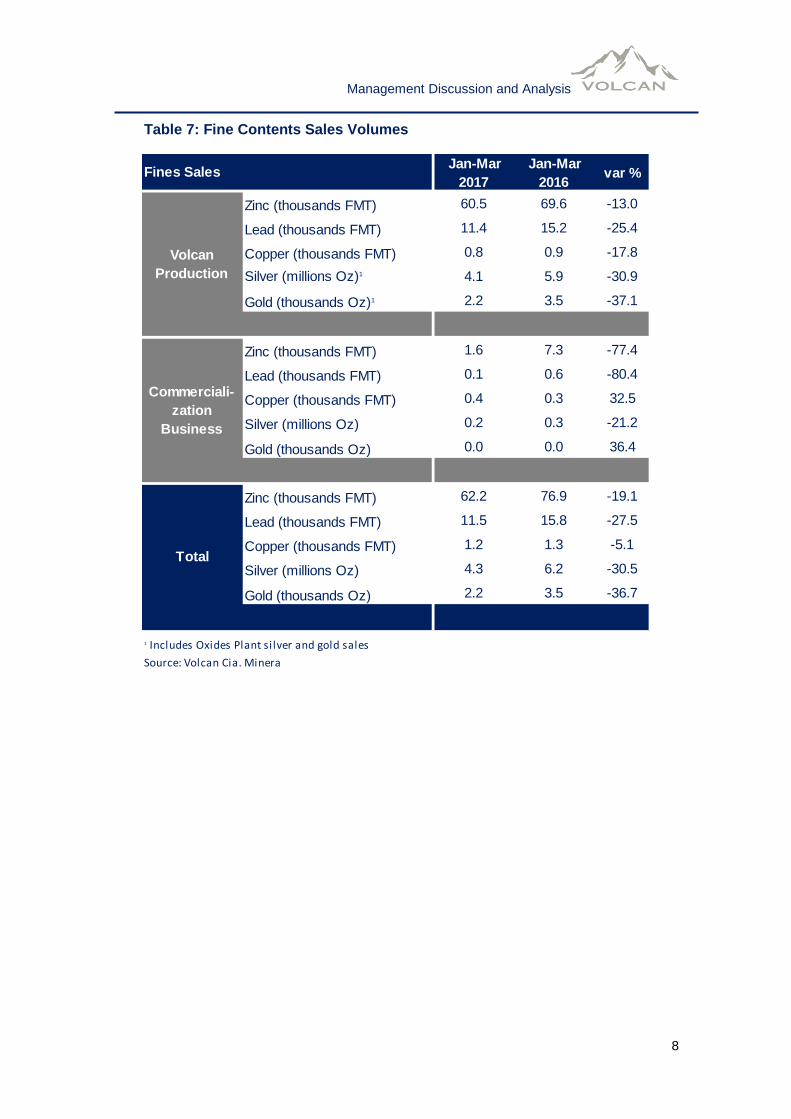
Table 7: Fine Contents Sales Volumes
Jan-Mar
2017
Jan-Mar
2016 var %
Zinc (thousands FMT) 60.5 69.6 -13.0
Lead (thousands FMT) 11.4 15.2 -25.4
Copper (thousands FMT) 0.8 0.9 -17.8
Silver (millions Oz)1 4.1 5.9 -30.9
Gold (thousands Oz)1 2.2 3.5 -37.1
Zinc (thousands FMT) 1.6 7.3 -77.4
Lead (thousands FMT) 0.1 0.6 -80.4
Copper (thousands FMT) 0.4 0.3 32.5
Silver (millions Oz) 0.2 0.3 -21.2
Gold (thousands Oz) 0.0 0.0 36.4
Zinc (thousands FMT) 62.2 76.9 -19.1
Lead (thousands FMT) 11.5 15.8 -27.5
Copper (thousands FMT) 1.2 1.3 -5.1
Silver (millions Oz) 4.3 6.2 -30.5
Gold (thousands Oz) 2.2 3.5 -36.7
1 Includes Oxides Plant silver and gold sales
Source: Volcan Cia. Minera
Fines Sales
Volcan
Production
Commerciali-
zation
Business
Total

Management Discussion and Analysis
9
Table 8: Sales in USD
For 1Q17, total sales before adjustments were USD 199.1 MM, 15.7% higher than the
USD 172.1 MM reported in 1Q16. This result is attributable to the increase in the
average sales price of zinc by 62.0%, lead by 29.0%, copper by 23.2%, silver by
18.4%, and gold by 4.8%. The increase in total sales occurred despite lower third-party
concentrates sales, where sales before adjustments decreased from USD 13.6 MM in
1Q16 to USD 8.4 MM in 1Q17.
Jan-Mar
2017
Jan-Mar
2016 var %
Zinc (USD/MT) 2,708 1,671 62.0
Lead (USD/MT) 2,276 1,764 29.0
Copper (USD/MT) 5,882 4,773 23.2
Silver (USD/Oz) 17.7 14.9 18.4
Gold (USD/Oz) 1,221 1,165 4.8
Source: Volcan Cia. Minera
Jan-Mar
2017
Jan-Mar
2016 var %
Zinc 109.6 65.8 66.4
Lead 19.4 18.6 4.6
Copper 2.3 1.9 18.0
Silver 58.0 69.6 -16.7
Gold 1.5 2.6 -41.8
Sales before adjust. 190.8 158.5 20.3
Sett. of prior period adjust. 4.6 -6.5
Adjust. for open positions -2.8 5.6
Hedging results 2.1 11.2 -81.0
Sales after adjust. 194.7 168.8 15.3
Zinc 3.6 9.5 -62.5
Lead 0.2 0.7 -65.2
Copper 1.8 0.8 124.3
Silver 2.7 2.6 2.3
Gold 0.0 0.0
Sales before adjust. 8.4 13.6 -38.6
Sett. of prior period adjust. 0.4 -0.5
Adjust. for open positions 1.3 0.9 38.0
Hedging results 0.7 0.6 27.6
Sales after adjust. 10.8 14.6 -26.1
Zinc 113.1 75.3 50.2
Lead 19.6 19.2 2.1
Copper 4.1 2.7 49.8
Silver 60.7 72.2 -16.0
Gold 1.5 2.6 -40.8
Sales before adjust. 199.1 172.1 15.7
Sett. of prior period adjust. 5.0 -7.0
Adjust. for open positions -1.5 6.5
Hedging results 2.9 11.8 -75.8
Sales after adjust. 205.5 183.4 12.0
Source: Volcan Cia. Minera
Sales Prices
Sales
(millions USD)
Volcan
Production
Commerciali-
zation
Business
Total

Management Discussion and Analysis
10
During 1Q17, Volcan recorded positive sales adjustments of USD 5.0 MM, related to
final settlements, and negative adjustments of USD 1.5 MM related to provisions for
open commercial positions. Moreover, hedging results were positive by USD 2.9 MM.
Therefore, during 1Q17 sales after adjustments totaled USD 205.5 MM, a 12.0%
increase if compared to the USD 183.4 MM reported in 1Q16.
Cost of Goods Sold
Table 9: Cost of Goods Sold
During 1Q17, the total cost of goods sold was USD 138.3 MM, 1.8% higher than the
USD 135.8 MM figure for 1Q16. This is mainly explained by a USD 4.3 MM increase in
the cost of production and a USD 4.9 MM decrease in total inventories, partially offset
by a reduction of USD 5.8 MM in purchases of third-party concentrates.
Gross Margin and Gross Profit
The Company's gross margin increased from 26% in 1Q16 to 33% in 1Q17 due to the
higher metals prices, improved margin in concentrates sales, and reduced
commercialization of third-party concentrates in total sales. Total gross profit in 1Q17
grew by 41.1%, from USD 47.6 MM in 1Q16 to USD 67.2 MM in 1Q17.
Administrative and Sales Expenses
Administrative expenses in 1Q17 totaled USD 10.5 MM, 12.4% higher than the USD
9.3 MM recorded in 1Q16, mainly explained by the increased workers' participation and
the appreciation of local currency.
Administrative expenses in 1Q17 totaled USD 7.7 MM, 16.5% higher than the USD 6.6
MM recorded in 1Q16, mainly due to higher freight expenses arising from the logistical
complications caused by the coastal El Niño in the central highlands.
Cost of Goods Sold
(millions USD)
Jan-Mar
2017
Jan-Mar
2016 var %
Volcan Production 130.9 122.9 6.5
Own Production Cost 96.8 92.5 4.6
D&A from Production Cost 29.6 30.0 -1.3
Extraordinary Costs 0.6 0.4 33.4
Variation of Inventories 3.9 0.0
Commercialization Business 7.1 11.9 -40.3
Concentrates Purchase 6.4 12.2 -47.2
Variation of Inventories 0.7 -0.3
Workers Participation 0.3 1.0 -69.7
Total 138.3 135.8 1.8
Source: Volcan Cia. Minera

Management Discussion and Analysis
11
Other Income and Expenses
In 1Q17, the net amount of other income and expenses was negative USD 1.6 MM
versus a positive amount of USD 9.8 MM in 1Q16. It is worth noting that 1Q16 results
included an extraordinary gain of USD 12.9 MM related to the partial buyback of
international bonds issued in 2012.
Financial Expenses and Exchange-Rate Difference
Net financial expenses for 1Q17 totaled USD 9.4 MM, a figure higher than the
USD 8.6 MM recorded in 1Q16. This is explained by the reprofiling of a portion of the
debt that was converted from short-term into medium-term, at an interest rate in line
with the new term. This reprofiling will result in an improved liquidity ratio for the
Company.
Moreover, exchange-rate variation gains totaling USD 0.1 MM were registered in 1Q17,
lower than the exchange-rate gains reported in 1Q16 (USD 0.7 MM).
Net Profit and EBITDA
Net profit grew by 21.7%, from USD 19.3 MM in 1Q16 to USD 23.5 MM in 1Q17. This
growth is mainly explained by an increased gross margin, as a result of higher metals
prices.
EBITDA increased by 5.8%, from USD 75.8 MM in 1Q16 to USD 80.2 MM in 1Q17.
2.5 Liquidity and Creditworthiness
In 1Q17, cash generated by mining operations totaled USD 73.4 MM. Operating and
exploration investments, as well as growth investments in the mining business, totaled
USD 30.5 MM, while energy investments totaled USD +0.9 MM. Moreover, other
investments totaled USD 1.5 MM, dividends paid amounted to USD 14.1 MM, interests
to USD 17.3 MM, while financial liabilities decreased by USD 13.8 MM.
Therefore, during 1Q17, the resulting total cash flow was USD -2.9 MM, and the total
cash balance as of March 31, 2017, was USD 200.5 MM.
At the end of 1Q17, the net debt/EBITDA ratio was 1.98.
For a more complete analysis, the table below shows debt, cash balance and EBITDA
pertaining to the mining division separately from the energy division. The energy
division is comprised of subsidiary companies Hidroelectrica Huanchor S.A.C.,
Compañia Hidroelectrica Tingo S.A. and Empresa de Generacion Electrica Rio Baños
S.A.C.

Management Discussion and Analysis
12
Table 10: Net Debt / EBITDA Ratio
Chart 2: Net Debt / EBITDA Ratio Evolution
Net Debt/EBITDA
RatioMining Energy
Consolidated
1Q17
Gross Debt (MM USD) 787.5 22.6 810.0
Cash Balance (MM USD) 191.8 8.6 200.5
Net Debt (MM USD) 595.6 13.9 609.6
EBITDA1 (MM USD) 300.3 7.0 307.3
Ratio 1.98 2.00 1.98
Source: Volcan Cia. Minera
1 EBITDA for the last 12 months.
2.592.51
2.79 2.882.66 2.76
2.37
2.01
1.98
1Q 15 2Q 15 3Q 15 4Q 15 1Q 16 2Q 16 3Q 16 4Q 16 1Q 17
Source: Volcan Cia. Minera
Management Discussion and Analysis
13
3. Results by Operating Unit
3.1 Yauli Unit Operating Results
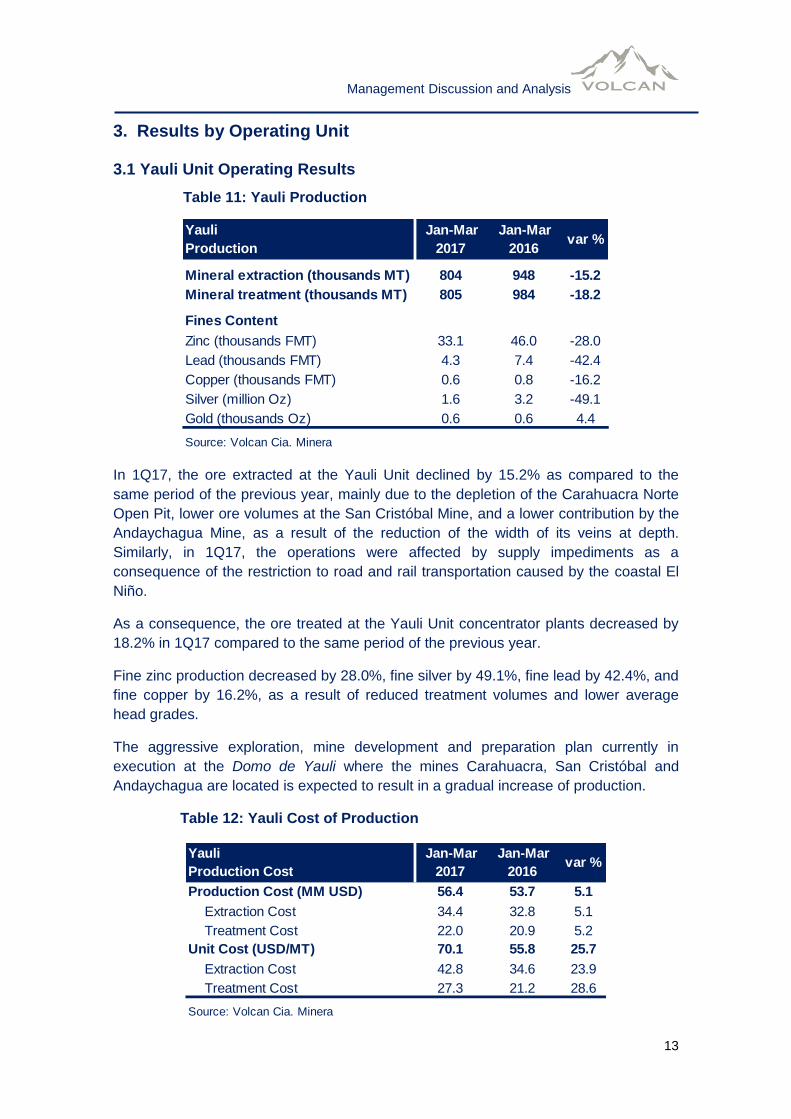
Table 11: Yauli Production
In 1Q17, the ore extracted at the Yauli Unit declined by 15.2% as compared to the
same period of the previous year, mainly due to the depletion of the Carahuacra Norte
Open Pit, lower ore volumes at the San Cristóbal Mine, and a lower contribution by the
Andaychagua Mine, as a result of the reduction of the width of its veins at depth.
Similarly, in 1Q17, the operations were affected by supply impediments as a
consequence of the restriction to road and rail transportation caused by the coastal El
Niño.
As a consequence, the ore treated at the Yauli Unit concentrator plants decreased by
18.2% in 1Q17 compared to the same period of the previous year.
Fine zinc production decreased by 28.0%, fine silver by 49.1%, fine lead by 42.4%, and
fine copper by 16.2%, as a result of reduced treatment volumes and lower average
head grades.
The aggressive exploration, mine development and preparation plan currently in
execution at the Domo de Yauli where the mines Carahuacra, San Cristóbal and
Andaychagua are located is expected to result in a gradual increase of production.
Table 12: Yauli Cost of Production
Yauli
Production
Jan-Mar
2017
Jan-Mar
2016 var %
Mineral extraction (thousands MT) 804 948 -15.2
Mineral treatment (thousands MT) 805 984 -18.2
Fines Content
Zinc (thousands FMT) 33.1 46.0 -28.0
Lead (thousands FMT) 4.3 7.4 -42.4
Copper (thousands FMT) 0.6 0.8 -16.2
Silver (million Oz) 1.6 3.2 -49.1
Gold (thousands Oz) 0.6 0.6 4.4
Source: Volcan Cia. Minera
Yauli
Production Cost
Jan-Mar
2017
Jan-Mar
2016 var %
Production Cost (MM USD) 56.4 53.7 5.1
Extraction Cost 34.4 32.8 5.1
Treatment Cost 22.0 20.9 5.2
Unit Cost (USD/MT) 70.1 55.8 25.7
Extraction Cost 42.8 34.6 23.9
Treatment Cost 27.3 21.2 28.6
Source: Volcan Cia. Minera

Management Discussion and Analysis
14
Cost of production in absolute terms increased by 5.1%, from USD 53.7 MM in 1Q16 to
USD 56.4 MM in 1Q17. This increase is mainly explained by the decline in Carahuacra
Norte Open Pit low-production-cost contributions to the Yauli Unit production mix, and
increased preparations, mainly at the San Cristóbal and Carahuacra mines.
The operation's unit cost increased by 25.7%, from 55.8 USD/MT in 1Q16 to
70.1 USD/MT in 1Q17, mainly due to a higher absolute cost and lower extracted and
treated volumes.
Table 13: Yauli Operating Investments
Operating investments increased by 97.9%, from USD 9.3 MM in 1Q16 to
USD 18.4 MM in 1Q17, including increased investments in exploration, development
and mine infrastructure, in line with the current plan to increase production levels.
3.2 Chungar Unit Operating Results
Table 14: Chungar Production
In 1Q17, ore volumes extracted at the Chungar Unit decreased by 4.9% as a
consequence of a 19.9% reduction of volumes extracted at the Islay Mine, offset by a
0.3% increase in ore extracted at the Animon Mine. The decline in the contribution of
the Islay Mine was due to a reduction of work fronts and the effect from a revision of
the safety carried out in March. Accordingly, ore processed at the concentrator plant
declined by 7.3%.
Yauli Operating Investments
(MM USD)
Jan-Mar
2017
Jan-Mar
2016 var %
Local Exploration 1.5 0.1 2500.8
Mine Development 11.5 5.6 105.0
Plants and Tailings Dams 1.9 1.5 29.5
Mine and Infrastructure 2.5 1.5 60.4
Energy 0.7 0.5 39.8
Support and Others 0.3 0.1 138.1
Total 18.4 9.3 97.9
Source: Volcan Cia. Minera
Chungar
Production
Jan-Mar
2017
Jan-Mar
2016 var %
Mineral extraction (thousands MT) 477 501 -4.9
Mineral treatment (thousands MT) 473 510 -7.3
Fines Content
Zinc (thousands FMT) 21.8 22.9 -4.8
Lead (thousands FMT) 4.6 5.8 -20.7
Copper (thousands FMT) 0.4 0.4 5.0
Silver (million Oz) 0.8 1.1 -24.0
Source: Volcan Cia. Minera

Management Discussion and Analysis
15
As a result of the lower ore volumes at the Islay Mine and lower lead and silver grades
at the Animón Mine, in 1Q17, fine zinc production decreased by 4.8%, lead by 20.7%
and silver by 24.0%. Meanwhile, fine copper production increased by 5.0%.
It is worth noting that the integration tunnel between the Animón and Islay mines will be
built this year. This will result in the improved efficiency of current operations, and lower
transportation and pumping costs, among others. In addition, this tunnel will facilitate
the exploration of the Islay 4 concession, which shows significant evidence of
mineralization and may lead to the future growth of production at the Chungar Unit.
Table 15: Chungar Cost of Production
Cost of production in absolute terms increased by 5.6%, from USD 24.3 MM in 1Q16 to
USD 25.7 MM in 1Q17. This is explained by a significant increase in preparations at
the Islay and Animón mines, and by larger contributions to neighboring communities
through collective agreements.
The unit cost increased by 12.1%, from 48.2 USD/MT in 1Q16 to 54.1 USD/MT in
1Q17, mainly due to a higher absolute cost and lower volumes of production.
Table 16: Chungar Operating Investments
Operating investments increased by 116.0%, from USD 4.8 MM in 1Q16 to
USD 10.3 MM in 1Q17, mainly due to higher investments in exploration, development,
tailings dams and mine and energy infrastructure.
Chungar
Production Cost
Jan-Mar
2017
Jan-Mar
2016 var %
Production Cost (MM USD) 25.7 24.3 5.6
Extraction Cost 15.6 15.2 2.5
Treatment Cost 10.1 9.1 10.8
Unit Cost (USD/MT) 54.1 48.2 12.1
Extraction Cost 32.7 30.3 7.7
Treatment Cost 21.4 17.9 19.5
Source: Volcan Cia. Minera
Chungar Operating Investments
(MM USD)
Jan-Mar
2017
Jan-Mar
2016 var %
Local Exploration 0.6 0.0
Mine Development 4.3 3.9 9.3
Plants and Tailings Dams 2.8 0.0
Mine and Infrastructure 2.1 0.7 208.1
Energy 0.4 0.0
Support and Others 0.1 0.1 46.1
Total 10.3 4.8 116.0
Source: Volcan Cia. Minera

Management Discussion and Analysis
16
3.3 Alpamarca Unit Operating Results
Table 17: Alpamarca Production
In 1Q17, ore volumes extracted at the Alpamarca Unit grew by 5.2% compared to the
same quarter of the previous year. Meanwhile, the concentrator plant treated
234 thousand MT of ore in 1Q17, a 4.2% increase over 1Q16.
During 1Q17, the production of zinc, copper and silver rose by 9.8%, 0.4% and 7.4%,
respectively, while lead production decreased 14.4%. The increase in zinc and silver
production is mainly explained by higher treated ore volumes and head grades, while
the decline in lead production is due to a lower head grade.
Table 18: Alpamarca Cost of Production
In absolute terms, the cost of production totaled USD 4.9 MM, 13.1% lower than the
USD 5.6 MM figure for the same quarter of the previous year. The unit cost fell by
16.8%, from 25.0 USD/MT in 1Q16 to 20.8 USD/MT in 1Q17. The unit cost decreased
significantly due to an increased volume of production and the operating efficiencies
achieved in the exploitation of the open pit.
Alpamarca
Production
Jan-Mar
2017
Jan-Mar
2016 var %
Mineral extraction (thousands MT) 238 227 5.2
Mineral treatment (thousands MT) 234 224 4.2
Fines Content
Zinc (thousands FMT) 2.7 2.5 9.8
Lead (thousands FMT) 1.6 1.8 -14.4
Copper (thousands FMT) 0.1 0.1 0.4
Silver (million Oz) 0.5 0.5 7.4
Source: Volcan Cia. Minera
Alpamarca
Production Cost
Jan-Mar
2017
Jan-Mar
2016 var %
Production Cost (MM USD) 4.9 5.6 -13.1
Extraction Cost 2.0 2.8 -29.4
Treatment Cost 2.9 2.8 3.4
Unit Cost (USD/MT) 20.8 25.0 -16.8
Extraction Cost 8.4 12.5 -32.9
Treatment Cost 12.4 12.5 -0.8
Source: Volcan Cia. Minera

Management Discussion and Analysis
17
Table 19: Alpamarca Operating Investments
Operating investments at the Alpamarca Unit during 1Q17 totaled USD 0.3 MM, while
investments in 1Q16 totaled USD 0.2 MM.
3.4 Cerro de Pasco Unit Operating Results
Table 20: Cerro de Pasco Production
In 4Q16, the commercial treatment of low-grade polymetallic ore from the stockpiles
began at this unit. In 1Q17, the volumes of ore treated amounted to 228 thousand MT,
producing 1.8 thousand FMT of zinc, 0.7 thousand FMT of lead and 0.1 million silver
ounces.
A sorting technology that separates the highest grade ore from the stockpiles is
expected to commence operations during the second half of 2017 at the Cerro de
Pasco Unit, allowing for a significant increase in treated grades of this polymetalic
mineral.
Alpamarca Operating Inv.
(MM USD)
Jan-Mar
2017
Jan-Mar
2016 var %
Local Exploration 0.0 0.0 -100.0
Mine Development 0.0 0.0
Plants and Tailings Dams 0.2 0.0 323.0
Mine and Infrastructure 0.1 0.1 -20.8
Support and Others 0.1 0.0
Total 0.3 0.2 122.0
Source: Volcan Cia. Minera
Cerro de Pasco
Production
Jan-Mar
2017
Mineral extraction (thousands MT) 228
Mineral treatment (thousands MT) 228
Fines Content
Zinc (thousands FMT) 1.8
Lead (thousands FMT) 0.7
Copper (thousands FMT) 0.0
Silver (million Oz) 0.1
Source: Volcan Cia. Minera

Management Discussion and Analysis
18
Table 21: Cerro de Pasco Cost of Production
In 1Q17, the absolute cost of production amounted to USD 3.0 MM and the unit cost
was 13.3 USD/MT.
Table 22: Cerro de Pasco Operating Investments
During 1Q17, operating investments totaled USD 0.6 MM and were used for the
treatment of ore from stockpiles at the San Expedito plant.
3.5 Oxides Plant Operating Results
Table 23: Oxides Plant Production
In 1Q17, the treated volume of ore from the stockpiles declined by 20.9% as compared
to 1Q16, due to the 17-day suspension of production resulting from the blockage of the
plant's access road by a group of people and vehicles from the community company
ECOSERM Rancas. As a consequence, the production of silver fines declined by
23.2% and gold fine by 34.8%.
The annual planned production is expected to recover in the following months.
Cerro de Pasco
Production Cost
Jan-Mar
2017
Production Cost (MM USD) 3.0
Extraction Cost 0.0
Treatment Cost 3.0
Unit Cost (USD/MT) 13.3
Extraction Cost 0.0
Treatment Cost 13.3
Source: Volcan Cia. Minera
Cerro de Pasco Operating Inv.
(MM USD)
Jan-Mar
2017
Plants and Tailings Dams 0.6
Total 0.6
Source: Volcan Cia. Minera
Oxides Plant
Production
Jan-Mar
2017
Jan-Mar
2016 var %
Mineral treatment (thousands MT) 178 226 -20.9
Fines Content
Silver (million Oz) 0.8 1.0 -23.2
Gold (Oz) 608 933 -34.8
Source: Volcan Cia. Minera

Management Discussion and Analysis
19
Table 24: Oxides Plant Cost of Production
The cost of production in absolute terms decreased by 23.9%, from USD 8.9 MM in
1Q16 to USD 6.7 MM in 1Q17, due to the 17-day suspension of the plant.
The operation's unit cost decreased by 3.8%, from 39.3 USD/MT in 1Q16 to
37.8 USD/MT in 1Q17, due to reduced use of reagents and improved efficiency in the
plant's operation.
Table 25: Oxides Plant Operating Investments
The operating investment figure for 1Q17 at the Oxides Plant amounted to
USD 1.0 MM. During 1Q16, operating investment totaled USD 1.9 MM.
Oxides Plant
Production Cost
Jan-Mar
2017
Ene-Mar
2016 var %
Production Cost (MM USD) 6.7 8.9 -23.9
Extraction Cost 0.9 1.3 -33.4
Treatment Cost 5.9 7.6 -22.3
Unit Cost (USD/MT) 37.8 39.3 -3.8
Extraction Cost 4.8 5.7 -15.8
Treatment Cost 33.0 33.6 -1.8
Source: Volcan Cia. Minera
Oxides Plant Operating Inv.
(MM USD)
Jan-Mar
2017
Jan-Mar
2016 var %
Plants and Tailings Dams 0.1 0.1 24.9
Mine and Infrastructure 0.6 1.8 -64.5
Support and Others 0.2 0.0
Total 1.0 1.9 -50.4
Source: Volcan Cia. Minera

Management Discussion and Analysis
20
4. Energy
Table 26: Volcan's Electric Power Balance
During 1Q17, Volcan's total consumption of electric power reached 166.1 GWh, with a
maximum demand of 88 MW.
The 10 hydroelectric plants that belong to the Chungar Unit generated 43 GWh. This
accounted for 26% of the Company's total consumption; at an average cost of
18 USD/MWh, including operating, maintenance and transmission costs. The Tingo
Hydroelectric Plant generated 2.2 GWh, accounting for 1.3% of the Company's total
consumption. All of the Tingo plant´s power supplied to the Chungar Unit.
Volcan purchased 120.9 GWh from the national central grid system (the SEIN) in order
to meet its total consumption demand, at an average unit cost of 79 USD/MWh.
The Huanchor Hydroelectric Plant produced 33.7 GWh and Rucuy Hydroelectric Plant
generated 34.6 MWh. All of this power was sold to third parties.
As a consequence of the coastal El Niño, the Rucuy Hydroelectric Plant suspended
operations in March due to damage to part of the penstock and a section of the
transmission line1. The Company made an insurance claim and is evaluating the time
needed to resume the hydroelectric plant's operation.
1 This event was reported to the Superintendencia de Mercado de Valores in letter RB-016-17 on March 22, 2017.
Electric Balance
(GWh)
Energy generation 113.5 70.2 61.7
Chungar 43.0 38.7 11.3
Tingo 2.2 2.3 -4.2
Huanchor 33.7 29.2 15.4
Rucuy 34.6
Energy consumption 166.1 151.8 9.4
Energy purchase 120.9 110.8 9.1
Source: Volcan Cia. Minera
var % Jan-Mar
2017
Jan-Mar
2016

Management Discussion and Analysis
21
5. Final Comments
The Company has an aggressive exploration plan in place for its current operating
units and for new prospects and projects. During 2017, an exploration program of
more than 200 thousand meters of diamond drilling will be executed. These
programs will allow for the expansion of the resource base of the mines in operation
and for the definition of resources at our most important projects, such as Romina 2,
Carhuacayán, Zoraida, Vinchos, Palma, and Chumpe, among others, which
represent the future growth of the Company.
The Company is permanently focused on operating cost reduction and control.
Investments in infrastructure, such as the integration tunnels between the San
Cristóbal and Carahuacra mines in Yauli and the Animón and Islay mines in
Chungar, will allow for significant reductions in transportation costs and improved
operating efficiencies. The execution of a new energy supply agreement will
translate into savings of approximately USD 8.8 MM from 2018 to 2020 and USD
6.8 MM from 2021 to 2023. Moreover, specialized teams were created within the
organization with the specific purpose of identifying and developing new operating
improvement and cost-reduction initiatives.
Improved financial results are reflected in higher net profit and EBITDA, and also in
better liquidity and debt ratios. Short-term debt has decreased from USD 251 MM in
4Q16 to USD 179 MM in 1Q17, while the net debt/EBITDA ratio registered 1.98. The
Company is firmly focused on further reducing its total debt in a favorable price
environment.

Management Discussion and Analysis
22
Annexes
Annex 1: Sales Breakdown
Chart 3: Sales by Origin (percentage of value in USD)
The distribution of sales by origin reflects a decline in the contribution of third-party
concentrates in total sales, from 8% in 1Q16 to 4% in 1Q17.
Chart 4: Sales by Metal (percentage of value in USD)
The distribution of sales by metal in 1Q17 reflects the growth in the contribution of zinc,
as a result of the increase in its average sales price.
Yauli46%
Chungar31%
Alpamarca9%
Oxides8%
Third-party4%
Sales by Origin1Q17
Source: Volcan Cia. MineraSource: Volcan Cia. Minera
Yauli52%
Chungar25%
Cerro0%
Alpamarca7%
Oxides9%
Third-party8%
Sales by Origin1Q16
Zinc57%
Lead10%
Copper2%
Silver30%
Gold1%
Sales by Metal1Q17
Source: Volcan Cia. Minera
Zinc44%
Lead11%
Copper2%
Silver42%
Gold2%
Sales by Metal1Q16

Management Discussion and Analysis
23
Annex 2: Average Spot Prices
Annex 3: Macroeconomic Indicators
Annex 4: Domestic Peruvian Metal Production
Spot Prices Jan-Mar
2017
Jan-Mar
2016 var %
Zinc (USD/MT) 2,781 1,676 65.9
Lead (USD/MT) 2,279 1,742 30.8
Copper (USD/MT) 5,834 4,669 25.0
Silver (USD/Oz) 17.4 14.8 17.4
Gold (USD/Oz) 1,219 1,179 3.4
Source: London Metal Exchange
Macroeconomic
Indicators
Jan-Mar
2017
Jan-Mar
2016 var %
Exchange Rate (S/ x USD) 3.29 3.45 -4.7
Inflation 3.97 4.30 -7.6
1 Inflation of the last 12 months
Source: Central Reserve Bank of Peru
National
Production
Jan - Feb
2017
Jan - Feb
2016var %
Silver (Thousands Oz) 21,040 22,551 -6.7
Zinc (FMT) 222,707 209,055 6.5
Lead (FMT) 46,425 50,844 -8.7
Copper (FMT) 374,599 326,426 14.8
Gold (Thousands Oz) 767 820 -6.5
Source: Ministry of Energy and Mines