
Integrated Laparoscopic Operating Theatres: The Way of the Future?

toronto.ca/budget2016
OPERATING PROGRAM SUMMARY
Civic Theatres Toronto
2016 OPERATING BUDGET OVERVIEW
The three City-owned and operated Theatres promote theatrical, artistic and cultural programming in the community through convenient and cost-effective access to state of the art venues that support multi-cultural, not-for-profit, and corporate events.
2016 Budget Highlights
The total cost to deliver these services to Toronto residents is $23.164 million gross and $5.538 million net as shown below.
In 2016, Theatres face a net pressure of $0.262 million which is partially offset by $0.070 million in operational efficiencies, resulting in a 3.6% net increase over the 2015 Net Operating Budget.
$ %
Gross Expenditures 23,323.7 23,164.3 (159.4) (0.7%)
Gross Revenues 17,978.4 17,626.8 (351.6) (2.0%)
Net Expenditures 5,345.3 5,537.6 192.3 3.6%
Change
2016 Budget2015 Budget(in $000's)
Contents
Overview
I: 2016 – 2018 Service Overview and Plan 6
II: 2016 Budget by Service 13
III: Issues for Discussion 20
Appendices:
1. 2015 Performance 23
2. 2016 Operating Budget byExpenditure Category 24
3. 2016 Organization Chart 25
4. Summary of 2016 ServiceChanges 28
5. Summary of 2016 New &Enhanced Service Priorities N/A
6. Inflows/Outflows to / fromReserves & Reserve Funds 29

2016 Operating Budget Civic Theatres Toronto
toronto.ca/budget2016 Page 2
2013
Actual
2014
Actual
2015
Actual
2016
Target
2017
Plan
2018
Plan
Sony Centre 518 583 653 653 653 653
St. Lawrence Centre 649 673 729 717 731 746
Toronto Centre 356 368 517 516 516 516
0
100
200
300
400
500
600
700
800
Theatres - Cost Per Seat
Fast Facts
Sony Centre for Performing Arts offers a3,191-seat auditorium and is Canada's largestsoft seat theatre.
St. Lawrence Centre for the Arts houses 2theatres: the 876-seat Bluma Appel Theatreand the 498-seat Jane Mallet Theatre.
Toronto Centre for the Arts has 3 theatres:the new 300-seat Greenwin Stage TowerTheatre; the 1,036-seat George WestonRecital Hall; and the 200-seat Studio Theatre.
Trends
The cost per seat generally increasesgradually to reflect the cost of inflation butcan also fluctuate from year to yeardepending on the level of stage activitytaking place in each location which impactsthe total facility operation costs.
Cost per seat for Toronto Centre for the Artsexperienced a 40% increase in 2015 due tothe re-configuration of the Main StageTheatre which resulted in 877 fewer seatsand a higher cost per seat.
Our Service Deliverables for 2016
The civic theatres endorse culture, arts and theatre by programming a full range of high quality performances and events for both corporate and not-for-profit artists.
The 2016 Operating Budget provides funding for the three City-owned and operated theatres:
Sony Centre for the Performing Arts offersmulti-functional space, comprehensive eventservices, state-of-the-art lighting and soundsystems, and a world class stage. The Theatrewill build the Centre's brand of excellence inprogramming performances with diverseappeal to all of Toronto's residents.
St. Lawrence Centre for the Arts providesstate-of-the-art facilities to Toronto's not-for-profit performing arts companies and localcommunities at an affordable cost. TheCentre will continue to attract a wide range ofcultural and artistic events with selectcorporate and not-for-profit presenters.
Toronto Centre for the Arts offers a first classvenue for a full range of performing arts. TheCentre will become the most versatileperforming arts centre in Toronto. It will buildstrategic links with the local arts communityand seek educational and programmingpartners that will strengthen the operations ofthe Centre.

2016 Operating Budget Civic Theatres Toronto
toronto.ca/budget2016 Page 3
2016 Operating Budget Expenses & Funding
Where the money goes:
2016 Budget by Service
2016 Budget by Expenditure Category
Where the money comes from:
2016 Budget by Funding Source
Leadership Dev't, $0.3,
1%
Sony Centre,
$15.3, 66%
St. Lawrence, $3.6, 16%
TCA, $4.0, 17%
$23.164 Million
User Fees & Donations, $12.2, 53%
Contributions from Reserve Funds, $2.4,
10%
Property Tax, $5.5, 24%
Sundry & Other
Revenues, $3.1, 13%
$23.164 Million
Salaries & Benefits,
$11.7, 51%
Equipment, $0.8, 3%
Materials & Supplies, $2.2,
9%
Services & Rents, $4.8,
21%
Contributions to Reserves,
$1.1, 5%
Other Expenditures,
$0.7, 3%
Contributions to Capital, $1.8, 8%
$23.164Million
Our Key Issues & Priority Actions
Increasing Operating Costs - All three theatresare underutilized and the cost per seat ofoperating the combined seven stages continuesto rise with few prospects for reversing the trendunder a status quo scenario.
$0.300 million is included in 2016 forLeadership Development to consolidate theoperations of all three theatres into one neworganization under the direction of the newCivic Theatres Toronto Board.
Decline in Ticket Surcharge Revenue - Decline inticket sales reduces the ticket surcharge revenueused to fund necessary capital maintenance workat the theatres.
Council approval of the write-off of the Cityloans will free up the ticket surcharge revenue,previously used to pay off the loan, for variouscapital repairs.
2016 Operating Budget Highlights
Sony Centre for the Performing Arts will continueto strengthen its strong brand strategy, re-establish best practices for networking,sponsorship, and partner opportunities. The NetBudget increase of $0.098 million will supportsponsorship development.
St. Lawrence Centre for the Arts will continue toattract new resident companies and increaseawareness of the Centre's potential with highermarketing operations. Net Budget decrease of$0.024 million is due to rightsizing the revenuebudget.
Toronto Centre for the Arts will continue to focuson the not-for-profit community arts groups byincreasing overall utilization of the reconfiguredsmaller venues. Net Budget decrease of $0.023million results from increased activity volume andassociated revenue.
The 2016 Operating Budget includes $0.300million for Leadership Development to supportthe transition and recruit a new CEO for CivicTheatres Toronto.
2016 Operating Budget Civic Theatres Toronto
toronto.ca/budget2016 Page 4
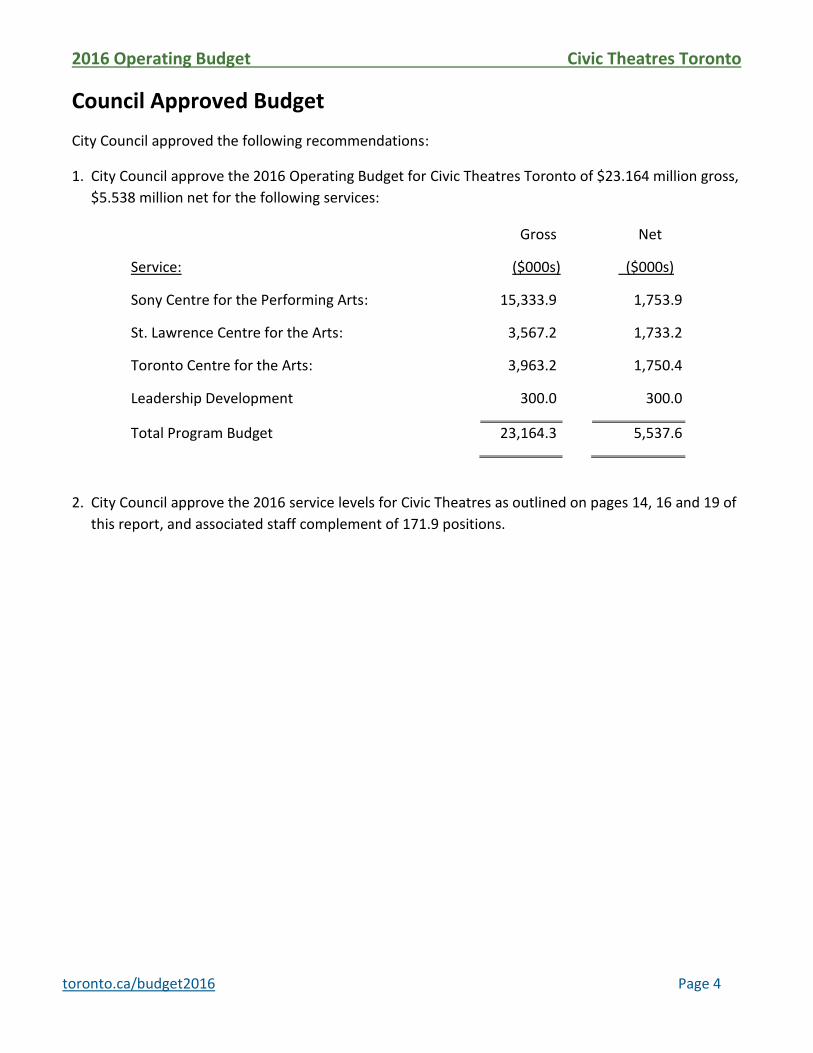
Council Approved Budget
City Council approved the following recommendations:
1. City Council approve the 2016 Operating Budget for Civic Theatres Toronto of $23.164 million gross,
$5.538 million net for the following services:
2. City Council approve the 2016 service levels for Civic Theatres as outlined on pages 14, 16 and 19 of
this report, and associated staff complement of 171.9 positions.
Service:
Gross
($000s)
Net
($000s)
Sony Centre for the Performing Arts:
St. Lawrence Centre for the Arts:
Toronto Centre for the Arts:
15,333.9
3,567.2
3,963.2
1,753.9
1,733.2
1,750.4
Leadership Development 300.0 300.0
Total Program Budget 23,164.3 5,537.6
2016 Operating Budget Civic Theatres Toronto
toronto.ca/budget2016 Page 5
Part I: 2016 – 2018
Service Overview and
PlanProgram Map
2016 Operating Budget Civic Theatres Toronto
toronto.ca/budget2016 Page 6
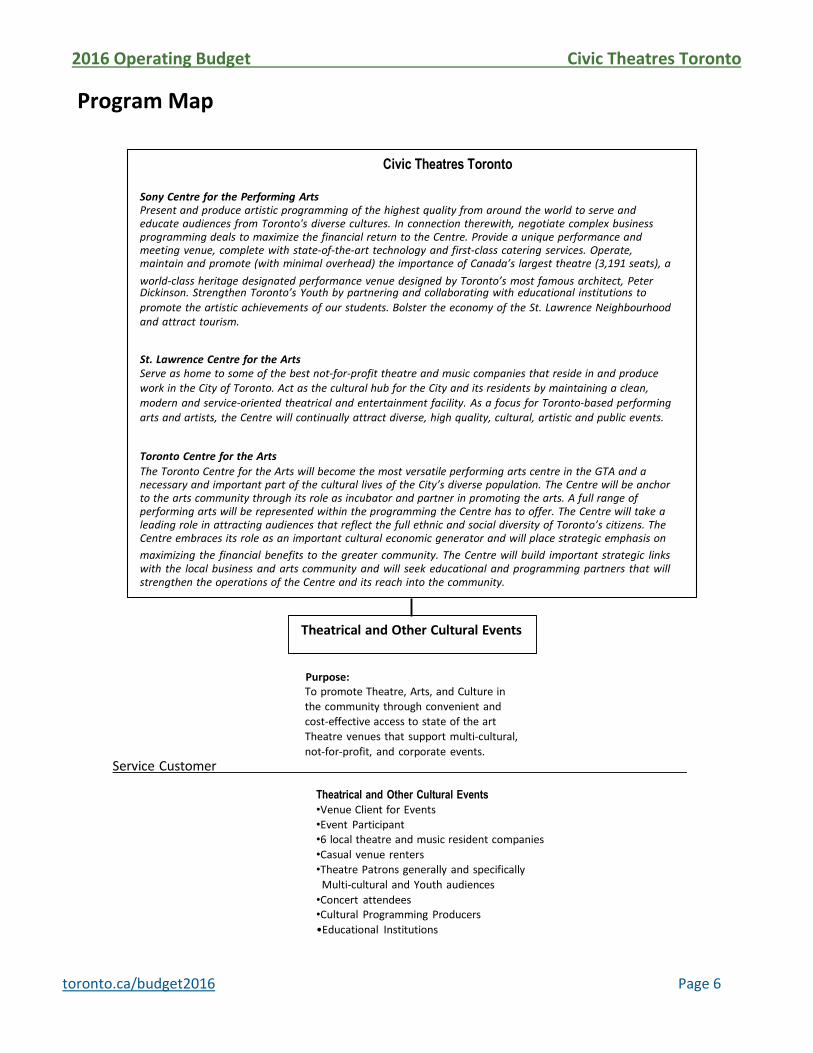
Program Map
Purpose: To promote Theatre, Arts, and Culture in
the community through convenient and
cost-effective access to state of the art
Theatre venues that support multi-cultural,
not-for-profit, and corporate events.
Service Customer
Theatrical and Other Cultural Events
•Venue Client for Events
•Event Participant •6 local theatre and music resident companies
•Casual venue renters
•Theatre Patrons generally and specifically
Multi-cultural and Youth audiences
•Concert attendees •Cultural Programming Producers
•Educational Institutions
Civic Theatres Toronto
Sony Centre for the Performing Arts Present and produce artistic programming of the highest quality from around the world to serve and educate audiences from Toronto's diverse cultures. In connection therewith, negotiate complex business programming deals to maximize the financial return to the Centre. Provide a unique performance and meeting venue, complete with state-of-the-art technology and first-class catering services. Operate, maintain and promote (with minimal overhead) the importance of Canada’s largest theatre (3,191 seats), a
world-class heritage designated performance venue designed by Toronto’s most famous architect, Peter Dickinson. Strengthen Toronto’s Youth by partnering and collaborating with educational institutions to
promote the artistic achievements of our students. Bolster the economy of the St. Lawrence Neighbourhood and attract tourism.
St. Lawrence Centre for the Arts Serve as home to some of the best not-for-profit theatre and music companies that reside in and produce work in the City of Toronto. Act as the cultural hub for the City and its residents by maintaining a clean, modern and service-oriented theatrical and entertainment facility. As a focus for Toronto-based performing arts and artists, the Centre will continually attract diverse, high quality, cultural, artistic and public events.
Toronto Centre for the Arts
The Toronto Centre for the Arts will become the most versatile performing arts centre in the GTA and a necessary and important part of the cultural lives of the City’s diverse population. The Centre will be anchor to the arts community through its role as incubator and partner in promoting the arts. A full range of performing arts will be represented within the programming the Centre has to offer. The Centre will take a leading role in attracting audiences that reflect the full ethnic and social diversity of Toronto’s citizens. The Centre embraces its role as an important cultural economic generator and will place strategic emphasis on
maximizing the financial benefits to the greater community. The Centre will build important strategic links with the local business and arts community and will seek educational and programming partners that will strengthen the operations of the Centre and its reach into the community.
Theatrical and Other Cultural Events

2016 Operating Budget Civic Theatres Toronto
toronto.ca/budget2016 Page 7
Table 1 2016 Operating Budget and Plan by Service
The Civic Theatres Toronto’s 2016 Operating Budget is $23.164 million gross and $5.538 million net, representing a 3.6% increase to the 2015 Approved Net Operating Budget. The net budget increase of $0.192 million is due to the following:
Sony Centre for the Performing Arts' 2016 Operating Budget is $1.754 million net or 6% above the 2015 Approved Operating Budget for Sony Centre. Labour related and inflationary increases, as well as additional funding required for preventative maintenance, are partially offset by additional revenue from increased activity.
St. Lawrence Centre for the Arts' 2016 Operating Budget is $1.733 million net or 1.4% below the 2015 Approved Operating Budget for St. Lawrence Centre and is in line with the reduction target set out in the 2016 Operating Budget Directions and Guidelines. Inflationary pressures on labour and non-labour factors are fully offset by revenue changes based on activity levels.
Toronto Centre for the Arts' 2016 Operating Budget is $1.750 million net or 1.3% below the 2015 Approved Operating Budget for the Toronto Centre and is in line with the reduction target set out in the 2016 Operating Budget Directions and Guidelines. Salary and non-salary economic factors and other base pressures are fully offset by anticipated revenue from increased activity levels.
The 2016 Operating Budget for Leadership Development provides one-time funding of $0.300 million to continue the transition of three theatres to one organization, including supporting the work of the Special Advisor and a CEO search and initial engagement.
Incremental Change
2017 and 2018 Plan
(In $000s)
Approved
Budget
Projected
Actual 2016 Base
2016
New/Enhanced
2016
Budget
By Service $ $ $ $ $ $ % $ % $ %
Sony Centre for the Performing Arts
Gross Expenditures 16,292.5 14,440.1 15,333.9 15,333.9 (958.6) (5.9%)
Revenue 14,637.2 12,768.1 13,580.0 13,580.0 (1,057.2) (7.2%)
Net Expenditures 1,655.3 1,672.0 1,753.9 - 1,753.9 98.6 6.0% - -
St. Lawrence Centre for the Arts
Gross Expenditures 3,455.9 3,772.9 3,567.2 3,567.2 111.3 3.2% 56.9 1.6% 58.8 1.6%
Revenue 1,698.8 2,178.1 1,834.0 1,834.0 135.2 8.0% 34.7 1.9% 35.4 1.9%
Net Expenditures 1,757.1 1,594.8 1,733.2 - 1,733.2 (23.9) (1.4%) 22.2 1.3% 23.4 1.3%
Toronto Centre for the Arts
Gross Expenditures 3,415.3 3,311.2 3,963.2 3,963.2 547.9 16.0% (477.9) (12.1%) 21.8 0.6%
Revenue 1,642.4 1,342.9 2,212.8 2,212.8 570.4 34.7% (470.7) (21.3%) 29.8 1.7%
Net Expenditures 1,772.9 1,968.3 1,750.4 - 1,750.4 (22.5) (1.3%) (7.2) (0.4%) (8.0) (0.5%)
Leadership Development
Gross Expenditures 160.0 80.0 300.0 300.0 140.0 87.5% (300.0) (100.0%)
Revenue
Net Expenditures 160.0 80.0 300.0 - 300.0 140.0 0.9 (300.0) (100.0%)
Total
Gross Expenditures 23,323.7 21,604.2 23,164.3 - 23,164.3 (159.4) (0.7%) (721.0) (3.1%) 80.6 0.4%
Revenue 17,978.4 16,289.1 17,626.8 - 17,626.8 (351.6) (2.0%) (436.0) (2.5%) 65.2 0.4%
Total Net Expenditures 5,345.3 5,315.1 5,537.5 - 5,537.6 192.2 3.6% (285.0) (5.1%) 15.4 0.3%
Approved Positions 163.1 168.9 171.9 - 171.9 8.8 5.4%
2015 2016 Operating Budget
2016 vs. 2015 Budget
Approved Changes 2017 2018
2016 Operating Budget Civic Theatres Toronto
toronto.ca/budget2016 Page 8
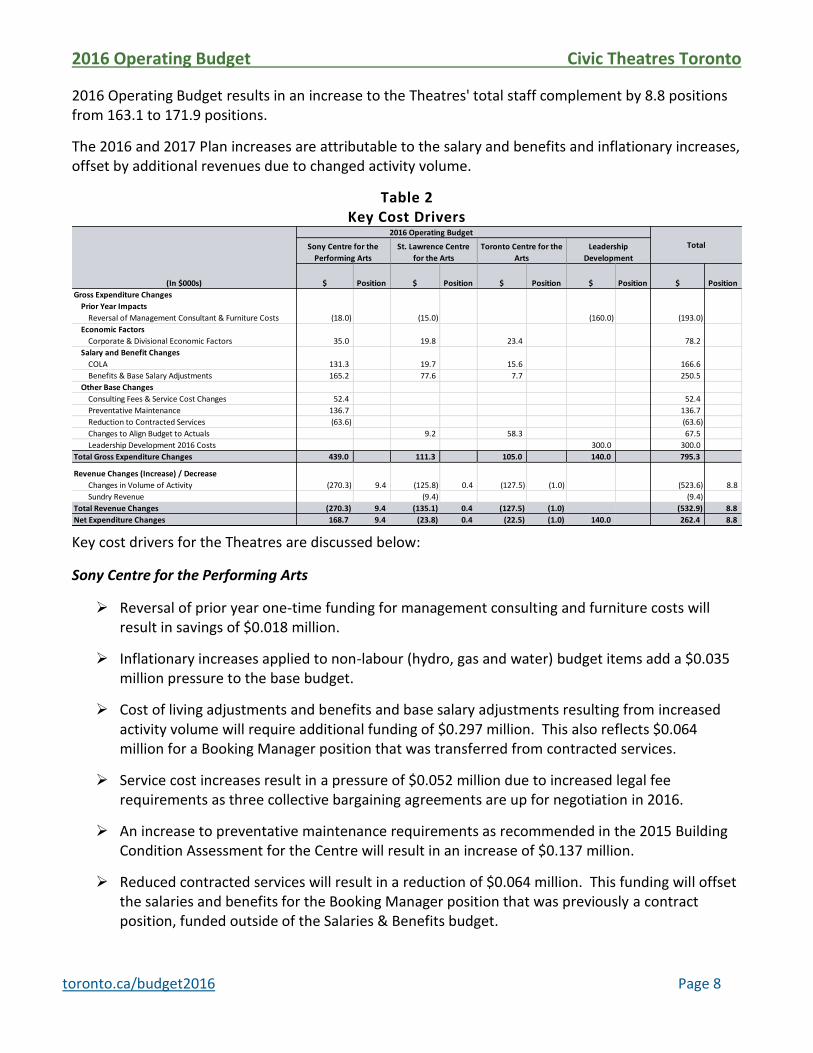
2016 Operating Budget results in an increase to the Theatres' total staff complement by 8.8 positions from 163.1 to 171.9 positions.
The 2016 and 2017 Plan increases are attributable to the salary and benefits and inflationary increases, offset by additional revenues due to changed activity volume.
Table 2 Key Cost Drivers
Key cost drivers for the Theatres are discussed below:
Sony Centre for the Performing Arts
Reversal of prior year one-time funding for management consulting and furniture costs will result in savings of $0.018 million.
Inflationary increases applied to non-labour (hydro, gas and water) budget items add a $0.035 million pressure to the base budget.
Cost of living adjustments and benefits and base salary adjustments resulting from increased activity volume will require additional funding of $0.297 million. This also reflects $0.064 million for a Booking Manager position that was transferred from contracted services.
Service cost increases result in a pressure of $0.052 million due to increased legal fee requirements as three collective bargaining agreements are up for negotiation in 2016.
An increase to preventative maintenance requirements as recommended in the 2015 Building Condition Assessment for the Centre will result in an increase of $0.137 million.
Reduced contracted services will result in a reduction of $0.064 million. This funding will offset the salaries and benefits for the Booking Manager position that was previously a contract position, funded outside of the Salaries & Benefits budget.
(In $000s) $ Position $ Position $ Position $ Position $ Position
Gross Expenditure Changes
Prior Year Impacts
Reversal of Management Consultant & Furniture Costs (18.0) (15.0) (160.0) (193.0)
Economic Factors
Corporate & Divisional Economic Factors 35.0 19.8 23.4 78.2
Salary and Benefit Changes
COLA 131.3 19.7 15.6 166.6
Benefits & Base Salary Adjustments 165.2 77.6 7.7 250.5
Other Base Changes
Consulting Fees & Service Cost Changes 52.4 52.4
Preventative Maintenance 136.7 136.7
Reduction to Contracted Services (63.6) (63.6)
Changes to Align Budget to Actuals 9.2 58.3 67.5
Leadership Development 2016 Costs 300.0 300.0
Total Gross Expenditure Changes 439.0 111.3 105.0 140.0 795.3
Revenue Changes (Increase) / Decrease
Changes in Volume of Activity (270.3) 9.4 (125.8) 0.4 (127.5) (1.0) (523.6) 8.8
Sundry Revenue (9.4) (9.4)
Total Revenue Changes (270.3) 9.4 (135.1) 0.4 (127.5) (1.0) (532.9) 8.8
Net Expenditure Changes 168.7 9.4 (23.8) 0.4 (22.5) (1.0) 140.0 262.4 8.8
Total Sony Centre for the
Performing Arts
St. Lawrence Centre
for the Arts
Toronto Centre for the
Arts
Leadership
Development
2016 Operating Budget
2016 Operating Budget Civic Theatres Toronto
toronto.ca/budget2016 Page 9
St. Lawrence Centre for the Arts
Reversal of prior year one-time funding for management consulting and furniture costs will result in savings of $0.015 million.
Inflationary increases applied to labour and non-labour budget items add a $0.040 million pressure to the base budget.
Benefits & Base Salary adjustments as a result of activity volume changes will require additional funding of $0.078 million.
Aligning such base budget items as audit fees and credit card charges with 2015 actuals will require additional funding of $0.009 million in 2016.
Toronto Centre for the Arts
Inflationary increases applied to labour and non-labour budget items add a $0.047 million pressure to the base budget.
Aligning a number of budget line items to historical actual will require additional funding of $0.058 million.
Leadership Development
One-time 2015 funding of $0.160 million required to begin the transition to Civic Theatres Toronto was reversed.
One-time funding of $0.300 million is required to continue with operational requirements of the transition, including supporting the work of the Special Advisor, a CEO search and initial engagement.

2016 Operating Budget Civic Theatres Toronto
toronto.ca/budget2016 Page 10
In order to offset the above net pressures, the 2016 service cost changes for Theatres consists of base revenue changes of $0.533 million net and service efficiency savings of $0.070 million net, as detailed below.
Table 3 2016 Total Service Change Summary
Base Revenue Changes (Savings of $0.533 million net)
Changes in Volume of Activity
Changes in activity volume will result in additional net revenue of $0.270 million for the Sony Centre and $0.128 million for the Toronto Centre for the Arts. In addition, aligning budgeted recoveries for labour costs to historical experience will provide additional revenue of $0.126 million to St. Lawrence Centre.
Sundry Revenue
Additional sundry revenues for production equipment and piano rental, printing and catering commission will result in additional revenue of $0.009 million for the St. Lawrence Centre.
Service Efficiencies (Savings of $0.070 million gross & net)
Hydro Expenses Reduction
As a result of a retrofit to the Sony Centre's lighting system throughout the building, the hydro bill will be reduced and provide efficiency savings of $0.037 million.
Renegotiated Contract
Successful negotiations with Sodexo resulted in reduced fee paid under the existing contract providing savings of $0.033 million.
$ $ #Gross Net Gross Net Gross Net Gross Net Pos. Net Pos. Net Pos.
Base Changes:
Base Revenue Changes
Changes in Volume of Activity (1,386.1) (270.3) (125.8) 193.0 (127.5) (1,193.1) (523.6) 8.8
Sundry Revenue (9.4) (9.4)
Sub-Total (1,386.1) (270.3) (135.2) 193.0 (127.5) (1,193.1) (532.9) 8.8
Service Efficiencies
Hydro Expenses Reduction (37.0) (37.0) (37.0) (37.0)
Renegotiated Contract (33.0) (33.0) (33.0) (33.0)
Sub-Total (70.0) (70.0) (70.0) (70.0)
Total Changes (1,456.1) (340.3) (135.2) 193.0 (127.5) (1,263.1) (602.9) 8.8
2017 Plan 2018 Plan
2016 Service Changes Total Service Changes
Description ($000s) Sony Centre for the St. Lawrence Toronto Centre for
Incremental Change
2016 Operating Budget Civic Theatres Toronto
toronto.ca/budget2016 Page 11
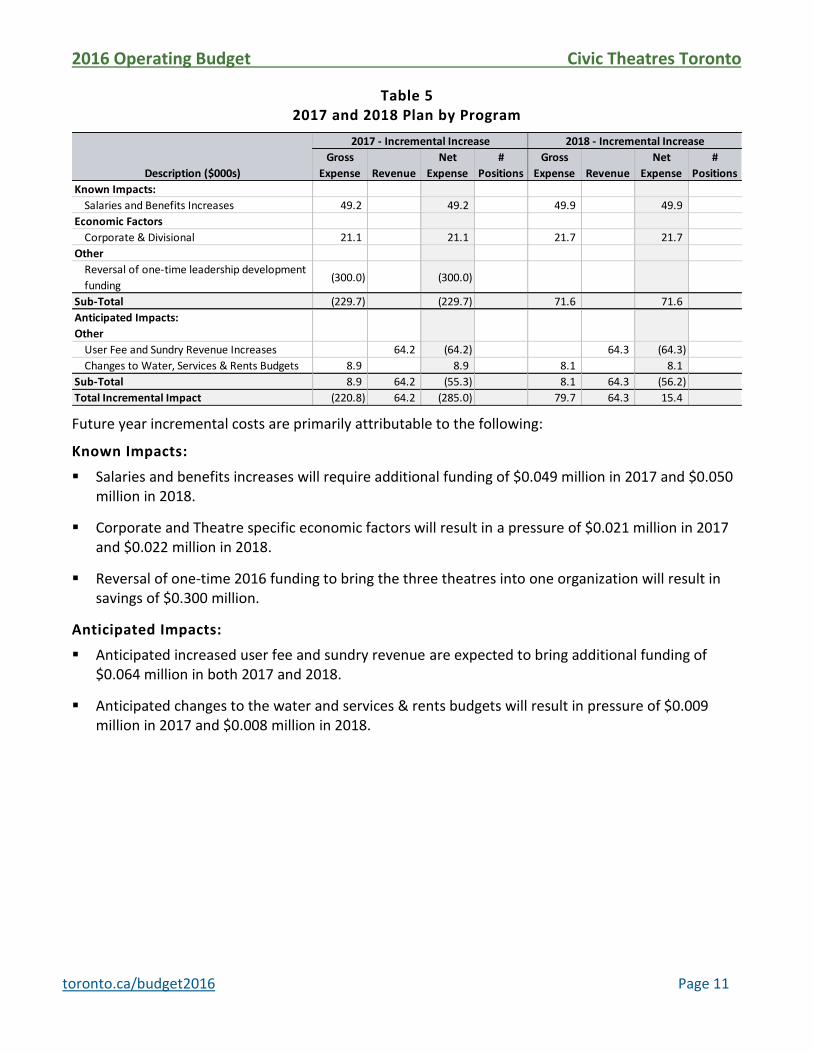
Table 5 2017 and 2018 Plan by Program
Future year incremental costs are primarily attributable to the following:
Known Impacts:
Salaries and benefits increases will require additional funding of $0.049 million in 2017 and $0.050 million in 2018.
Corporate and Theatre specific economic factors will result in a pressure of $0.021 million in 2017 and $0.022 million in 2018.
Reversal of one-time 2016 funding to bring the three theatres into one organization will result in savings of $0.300 million.
Anticipated Impacts:
Anticipated increased user fee and sundry revenue are expected to bring additional funding of $0.064 million in both 2017 and 2018.
Anticipated changes to the water and services & rents budgets will result in pressure of $0.009 million in 2017 and $0.008 million in 2018.
Description ($000s)
Gross
Expense Revenue
Net
Expense
#
Positions
Gross
Expense Revenue
Net
Expense
#
Positions
Known Impacts:
Salaries and Benefits Increases 49.2 49.2 49.9 49.9
Economic Factors
Corporate & Divisional 21.1 21.1 21.7 21.7
Other
Reversal of one-time leadership development
funding(300.0) (300.0)
Sub-Total (229.7) (229.7) 71.6 71.6
Anticipated Impacts:
Other
User Fee and Sundry Revenue Increases 64.2 (64.2) 64.3 (64.3)
Changes to Water, Services & Rents Budgets 8.9 8.9 8.1 8.1
Sub-Total 8.9 64.2 (55.3) 8.1 64.3 (56.2)
Total Incremental Impact (220.8) 64.2 (285.0) 79.7 64.3 15.4
2017 - Incremental Increase 2018 - Incremental Increase
2016 Operating Budget Civic Theatres Toronto
toronto.ca/budget2016 Page 12
Part II: 2016 Budget by
Service

2016 Operating Budget Civic Theatres Toronto
toronto.ca/budget2016 Page 13
Sony Centre for the Performing Arts What We Do
Sony Centre presents and produces artistic programming of the highest quality from around the world to serve and educate audiences from Toronto's diverse cultures.
The Centre provides a unique performance and meeting venue, complete with state-of-the-art technology and first class catering services.
Sony Centre strengthens Toronto's youth by partnering and collaborating with educational institutions to promote the artistic achievements of its students.
2016 Service Budget by Activity ($000s)
Service by Funding Source ($000s)
Facility Cost Per Seat
Propoerty Tax,
$1,754.0,
11%
User Fees, $9,031.0,
59%
Contributions from
Reserves,
$1,520.9, 10%
Sundry Revenues, $3,028.1,
20%
$15.3Million
2013 Actual
2014Actual
2015Actual
2016Target
2017Plan
2018Plan
Facilities Cost Per Seat $356 $331 $653 $653 $653 $653
$0
$100
$200
$300
$400
$500
$600
$700
Sony Centre - Cost Per Seat
Sony Centre for the Performing Arts
Sony Centre for the
Performing Arts,
$15,334.0, 100%
$15.3Million
The 2015 cost per seat includes the
increased provision for utilities, as well as
the operational costs for the expanded
and renovated backstage area.
The 2016 and future year costs per seat
are anticipated to remain at $653.
2016 Operating Budget Civic Theatres Toronto
toronto.ca/budget2016 Page 14
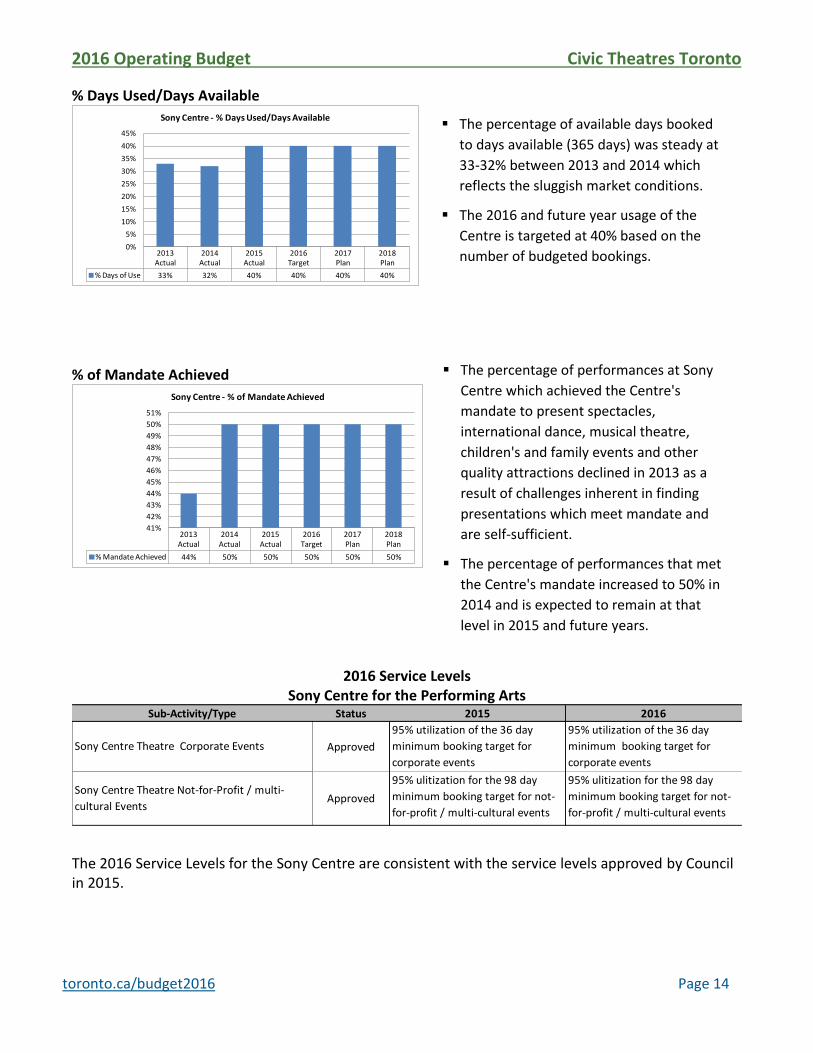
% Days Used/Days Available
% of Mandate Achieved
2016 Service Levels
Sony Centre for the Performing Arts
The 2016 Service Levels for the Sony Centre are consistent with the service levels approved by Council in 2015.
2013 Actual
2014Actual
2015Actual
2016Target
2017Plan
2018Plan
% Days of Use 33% 32% 40% 40% 40% 40%
0%
5%
10%
15%
20%
25%
30%
35%
40%
45%
Sony Centre - % Days Used/Days Available
2013 Actual
2014Actual
2015Actual
2016Target
2017Plan
2018Plan
% Mandate Achieved 44% 50% 50% 50% 50% 50%
41%
42%
43%
44%
45%
46%
47%
48%
49%
50%
51%
Sony Centre - % of Mandate Achieved
Sub-Activity/Type Status 2015 2016
Approved
95% utilization of the 36 day
minimum booking target for
corporate events
95% utilization of the 36 day
minimum booking target for
corporate events
Approved
95% ulitization for the 98 day
minimum booking target for not-
for-profit / multi-cultural events
95% ulitization for the 98 day
minimum booking target for not-
for-profit / multi-cultural events
Sony Centre Theatre Corporate Events
Sony Centre Theatre Not-for-Profit / multi-
cultural Events
The percentage of available days booked
to days available (365 days) was steady at
33-32% between 2013 and 2014 which
reflects the sluggish market conditions.
The 2016 and future year usage of the
Centre is targeted at 40% based on the
number of budgeted bookings.
The percentage of performances at Sony
Centre which achieved the Centre's
mandate to present spectacles,
international dance, musical theatre,
children's and family events and other
quality attractions declined in 2013 as a
result of challenges inherent in finding
presentations which meet mandate and
are self-sufficient.
The percentage of performances that met
the Centre's mandate increased to 50% in
2014 and is expected to remain at that
level in 2015 and future years.
2016 Operating Budget Civic Theatres Toronto
toronto.ca/budget2016 Page 15
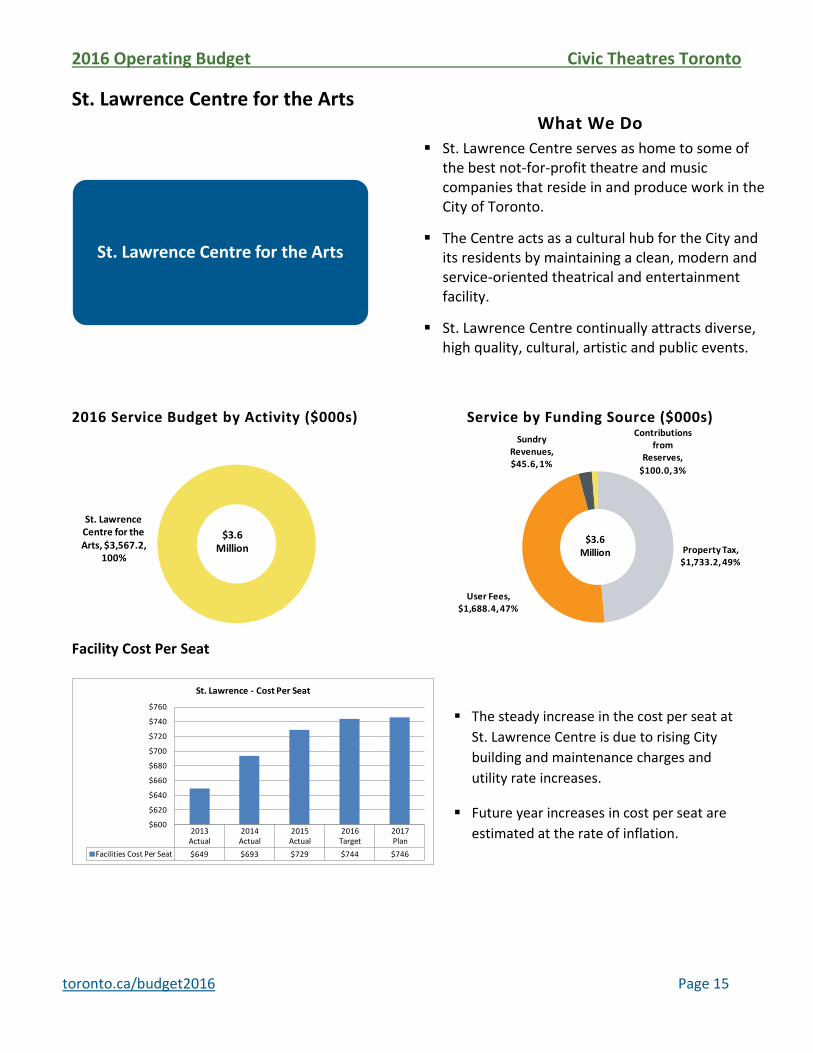
Property Tax, $1,733.2, 49%
User Fees, $1,688.4, 47%
Contributions from
Reserves,
$100.0, 3%
Sundry Revenues, $45.6, 1%
$3.6Million
St. Lawrence Centre for the Arts
What We Do
St. Lawrence Centre serves as home to some of the best not-for-profit theatre and music companies that reside in and produce work in the City of Toronto.
The Centre acts as a cultural hub for the City and its residents by maintaining a clean, modern and service-oriented theatrical and entertainment facility.
St. Lawrence Centre continually attracts diverse, high quality, cultural, artistic and public events.
2016 Service Budget by Activity ($000s)
Service by Funding Source ($000s)
Facility Cost Per Seat
St. Lawrence Centre for the Arts
2013 Actual
2014Actual
2015Actual
2016Target
2017Plan
Facilities Cost Per Seat $649 $693 $729 $744 $746
$600
$620
$640
$660
$680
$700
$720
$740
$760
St. Lawrence - Cost Per Seat
St. Lawrence Centre for the Arts, $3,567.2,
100%
$3.6Million
The steady increase in the cost per seat at
St. Lawrence Centre is due to rising City
building and maintenance charges and
utility rate increases.
Future year increases in cost per seat are
estimated at the rate of inflation.

2016 Operating Budget Civic Theatres Toronto
toronto.ca/budget2016 Page 16
% Days Used/Days Available
% Days Used/Days Available
2016 Service Levels St. Lawrence Centre for the Arts
In 2016, the St. Lawrence Centre for the Arts will maintain the service levels approved by Council in 2015.
2013 Actual
2014Actual
2015Actual
2016Target
2017Plan
2018Plan
% Days of Use 33% 28% 32% 33% 33% 33%
25%
26%
27%
28%
29%
30%
31%
32%
33%
34%
Bluma Appel Theatre - % Days Used/Days Available
2013 Actual
2014Actual
2015Actual
2016Target
2017Plan
2018Plan
% Days of Use 26% 28% 25% 25% 26% 26%
24%
24%
25%
25%
26%
26%
27%
27%
28%
28%
29%
Jane Mallet Theatre - % Days Used/Days Available
Sub-Activity/Type Status 2015 2016
Approved60% utilization of the 20 day
minimum booking target for
corporate events
60% utilization of the 20 day
minimum booking target for
corporate events
Approved
88% utilization of the 126 day
minimum booking target for not-
for-profit / multicultural events
88% utilization of the 126 day
minimum booking target for not-
for-profit / multicultural events
Approved113% utilization of the 15 day
minimum booking target for
corporate events
113% utilization of the 15 day
minimum booking target for
corporate events
Approved
125% utilization of the 64 day
minimum booking target for not-
for-profit / multicultural events
125% utilization of the 64 day
minimum booking target for not-
for-profit / multicultural events
Approved
35% utilization of the 15 day
minimum booking target for
corporate events
35% utilization of the 15 day
minimum booking target for
corporate events
Rehearsal Hall Corporate Events (STLCA)
Rehearsal Hall Theatre Not-for-Profit / multi-
cultural Events (STLCA)
Jane Mallett Theatre Corporate Events (STLCA)
Jane Mallett Theatre Not-for-Profit / multi-
cultural Events (STLCA)
Bluma Appel Theatre Corporate Events (STLCA)
Bluma Appel Theatre Not-for-Profit / multi-
cultural Events (STLCA)
Approved
147% utilization of the 35 day
minimum booking target for not-
for-profit / multicultural events
147% utilization of the 35 day
minimum booking target for not-
for-profit / multicultural events
The percentage of days used todays
available (365 days) in the Bluma Appel
Theatre declined in 2014 primarily
because of cancelled Canadian Stage
presentations and bookings.
The percentage of days used rose in 2015
and is expected to rise in future years
since more bookings are anticipated for
Canadian Stage.
The Jane Mallet Theatre experienced a
decline in the percentage of days used in
2013 due to the departure of a resident
company and cancellation of one-time
bookings. The impact was partially carried
over into 2014.
In 2015 and future years, the percentage
of days used is based on known bookings
and one-off events.

2016 Operating Budget Civic Theatres Toronto
toronto.ca/budget2016 Page 17
Property Tax, $1,750.4, 44%
User Fees, $1,462.8, 37%
Contributions from
Reserves,
$750.0, 19%
$3.9Million
Toronto Centre for the Arts
What We Do
Toronto Centre for the Arts plays an important role as an incubator and partner in promoting the arts and presents a full range of performing arts within its programming.
The Centre takes a leading role in attracting audiences that reflect the full ethnic and social diversity of Toronto's citizens.
Toronto Centre for the Arts builds strategic links with the local business and arts communities and seeks educational and programming partners that will strengthen its reach into the community.
2016 Service Budget by Activity ($000s)
Service by Funding Source ($000s)
Facility Cost Per Seat
Toronto Centre for the Arts
Toronto Centre for the Arts, $3,963.2,
100%
$3.9Million
2013 Actual
2014Actual
2015Actual
2016Target
2017Plan
Facilities Cost Per Seat $356 $331 $453 $464 $467
$0
$50
$100
$150
$200
$250
$300
$350
$400
$450
$500
Toronto Centre - Cost Per Seat The cost per seat remained fairly constant
in 2013 and 2014 and rose in 2015
primarily due to the reduction in total
seating arising from the re-configuration of
the Main Stage Theatre (1,727 seats) into
two smaller venues (850 seats).
2016 and 2017 increases in the cost per
seat are expected to correspond to the rate
of inflation.

2016 Operating Budget Civic Theatres Toronto
toronto.ca/budget2016 Page 18
% Days Used/Days Available
% Days Used/Days Available
2016 Service Levels Toronto Centre for the Arts
The Toronto Centre for the Arts will maintain the same service levels in 2016 as was approved by Council in 2015.
2013 Actual
2014Actual
2015Actual
2016Target
2017Plan
2018Plan
% Days of Use 36% 38% 42% 45% 48% 48%
0%
10%
20%
30%
40%
50%
60%
George Weston Recital Hall - % Days Used/Days Available
2013 Actual
2014Actual
2015Actual
2016Target
2017Plan
2018Plan
% Days of Use 93% 81% 67% 80% 83% 83%
0%
10%
20%
30%
40%
50%
60%
70%
80%
90%
100%
Studio Theatre - % Days Used/Days Available
Sub-Activity/Type Status 2015 2016
Approved
100% utilization of the 20 day
minimum booking target for
corporate events
100% utilization of the 20 day
minimum booking target for
corporate events
Approved
131% utilization of the 80 day
minimum booking target for not-
for-profit / multicultural events
131% utilization of the 80 day
minimum booking target for not-
for-profit / multicultural events
Approved
100% utilization of the 200 day
minimum booking target for not-
for-profit / multicultural events
100% utilization of the 200 day
minimum booking target for not-
for-profit / multicultural events
Approved100% utilization of the 11 day
minimum booking target for
corporate events
100% utilization of the 11 day
minimum booking target for
corporate events
George Weston Theatre Corporate Events (TCA)
The Studio Theatre Not-for-Profit / multi-
cultural Events (TCA)
George Weston Theatre Not-for-Profit / multi-
cultural Events (TCA)
Greenwin Theatre Corporate Events (TCA)
Greenwin Theatre Not-for-Profit Events (TCA) Approved
100% utilization of the 94 day
minimum booking target for not-
for-profit / multicultural events
100% utilization of the 94 day
minimum booking target for not-
for-profit / multicultural events
The percentage of days used as a
proportion of days available in the George
Weston Recital Hall has been gradually
increasing in 2014 and 2015 partly due to
reduced IATSE labour costs.
The Centre anticipates increased bookings
for 2016 and future years as the new
projection system is installed and allows the
Centre to pursue not-for-profit film
festivals.
In 2015, the departure of the Harold Green
Theatre Company to the Stage Tower
Theatre impacted the utilization rate.
The 2016 and future years utilization rate is
expected to recover based on historically
high demands for this versatile space.
2016 Operating Budget Civic Theatres Toronto
toronto.ca/budget2016 Page 19
Part III: Issues for Discussion

2016 Operating Budget Civic Theatres Toronto
toronto.ca/budget2016 Page 20
Issues for Discussion Issues Impacting the 2016 Budget
Write Off of Direct City Loans
On November 3, 2015, City Council adopted a report entitled Adjustments to Various Direct City Loans (EX9.10). The report can be found at the following link: (http://www.toronto.ca/legdocs/mmis/2015/ex/bgrd/backgroundfile-84484.pdf)
The write-off of the City loans made to the Sony Centre for the Performing Arts (Sony Centre) in the amount of $7.002 million and to the Toronto Centre for the Performing Arts (TCA) in the amount of $10.023 million as outlined in the table below was approved by City Council at its meeting on November 3, 2015.
City Council granted capital completion loan to the Sony Centre in the amount $6.65 million for completion of the redevelopment of the Centre which was expected to be repaid using a future facility fee surcharge levied on ticket sales and by future naming rights proceeds. Due to lower than expected ticket sales, all of the collected ticket surcharge revenue was going towards repaying the loan.
The former City of North York provided approximately $15 million in interim financing to the North York Performing Arts Centre Corporation (NYPACC) to help fund the approximately $45 million construction cost of the North York Performing Arts Centre (NYPAC). Prior to the loss of its major tenant in 1999, NYPACC had made payments that reduced the balance outstanding to $10,023,036 and subsequent to the departure of the major tenant in 1999, no further loan repayments have been made.
The write-off of the City loans will impact the Operating Budget for the Sony Centre as a portion of the ticket surcharge revenue that was previously used to pay off the loan will now be applied to cover minor capital work. The loan write-off will have no impact on the TCA's budgets, as no payments have been made since 1999.
Issues Impacting Future Years
Future of the Three Major Civic Centres
A Theatres Working Group was established in 2013 and engaged a consultant to examine options for operating and governance models for the City's three civic theatres – the St. Lawrence Centre for the Arts, the Sony Centre for the Performing Arts and the Toronto Centre for the Arts.
('000s)
Entity
Original Loan
Amount
Current Loan
Balance as at
August 31, 2015
Amount of Loan
Write-off
Sony Centre 6,650 7,002 7,002
TCA 15,000 10,023 10,023
Total 21,650 17,025 17,025
2016 Operating Budget Civic Theatres Toronto
toronto.ca/budget2016 Page 21
Following extensive work done by external consultants, and taking into consideration advice from the Theatres Working Group, City staff proposed a new direction for the future of the City's three civic theatres. Changes were proposed both to the operating model and the governance structure with the objective of enhancing the relevance of theatres to the communities they serve, increasing theatre usage and improving the financial viability of the theatres.
The staff report entitled Report on the Future of the Civic Theatres (EX7.15) was approved by Council on July 7, 2015 and recommended consolidating the operations of the St. Lawrence Centre, Sony Centre, and TCA into one new organization under the direction of a single Civic Theatres Toronto Board, and to commence the governance and operational transition process. The report can be found at the following link: (http://www.toronto.ca/legdocs/mmis/2015/ex/bgrd/backgroundfile-81752.pdf)
Immediate governance steps include establishing a new board and determining the executive leadership to champion the change process. 8 citizen members of the new Civic Theatres Toronto Board were appointed in December 2015 (with the remaining 2 members to be appointed in early 2016) and will move forward to develop a strategy to bring all three theatres into one organization.
The 2016 Operating Budget for the Civic Theatres Toronto is based on the current structure and includes additional one-time funding of $0.300 million for "Leadership Development" to continue with operational requirements of the transition, including supporting the work of the Special Advisor, a CEO search and initial engagement.
Changes to the future Operating Budget for the Theatres are anticipated as the work of the Civic Theatres Toronto Board proceeds in the coming year.

2016 Operating Budget Civic Theatres Toronto
toronto.ca/budget2016 Page 22
Appendices:
2016 Operating Budget Civic Theatres Toronto
toronto.ca/budget2016 Page 23
Appendix 1
2015 Service Performance
2015 Key Service Accomplishments
In 2015, Sony Centre for the Performing Arts accomplished the following:
Installed new stage lighting and sound equipment.
Restored Theatre's curb appeal with new driveway and planters.
Completed a Building Condition Assessment in September that identified $33.229 million in required capital repairs.
In 2015, St. Lawrence Centre for the Arts accomplished the following:
Hosted the Miss Universe Canada Pageant and Luminato presentations.
Three Panamania shows were hosted in the Bluma Appel Theatre.
Hosted five concerts presented by the Toronto Jazz Festival.
Negotiated a new four year collective bargaining agreement with IATSE Local 58.
In 2015, Toronto Centre for the Arts accomplished the following:
The Greenwin Theatre was completed in April, in time for the first scheduled show.
Centennial College and the TCA were successful in starting the Dance Program, the second of three new programs at the TCA, in addition to the Music Program that started in 2014.

2016 Operating Budget Civic Theatres Toronto
toronto.ca/budget2016 Page 24
Appendix 2
2016 Operating Budget by Expenditure Category
Program Summary by Expenditure Category
For additional information regarding the 2015 Q3 operating variances and year-end projections, please refer to the attached link for the report entitled "Operating Variance Report for the Nine-Month Period Ended September 30, 2015" approved by City Council at its meeting on December 9, 2015. (http://app.toronto.ca/tmmis/viewAgendaItemHistory.do?item=2015.EX10.27)
Impact of 2015 Operating Variance on the 2016 Operating Budget
The Sony Centre and the Toronto Centre for the Arts adjusted their 2016 Operating Budgets to reflect activity volume changes experienced in 2015.
St. Lawrence Centre for the Arts also aligned its budgeted recoveries for labour costs to be consistent with actual costs in prior years.
2015
2013 2014 2015 Projected 2016
Category of Expense Actual Actual Budget Actual * Budget 2017 2018($000's) $ $ $ $ $ $ % $ $
Salaries and Benefits 10,596.0 4,910.9 10,652.6 10,963.5 11,725.5 1,072.9 10.1% 11,774.4 11,824.3 Materials and Supplies 1,800.9 883.8 2,032.9 2,139.6 2,189.0 156.1 7.7% 2,212.1 2,235.4 Equipment 69.7 30.7 436.2 98.3 826.0 389.8 89.4% 326.1 326.1 Services & Rents 5,352.0 924.3 6,606.3 5,308.6 4,847.6 (1,758.7) (26.6%) 4,554.2 4,560.6 Contributions to Capital 952.2 1,462.3 1,074.4 122.2 12.8% 1,074.4 1,074.4 Contributions to Reserve/Res Funds 710.1 30.3 1,708.1 901.1 1,766.7 58.6 3.4% 1,766.7 1,766.7 Other Expenditures 948.8 96.3 935.5 730.8 735.1 (200.4) (21.4%) 735.5 736.5 Interdivisional Charges -
Total Gross Expenditures 19,477.5 6,876.3 23,323.8 21,604.2 23,164.3 (159.5) (0.7%) 22,443.3 22,524.0 Interdivisional Recoveries Provincial Subsidies Federal Subsidies Other Subsidies User Fees & Donations 11,474.5 3,350.5 12,827.7 11,714.2 12,182.2 (645.5) (5.0%) 12,245.2 12,309.5 Transfers from Capital Fund Contribution from Reserve/Reserve Funds 2,062.3 1,462.3 2,370.9 308.6 15.0% 1,870.9 1,870.9 Sundry Revenues 2,995.3 46.4 3,088.4 3,112.6 3,073.7 (14.7) (0.5%) 3,074.6 3,075.6
Total Revenues 14,469.8 3,396.9 17,978.4 16,289.1 17,626.8 (351.6) (2.0%) 17,190.7 17,256.0
Total Net Expenditures 5,007.7 3,479.4 5,345.4 5,315.1 5,537.5 192.1 3.6% 5,252.5 5,268.0
Approved Positions 165.6 89.1 163.1 100.0 171.9 8.8 5.4% * Based on the 2015 9-month Operating Variance Report
2016 Change from
2015 Approved
Budget
Plan

2016 Operating Budget Civic Theatres Toronto
toronto.ca/budget2016 Page 25
Appendix 3a
Sony Centre for the Performing Arts
2016 Organization Chart
2016 Complement
Category
Senior
Management Management
Exempt
Professional &
Clerical Union Total
Permanent 7.0 11.0 16.7 15.5 50.2
Temporary 1.0 29.1 30.1
Total 7.0 11.0 17.7 44.6 80.3

2016 Operating Budget Civic Theatres Toronto
toronto.ca/budget2016 Page 26
Appendix 3b
St. Lawrence Centre for the Arts
2016 Organization Chart
2016 Complement
Board of Directors
General Manager
Director of Finance
Professional Staff (5)
Box Office Manager(1)
System Manager (1)
Director of Sales & Marketing
Director of Production &
Communications
Professional Staf f (1)
Director of Guest & Client Services
FOH Managers (2)
CUPE Staf f (5.7)
Stage Hands Local 58 IATSE
(11.7)
Category
Senior
Management Management
Excempt
Professional &
Clerical Union Total
Full-Time 1.0 8.0 5.0 14.0
Part-Time 18.8 18.8
Total 1.0 8.0 5.0 18.8 32.8

2016 Operating Budget Civic Theatres Toronto
toronto.ca/budget2016 Page 27
Appendix 3c
Toronto Centre for the Arts
2016 Organization Chart
2016 Complement
General Manager
Director Production and Facility Services
Stage Hands Custodial
Production Managers (2)
Building Operators
Director Operations
Duty Managers Security
IT Services Outsourced
New Media Marketing
Coordinator
FOH Manager
Stage Door
UshersBartenders and Concession
Director Finance and
Administration
Bookings Coordinator
Office Coordinator / Booking Associate
Payroll and AP Clerk
TM and Inventory Data Entry
Payroll Manager / Data Entry
Coordinator
FOH Cash Supervisors
Box Office Manager
Box Office Coordinator and
SupervisorsBox Office Staff
Category
Senior
Management Management
Exempt
Professional &
Clerical Union Total
Permanent 1.0 12.0 13.0
Temporary 45.8 45.8
Total 1.0 12.0 45.8 58.8

2016 Operating Budget Civic Theatres Toronto
toronto.ca/budget2016 Page 28
Appendix 4
Summary of 2016 Service Changes

2016 Operating Budget Civic Theatres Toronto
toronto.ca/budget2016 Page 29
Appendix 6
Inflows/Outflows to/from Reserves & Reserve Funds
Program Specific Reserve /Reserve Funds
2016 2017 2018$ $ $ $
Projected Beginning Balance 146.4 146.4 146.4 146.4
Sony Centre Facility Fee Reserve Fund XR3030
Proposed Withdrawls (-) 1,505.5 1,505.5 1,505.5
Contributions (+) (1,505.5) (1,505.5) (1,505.5)
146.4 146.4 146.4 146.4
Other Program / Agency Net Withdrawals & Contributions
Balance at Year-End 146.4 146.4 146.4 146.4
* Based on 9-month 2015 Reserve Fund Variance Report
2016 2017 2018
$ $ $ $
Projected Beginning Balance 1.1 1.1 1.1 1.1
St. Lawrence Centre for the Arts Capital Reserve Fund XR1046
Proposed Withdrawls (-) (100.0) (100.0) (100.0)
Contributions (+) 100.0 100.0 100.0
1.1 1.1 1.1 1.1
Other Program / Agency Net Withdrawals & Contributions
Balance at Year-End 1.1 1.1 1.1 1.1
* Based on 9-month 2015 Reserve Fund Variance Report
2016 2017 2018
$ $ $ $
Projected Beginning Balance 2,062.5 2,062.5 1,212.5 862.5
North York Performing Arts Centre Capital Reserve
FundXR3007
Proposed Withdrawls (-) (900.0) (400.0) (400.0)
Contributions (+) 50.0 50.0 50.0
2,062.5 1,212.5 862.5 512.5
Other Program / Agency Net Withdrawals & Contributions
Balance at Year-End 2,062.5 1,212.5 862.5 512.5
* Based on 9-month 2015 Reserve Fund Variance Report
2016 2017 2018
$ $ $ $
Projected Beginning Balance 166.7 166.7 166.7 166.7
Sony Centre Stabilization Reserve XQ2031
Proposed Withdrawls (-) (15.4) (15.4) (15.4)
Contributions (+) 15.4 15.4 15.4
166.7 166.7 166.7 166.7
Other Program / Agency Net Withdrawals & Contributions
Balance at Year-End 166.7 166.7 166.7 166.7
* Based on 9-month 2015 Reserve Fund Variance Report
Reserve /
Reserve Fund
Number
Projected
Balance as of
Dec. 31, 2015 *
Withdrawals (-) / Contributions (+)
Reserve / Reserve Fund Name (In $000s)
Total Reserve / Reserve Fund Draws / Contributions
Reserve /
Reserve Fund
Number
Projected
Balance as of
Dec. 31, 2015 *
Withdrawals (-) / Contributions (+)
Reserve / Reserve Fund Name (In $000s)
Total Reserve / Reserve Fund Draws / Contributions
Reserve /
Reserve Fund
Number
Projected
Balance as of
Dec. 31, 2015 *
Withdrawals (-) / Contributions (+)
Reserve / Reserve Fund Name (In $000s)
Total Reserve / Reserve Fund Draws / Contributions
Reserve /
Reserve Fund
Number
Projected
Balance as of
Dec. 31, 2015 *
Withdrawals (-) / Contributions (+)
Reserve / Reserve Fund Name (In $000s)
Total Reserve / Reserve Fund Draws / Contributions
2016 Operating Budget Civic Theatres Toronto
toronto.ca/budget2016 Page 30
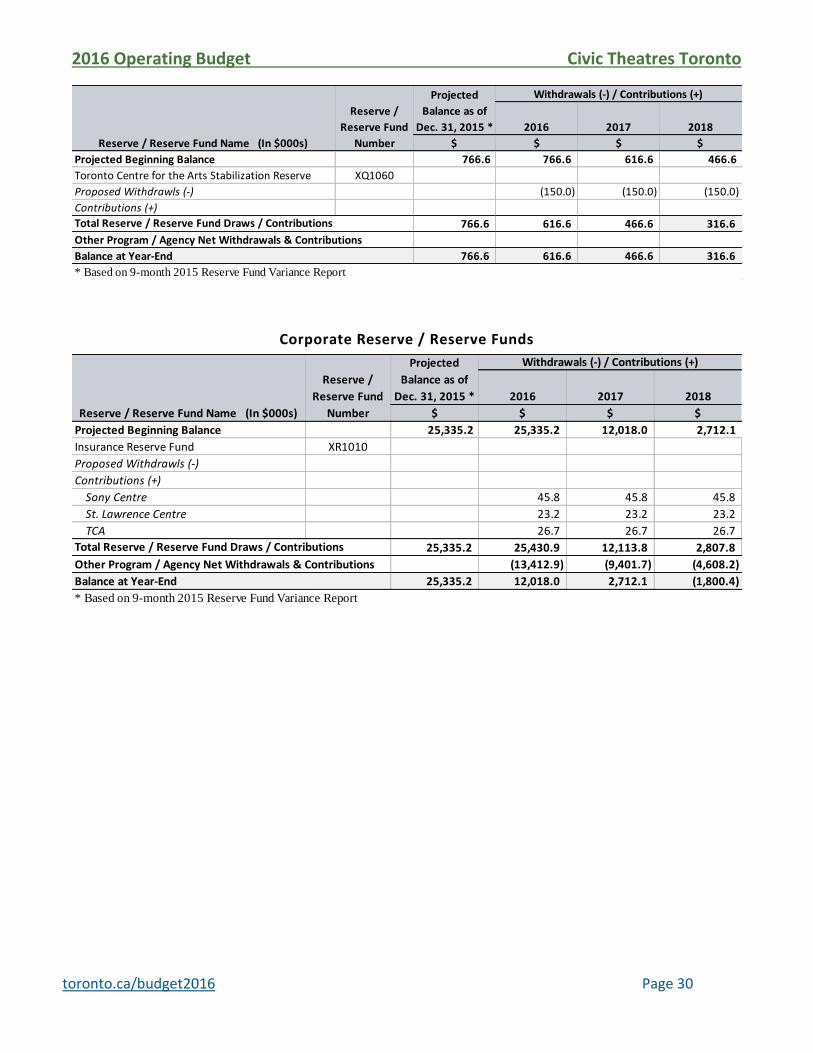
Corporate Reserve / Reserve Funds
2016 2017 2018
$ $ $ $
Projected Beginning Balance 766.6 766.6 616.6 466.6
Toronto Centre for the Arts Stabilization Reserve XQ1060
Proposed Withdrawls (-) (150.0) (150.0) (150.0)
Contributions (+)
766.6 616.6 466.6 316.6
Other Program / Agency Net Withdrawals & Contributions
Balance at Year-End 766.6 616.6 466.6 316.6
* Based on 9-month 2015 Reserve Fund Variance Report
Reserve /
Reserve Fund
Number
Projected
Balance as of
Dec. 31, 2015 *
Withdrawals (-) / Contributions (+)
Reserve / Reserve Fund Name (In $000s)
Total Reserve / Reserve Fund Draws / Contributions
2016 2017 2018
$ $ $ $
Projected Beginning Balance 25,335.2 25,335.2 12,018.0 2,712.1
Insurance Reserve Fund XR1010
Proposed Withdrawls (-)
Contributions (+)
Sony Centre 45.8 45.8 45.8
St. Lawrence Centre 23.2 23.2 23.2
TCA 26.7 26.7 26.7
25,335.2 25,430.9 12,113.8 2,807.8
Other Program / Agency Net Withdrawals & Contributions (13,412.9) (9,401.7) (4,608.2)
Balance at Year-End 25,335.2 12,018.0 2,712.1 (1,800.4)
* Based on 9-month 2015 Reserve Fund Variance Report
Total Reserve / Reserve Fund Draws / Contributions
Reserve /
Reserve Fund
Number
Projected
Balance as of
Dec. 31, 2015 *
Withdrawals (-) / Contributions (+)
Reserve / Reserve Fund Name (In $000s)


