Operating leases and the assessment of lease–debt ...directory.umm.ac.id/Data...
44
Operating leases and the assessment of lease–debt substitutability Vivien Beattie, Alan Goodacre * , Sarah Thomson Department of Accounting, Finance and Law, University of Stirling, Stirling FK9 4LA, Scotland, UK Received 22 December 1998; accepted 16 April 1999 Abstract Operating leases are estimated in the current paper to be approximately thirteen times larger than finance leases, on average. In recognition of this, the paper investigates the degree of substitutability between leasing and non-lease debt using a comprehensive measure of leasing, improving on the partial measures used in prior research. Operating lease liabilities are estimated using the Ôconstructive capitalisationÕ approach suggested by Imho, Lipe and Wright (1991, Accounting Horizons 5, pp. 51–63), modified to incorporate company-specific and UK-relevant assumptions. The results imply that leasing and debt are partial substitutes, with £1 of leasing displacing approximately £0.23 of non-lease debt, on average, consistent with the argument that lessors bear some risks which are not inherent in debt contracts. These findings suggest that substitution eects are not uniform across lease types. Ó 2000 Elsevier Science B.V. All rights re- served. JEL classification: G32 Keywords: Operating leases; Capital structure; Lease–debt substitutability Journal of Banking & Finance 24 (2000) 427–470 www.elsevier.com/locate/econbase * Corresponding author. Tel.: +44-1786-467291; fax: +44-1786-467308. E-mail address: [email protected] (A. Goodacre). 0378-4266/00/$ - see front matter Ó 2000 Elsevier Science B.V. All rights reserved. PII: S 0 3 7 8 - 4 2 6 6 ( 9 9 ) 0 0 0 4 5 - X
Transcript of Operating leases and the assessment of lease–debt ...directory.umm.ac.id/Data...

Operating leases and the assessment of
lease±debt substitutability
Vivien Beattie, Alan Goodacre *, Sarah Thomson
Department of Accounting, Finance and Law, University of Stirling, Stirling FK9 4LA, Scotland, UK
Received 22 December 1998; accepted 16 April 1999
Abstract
Operating leases are estimated in the current paper to be approximately thirteen
times larger than ®nance leases, on average. In recognition of this, the paper investigates
the degree of substitutability between leasing and non-lease debt using a comprehensive
measure of leasing, improving on the partial measures used in prior research. Operating
lease liabilities are estimated using the Ôconstructive capitalisationÕ approach suggested
by Imho�, Lipe and Wright (1991, Accounting Horizons 5, pp. 51±63), modi®ed to
incorporate company-speci®c and UK-relevant assumptions. The results imply that
leasing and debt are partial substitutes, with £1 of leasing displacing approximately
£0.23 of non-lease debt, on average, consistent with the argument that lessors bear some
risks which are not inherent in debt contracts. These ®ndings suggest that substitution
e�ects are not uniform across lease types. Ó 2000 Elsevier Science B.V. All rights re-
served.
JEL classi®cation: G32
Keywords: Operating leases; Capital structure; Lease±debt substitutability
Journal of Banking & Finance 24 (2000) 427±470
www.elsevier.com/locate/econbase
* Corresponding author. Tel.: +44-1786-467291; fax: +44-1786-467308.
E-mail address: [email protected] (A. Goodacre).
0378-4266/00/$ - see front matter Ó 2000 Elsevier Science B.V. All rights reserved.
PII: S 0 3 7 8 - 4 2 6 6 ( 9 9 ) 0 0 0 4 5 - X

1. Introduction
In recent years, signi®cant progress has been made in understanding thedeterminants of corporate capital structure with an increased emphasis on®nancial contracting theory (see, for example, Smith and Wakeman, 1985;Barclay and Smith, 1995; Sharpe and Nguyen, 1995; Mehran et al., 1997;Graham et al., 1998 and, for an international view, Rajan and Zingales,1995). This theory suggests that ®rm characteristics such as business risk andinvestment opportunity set a�ect contracting costs. In turn, these costs im-pact on the choice between alternative forms of ®nance such as debt andequity and between di�erent classes of ®xed-claim ®nance such as debt andleasing.
However, our understanding of the relationship between leasing and debtis far from complete and the degree of substitutability (or, indeed, comple-mentarity) between the two remains unresolved. Finance theory generallypredicts that leasing and debt are substitutes, to a greater or lesser extent. YetAng and Peterson (1984), in their seminal empirical study using ®nancialstatement data, failed to con®rm this prediction, instead ®nding a comple-mentary relationship. They referred to this result as the Ôleasing puzzleÕ. Al-though subsequent analytical work by Lewis and Schallheim (1992)demonstrated the theoretical possibility of complementarity, more recentempirical papers have supported substitutability (Marston and Harris, 1988;Adedeji and Stapleton, 1996) although the evidence in Mehran et al. (1997) ismixed.
A major obstacle to resolving this issue is the di�culty in measuring leaseliabilities from sources which are publicly available. This arises becausecompanies are currently required to include only ®nance (capital) leases ontheir balance sheets and not assets that have been ®nanced by operatingleases. Thus, explanatory models of the lease ratio su�er from major mea-surement error of the dependent variable. None of the previous studies hasfully considered the issue of how to incorporate operating leases in theirmeasure of leasing. Marston and Harris (1988) had to use a fairly crude as-sumption, while Sharpe and Nguyen (1995) and Mehran et al. (1997) used anapproximation based on the ratio of lease payments to an estimate of totalcapital costs in a given year. Other studies, including Ang and Peterson (1984)and Adedeji and Stapleton (1996) are partial analyses incorporating only®nance leases.
In the UK, the lease accounting standard, SSAP 21 (ASC, 1984), intro-duced the distinction between operating and ®nance leases. Since the stan-dard came into operation, company management have tended to switch thecontractual nature of their leases towards operating leases. Recent UK re-search (Beattie et al., 1998) has identi®ed that operating leases are now amajor source of long-term debt-type ®nancing and are considerably more
428 V. Beattie et al. / Journal of Banking & Finance 24 (2000) 427±470
important than ®nance leases; similar results have emerged from the US(Marston and Harris, 1988; Imho� et al., 1991; Graham et al., 1998). Thus, asubstantial contribution can be made to the lease±debt substitutability liter-ature by using a comprehensive measure of leasing which includes operatinglease ®nance.
The aim of the present study is to investigate the degree of substitutabilitybetween lease and non-lease debt ®nancing using comprehensive measures ofleasing and debt. 1 The primary focus is to explain the observed lease ratio fora cross-section of ®rms, following the methods of Ang and Peterson (1984), asamended by Adedeji and Stapleton (1996). Given the limited information onoperating lease liabilities disclosed in published ®nancial statements, we usean estimate of total operating lease liabilities based on the method of Ôcon-structive capitalisationÕ suggested by Imho� et al. (1991). This basic approachhas been modi®ed to incorporate company-speci®c and UK relevant as-sumptions using the procedures developed by Beattie et al. (1998).
The remainder of this paper is structured as follows. Section 2 provides abrief discussion of capital structure theories and the determinants of ®xed-claim ®nancing, to support the variables selected to model the lease±debtrelationship. Section 3 reviews the literature on lease±debt substitutabilityand presents the models tested in the present study. Methods, including adescription of the approach used to capitalise operating leases, are outlinedin Section 4. Results, based on both the partial and comprehensive leaseratios, are presented and compared in Section 5. Section 6 summarises andconcludes.
1 A basic premise of the paper is that operating leases can be, indeed should be, pooled with
®nance (capital) leases. This can be justi®ed on three grounds. First, lease contract terms lie on a
ÔcontinuumÕ. At one extreme is the contract in which it is clear that the lessor is essentially providing
®nance for the purchase of an asset by the lessee. At the other, the nature of the contract is that the
lessee is paying a rental for the use of the asset, usually over a short period with no commitment
other than the rental payment. However, the vast majority of contracts lie in the middle of the
continuum and do not ®t neatly into either category. The distinction between the two lease types
often does not relate to a fundamental di�erence in their characteristics. Rather, it relates to a desire
to meet the essentially ÔarbitraryÕ accounting classi®cation criteria in order to keep leased assets and
liabilities o� the balance sheet. Second, there is convincing empirical evidence that all leases are
viewed similarly by the market as giving rise to assets and liabilities, with Ely (1995) ®nding that her
results Ôsupport the treatment of operating leases as property rightsÕ. Third, the potentially
distinguishing feature of ÔcancellabilityÕ of operating leases is deceptive. The disclosure in published
®nancial statements is of non-cancellable operating leases; further, even cancellable leases often
carry a punitive termination penalty. We are grateful to an anonymous referee for suggesting the
inclusion of this justi®cation.
V. Beattie et al. / Journal of Banking & Finance 24 (2000) 427±470 429

2. Fixed-claim ®nancing
2.1. Capital structure theories
The traditional Static Trade-O� Theory can be characterised by the as-sumption that capital structure is optimised year by year with managementweighing up the relative advantage of the tax-shield bene®ts of debt against theincreased likelihood of incurring debt-related bankruptcy costs. However, inreality, managers do not appear to determine capital structure in this way butrather as part of a dynamic process. Consequently, at any particular time, a®rm may deviate from its optimal or target debt ratio.
Early recognition of this dynamic process was demonstrated by Donaldson(1961), in what he described as the Pecking-Order Theory of ®nancial choices.He observed that managers preferred to fund investment initially from retainedpro®ts rather than use outside funds. This preference led ®rms to adopt divi-dend policies that re¯ected their anticipated need for investment funds, policieswhich managers were reluctant to substantially change. If retained pro®ts ex-ceeded investment needs then debt would be repaid. If external ®nance wasrequired ®rms tended ®rst to issue the safest security, debt, and only issuedequity as a last resort.
Several possible theoretical explanations for this observed behaviour havebeen proposed. First, taxes and transaction costs favour the use of retainedearnings and favour debt over the issuing of new equity. Second, Myers andMajluf (1984) argue that, under asymmetric information, equity issues arerationally interpreted as Ôbad newsÕ on average, since managers are reluctantto issue stock when they believe the shares are undervalued. Empirical evi-dence con®rms that announcements of new issues are associated with declinesin stock price, which at least partly explains the relatively small number ofnew equity issues. This asymmetric information argument also extends to theuse of dividends as a signalling mechanism. Consequently, managers areaverse to reducing dividends, thereby limiting access to retained earningswhich, in certain periods, leads to the use of external funds to ®nance in-vestment.
The Stakeholder Theory suggests that the way in which a ®rm and its non-®nancial stakeholders (i.e., customers, suppliers, employees and the commu-nity at large) interact is an important additional determinant of the ®rmÕsoptimal capital structure (Grinblatt and Titman, 1998, ch. 16). This theoryargues that the indirect costs of ®nancial distress are higher for certain typesof ®rm than for others. They are especially costly for ®rms characterised byproducts whose quality is important yet unobservable, or by products thatrequire future servicing, or by stakeholders who require specialised capital ortraining. Such ®rms should have relatively less debt in their capital structure.On the other hand, ®nancial distress should be less costly for ®rms that sell
430 V. Beattie et al. / Journal of Banking & Finance 24 (2000) 427±470

non-durable goods and services, that are relatively less specialised and whosequality can easily be assessed. It is expected that these ®rms will have rela-tively higher debt levels. This theory helps to explain why some ®rms choosenot to borrow even when lenders are willing to provide ®nance on attractiveterms.
Modelling the lease±debt relationship ®rst requires some understanding ofthe determinants of ®xed-claim ®nancing. The above theoretical argumentslead to predictions about the factors that determine the level of ®xed-claim®nancing within a ®rm; discussion of these predictions and the empiricalsupport for them is presented below.
2.2. Determinants of ®xed-claim ®nancing
2.2.1. Pro®tThe static theory suggests that debt ratios ought to be positively correlated
with pro®tability. More pro®table ®rms have more income to shelter, are morelikely to have high marginal tax rates and are less susceptible to bankruptcy.However, this result has not been observed empirically (e.g. Titman andWessels, 1988), in fact, those ®rms with the highest taxable earnings tend tohave the lowest debt ratios. This is consistent with the pecking-order theoryand the observed relative infrequency of new equity issues.
2.2.2. Asset structureAgency arguments suggest that shareholders of leveraged ®rms have an
incentive to invest sub-optimally to expropriate wealth from the providers ofdebt. Further, the asymmetric information model implies that issuing debt in asituation where a ®rmÕs managers have better information than the debt pro-vider may increase the cost of such debt. Issuing debt secured on property withknown values avoids such costs and also reduces the underinvestment problem.Thus, ®rms with assets that can be used as collateral are likely to issue moredebt.
2.2.3. Investment opportunity setTitman and Wessels (1988) note that growth opportunities are capital assets
that increase ®rm value, but these are not re¯ected in the book value of assetsor in current pro®ts. Thus, the assets cannot be used as collateral for debt anddo not increase the pro®t available to absorb tax-shielding interest. Both ar-guments suggest a negative relationship between growth opportunities anddebt levels. Further, the costs associated with underinvestment, as a result ofthe agency relationship referred to in the previous section, are likely to behigher for ®rms in growing industries as there is greater ¯exibility in futureinvestment choice. This also implies that debt levels will be negatively corre-lated with expected future growth. However, Myers (1977) notes that this
V. Beattie et al. / Journal of Banking & Finance 24 (2000) 427±470 431
agency problem is reduced if the ®rm issues short-term rather than long-termdebt. Overall, these arguments suggest that long-term debt will be negativelyrelated to growth rates but that short-term debt will be positively related togrowth rates. The net e�ect on total debt will depend on the relative use oflong- and short-term debt by growing ®rms.
2.2.4. SizeA number of authors have suggested that debt ratios may be related to ®rm
size. Large ®rms tend to be relatively more diversi®ed and, therefore, less liableto su�er ®nancial distress. Also, the costs of issuing new long-term debt andequity securities tend to include a large ®xed element which militates againstsmall ®rms using such ®nance. Both arguments suggest that long-term debtratios should be positively related to ®rm size. In contrast, small ®rms tend toborrow short-term (through bank loans) because of the lower associated costs(see Marsh, 1982).
2.3. Determinants of leasing
Much of the above discussion relating to debt ®nance relates equally toleasing. However, the collateralised nature of leasing leads to four di�erencesthat a�ect managersÕ ®nancing choice. First, the characteristics of a ®rmÕscurrent and future assets, and in particular asset speci®city, can in¯uence ®-nancing. Stulz and Johnson (1985) show that high-priority claims, such asleasing, can mitigate the underinvestment problem relative to other forms ofdebt, because the senior claims on the new project assets limit the transfer ofwealth from shareholders to existing debt-providers. Following this line, Bar-clay and Smith (1995) argue that, for a given amount of ®xed-claim ®nancing,®rms with more growth opportunities might be expected to rely more heavilyon lease ®nancing than on lower priority forms of debt. Smith and Wakeman(1985) suggest that ®rms are more likely to buy, than lease, assets which arehighly speci®c to the ®rm. This results from con¯icts and agency costs betweenlessor and lessee which arise in the bilateral monopoly that is created when thelease is negotiated. Consequently, they suggest that ®rms are more likely tolease general facilities (such as o�ces) than ®rm-speci®c production or researchfacilities. Similarly, Williamson (1988) argues that assets which are more easilyredeployable, such as aircraft or trucks, are better suited for leasing and for useas collateral in debt contracts. In combination, these arguments suggest that,for a given level of ®xed-claim ®nancing, ®rms that have a high proportion ofgrowth opportunities, and/or whose assets are not ®rm-speci®c, are likely toemploy more leasing.
Second, ®rm size may have a di�erential in¯uence on leasing relative toother forms of debt-type ®nance. Grinblatt and Titman (1998) argue that thedebt holder±equity holder con¯ict may be worse for small ®rms. Smaller ®rms
432 V. Beattie et al. / Journal of Banking & Finance 24 (2000) 427±470

may be more ¯exible and thus better able to increase the risk of their invest-ment projects. The potentially higher return from accepting this risk accrues toshareholders only, while the increased risk is shared by debt-providers; this willreduce the willingness of lenders to provide debt ®nance. Moreover, topmanagers of small ®rms are more likely to be major shareholders and may,therefore, prefer the lower personal risk associated with low debt levels. Thesearguments reinforce the view that small ®rms will have lower debt ratios.However, they also suggest small companies may favour leasing over debt, ascreditors obtain more security and a manager with a large ownership interestmay prefer leasing to reduce personal exposure to obsolescence or other asset-speci®c risks.
Third, tax considerations may be important in the choice between debt andleasing. Leasing provides the option of ÔsellingÕ tax allowances to a lessor, inexchange for lower rental payments. Most empirical work has failed to provideevidence consistent with theory, until the recent study by Graham et al. (1998).The authors suggest that this failure re¯ects the fact that corporate tax status isendogenous to ®nancing decisions. Using a forward-looking estimate of before-®nancing corporate marginal tax rates, they document a negative relation be-tween operating leases and tax rates, and a positive relation between debt levelsand tax rates. They argue that their results provide unambiguous evidencesupporting the hypothesis that low tax rate ®rms lease more and have lowerdebt levels, than high tax rate ®rms.
Finally, poor liquidity and cash ¯ow problems have been found to be animportant in¯uence in the decision to lease (Drury and Braund 1990; Ad-edeji and Stapleton, 1996), the collateral of the asset increases the avail-ability of lease ®nance in situations where unsecured debt would be toorisky.
3. Lease±debt substitutability
3.1. Theories
Prevailing ®nance theory generally suggests that leases and non-lease debtare substitutes. Thus, an increase in one should lead to a compensating decreasein the other. There are three variants of this theory, which imply di�erentmagnitudes for the substitution coe�cient. Traditional ®nance theory treatscash ¯ows from lease obligations as equivalent to debt cash ¯ows, thus thetrade-o� between debt and leases is one-to-one. Some theorists argue thatdi�erences between the nature and terms of lease and debt contracts lead to alease using less debt capacity than an equivalent amount of non-lease debt (i.e.,the substitution coe�cient is less than 1). Finally, others argue that since leasedassets may be ®rm-speci®c, the risk of moral hazard may be great, resulting in a
V. Beattie et al. / Journal of Banking & Finance 24 (2000) 427±470 433
substitution coe�cient of more than one (see Ang and Peterson (1984) andreferences therein).
In contrast to this accepted wisdom, Lewis and Schallheim (1992) demon-strate analytically that debt and leasing can be complements. They argue thatleasing is a mechanism for selling excess tax deductions that can motivate lessee®rms to increase the proportion of debt in their capital structure. They alsoshow that lessee ®rms can derive a bene®t from leasing even with an as-sumption that the marginal tax rate is the same for lessor and lessee. Thiscontrasts with most existing models where the only situation in which leasingprovides an advantage is when the marginal tax rates di�er.
The following equation captures these opposing views and their variants:
DRNL � DRL � a LRL; �1�where DR is the debt ratio, LR is the lease ratio, NL is a company which doesnot lease, L is a company which does lease, and a is the lease±debt substitutioncoe�cient.
The above substitution arguments correspond to a values of exactly 1, of0 < a < 1 and of a > 1, respectively; all three share the view that leases are ex-pected to reduce debt capacity (i.e., a > 0). Complementarity between leasesand debt corresponds to a negative a.
3.2. Empirical evidence
There are three possible approaches to investigating the relationship be-tween leasing and debt: ®rst, by using historical ®nancial statement data,second, by invoking an experimental design with ®rm managers or ®nance-providers as subjects 2 and third, by directly obtaining the views of managersand providers using a survey method. 3 The focus of the current paper isstudies adopting the ®rst of these approaches. In this, it must be assumed eitherthat ®rms are operating at (or near) their optimal capital structure, on average,or that the model must somehow accommodate deviations from the optimalstructure. The approach must also include adequate control for the di�erences
2 For example, an experimental approach was used by Wilkins and Zimmer (1983a,b) and
Wilkins (1984) to explore the e�ect of alternative accounting methods for leases (capitalisation
versus footnote-only disclosure) using Singapore-based bank loan o�cers and investment analysts
as subjects. They found that the decisions of loan o�cers were a�ected by levels of leverage but not
by either the method of accounting for ®nancial leases or whether the ®nancing was by loan or
lease, implying that debt and leases were viewed as substitutes.3 For example, survey evidence concerning UK company managersÕ perceptions of leasing
(Drury and Braund, 1990) found that the majority of ®rms considered that leasing reduces
borrowing capacity by a smaller amount than an equivalent loan (implying a substitution
coe�cient, a < 1).
434 V. Beattie et al. / Journal of Banking & Finance 24 (2000) 427±470

in debt capacity across ®rms. Otherwise, observed lease ratios and debt ratioswill re¯ect di�erences in debt capacity, or usage of debt capacity, as well asdebt displacement.
Ang and Peterson (1984) (AP) adopted the ®rst approach and used Tobitanalysis on ®nancial statement data drawn from 600 US ®rms between 1976±81.They concluded that, contrary to much accepted theory, leases and debt arecomplements rather than substitutes; lessee ®rms used more long-term debtthan did non-leasing ®rms (i.e., a < 0). They attempted to control for di�erencesin debt capacity by including six additional ®nancial variables in the regressionmodel, operating leverage, sales variability, pro®tability, expected growth, sizeand liquidity. Only operating leverage and pro®tability were found to be sig-ni®cant negative explanatory factors for the level of leasing. This latter result isconsistent with Kare and HerbstÕs (1990) survey evidence that more pro®table®rms, having easier access to low cost debt, prefer debt to leasing. The tax ratesof leasing ®rms were found by AP to be consistently higher than non-leasing®rms, suggesting that tax asymmetries between lessors and lessees are not asigni®cant cause of leasing activity. Smith and Wakeman (1985) suggested thefollowing partial explanation for APÕs ÔcomplementsÕ result: Ôalthough leasesand debt are substitutes for a given ®rm, looking across ®rms, characteristics. . . which provide high debt capacity also tend to provide more pro®tableleasing opportunitiesÕ (p. 907).
Bayless and Diltz (1986) criticised the AP method on the grounds of itsfundamental assumptions, in particular, of the di�culty in satisfactorily con-trolling for cross-sectional di�erences in debt capacity. Instead, they adoptedthe second approach and used an experimental design to control for variationin ®rmsÕ debt capacity, ®nding that lending o�cers reduced their willingness tolend when a ®rm took on lease obligations. Consequently, they estimated avery close substitutability between debt and leasing with capital lease obliga-tions displacing between 10% and 26% more debt capacity than debt ®nance(i.e., a > 1). Whilst the experimental approach avoids the problem of control-ling for debt capacity, it has its own limitations. In particular, achieving reli-able subject response in the arti®cial experimental situation is di�cult andgeneralisation to other groups not speci®cally included as experimental subjectsis hazardous.
Marston and Harris (1988) tried to reconcile these two studiesÕ con¯ictingresults using ®nancial statement data. They used an OLS regression approachbased on changes (rather than levels) of lease and debt ®nance and also usedcomprehensive measures of leasing (capitalised plus non-capitalised) and debt(short-term and long-term). The changes were measured relative to a policy ofmaintaining a constant proportion of assets ®nanced by leasing and by debt,with the proportion measured as the average over a pre-study 3-year period.Their model also allowed for changes in debt levels independent of any leasechanges. The results were consistent with the ®ndings of AP (1984), viz. the use
V. Beattie et al. / Journal of Banking & Finance 24 (2000) 427±470 435
of leasing tends to be associated with the use of non-lease debt. However, theyalso found support for Smith and WakemanÕs observation that certain ®rmcharacteristics simultaneously provide for use of both leasing and non-leasedebt. In combination, these ®ndings suggest strongly that APÕs results re¯ectdi�erences in debt capacity rather than complementarity. Importantly, theestimated coe�cient of substitution between leasing and non-lease debt wassigni®cantly positive, demonstrating that, at the margin, use of lease ®nancingsubstitutes for other forms of both short-term and long-term debt. On average,®rms reduced non-lease debt when leasing increased but did so on less than adollar-for-dollar basis, with $1 of leases substituting for about $0.6 of non-lease debt (i.e., 0 < a < 1). This may be value creating if ®rms are able to expandtheir debt capacity or it may re¯ect a di�erence in the risk characteristics of thetwo instruments. They also estimated that non-capitalised leases accounted forabout 65% of total leasing in 1982 (i.e., post-SFAS 13), thus arguing that it isimportant for empirical studies to use a comprehensive measure of leases.
Adedeji and Stapleton (1996) (A&S) replicate the AP (1984) study in theUK. They de®ne lease and debt ratios with total assets as the denominatorrather than the book value of equity used by AP, since the latter introduces abias in favour of a positive relationship between lease and debt ratios. Thecontrol variables used were price earnings ratio, liquidity, size and tax rate.These di�er from those used by AP in that operating leverage, sales variabilityand pro®tability were omitted but tax rate was included. Operating leases wereexcluded from the lease ratio measure due to data unavailability. In the light ofevidence regarding the importance of operating leases in corporate ®nancingfrom both the UK (Beattie et al., 1998) and the US (Marston and Harris, 1988;Graham et al., 1998), this omission is a serious limitation.
To serve as a benchmark, A&S replicate the AP study using a Tobit re-gression of the full sample in which 44% of companies had no ®nance leases.Consistent with AP, they ®nd that the lease ratio had a generally positive, butinsigni®cant, relationship with the debt ratio, which implies a complementaryrelationship. The only signi®cant control variable was liquidity (a negativerelationship, as predicted). A&S investigate whether the positive relationshipbetween lease and debt ratios is attributable to poor control for the di�erencesbetween the debt capacities of leasing and non-leasing ®rms, by re-estimatingthe regression model on the sub-sample of ®rms which undertook leasing. TheOLS method is used as the dependent variable is no longer truncated.
In contrast with the Tobit results, OLS regression showed the lease ratio tobe signi®cantly negatively related to the debt ratio in each of the 3 years of thestudy. A&S concluded that debt and ®nance leases are indeed substitutes with,on average, £1 of ®nance lease displacing approximately £0.55 of debt over theperiod studied. In addition, the lease ratio was signi®cantly negatively relatedto liquidity and tax rate for each of the 3 years and to the price earnings ratiofor two out of 3 years.
436 V. Beattie et al. / Journal of Banking & Finance 24 (2000) 427±470

A&SÕs results appear to support suggestions that liquidity has a negativee�ect on leasing (Hull and Hubbard, 1980; Drury and Braund, 1990) and thatexpected growth (measured by A&S as the price earnings ratio) is a negativedebt determinant (Myers, 1977). A&S did not ®nd size to be a signi®cant ex-planatory variable, in contrast with previous studies of UK debt ®nancing(Marsh, 1982). Arguments presented earlier suggest that a negative relationshipbetween size and debt is expected but that leasing may be attractive to small®rms, implying a positive relationship between size and leasing. Thus, the lackof signi®cance for the size variable may be attributable to o�setting in¯uences.Alternatively, it may be due to the particular size proxy used; Sharpe andNguyen (1995) argue that total assets could be inappropriate, due to its lack ofindependence from the leasing choice.
A further aspect of the lease decision examined by A&S was industry in-¯uence. Several studies on the use of debt have concluded that industry clas-si®cation has a signi®cant in¯uence (see, for example, Scott, 1972; Remmers etal., 1975; Ferri and Jones, 1979; Bradley et al., 1984). To investigate whetherthis in¯uence extended to the use of leasing, A&S modi®ed their model toinclude industry dummy variables. However, these variables were found to begenerally insigni®cant.
The impact of a ®rmÕs ownership structure on the decision to lease assets hasrecently been examined using historical ®nancial statement data by Mehran etal. (1997). Consistent with theoretical arguments, they ®nd that Chief Execu-tive O�cer share ownership is positively related to leasing activity. Their re-sults also provide mixed evidence on the relationship between debt and leasing,with OLS estimates suggesting a complementary relationship between debt andcapitalised leases but a logit analysis suggesting that the two forms of ®nancingare substitutes. They found no evidence of an interaction between debt andoperating leases.
In summary, there is considerable diversity of evidence regarding lease±debtsubstitutability. This may result from the use of small samples, failure toproperly account for di�erences in ®rmsÕ debt capacity and/or failure to use acomprehensive measure of leasing (i.e., one which includes operating leases).
4. Methods
4.1. Lease±debt substitutability models
The estimation model to determine lease-debt substitutability is derivedfrom the de®nition of the debt-to-lease displacement ratio a (Eq. (1) above).Assuming that the debt ratio of a non-leasing ®rm (DRNL) is a function of anumber of control variables which re¯ect the characteristics that determine a®rmÕs debt ratio, then Eq. (1) can be rewritten as
V. Beattie et al. / Journal of Banking & Finance 24 (2000) 427±470 437

C �Control variables� � DRL � a LRL: �2�Rearranging the above, it follows that the lease ratio of a ®rm is
LRL � ÿ1=a DRL � 1=a C �Control variables� �3�with the resulting equation to be estimated:
LR � b0 � b1�DR� � bi�1 �Control variablei�: �4�If lease and debt ®nance are substitutes, irrespective of the degree, a willbe greater than zero and consequently b
1, the debt ratio coe�cient, will be
negative. 4
Throughout this study, Eq. (4) was estimated in two ways. Tobit regressionwas applied to the full sample to accommodate the truncated dependentvariable and OLS regression was applied to the restricted sub-sample ofcompanies with positive leasing.
4.2. Variable measurement
The experimental variables under consideration are measures of leasing andnon-leasing debt.
Leasing. Two ratios were used. The ®rst, which we call the partial lease ratio(LRP), represents long-term ®nance (capital) leases as a proportion of totalassets. The second, which we call the comprehensive lease ratio (LRC), is theratio of total long-term leases, including the estimated long-term operatinglease liability, to total assets.
Debt. The debt ratio was measured as the ratio of (the book value of) long-term and short-term debt, net of ®nance leases, to total assets.
To control for di�erences in debt capacity and its usage across ®rms, severalexplanatory variables which are likely to in¯uence the debt ratio of a non-leasing ®rm are chosen, consistent with the arguments presented earlier.
Pro®tability. Firms with higher pro®tability will generally be able to makegreater use of the tax-shielding e�ect of debt and will also have a lower risk ofbankruptcy, so would be expected to have higher debt levels. The measure ofpro®tability adopted here was return on capital employed (PROF).
4 The value of b1, however, is a measure of the lease-to-debt displacement ratio rather than the
debt-to-lease displacement ratio, a. Alpha cannot be determined by simply taking the inverse of b1
due to the presence of the constant and other independent variables in the regression model.
However, should a substitutability relationship arise, A&S proposed that a can easily be
determined by swapping the lease ratio and debt ratio in the above equation to treat the debt ratio
as the dependent variable.
438 V. Beattie et al. / Journal of Banking & Finance 24 (2000) 427±470
Asset structure. Firms with assets that can be used as security may be likelyto issue more debt. A simple proxy for the relative collateral value in a ®rmÕsassets structure is the proportion of ®xed assets to total assets (FAPROP).
Growth opportunities. Two proxies for potential growth opportunities wereadopted. The ®rst was a historical measures of the average percentage change,over the past 4 years, in total assets (TAGROW). 5 The second indicator ofgrowth was the price earnings ratio (PE). The advantage of this measure is thatit represents the stock marketÕs forward looking assessment of growth pros-pects. However, it is determined in part by the ®rmÕs leverage and is thereforesubject to some bias due to reverse causality (Titman and Wessels, 1988).
Size. Consistent with many previous studies, size was measured as thenatural log of total assets (LNSZ). An alternative speci®cation which allowsfor non-linearities was also adopted by including both size (SZ), measured astotal assets, and its square (SZSQ) in the model.
Industry classi®cation. In our model, a dummy variable for the industrialclassi®cation of the ®rm was adopted as a proxy for the nature of the ®rmÕsassets and its stakeholder relationships. Industries were split between thosewhere the number of sample constituents might be su�ciently large to captureany speci®c industry e�ects, and the rest. Five industries contain, on average,14 or more companies and were classed as large. Firms within these ®ve in-dustry groups were identi®ed with separate dummies (building, retail, engi-neering, electrical and leisure), taking the value of 1 if the ®rm is within thesector and zero otherwise. The remaining Ôcontrol groupÕ ®rms were accom-modated within the intercept term. Thus, the industry dummy coe�cientshould be viewed as an impact relative to the average control group ®rm. Thenon-speci®c nature of assets employed in retailing and leisure (e.g., shop space)suggests that these industries will use more leasing (positive coe�cients). Bycontrast, the likely ®rm-speci®c assets in the engineering and electrical indus-tries imply negative coe�cients; assets in the building sector are more variedand the expected sign is uncertain.
Tax. The tax-paying status of the ®rm was proxied by calculating the ef-fective tax rate, measured as the current year reported tax charge divided bypro®t before tax (TR). 6
Liquidity. This variable (LQ) was measured as the ®rmÕs current ratio (i.e.,current assets/current liabilities).
5 Another historical proxy was used. This measured the average percentage change, over the past
four years, in total sales (SALEGROW). There was a strong positive association (correlation
coe�cient of 0.75) between this and the TAGROW variable so to reduce potential multicollinearity
problems only TAGROW was included in the modelling stage.6 A second tax rate variable (TRAVE), the average of the TR measure over the last three years,
was also investigated. Results for the separate models incorporating TR and TRAVE were almost
identical so only results using TR are presented.
V. Beattie et al. / Journal of Banking & Finance 24 (2000) 427±470 439
When the comprehensive lease ratio (LRC) was used as the dependent vari-able, the explanatory variables were adjusted for the e�ect of operating leasecapitalisation. 7
4.3. Sample selection
A randomly selected sample of 300 listed industrial and commercial com-panies was originally selected for analysis and steps were taken to minimisesurvivorship bias. 8 Financial companies were excluded as our analysis of theExtel Company Analysis database showed this sector to employ minimalleasing. This original sample of 300 companies comprised 53 ÔdeadÕ companies,122 ÔnewÕ companies, and 125 companies which had existed from 1981 to 1994.Over the 1990±94 period of our study this gave between 217 (1990) and 232(1994) companies in existence in each particular year. The data requirements ofthe models, especially for variables such as growth proxies measured overseveral years, reduced the sample size for the models presented here. 9
Panel A of Table 1 gives details of the sample composition over the studyperiod, while Panel B provides an analysis of sample companies by industry for
7 Two variables were not adjusted, namely FAPROP and TAGROW. Adjustment to FAPROP
requires the addition of the total operating lease asset to the ®xed assets numerator of the variable
and also to the total assets denominator. The lease ratio dependent variable (LRP) requires a very
similar ÔadjustmentÕ as it is measured as ®nance lease liability plus operating lease liability/total
assets (including operating lease asset). The operating lease asset and liability are of similar size,
di�ering only in the cumulative net pro®t e�ect on equity, and are both of relatively large
magnitude, on average. The adjustment introduces a signi®cant positive bias in the correlation
between FAPROP and (LRP). Similar arguments apply to the TAGROW variable.8 The UKQI list current in 1995 (the year in which the sampling was undertaken) was used as the
initial sampling frame. This Datastream listing of approximately 1300 companies contains all of the
UK industrial and commercial companies for which Datastream has accounting information. A
particular methodological problem in studies concerning performance is survivorship bias, which
refers to the use of samples which are biased towards long-surviving companies (see, for example,
Brown et al. (1992) for a review of this problem). This is also important in a leasing context, as
previous research ®ndings suggest that leasing may be the only option in acquiring the use of assets
for unpro®table, or high growth, companies which have exhausted all alternative sources of ®nance.
To overcome this problem, the 1995 UKQI list was augmented by a group of approximately 250
ÔdeadÕ companies (failed, taken over, or gone private), identi®ed from a comparison of the Times
1000 1981/82 top UK companies (no historic UKQI list being available) with the 1995 UKQI list.
The year 1981 was selected for comparison purposes because it is the year in which ED 29 was
published, and some of our analysis therefore covers the 14-year period 1981 to 1994. Sample
representativeness checks were performed, based on total assets (item 392) and share capital and
reserves (item 307). This showed that the company size distribution and industry sector distribution
of the sample approximated closely to that of the population.9 Models were also estimated on the full sample set by excluding such multi-year variables. The
results (not presented here) were almost identical, con®rming that bias resulting from data needs is
not a signi®cant issue.
440 V. Beattie et al. / Journal of Banking & Finance 24 (2000) 427±470

Table 1
Composition of sample for 1990 through 1994
Number of companies with Total
Finance
leases
Operating
leases (only)
Any leases No leases
Panel A: Analysis of leasing by year
1990 95 60 155 24 179
1991 97 68 165 24 189
1992 97 72 169 24 193
1993 101 75 176 21 197
1994 105 83 188 18 206
Panel B: Analysis of leasing by industry for 1994a
Five largest industry groups (incorporated as dummy variables)
Building 11 12 23 3 26
Retail 10 12 22 1 23
Electrical/tronic 6 11 17 1 18
Engineering 11 6 17 0 17
Leisure 9 4 13 1 14
Sub-total A 47 45 92 6 98
Smaller industry groups (treated as control group)
Motor 8 0 8 3 11
Textiles 5 4 9 2 11
Breweries 2 5 7 3 10
Household goods 5 3 8 2 10
Utilities 5 4 9 0 9
Business support 4 2 6 1 7
Food manufacturing 5 2 7 0 7
Publishing & Printing 6 1 7 0 7
Chemicals 2 2 4 1 5
Computer services 5 0 5 0 5
Diversi®ed industrials 2 3 5 0 5
Distribution 2 2 4 0 4
Health 2 2 4 0 4
Media and agencies 2 1 3 0 3
Oil 0 3 3 0 3
Paper & Packaging 1 2 3 0 3
Metals 1 0 1 0 1
Mining 0 1 1 0 1
Transport 0 1 1 0 1
Waste control 1 0 1 0 1
Sub-total B 58 38 96 12 108
Total (A + B) 105 83 188 18 206
a The pattern across industries was very similar for 1990 to 1993 and, therefore, details are not
reported here.
V. Beattie et al. / Journal of Banking & Finance 24 (2000) 427±470 441
1994. Panel A shows that between 179 and 206 companies each year possessedall the relevant data. It also indicates the number of companies which used just®nance leases and those which used operating and/or ®nance leases. For ex-ample, in 1994, 105 companies (51%) used ®nance leases but this increased to188 (91%) once operating leases were considered. This suggests that mostcompanies adopt some form of leasing to ®nance the use of assets.
4.4. Data collection
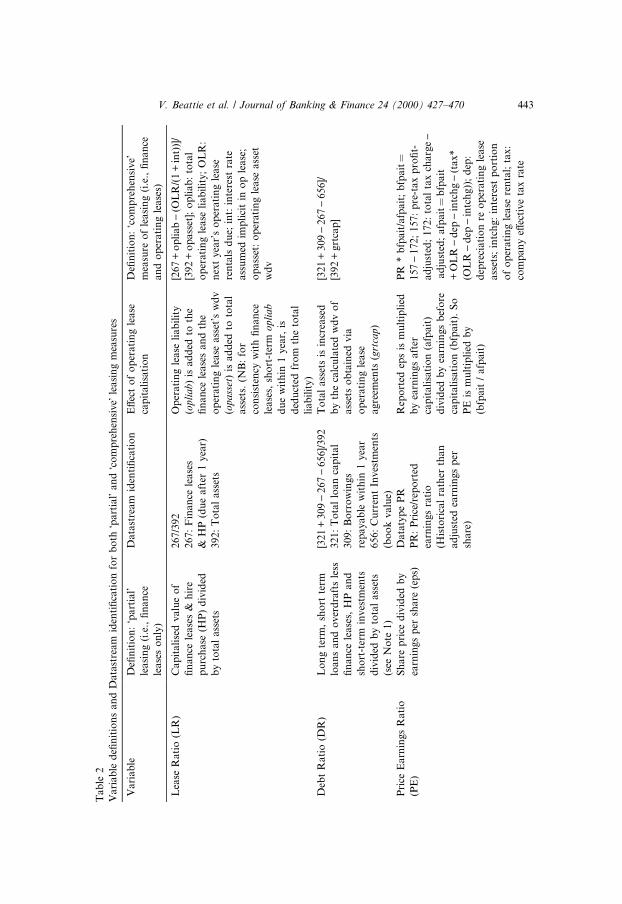
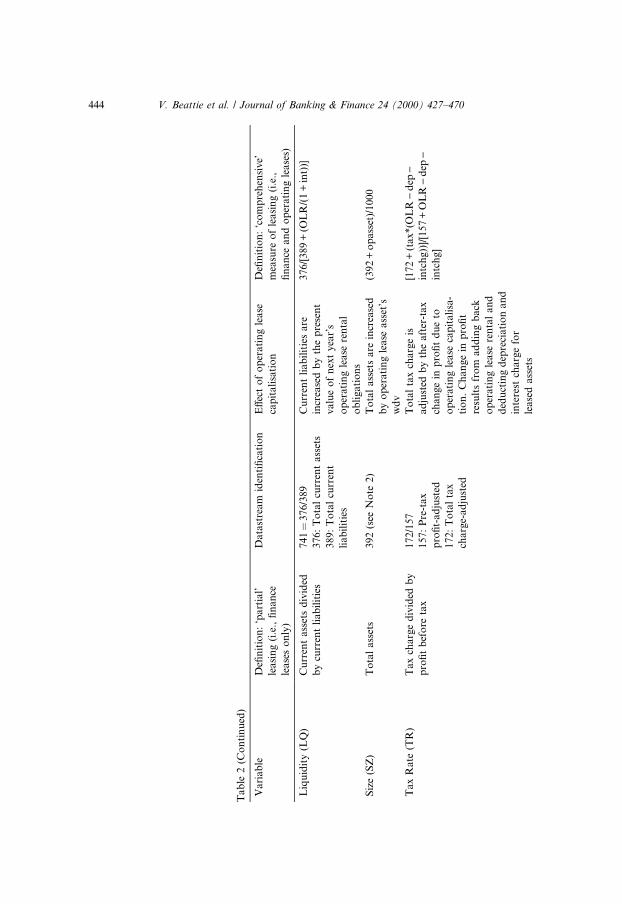
Eleven pro®t and loss and balance sheet items and industry group mem-bership were extracted from Datastream (see Table 2, column 3) to calculatethe regression variables. Leasing data to support the operating lease capitali-sation procedure is contained in the notes to the accounts (not available inDatastream) and was extracted manually from company ®nancial statementson micro®ches. Detailed speci®cation of variables is presented in Table 2.
4.5. Operating lease capitalisation procedure
The basis of the procedure developed by Imho� et al. (1991) for Ôcon-structive capitalisationÕ of operating leases is the schedule of minimum totalfuture operating lease payments disclosed by US companies in a note to the®nancial statements. The total commitment is analysed by time period(amounts payable in each of the next 5 years and after 5 years). Estimation ofthe present value of the unrecorded lease liability requires assumptions to bemade regarding the appropriate interest rate and the average remaining leaselife of leases whose remaining lease life exceeds 5 years. Estimation of thepresent value of the unrecorded lease asset requires further assumptions to bemade regarding the weighted average total lease life and the depreciationmethod which would be used. Finally, the impact of capitalisation on deferredtax, and hence balance sheet measures, requires an assumption to be maderegarding the appropriate tax rate.
The operating lease information disclosed by UK companies in a note to the®nancial statements is a schedule of next year's operating lease payments(compared to the minimum total future payments disclosed by US companies).This ®gure is analysed by asset category (i.e. Ôland and buildingsÕ and ÔotherÕ)and by lease expiry date (i.e., leases expiring within 1 year, between one and5 years and after 5 years). Although generally less complete than US disclo-sures, UK disclosures do have the advantage of giving a more reliable pictureof the companyÕs pattern of remaining lease lives.
In the present study, the Ôconstructive capitalisationÕ procedure was adaptedto take into account the di�erent operating lease disclosure requirements in theUK. In addition, preliminary analysis based on a set of six common assump-tions similar to those of Imho� et al., failed to produce reasonable and
442 V. Beattie et al. / Journal of Banking & Finance 24 (2000) 427±470
Tab
le2
Va
ria
ble
de®
nit
ion
sa
nd
Da
tast
ream
iden
ti®
cati
on
for
bo
thÔp
art
ialÕ
an
dÔc
om
pre
hen
siveÕ
leasi
ng
mea
sure
s
Va
ria
ble
De®
nit
ion
:`p
art
ial'
lea
sin
g(i
.e.,
®n
an
ce
lea
ses
on
ly)
Data
stre
am
iden
ti®
cati
on
E�
ect
of
op
erati
ng
lease
cap
itali
sati
on
De®
nit
ion
:`c
om
pre
hen
sive'
mea
sure
of
leasi
ng
(i.e
.,®
nan
ce
an
do
per
ati
ng
lease
s)
Lea
seR
ati
o(L
R)
Ca
pit
ali
sed
va
lue
of
®n
an
cele
ase
s&
hir
e
pu
rch
ase
(HP
)d
ivid
ed
by
tota
la
sset
s
267/3
92
Op
erati
ng
lease
liab
ilit
y
(opli
ab)
isad
ded
toth
e
®n
an
cele
ase
san
dth
e
op
erati
ng
lease
ass
et's
wd
v
(opass
et)
isad
ded
toto
tal
ass
ets.
(NB
:fo
r
con
sist
ency
wit
h®
nan
ce
lease
s,sh
ort
-ter
mopli
ab
du
ew
ith
in1
yea
r,is
ded
uct
edfr
om
the
tota
l
liab
ilit
y)
[267
+o
pli
ab
)(O
LR
/(1
+in
t))]
/
[392
+o
pass
et];
op
liab
:to
tal
op
erati
ng
lease
liab
ilit
y;
OL
R:
nex
tyea
r's
op
erati
ng
lease
ren
tals
du
e;in
t:in
tere
stra
te
ass
um
edim
pli
cit
ino
ple
ase
;
op
ass
et:
op
erati
ng
lease
ass
et
wd
v
267:
Fin
an
cele
ase
s
&H
P(d
ue
aft
er1
yea
r)
392:
To
tal
ass
ets
Deb
tR
ati
o(D
R)
Lo
ng
term
,sh
ort
term
loa
ns
an
do
ver
dra
fts
less
®n
an
cele
ase
s,H
Pa
nd
sho
rt-t
erm
inv
estm
ents
div
ided
by
tota
la
sset
s
(see
No
te1
)
[321
+309)
267)
656]/
392
To
tal
ass
ets
isin
crea
sed
by
the
calc
ula
ted
wd
vo
f
ass
ets
ob
tain
edvia
op
erati
ng
lease
agre
emen
ts(g
rtca
p)
[321
+309)
267)
656]/
[392
+grt
cap
]321:
To
tal
loan
cap
ital
309:
Bo
rro
win
gs
rep
ayab
lew
ith
in1
yea
r
656:
Cu
rren
tIn
ves
tmen
ts
(bo
ok
valu
e)
Pri
ceE
arn
ing
sR
ati
o
(PE
)
Sh
are
pri
ced
ivid
edb
y
earn
ing
sp
ersh
are
(ep
s)
Data
typ
eP
RR
epo
rted
eps
ism
ult
ipli
ed
by
earn
ings
aft
er
cap
itali
sati
on
(afp
ait
)
div
ided
by
earn
ings
bef
ore
cap
itali
sati
on
(bfp
ait
).S
o
PE
ism
ult
ipli
edb
y
(bfp
ait
/afp
ait
)
PR
*b
fpait
/afp
ait
;b
fpait�
157)
172;
15
7:
pre
-tax
pro
®t-
ad
just
ed;
172:
tota
lta
xch
arg
e)
ad
just
ed;
afp
ait�
bfp
ait
+O
LR
)d
ep)
intc
hg)
(tax*
(OL
R)
dep
)in
tch
g))
;d
ep:
dep
reci
ati
on
reo
per
ati
ng
lease
ass
ets;
intc
hg
:in
tere
stp
ort
ion
of
op
erati
ng
lease
ren
tal;
tax:
com
pan
ye�
ecti
ve
tax
rate
PR
:P
rice
/rep
ort
ed
earn
ings
rati
o
(His
tori
cal
rath
erth
an
ad
just
edea
rnin
gs
per
share
)
V. Beattie et al. / Journal of Banking & Finance 24 (2000) 427±470 443
Ta
ble
2(C
on
tin
ued
)
Va
ria
ble
De®
nit
ion
:`p
art
ial'
lea
sin
g(i
.e.,
®n
an
ce
lea
ses
on
ly)
Data
stre
am
iden
ti®
cati
on
E�
ect
of
op
erati
ng
lease
cap
itali
sati
on
De®
nit
ion
:`c
om
pre
hen
sive'
mea
sure
of
leasi
ng
(i.e
.,
®n
an
cean
do
per
ati
ng
lease
s)
Liq
uid
ity
(LQ
)C
urr
ent
ass
ets
div
ided
by
curr
ent
lia
bil
itie
s
741�
376/3
89
Cu
rren
tli
ab
ilit
ies
are
incr
ease
db
yth
ep
rese
nt
valu
eo
fn
ext
yea
r's
op
erati
ng
lease
ren
tal
ob
ligati
on
s
376/[
389
+(O
LR
/(1
+in
t))]
376:
To
tal
curr
ent
ass
ets
389:
To
tal
curr
ent
liab
ilit
ies
Siz
e(S
Z)
To
tal
ass
ets
392
(see
No
te2)
To
tal
ass
ets
are
incr
ease
d
by
op
erati
ng
lease
ass
et's
wd
v
(392
+o
pass
et)/
1000
Ta
xR
ate
(TR
)T
ax
cha
rge
div
ided
by
pro
®t
bef
ore
tax
172/1
57
To
tal
tax
charg
eis
ad
just
edb
yth
eaft
er-t
ax
chan
ge
inp
ro®
td
ue
to
op
erati
ng
lease
cap
itali
sa-
tio
n.
Ch
an
ge
inp
ro®
t
resu
lts
fro
mad
din
gb
ack
op
erati
ng
lease
ren
tal
an
d
ded
uct
ing
dep
reci
ati
on
an
d
inte
rest
charg
efo
r
lease
dass
ets
[172
+(t
ax*(O
LR
)d
ep)
intc
hg))
]/[1
57
+O
LR
)d
ep)
intc
hg]
157:
Pre
-tax
pro
®t-
ad
just
ed
172:
To
tal
tax
charg
e-ad
just
ed
444 V. Beattie et al. / Journal of Banking & Finance 24 (2000) 427±470

Pro
®ta
bil
ity
(PR
OF
)E
arn
ing
sb
efo
rein
tere
st
an
dta
x(E
BIT
)d
ivid
ed
by
cap
ita
lem
plo
yed
(157
+153)/
322
EB
ITad
just
edb
yad
din
g
back
op
erati
ng
lease
ren
tal
an
dd
edu
ctin
g
dep
reci
ati
on
on
lease
d
ass
ets.
Cap
ital
emp
loyed
incr
ease
db
yo
per
ati
ng
lease
dass
etle
sssh
ort
-ter
m
liab
ilit
y
[157
+O
LR
)d
ep]/
[322
+
op
ass
et)
(OL
R/(
1+
int)
)]153:
To
tal
inte
rest
charg
es
322:
To
tal
cap
ital
emp
loyed
To
tal
Ass
etG
row
th
(TA
GR
OW
)
Geo
met
ric
mea
ngro
wth
into
tal
ass
ets
ov
er3
yr
[(392
t/392
tÿ3)�
1=3� )
1]
No
chan
ges
inco
rpo
rate
d
(see
foo
tno
te7)
Ass
etst
ruct
ure
(FA
PR
OP
)
Fix
eda
sset
sd
ivid
edb
y
tota
la
sset
s
339/3
92
No
chan
ges
inco
rpo
rate
d
(see
foo
tno
te7)
339:
To
tal
®xed
ass
ets)
net
No
te1
:S
ho
rtte
rmlo
an
sa
nd
ov
erd
raft
sa
rein
clu
ded
as
they
are
oft
enco
nti
nu
ou
sly
roll
edo
ver
top
rovid
elo
ng
term
®n
an
ce.
Sh
ort
term
inves
tmen
ts
are
ded
uct
edso
tha
t®
rms
wh
ich
bo
rro
wfu
nd
sto
pla
ceo
nd
epo
sit
are
trea
ted
as
no
th
avin
gb
orr
ow
edth
efu
nd
s.F
inan
cele
ase
san
dH
P(
item
267)
is
ded
uct
edb
eca
use
itis
alr
ead
yin
clu
ded
init
em3
21
,to
tal
loan
cap
ital.
No
te2
:D
ata
stre
am
rep
ort
sall
of
the
item
sin
£000
exce
pt
tota
lass
ets
(£m
illi
on
).
V. Beattie et al. / Journal of Banking & Finance 24 (2000) 427±470 445
consistent results, due to the considerable variation in leasing patterns withinour sample companies. 10 We therefore developed the method to incorporatecompany-speci®c assumptions in respect of the remaining lease life, the assetproportion, and the e�ective tax rate. We also distinguish in our analysis be-tween asset categories and lease expiry categories, performing separate calcu-lations of remaining lease life and asset proportion for each. Further details ofour capitalisation procedure, and an illustration of its application to a par-ticular company, are given in Appendices 1 and 2.
Company ®nancial statements will be a�ected in several ways by thecapitalisation of operating leases. The e�ect on the variables in this study issummarised in Table 2 (columns 4 and 5). On the balance sheet, ®xed assetswill increase by the capitalised leased asset and liabilities will increase by theliability to make future lease payments, split between the current portion duewithin 1 year (current liability) and the longer-term portion. ShareholdersÕequity (retained pro®t) will be changed by the cumulative pro®t and losse�ect of capitalisation and deferred tax will also be a�ected. In the pro®t andloss account the full operating lease rental (OLR) payments are chargedagainst operating pro®t as a tax-deductible expense. On capitalisation of theleased asset, depreciation will be charged against operating pro®t and theinterest element of the OLR will be included under interest charges. Theimpact is that operating pro®t is likely to be higher (depreciation < OLR).Pro®t before tax will be lower in the early years of a lease, or lease portfolio,(depreciation + interest > OLR) and higher in the later years as the interestelement of OLR declines (depreciation + interest < OLR). Under current taxrules, the amount of tax paid will be unchanged, but the tax charged in thepro®t and loss account will be lower in the early years of the lease portfolioand higher in the later years. This was accommodated by adjustments todeferred tax.
10 The pattern of operating lease commitments over the period 1985 through 1994 was analyzed
for a small sub-sample of companies. This identi®ed some companies with commitments
predominantly in the Ô>5 yearsÕ category, some predominantly spread over the two Ô<5 yearsÕcategories, and some spread over all three expiry categories. Thus, some companies take on only
short- to medium-term leases, some mainly long-term leases, and some the whole range of lease
durations. Imho� et al.Õs assumption of uniform total and remaining lease lives is unable to capture
such diversity. In particular, calculation of the impact of capitalisation on the pro®t and loss
account (not discussed by the authors until their later paper Imho� et al., 1997) would be severely
distorted. For example, imagine a company which takes on only medium-term leases of, say, ®ve
years. In a steady state, the average remaining life for the company's leases would be approximately
3 years. Imho� et al. suggested a uniform assumption of 15 year remaining lease life. If this were
applied to such a company, the depreciation charge in the P&L account upon capitalisation of the
operating leases would be one-®fteenth of the asset value (assuming straight-line method) rather
than one-third and would give a large understatement of the e�ect on operating and pre-tax pro®t.
446 V. Beattie et al. / Journal of Banking & Finance 24 (2000) 427±470
5. Results
5.1. Descriptive statistics
The Ôconstructive capitalisationÕ process outlined above and in the Appen-dices allows the relative size of ®nance leases and operating leases to be as-sessed. For example, in 1994, the mean total liability in respect of ®nance leaseswas £3.8 million and for operating leases £50.8 million, of which £8.3 millionwould be categorised as short-term (<1 year) and £42.5 million long-term (>1year). This suggests that, on average, the operating leased liability is approx-imately 13 times larger than the liability in respect of ®nance leased assets. Thisreinforces the need for lease±debt substitutability research to incorporate op-erating leases.
Table 3 provides summary statistics for the variables, subscripted C to de-note their relevance to the comprehensive leasing measure, i.e., after they hadbeen adjusted to take account of the capitalisation of operating leases. 11
Statistics for variables based on the partial lease measure are also provided forcomparison (subscripted P). The mean value of the adjusted lease ratio LRC isapproximately 9.5% of total assets on average over the 5 years, compared to0.7% when considering only the use of ®nance leases. 12 This is consistent withthe above multiplier of approximately 13. The maximum value of LRC for anysingle company is 75% (in 1992), compared to a maximum of 18% (in 1991) forLRP, when only ®nance leases are considered. A similar pattern for debt ratiosDRC and DRP is observed with a decreasing trend in the mean DRC from apeak of 17.3% in 1991 down to 14.2% in 1994. The DRC values remain higherthan LRC, but are slightly lower than DRP, when ®nance leases alone wereconsidered. This occurs because capitalisation of operating leased assets leadsto an increase in total assets and a commensurate reduction in the debt ratio(debt to total assets).
Adjusted PEC ratios have slightly higher mean values than before. Thisimplies that earnings per share is reduced on average, due to the depreciationplus interest (after capitalisation) being a greater charge against pro®t than theoperating lease rental (before capitalisation). Adjusted LQC ratios have lower
11 The 1990-94 study period included a recession during which some companies reported losses
or very small pro®ts. This situation can distort relationships and two variables, in particular,
required adjustment to minimise the impact. Negative PE ratios were set to 100 for consistency
with companies experiencing low pro®ts (which explains the relatively high mean PE ratios
reported in Table 3) and PE ratios greater than 100 were set equal to 100. Companies reporting a
negative tax charge (i.e. repayment) associated with negative earnings gives a positive e�ective tax
rate. Such companies need to be recognised as ÔlowÕ tax payers so TR was set equal to 0. For
companies with a negative e�ective tax rate, TR was also set to 0, and high TR values in excess of 1
were set equal to 1.12 A&S report a ®nance LR of 0.9% of total assets in their sample.
V. Beattie et al. / Journal of Banking & Finance 24 (2000) 427±470 447
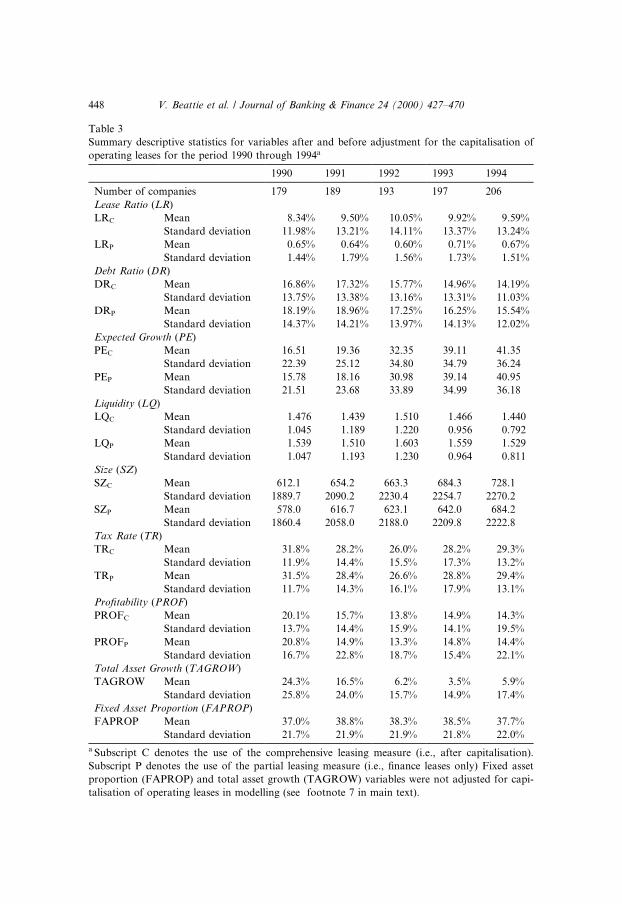
Table 3
Summary descriptive statistics for variables after and before adjustment for the capitalisation of
operating leases for the period 1990 through 1994a
1990 1991 1992 1993 1994
Number of companies 179 189 193 197 206
Lease Ratio (LR)
LRC Mean 8.34% 9.50% 10.05% 9.92% 9.59%
Standard deviation 11.98% 13.21% 14.11% 13.37% 13.24%
LRP Mean 0.65% 0.64% 0.60% 0.71% 0.67%
Standard deviation 1.44% 1.79% 1.56% 1.73% 1.51%
Debt Ratio (DR)
DRC Mean 16.86% 17.32% 15.77% 14.96% 14.19%
Standard deviation 13.75% 13.38% 13.16% 13.31% 11.03%
DRP Mean 18.19% 18.96% 17.25% 16.25% 15.54%
Standard deviation 14.37% 14.21% 13.97% 14.13% 12.02%
Expected Growth (PE)
PEC Mean 16.51 19.36 32.35 39.11 41.35
Standard deviation 22.39 25.12 34.80 34.79 36.24
PEP Mean 15.78 18.16 30.98 39.14 40.95
Standard deviation 21.51 23.68 33.89 34.99 36.18
Liquidity (LQ)
LQC Mean 1.476 1.439 1.510 1.466 1.440
Standard deviation 1.045 1.189 1.220 0.956 0.792
LQP Mean 1.539 1.510 1.603 1.559 1.529
Standard deviation 1.047 1.193 1.230 0.964 0.811
Size (SZ)
SZC Mean 612.1 654.2 663.3 684.3 728.1
Standard deviation 1889.7 2090.2 2230.4 2254.7 2270.2
SZP Mean 578.0 616.7 623.1 642.0 684.2
Standard deviation 1860.4 2058.0 2188.0 2209.8 2222.8
Tax Rate (TR)
TRC Mean 31.8% 28.2% 26.0% 28.2% 29.3%
Standard deviation 11.9% 14.4% 15.5% 17.3% 13.2%
TRP Mean 31.5% 28.4% 26.6% 28.8% 29.4%
Standard deviation 11.7% 14.3% 16.1% 17.9% 13.1%
Pro®tability (PROF)
PROFC Mean 20.1% 15.7% 13.8% 14.9% 14.3%
Standard deviation 13.7% 14.4% 15.9% 14.1% 19.5%
PROFP Mean 20.8% 14.9% 13.3% 14.8% 14.4%
Standard deviation 16.7% 22.8% 18.7% 15.4% 22.1%
Total Asset Growth (TAGROW)
TAGROW Mean 24.3% 16.5% 6.2% 3.5% 5.9%
Standard deviation 25.8% 24.0% 15.7% 14.9% 17.4%
Fixed Asset Proportion (FAPROP)
FAPROP Mean 37.0% 38.8% 38.3% 38.5% 37.7%
Standard deviation 21.7% 21.9% 21.9% 21.8% 22.0%
a Subscript C denotes the use of the comprehensive leasing measure (i.e., after capitalisation).
Subscript P denotes the use of the partial leasing measure (i.e., ®nance leases only) Fixed asset
proportion (FAPROP) and total asset growth (TAGROW) variables were not adjusted for capi-
talisation of operating leases in modelling (see footnote 7 in main text).
448 V. Beattie et al. / Journal of Banking & Finance 24 (2000) 427±470

mean values due to the increase in current liabilities caused by the short termelement of operating lease commitments. The average company size increasesby about 6% on average on adjustment for operating leased assets. The meanadjusted TRC does not signi®cantly change but, on average, the tax charge isslightly lower in line with a corresponding reduction in earnings. The observedtrends in pro®tability (PROF) and total asset growth (TAGROW) variablesre¯ect the impact of the recession during the study period. 13
5.2. Correlation analysis for capitalisation-adjusted variables
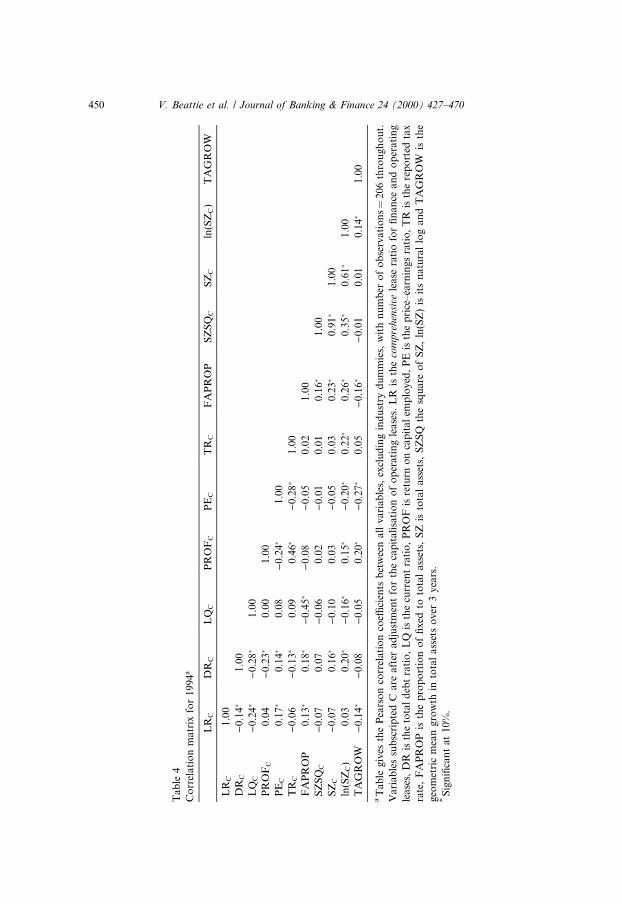
Table 4 provides details of the correlations between the variables after ad-justment for operating lease capitalisation; these are generally as predicted.First, consider the control variables, seven of which are signi®cantly correlatedwith the debt ratio. The debt ratio is negatively related to pro®tability(PROFC) and to tax rate (TRC), contrary to the static trade-o� theory butconsistent with the pecking order theory. The positive association with FA-PROP suggests an increased use of debt by ®rms with assets which can be usedas collateral for loans. The proxies for growth give mixed signals; the weaknegative association with historical measure TAGROW is consistent with thepredicted lower use of debt by growth ®rms. However, the positive correlationbetween debt and PE ratio suggests that PEC may be capturing a di�erentcharacteristic to the other growth variables; indeed, the correlations betweenPEC and these are signi®cantly negative. Size (SZC) is expected to be positivelyrelated to long-term and inversely related to short-term debt. Our DRC mea-sure includes both short-term and long-term debt so the expected association isuncertain. The observed relationship is positive and signi®cant. Splitting thedebt ratio between short- and long-term reveals that the expected relationshipsdo hold, with a signi®cant correlation of 0.28 between size and long-term debt,and an insigni®cant correlation of )0.10 between size and short-term debt.Marsh (1982) also cites similar evidence that large companies tend to use morelong-term debt and small companies more short-term debt.
Second, consider the lease ratio (LRC) variable. It has a signi®cant nega-tive relationship with the debt ratio (DRC), indicating substitutability. The
13 We also carried out tests to see if there were any signi®cant di�erences between variables for
the three groups of ®rms (i.e., ÔdeadÕ, ÔnewÕ and ÔcontinuingÕ) in our sample. For each of the 5 years,
the lease ratio and the debt ratio were tested for both partial and comprehensive measures.
Unfortunately, there were insu�cient numbers of ÔdeadÕ ®rms in each yearÕs sample for reliable
estimation of variable means. No signi®cant di�erences between ÔnewÕ and ÔcontinuingÕ ®rms were
found for the mean partial lease ratio (LRP) or for either of the debt ratios (DRP, DRC). However,
the mean comprehensive lease ratio (LRC) was signi®cantly higher (at the 5% level) for ÔnewÕ ®rms
than for ÔcontinuingÕ ®rms, in each of the 5 years. This is consistent with the growth of the UK
services sector, which contains high users of operating leases. This growth is re¯ected our sample.
We are grateful to an anonymous referee for suggesting this additional analysis.
V. Beattie et al. / Journal of Banking & Finance 24 (2000) 427±470 449
Tab
le4
Co
rrel
ati
on
matr
ixfo
r1
99
4a
LR
CD
RC
LQ
CP
RO
FC
PE
CT
RC
FA
PR
OP
SZ
SQ
CS
ZC
ln(S
ZC
)T
AG
RO
W
LR
C1
.00
DR
C)
0.1
4�
1.0
0
LQ
C)
0.2
4�
)0
.28�
1.0
0
PR
OF
C0
.04
)0
.23�
0.0
01
.00
PE
C0
.17�
0.1
4�
0.0
8)
0.2
4�
1.0
0
TR
C)
0.0
6)
0.1
3�
0.0
90
.46�
)0.2
8�
1.0
0
FA
PR
OP
0.1
3�
0.1
8�
)0
.45�
)0.0
8)
0.0
50.0
21.0
0
SZ
SQ
C)
0.0
70
.07
)0
.06
0.0
2)
0.0
10.0
10.1
6�
1.0
0
SZ
C)
0.0
70
.16�
)0
.10
0.0
3)
0.0
50.0
30.2
3�
0.9
1�
1.0
0
ln(S
ZC
)0
.03
0.2
0�
)0
.16�
0.1
5�
)0.2
0�
0.2
2�
0.2
6�
0.3
5�
0.6
1�
1.0
0
TA
GR
OW
)0
.14�
)0
.08
)0
.05
0.2
0�
)0.2
7�
0.0
5)
0.1
6�
)0.0
10.0
10.1
4�
1.0
0
aT
ab
legiv
esth
eP
ears
on
corr
elati
on
coe�
cien
tsb
etw
een
all
vari
ab
les,
excl
ud
ing
ind
ust
ryd
um
mie
s,w
ith
nu
mb
ero
fo
bse
rvati
on
s�
206
thro
ugh
ou
t.
Va
ria
ble
ssu
bsc
rip
ted
Ca
rea
fter
ad
just
men
tfo
rth
eca
pit
ali
sati
on
of
op
erati
ng
lease
s.L
Ris
the
com
pre
hen
sive
lease
rati
ofo
r®
nan
cean
do
per
ati
ng
lea
ses,
DR
isth
eto
tal
deb
tra
tio
,L
Qis
the
curr
ent
rati
o,
PR
OF
isre
turn
on
cap
ital
emp
loyed
,P
Eis
the
pri
ce±ea
rnin
gs
rati
o,
TR
isth
ere
po
rted
tax
rate
,F
AP
RO
Pis
the
pro
po
rtio
no
f®
xed
toto
tal
ass
ets,
SZ
isto
tal
ass
ets,
SZ
SQ
the
squ
are
of
SZ
,ln
(SZ
)is
its
natu
ral
log
an
dT
AG
RO
Wis
the
geo
met
ric
mea
ng
row
thin
tota
la
sset
so
ver
3y
ears
.*
Sig
ni®
can
ta
t1
0%
.
450 V. Beattie et al. / Journal of Banking & Finance 24 (2000) 427±470
signi®cant negative coe�cient with liquidity (LQC) is as expected with poorliquidity ®rms engaging in more leasing. The positive coe�cient with PEC
suggests that growth ®rms undertake more leasing, but the historical growthmeasures give opposite indications. The positive association with the assetstructure variable (FAPROP) supports the Smith and Wakeman (1985) con-tention that ®rms with certain types of assets will ®nd it easier to engage in bothleasing and debt ®nance. The size e�ect is weakly negative, but is consistentwith smaller ®rms using more leasing, on average.
Two separate models were estimated: First, with size proxied using LNSZand, second, to accommodate potential non-linearities, including both SZ andSZSQ. As almost identical results were obtained, only the model with theLNSZ proxy is presented here.
5.3. Regression estimates based on partial lease ratio
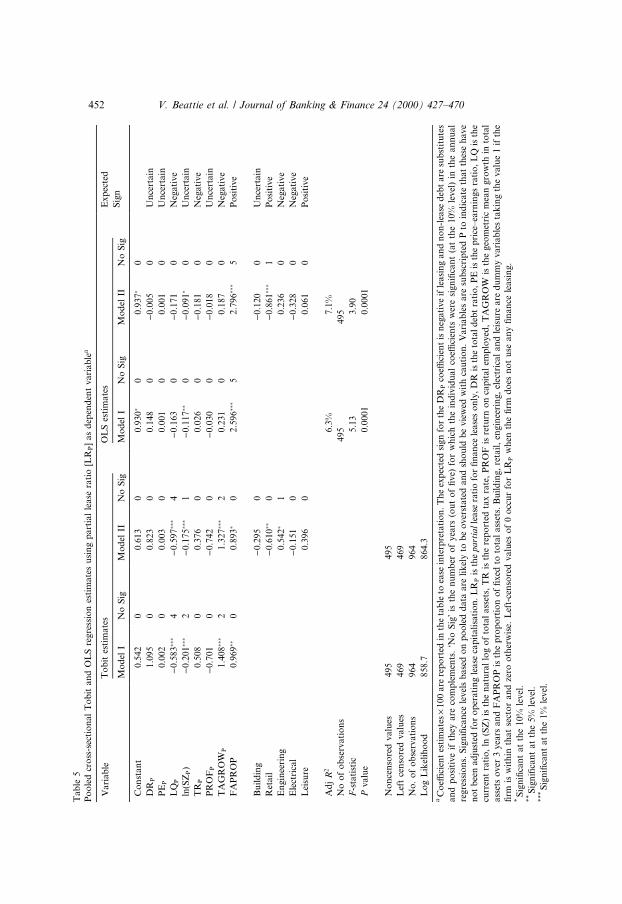
Initially, to give a benchmark for later comparisons, we replicate the A&Sstudy which considered a partial measure of leases only (i.e., ®nance leases) butwe include three additional control variables (PROF, TAGROW and FA-PROP). For comparison with the A&S results, Eq. (4) was ®rst estimated ex-cluding industry dummies (Model I) and then including them (Model II). Tobitregression was used for the full sample and OLS regression for only thosecompanies which used ®nance leases. Cross-sectional regressions were carriedout separately for each of the 5 years 1990 through 1994 and pooled over theentire 5 years. The pooled regressions provide a useful means of summarisingthe results and are reported in Table 5. The signi®cance levels from these re-gressions are subject to bias and are likely to be overstated; they should,therefore, be viewed with caution. To aid interpretation of signi®cance, thenumber of times, out of ®ve, in which the variable appeared as signi®cant (atthe 10% level) in the annual regressions is also reported.
The explanatory power of the annual regressions was low (mean adj. R2 ofapproximately 3%), and did not greatly improve in the pooled regressions. Inboth the Tobit and OLS regression models, the debt ratio coe�cient wasgenerally positive, consistent with complementarity, but was not signi®cant.Only the liquidity variable, LQ (in the Tobit regressions) and the asset struc-ture variable, FAPROP (in the OLS regressions) were generally signi®cant withthe expected sign. Thus, there is weak evidence that companies with poor li-quidity and those with assets which can be used as collateral, take on relativelymore ®nance leases.
The coe�cients on the industry dummies are generally insigni®cant in theannual regressions, though signi®cantly negative for retail in the pooled re-gression. This provides weak evidence that the retail sector employs relativelyless ®nance leases than most sectors. Given the general, rather than ®rm-speci®c, nature of assets within the retail sector, this result is counter-intuitive.
V. Beattie et al. / Journal of Banking & Finance 24 (2000) 427±470 451
Ta
ble
5
Po
ole
dcr
oss
-sec
tio
nal
To
bit
an
dO
LS
regre
ssio
nes
tim
ate
su
sin
gp
art
ial
lease
rati
o[L
RP]
as
dep
end
ent
vari
ab
lea
Vari
ab
leT
ob
ites
tim
ate
sO
LS
esti
mate
sE
xp
ecte
d
Sig
nM
od
elI
No
Sig
Mo
del
IIN
oS
igM
od
elI
No
Sig
Mo
del
IIN
oS
ig
Co
nst
an
t0.5
42
00.6
13
00.9
30�
00
.937�
0
DR
P1.0
95
00.8
23
00.1
48
0)
0.0
05
0U
nce
rtain
PE
P0.0
02
00.0
03
00.0
01
00
.001
0U
nce
rtain
LQ
P)
0.5
83���
4)
0.5
97���
4)
0.1
63
0)
0.1
71
0N
egati
ve
ln(S
ZP)
)0.2
01���
2)
0.1
75���
1)
0.1
17��
0)
0.0
91�
0U
nce
rtain
TR
P0.5
08
00.3
76
00.0
26
0)
0.1
81
0N
egati
ve
PR
OF
P)
0.7
01
0)
0.7
42
0)
0.0
30
0)
0.0
18
0U
nce
rtain
TA
GR
OW
P1.4
08���
21.3
27���
20.2
31
00
.187
0N
egati
ve
FA
PR
OP
0.9
69��
00.8
93�
02.5
96���
52
.796���
5P
osi
tive
Bu
ild
ing
)0.2
95
0)
0.1
20
0U
nce
rtain
Ret
ail
)0.6
10��
0)
0.8
61���
1P
osi
tive
En
gin
eeri
ng
0.5
42�
10
.236
0N
egati
ve
Ele
ctri
cal
)0.1
51
0)
0.3
28
0N
egati
ve
Lei
sure
0.3
96
00
.061
0P
osi
tive
Ad
jR
26.3
%7.1
%
No
of
ob
serv
ati
on
s495
495
F-s
tati
stic
5.1
33.9
0
Pv
alu
e0.0
001
0.0
001
No
nce
nso
red
valu
es495
495
Lef
tce
nso
red
valu
es469
469
No
.o
fo
bse
rva
tio
ns
96
49
64
Lo
gL
ikel
iho
od
858.7
864.3
aC
oe�
cien
tes
tim
ate
s´
100
are
rep
ort
edin
the
tab
leto
ease
inte
rpre
tati
on
.T
he
exp
ecte
dsi
gn
for
the
DR
Pco
e�ci
ent
isn
egati
ve
ifle
asi
ng
an
dn
on
-lea
sed
ebt
are
sub
stit
ute
s
an
dp
osi
tive
ifth
eyare
com
ple
men
ts.ÔN
oS
igÕ
isth
en
um
ber
of
yea
rs(o
ut
of
®ve)
for
wh
ich
the
ind
ivid
ual
coe�
cien
tsw
ere
sign
i®ca
nt
(at
the
10%
level
)in
the
an
nu
al
regre
ssio
ns.
Sig
ni®
can
cele
vel
sb
ase
do
np
oo
led
data
are
lik
ely
tob
eo
ver
state
dan
dsh
ou
ldb
evie
wed
wit
hca
uti
on
.V
ari
ab
les
are
sub
scri
pte
dP
toin
dic
ate
that
thes
eh
ave
no
tb
een
ad
just
edfo
ro
per
ati
ng
lease
cap
itali
sati
on
.L
RP
isth
epart
ial
lease
rati
ofo
r®
nan
cele
ase
so
nly
,D
Ris
the
tota
ld
ebt
rati
o,
PE
isth
ep
rice
±ea
rnin
gs
rati
o,
LQ
isth
e
curr
ent
rati
o,
ln(S
Z)
isth
en
atu
ral
log
of
tota
lass
ets,
TR
isth
ere
po
rted
tax
rate
,P
RO
Fis
retu
rno
nca
pit
al
emp
loyed
,T
AG
RO
Wis
the
geo
met
ric
mea
ngro
wth
into
tal
ass
ets
over
3yea
rsan
dF
AP
RO
Pis
the
pro
po
rtio
no
f®
xed
toto
tal
ass
ets.
Bu
ild
ing,
reta
il,
engin
eeri
ng,
elec
tric
al
an
dle
isu
reare
du
mm
yvari
ab
les
tak
ing
the
valu
e1
ifth
e
®rm
isw
ith
inth
at
sect
or
an
dze
roo
ther
wis
e.L
eft-
cen
sore
dvalu
eso
f0
occ
ur
for
LR
Pw
hen
the
®rm
do
esn
ot
use
an
y®
na
nce
lea
sin
g.
*S
ign
i®ca
nt
at
the
10%
level
.**
Sig
ni®
can
tat
the
5%
level
.***
Sig
ni®
can
tat
the
1%
level
.
452 V. Beattie et al. / Journal of Banking & Finance 24 (2000) 427±470
Overall, these results provide no support for a substitutability relationshipbetween ®nance leases and debt and are consistent with the initial observationsby A&S (and AP) that ®nance leases and debt appear to be complements. Forboth Model I and Model II in the annual regressions, the lease ratio has apositive but insigni®cant relationship with the debt ratio for 4 (3) years out of®ve for Tobit (OLS) regressions. Our positive OLS results in 1990 and 1991di�er from those of A&S, 14 who found a consistent signi®cantly negative re-lationship between LR and DR, for each of the years 1990 through 1992, basedon their sample of approximately 315 companies that had ®nance leases. Thiscontrasted with their ®nding of a generally positive relationship in the Tobitanalysis of the full sample of approximately 565 companies. These observationsled them to conclude that the large proportion of non-leasing ®rms in their fullsample, ®rms which also had low debt ratios, explained the Tobit-basedÔcomplementsÕ result. 15
5.4. Regression estimates based on comprehensive lease ratio
Eq. (4) was estimated ®rst, for the full sample, using the Tobit regressiontechnique and then for the sub-sample of companies undertaking any form ofleasing using OLS. Given the relatively small proportion of companies thatwere not engaged in any leasing (approximately 12% on average) the almostidentical results from the two techniques are not surprising. In view of thesimilarity, only OLS estimates are reported. Table 6 uses pooled cross-sectional
14 This di�erence remains puzzling. We investigated further by re-estimating both Tobit and OLS
regressions with our three additional control variables removed. The sign and signi®cance of DRP
for 1990±92 were unchanged. In particular, the DRP coe�cient was insigni®cantly positive for 1990
and 1991 in contrast with A&S. We also ran a crude check to see if our results might be sample-
speci®c by splitting our sample in two and re-estimating the regressions. The sign of the DRP
coe�cient remained positive for both of the sub-samples. It is also worth noting that A&S report a
positive correlation for 1991 and 1992 between LR and DR for their ®nance lease sub-sample
(Table A2, p. 83) despite ®nding a signi®cant negative coe�cient linking the variables in their OLS
regression model.15 Footnote 13 provides evidence that our sample selection approach itself is not in¯uencing the
di�erence between our partial (i.e. ®nance) lease ratio results and those of A&S. However, there are
other potential explanatory factors. A&S included all companies which had the relevant data and
which were in Ônon-®nancial and fairly large industriesÕ (A&S, 1996, p.74). In particular they
excluded companies for which data on Ô®nance leases and especially the book value of short-term
investmentsÕ was missing on the Datastream database. Our random sample selection process was
less data-dependent since we extracted lease data from the primary source (published ®nancial
statements). It is possible that these two approaches give di�erent industry representation within
the samples; indeed comparison of our Table 1 and A&S Table 1 supports this contention. There is
also the possibility that, in the context of companiesÕ overall ®nancing decisions, ®nance leases are
of little signi®cance. This might cause the results in relation to ®nance leases alone to be unstable
and, potentially, to be quite sample-speci®c.
V. Beattie et al. / Journal of Banking & Finance 24 (2000) 427±470 453

Ta
ble
6
Co
mp
ari
son
bet
wee
np
oo
led
cro
ss-s
ecti
on
al
OL
Sre
gre
ssio
nes
tim
ate
sfo
rp
art
ial
lease
rati
o[L
RP]
an
dco
mp
reh
ensi
ve
lease
rati
o[L
RC
]a
Vari
ab
leP
art
ial
Lea
seR
ati
o(f
rom
Tab
le5)
Co
mp
reh
ensi
ve
Lea
seR
ati
o
Mo
del
IN
oS
igM
od
elII
No
Sig
Mo
del
IN
oS
igM
od
elII
No
Sig
Co
nst
an
t0.9
30�
00.9
37�
021.6
14���
52
0.4
37���
5
DR
0.1
48
0)
0.0
05
0)
34.5
05
5)
20.3
60���
5
PE
0.0
01
00.0
01
00.0
78���
40.0
52
4
LQ
)0.1
63
0)
0.1
71
0)
5.9
61���
5)
4.6
32���
5
ln(S
Z)
)0.1
17��
0)
0.0
91�
00.2
82
0)
0.5
12��
1
TR
0.0
26
0)
0.1
81
0)
3.2
71
11.0
86
2
PR
OF
)0.0
30
0)
0.0
18
0)
1.4
50
01.8
19
1
TA
GR
OW
0.2
31
00.1
87
00.8
83
3)
0.7
22
3
FA
PR
OP
2.5
96���
52.7
96���
50.1
17
0)
6.0
27���
4
Bu
ild
ing
)0.2
95
0)
0.3
75
0
Ret
ail
)0.6
10��
02
3.6
31���
5
En
gin
eeri
ng
0.5
42�
1)
1.3
22
0
Ele
ctri
cal
)0.1
51
0)
2.6
28��
2
Lei
sure
0.3
96
02.5
19�
0
Ad
jR
26.3
%7.1
%17.9
%46.1
%
No
of
ob
serv
ati
on
s
495
495
853
853
F-s
tati
stic
5.1
33.9
024.1
456.9
5
Pvalu
e0.0
001
0.0
001
0.0
001
0.0
001
aC
oe�
cien
tes
tim
ate
s´
100
are
rep
ort
edin
the
tab
leto
ease
inte
rpre
tati
on
.T
he
exp
ecte
dsi
gn
for
the
DR
coe�
cien
tis
neg
ati
ve
ifle
asi
ng
an
dn
on
-lea
sed
ebt
are
sub
stit
ute
s
an
dp
osi
tive
ifth
eyare
com
ple
men
ts.ÔN
oS
igÕ
isth
en
um
ber
of
yea
rs(o
ut
of
®ve)
for
wh
ich
the
ind
ivid
ual
coe�
cien
tsw
ere
sign
i®ca
nt
(at
the
10%
level
)in
the
an
nu
al
regre
ssio
ns
usi
ng
the
Wh
ite
(1980)
het
ero
sked
ast
ic-c
on
sist
ent
covari
an
cem
atr
ixes
tim
ati
on
toad
just
for
het
ero
sked
ast
icit
y.
Sig
ni®
can
cele
vel
sb
ase
do
np
oo
led
data
are
lik
ely
tob
eo
ver
state
dan
dsh
ou
ldb
evie
wed
wit
hca
uti
on
.E
xp
lan
ato
ryvari
ab
les
inth
eco
mpre
hen
sive
lease
rati
ore
gre
ssio
ns
have
bee
nad
just
edfo
ro
per
ati
ng
lease
cap
itali
sati
on
;in
the
part
ial
lease
rati
ore
gre
ssio
ns
they
have
no
t.L
Ris
the
lease
rati
o,
DR
isth
eto
tal
deb
tra
tio
,P
Eis
the
pri
ce±ea
rnin
gs
rati
o,
LQ
isth
ecu
rren
tra
tio
,ln
(SZ
)is
the
natu
ral
log
of
tota
lass
ets,
TR
isth
ere
po
rted
tax
rate
,P
RO
Fis
retu
rno
nca
pit
al
emp
loyed
,T
AG
RO
Wis
the
geo
met
ric
mea
ngro
wth
into
tal
ass
ets
over
3yea
rs
an
dF
AP
RO
Pis
the
pro
po
rtio
no
f®
xed
toto
tal
ass
ets.
Bu
ild
ing,
reta
il,
engin
eeri
ng,
elec
tric
al
an
dle
isu
reare
du
mm
yvari
ab
les
tak
ing
the
valu
e1
ifth
e®
rmis
wit
hin
that
sect
or
an
dze
roo
ther
wis
e.*
Sig
ni®
can
tat
the
10%
level
.**
Sig
ni®
can
tat
the
5%
lev
el.
***
Sig
ni®
can
tat
the
1%
level
.
454 V. Beattie et al. / Journal of Banking & Finance 24 (2000) 427±470

regressions to summarise results and facilitate comparison between partialand comprehensive lease ratio models. Table 7 provides the detailed annualregression results for the comprehensive lease ratio based on Model II (i.e.including industry dummies).
First, these tables show that the explanatory power of the regressions ismuch greater for the comprehensive lease ratio with adjusted R2 for the pooledregressions of 17.9% and 46.1% for Model I and Model II respectively, com-pared with 6.3% and 7.1% for the partial lease ratio. The adjusted R2 for theannual Model II regressions range between 42.2% and 55.0%.
Second, they indicate that the comprehensive lease ratio LRC has a signif-icantly negative relationship with the debt ratio DRC in the pooled results and
Table 7
Annual OLS regression estimates using comprehensive lease ratio [LRC] as dependent variablea
Variable 1990 1991 1992 1993 1994
Constant 14.38��� 23.02��� 21.47��� 20.04��� 19.41���
DRC )15.85� )25.06��� )23.44�� )22.50��� )22.14���
PEC 0.14��� 0.08��� 0.07�� 0.02 0.04�
LQC )5.22��� )5.22��� )5.02��� )4.03��� )4.56���
ln(SZC) )0.52 )0.84�� )0.45 0.15 )0.26
TRC 15.75�� 10.69 10.95�� )3.21 )7.75
PROFC )2.10 )10.96 )5.69 6.07 10.69�
TAGROWC 5.03�� 3.49 )7.91 )15.98�� )9.99���
FAPROP )8.60�� )7.90� )8.05� )7.15� )4.11
Building 2.59 1.37 )2.15 )3.44 )1.73
Retail 21.26��� 23.33��� 22.04��� 22.82��� 27.39���
Engineering )0.13 )1.45 )1.84 )1.53 0.13
Electrical )2.14 )3.29�� )3.58� )2.21 )0.88
Leisure 2.07 3.78 2.40 1.41 3.33
Adj R2 47.5% 43.8% 42.2% 42.9% 55.0%
No of
observations
155 165 169 176 188
F-statistic 11.7 10.8 10.4 11.1 18.6
P value 0.0001 0.0001 0.0001 0.0001 0.0001
a Coe�cient estimates ´ 100 are reported in the table to ease interpretation. The expected sign for
the DRC coe�cient is negative if leasing and non-lease debt are substitutes and positive if they are
complements. Signi®cance levels are stated using the White (1980) heteroskedastic-consistent co-
variance matrix estimation to adjust for heteroskedasticity. Explanatory variables are subscripted C
to indicate they have been adjusted for operating lease capitalisation. LR is the comprehensive lease
ratio for ®nance and operating leases, DR is the total debt ratio, PE is the price±earnings ratio, LQ
is the current ratio, ln(SZ) is the natural log of total assets, TR is the reported tax rate, PROF is
return on capital employed, TAGROW is the geometric mean growth in total assets over 3 years
and FAPROP is the proportion of ®xed to total assets. Building, retail, engineering, electrical and
leisure are dummy variables taking the value 1 if the ®rm is within that sector and zero otherwise.* Signi®cant at the 10% level.** Signi®cant at the 5% level.*** Signi®cant at the 1% level.
V. Beattie et al. / Journal of Banking & Finance 24 (2000) 427±470 455

in every year of the study; signi®cance is at the 1% level in 4 years and at the 5%level in 1 year. Thus, there is evidence of a persistent substitutability rela-tionship between our comprehensive measure of leasing and debt. Given thesmall magnitude of ®nance leases relative to operating leases, this implies thatoperating leases and debt are substitutes. This contrasts with Mehran et al.(1997) who found no evidence of such an interaction using US data.
In the comprehensive lease ratio models, liquidity LQC is consistently neg-ative and highly signi®cant (as expected) but PEC has a signi®cantly positiverelationship with the lease ratio (ÔuncertainÕ relationship expected). The rela-tionship between lease ratio and the other non-dummy control variables is timevarying both in sign and signi®cance.
Comparing the comprehensive lease ratio results excluding and includingindustry dummies (Model I compared with Model II) three major observationscan be made. First, inclusion of the industry dummies raises the explanatorypower of the regression signi®cantly, with adjusted R2 improving from 17.9%to 46.1% for the pooled regressions. Second, the FAPROP variable changessign and is signi®cantly negative in Model II. This suggests that a genuineunderlying negative relationship between the comprehensive lease ratio andFAPROP is possibly being masked by the strong retail sector relationshipwhich is not being explicitly modelled in Model I. Pooled cross-sectional resultswith retail company data excluded con®rm this, producing coe�cients ofFAPROP for Models I and II of )5.46 and )7.45 respectively, both signi®cantat the 1% level. This negative relationship is contrary to expectations since®rms with assets available as collateral are likely to take on more leasing.However, as it was not possible to adjust the FAPROP variable for assetsacquired under operating leases (see footnote 7), the proportion of ®xed assetsto total assets is understated by those assets which remain o�-balance sheet.Therefore, ®rms which use a high level of operating lease ®nance are likely toshow a relatively low level of on-balance sheet ®xed assets, which wouldexplain the observed negative relationship.
Third, the dummy for the retail sector is consistently positive and highlysigni®cant (at the 1% level) throughout. 16 Although the size of the industrydummy coe�cients, with the exception of retail, is generally insigni®cant, thesigns are as expected and are generally consistent over time. These resultssuggest that there are signi®cant di�erences in the usage of leases across dif-ferent industries.
For Model II using the partial lease ratio (LRP), the coe�cient of the retailindustry dummy variable was consistently negative, though mainly insigni®-cant, in the annual Tobit and OLS regressions; in the pooled results it was
16 This analysis was repeated using a revised cut-o� of nine industries classed as large (i.e., those
with, on average, 10 or more companies). The results were very similar and are not reported here.
456 V. Beattie et al. / Journal of Banking & Finance 24 (2000) 427±470
signi®cantly negative in both (see Table 5). This, together with the largesigni®cant positive coe�cient when using the comprehensive measure ofleasing (LRC), implies that companies are in¯uenced to enter into operatinglease agreements as a result of functioning in the retail trade. These results areconsistent with those of Kare and Herbst (1990) who also found that retail®rms employ more leases. As suggested earlier, retail assets are relativelystandard (city-centre shops, out-of-town shopping developments, o�ces andthe like), which makes them more suitable for leasing than the more spec-ialised assets often used in other industries. Further, such non-specialisedretail assets are especially suitable for ®nancing using operating lease con-tracts. A major di�erence between ®nance and operating leases is that thelessor bears Ôresidual valueÕ risk in operating leases. At the end of the oper-ating lease the asset reverts back to the lessor. The Ôresidual valueÕ on re-version has to be estimated by the lessor at the start of the lease contractwhen determining the appropriate lease rentals. This residual value will de-pend on the likelihood that the asset can be re-let or sold by the lessor, andthe state of the market for such assets at the date of reversion. The stan-dardised nature of, for example, an out-of-town shopping development meansthat it is fairly simple to convert it, at relatively low cost, for use by a newlessee. Additionally, there has been considerable growth in out-of-town re-tailing in the UK with demand for such sites in excess of supply as a result ofplanning controls. Thus, there is likely to be a ready market for selling or re-letting the asset.
There may also be a tax-based argument to partly explain the attraction ofoperating lease ®nance for retail assets. There are generally no tax allowancesin the UK for the purchase of retail properties. But, if a retail company ®-nances such properties using an operating lease, then tax relief is available onthe full operating lease rental. There would be no tax advantage to such leasesif the lessor su�ers tax on receipt of the rental. However, if the lessor is a non-tax payer (e.g., a pension fund), then there is a reduction in total tax payable bylessor and lessee, to the detriment of the Inland Revenue only; this tax bene®tcan be shared between lessee and lessor by the lessee accepting a slightly higherbefore-tax rental charge. Thus, there is a tax incentive to lease rather than buysuch retail properties. This incentive does not depend on the lessee being a lowor non-tax payer, the usual situation for tax incentives to lease; rather it de-pends on the non-tax paying nature of the lessor. This might partly explain whythe tax rate (TR) variable does not seem to be helpful in explaining the leaseratio.
To gain further insight into the pattern of leasing, a descriptive breakdownof the use of leasing and its relationship with the explanatory variables wasundertaken. The companies were separated between leasing and non-leasing,and companies with leasing were sorted on the size of lease ratio (LRC) andsplit into quintiles. By way of illustration, the mean values for the lease ratio
V. Beattie et al. / Journal of Banking & Finance 24 (2000) 427±470 457

and associated explanatory variables for 1994 are reported in Table 8. 17 Thisstrati®cation highlights the heavy use of leasing by some companies. The top20% of leasing users ®nance, on average, approximately 32% of their totalassets in this way.
The table shows that a typical non-leasing company (®rst column of data,mean LRC� 0.0%) has low debt (DRC), average expected and historicalgrowth (PEC and TAGROWC), very high liquidity (LQC), is very small (SZC),has an average tax rate (TRC), has relatively high pro®tability (PROFC), and a
Table 8
Relationship between comprehensive lease ratio [LRC] and explanatory variables for 1994a
No
leasing
Mean value within quintile number All
leasing
All
com-
panies1 2 3 4 5
No of
companies
18 37 37 38 38 38 188 206
LRC 0.0% 0.8% 3.1% 5.7% 10.7% 31.8% 10.5% 9.6%
Explanatory variable
DRC 9.8% 16.5% 15.9% 14.9% 13.9% 11.9% 14.6% 14.2%
PEC 39.26 38.64 34.29 34.71 45.99 53.83 41.55 41.35
LQC 2.19 1.50 1.62 1.29 1.26 1.18 1.37 1.44
SZC (£m) 167.6 1256.2 1080.3 650.2 450.0 492.5 781.8 728.1
TRC 30.8% 25.6% 31.0% 29.2% 33.0% 26.7% 29.1% 29.3%
PROFC 17.8% 9.5% 13.4% 17.0% 12.7% 17.5% 14.0% 14.3%
TAGROWC 5.7% 6.8% 9.8% 9.6% 3.2% 0.6% 6.0% 5.9%
FAPROP 34.4% 35.6% 37.6% 40.6% 35.1% 40.8% 38.0% 37.7%
a Companies were split between those which used neither ®nance nor operating leasing (LRC� 0;
ÔNo leasingÕ) and those which did use leasing (LRC > 0; ÔAll leasingÕ). Leasing companies were
ranked by the size of the comprehensive lease ratio LRC and split into quintiles. The table reports
mean values for the lease ratio and explanatory variables within each of these groups and, in the
®nal column, across all sample companies (ÔAll companiesÕ). Explanatory variables are subscripted
C to indicate they have been adjusted for operating lease capitalisation. LRC is the comprehensive
lease ratio for ®nance and operating leases, DR is the total debt ratio, PE is the price±earnings
ratio, LQ is the current ratio, SZ is size measured as total assets, TR is the reported tax rate, PROF
is return on capital employed, TAGROW is the geometric mean growth in total assets over 3 years
and FAPROP is the proportion of ®xed to total assets. Two-sample t-tests for mean di�erences of
the explanatory variables between the ÔNo leasingÕ and ÔAll leasingÕ groups indicated statistically
signi®cant di�erences for DR (10% level), LQ (10% level) and SZ (1% level). All other di�erences
were not statistically signi®cant. Testing the explanatory variables using ANOVA indicated that the
quintile means were not all equal for LQ (1% signi®cance level). There was also some weak evidence
(20% signi®cance level) that the quintile means were not all equal for DR, PE, TR and TAGROW.
Other quintile means were not statistically signi®cantly di�erent.
17 The relationships are very similar for the other 4 years and are not reported to save space and
for ease of exposition.
458 V. Beattie et al. / Journal of Banking & Finance 24 (2000) 427±470
lower than average proportion of ®xed assets (FPROP). By contrast, a typicalhigh leasing company (quintile 5) is likely to have low levels of debt (DRC),high growth prospects as measured by PEC but low historic growthTAGROWC, poor liquidity (LQC), will be small-to-medium sized (SZC), havea slightly low tax rate (TRC), relatively high pro®tability (PROFC), and a highproportion of ®xed assets (FPROP).
Within the subset of leasing companies there are decreasing near-monotonicrelationships between the quintile mean lease ratios and debt ratio, liquidityand size 18 and an increasing relationship with PE. There are no clear patternswith the other variables.
This description is consistent with greater use of leasing by companies whichare generally short of ®nance, have poor recent growth, yet are pro®table withgood future prospects which presumably needs ®nancing. The relationshipbetween leasing and size illustrated in Table 8 is also informative. It suggeststhat small companies do not generally use leasing ®nance. At the other ex-treme, large companies also do not use a great deal of leasing, perhaps becausethey have less need to do so as they have easier access to other cheaper forms ofdebt ®nance. So it is medium-sized companies which are the heaviest users ofleasing. They have less easy access to large amounts of debt-type ®nance, but agreat need to ®nance growth, and presumably are able, and willing, to employslightly more expensive lease ®nance.
5.5. Robustness checks
Given the limited disclosure of operating lease liabilities in UK ®nancialstatements, the method of constructive capitalisation necessarily involvessubjective assumptions and judgement. To test whether the results were in-¯uenced by the speci®c assumptions adopted here, the methods were reappliedindependently for a series of alternatives.
First, the base assumption of a 10% interest rate to discount the estimatedfuture lease payments was varied by �2%. Second, the base estimates of re-maining and total lease lives were replaced with two sets of more extreme es-timates; one set placed the leases at a much earlier stage of a shorter lease life,while the other placed the leases at a much later stage of a longer total life.
18 The size-related pattern of lease use indicated in Table 8 for companies which undertake
leasing suggests a negative relationship. The implied negative sign for LNSZC is observed in 4 out
of 5 years in the annual OLS regressions for Model II including industry dummies, though only in
1991 is the coe�cient signi®cant. For Model I which excludes industry dummies, the coe�cient of
LNSZC was consistently positive though insigni®cant, probably as a result of the size variable
proxying for other factors.
V. Beattie et al. / Journal of Banking & Finance 24 (2000) 427±470 459

Third, three slightly di�erent assumptions in the capitalisation procedure wereadopted. In one, the operating lease rental was taken as the reported operatinglease rental expense, rather than next yearÕs operating lease commitment. In thenext, the operating lease liability for each asset category was estimated basedon the overall average remaining life, rather than considering expiry categoriesindividually; this allows the historic lease obligation pro®le to be re¯ected inboth asset and liability estimates. Finally, the relationship between lease assetand liability was estimated for each expiry category, rather than using theoverall average remaining and total lease lives.
With one or two minor exceptions the signs and signi®cance of the regres-sion coe�cients were unaltered by these alternative measurements and,therefore, the reported results are considered robust to the estimates involvedin the operating lease capitalisation procedure.
The comprehensive lease ratio LRC employed in the study comprises thelong-term elements only of ®nance and operating leases, i.e., short-term ele-ments were excluded. The sensitivity of the results to a di�erent measure of thelease ratio variable was also investigated. The regression coe�cients were re-estimated with LRC de®ned to include short-term elements of both ®nance andoperating lease liabilities. Again, the signs and signi®cance of coe�cients es-sentially remained unchanged, though the magnitude of the DRC coe�cientincreased by approximately 20%, on average. This suggests a closer degree ofsubstitution between leasing and debt ®nance when short-term obligations areincluded.
The use of total assets as a proxy for company size has been criticised bySharpe and Nguyen (1995) in view of its dependence on the lease accountingdecision. The regression coe�cients were estimated with the number of em-ployees (Datastream item 219) as an alternative size measure. The signs andsigni®cance of coe�cients were unaltered, and the size variable remained as inTable 7, generally negative but insigni®cant. This suggests that the total assetsproxy did not greatly a�ect the results.
Finally, in view of the observation that leasing is used least by small andby large companies and most by medium sized companies, the possibility ofcapturing this non-linearity with the size control variable was investigated.Rather than natural log of size (LNSZ), size (SZ) and its square (SZSQ)were incorporated in the regression models with expected positive and neg-ative signs, respectively, for an inverted parabolic relationship. For theÔcomprehensive leasingÕ models (with LRC as dependent variable) the signsand signi®cance of other variables were very similar though the explanatorypower was very slightly increased. The SZ variable coe�cient was consis-tently negative and was signi®cant in two of the ®ve annual, and in thepooled, OLS regressions; SZSQ was consistently positive and only signi®cantin the pooled regression. The signs are opposite to those expectedif the inverted parabolic relationship pertains, suggesting that the simpler
460 V. Beattie et al. / Journal of Banking & Finance 24 (2000) 427±470

negative size relationship for companies undertaking leasing (see Table 8) isdominant.
5.6. Determination of the debt-to-lease displacement ratio
Finding a negative value for the debt ratio coe�cient provides evidence thattotal lease and debt ®nance are substitutes. However, this coe�cient is ameasure of the lease-to-debt displacement ratio, rather than the debt-to-leasedisplacement ratio a. The latter cannot be determined by taking the inverse ofthe coe�cient due to the presence of the constant and other independentvariables in the regression equation. The regression relationship must insteadbe re-estimated with DRC as the dependent variable and LRC as one of theindependent variables. OLS regression was used on the sub-sample of leasingcompanies for the comprehensive measure of leasing with the same controlvariables and industry dummies as previously. This was carried out for each ofthe 5 years 1990 through 1994 and pooled over all 5 years. 19 The estimatedvalues of the debt-to-lease displacement coe�cient for each of the years areapproximately )22%, )28%, )18%, )24% and )23%, giving an average valueof )23% over the 5 years; the pooled cross-sectional regression yields )22%.This indicates that £1 of leases (®nance and/or operating leases) displaced onaverage approximately £0.23 of debt over the period of the study.
While there was no evidence of substitutability between debt and ®nanceleases in the current study (see Section 5.3), Adedeji and Stapleton (1996)found that £1 of ®nance lease displaced about £0.55 of debt, on average, during1990±92. We do, however, ®nd evidence of substitutability between debt andall leases, suggesting that the substitution e�ect is not uniform across leasetypes. To test this further, we ran ®ve annual OLS regressions with DRC as thedependent variable (and the same control variables as in Table 7) but with twoseparate lease ratio variables, one for ®nance leases (LRP) and one for oper-ating leases (LROP). As expected, given the major importance of operatingleases relative to ®nance leases, the coe�cients on LROP were almost identicalto those obtained for LRC. They were all signi®cantly negative, ranging be-tween )19% (1992) and )30% (1991) and averaging )23.7%. However, thecoe�cients on LRP were not signi®cant and were extremely variable over the5 year period, ranging between )58% (1993) and +73% (1990). This lack of any
19 Adjusted R2 was much lower than the model estimated with LRC as dependent variable,
averaging 25.6% over the ®ve years, with 24.9% for the pooled regression. The reduction arises
mainly from a much less pronounced Ôindustry e�ectÕ for debt. Some caution must be exercised in
the interpretation of this model with DRC as dependent variable. The LRC variable, now treated as
an independent variable, is subject to measurement error and an Ôerrors-in-variableÕ problem arises.
With LRC as dependent variable this is less of a problem as the impact is likely to be re¯ected in
R2 as the error term in the regression ÔabsorbsÕ the measurement errors in LRC.
V. Beattie et al. / Journal of Banking & Finance 24 (2000) 427±470 461
signi®cant relationship between debt and ®nance leases is somewhat puzzling,since ®nance leases possess similar characteristics to debt. One possible ex-planation is that the relatively low level of ®nance leasing which remains in UK®rmsÕ ®nancial statements may not be the result of systematic decisions by ®rmmanagement. Rather, it may re¯ect a random ÔresidualÕ resulting from man-agersÕ inability to restructure some old contracts from ®nance to operatinglease formats.
One further aspect of the relationship between lease and debt ratios wasinvestigated. In the notes to their ®nancial statements, UK companies are re-quired to analyse next yearÕs operating lease commitment between Ôland andbuildingsÕ and ÔotherÕ (though a few companies fail to provide the split). Thisenabled the estimated total lease asset and liability to be similarly partitioned.To assess whether the degree of substitutability is related to the type of assetleased, the comprehensive lease ratio was split between these two categories,and an Ôunclassi®edÕ category. These variables were then incorporated in anOLS regression with the debt ratio as dependent variable and the same controlvariables including industry dummies as before. The estimated Ôland andbuildingsÕ displacement coe�cient averaged )20.0% over the 5 years, slightlylower than the overall ®gure of )23% reported above; it was signi®cant at the5% in all 5 years. The coe�cients for ÔothersÕ were variable in both sign and sizeand were statistically insigni®cant; the Ôunclassi®edÕ coe�cient was negativeand close to its average of )35.0% in all 5 years but was statistically insignif-icant. These results suggest that the nature and terms of operating lease con-tracts on land and buildings are such as to consume slightly less debt capacitythan contracts on other assets. Operating leases, generally, appear to consumemuch less debt capacity than an equivalent amount of non-lease debt.
6. Summary and conclusions
Operating leases are an important element of ®xed-claim ®nancing in theUK but they have been ignored in previous studies concerning capital structureand, in particular, in studies of lease±debt substitutability. This study estimatesthe total liability in respect of operating leases at the individual company leveland incorporates this, together with the ®nance lease liability in a compre-hensive measure of leasing. This measure is used in an investigation of therelationship between leasing and non-lease debt. The empirical results supportthe contention that leasing and debt are partial substitutes, with £1 of leasingdisplacing approximately £0.23 of non-lease debt, on average. This is consistentwith the argument that lessors bear some risks which are not inherent in debtcontracts. For operating leases a major source of such risk for the lessor isÔresidual value riskÕ. The residual value of the asset at the end of the lease mustbe estimated in determining the appropriate lease rentals. If, at the end of the
462 V. Beattie et al. / Journal of Banking & Finance 24 (2000) 427±470

lease, the asset cannot be either sold or leased at equivalent present value thenthe lessor will make a loss.
Liquidity is an important determinant of leasing, and there is some weakevidence to suggest that the use of leasing is size-related with small and large®rms taking on less leasing than medium-sized ®rms. Firms with high growthprospects (proxied by the PE ratio) seem to use more lease ®nance, consistentwith the argument that leasing can help to mitigate the underinvestmentproblems associated with debt usage. This might also be related to the natureof high growth ®rms. It is likely that there are more high growth ®rms in theservice sector than in manufacturing and service providers are expected to usegeneral, rather than ®rm-speci®c, assets. Such assets are more conducive to®nancing by leases, especially by operating leases where the lessor bears theresidual value risk.
Industry membership is a signi®cant explanatory factor for the level ofleasing, as it has been found to be for debt in previous studies. In particular, theretail sector undertakes a greater level of operating leasing than average. Retailassets are relatively standard and this, combined with the growth in out-of-town shopping developments in the UK, again leads to relatively low Ôresidualvalue riskÕ for the lessor. The bene®t of this low-risk should be to reduce thecost to lessees. There may also be a tax-based bene®t arising from tax asym-metry between lessor and lessee but requiring the lessor to be non-or low-taxpaying. The tax bene®t enjoyed by the lessee can in e�ect be shared with thelessor. Either or both of these will bring the cost of leasing more into line withcheaper non-leasing debt ®nance and increase the attractiveness of leasing.
Further analysis of the categories of operating leased assets for 1994 revealsthat Ôland and buildingsÕ constitutes at least 80% of the total value of leasedassets. 20 Thus, real estate forms a major part of assets ®nanced by operatinglease contracts. Such leases tend to run for long periods within which the rent isperiodically reviewed. Ward (1983) provides an analysis of the real estate lease-or-buy decision in a UK institutional and tax context. He demonstrates that,although the tax positions of lessor and lessee appear to negate the bene®ts ofleases to the lessee, the likely patterns of income ¯ows themselves are su�cientto provide real bene®ts to the lessee. He also shows that the bene®ts to thelessee increase substantially if leasing displaces less than an equal amount ofdebt. The evidence in the current paper that £1 of leasing tends to displace£0.23 of debt implies that there is a strong incentive for lessees to lease ratherthan buy real estate.
20 For 1994, we measured the proportion of the total value of operating leased assets represented
in the categories Ôland and buildingsÕ, ÔotherÕ and those which were not categorised. The
proportions were 77%, 9% and 14%, respectively, which suggests that, unless the non-categorised
were mainly ÔotherÕ, over 80% are likely to be Ôland and buildingsÕ.
V. Beattie et al. / Journal of Banking & Finance 24 (2000) 427±470 463
The current UK accounting treatment of leases is broadly the same inmany countries, including the US. Those leases categorised as Ô®nanceÕ orcapital leases feature as assets and liabilities on the balance sheet of the lesseerather than the lessor, by contrast, operating leased assets remain on thelessorÕs balance sheet with limited footnote disclosure in the lesseeÕs ®nancialstatements. Accounting standard-setters in the UK, US, Australia, and NewZealand, together with the IASC, have published a discussion paper ÔAc-counting for Leases: A New ApproachÕ, which proposes that all leases becapitalised (McGregor, 1996). In addition to other impacts, the apparentdi�erences in debt displacement between Ô®nanceÕ and operating leases suggestthat this proposal may have important economic consequences for both les-sees and lessors. It is possible that the inclusion of all leases on the balancesheet will a�ect the cost of capital which ®rms use in capital budgeting de-cisions and which analysts use to estimate ®rm equity values. In turn, thismay a�ect ®rmsÕ future ®nancing choices. Further research is required toassess these potential e�ects prior to the promulgation of any new accountingstandards.
Our results have implications for both company managers and researchers.They suggest that managers should be aware that leases consume debt ca-pacity, albeit on a less than one-for-one basis. Indeed, there is evidence thatmanagers may already recognise this (Drury and Braund, 1990) but perhapsnot in relation to operating leases. Academic researchers need to be aware thatnon-capitalised operating lease ®nance is an important source of ®nance whichshould be included in future studies on capital structure.
Acknowledgements
The ®nancial support of the Research Board of the Institute of CharteredAccountants in England and Wales is gratefully acknowledged. The authorsalso wish to acknowledge helpful comments from Tony Appleyard, RobinLimmack, Richard Ta�er and three anonymous referees.
Appendix A. Estimation of the value of operating leased assets and the related
liability
For each of the two asset categories (i.e., Ôland and buildingsÕ and ÔotherÕ),the total next yearÕs operating lease payments can be expressed asX3
e�1
CF1e �A:1�
464 V. Beattie et al. / Journal of Banking & Finance 24 (2000) 427±470
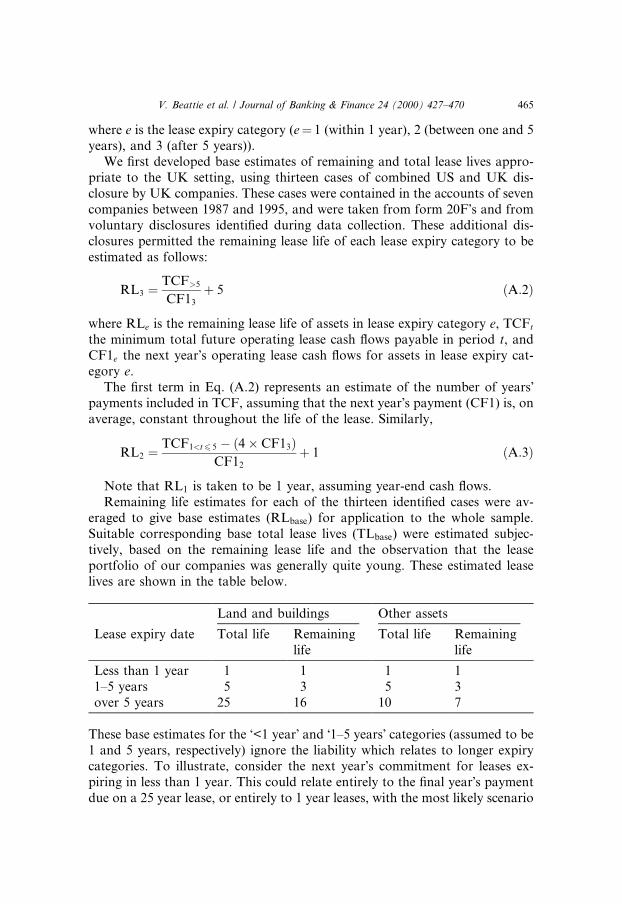
where e is the lease expiry category (e� 1 (within 1 year), 2 (between one and 5years), and 3 (after 5 years)).
We ®rst developed base estimates of remaining and total lease lives appro-priate to the UK setting, using thirteen cases of combined US and UK dis-closure by UK companies. These cases were contained in the accounts of sevencompanies between 1987 and 1995, and were taken from form 20FÕs and fromvoluntary disclosures identi®ed during data collection. These additional dis-closures permitted the remaining lease life of each lease expiry category to beestimated as follows:
RL3 � TCF>5
CF13
� 5 �A:2�
where RLe is the remaining lease life of assets in lease expiry category e, TCFt
the minimum total future operating lease cash ¯ows payable in period t, andCF1e the next yearÕs operating lease cash ¯ows for assets in lease expiry cat-egory e.
The ®rst term in Eq. (A.2) represents an estimate of the number of yearsÕpayments included in TCF, assuming that the next yearÕs payment (CF1) is, onaverage, constant throughout the life of the lease. Similarly,
RL2 � TCF1<t6 5 ÿ �4� CF13�CF12
� 1 �A:3�
Note that RL1 is taken to be 1 year, assuming year-end cash ¯ows.Remaining life estimates for each of the thirteen identi®ed cases were av-
eraged to give base estimates (RLbase) for application to the whole sample.Suitable corresponding base total lease lives (TLbase) were estimated subjec-tively, based on the remaining lease life and the observation that the leaseportfolio of our companies was generally quite young. These estimated leaselives are shown in the table below.
These base estimates for the Ô<1 yearÕ and Ô1±5 yearsÕ categories (assumed to be1 and 5 years, respectively) ignore the liability which relates to longer expirycategories. To illustrate, consider the next yearÕs commitment for leases ex-piring in less than 1 year. This could relate entirely to the ®nal yearÕs paymentdue on a 25 year lease, or entirely to 1 year leases, with the most likely scenario
Land and buildings Other assets
Lease expiry date Total life Remaininglife
Total life Remaininglife
Less than 1 year 1 1 1 11±5 years 5 3 5 3over 5 years 25 16 10 7
V. Beattie et al. / Journal of Banking & Finance 24 (2000) 427±470 465
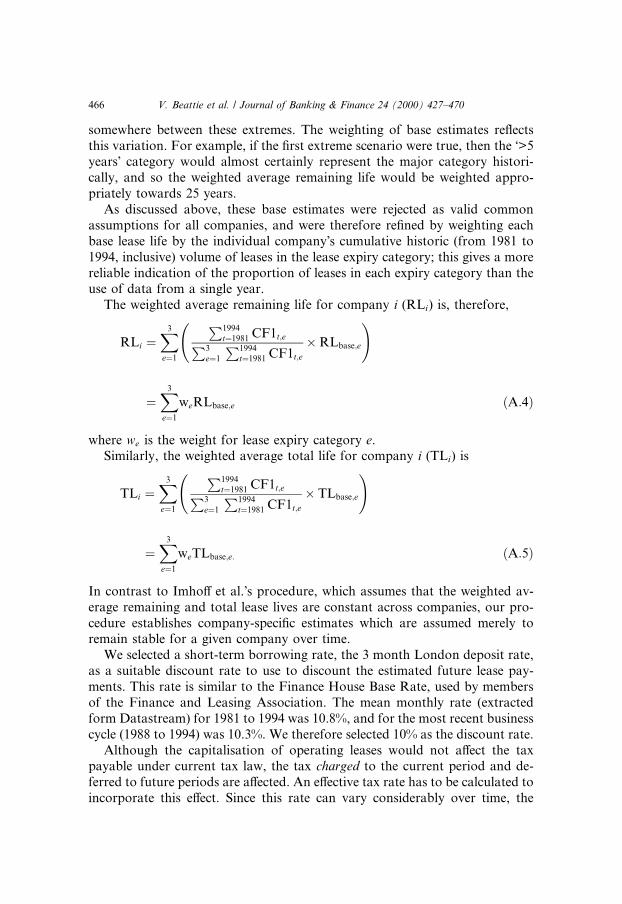
somewhere between these extremes. The weighting of base estimates re¯ectsthis variation. For example, if the ®rst extreme scenario were true, then the Ô>5yearsÕ category would almost certainly represent the major category histori-cally, and so the weighted average remaining life would be weighted appro-priately towards 25 years.
As discussed above, these base estimates were rejected as valid commonassumptions for all companies, and were therefore re®ned by weighting eachbase lease life by the individual companyÕs cumulative historic (from 1981 to1994, inclusive) volume of leases in the lease expiry category; this gives a morereliable indication of the proportion of leases in each expiry category than theuse of data from a single year.
The weighted average remaining life for company i (RLi) is, therefore,
RLi �X3
e�1
P1994t�1981 CF1t;eP3
e�1
P1994t�1981 CF1t;e
�RLbase;e
!
�X3
e�1
weRLbase;e �A:4�
where we is the weight for lease expiry category e.Similarly, the weighted average total life for company i (TLi) is
TLi �X3
e�1
P1994t�1981 CF1t;eP3
e�1
P1994t�1981 CF1t;e
� TLbase;e
!
�X3
e�1
weTLbase;e: �A:5�
In contrast to Imho� et al.Õs procedure, which assumes that the weighted av-erage remaining and total lease lives are constant across companies, our pro-cedure establishes company-speci®c estimates which are assumed merely toremain stable for a given company over time.
We selected a short-term borrowing rate, the 3 month London deposit rate,as a suitable discount rate to use to discount the estimated future lease pay-ments. This rate is similar to the Finance House Base Rate, used by membersof the Finance and Leasing Association. The mean monthly rate (extractedform Datastream) for 1981 to 1994 was 10.8%, and for the most recent businesscycle (1988 to 1994) was 10.3%. We therefore selected 10% as the discount rate.
Although the capitalisation of operating leases would not a�ect the taxpayable under current tax law, the tax charged to the current period and de-ferred to future periods are a�ected. An e�ective tax rate has to be calculated toincorporate this e�ect. Since this rate can vary considerably over time, the
466 V. Beattie et al. / Journal of Banking & Finance 24 (2000) 427±470
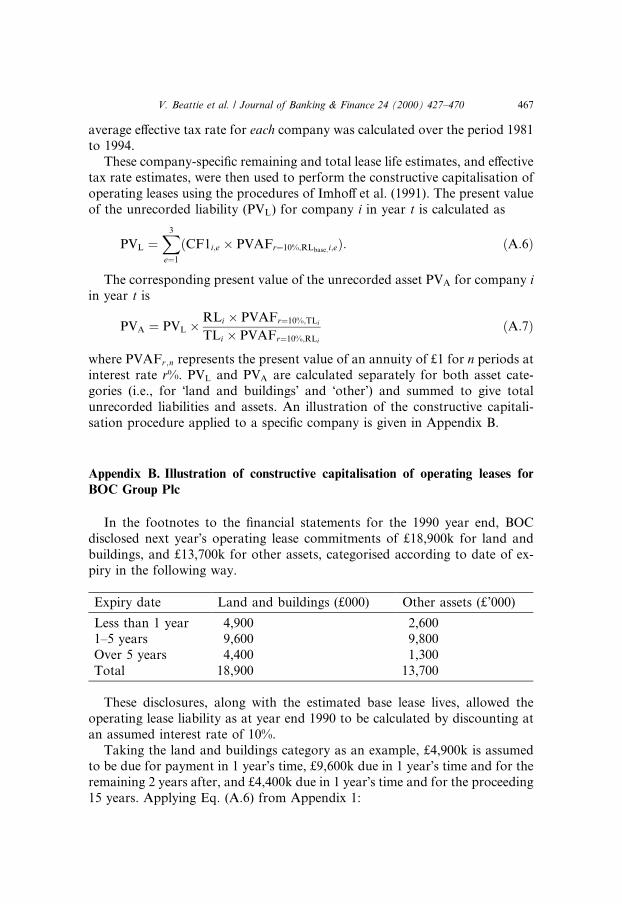
average e�ective tax rate for each company was calculated over the period 1981to 1994.
These company-speci®c remaining and total lease life estimates, and e�ectivetax rate estimates, were then used to perform the constructive capitalisation ofoperating leases using the procedures of Imho� et al. (1991). The present valueof the unrecorded liability (PVL) for company i in year t is calculated as
PVL �X3
e�1
�CF1i;e � PVAFr�10%;RLbase;i;e�: �A:6�
The corresponding present value of the unrecorded asset PVA for company iin year t is
PVA � PVL �RLi � PVAFr�10%;TLi
TLi � PVAFr�10%;RLi
�A:7�
where PVAFr ;n represents the present value of an annuity of £1 for n periods atinterest rate r%. PVL and PVA are calculated separately for both asset cate-gories (i.e., for Ôland and buildingsÕ and ÔotherÕ) and summed to give totalunrecorded liabilities and assets. An illustration of the constructive capitali-sation procedure applied to a speci®c company is given in Appendix B.
Appendix B. Illustration of constructive capitalisation of operating leases for
BOC Group Plc
In the footnotes to the ®nancial statements for the 1990 year end, BOCdisclosed next yearÕs operating lease commitments of £18,900k for land andbuildings, and £13,700k for other assets, categorised according to date of ex-piry in the following way.
These disclosures, along with the estimated base lease lives, allowed theoperating lease liability as at year end 1990 to be calculated by discounting atan assumed interest rate of 10%.
Taking the land and buildings category as an example, £4,900k is assumedto be due for payment in 1 yearÕs time, £9,600k due in 1 yearÕs time and for theremaining 2 years after, and £4,400k due in 1 yearÕs time and for the proceeding15 years. Applying Eq. (A.6) from Appendix 1:
Expiry date Land and buildings (£000) Other assets (£'000)
Less than 1 year 4,900 2,6001±5 years 9,600 9,800Over 5 years 4,400 1,300Total 18,900 13,700
V. Beattie et al. / Journal of Banking & Finance 24 (2000) 427±470 467
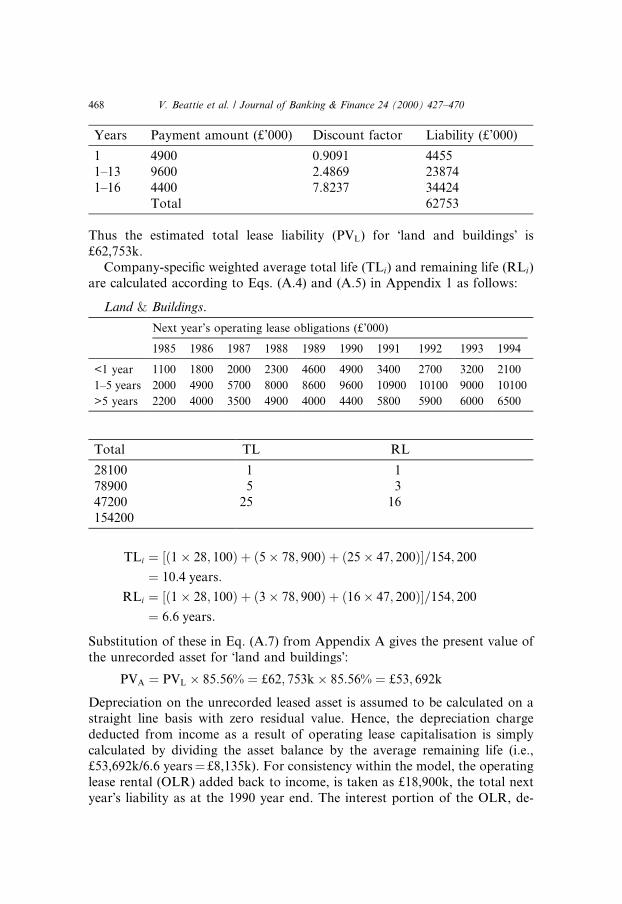
Thus the estimated total lease liability (PVL) for Ôland and buildingsÕ is£62,753k.
Company-speci®c weighted average total life (TLi) and remaining life (RLi)are calculated according to Eqs. (A.4) and (A.5) in Appendix 1 as follows:
Land & Buildings.
TLi � ��1� 28; 100� � �5� 78; 900� � �25� 47; 200��=154; 200
� 10:4 years:
RLi � ��1� 28; 100� � �3� 78; 900� � �16� 47; 200��=154; 200
� 6:6 years:
Substitution of these in Eq. (A.7) from Appendix A gives the present value ofthe unrecorded asset for Ôland and buildingsÕ:
PVA � PVL � 85:56% � £62; 753k� 85:56% � £53; 692k
Depreciation on the unrecorded leased asset is assumed to be calculated on astraight line basis with zero residual value. Hence, the depreciation chargededucted from income as a result of operating lease capitalisation is simplycalculated by dividing the asset balance by the average remaining life (i.e.,£53,692k/6.6 years� £8,135k). For consistency within the model, the operatinglease rental (OLR) added back to income, is taken as £18,900k, the total nextyearÕs liability as at the 1990 year end. The interest portion of the OLR, de-
Years Payment amount (£'000) Discount factor Liability (£'000)
1 4900 0.9091 44551±13 9600 2.4869 238741±16 4400 7.8237 34424
Total 62753
Next year's operating lease obligations (£'000)
1985 1986 1987 1988 1989 1990 1991 1992 1993 1994
<1 year 1100 1800 2000 2300 4600 4900 3400 2700 3200 2100
1±5 years 2000 4900 5700 8000 8600 9600 10900 10100 9000 10100
>5 years 2200 4000 3500 4900 4000 4400 5800 5900 6000 6500
Total TL RL
28100 1 178900 5 347200 25 16154200
468 V. Beattie et al. / Journal of Banking & Finance 24 (2000) 427±470
ducted from income, is calculated as 10% of the liability at the beginning of1990, i.e.,
Interest � 10%� Liabilitystart 1990
� 10%� �Liabilityend 1990 �OLR�=1:1
� 10%� �62; 753k� 18; 900k�=1:1
� £7; 423k:
Thus, of the £18,900k operating lease rental liability, £7,423k relates to interestand the remaining £11,477k represents capital repayment.
References
Adedeji, A., Stapleton, R.C., 1996. Leases debt and taxable capacity. Applied Financial Economics
6, 71±83.
Ang, J., Peterson, P.P., 1984. The leasing puzzle. Journal of Finance 39, 1055±1065.
ASC, 1984. Accounting for leases and hire purchase contracts, Statement of Standard Accounting
Practice No. 21, Accounting Standards Committee, London.
Barclay, M.J., Smith Jr., C.W., 1995. The priority structure of corporate liabilities. Journal of
Finance 50, 899±917.
Bayless, M.E., Diltz, J.D., 1986. An empirical study of the debt displacement e�ects of leasing.
Financial Management 15, 53±60.
Beattie, V.A., Edwards, K., Goodacre, A., 1998. The impact of constructive operating lease
capitalisation on key accounting ratios. Accounting and Business Research 28, 233±254.
Bradley, M., Jarrell, G., Kim, E., 1984. On the existence of an optimal capital structure theory and
evidence. Journal of Finance 39, 857±878.
Brown, S.J., Goetzmann, W., Ibbotson, R.G., Ross, S.A., 1992. Survivorship bias in performance
studies. Review of Financial Studies 5, 553±580.
Donaldson, G., 1961. Corporate debt capacity: A study of corporate debt policy and the
determination of corporate debt capacity, Harvard Graduate School of Business Administra-
tion, Boston.
Drury, C., Braund, S., 1990. The leasing decision: A comparison of theory and practice.
Accounting and Business Research 20, 179±191.
Ely, K.M., 1995. Operating lease accounting and the marketÕs assessment of equity risk. Journal of
Accounting Research 33 (2), 397±415.
Ferri, M., Jones, W., 1979. Determinants of ®nancial structure: A new methodological approach.
Journal of Finance 33, 657±669.
Graham, J.R., Lemmon, M.L., Schallheim, J.S., 1998. Debt, leases, taxes and the endogeneity of
corporate tax status. Journal of Finance 53, 131±162.
Grinblatt, M., Titman, S., 1998. Financial markets and corporate strategy, Irwin/McGraw-Hill,
New York, USA.
Hull, J.C., Hubbard, G.L., 1980. Lease evaluation in the UK: Current theory and practice. Journal
of Business Finance and Accounting 7, 619±637.
Imho�, E.A., Lipe, R.C., Wright, D.W., 1991. Operating leases: Impact of constructive
capitalization. Accounting Horizons 5, 51±63.
Imho�, E.A., Lipe, R.C., Wright, D.W., 1997. Operating leases: Income e�ects of constructive
capitalization. Accounting Horizons 11, 12±32.
V. Beattie et al. / Journal of Banking & Finance 24 (2000) 427±470 469

Kare, D.D., Herbst, A.F., 1990. The in¯uence of pro®tability on a ®rmÕs lease-or-borrow decision.
Advances in Accounting 8, 25±36.
Lewis, C.M., Schallheim, J.S., 1992. Are debt and leases substitutes? Journal of Financial and
Quantitative Analysis 27, 497±512.
Marsh, P., 1982. The choice between equity and debt: An empirical study. Journal of Finance 37,
121±144.
Marston, F., Harris, R.S., 1988. Substitutability of leases and debt in corporate capital structures.
Journal of Accounting, Auditing and Finance 3, 147±164.
McGregor, W., 1996. Accounting for leases: A new approach., Financial Accounting Standards
Board, Stamford, CT.
Mehran, H., Taggart, R.A., Yermack, D., 1997. CEO ownership, leasing and debt ®nancing,
Working Paper.
Myers, S.C., 1977. Determinants of corporate borrowing. Journal of Financial Economics 5, 147±
176.
Myers, S., Majluf, N., 1984. Corporate ®nancing and investment decisions when ®rms have
information investors do not have. Journal of Financial Economics 13, 187±221.
Rajan, R.G., Zingales, L., 1995. What do we know about capital structure choice. Some evidence
from international data. Journal of Finance 50, 1421±1460.
Remmers, L., Stonehill, A., Wright, R., Beekhuisen, T., 1975. Industry and size as debt ratio
determinants in manufacturing internationally. Financial Management 3, 24±32.
Scott Jr., D.F, 1972. Evidence on the importance of ®nancial structure. Financial Management 1,
45±50.
Sharpe, S.A., Nguyen, N.H., 1995. Capital market imperfections and the incentive to lease. Journal
of Financial Economics 39, 271±294.
Smith, C.W., Wakeman, L.M., 1985. Determinants of corporate leasing policy. Journal of Finance
40, 895±908.
Stulz, R.M., Johnson, H., 1985. An analysis of secured debt. Journal of Financial Economics 14,
501±521.
Titman, S., Wessels, R., 1988. The determinants of capital structure choice. Journal of Finance 43,
1±19.
Ward, C.W.R., 1983. Property lease-or-buy decisions. Accounting and Business Research 13, 143±
149.
White, H., 1980. A heteroskedasticity-covariance matrix estimator and a direct test for
heteroskedasticity. Econometrica 48, 817±838.
Wilkins, T., Zimmer, I., 1983a. The e�ect of leasing and di�erent methods of accounting for leases
on credit evaluations. The Accounting Review 58, 749±764.
Wilkins, T., Zimmer, I., 1983b. The e�ects of alternative methods of accounting for leases ± an
experimental study. Abacus 19, 64±75.
Wilkins, T., 1984. A behavioural investigation of alternative methods of ®nancing capital
acquisitions and lease capitalisation. Accounting and Business Research 14, 359±366.
Williamson, O.E., 1988. Corporate ®nance and corporate governance. Journal of Finance 43, 567±
591.
470 V. Beattie et al. / Journal of Banking & Finance 24 (2000) 427±470