Operable Unit 3-13, Group 3, Other Surface Soils ... · 4.1.4 Field Equipment Calibration and Setup...
60
DOE/ID-11090 Revision 1 Operable Unit 3-13, Group 3, Other Surface Soils Remediation Sets 1-3 (Phase I) Characterization Plan September 2005
Transcript of Operable Unit 3-13, Group 3, Other Surface Soils ... · 4.1.4 Field Equipment Calibration and Setup...

DOE/ID-11090
Revision 1
Operable Unit 3-13, Group 3, Other Surface Soils Remediation Sets 1-3 (Phase I) Characterization Plan
September 2005

DOE/ID-11090
Revision 1
September 2005
Operable Unit 3-13, Group 3, Other Surface
Soils Remediation Sets 1-3 (Phase I)
Characterization Plan

DOE/ID-11090Revision 1
Project No. 23083
Operable Unit 3-13, Group 3 Other Surface Soils Remediation Sets 1-3 (Phase I)
Characterization Plan
September 2005
Prepared for the U.S. Department of Energy
Idaho Operations Office

iii
ABSTRACT
This Characterization Plan was developed for the Operable Unit 3-13,
Group 3, Other Surface Soils, Remediation Sets 1-3 (Phase I) remediation
activities for the Idaho Nuclear Technology and Engineering Center at the Idaho
National Engineering and Environmental Laboratory. This plan, which supports
the Group 3 Remedial Design/Remedial Action Work Plan, identifies the
characterization data necessary to
1. Determine whether the sites require remediation
2. Determine whether waste can be disposed of at the INEEL CERCLA Disposal
Facility landfill
3. Determine if waste that requires remediation and for which I-129 is suspected
can be disposed of in the INEEL CERCLA Disposal Facility landfill.
It also establishes the procedures and requirements that will be used to
perform characterization sampling and analysis, as well as minimize health and
safety risks to persons performing the sampling activities at the 10 Group 3,
Phase I release sites.

iv

v
CONTENTS
ABSTRACT.................................................................................................................................................iii
ACRONYMS............................................................................................................................................... ix
1. INTRODUCTION...........................................................................................................................1-1
1.1 Project Objectives...............................................................................................................1-1
1.2 Site Description ..................................................................................................................1-1
1.2.1 The Idaho National Engineering and Environmental Laboratory.......................1-2
1.2.2 INTEC—Waste Area Group 3............................................................................1-2
1.2.3 Operable Unit 3-13, Group 3, Other Surface Soils.............................................1-2
1.3 Scope ..................................................................................................................................1-5
2. PROJECT ORGANIZATION AND RESPONSIBILITIES ...........................................................2-1
3. DATA QUALITY OBJECTIVES...................................................................................................3-1
3.1 Problem Statement..............................................................................................................3-1
3.2 Principal Study Questions and Decision Statements..........................................................3-1
3.3 Decision Inputs...................................................................................................................3-2
3.4 Study Boundaries................................................................................................................3-3
3.5 Decision Rules....................................................................................................................3-3
3.6 Decision Error Limits .........................................................................................................3-6
3.7 Design Optimization...........................................................................................................3-6
3.7.1 Decision Statement 1 ..........................................................................................3-7
3.7.2 Decision Statement 2 ..........................................................................................3-9
3.7.3 Decision Statement 3 ........................................................................................3-10
3.7.4 Site-Specific Sampling Design Strategy...........................................................3-12
3.8 Measurement Performance Criteria..................................................................................3-18
3.8.1 Precision ...........................................................................................................3-19
3.8.2 Accuracy ...........................................................................................................3-19
3.8.3 Detection Limits ...............................................................................................3-20
3.8.4 Completeness ....................................................................................................3-22
3.8.5 Comparability ...................................................................................................3-22
3.8.6 Representativeness............................................................................................3-22
3.9 Data Quality .....................................................................................................................3-23

vi
3.10 Data Validation.................................................................................................................3-23
4. SAMPLE COLLECTION, ANALYSIS, AND DATA MANAGEMENT .....................................4-1
4.1 Sample Collection ..............................................................................................................4-1
4.1.1 Presampling Meeting ..........................................................................................4-1
4.1.2 Sampling and Analysis Requirements ................................................................4-1
4.1.3 Sampling Documentation and Equipment ..........................................................4-1
4.1.4 Field Equipment Calibration and Setup..............................................................4-4
4.1.5 Sample Designation and Labeling ......................................................................4-4
4.1.6 Sample Containers ..............................................................................................4-5
4.1.7 Sample Preservation ...........................................................................................4-6
4.1.8 Chain-of-Custody................................................................................................4-6
4.1.9 Sample Collection Procedures ............................................................................4-6
4.1.10 Equipment Decontamination Procedures............................................................4-7
4.1.11 Sample Transport................................................................................................4-7
4.1.12 Waste Management.............................................................................................4-7
4.2 Sample Analysis .................................................................................................................4-7
4.2.1 Analytical Methods.............................................................................................4-7
4.2.2 Instrument Calibration Procedures .....................................................................4-8
4.2.3 Laboratory Records.............................................................................................4-8
4.3 Data Management and Document Control .........................................................................4-8
4.3.1 Data Reporting....................................................................................................4-8
4.3.2 Data Validation...................................................................................................4-9
4.3.3 Data Quality Assessment ....................................................................................4-9
4.3.4 Document Control...............................................................................................4-9
5. REFERENCES................................................................................................................................5-1
FIGURES
1-1. Location of the Idaho National Engineering and Environmental Laboratory....................................1-3
1-2. Operable Unit 3-13, Group 3, Other Surface Soils, Remediations Sets 1-3 (Phase I) sites...............1-4
3-1. Proposed characterization sampling locations for CPP-97 ..............................................................3-14
3-2. Proposed characterization sampling locations for CPP-37B and CPP-37C.....................................3-17

vii
TABLES
1-1. Operable Unit 3-13 soil remediation goals ........................................................................................1-5
1-2. Operable Unit 3-13, Group 3, Other Surface Soils (Phase I) sites.....................................................1-6
3-1. Data requirements for the Operable Unit 3-13, Group 3 soil sites.....................................................3-4
3-2. Sampling strategy for CPP-92, -98, -99 soil waste boxes................................................................3-15
3-3. Analytical performance requirements for the Operable Unit 3-13, Group 3 sites ...........................3-18
3-4. Analytical methods and detection limits for each contaminant of potential concern ......................3-21
3-5. Quality assurance/quality control samples.......................................................................................3-23
4-1. Sampling bottles, preservation types, and holding times...................................................................4-5

viii

ix
ACRONYMS
AA alternative action
ALS alpha spectrometry
CERCLA Comprehensive Environmental Response, Compensation and Liability Act
CFR Code of Federal Regulations
COC contaminant of concern
COPC contaminant of potential concern
CPP Chemical Processing Plant
DAR document action request
DOE Department of Energy
DOT Department of Transportation
DQO data quality objective
DS decision statement
EA exposure area
EPA Environmental Protection Agency
FFA/CO Federal Facility Agreement and Consent Order
FSP field sampling plan
FTL field team leader
GFP gas flow proportional
GMS gamma spectrometry
HASP health and safety plan
HDPE high-density polyethylene
HPGe high-purity germanium
ICDF INEEL CERCLA Disposal Facility
ICP Idaho Completion Project
IDEQ Idaho Department of Environmental Quality

x
IEDMS Integrated Environmental Data Management System
IH industrial hygienist
INEEL Idaho National Engineering and Environmental Laboratory
INTEC Idaho Nuclear Technology and Engineering Center
LEPS low-energy photon spectrometry
LSC liquid scintillation counting
MDA minimum detectable activities
MDL method detection limits
MQO measurement quality objective
OU operable unit
PM project manager
PSQ principal study question
QA quality assurance
QAPjP quality assurance project plan
QC quality control
RA remedial action
RCRA Resource Conservation and Recovery Act
RD/RA remedial design/remedial action
RG remediation goal
ROD Record of Decision
SAM Sample and Analysis Management
SAP sampling and analysis plan
SC sample custodian
SOW statement of work
SVOC semivolatile organic compound
TAL target analyte list

xi
TOS task order statement of work
UCL upper confidence limit
UTS universal treatment standard
VOC volatile organic compound
WAC Waste Acceptance Criteria
WAG waste area group

xii
1-1
Operable Unit 3-13, Group 3, Other Surface Soils Remediation Sets 1-3 (Phase I)
Characterization Plan
1. INTRODUCTION
This Characterization Plan was prepared for the Operable Unit (OU) 3-13, Group 3, Other Surface
Soils, Remediation Sets 1-3 (Phase I) remediation activities for the Idaho Nuclear Technology and
Engineering Center (INTEC) at the Idaho National Engineering and Environmental Laboratory (INEEL).
This plan identifies the characterization data necessary for material profiling, remediation, and disposal
decisions for 10 release sites (Group 3, Phase I sites, Remediation Sets 1, 2, and 3) consisting mainly of
contaminated soils at INTEC.
This plan is a necessary component of the Remedial Design/Remedial Action (RD/RA) Work
Plan (WP) (DOE-ID 2004a) developed for the OU 3-13, Group 3, remediation activities. Data quality
objectives (DQOs) are outlined, and data collection, analysis, and management requirements are
provided. Components of the project Health and Safety Plan (HASP) (INEEL 2004) are referenced
(i.e., health and safety requirements, training, site control and security, and emergency response and
notification).
This plan was developed using the U.S. Environmental Protection Agency (EPA) publication
Guidance for Conducting Remedial Investigations and Feasibility Studies under the Comprehensive Environmental Response, Compensation, and Liability Act (EPA 1988) and meets the requirements of
the Federal Facility Agreement and Consent Order (FFA/CO) (DOE-ID 1991).
1.1 Project Objectives
The objective of the characterization activities described in this plan is to verify that soil and debris
in OU 3-13, Group 3, Phase I remediation sites exceeding the remediation goals (RGs) established in the
OU 3-13 Record of Decision (ROD) (DOE-ID 1999) meet the Waste Acceptance Criteria (WAC) for
disposal at the INEEL CERCLA Disposal Facility (ICDF). This plan describes the sampling necessary to
1. Determine whether the sites require remediation
2. Determine whether the wastes can be disposed of at the ICDF landfill
3. Determine if waste requiring remediation for which I-129 is suspected can be disposed of in the
ICDF landfill.
This document is implemented with the current revision of the Quality Assurance Project Plan for Waste Area Groups 1, 2, 3, 4, 5, 6, 7, 10, and Inactive Sites (QAPjP) (DOE-ID 2002a). This document
governs all work at the characterization sites performed by INEEL employees, subcontractors, and
employees of other companies or U.S. Department of Energy (DOE) laboratories.
1.2 Site Description
Site description covers the INEEL Site, the relevant waste area group (WAG), and the WAG group
with the three remediation sets.

1-2
1.2.1 The Idaho National Engineering and Environmental Laboratory
The INEEL encompasses 2,305 km2 (890 mi
2) and is located approximately 55 km (34 mi)
west of Idaho Falls, Idaho (Figure 1-1). The United States Atomic Energy Commission, now the DOE,
established the Nuclear Reactor Testing Station, now the INEEL, in 1949 as a site for building and
testing nuclear facilities. At present, the INEEL supports the engineering and operations efforts of DOE
and other federal agencies in areas of nuclear safety research, reactor development, reactor operations
and training, nuclear defense materials production, waste management and technology development,
and energy technology and conservation programs.
1.2.2 INTEC—Waste Area Group 3
The INTEC is located in the south central portion of the INEEL approximately 13 km (8 mi) north
of the southern INEEL boundary and covers an area of 0.4 km2 (0.15 mi
2). Operations commenced at
INTEC in 1953. INTEC has historically been a uranium reprocessing facility for both defense projects
and research while also acting as a storage facility for spent nuclear fuel. While reprocessing activities at
INTEC were phased out in the 1990s, the facility continues to receive and store spent nuclear fuel and
radioactive wastes for future disposition.
The INTEC is designated as WAG 3, which was subdivided into 13 OUs that were investigated for
contaminant releases to the environment. Fifty-five contaminant release sites were identified within
OU 3-13 requiring remedial action (RA) to mitigate risks to human health and the environment under a
future residential use scenario. These sites were organized into seven groups that share common
characteristics and contaminant sources. Group 3, Other Surface Soils, is further divided into Remediation
Sets 1 through 7. Ten of the 55 release sites are included in Sets 1, 2, and 3. The characterization and
remediation of Sets 1, 2, and 3 are to be completed as Phase I of the OU 3-13, Group 3, Other Surface
Soils, remediation project. The remaining release sites will be addressed during the Phase II activities.
1.2.3 Operable Unit 3-13, Group 3, Other Surface Soils
Remediation Sets 1, 2, and 3 include 10 release sites (CPP-97, CPP-92, CPP-99, CPP-98,
CPP-37B, CPP-37C, CPP-03, CPP-37A, CPP-67, and CPP-34A/B) consisting of tarp-covered soil
stockpiles, boxed soil and debris, gravel pits with debris, in-place contaminated staging area soil,
infiltration ponds, and disposal trenches (Figure 1-2). Soil and debris wastes are the result of onsite
operations, and maintenance and upgrade projects (e.g., tank farm upgrade, CPP-603 cleanup,
miscellaneous excavation projects).
Contaminants within OU 3-13, Group 3 include both chemical and radionuclide constituents.
The OU 3-13 ROD identifies contaminants of concern (COCs) for Group 3 to include americium-241;
cesium-137; europium-152 and -154; plutonium-238, -239, -240, and -241; strontium-90; and mercury
(Hg) (DOE-ID 1999). The RGs are established in the ROD for each of these soil COCs and listed in
Table 1-1.

1-3
Figure 1-1. Location of the Idaho National Engineering and Environmental Laboratory.

1-4
Percolation Pond #1YDG-326
Percolation Pond #2YDG-327
CPP-34A
CPP-34B
CPP-37A
CPP-37B
CPP-37C
CPP-03
CPP-67
CPP-92, 98, 99
NO
RT
H
CPP-97N696450E297675
N696375E297750
N696250E297750
N696450E297525
N696250E297450
N696350E297450
Figure 1-2. Operable Unit 3-13, Group 3, Other Surface Soils, Remediations Sets 1-3 (Phase I) sites.

1-5
Table 1-1. Operable Unit 3-13 soil remediation goals.
Contaminant of Concern
Soil Risk-Based RGa
for Single COCsb
(mg/kg or pCi/g)
Hg 23
Am-241 290
Cs-137 23
Eu-152 270
Eu-154 5,200
Pu-238 670
Pu-239/240 250
Pu-241 56,000
Sr-90 223
a. Source of risk-based soil remediation goals: Table 8-1 of the OU 3-13 Record of Decision (DOE-ID 1999).
b. If multiple contaminants are present, use a sum of the fractions to determine the combined COC remediation goal.
Site descriptions, waste types, COCs, waste stream constituents, and process knowledge summaries
are provided in Table 1-2. In-depth site descriptions and discussion of process knowledge, and
preliminary sampling and characterization efforts are contained in Section 3 of the RD/RA Work Plan
(DOE-ID 2004a). This information is based on data from various INEEL documents including the
Comprehensive RI/FS for the Idaho Chemical Processing Plant OU 3-13 at the INEEL–Part A, RI/BRA
Report (Final) (DOE-ID 1997), the ROD (DOE-ID 1999), and Operable Unit 3-13, Group 3, Other Surface Soils, Prioritization and Site Grouping Report (DOE-ID 2002b).
1.3 Scope
The scope of this characterization activity is to determine if additional sampling is necessary at the
Group 3 sites and to provide a compilation of analytical results necessary for establishing site boundaries
and completing waste profiles for disposal at the ICDF. The scope includes all data collection activities,
laboratory analyses, data quality, and data management and storage.
Characterization activities will also include I-129 analysis for those sites where I-129 is present.
I-129 was identified as a required analysis in the ICDF Complex Waste Verification Sampling and Analysis Plan (SAP) (DOE-ID 2003). Because of its risk to groundwater, ICDF limits the mass of I-129
allowed to be disposed in its facility to 2.4 Ci. Therefore, I-129 mass will be quantified for the Group 3
sites suspected of having detectable I-129.

1-6
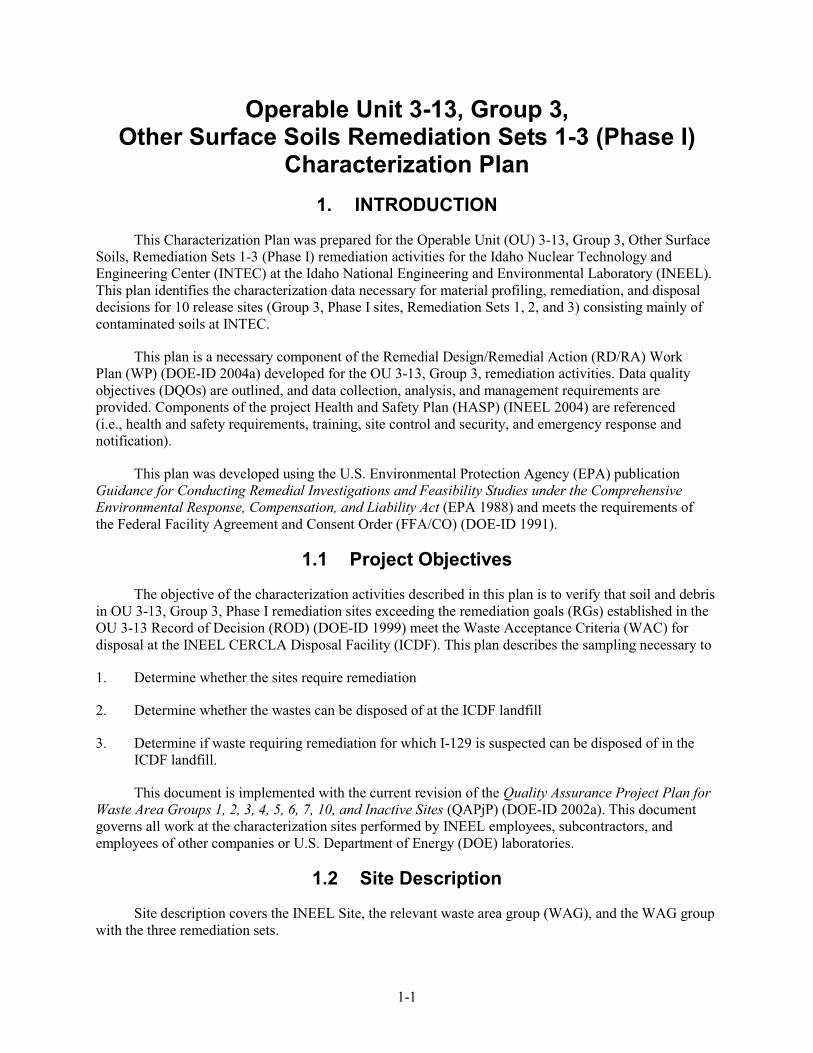
Table 1-2. Operable Unit 3-13, Group 3, Other Surface Soils (Phase I) sites.
Site Description
Waste Type/
Description
COCs Exceeding
Soil RGsa
Process Knowledge
Remediation Set 1
CPP-97 Tank farm soil stockpile—
two tarp-covered
stockpiles and
contaminated surface soil
Soil
Pile 1—0-3 mR/hr
Pile 2—3-50 mR/hr
Cs-137, Sr-90
No data for Eu-152
and Pu-241
Indicates source of the waste is from tank
farm upgrade.
CPP-92 Boxed soil—653 boxes Soil (primary), debris, and
personal protective
equipment
Cs-137, Sr-90
No data for Pu-241
Indicates source of waste is from tank farm
upgrade and other excavations at INTEC.
CPP-99 Boxed soil—58 boxes Soil, concrete, metal, wood,
and other noncompactable
debris
Cs-137, Sr-90b
Indicates source of waste is from tank farm
upgrade and CPP-604 tunnel excavation.
CPP-98 Tank farm shoring
boxes—119 boxes
Soil, wood, metal Cs-137, Sr-90b
Indicates source of waste is from tank farm
upgrade.
Remediation Set 2
CPP-37B Gravel pit and debris
landfill inside INTEC
fence—received sewage
water pre-1982,
construction debris post-
1982
Soil (primary), minor
debris, and personal
protective equipment
No data for Eu-152,
Eu-154, and Pu-241c
Indicates low volumes of water discharged
to the pits, but believed to contain
radionuclides, and may have also
contained chemical waste; may have
received radioactive steam from the
High-Level Liquid Waste Tank Farm.
CPP-37C Contamination southeast
of CPP-37B—discovered
during culvert excavation
Soil and rock (primary),
concrete, plywood, plastic,
pipe
No data for Eu-152,
Eu-154, and Pu-241d
Indicates this site is not an extension of
CPP-37B, but was used to dispose of
construction debris.
Remediation Set 3
CPP-03 Temporary storage area
southeast of CPP-603
Soil Cs-137
No data for Hg and
Pu-241
Indicates this site was used to store old and
abandoned radioactively contaminated
equipment, as well as temporary storage
for soil from WL-102 tank replacement
project.
1-7
Site Description
Waste Type/
Description
COCs Exceeding
Soil RGsa
Process Knowledge
CPP-37A Gravel pit outside INTEC
fence
Soil (primary), personal
protective equipment,
debris, sampling equipment
Nonee Indicates this site was used as a
decontamination area for construction
equipment, as a percolation pond for
INTEC service wastewater, as well as
INTEC stormwater runoff.
CPP-67 Percolation Ponds 1 and 2 Soil SWP-1 - Cs-137, Hg
No data for Eu-152,
Eu-154, and Pu-241
SWP-2 – Cs-137
No data for Eu-152,
Eu-154, and Pu-241
Indicates these received service
wastewater containing trace amounts of
radioactivity.
CPP-34A/B Soil storage areas
(disposal trenches) in
northeast corner INTEC
Soil Cs-137, Sr-90
No data for Eu-152,
Eu-154, Pu-239, and
Pu-241
Indicates this site was used to store soil
from around the WL-102 tank excavation.
a. RGs obtained from OU 3-13 ROD (DOE-ID 1999).
b. Soil COCs exceeding RGs for Sites CPP-98 and CPP-99 are assumed to be representative of the expected COCs for CPP-97 and CPP-92.
c. All soil COCs except for Eu-152, Eu-154, and Pu-241 were analyzed during previous characterization efforts of CPP-37B and were found to be less than RGs; however, the OU 3-13 ROD states
that because this site was previously used as a landfill, there is insufficient characterization to recommend no further action.
d. All soil COCs except for Eu-152, Eu-154, and Pu-241 were analyzed during previous characterization efforts of the excavated soil generated during the Tank Farm Interim Action and were found
to be less than RGs.
e. An evaluation of data indicated no COCs exceed RGs, thus no remediation of this site is required as documented in the RD/RA Work Plan (DOE-ID 2004a).
COC = contaminant of concern
RD/RA = Remedial Design/Remedial Action
ROD = Record of Decision
SWP = Service Waste Pond
WP = Work Plan

1-8

2-1
2. PROJECT ORGANIZATION AND RESPONSIBILITIES
The project organization and responsibilities are identified and discussed in the HASP for the
OU 3-13, Group 3, Other Surface Soils Remediation Sets 1-3 (Phase I) (INEEL 2004).

2-2

3-1
3. DATA QUALITY OBJECTIVES
The DQO process, which is used to qualitatively and quantitatively specify the objectives for the
data collected, was designed as a specific planning tool to establish criteria for defensible
decision-making and to facilitate the design of the data acquisition efforts. The DQO process is described
in the U.S. Environmental Protection Agency (EPA) document Data Quality Objective Process for
Hazardous Waste Site Investigations (EPA 2000). The DQO process includes seven steps, each of which
has specific outputs. These steps are outlined in the following sections.
3.1 Problem Statement
The problem statement is intended to define the problem so that the focus of the sampling and
analysis will be unambiguous. The problem statement for the Group 3 sites RA is three-fold. Sampling is
required to
Determine whether sites require remediation
Determine whether the wastes can be disposed of at the ICDF landfill
Determine if those wastes requiring remediation for which I-129 is suspected can be disposed of in
the ICDF landfill.
3.2 Principal Study Questions and Decision Statements
This step in the DQO process identifies the decisions and actions that will be taken based on the
data collected. Principal study questions (PSQs) and alternative actions (AAs) that could result from
resolution of the PSQs are developed, and the PSQs and AAs are then combined into decision statements
(DSs). The objective of this characterization activity is to answer the PSQs.
The first objective of the sampling specified in this plan is to determine if remediation is required
for the sites. This objective is met by answering the following PSQ:
PSQ1: Do the COCs exceed the RGs?
The AAs to be taken, depending on the resolution to PSQ1, are as follows:
- AA1.1: If the COCs do not exceed the RGs, then no remediation is required.
- AA1.2: If the COCs exceed the RGs, then remediation is required.
Combining PSQ1 and the associated AAs results in the following DS:
DS1: Determine if the COCs do not exceed RGs or if remediation is required.
The second objective of the sampling specified in this plan is to determine whether the wastes can
be disposed of in the ICDF landfill. This objective is met by answering the following PSQ:
PSQ2: Can the waste, based on the waste profile, be disposed of in the ICDF landfill?

3-2
The AAs to be taken depending on the resolution to PSQ2 are as follows:
- AA2.1: If the waste can be disposed of, based on the RD/RA Work Plan, then no additional
sampling by the project is required prior to disposal of the waste.
- AA2.2: If the waste cannot be disposed of based on an inadequate waste profile, then collect
more samples in order to complete the waste profile prior to disposal of the waste.
Combining PSQ2 and the associated AAs results in the following DS:
DS2: Determine if the waste can be disposed of in the landfill, based on the waste profile, or if
additional sampling is required prior to disposal.
The third objective of the sampling specified in this plan is to determine if those wastes requiring
remediation for which I-129 is suspected can be disposed of in the ICDF landfill. To meet this objective
the following PSQ must be addressed:
PSQ3: Do process knowledge or the I-129 sample results indicate that the waste for each site to be
remediated and disposed of in the ICDF landfill meet the ICDF landfill WAC?
The AAs to be taken depending on the resolution to PSQ3 are as follows:
- AA3.1: For each of these sites, if process knowledge or sample results indicate that the waste
with I-129 contamination meets the ICDF landfill WAC, then the waste may be disposed of
in the landfill.
- AA3.2: For each of these sites, if process knowledge and sample results do not indicate that
waste with I-129 contamination meets the ICDF landfill WAC, then the waste may not be
disposed of in the landfill.
Combining PSQ3 and the associated AAs results in the following DS:
DS3: Determine whether the waste with I-129 contamination meets the ICDF landfill WAC, or
whether the waste cannot be disposed of in the ICDF landfill.
3.3 Decision Inputs
The purpose of this step is to identify informational inputs that will be required to resolve the DSs
and to determine which inputs require measurements.
The following information is required to resolve the three DSs identified above:
DS1—the identification and quantification of contaminants exceeding the soil COCs RG limits
DS2—the identification and quantification of contaminants in the waste stream
DS3—the volume of waste per site, the identification and quantification of I-129, and the ICDF
landfill WAC.

3-3
This plan provides a comparison of existing analytical data from previous sampling events with the
ICDF WAC requirements and the ROD RGs. In addition, it documents resulting areas where sufficient
data do not exist to support the associated decisions. Table 3-1 identifies the data gaps for each site
required to resolve the decision statements developed in Section 3.2. A detailed evaluation of the existing
data gaps for each site relative to the ICDF WAC and the ROD RGs is presented in Sections 3 and 5 and
the Appendix A tables of the RD/RA Work Plan (DOE-ID 2004a).
3.4 Study Boundaries
The primary objectives of this step are to identify the population of interest, define the spatial and
temporal boundaries that apply to each DS, define the scale of decision-making, and identify practical
constraints that must be considered in the sampling design. Implementing this step helps ensure that the
sampling design will result in the collection of data that accurately reflect the true condition of the site
under investigation.
The spatial boundaries are as identified in the Group 3, Phase I, RD/RA Work Plan
(DOE-ID 2004a). If new information becomes available, these boundaries may be adjusted.
The temporal boundaries are the projected dates that the characterization activities for each site
will be implemented, as identified in the RD/RA Work Plan. Results obtained from this sampling effort
will be considered adequate to answer the PSQs developed in Section 3.2.
There are no practical constraints expected to be encountered that would interfere with the
collection of adequate waste volumes for analyses. Any limitations on data quality and/or usability
resulting from sample collection constraints will be discussed in the data quality assessment report.
3.5 Decision Rules
The objective of this step is to define parameters of interest that characterize the population,
specify the action level, and integrate previous DQO outputs into a single statement that defines the
conditions that would cause the decision-maker to choose among AAs. The decision rule typically takes
the form of an “If…then” statement describing the action to take if one or more conditions are met.
The decision rule is specified in relation to a statistical parameter that characterizes the population
of interest. The parameter of interest for the WAG 3, Group 3 waste samples will be the true mean
concentration, as estimated by the 95% upper confidence limit (UCL) of the sample mean of the COCs.
Therefore, the sample statistic of interest for the wastes will be the 95% UCL of the sample mean
concentration for each COC exceeding the RGs.
The decision rules originating from the sampling objectives are as follows:
If the mean concentration for a contaminant at a site exceeds an RG or the sum of the fractions
exceeds the combined COC RG, then remediation of that site will be required.
If the mean concentration for a contaminant at a site does not exceed an RG or the sum of the
fractions does not exceed the combined COC RG, then remediation of that site is not required.

3-4
Table 3-1. Data requirements for the Operable Unit 3-13, Group 3 soil sites.
Decision Statement 1—
Determine if Remediation is Required Decision Statement 2—Waste Profile Decision Statement 3—I-129 Mass
Site Data Gap Additional Samples Required Data Gap Additional Samples Required Data Gap Additional Samples Required
CPP-97 None – Remediation is
required – Soils COCs are
greater than ROD RGs.
None.a Organics, inorganics, and radionuclides. Six samples.
The piles will be sampled at random locations on
the soil pile at the east, west, and south face of
each pile for a total of six samples.
No characterization data
available.
Three samples (smaller
stockpile).
Samples will be collected
during DQO-2 sampling.
CPP-92 None – Remediation is
required – Soils COCs are
greater than ROD RGs.
None.a Organics, inorganics, and radionuclides. The boxed soil will be segregated for sampling
purposes into three levels as stated in the text.
The sampling approach will include randomly
selecting approximately 5% of the boxes from
each level to be sampled, except for Level 3 in
which samples will be collected from all the
boxes.
Samples will then be collected from the boxes
and randomly composited in groups of two for
Levels 1 and 2 and in groups of three (all Level 3
boxes) for Level 3:
Level 1 – 24 boxes – 12 samples
Level 2 – 6 boxes – 3 samples
Level 3 – 3 boxes – 1 sample.
I-129 was detected in one
sample (from CPP-89).
59 samples
Three biased samples will be
collected from the >50-mR/hr
level and the remaining 56
samples will be randomly
collected from CPP-92 and
CPP-99.
CPP-98 None – Remediation is
required – Soils COCs are
greater than ROD RGs.
None.a No characterization data available.
b To be combined with CPP-92. No characterization data
available.b
To be combined with CPP-92.
CPP-99 None – Remediation is
required – Soils COCs are
greater than ROD RGs.
None.a No characterization data available.
b To be combined with CPP-92. No characterization data
available.b
To be combined with CPP-92.
CPP-37B All soil/GW COCsc/Tc-99 6 sample locations
8 sample depths
==> 48 samples.
None. None. None. NonedI-129 will be analyzed
under DQO#1.
CPP-37C All soil/GW COCse/Tc-99 11 sample locations
5 sample depths
==> 55 samples.
None. None. None. Noned–I-129 will be analyzed
under DQO#1.
CPP-37A Eu-152, Eu-154, Pu-241 None – Scaling, as described
in the ICDF Design Inventory
(EDF-ER-264), will be
performed to estimate
concentrations. The scaling
results will be included in the
RD/RA Work Plan
(DOE-ID 2004a).
None.d None.
d None.
d None.
d

Table 3-1. (continued).
3-5
Decision Statement 1—
Determine if Remediation is Required Decision Statement 2—Waste Profile Decision Statement 3—I-129 Mass
Site Data Gap Additional Samples Required Data Gap Additional Samples Required Data Gap Additional Samples Required
CPP-03 Hg, Pu-241 None.a None – Sufficient data are available to
complete a waste profile.
None. No characterization data
available.
Verification sampling will be
performed as described in
Section 3.7.3.
CPP-67 Pond #1 Eu-152, Eu-154, Pu-241 None.a None – Sufficient data are available to
complete a waste profile.
None. Ten I-129 samples were
collected and analyzed
from various depths at five
sample locations, but not
detected.
Verification sampling will be
performed as described in
Section 3.7.3 based on half of
the detection limit of the
existing I-129 data.
CPP-67 Pond #2 Eu-152, Eu-154, Pu-241 None.a None – Sufficient data are available to
complete a waste profile.
None. Ten samples were collected
and analyzed for I-129 with
detectable concentrations of
I-129.
Verification sampling will be
performed as described in
Section 3.7.3.
CPP-34A/B Eu-152, Eu-154, P-239,
Pu-241
None.a None – Sufficient data are available to
complete a waste profile.
None. Twenty samples were
collected and analyzed for
I-129 with nondetectable
concentrations.
Verification sampling will be
performed as described in
Section 3.7.3.
a. No additional sampling is required because RGs have been exceeded using Cs-137 as the indicator of contamination and remediation is required.
b. Data gaps for Sites CPP-98 and CPP-99 are assumed to be representative of the expected data gaps for CPP-97 and CPP-92.
c. Although characterization was previously performed for Site CPP-37B, the OU 3-13 ROD states that because the pit was used as a landfill, previous characterization is considered insufficient to recommend no further action. Therefore, characterization sampling will be performed for all soil
and groundwater COCs.
d. No remediation is planned for Sites CPP-37A, CPP-37B, and CPP-37C; therefore, no characterization for waste profiling of I-129 is planned. If remediation is required based on characterization efforts, then sufficient samples should be available to complete the waste profile.
e. Limited characterization was performed at Site CPP-37C; however, the extent of contamination at this site was not determined. Characterization sampling will be performed for all soil and groundwater COCs.
COC = contaminant of concern
RD/RA = Remedial Design/Remedial Action
RG = remediation goal
ROD = Record of Decision

3-6
And
If existing data confirm that the waste may be disposed of in the ICDF landfill, as evidenced by the
completion of the waste profile, then no additional data are required prior to disposal of the waste.
If existing data do not confirm that the waste may be disposed of in the ICDF landfill, as evidenced
by the lack of a waste profile, then additional data are required to complete the waste profile prior
to disposal of the waste.
And
If process knowledge or sample results indicate that the waste with I-129 contamination meets the
ICDF landfill WAC, then the waste may be disposed of in the landfill.
If process knowledge and sample results do not indicate that the waste with I-129 contamination
meets the ICDF landfill WAC, then the waste may not be disposed of in the landfill.
3.6 Decision Error Limits
Since analytical data can only estimate the true condition of the site under investigation, and, since
data are intrinsically variable, decisions based on measurement data could potentially be in error. For this
reason, the primary objective of this step is to determine which DSs, if any, require a statistically based
sample design.
Possible decision errors that can occur for the decisions associated with the three sampling
objectives at the WAG 3, Group 3 sites include
1. Determining that the site does not require remediation, when, in fact, COCs exceed the RGs for a
site
2. Disposal of waste in the ICDF landfill, when, in fact, the waste profile does not confirm the waste
may be disposed of there
3. Determining that the I-129-bearing waste can be disposed of in the landfill, when, in fact, the waste
exceeds the ICDF landfill WAC.
The possibility of decision error cannot be eliminated but it can be minimized, which is
accomplished by controlling the total sampling activity errors. Methods for controlling errors include
collecting a large number of samples (to control sampling design error), analyzing individual samples
several times, or using more precise analytical methods (to control measurement error). The chosen
method for reducing decision errors depends on where the greatest component of total error exists in the
data set and the ease in reducing the error contributed by those data components. The amount of effort
expended on controlling decision error is directly proportional to the consequences of making an error.
3.7 Design Optimization
The objective of this step is to identify the best sampling and analysis design that satisfies the
previous DQO steps. The activities required to optimize the design include
Review the outputs of the DQO steps and existing environmental data

3-7
Develop general data collection design alternatives
Formulate a mathematical expression needed to solve the design problem for each data collection
design alternative
Select the optimal number of samples to satisfy the DQOs for each data collection design
alternative
Select the most resource-effective data collection design that satisfies all the DQOs.
A review of the existing environmental data was performed for each site and data gaps were
identified. These results, discussed in detail in the RD/RA Work Plan (DOE-ID 2004a), form the basis for
the sampling designs presented in the following sections. The sampling design for each Phase I site is
discussed relative to the three decision statements developed in Section 3.2. The specific data required to
resolve each decision statement are identified in Table 3-1.
3.7.1 Decision Statement 1
Decision Statement 1 is as follows: Determine if remediation at the site is necessary. For those sites
with at least one soil COC 95% UCL for the true mean concentration greater than RGs, remediation is
required (Sites CPP-97, -92, -98, -99, -03, -67, and –34). The 95% UCL will be calculated assuming the
data follow a normal distribution. This assumption will be tested using the Shapiro-Wilk test. Data will be
transformed if necessary. If log-transformed data are normal, then the 95% UCL from the transformed
data will be compared to the log-transformed RG. The 95% UCL will be calculated as follows in
Equation (3-1):
n
stx n
2
1,95.0 (3-1)
where
x = the sample mean
1,95.0 nt = the 95th percentile of the t distribution with 1n degrees of freedom
2s = the sample variance
n = the number of sample results.
If a site(s) has not been sufficiently characterized to determine whether soil COC 95% UCLs are
greater than RGs, then additional characterization is necessary to determine whether remediation is
required. Sites CPP-37B and –37C will require additional characterization. The approach for
characterization of these sites will be performed in three phases:
The first phase will be a geophysical survey (ground-penetrating radar system) of the two sites to
determine the boundaries of the sites, extent of debris, and potentially confirm the pit edges (based
upon material density variations). Analysis of this nonphysical survey information will provide
information regarding the debris pit boundaries, provide the relative concentration of debris
disposal areas, and guide the selection of sample locations and test pits/trenches.
3-8
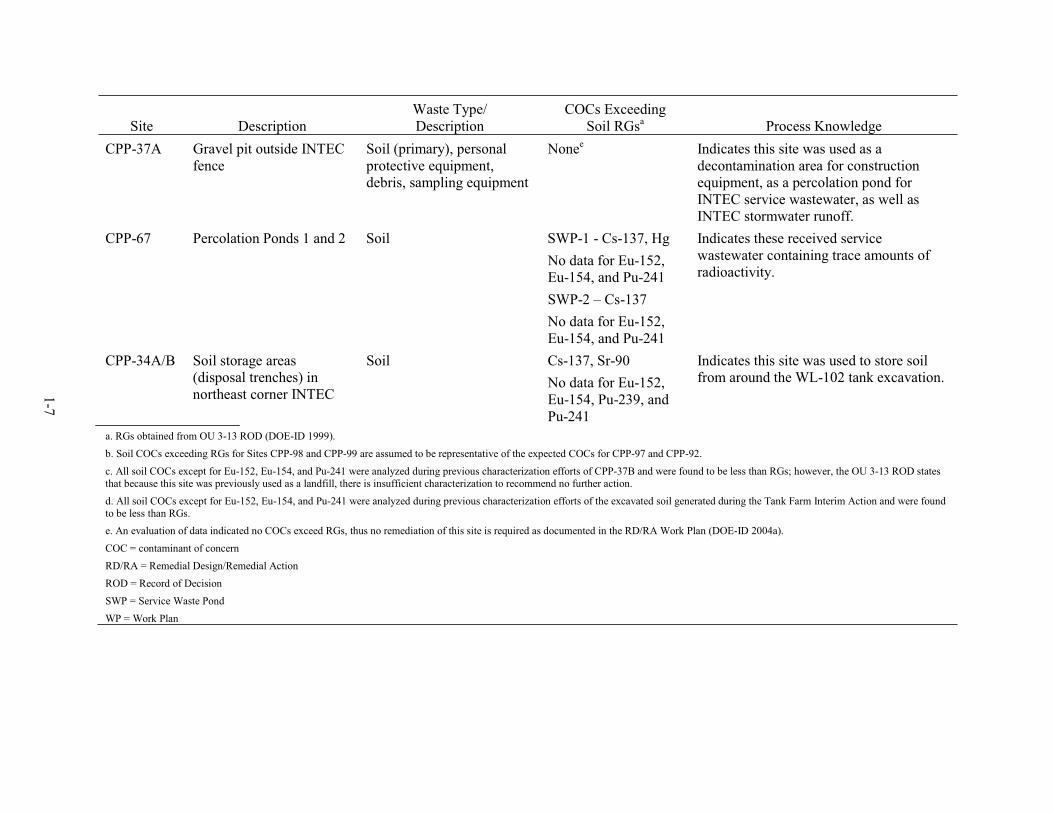
The second phase will consist of taking samples, analyzing for COCs, and determining 95% UCLs.
The number of sample results required will be determined by assuring that the 95% UCLs are
below the RGs. The following formula will be used, substituting best estimates of mean and
variance, and, if none are available, using EPA (2001) guidance:
2
645.1645.1 2
2
22
RGx
sn (3-2)
where the components are as defined above, and the arrow indicates the number of samples will be
rounded up to the next integer. The number of sample locations will be determined by dividing the
required number of results by the appropriate number of depths to be sampled. The sample
locations will be determined by dividing the site into equal-sized grids to allow for the proper
number of sample locations with one sample per grid-block. Then, biased sample locations will be
selected and samples will be collected from various depths (37B: 2, 5, 10, 15, 20, 25, 30 and 35 ft)
(37C: 2, 5, 10, 15, and 20) based upon previous sampling depths, historical photos of the waste
areas, and historical survey data of waste depths. The locations will be biased to avoid boring into
debris or previous sample locations, and yet retain representativeness over the site.
The third phase will consist of excavating test pits/trenches to extract buried debris for radiological
field screening and visual inspection to determine waste types by physical configuration (piping,
concrete, soil, building debris, etc.). There will be a maximum of three test pits in each of the
CPP-37B and CPP-37C areas. The test pits will be excavated to a maximum depth of 10 ft per the
ROD risk-driven depth determination. The screening data will be evaluated to determine the
disposition of the debris (e.g., leave in place or excavate and dispose at ICDF). Field-screening
using high-purity germanium detectors will be used during the test pit operation for real-time
characterization onsite to minimize sampling costs and provide faster results.
3.7.1.1 CPP-97. Previous sampling activities at CPP-97 focused primarily on radiation
measurements of the two soil piles themselves and gamma spectrometry measurements of the surrounding
surface area to define the site boundary. Radiological surveys have defined the lateral extent of Cs-137
contamination at this site and indicate that concentrations exceed the RGs for Cs-137 and Sr-90. No
additional sampling is required because Cs-137 is used as the indicator to determine if remediation is
required.
3.7.1.2 CPP-92. Existing data indicate that contaminant concentrations associated with this boxed
waste exceed the RGs for Cs-137 and Sr-90. Because all of the containers are slated for remediation,
additional sampling is not needed to determine if remediation is required.
3.7.1.3 CPP-98. Process knowledge indicates that the source of the CPP-98 boxed waste is from
the tank farm. No analytical data are available for this site specifically. However, data are available for
the corresponding contaminated soils excavated as part of the same projects (CPP-97 and CPP-92), which
are assumed to be representative data for this site. Because all of the containers contain debris, additional
sampling is not needed to determine if remediation is required.
3.7.1.4 CPP-99. Process knowledge indicates that the source of the CPP-99 boxed waste is from
the tank farm. No analytical data are available for this site specifically. However, data are available for
the corresponding contaminated soils excavated as part of the same projects (CPP-97 and CPP-92), which
are assumed to be representative data for this site. Because all of the containers are slated for remediation,
additional sampling is not needed to determine if remediation is required.

3-9
3.7.1.5 CPP-37B. The physical boundaries of this site are well defined based on previous site
investigations and some chemical and radiological data are available. However, the OU 3-13 ROD states
that since the pit was previously used as a landfill, the existing characterization data are insufficient.
Therefore, additional characterization is necessary to determine if remediation is required.
3.7.1.6 CPP-37C. This site, established in 2002, was insufficiently characterized to determine the
nature and extent of contamination. Therefore, additional characterization is needed to determine if
remediation is required.
3.7.1.7 CPP-03. The source of the waste at Site CPP-03 is associated with the releases from the
tank farm and Waste Calcining Facility condensate. Existing data are limited to radionuclides only and
indicate that the waste exceeds the RG for Cs-137. No additional sampling is required because Cs-137 is
used as the indicator to determine that remediation is required.
3.7.1.8 CPP-37A. Previous characterization sampling and process knowledge indicated that RGs
were not exceeded for the soil COCs. As described in the RD/RA Work Plan (DOE-ID 2004a),
remediation is not required at this site.
3.7.1.9 CPP-67. The existing data for this site indicate that the RGs for Cs-137 and mercury are
exceeded in Pond 1, and the RG for Cs-137 is exceeded in Pond 2. No additional sampling is required
because Cs-137 is used as the indicator to determine that remediation is required at this site.
3.7.1.10 CPP-34A/B. The existing data indicate that the RGs for Cs-137 and Sr-90 were exceeded
at this site. Although, there is no data for Eu-152, Eu-154, Pu-239, and Pu-241 (Table 3-1), no additional
sampling is required because Cs-137 is used as the indicator to determine that remediation is required at
this site.
3.7.2 Decision Statement 2
Decision Statement 2 is as follows: Determine if the waste can be disposed of in the landfill or if
additional sampling is required to complete a waste profile prior to disposal in the landfill.
For these soils, if inadequate data exist to prepare a waste profile, additional characterization will
be required. These requirements are presented for each site individually.
3.7.2.1 CPP-97. Because Cs-137 and Sr-90 concentrations in the stockpiled soils exceed their
respective RGs, this site will be remediated. However, the existing data are insufficient to complete a
waste profile for the resulting waste stream. Therefore, additional organic, inorganic, and radiological
data are required.
3.7.2.2 CPP-92. Because existing data indicate Cs-137 and Sr-90 concentrations in the boxed waste
exceed RGs, this site will be remediated. However, these data are insufficient to complete a waste profile
for the resulting waste stream. Therefore, additional organic, inorganic, and radiological data are required.
3.7.2.3 CPP-98. As described in Section 3.7.1.3, waste associated with Site CPP-98 corresponds
with Sites CPP-97 and CPP-92 soils, and the soil data for these sites are assumed to be representative of
debris waste in CPP-98. Because this waste stream is debris only, sampling for profiling purposes will not
be performed.

3-10
3.7.2.4 CPP-99. As described in Section 3.7.1.4, boxed waste associated with this site corresponds
with Sites CPP-97 and CPP-92 soils, but the data are insufficient to complete a waste profile for the
resulting CPP-99 waste stream. Organic, inorganic, and radiological data are required.
3.7.2.5 CPP-37B. As described in the RD/RA Work Plan (DOE-ID 2004a), no remediation is
planned for this site. Therefore, a waste profile is not required for disposal at the ICDF. If characterization
sampling identifies exceedences of RGs, the RD/RA Work Plan will be revised accordingly.
3.7.2.6 CPP-37C. As described in the RD/RA Work Plan, no remediation is planned for this site.
Therefore, a waste profile is not required for disposal at the ICDF. If characterization sampling identifies
exceedences of RGs, the RD/RA Work Plan will be revised accordingly.
3.7.2.7 CPP-03. Because the Cs-137 RG is exceeded for this site, remediation is required. Existing
data are sufficient to complete a waste profile.
3.7.2.8 CPP-37A. As described in the RD/RA Work Plan, no remediation is planned for this site.
Therefore, a waste profile is not required for disposal at the ICDF.
3.7.2.9 CPP-67. The RGs for Hg and Cs-137 are exceeded in Pond 1, and remediation is required.
Remediation is also required for Pond 2, as the RG for Cs-137 is exceeded. Existing data for both ponds
are sufficient to complete a waste profile.
3.7.2.10 CPP-34A/B. Because the RGs for Cs-137 and Sr-90 are exceeded, remediation of this site
is required. Existing data are sufficient to complete a waste profile.
3.7.3 Decision Statement 3
Decision Statement 3 is as follows: Determine whether the I-129-bearing waste meets the ICDF
landfill WAC, or whether the waste cannot be disposed of in the ICDF landfill.
Characterization of I-129 for Group 3 soils that are to be excavated may require a two-stage
approach: first, initial characterization, and, second, verification. Initial characterization first involves
determining if I-129 is suspected at the site, based on process knowledge. If process knowledge indicates
no I-129, then no further action is necessary (i.e., no second stage is necessary). If process knowledge
indicates possible I-129 contamination, then available sample results will be used to determine the level
of effort for the second stage sampling (verification).
The second stage is the additional characterization called for in the ICDF Complex Waste Verification Sampling and Analysis Plan (DOE-ID 2003) for those sites containing I-129. The stage
two sampling and the ICDF verification will be performed concurrently. Hereafter, the additional
sampling will be referred to as verification. The second stage sampling effort will be determined using
the ICDF Complex Waste Verification Sampling and Analysis Plan, based on stage one sample results,
as described below.
For sites believed to contain I-129, the stage one sample results will be used to determine the level
of effort for the second stage. The higher the sample concentration, the more verification samples will be
required. The stage two sampling applies to lots of waste not to exceed 5,000 yd3 and is based on the
simple exceedance rule described in EPA (1989, 2002). The simple exceedance rule provides specified
confidence (1- ) that a percent (p) of the data are below the detection limit and does not require

3-11
assumptions be made about the distribution of the data. The sample size can be determined for a specified
confidence and percent using the following formula, Equation (3-3), found in EPA (2002):
)log(
)log(
pn (3-3)
The required values for p and are determined based on the concentrations from the stage one
sample results and the WAC limit from the ICDF. The WAC limit for I-129 is 2.4 Ci. This translates to a
concentration of 3.1 pCi/g, assuming that the entire disposed waste volume contains I-129.
The typical detection limit for I-129 is 1.0 pCi/g. If the stage one samples for sites believed to
contain I-129 are all nondetectable, then ½ the detection limit will be used to determine the level of
verification required. Because 0.5 pCi/g is 16% of the WAC, two samples per lot are required. For sites
with detectable I-129, the verification sampling effort will be determined from the largest sample result.
In general, the detectable quantities were at least 90% of the WAC, so 59 samples per lot are required.
The stage two samples will be collected either from containers during excavation or in situ. With
either method, the waste will be divided into lots of no more than 5,000 yd3. Containers to be sampled
will be selected using a systematic sample with a random start. The sample will be collected from the
selected container during loading to ensure mixing and representativeness. For sampling from in situ
soils, a 3-D grid will overlay each lot. The number of grid-blocks will equal the number of verification
samples required for that lot. One random sample will be selected from each grid-block. Some sites may
be stratified, based on stage one results, into more than one material profile.
To track the mass of I-129 in the ICDF landfill, the 95% UCL for the mass will be determined and
accumulated, to compare to the mass landfill WAC of 2.4 Ci. The 95% UCL for mass will be calculated
using all sample results as long as all samples were collected and analyzed using comparable methods and
are recent enough so that temporal change is not an issue. The mass will be estimated for a whole site, not
individually for each lot within a site. The following formula assumes that the mean concentration is
normally distributed, but is robust to this assumption (Conover 1980). The data will be tested for
normality prior to calculation of the 95% UCL using a Shapiro-Wilk test and transformed if necessary.
The 95% UCL is calculated as shown in Equation (3-4) as follows:
n
VszVx
22
95.0 (3-4)
where
x = mean of the 129
I (Ci/g) sample results,
V = volume of 129
I bearing waste (g),
95.0z = 95th percentile of the standard normal distribution,
s2 = variance of the 129I sample results, and
n = number of samples from the volume of 129
I bearing waste.

3-12
3.7.3.1 CPP-97. I-129 was not analyzed for during previous sampling efforts. However, as
discussed in Section 3 of the RD/RA Work Plan (DOE-ID 2004a), process knowledge indicates that
Waste Calcining Facility condensate contamination may be present in the smaller stockpile (70 yd3) that
received waste with 3- to 50-mR/hr readings. Therefore, further characterization of I-129 will be
performed for this stockpile. Three samples, using a population lot unit size of 25 yd3, will be analyzed to
determine the mass of I-129.
3.7.3.2 CPP-92. One sample was analyzed for I-129 from soil generated during the CPP-604/605
emergency fire exit tunnel construction (Site CPP-89). The soil was later containerized in boxes and
became part of CPP-92. The I-129 concentration from this sampling effort was 3.1 pCi/g. This sample
result, at least 90% of the WAC, indicates that 59 samples per lot of waste are required. The site has a
volume less than 5,000 yd3 and is contained in boxes. Thus, 56 random and three biased samples from the
>50-mR/hr level will be selected for sampling. A sample will be collected at a random location within the
selected boxes. The boxes from CPP-99 will be included in the lot for sampling.
3.7.3.3 CPP-98. Because this waste stream is debris only, sampling to determine adherence to the
ICDF landfill WAC for I-129 will not be performed, as the waste profile will apply contaminants
identified from the soil samples (e.g., CPP-99, -97, -92). Therefore, further characterization or verification
is not necessary.
3.7.3.4 CPP-99. As described in Section 3.7.1.4, the soil data for CPP-97 and CPP-92 are assumed
to be representative of CPP-99. However, these data are insufficient to characterize the mass of I-129.
Therefore, I-129 data are required. The soil boxes in CPP-99 will be combined into one lot with the soil
boxes from CPP-92 for I-129 sampling.
3.7.3.5 CPP-03. As described in the RD/RA Work Plan, process knowledge indicates that
contamination at this site would be similar to CPP-34A/B. I-129 sampling data gathered from CPP-34
A/B will be used to determine if verification sampling for I-129 is required and to what extent.
3.7.3.6 CPP-67. Existing data for Pond 1 indicate that I-129 was analyzed for, but not detected
at any sample location. Because 1/2 the detection limit is within 20% of the WAC, two verification
samples will be collected from each 5,000-yd3 lot. I-129 was also analyzed and detected in Pond 2.
The sample results from stage one indicate detectable concentrations of I-129 are within the top 6 in.
The largest sample result is at least 90% of the WAC; therefore, 59 verification samples per 5,000 yd3
lot will be required for this site, for a total of 236 samples. Following Agency review of the sampling
strategy, it was identified that this number would be reduced by 26 samples that will be collected for
Site CPP-34A/B.
3.7.3.7 CPP-34A/B. Existing data indicate I-129 was analyzed for, but not detected. Following
Agency review of the sampling strategy, it was determined that verification sampling will be performed at
a frequency of two samples per 5,000 yd3 for a total of 26 samples.
3.7.4 Site-Specific Sampling Design Strategy
This section describes the sampling design strategy for each of the Phase I sites.
3.7.4.1 CPP-97, Tank Farm Soil Stockpile. Existing sample data for CPP-97 lack various
organic, inorganic, and radiological analyses necessary to complete the waste profile prior to disposal in
the ICDF landfill. These piles will be sampled using grab samples (4-in. to 1-ft depth to avoid surface
volatile organic compound [VOC] anomalies), and samples will be collected at random locations on the

3-13
soil pile itself at the ends and side (east, west, and south face of pile) of each pile for a total of six
samples. Figure 3-1 shows the proposed sampling locations at CPP-97.
3.7.4.2 CPP-92, -98, -99 Boxed Soil Sites. Existing sample data from Sites CPP-92, -98, and
-99 lack various organic, inorganic, and radiological analyses necessary to complete the waste profile
prior to disposal in the ICDF landfill. Because CPP-98 consists of containers of debris only, sampling is
not required.
There are some physical sampling data from the Site CPP-89 and Site CPP-17A/-17B waste that
was placed into waste containers at CPP-92. Twenty-five samples were collected at the two sites
(5 samples from CPP-17A, 2 samples from CPP-17B, and 18 samples from CPP-89) resulting in two
COCs exceeding the ROD RGs (Cs-137 at 7,730 pCi/g and Sr-90 at 10,800 pCi/g). These samples were
characterized by 3 inorganic analyses and 15 radionuclide analyses. One sample had I-129 analysis
performed at Site CPP-89 with a reported value of 3.1 pCi/g. No organic analyses were performed on
these samples.
Based on data from the Integrated Waste Tracking System, radiation measurements of some of
the waste boxes at these sites indicate levels exceeding 200 mR/hr on contact. The distribution of this
radiation data indicates this waste stream may not be homogenous. Initially, one material profile is
planned for the collection of soil waste boxes. For characterization purposes, the soil waste boxes will be
sampled using a stratified approach. The stratification will be based on the radiation measurement
guidelines below:
Radiation measurements 5 mR/hr on contact (Level 1)
Radiation measurements >5 and 50 mR/hr on contact (Level 2)
Radiation measurements >50 mR/hr on contact (Level 3).
Once waste boxes are sorted into Levels 1, 2, or 3, they will be segregated by waste type (soil or
debris). A random approach for sampling the waste boxes containing soil will subsequently be
implemented (no sampling is required for debris) within each level. This sampling approach entails
selecting 5% of the boxes from each level, except Level 3. in which samples will be collected from all the
boxes. Pertinent information regarding soil waste containers and their respective grouping into Levels 1,
2, or 3 is listed in Table 3-2.
The Level 3 soil waste containers from CPP-92 and -99 include 16 waste containers, of which only
three have been identified as soil waste containers. Due to the small number of designated soil waste
boxes and the high level of radionuclide contamination in the Level 3 grouping, one sample will be
collected from each soil box.

3-1
4
Additional Characterization Sampling:
CPP-97 Site Sampling Sub-Surface
Grab Samples97-1 / 97-2 / 97-3 / 97-4 / 97-5 / 97-6
Sample Depths 0’4” to 1’0”To Avoid VOC Anomalies
N696450
E297675
N696375
E297750
N696250
E297750
N696450
E297525
N696250
E297450
N696350
E297450
Security Fence
Palm Avenue
Chestnut Avenue
100’ 200’ 300’ 400’ 500’
Percolation Pond
#1YDG -
326
Percolation Pond
#2YDG -
327
CPP -34A
CPP -34B
CPP -37A
CPP -37B
CPP -37C
CPP -03
CPP -67
CPP -92, 98, 99
NORTH
CPP -97N
69
64
50
E2
97
67
5 N
6963
75
E2
97
75
0
N
69
62
50
E2
97
75
0
N
69
64
50
E2
97
52
5
N
69
62
50
E2
97
45
0
N
69
63
50
E297
45
0
CPP-97
97-1
97-2
97-3
97-5
97-6
97-4
Figure 3-1. Proposed characterization sampling locations for CPP-97.

3-15
Table 3-2. Sampling strategy for CPP-92, -98, -99 soil waste boxes.
Description
Level 1
5 mR/hr
Level 2
5 mR/hr and 50 mR/hr
Level 3
50 mR/hr
CPP-92 soil boxesa 466 100 3
CPP-98 soil boxesb —
c—
c—
c
CPP-99 soil boxesd 10 3 —
c
Total soil boxes 476 103 3
Volume (yd3) 1,128 265 9
Number of boxes to be sampled 24 6 3
a. CPP-92 inventory includes 571 soil and 82 debris boxes.
b. CPP-98 inventory includes 119 debris boxes.
c. — = not applicable.
d. CPP-99 inventory includes 14 soil boxes, 43 debris boxes, and 1 box with unspecified content.
Contents of waste containers will be verified prior to disposal at the ICDF in accordance with the
ICDF Complex Waste Verification Sampling and Analysis Plan (DOE-ID 2003). If the container contents
were incorrectly identified (e.g., initially identified as debris but found to be >50% soil), the profile and
waste description will be corrected. At that time, the sample data obtained will be used to fill out the
waste profile for the waste stream. If the levels are believed to represent more than one population, more
than one material profile may be completed.
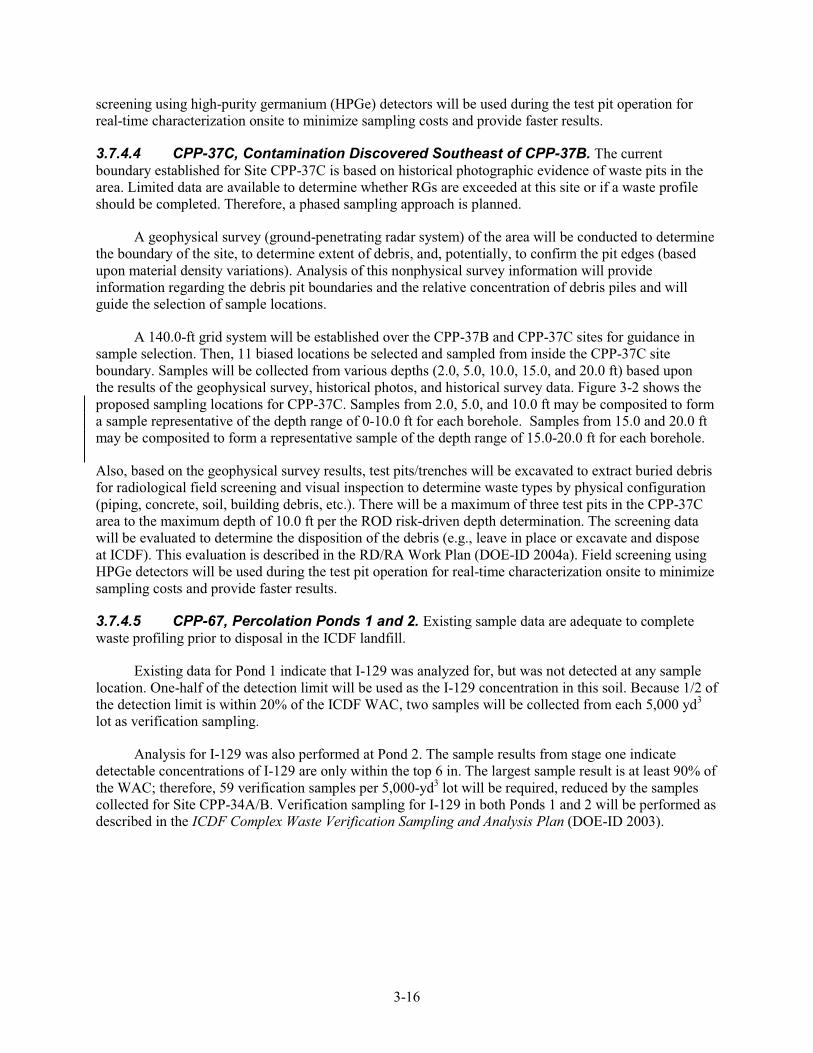
3.7.4.3 CPP-37B, Gravel Pit and Debris Landfill Inside INTEC Fence. The existing data
for Site CPP-37B are insufficient to determine whether RGs are exceeded at this site. Because this site
was previously used as a landfill, a phased characterization sampling approach is planned.
A geophysical survey (ground-penetrating radar system) of the area will be conducted to determine
the boundary of the site, to determine extent of debris, and, potentially, to confirm the pit edges (based
upon material density variations). Analysis of this nonphysical survey information will provide
information regarding the debris pit boundaries and the relative concentration of debris piles and will
guide the selection of sample locations. A 140.0-ft grid system will be established over the CPP-37B and
CPP-37C sites for guidance in sample selection. Then, six additional biased sample locations will be
selected at CPP-37B and samples collected from various depths (2.0, 5.0, 10.0, 15.0, 20.0, 25.0, 30.0, and
35.0 ft) based upon previous sampling depths, historical photos of the waste pit, and historical survey data
of waste pit depths. The number of additional sample locations was selected to supplement the sampling
conducted at this site during the Track 2 investigation (DOE-ID 1997). The locations will be biased to
avoid boring into debris. Figure 3-2 shows the proposed sampling locations for CPP-37B. Samples from
2.0, 5.0, and 10.0 ft may be composited to form a sample representative of the depth range of 0-10.0 ft for
each borehole. Samples from 15.0, 20.0, 25.0, 30.0, and 35.0 ft may be composited to form a
representative sample of the depth range of 15.0-35.0 ft for each borehole.
Also based on the geophysical survey results, test pits/trenches will be excavated to extract buried
debris for radiological field screening and visual inspection to determine waste types by physical
configuration (piping, concrete, soil, building debris, etc.). There will be a maximum of three test pits in
the CPP-37B area to the maximum depth of 10.0 ft, per the ROD risk-driven depth determination. The
screening data will be evaluated to determine the disposition of the debris (e.g., leave in place or excavate
and dispose at ICDF). This evaluation is described in the RD/RA Work Plan (DOE-ID 2004a). Field
3-16
screening using high-purity germanium (HPGe) detectors will be used during the test pit operation for
real-time characterization onsite to minimize sampling costs and provide faster results.
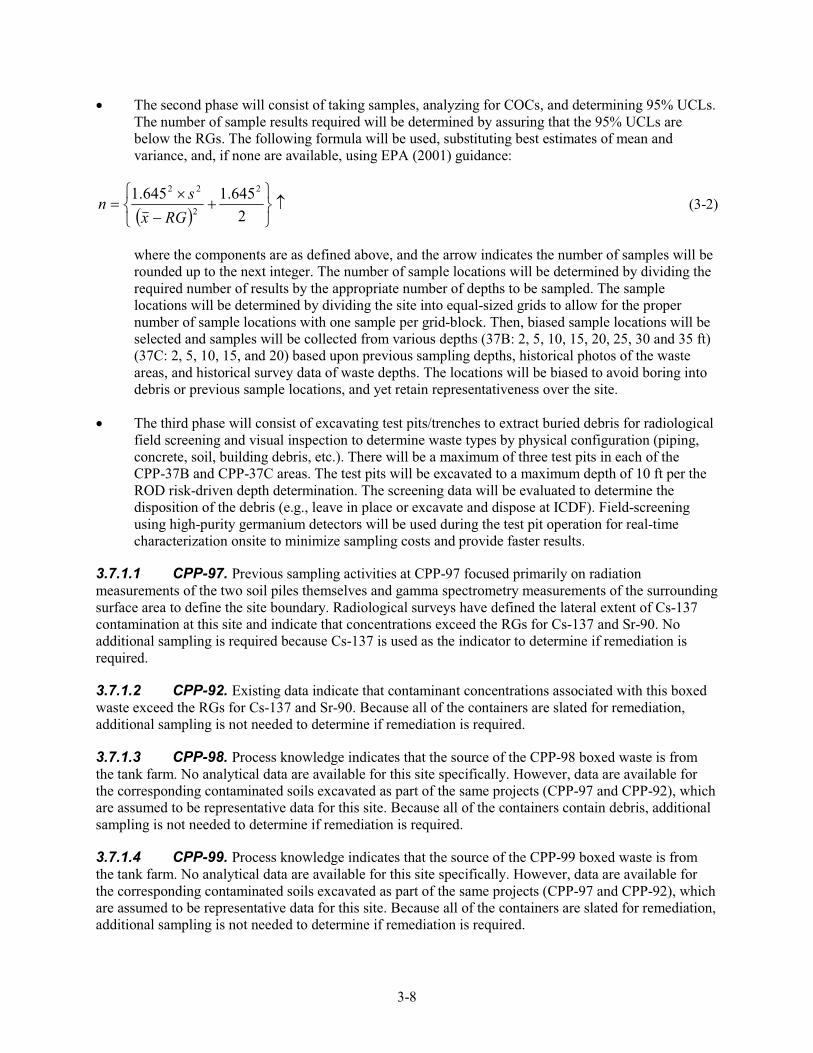
3.7.4.4 CPP-37C, Contamination Discovered Southeast of CPP-37B. The current
boundary established for Site CPP-37C is based on historical photographic evidence of waste pits in the
area. Limited data are available to determine whether RGs are exceeded at this site or if a waste profile
should be completed. Therefore, a phased sampling approach is planned.
A geophysical survey (ground-penetrating radar system) of the area will be conducted to determine
the boundary of the site, to determine extent of debris, and, potentially, to confirm the pit edges (based
upon material density variations). Analysis of this nonphysical survey information will provide
information regarding the debris pit boundaries and the relative concentration of debris piles and will
guide the selection of sample locations.
A 140.0-ft grid system will be established over the CPP-37B and CPP-37C sites for guidance in
sample selection. Then, 11 biased locations be selected and sampled from inside the CPP-37C site
boundary. Samples will be collected from various depths (2.0, 5.0, 10.0, 15.0, and 20.0 ft) based upon
the results of the geophysical survey, historical photos, and historical survey data. Figure 3-2 shows the
proposed sampling locations for CPP-37C. Samples from 2.0, 5.0, and 10.0 ft may be composited to form
a sample representative of the depth range of 0-10.0 ft for each borehole. Samples from 15.0 and 20.0 ft
may be composited to form a representative sample of the depth range of 15.0-20.0 ft for each borehole.
Also, based on the geophysical survey results, test pits/trenches will be excavated to extract buried debris
for radiological field screening and visual inspection to determine waste types by physical configuration
(piping, concrete, soil, building debris, etc.). There will be a maximum of three test pits in the CPP-37C
area to the maximum depth of 10.0 ft per the ROD risk-driven depth determination. The screening data
will be evaluated to determine the disposition of the debris (e.g., leave in place or excavate and dispose
at ICDF). This evaluation is described in the RD/RA Work Plan (DOE-ID 2004a). Field screening using
HPGe detectors will be used during the test pit operation for real-time characterization onsite to minimize
sampling costs and provide faster results.
3.7.4.5 CPP-67, Percolation Ponds 1 and 2. Existing sample data are adequate to complete
waste profiling prior to disposal in the ICDF landfill.
Existing data for Pond 1 indicate that I-129 was analyzed for, but was not detected at any sample
location. One-half of the detection limit will be used as the I-129 concentration in this soil. Because 1/2 of
the detection limit is within 20% of the ICDF WAC, two samples will be collected from each 5,000 yd3
lot as verification sampling.
Analysis for I-129 was also performed at Pond 2. The sample results from stage one indicate
detectable concentrations of I-129 are only within the top 6 in. The largest sample result is at least 90% of
the WAC; therefore, 59 verification samples per 5,000-yd3 lot will be required, reduced by the samples
collected for Site CPP-34A/B. Verification sampling for I-129 in both Ponds 1 and 2 will be performed as
described in the ICDF Complex Waste Verification Sampling and Analysis Plan (DOE-ID 2003).

3-1
7
Grid Established per the Site Surface Exposure Area (EA) Limit
Less than 0. 5 acres or 146 lf x 146 lf ==> 140 lf Grid Used
Borehole Locations are Based Upon BIASED Placement to Define the
Boundary of the CPP -37C Burial
Proposed Additional Characterization Sampling:
Previous Borehole Location - within old Pond Location
37-1 / 37 -2 / 37 -3 / 37 -4 ==> Golder Associates 1991
CPP -37B Site Sampling Boreholes
Recommended
CPP -37C Site Sampling Boreholes
Recommended
Not Required due to “Known” Boundary of Landfill from Aerial Photo
37C -6 / 37C -7 / 37C -8 /
ROD Recognized these Sites as “LANDFILLS”
Recommended Approach Sequencing
- Geophysical Surveys (Rapid Ground Penetrating Radar Mapping)
- Location of Biased Boreholes
- “Test Trenches / Pits”
Test Trenches 20’0” wi de at bottom with variable lengths
[25’0” depth] - Slopes 1.5:1 ==> Top 100’0” wide
[15’0” depth] - Slopes 1.5:1 ==> Top 65’0” wide
NOTE:- Typic al Test Trench / Pit configurations are shown on drawing for graphical - Typical Trench / Pit depth - Minimum of 6’0” Maximum of 10’0”
-
Sampling Depths
2.0 lf / 5.0 lf / 10.0 lf / 15.0 lf / 20.0 lf / 25.0 lf / 30.0 lf / 35.0 lf
Interior Boundary Samples
Biased - Located between previous samples
37B -1 / 37B -2 / 37B -3
Biased - Located outside pond area
37B -4 / 37B -5 / 37B -6
Sampling Depths
2.0 lf / 5.0 lf / 10.0 lf / 15.0 lf / 20.0 lf
Exterior Boundary Samples
Interior Boundary Samples
37C-9 / 37C -10 / 37C -11
37C -12 / 37C -13 / 37C -14 / 37C -15 / 37C -16
[10’0” depth] - Slopes 1.5:1 ==> Top 50’0” wide
100’ 200’ 300’ 400’ 500’
CPP-37B
CPP-37C
N3
N6
N7
N8
N9
1 2 3 4 6 7
N4
N5
37C-7
37C-9
5
Palm Avenue
37C-11
37C-12
37C-13
37C-14
37C -8
37C-15
37C-6
37C-10
37C -16
37B -1
37B -337B -2
37-1
37-2
37-3
37-4
CPP-
1678
CPP-37C
20’ x 40’ Test Pit
CPP -37B
20’ x 40’ Test Pit
Outline of Pond Surface 1991 - Golder
Associates
Outline of Elevation 4902.5 1991 - Golder
Associates
Outline of Excavation for Additional Characterization if soils/debris greater than
RG limits
37B -4
37B -5
37B-6
CPP-37C
20’ x 40’ Test Pit
Figure 3-2. Proposed characterization sampling locations for CPP-37B and CPP-37C.
3-18
3.8 Measurement Performance Criteria
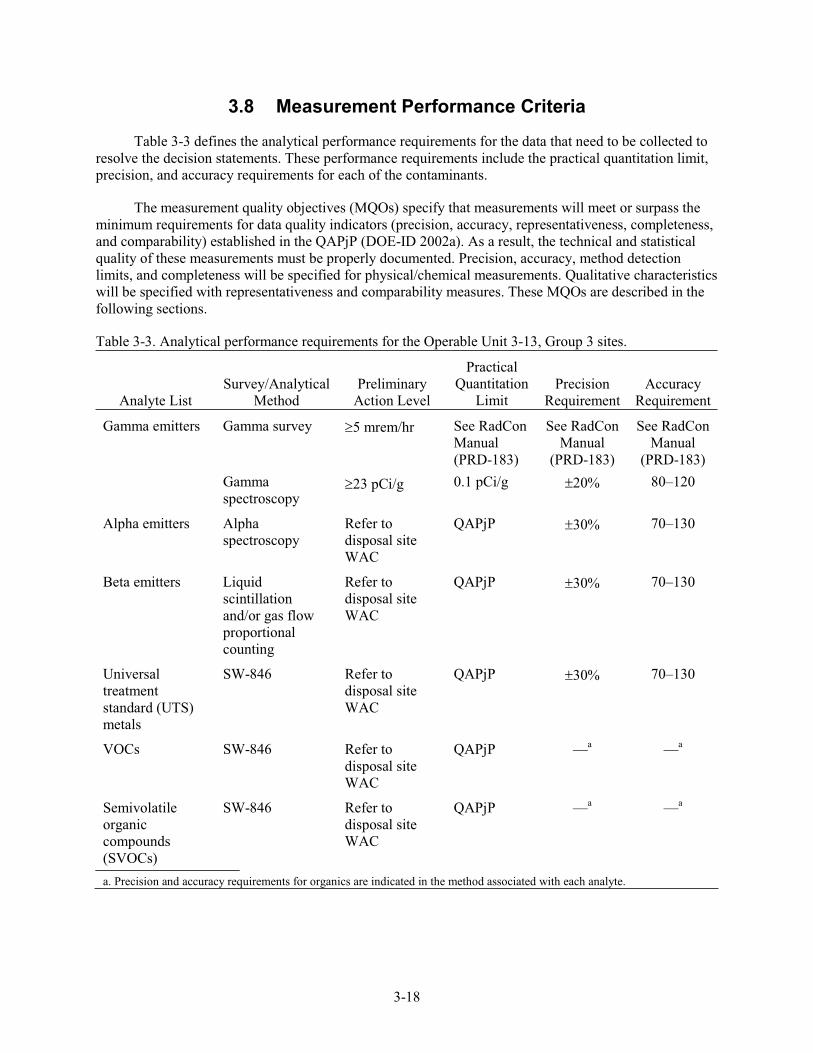
Table 3-3 defines the analytical performance requirements for the data that need to be collected to
resolve the decision statements. These performance requirements include the practical quantitation limit,
precision, and accuracy requirements for each of the contaminants.
The measurement quality objectives (MQOs) specify that measurements will meet or surpass the
minimum requirements for data quality indicators (precision, accuracy, representativeness, completeness,
and comparability) established in the QAPjP (DOE-ID 2002a). As a result, the technical and statistical
quality of these measurements must be properly documented. Precision, accuracy, method detection
limits, and completeness will be specified for physical/chemical measurements. Qualitative characteristics
will be specified with representativeness and comparability measures. These MQOs are described in the
following sections.
Table 3-3. Analytical performance requirements for the Operable Unit 3-13, Group 3 sites.
Analyte List
Survey/Analytical
Method
Preliminary
Action Level
Practical
Quantitation
Limit Precision
Requirement
Accuracy
Requirement
Gamma emitters Gamma survey
Gamma
spectroscopy
5 mrem/hr
23 pCi/g
See RadCon
Manual
(PRD-183)
0.1 pCi/g
See RadCon
Manual
(PRD-183)
20%
See RadCon
Manual
(PRD-183)
80–120
Alpha emitters Alpha
spectroscopy
Refer to
disposal site
WAC
QAPjP 30% 70–130
Beta emitters Liquid
scintillation
and/or gas flow
proportional
counting
Refer to
disposal site
WAC
QAPjP 30% 70–130
Universal
treatment
standard (UTS)
metals
SW-846 Refer to
disposal site
WAC
QAPjP 30% 70–130
VOCs SW-846 Refer to
disposal site
WAC
QAPjP —a —
a
Semivolatile
organic
compounds
(SVOCs)
SW-846 Refer to
disposal site
WAC
QAPjP —a —
a
a. Precision and accuracy requirements for organics are indicated in the method associated with each analyte.

3-19
3.8.1 Precision
Precision is a measure of agreement or reproducibility among individual measurements for the
same property under the same conditions. Precision is expressed as relative percent difference, which is
defined and shown in Equation (3-5) as the absolute value of the difference divided by the mean,
expressed as a percentage:
1002
X/MSDMS
MSDMSRPD (3-5)
where
RPD = relative percent difference
MS = measured concentration of parameter in matrix spike sample
MSD = measured concentration of parameter in matrix spike duplicate sample.
The analytical laboratory will report the precision of their measurements of the matrix spike and
matrix spike duplicate analyses conducted for organic and most inorganic analyses. For all radiochemical
and some inorganic measurements, precision will be calculated using duplicate measurements of the same
sample. Replicate measurements are used for metals determination after sample preparation, during
instrumental analysis, and for mercury determinations post-digestion. Radiochemical measurements will
use separate sample splits for solid samples to determine measurement precision.
Acceptable laboratory precision will be determined by method-specific criteria outlined in
SW-846, Test Methods for Evaluating Solid Waste, Physical/Chemical Methods (EPA 1996), for total
metals and each requested organic analysis. Acceptable radiochemical measurement precision will be
determined using the guidance outlined in “Idaho National Engineering and Environmental Laboratory
Sample and Analysis Management Statement of Work for Analytical Services” (ER-SOW-394).
3.8.2 Accuracy
Accuracy is the relative agreement or nonagreement between a measured value and an accepted
reference value. Accuracy reflects the measurement error associated with a measurement and is
determined by assessing actual measurements in the sample matrix during the analysis of matrix spike
samples. Accuracy is assessed by means of determining analyte recovery from matrix spikes, samples, or
laboratory reference samples and is expressed as a percent recovery (%R), defined as the measured value
divided by the true value expressed as a percent, as shown in Equation (3-6):
100xC
CCR%
as
usss (3-6)
where
%R = percent recovery
Css = measured analyte concentration in spiked sample
Cus = measured analyte concentration in nonspiked samples (or zero for laboratory reference
samples)
3-20
Cas = calculated or certified analyte concentration added to sample.
For organic and inorganic analyses, the analytical laboratory will represent the accuracy of their
measurements in the sample matrix as the results of the matrix spike data. For organic analyses, an
additional measure of accuracy is provided by surrogate spike data. Surrogate spike compounds are
analytes of similar chemical characteristic to the analytes of interest. They are added to all samples,
matrix spikes, and blanks to test for possible bias added during the entire sample preparation and
measurement process. Acceptable laboratory accuracy will be determined by assessing the results against
method-specific criteria outlined in SW-846 (EPA 1996) for total metals, and each requested organic
analysis. Radiochemical method accuracy will be determined by assessing the results against the criteria
outlined in ER-SOW-394. During the DQO process, accuracy of the environmental measurements (in the
form of bias, may be indicated by the measure discussed above) will be assessed to determine if there are
any impacts on data use due to the accuracy of the data.
3.8.3 Detection Limits
The laboratory will use guidance found in SW-846 (EPA 1996) or 40 CFR 136, Appendix B, to
aid in appropriately determining method detection limits (MDLs) for organic and inorganic analytical
methods and the requirements of ER-SOW-394 for setting minimum detectable activities (MDAs) for
radiochemical measurements. The MDLs and MDAs are defined as the minimum concentration or
activity of a substance that can be reliably measured and reported by a particular analytical method.
Matrix effects, sample size, radiation levels, or other analytical interferences may increase MDLs or
MDAs. The effects of these conditions on the laboratory’s MDLs or MDAs, if determinable, will be
documented.
Chemical methods for all total metals, anions, and organic analyses typically use the standard
deviation of replicate measurements of standards multiplied by a factor specified by the method or
laboratory SOW to determine minimum MDLs. Estimated detection limits are provided in each of the
appropriate analytical methods for chemical determinations and serve as a guide for purposes of this plan.
The laboratory will use standard radiochemistry and chemical analysis practices to ensure the MDLs
approach those prescribed in the analytical laboratory statement of work (SOW). Any significant
deviations will be identified in the reported data.
Methods for the determination of radionuclides and applicable MDAs will be as defined in
ER-SOW-394 or as defined in the project-specific analytical laboratory SOW. The laboratory will attempt
to keep MDAs as low as possible given the constraints of the sample matrix and any remote sample
handling operations required to assure the safety of laboratory personnel.
The laboratory analysts will follow the SW-846 (EPA 1996) and ER-SOW-394 methods as closely
as possible to ensure the data are compliant with the requirements of the project. A smaller sample size
may introduce a dilution effect, thereby elevating the detection level for a given sample or analysis. In the
event that sample volume (or mass) prohibits the use of SW-846 protocols, the laboratory will make a
good faith effort to assign methods that will provide acceptable/usable data and document all method
deviations in the case narrative provided with the data package. Table 3-4 describes the analytical
methods and detection limits for each contaminant of potential concern (COPC).

3-21
Table 3-4. Analytical methods and detection limits for each contaminant of potential concern.
Constituent Analytical Method Solids Detection Limits
UTS metals EPA Methods 1311, 3010A,
7760A, 6010B, and 7470A
0.2–1000 mg/kg
depending on metal
CLP target analyte list (TAL) metals EPA Methods 3010A, 7760A,
6010B, and 7470A
0.2–1000 mg/kg
depending on metal
Appendix IXa TAL VOCs (including
acetone, methylene chloride,
1,1,1-trichloroethane,
tetrachloroethene, and
trichloroethylene)
EPA Method 8260B 5–100 g/kg depending
on VOC (must meet
UTS detection limits
for those analytes in
parentheses)
Appendix IX TAL SVOCs EPA Method 8270C 660–3300 g/kg
depending on SVOC
PCBs EPA Method 8082 350 ug/kg
Tritium (H-3) Liquid scintillation counting
(LSC)
20 pCi/g
Strontium-90 Gas flow proportional (GFP) 0.5 pCi/g
Technetium-99 LSC or GFP 1 pCi/g
Iodine-129 Low-energy photon spectrometry
(LEPS), GFP, or mass
spectrometry technique
1 pCi/g
Radium-226 Gamma spectrometry (GMS) or
GFP
0.5 pCi/g
Neptunium-237 Alpha spectrometry (ALS) 0.05 pCi/g
Uranium isotopes ALS 0.05 pCi/g
Plutonium isotopes ALS 0.05 pCi/g
Americium-241 ALS 0.05 pCi/g
Thorium-228 ALS 0.05 pCi/g
Thorium-232 ALS 0.05 pCi/g
Ruthenium-106 GMS —b
Silver-108 GMS —b
Antimony-125 GMS —b
Cesium-134 GMS —b
Cesium-137 GMS —b
Cerium-144 GMS —b
Europium-152 GMS —b
Europium-154 GMS —b
Europium-155 GMS —b
Gamma emitters GMS 0.1 pCi/g
a. 40 CFR 264.
b. Detection limit is indicated in the analytical method for each constituent.

3-22
3.8.4 Completeness
Completeness is the measure of the amount of valid analytical data obtained compared to the total
number of data points planned. Valid analytical data are those generated when analytical systems and the
resulting analytical data meet all DQOs outlined for the project (i.e., all calibration verification
interference, and other checks not affected by the sample matrix meet acceptance criteria). It is important
to understand that data that are flagged during the data validation process are not necessarily invalid data.
Part of the data quality analysis process is the review of flagged data to determine whether the validation
flags impact the intended use of the data. Therefore, the definition of “valid data” in the context of
calculating completeness is “data that are acceptable for their intended purpose.” Completeness of the
reported data (expressed as a percentage) is calculated, as shown in Equation (3-7).
100Mt/M%C v (3-7)
where
C(%) = completeness
Mv = number of measurements determined to be valid per analyte
Mt = total number of measurements performed per analyte.
A completeness of 90% is a common goal. All data obtained from this project should meet the
quality requirements and reporting protocols unless irregularities in the matrix (a.k.a. matrix effects)
impede contaminant recovery or a broken, spilled container results in a loss of sample materials. The
completeness goal for the project is to obtain enough valid data to satisfy the DQO specifications.
3.8.5 Comparability
Comparability is the degree to which one data set can be compared to another obtained from the
same population using similar techniques for data gathering. Comparability will be achieved through the
use of consistent sampling procedures, experienced sampling personnel, the same analytical method for
like parameters, standard field and laboratory documentation, and traceable laboratory standards.
3.8.6 Representativeness
Representativeness is a measure of the degree to which data accurately and precisely represent a
characteristic of a population parameter at a sampling point, a process condition, or an environmental
condition. Representativeness is a qualitative term that should be evaluated to determine whether in situ
and other measurements are made and physical samples are collected in such a manner that the resulting
data appropriately reflect population parameter of interest in the media and phenomenon measured or
studied.
The sampling design discussed in Section 3.7 of this plan is the basis for obtaining representative
data for the WAG 3, Group 3 sites. A final determination of representativeness for the initial data set will
be made by the project manager (PM) and other project personnel following the return of the chemical
and radiological analytical data.

3-23
3.9 Data Quality
In addition to primary project samples, quality assurance/quality control (QA/QC) samples will be
collected to establish the quantitative and qualitative criteria necessary to support the RA decision process
and to describe the acceptability of the data by providing information both comparable to and
representative of actual field conditions. Quality assurance/quality control samples consisting of field
blanks and equipment rinsate blanks will be used to determine field accuracy. Quality control (duplicate)
samples are used to measure field and laboratory precision. The QA/QC sample results will be evaluated
as outlined in the QAPjP (DOE-ID 2002a). Table 3-5 provides an overview of QA/QC sample analysis
for this sampling effort.
3.10 Data Validation
Data will be acquired, processed, and controlled before input to the Integrated Environmental Data
Management System (IEDMS). For the samples submitted to the analytical laboratory, all data will be
validated to Level B, in accordance with the QAPjP (DOE-ID 2002a).
A data limitation and validation report, including copies of chain-of-custody forms, sample results,
and validation flags, will be generated for each sample delivery group. All data limitation and validation
reports associated with a site will be transmitted to the EPA and Idaho Department of Environmental
Quality (IDEQ) within 120 days from the last day of sample collection. All definitive data will be
uploaded to the IEDMS.
The Sample and Analysis Management (SAM) group will ensure the data are validated to Level B,
as specified. The analytical method data validation will be conducted in accordance with current INEEL
SAM data validation procedures. Validated data are entered into the IEDMS.
Table 3-5. Quality assurance/quality control samples.
QA/QC Sample Type Comment
Duplicate Duplicate samples will be collected at a minimum frequency of 1/20
samples or 1/day/matrix, whichever is less.
Field blanks Field blanks are only recommended for subsurface soils (>6 in.) collected
for radionuclide analyses. Field blanks will be collected at a minimum
frequency of 1/20 samples or 1/day whichever is less.
Trip blanks Trip blanks are not recommended for soil samples.
Equipment rinsate Equipment blanks will be collected from the same equipment used to
collect samples and will be analyzed for the same constituents. Equipment
blanks are not required if dedicated or disposable equipment is used.
Appropriate equipment blanks will be collected at a minimum frequency of
1/day/matrix or 1/20 samples, whichever is less.

3-24

4-1
4. SAMPLE COLLECTION, ANALYSIS, AND DATA MANAGEMENT
Specific procedures are required to handle samples collected during Group 3, Phase I site sampling
activities to ensure that data are representative of the soil and debris at each site. This section outlines the
specific sampling process designed for these activities.
The QAPjP (DOE-ID 2002a) is the guiding document for this section. The sampling requirements
discussed here will guide the collection of representative samples as specified in the DQOs (Section 3 of
this plan).
4.1 Sample Collection
4.1.1 Presampling Meeting
Before sampling takes place, project personnel will meet to ensure the sampling and analysis can
be performed in a safe manner and that sampling activities will provide the project with usable data.
Personnel will ensure that necessary equipment and documentation are present and that project scope and
objectives are understood.
4.1.2 Sampling and Analysis Requirements
Sampling and analysis plan tables, prepared by the SAM, provide a summary of sample locations,
analytical parameters and container, volume, holding times, and preservation requirements. Analytical
requirements for each constituent and sample media are provided. These tables will be prepared prior to
the sampling activities. The INEEL SAM is responsible for obtaining laboratory analytical services. The
SAM will prepare task order statement of work (TOS) documents if needed for laboratory services.
If a sample is lost, containers are broken, or the sample is unusable, the sample will be retaken
where possible. The sampling field team leader (FTL) will ensure that any changes to this document
regarding sampling frequency, location, and/or analysis are documented in the sample logbook. The PM
is responsible to ensure that a document action request (DAR) is written and approved for any changes to
this document.
4.1.3 Sampling Documentation and Equipment
A sampling logbook will be maintained for all field data gathered, field observations, field
equipment calibrations, samples collected for analysis, and sample custody. Field logbooks, as legal
documents, will be maintained to ensure that field activities are properly documented as they relate to
site safety meetings and that site work is conducted in accordance with the health and safety procedures.
Field logbooks will be bound, and they will contain consecutively numbered pages. All entries in field
logbooks will be made using permanent ink pens or markers. All mistakes made as entries will be
amended by drawing a single line through the entry and then initialed and dated by the person making
the correction.
The FTL will be responsible for controlling and maintaining all field documents and records, and
for ensuring that all required documents will be submitted to the Idaho Completion Project
Administrative Records and Document Control Office at the conclusion of the project.
Sample documentation, shipping, and custody procedures for this project are based on
EPA-recommended procedures that emphasize careful documentation of sample collection and sample

4-2
transfer. The appropriate information pertaining to each sample will be recorded in accordance with
INEEL logbook practices, chain-of-custody procedures, and the QAPjP (DOE-ID 2002a). All personnel
involved with handling, managing, or disposing of samples will be familiar with INEEL handling and
shipping sample procedures, and all samples will be dispositioned accordingly.
A DAR is required when field conditions dictate making any changes to this plan, the project
HASP, or other controlled project procedures (e.g., requiring additional analyses to meet appropriate
WAC). If necessary, a DAR will be executed in accordance with Idaho Completion Project document
procedures.
All information recorded on project field documentation (e.g., logbooks, chain-of-custody forms)
will be made in permanent ink. All field documentation errors will be corrected by drawing a single line
through the error and entering the correct information, and all corrections will be initialed and dated. In
addition, photographs will be taken to document the field sampling activities.
Included below is a tentative list of necessary equipment and supplies. This list is as extensive as
possible, but not exhaustive, and should only be used as a guide. Other equipment and supplies specified
in the project-specific HASP and/or field sampling plan (FSP) may not be included in this section.
Sampling equipment that will come into contact with sample material will be cleaned before use with
an appropriate method (e.g., Alconox or similar nonphosphate soap with de-ionized water rinse, or
equivalent). Field sampling and decontamination supplies may include the following:
Stainless-steel hand augers
Push probe/split spoon
Power augers or small drill
Tape measure (30.5 m [100 ft])
Wood stakes and ribbon (30.5 m [100 ft])
Stainless steel spoons
Stainless steel or aluminum composting pans
Paper wipes
Plastic garbage bags
De-ionized water (20 L [5.3 gal] minimum)
Nonphosphate-based soap
Isopropanol
Spray bottles
Aluminum foil
Pipe wrench

4-3
Crescent wrench
Hammer
Tables
Certified ultrapure water (5 L [1.3 gal] JT Baker)
Sample and shipping logbook
FTL logbook
Controlled copies of the FSP, QAPjP, HASP, and applicable referenced procedures
Black ink pens
Black ultrafine markers
Sample containers, as specified in the QAPjP
Preprinted sample labels and field guidance forms
Nitrile or latex gloves
Leather work gloves
Ziploc™ plastic bags
Custody seals.
Sample preparation and shipping supplies include the following:
Pipettes
pH paper
Nitrile or latex gloves
Paper wipes
ParafilmTM
Clear tape
Strapping tape
Resealable plastic bags (such as Ziploc™) in various sizes
Chain-of-custody forms

4-4
Shipping request forms
Names, addresses, telephone numbers, and contact names for analytical laboratories
Task order statements of work for analytical laboratories and associated purchase order numbers
Vermiculite or bubble-wrap (packaging material)
Plastic garbage bags
Blue IceTM
Coolers
“This Side Up” and “Fragile” labels
Address labels
Sample bottles and lids
Custody seals.
4.1.4 Field Equipment Calibration and Setup
The FTL will work closely with sampling personnel to ensure that sampling equipment is operating
as recommended by the manufacturer and/or according to design specifications. Presampling inspections
of equipment will be performed to ensure the equipment is functioning properly. Corrective actions for
the repair or maintenance of any sampling equipment will be immediate and will be confirmed by the
FTL or PM before proceeding with sampling.
Radiological control personnel are responsible for the calibration of all radiological monitoring
equipment and the placement and handling of telemetry dosimeters. The industrial hygienist (IH) will be
responsible for the measurement and evaluation of other chemical hazards.
4.1.5 Sample Designation and Labeling
Each sample bottle will contain a label identifying the field sample number, the analyses requested,
the sample date and time, and the name of the person performing the sampling. Labels will be secured on
the sample using clear plastic tape.
A systematic character identification code will be used to uniquely identify all samples.
Uniqueness is required to maintain consistency and prevent the same code from being assigned to more
than one sample.
The first designator of the code, 3, refers to the sample originating from WAG 3. The second and
third designators refer to the sample being collected in support of the RA. The next three numbers
designate the sequential sample number for the project. Regular and field duplicate samples will be
designated with a two-character set (e.g., 01, 02). The last two characters refer to a particular analysis and
bottle type. For example, a soil sample collected in support of the RA might be designated as
3RA00101R4, where (from left to right):

4-5
3 designates the sample as originating from WAG 3
RA designates the sample as being collected for the RA
001 designates the sequential sample number
01 designates the type of sample (01 = regular, 02 = field duplicate)
R4 designates gamma spectrometric analysis.
The IEDMS database will be used to record all pertinent information associated with each sample
identification code. Preparation of the plan database and completion of the SAM request for services are
used to initiate the sample and sample waste tracking activities performed by the SAM.
4.1.6 Sample Containers
Table 4-1 identifies container volumes, types, holding times, and preservative requirements that
apply to all soil and liquid samples being collected under this plan. All containers will be precleaned
(typically certified by the manufacturer) using the appropriate EPA-recommended cleaning protocols for
the bottle type and sample analyses. Extra containers will be available in case of breakage, contamination,
or if the need for additional samples arises. Prior to use, preprinted labels with the name of the project,
sample identification number, location, depth, and requested analysis will be affixed to the sample
containers.
Table 4-1. Sampling bottles, preservation types, and holding times.
Analysis
Volume and
Type Preservative Holding Time
UTS metals Glass or
plastic
4oC 180 days for all metals
except mercury, which is
28 days
CLP TAL metals Glass or
plastic
4oC 180 days for all metals
except mercury, which is
28 days
Appendix IXa TAL VOCs (including
acetone, methylene chloride,
1,1,1-trichloroethane, tetrachloroethene,
and trichloroethylene)
Glass 4oC 14 days
Appendix IXa TAL SVOCs Glass 4
oC 14 days
PCBs Glass 4oC 14 days
Alpha radionuclides High-density
polyethylene
(HDPE)
NA 180 days for all isotopes
Beta radionuclides HDPE NA 180 days for all isotopes
except I-129, which is
28 days
Gamma emitters HDPE NA 180 days for all isotopes
a. 40 CFR 264.

4-6
4.1.7 Sample Preservation
Water samples will be preserved in a manner consistent with the QAPjP (DOE-ID 2002a). If
cooling is required for preservation, the temperature will be checked periodically prior to shipment to
certify adequate preservation for those samples that require temperatures of 4 C (39 F) for preservation.
Ice chests (coolers) containing frozen reusable ice will be used to chill samples in the field after sample
collection, if required.
4.1.8 Chain-of-Custody
The INEEL chain-of-custody procedures will be followed as well as the requirements in the QAPjP
(DOE ID 2002a). Sample bottles will be stored in a secured area accessible only to the field team
members.
Chain-of-custody procedures will begin immediately after collection of the first sample. At the
time of sample collection, the sampling team will initiate a chain-of-custody form for each sample. All
samples collected will then remain in the custody of a member of the sampling team until the custody is
transferred to the analytical laboratory sample custodian (SC). Upon receipt at the laboratory, the SC will
review the sample labels and the chain-of-custody form to ensure completeness and accuracy. The
laboratory SC will sign and date the chain-of-custody form signifying acceptance of delivery and custody
of the samples. If discrepancies on the form are noted, immediate corrective action will be sought with the
sampling team member(s) identified on the form.
Custody seals will be placed on all shipping containers to ensure that tampering or unauthorized
opening will not compromise sample integrity. The seal will be attached in such a way that opening the
container requires the seal to be broken. Clear plastic tape will be placed over the seals to ensure that the
seals are not damaged during shipment. Seals will be affixed to containers before the samples leave the
custody of the sampling personnel.
4.1.9 Sample Collection Procedures
Sample collection procedures will be performed in accordance with existing INEEL sampling
collection and handling procedures.
A scoop, hand corer/auger, power auger, or other typical soil sample collection tool will be used to
collect soil samples. Prior to collection, sampling tools will be decontaminated to prevent
cross-contamination of samples.
Deep sampling will require a drill-rig system and will be performed in accordance with existing
INEEL drilling sampling collection and handling procedures. Special precautions will be implemented
during the utilization of drill-rig equipment to ensure that existing utilities locations are known and staked
before drilling.
For each sample activity, sample locations will be chosen to be representative of the waste stream.
All samples will be collected in appropriate containers based on the contaminant and the associated
analytical method required for the analytical data. Either on-Site analysis will be performed or off-Site
analytical laboratories will be used, depending on the contaminant, required detection level, and analytical
technique. All samples requiring off-Site laboratory analysis must be collected in precleaned sample
containers and follow the container requirements per the TOS. If sampling for volatile or semivolatile
organics is required, these will be collected first to minimize disturbance of the soil.

4-7
4.1.10 Equipment Decontamination Procedures
Field decontamination procedures designed to prevent cross-contamination between locations and
samples and prevent offsite contamination migration will be performed in accordance with INEEL
sampling equipment decontamination procedures. All equipment associated with sampling will be
thoroughly decontaminated prior to daily activities and between sample locations. Following
decontamination, sampling equipment will be wrapped in foil to prevent contamination from windblown
dust.
4.1.11 Sample Transport
Samples will be shipped in accordance with the regulations issued by the U.S. Department of
Transportation (DOT) (49 CFR 171 through 178) and EPA sampling handling, packaging, and shipping
methods (40 CFR 262). All samples will be packaged in accordance with the requirements in INEEL
chain-of-custody and sample labeling procedures. Sample transport will be between the site and the SAM
facility. The SAM is responsible for all off-Site shipping.
4.1.12 Waste Management
Wastes generated during the characterization project will be addressed in accordance with the
project Waste Management Plan (DOE-ID 2004b).
4.2 Sample Analysis
Sample analysis will be performed by laboratories approved by the INEEL SAM. These
laboratories will perform analyses in accordance with project requirements, including ER-SOW-394.
Project-specific requests for analyses forms or TOS(s) identify additional requirements for
laboratory analysis. The following sections identify analysis requirements for this characterization
project.
4.2.1 Analytical Methods
To ensure that data of acceptable quality are obtained from characterization projects, standard EPA
laboratory methods or technically appropriate methods for analytical determinations will be used.
References for the most commonly used methods are listed here:
Soil Sampling and Analysis for Volatile Organic Compounds (EPA 1991a, pages 1-22)
Characterizing Soils for Hazardous Waste Site Assessments (EPA 1991b, pages 1-16)
A Compendium of Superfund Field Operations Methods (EPA 1987, pages 7-1 through 7-9, 8.1-1
through 8.4-51, 13-1 through 13-10, 15-1 through 15-58)
Statement of Work for Organic Analysis-Multimedia, Multi-Concentration (EPA 1994)
Statement of Work for Inorganic Analysis-Multimedia, Multi-Concentration (EPA 1993)
Test Methods for Evaluating Solid Waste, Physical and Chemical Methods (EPA 1996)
Methods for the Chemical Analysis of Water and Wastes (EPA 1983).

4-8
The general sample volumes, preservation, container types, and holding times for many of the
typically required analyses can be found in Tables 2-1 and 2-2 of the QAPjP (DOE-ID 2002a). American
Society for Testing and Materials or EPA sampling methods will be used whenever possible. The specific
information related to sampling bottles, preservation types, and holding times is found in Table 4-1 of
Section 4.1.6 of this plan.
4.2.2 Instrument Calibration Procedures
Laboratory instrumentation will be calibrated in accordance with each of the specified analytical
methods. The laboratory quality assurance plan shall include requirements for calibrations when
specifications are not listed in analytical methods. Calibrations that are typically not called out in
analytical methods include ancillary laboratory equipment and verification of reference standards used for
calibration and standard preparation. Laboratory documentation will include calibration techniques and
sequential calibration actions, performance tolerances provided by the specific analytical method, and
calibrations dates and frequency. All analytical methods have specifications for equipment checks and
instrument calibrations. The laboratory will comply with all method-specific calibration requirements for
all requested parameters. If a failure of instrument calibration or equipment is detected, the instrument
will be recalibrated, and all affected samples will be analyzed using an acceptable calibration.
4.2.3 Laboratory Records
Laboratory records are required to document all activities involved in sample receipt, processing,
analysis, and data reporting. Sample management records document sample receipt, handling and storage,
and the sample analysis schedule. The records verify that the COC and proper preservation were
maintained, reflect any anomalies in the samples, note proper log-in of samples into the laboratory, and
address procedures used to prioritize received samples to ensure that the holding time requirements
are met.
The laboratory is responsible to maintain documentation demonstrating laboratory proficiency
with each method as prescribed in standard operating procedures. Laboratory documentation will include
sample preparation and analysis details, instrument standardization, detection and reporting limits, and
test-specific QC criteria. Any deviations from prescribed methods must be properly recorded. QA/QC
reports will include general QC records, such as analyst training, instrument calibration, routine
monitoring of analytical performance, and calibration verification. Project-specific information, such as
blanks, spikes, calibration check samples, replicates, and splits performed per project requirements, may
be documented. Specific requirements for the quantity and types of QA/QC monitoring and associated
reporting formats will be specified in the task-specific laboratory statement of work.
4.3 Data Management and Document Control
4.3.1 Data Reporting
Tier I data packages are suggested for all analyses so that Level B validation could be performed at
a later date if determined necessary in the future. The final data package documentation will conform to
the criteria specified in ER-SOW-394.
The ER SOW prepared by the INEEL SAM organization is the standard by which analytical
data deliverable requirements are defined by INEEL projects to laboratories used by the INEEL. The
document used to establish technical and reporting standards will be adhered to by all laboratories used
by this project.

4-9
4.3.2 Data Validation
Data will be acquired, processed, and controlled prior to input to the IEDMS as required by the
INEEL. For the samples submitted to the analytical laboratory, all data will be validated to Level B, in
accordance with the QAPjP (DOE-ID 2002a).
A data limitation and validation report, including copies of chain-of-custody forms, sample results,
and validation flags, will be generated for each sample delivery group. All data limitation and validation
reports associated with a site will be transmitted to the EPA and IDEQ within 120 days from the last day
of sample collection. All definitive data will be uploaded to the IEDMS.
The SAM group will ensure the data are validated to Level B, as specified. The analytical method
data validation will be conducted in accordance with current INEEL SAM data validation procedures.
Validated data are entered into the IEDMS.
4.3.3 Data Quality Assessment
The data quality assessment process is used to determine whether or not the data meet the project
DQOs. Additional steps of the data quality assessment process may involve data plotting, testing for
outlying data points, and other statistical analysis relative to the characterization project DQOs.
In addition to primary project samples, QA/QC samples will be collected to establish the
quantitative and qualitative criteria necessary to describe the acceptability of the data by providing
information both comparable to and representative of actual field conditions. QA/QC control samples
consisting of field blanks and equipment rinsate blanks will be used to determine filed accuracy. QC
(duplicate) samples are used to measure field and laboratory precision. The QA/QC sample results will be
evaluated as outlined in the QAPjP (DOE-ID 2002a). Table 3-5 provides an overview of QA/QC sample
analysis for the sampling effort.
The completeness of the data is the number of samples collected and analyzed compared to the
number of samples planned. For this characterization plan, a 90% completeness objective for all analyses
has been established because some sample locations may not contain enough material for all analyses
requested.
Precision is a measure of agreement among replicate measurements of the same property. Accuracy
is a measure of the closeness of an individual measurement to the true value. Field and laboratory
precision and accuracy should be within the limits and goals mentioned in the QAPjP. Data results will be
evaluated upon completion of the project to determine whether precision and accuracy goals were met.
4.3.4 Document Control
Document control consists of the clear identification of all project-specific documents in an orderly
form, secure storage of the clear identification of all project-specific documents in an orderly form, secure
storage of all project information, and controlled distribution of all project information. Document control
ensures controlled documents of all types related to the project will receive appropriate levels of review,
comment, and revision, as necessary.

4-10
The PM is responsible for properly maintaining project documents according to INEEL document
control requirements. Upon completion of the characterization project, all project documentation and
information will be transferred to compliant storage according to project, program, and company
requirements. This information may include field logbooks, chain-of-custody forms, laboratory data
reports, engineering calculations and drawings, and final technical reports.
5-1
5. REFERENCES
40 CFR 136, Appendix B, 2003, “Definition and Procedure for the Determination of the Method
Detection Limit,” Code of Federal Regulation, Office of the Federal Register, July 2003.
40 CFR 262, 2003, “Standards Applicable to Generators of Hazardous Wastes,” Code of Federal Regulation, Office of the Federal Register, July 2003.
40 CFR 264, 2003, “Standards for Owners and Operators of Hazardous Waste Treatment, Storage, and
Disposal Facilities,” Code of Federal Regulation, Office of the Federal Register, July 2003.
49 CFR 171, 2002, “General Information, Regulations, and Definitions,” Code of Federal Regulations, Office of the Federal Register, October 2002.
49 CFR 172, 2002, “Hazardous Materials Table, Special Provisions, Hazardous Materials
Communications, Emergency Response Information, and Training Requirements,” Code of Federal Regulations, Office of the Federal Register, October 2002.
49 CFR 173, 2002, “Shippers—General Requirements For Shipments and Packagings,” Code of Federal Regulations, Office of the Federal Register, October 2002.
49 CFR 174, 2002, “Carriage by Rail,” Code of Federal Regulations, Office of the Federal Register,
October 2002.
49 CFR 175, 2002, “Carriage by Aircraft,” Code of Federal Regulations, Office of the Federal Register,
October 2002.
49 CFR 176, 2002, “Carriage by Vessel,” Code of Federal Regulations, Office of the Federal Register,
October 2002.
49 CFR 177, 2002, “Carriage by Public Highway,” Code of Federal Regulations, Office of the Federal
Register, October 2002.
49 CFR 178, 2002, “Specifications for Packagings,” Code of Federal Regulations, Office of the Federal
Register, October 2002.
Conover, W. J., 1980, Practical Nonparametric Statistics, New York: John Wiley & Sons, Inc.
DOE-ID, 1991, Federal Facility Agreement and Consent Order for the Idaho National Engineering Laboratory, Administrative Record No. 1088-06-29-120, U.S. Department of Energy Idaho Field
Office; U.S. Environmental Protection Agency, Region 10; Idaho Department of Health and
Welfare, December 4, 1991.
DOE-ID, 1997, Comprehensive RI/FS for the Idaho Chemical Processing Plant OU 3-13 at the INEEL – Part A, RI/BRA Report (Final), DOE/ID-10534, Rev. 0, U.S. Department of Energy Idaho
Operations Office, November 1997.
DOE-ID, 1999, Final Record of Decision, Idaho Nuclear Technology and Engineering Center, Operable Unit 3-13, DOE/ID-10660, Rev. 0, U.S. Department of Energy Idaho Operations Office,
October 1999.

5-2
DOE-ID, 2002a, Quality Assurance Project Plan for Waste Area Groups 1, 2, 3, 4, 5, 6, 7, 10, and Inactive Sites, DOE/ID-10587, Rev. 7, U.S. Department of Energy Idaho Operations Office,
September 2002.
DOE-ID, 2002b, Operable Unit 3-13, Group 3, Other Surface Soils, Prioritization and Site Grouping
Report, DOE/ID-10996, Rev. 0, U.S. Department of Energy Idaho Operations Office,
September 2002.
DOE-ID, 2003, ICDF Complex Waste Verification Sampling and Analysis Plan, DOE/ID-10985, Rev. 0,
U.S. Department of Energy Idaho Operations Office, February 2003.
DOE-ID, 2004a, Operable Unit 3-13, Group 3, Other Surface Soils Remediation Sets 1-3 (Phase I)
Remedial Design/Remedial Action Work Plan, DOE/ID-11089, Rev. 0, U.S. Department of Energy
Idaho Operations Office, February 2004.
DOE-ID, 2004b, Operable Unit 3-13, Group 3, Other Surface Soils Remediation Sets 1-3 (Phase I) Waste
Management Plan, DOE/ID-11092, Rev. 0, U.S. Department of Energy Idaho Operations Office,
January 2004.
EDF-ER-264, 2002, “INEEL CERCLA Disposal Facility Design Inventory,” Rev. 1, Idaho National
Engineering and Environmental Laboratory, December 2002.
EPA, 1983, Methods for the Chemical Analysis of Water and Wastes, EPA/600/4-79-020,
U.S. Environmental Protection Agency, March 1983.
EPA, 1987, A Compendium of Superfund Field Operations Methods, EPA/540-P-87/001,
U.S. Environmental Protection Agency, December 1987.
EPA, 1988, Guidance for Conducting Remedial Investigations and Feasibility Studies under the
Comprehensive Environmental Response, Compensation, and Liability Act, EPA/540/G-89/004,
Interim Final, U.S. Environmental Protection Agency, October 1988.
EPA, 1989, Methods for Evaluating the Attainment of Cleanup Standards, Volume I: Soils and Solid
Media, EPA/230/02-89-042, U.S. Environmental Protection Agency, February 1989.
EPA, 1991a, Soil Sampling and Analysis for Volatile Organic Compounds, EPA/540/4-91/001,
U.S. Environmental Protection Agency, February 1991.
EPA, 1991b, Characterizing Soils for Hazardous Waste Site Assessments, EPA/540/4-91/003,
U.S. Environmental Protection Agency, March 1991.
EPA, 1993, Statement of Work for Inorganic Analysis-Multimedia, Multi-Concentration, ILMO3.0,
U.S. Environmental Protection Agency, 1993.
EPA, 1994, Statement of Work for Organic Analysis-Multimedia, Multi-Concentration, OLM03.0,
U.S. Environmental Protection Agency, May 1999.
EPA, 1996, Test Methods for Evaluating Solid Waste, Physical/Chemical Methods, SW-846,
U.S. Environmental Protection Agency, 1996.

5-3
EPA, 2000, Data Quality Objective Process for Hazardous Waste Site Investigations, EPA QA/G-4HW,
EPA/600/R-00/007, U.S. Environmental Protection Agency, January 2000.
EPA, 2001, Supplemental Guidance for Developing Soil Screening Levels for Superfund Sites, Peer Review Draft, OSWER 9355.4-24, U.S. Environmental Protection Agency, March 2001.
EPA, 2002, RCRA Waste Sampling Draft Technical Guidance, Planning, Implementation, and Assessment, EPA 530D-02-002, U.S. Environmental Protection Agency, August 2002.
ER-SOW-394, 2002, “Idaho National Engineering and Environmental Laboratory Sample and Analysis
Management Statement of Work for Analytical Services,” Rev. 1, Idaho National Engineering and
Environmental Laboratory, December 2002.
INEEL, 2004, Operable Unit 3-13, Group 3, Other Surface Soils Remediation Sets 1-3 (Phase I) Health and Safety Plan, INEEL/EXT-03-00628, Rev. 0, Idaho National Engineering and Environmental
Laboratory, January 2004.
PRD-183, 2000, “Radiation Protection – INEEL Radiological Control Manual,” Rev. 6, Idaho National
Engineering and Environmental Laboratory, July 6, 2000.