Opening Address 22 May 2017 - SEAISIseaisi.org/seaisi2017/file/file/full-paper/Opening Address (Dr...
32
allow SPF and SCDF to notify BCA of incidents through the EMED incident mobile App during testing period Dr. John Keung CEO, Building and Construction Authority 1 Construction Productivity in Singapore – Changing the Way We Build 22 May 2017 Opening Address
Transcript of Opening Address 22 May 2017 - SEAISIseaisi.org/seaisi2017/file/file/full-paper/Opening Address (Dr...

allow SPF and SCDF to notify BCA of incidents through the EMED incident mobile App during testing period
Dr. John KeungCEO, Building and Construction Authority
1
Construction Productivity in Singapore –Changing the Way We Build
22 May 2017Opening Address

Singapore, an Island City State
Land Area – 720 km2
Population – 5.6 million
GDP per Capita – S$73,000
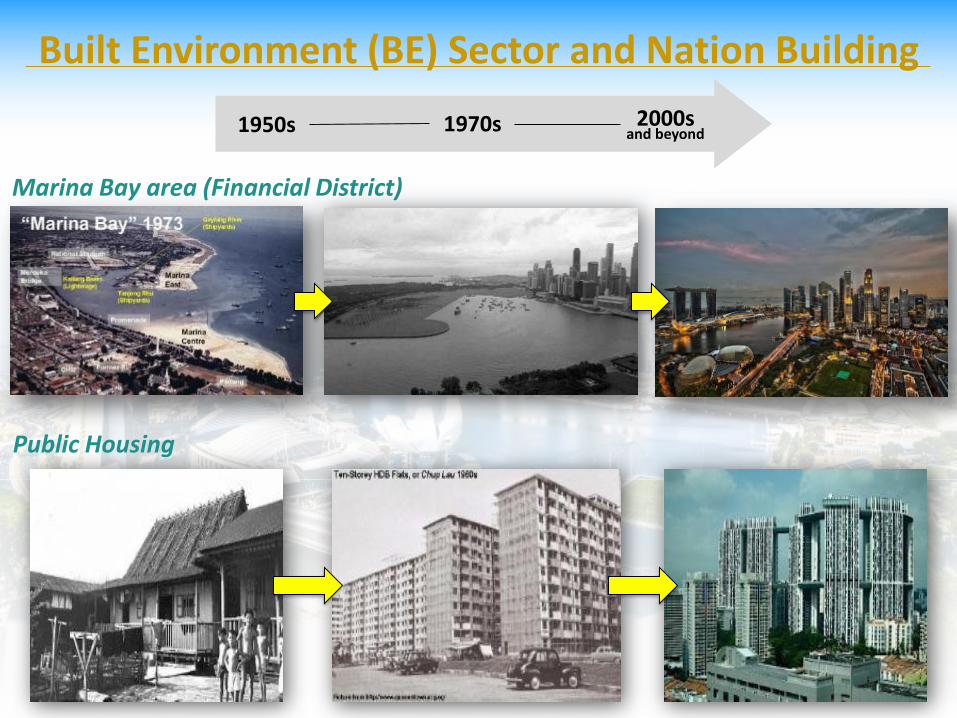
Built Environment (BE) Sector and Nation Building
1950s 1970s 2000sand beyond
Marina Bay area (Financial District)
Public Housing

Built Environment (BE) Sector and Nation Building
1950s 1970s 2000sand beyond
Seaport
Changi Airport
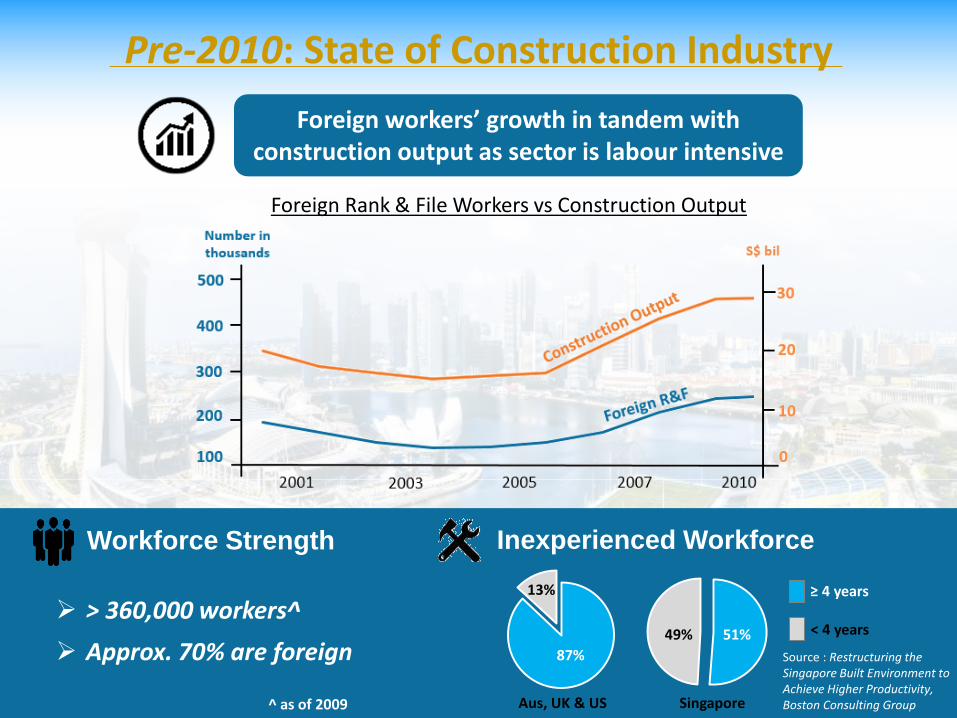
Pre-2010: State of Construction Industry
Foreign workers’ growth in tandem with construction output as sector is labour intensive
Foreign Rank & File Workers vs Construction Output
Workforce Strength Inexperienced Workforce
> 360,000 workers^
Approx. 70% are foreign
Aus, UK & US Singapore
< 4 years
≥ 4 years
87%
13%
51%49%
^ as of 2009
Source : Restructuring the Singapore Built Environment to Achieve Higher Productivity, Boston Consulting Group

Pre-2010: State of Construction Industry
2D Design (Hardcopy)
70
80
90
100
110
120
1994 1996 1998 2000 2002 2004 2006 2008
Value Added Productivity Growthfor Construction Industries
Singapore
Stagnant
Stagnating Value AddedProductivity
Low site productivity of0.380 m2 per manday(as of 2009)
Infancy in Digital Engineering Application

Pre-2010: State of Construction Industry
0
10,000
20,000
30,000
40,000
50,000
60,000
500 1,000 1,500 2,000 2,500 3,000 3,500 4,000 4,500 5,000
Na
tio
na
l C
on
str
uc
tio
n P
rod
uc
tivit
y (
US
$)
Unit Construction Cost in Major Cities (US$/m2)
National Construction Productivity vs Unit Construction Cost in Major Cities
Australia
(Various major cities)
Singapore
Japan
Philippines
Malaysia
Thailand
Korea Hong Kong
USA
UK
Source : National construction productivity were derived by MTI for the Economics Strategies Committee report. Unit Construction Costs in major cities were published by Landon & Seah Singapore Pte Ltd in their Construction Cost Handbook 2007-09.
Raising Productivity while Keeping Construction Cost Competitive

What Defines the Productivity Problem?
Dominance of Low Cost and Low Skilled Workers
Low Construction Wages
Average Weekly Wages (USD)
Source : Boston Consulting Group’s Average Weekly Wages chart cited in its 2014 Benchmarking report on Restructuring the Singapore Built Environment to Achieve Higher Productivity; )
Productive Technology (High Cost)
Manual Labour (Low Cost)
Cost ($)
High Substitution Cost
$$$
$

What Defines the Productivity Problem?
Silo Mentality in Construction Value Chain
Limited flow or exchange of information along value chain
Unproductive and costly reworks, inefficient building maintenance

Foreign Worker Levy
MYEMYE
MYEMYE
MYEMYE
MYEMYEMYE
CONSTRUCTIONWORKS
CONTRACT
$100m
Man-year allocated to Main Contractors based on their
project contract value
$180$250 $300 $300 $300 $300
$230
$350
$450$550 $600
$700
Jul-11
Jul-12
Jul-13
Jul-14
Jul-15
Jul-16
R1 (Higher Skilled)
Quota control Price mechanism+Man-Year Entitlement
(MYE) Quota
Note: Currency in SGD
How Did We Address the Productivity Problem?
Raise Manpower Cost to Drive Technology Substitution1

MinimumBuildable Design Score
Apply toArchitectsEngineers( )
MinimumConstructability Score
(Apply to Builders)
Downstream – Construction StageUpstream – Design Stage
Pro
gre
ssiv
e
Enh
ance
me
nts
2011 2013 2014 2015
BuildabilityThe extent to which a building design facilitates ease of construction
ConstructabilityThe extent to which labour-efficient technologies and methods are adopted downstream during construction
How Did We Address the Productivity Problem?
Set Minimum Standard through the Buildability Framework2

ConstructionProductivity
and CapabilityFund (CPCF)
Workforce Training andUpgrading (WTU) Fund
Funding support of training courses related to productivity
improvement
Enhanced BCA-IndustryBuilt Environment
Scholarship / Sponsorship
Build up PMET manpower capabilities by attracting new
entrants into the industry Building InformationModelling (BIM) Fund
Enhance BIM integration and collaboration through funding
support
ProductivityImprovementProjects (PIP)
Encourage technology adoption and process re-engineering through project co-funding
Mechanisation Credit(MechC) Scheme
Encourage builders to mechanisemanual works and reduce labour
reliance by con-funding equipment purchase and lease
Capability Building
Integration of Value Chain
Technology AdoptionS$800 million
How Did We Address the Productivity Problem?
Incentivise Private Sector to be 1st Movers3

Voluntary BIM submission
Mandatory BIM submission for new building projects> 20,000 m2
Mandatory BIM submission for new building projects> 5,000 m2
2010
2013
2015 andbeyond
How Did We Address the Productivity Problem?
Drive BIM Adoption through Regulation to Level Up Industry4

To achieve 25% to 30% productivity improvement from 2010 levels for
all new projects
Making productivity improvement as KPI
Identify pilot projects
Adopt game-changing technologies
*The agencies above constitute >70% of total public sector building and civil engineering works
How Did We Address the Productivity Problem?
Driving Productivity through Public Sector Procurement5

How Did We Address the Productivity Problem?
Driving Productivity through Public Sector Procurement5
Quality Price / Fee Productivity
Quality Fee Method (QFM)(procurement of consultancy services)
Increment in Productivity weightage:
Price Quality Method (PQM)(procurement of construction services)
Increment in Productivity weightage:
9% - 12% 20% 3% - 6% 10%
Tender

Executive Programmes Academic Programmes Specialist Cert. Programmes
Pro
fess
ion
al L
eve
lA
sso
ciat
e Le
vel
Executive Development Programme Postgraduate Degree Specialist Certificates
DegreeSeminars
Specialist Diploma
Diploma
Stanford-BCA Advanced Management Program: VDC LeadershipEnhancing Construction Productivity & Management (Kyoto University)
Workshop on Game-Changing Technologies (Build Smart Conference)
BCA-IFMA FM Conference
Master in International Construction Management with major in Construction Productivity (University of Florida, USA)
Bachelor of Construction Management (Building) (University of Newcastle, Australia)
PBU, MET & PPVC courses
VDC courses / workshops
Prefabricating our Future (PBU) Workshop
Certification Course in BIM Management
BIM Modelling courses
BIM Planning
S. Diploma & Advanced Cert. in Construction ProductivityS. Diploma in DfMA
S. Diploma in BIM; S. Diploma in VDC
S. Diploma in Lean Construction
Diploma in Construction IT
How Did We Address the Productivity Problem?
Nurture a Pipeline of Building Professionals6

>2,500 students
benefitted
Build Capabilities – Scholarships & Sponsorships at All Levels
How Did We Address the Productivity Problem?
Nurture a Pipeline of Building Professionals6

Site productivity is defined as the floor area completed per manday
0.380 0.3810.384
0.389
0.395
0.403
0.411
0.419
0.375
0.380
0.385
0.390
0.395
0.400
0.405
0.410
0.415
0.420
2009 2010 2011 2012 2013 2014 2015 2016
m2
pe
r m
and
ay
1.5%
0.8%0.3%
1.3%
2.0%
Year-on-Year Improvement in Site Productivity (building works)
2.0%
2.0%
10% cumulative
improvement since 2010
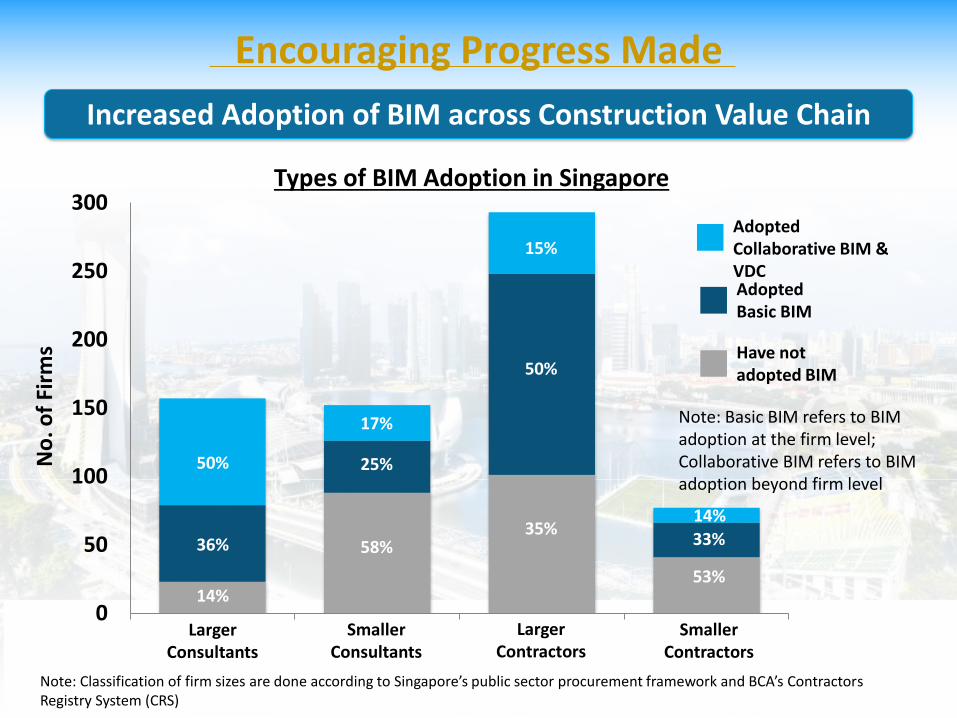
Encouraging Progress Made
Productivity Target: Annual average of 2-3% productivity improvement by 2020

2011 2014 2016
2011
2% Higher Skilled R1 Workers
2016
40% Higher SkilledR1 Workers
Ratio of Higher Skilled R1 Workers in the Industry
2%
20%
40%
Encouraging Progress Made
Improved Workforce Profile
0
50
100
150
200
250
300
Larger Consultants Smaller Consultants Larger Contractors Smaller Contractors
14%
36%
50%
58%
25%
17%
15%
50%
35%14%
33%
53%
LargerConsultants
SmallerConsultants
LargerContractors
SmallerContractors
Adopted Collaborative BIM & VDCAdoptedBasic BIM
Have notadopted BIM
Types of BIM Adoption in Singapore
No
. of
Firm
s
Note: Classification of firm sizes are done according to Singapore’s public sector procurement framework and BCA’s Contractors Registry System (CRS)
Note: Basic BIM refers to BIM adoption at the firm level; Collaborative BIM refers to BIM adoption beyond firm level
Encouraging Progress Made
Increased Adoption of BIM across Construction Value Chain

Sustain the Momentum

Riding the Challenges to Transform the Sector
Moving work offsite will improve productivity in 3 ways
• Controlled offsite environment• Scope for automation of offsite work• Scope for offshoring of offsite work
Designfor Manufacturing(off-site and automation)
and Assembly(on-site)
Changing the Way We Build
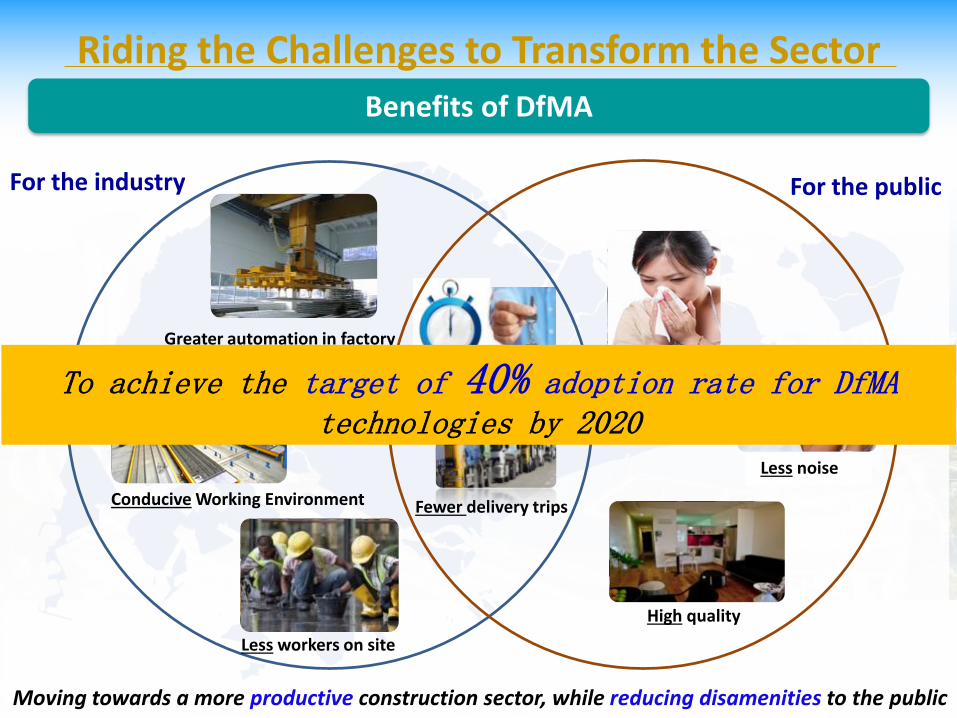
Riding the Challenges to Transform the Sector
Benefits of DfMA
High quality
Faster construction
For the industry For the public
Less workers on site
Greater automation in factory
Less dust
Less noise
Fewer delivery trips
Moving towards a more productive construction sector, while reducing disamenities to the public
Conducive Working Environment
To achieve the target of 40% adoption rate for DfMAtechnologies by 2020

Prefab Components
Str
uctu
ral
ME
PA
rch
itec
tura
l
Structural Steel / Advanced Precast / Hybrid
PBUs
Advanced Prefab Systems Integrated Sub-assemblies Fully Integrated Assemblies
PPVC
PPVC
Mass Engineered Timber (MET) / Hybrid
Precast PPVC
Dryrun Engineered timber floor
On-site Dry Applied Finishes
Prefab MEP Deck
Prefab Module with Platform/ Catwalk
Manpower Savings [Project Level]35%
40%
20%10%
70%
Manpower Savings [Trade Level]45% 60%
Prefab Plant
Prefab Ceiling Module/ Prefab Plant
Prefinished Surfaces
Flexible Water Pipe/ Sprinkler Dropper
Components:
Incremental Improvement
Integrated Assemblies:
Game-Changing Improvement
30%
Riding the Challenges to Transform the Sector
Continuum of Prefabrication and DfMA

Adoption of Steel PPVC atCrowne Plaza Changi Airport Hotel
Riding the Challenges to Transform the Sector

Adoption of Steel PPVC atCrowne Plaza Changi Airport Hotel
Riding the Challenges to Transform the Sector
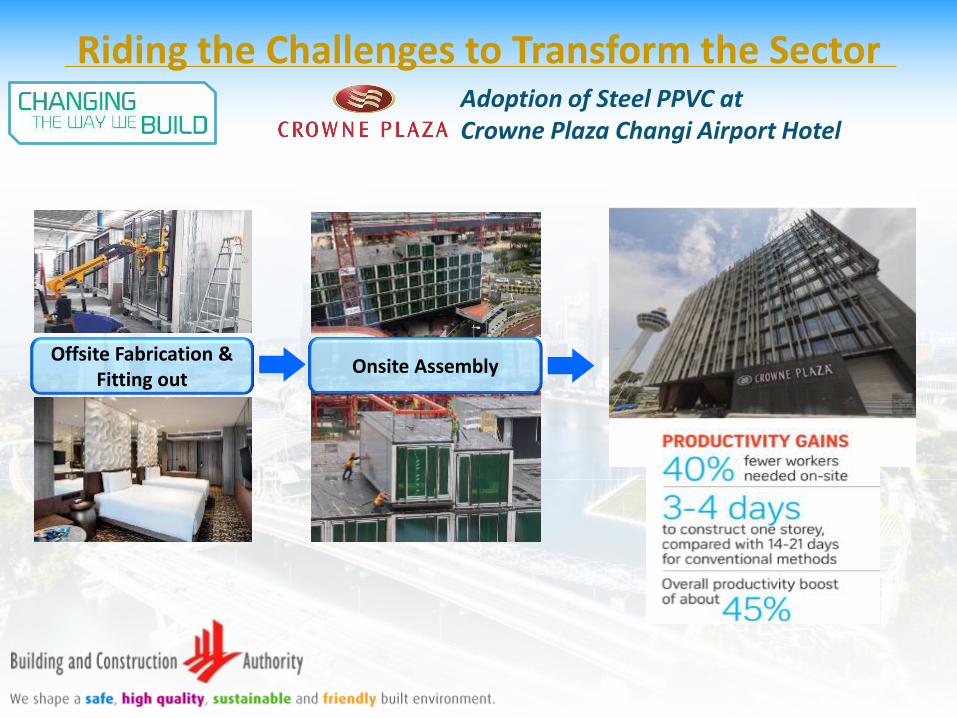
Onsite AssemblyOffsite Fabrication &
Fitting out
Adoption of Steel PPVC atCrowne Plaza Changi Airport Hotel
Riding the Challenges to Transform the Sector

Components
Fully Integrated Components
Steel PPVC
Up to 40% manpower savings at
project level
Advanced Prefab Systems
Structural steel/ hybrid construction
Up to 20% manpower savings at
project level
Continuum of Prefabrication (Steel)
Prefabricated steel cages
Up to 40%manpower savings at
trade level
Riding the Challenges to Transform the Sector
Use of Structural Steel

SCDF issued circular allowing the use of the design guide in Aug 2016
Performance based approach to Omit Fire Protection Works for Secondary Beams using New Design Guide for Fire Safety Design
• Omit fire protection on secondary beams without jeopardising building safety
• 30% to 40% reduction in fire protection works
Riding the Challenges to Transform the Sector
Enable More Extensive Use of Structural Steel

• BC1 – Allow use of alternative structural steel other than EN steel
• BC4 – Allow use of high grade structural steel for concrete filled tubular structures
• Manufacturer Accreditation Scheme to ensure Quality of PPVC production
Pas
t In
itia
tive
s
• SS560 – Develop new product specification for high grade 600 rebar for industry adoption
• New guidebook for buildable steel connections
• BC4 v2.0 to include encased composite columns using high grade materials
On
-go
ing
Init
iati
ves
High grade 600 rebar
BC4 v2.0
BC1 Design Guide
BC4 Design Guide
Manufacturer Accreditation Scheme
Guidebook for buildable steel connection
Riding the Challenges to Transform the Sector
Capability Building on Use of Steel
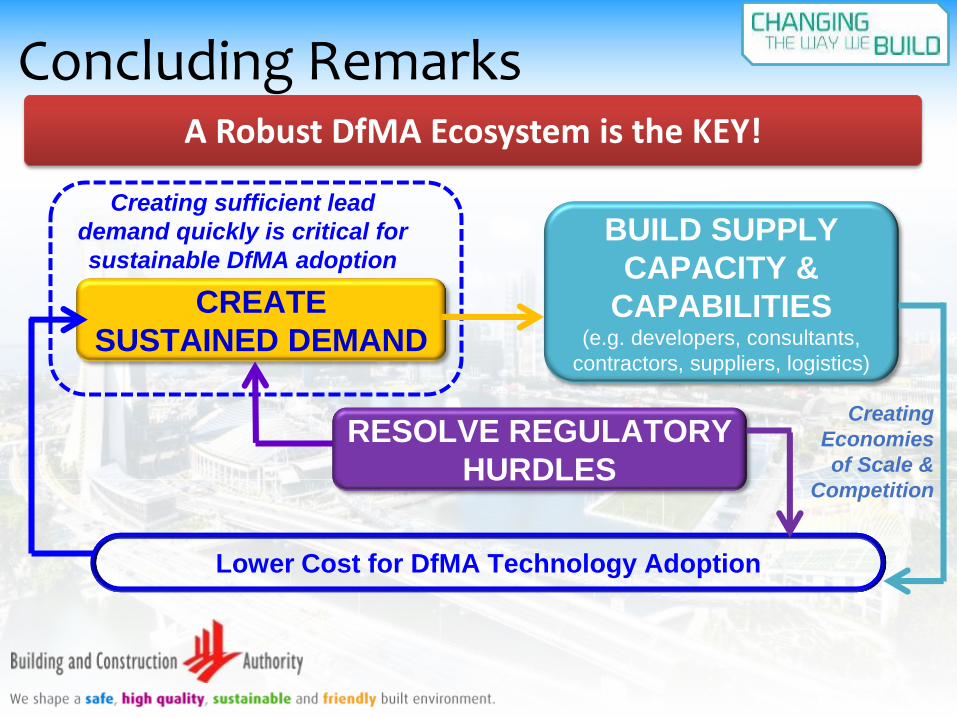
CREATE
SUSTAINED DEMAND
BUILD SUPPLY
CAPACITY &
CAPABILITIES(e.g. developers, consultants,
contractors, suppliers, logistics)
Lower Cost for DfMA Technology Adoption
Creating
Economies
of Scale &
Competition
Creating sufficient lead
demand quickly is critical for
sustainable DfMA adoption
RESOLVE REGULATORY
HURDLES
A Robust DfMA Ecosystem is the KEY!
Concluding Remarks