Open Spaces Customer Levels of Service Survey Report 2020
29
1 Open Space Assets - Customer Levels of Service Report 2020
Transcript of Open Spaces Customer Levels of Service Survey Report 2020

1
Open Space Assets -Customer Levels of Service Report 2020

29
Contents
Executive Summary 2
Purpose 4
Background 4
Methodology 6
Marketing of Survey 8
Survey Results and Analysis 8
Distribution of responses 9
Performance Rating 10
Importance 13
Cross comparison of performance and importance 14
Frequency of use 15
Future investment in infrastructure 16
Open Text Analysis 20
Key Findings 24
Recommendations 24
Appendix 25
Full list of responses by open space 25
Full breakdown of Level of Service by open space 26

2
Executive Summary
As part of a process of continual monitoring and evaluation of community assets, the Byron Shire Council sought feedback from the community in relation to customer levels of service for open spaces within Byron Shire. This feedback will inform the Customer Levels of Service section of the Open Spaces Asset Management Plan.
An online interactive map directing users to complete the Open Spaces Survey was conducted from 29th January 2020 to 3rd March 2020 and the results are presented in this report. There was comprehensive marketing of the survey on social media, print, website and direct email to selected groups.
The survey sought perceptions of the performance of open spaces against key criteria and the importance attached to these key criteria.

3
180 surveys completed; 63 different open spaces commented on; 73% (131) of respondents using nominated spaces weekly or more frequently; 75% (135) of respondents would rather have the council invest money on upgrading existing infrastructure; On a scale where 1 is Excellent and 5 is Very Poor,
Condition was ranked the most important criteria.
Average rating across all criteria was 2.84; Worst performer was disability access with an average of 3.05, closely followed by condition with an average of 3.04; Best performer was availability with an average of 2.63;
High-level statistics and fi ndings
Focus on maintaining or upgrading existing open spaces rather than building new facilities. Create dialogue with sporting teams to understand issues with the condition of current open spaces and help set expectations. Prioritise upgrades, particularly disability access upgrades, based on individual space performance (page 26). Review the relationship between public toilet locations and open spaces. Consider a public awareness campaign for online reporting of issues with the condition of open spaces. Consider a public awareness campaign to inform the community that the three parks at Brunswick Heads: Torakina, Banner and The Terrace Parks are not council managed open spaces.
Recommendations

4
Purpose
The Byron Shire Council is preparing an Open Spaces Asset Management Plan (OSAMP). This Plan provides information from the community on the customer level of service for open spaces for which Council has management responsibilities. This does not include three crown reserves at Brunswick Heads: Torakina Park, Banner Park and the Terrace Park.
Performance criteria include:
Condition e.g. softfall, broken infrastructure Amenity e.g. litter, grass/weeds, graffiti, etc. Functionality e.g. did the playground serve your purpose? Disability access e.g. footpath access, rubber compound, multi-use swings, hand rails, etc. Capacity e.g. cater to number of users Availability e.g. enough infrastructure for area
Respondents were also asked to nominate the importance of each of the performance criteria listed above.
Background
‘Assets’ refers to infrastructure that is managed by the Byron Shire Council. The major asset categories are roads, footpaths, car parks, drainage, parks and reserves, buildings, water and sewer. This report relates to open spaces that are owned or managed by Byron Shire Council.

5
This includes the following types of spaces:
Parks/reserves Playgrounds Sports fields Recreation facilities Tennis courts Skate parks Basketball courts Netball courts Swimming pools
Council assigns a Level of Service to open spaces. This is a combination of customer levels of service (LoS) and technical LoS (as detailed in the OSAMP). The customer LoS is based on what the community thinks is acceptable in terms of the quality, quantity and management of assets.
Council generally seeks public feedback on the current status of assets and community expectations for levels of service. Staff will review the community feedback and prepare a report to Council on the outcomes of the consultation. The results of all the feedback will also be used to guide the relevant asset management plans.
6
MethodologyAn internet based survey embedded into a mapping interface was developed and posted on the YourSay Byron Shire Website from 29th January 2020 to 3rd March 2020. Overall there were 1027 unique visitors to the map (as measured by distinct IP addresses) and 180 survey responses.
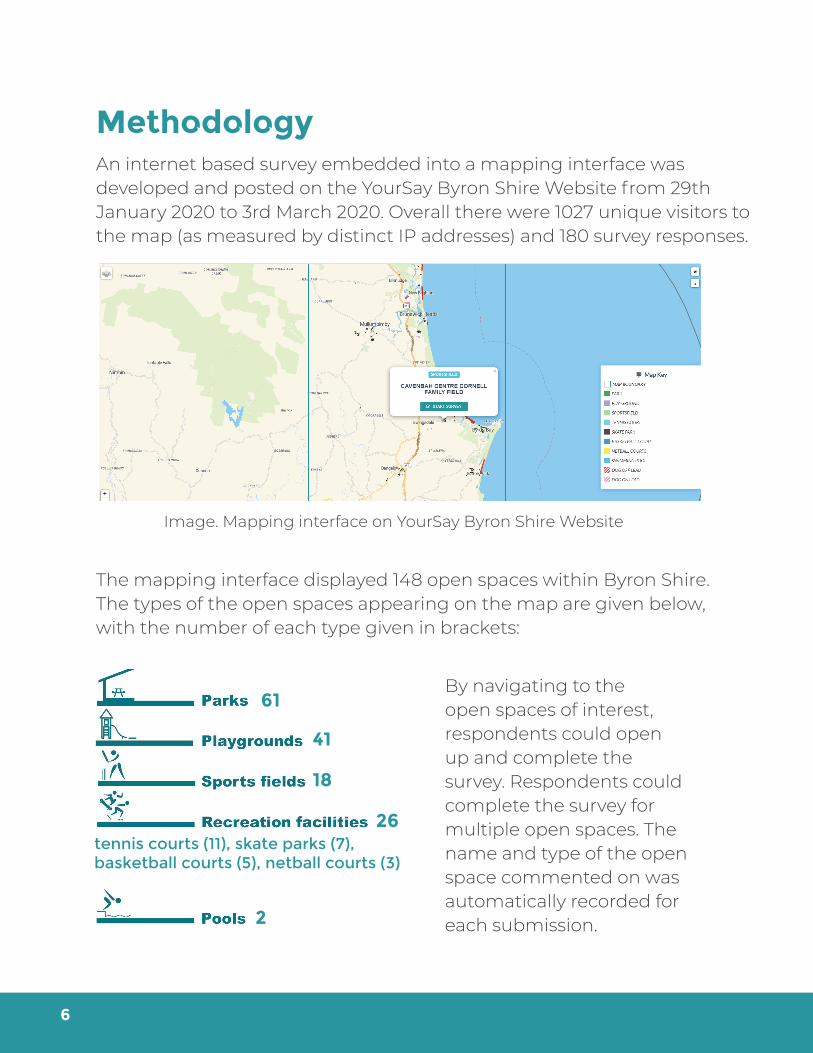
The mapping interface displayed 148 open spaces within Byron Shire. The types of the open spaces appearing on the map are given below, with the number of each type given in brackets:
By navigating to the open spaces of interest, respondents could open up and complete the survey. Respondents could complete the survey for multiple open spaces. The name and type of the open space commented on was automatically recorded for each submission.
Image. Mapping interface on YourSay Byron Shire Website
61
41
18
26tennis courts (11), skate parks (7), basketball courts (5), netball courts (3)
2

7
Survey Questions
1. How would you rate its overall condition?[Options: Excellent, Good, Fair, Poor, Very Poor]
2. How would you rate its overall cleanliness?[Options: Excellent, Good, Fair, Poor, Very Poor]
3. How would you rate its overall functionality?[Options: Excellent, Good, Fair, Poor, Very Poor]
4. How would you rate its overall disability access? [Options: Excellent, Good, Fair, Poor, Very Poor]
5. How would you rate its overall capacity?[Options: Excellent, Good, Fair, Poor, Very Poor]
6. How would you rate its overall availability?[Options: Excellent, Good, Fair, Poor, Very Poor]
7. How often do you use this space? [Options: Daily, Every few days weekly, Weekly, Fortnightly, Monthly, Every few months, Once a year]
8. Please rank the following attributes in order of importance.[Options: Condition, Cleanliness, Functionality, Disability access, Capacity, Availability]
9. Where would you like council to invest funds?[Options: sports field lighting, playgrounds, shelters, seats, pools, skate parks, picnic tables, pedestrian lighting, exercise equipment, tennis courts, bbqs, grandstands, netball courts, basketball courts]
10. If you would like more (answer of question above), where should we place it?[Options: Bangalow, Brunswick Heads, Byron Bay/Sunrise Estate, Cavanbah Sports Centre, Federal, Mullumbimby, Ocean Shores, Other, South Golden Beach/New Brighton, Suffolk Park]
11. Any other General Open Spaces comments or feedback?[Free text comment]
8
Marketing of Survey
During the consultation period the survey marketing included: Paid ¼ page advertisement in the Echo Newspaper Facebook paid advertisements Customised emails to more than 300 community members and all council staff Council media release Council community engagement web page - Yoursay Section in Community E News
Survey Results and Analysis
A total of 180 surveys were completed. Given the comprehensive marketing of the survey, this relatively low level of response for a community of around 34,000 signifi es that there is probably not a high level of dissatisfaction with facilities.
For each open space selected, survey respondents were asked to:
Rate the condition, cleanliness, functionality, disability access, capacity and availability of the space Identify how frequently they visit the space Rank the importance of condition, cleanliness, functionality, disability access, capacity and availability to the space Identify if Council should spend money on upgrading existing infrastructure or building new infrastructure Identify what type of infrastructure they would like to see more of Identify where they would like to see the infrastructure identifi ed above Provide any general comments or feedback on open spaces

9
Distribution of responses
“Sports fi elds” recorded the most responses, closely followed by “parks”. “Swimming pools” had the highest relative response rate, with 15 responses for the two swimming pools owned and managed by Council. No responses were provided for “basketball courts”.
Of the 148 open spaces displayed on the map, 63 spaces recorded at least one response. There was a wide spread of responses, with a maximum of 16 responses recorded for “Bangalow Sports Fields” and “Byron Bay Memorial Rec Grounds” and a minimum of one response recorded for 21 different spaces. The chart below displays the spaces with the most responses, with the full list of the number of responses by open space available in the appendix.
Chart. Number of responses by type of open space

10
Performance Rating
The following chart identifies the performance of the given set of criteria - condition, cleanliness, functionality, disability access, capacity and availability - for open spaces as a whole. The five point scale for performance was converted to a numerical scale where 1 = Excellent and 5 = Very Poor in order to find the average rating.
Generally, performance averaged around “Fair” across all criteria. Condition and disability access performed the worst; while both had similar total numbers of negative (Very Poor or Poor) ratings and positive ratings (Good or Excellent), both criteria had noticeably more Very Poor ratings compared to Excellent ratings. Availability was the best performing criteria, with over 50% positive ratings.
Playgrounds were the best performing type of space with an average of 2.38, indicating it is approaching “Good”. Parks were the worst performing with an average of 3.05, indicating that it is just below than “Fair”.
Chart. Number of responses by type of open space

11
Note: for the purposes of this chart, ‘Don’t Know’ responses were discarded, thus ‘disability access’ has 30 less responses than the other criteria.
The following table gives Council an indication of public perceptions of the service levels of the types of open spaces. This is intended to serve as a guide for where to focus Council’s maintenance efforts.
Infographic. Average performance ratings by type of open space
Chart. Performance ratings for all spaces
3.05
2.55
2.77 Average
2.38
2.79
2.84

12
For visualisation purposes, the colour scale given below is used to create a heatmap of the average scores. The lighter the cell background, the higher the average score; conversely, the lighter the cell background, the higher the average score for the given criteria for the type of space.
Please note that this is an aggregate average for all responses collected for the given type of open space. The table displaying the average performance of all spaces is available in the appendix.
Swimming pools, parks and skate parks all performed below average. All three performed poorly on the disability access criteria, while swimming pools also scored poorly on availability and parks scored poorly on condition and functionality. Skate parks scored poorly across all criteria, with an average rating between Very Poor and Poor for condition and disability access.
1Excellent
2Good
3Fair
4Poor
5Very Poor
Table. Performance by criteria - by open space type

13
Importance
The following chart identifies the importance of the given set of criteria - condition, cleanliness, functionality, disability access, capacity and availability - for open spaces as a whole.The ranking by most common response for each criterion is:
1. Condition (98 responses)
2. Cleanliness (63 responses)
3. Functionality (69 responses)
4. Disability access (71 responses)
5. Capacity (98 responses)
6. Availability (96 responses)
In contrast, by numerical average where 1 = least important and 6 = most important, the ranking from most important is:
1. Condition: 5.27
2. Functionality: 4.53
3. Cleanliness: 4.07
4. Disability Access: 2.52
5. Availability: 2.32
6. Capacity: 2.29
Condition is the clear first rank, with over 50% of respondents nominating it as their first ranked criteria and over 75% of respondents ranking it within their top 2. Functionality and cleanliness changed rankings depending on how the average was measured; while cleanliness had more respondents ranking it second, it also had less first place rankings and was more likely to be ranked 4th place or lower.
Capacity was least likely to rate highly, with only 7 people nominating it as either 1st or 2nd place; however, it was the third least likely to be ranked last behind availability (ranked last for over 50% of respondents) and disability access.

14
As such, when considering average rankings, availability ranks higher than capacity given the balance of higher placings to lower placings.
Cross comparison of performance and importance
A cross comparison was made of average performance of open spaces against the importance of key criteria for open spaces. The importance comes from the ranking provided, with 1 = least important and 6 = most important. The five point scale for performance was converted to a numerical scale where 1 = excellent and 5 = very poor.
It is interesting to note that the most important criterion (condition) rated fairly low in performance, with the least important criteria (capacity and availability) rating the highest. In general, performance decreases and importance increases. It is possible that this is an effect of the respondent’s attention being drawn to issues in current service levels.
Chart. Ranking of criteria for all spaces

15
Disability access is important to note as the sole deviation from this trend. This is likely because issues with disability access service levels are often immediately noticeably and difficult to miss.
Frequency of use
In general, open spaces saw frequent use. In total, 56 respondents nominated using spaces “every few days weekly”, closely followed by “weekly” with 52 responses.
Over 80% of respondents who used social sport open spaces (netball courts, sports fields and tennis courts) visited at least once a week. This indicates that most respondents visited these open spaces regularly as part of a routine or as part of a sports club or team. This was particularly evident with netball courts and tennis courts, which both recorded no daily visitors but many weekly visitors. Open spaces used for more individual sports - skate parks and swimming pools - were more likely to record either frequent (daily / every few days) or infrequent use (every few months / once a year).
Chart. Average performance against average importance

16
Skate parks were most likely to record either very frequent use (daily) or very infrequent use (once a year). All the daily responses were recorded for “Beach Drive & Dengha Place Skate park”, with the other responses spread out over the 7 other skate parks surveyed.
Social gathering spaces - parks and playgrounds - were most likely to record a wide range of responses. This likely reflects the wide range of parks and playgrounds within Byron Shire, from neighbourhood spaces to larger gathering spaces.
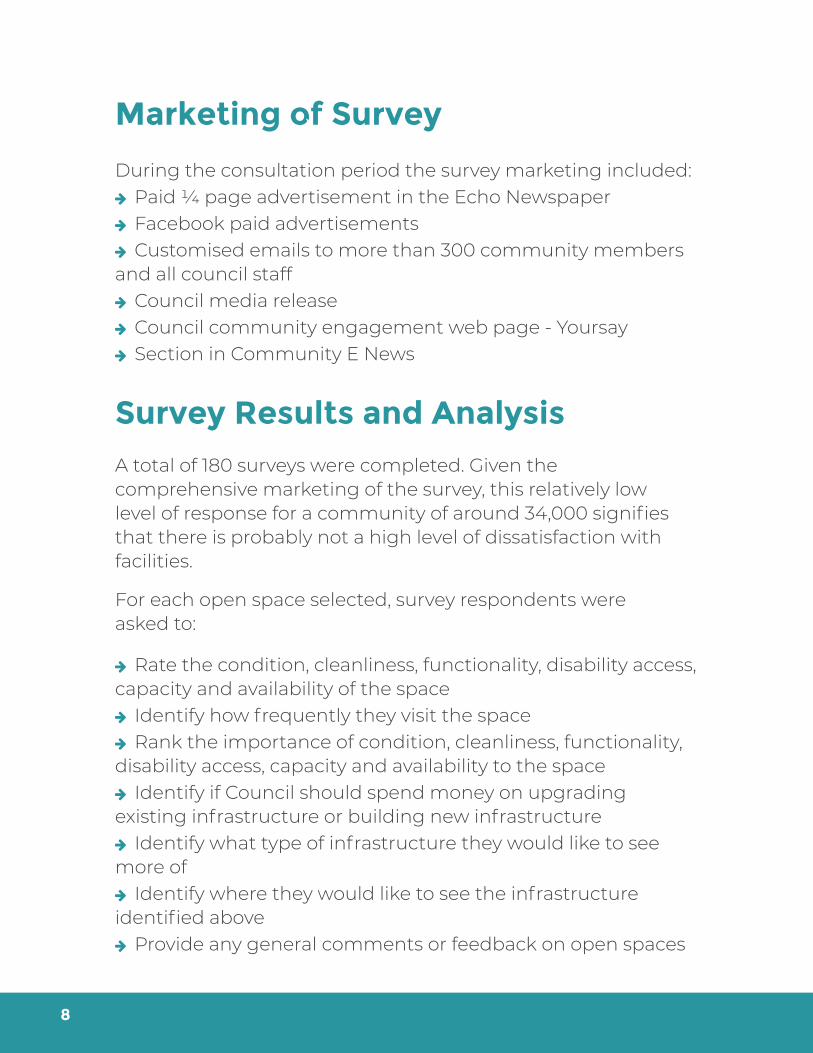
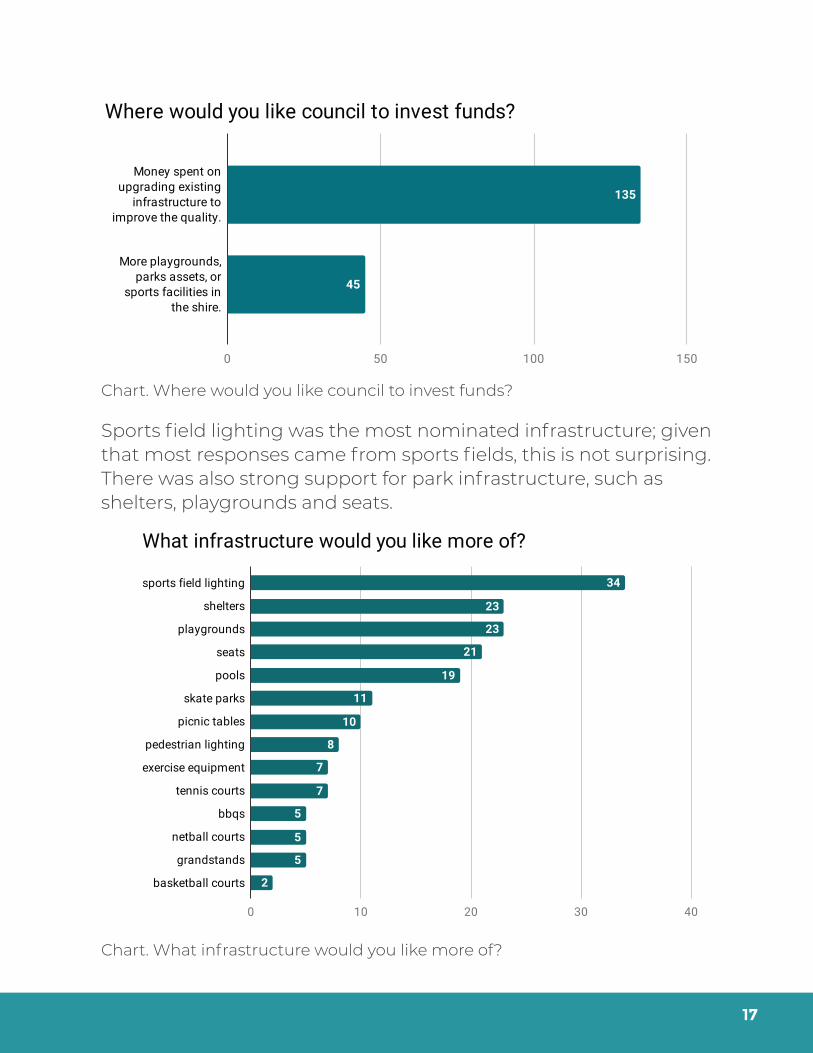
Future investment in infrastructure
There was a clear preference for the Council to spend money on upgrading existing infrastructure rather than building new infrastructure. This reflects previous findings in this report regarding the importance and performance of the condition of assets. The community appears to value quality over quantity of infrastructure.
Chart. How often do you use this space?
17
Sports field lighting was the most nominated infrastructure; given that most responses came from sports fields, this is not surprising. There was also strong support for park infrastructure, such as shelters, playgrounds and seats.
Chart. Where would you like council to invest funds?
Chart. What infrastructure would you like more of?

18
The following heatmap indicates where the types of infrastructure were requested, with the darker cells representing more requests. The most requests for infrastructure was at Mullumbimby (30 responses), closely followed by Bangalow, Brunswick Heads and Byron Bay / Sunrise Estate (29 responses).
Sports field lighting at Bangalow was the most common request (22 responses) and comprised most of the responses for Bangalow. In most other cases, the responses for types of infrastructure and locations for request were relatively distributed rather concentrated.
In the location choice, respondents who chose the “Other” option were expected to detail this in the later comment section. While some of these respondents mentioned locations in their comments, the majority did not provide useful data and hence further information is not available.

19

20
Open Text Analysis
Respondents were asked to provide general open spaces comments or feedback. Out of 180 responses, 125 came with open text comments. Most comments were directed at the specific condition of current facilities. Common issues include (please note that the quotes used here may be sections of longer quotes):
Drainage at Byron Bay Memorial Rec Grounds
“The grounds drainage and maintenance of the turf is not supporting how many players, teams, clubs and spectators use it.”
Lights at Bangalow and Mullumbimby
“Great community venue, lighting needs to be upgraded to enable greater night time use of this facility”
“Please consider installing lights in the car park too. Netball is a winter sport so training sessions finish in the dark.”
Capacity of tennis courts at both Mullumbimby and Bangalow “The tennis courts are at capacity for the junior comp Saturday, and many times during the week e.g. Tuesday night, with all courts being used.”
Covered heated pool which can be used around the year “In a shire surrounded by water, it is unacceptable not to be able to offer essential life skills in the form of swimming lessons all year
round.”
Accessibility of Brunswick Heads
“A little bit of thought would make a great contribution to he water’s edge and accessing the water by less able people in our community while protecting the waters edge from erosion.”

21
Revamp of skate parks
“Byron Bay is seriously lacking a good skatepark in its township. The existing one is essentially unusable and coarse concrete makes it much more dangerous.”
Toilet facilities at Mullumbimby netball courts
“Embarrassing when we run carnivals over 500 female participants/ parents attending and we have toilets with no lighting and they always get block[ed].”
Positive comments were nearly always tempered by the issues with current facilities. This indicates that while there is community goodwill for current open spaces, there is a need to continue to upgrade and maintain these facilities to ensure future utilisation. Examples include (please note that the quotes used here may be sections of longer quotes):
- “The Byron Bay Pool is an iconic and community gem. It serves a vital role in swimming development in a coastal community and offers a nearby “safe option” to less confident swimmers, who still wish to experience Byron Bay’s beautiful coastal views. However its ability to service the local community and it’s groups is increasingly falling behind nearby regions... This is due to it’s highly irregular specs not being suitable to community groups, limited capacity and disregard for the upkeep of functional aspects in the surrounding area.”
- “Bangalow sports fields are a fantastic resource for the community and well used throughout the year. Lighting for the fields is below average across the fields. The condition of the playing surface has been very poor in recent months with bindii, lack of grass and other weeds making it difficult for a even playing surface”
- “This area along the creek is stunning and yet there is nothing there- no seats, no landscaping, no lighting, no pathways, gardens etc. Better urban design will reinforce the unique design of this beautiful river.”

22
- “Waterlily park playground looks wonderful with the upgrade and new play area. But I find it is not designed for little children. The rocks surrounding the area are definitely a hazard. I spend my whole time running after my grandchildren in case they fall and hit their head on one of these badly positioned rocks.”
There were very few comments regarding open spaces in general. A few comments articulated the importance and need for open spaces for the community, while other comments made generalised statements regarding the state of open space within Byron Shire. Examples include (please note that the quotes used here may be sections of longer quotes):
- “Open spaces should be inclusive ie. cater for all abilities and all ages. They all need park furniture so people can rest and relax. They all need sports facilities nearby for recreation for all ages, and not just one sport either. If young people had more sporting facilities close to their home, there would not be so much graffiti or vandalism. Team sports are important to build character and self-esteem, socialising and working with others, taking pride in your area and the things you love to do, and learn values from coaches and older role models.”
- “Investment in playground equipment in the residential areas would promote neighbourhood interaction and physical activity optimising emotional health for families.”
- “Please upgrade and maintain what we have before overcommitting to more facilities.”
- “The condition of the grassed areas are poor and lack tree cover. Plant more trees in all parks and gardens. View the management of parks in Melbourne for some inspiration on providing usable and attractive spaces for communities.”
- “Comments from visiting families are that Byron Bay town doesn’t offer much in the way of playgrounds - they are small and often run down which is disappointing for an expensive destination (I explained that Byron Council doesn’t see the tourist $). Most of the attraction for families is the beach and nature.”

23
- “Better urban design along the river and connection to the town to foster use of the spaces- community gardens and lighting and pathways along all urban streets is required.”
Public toilets do not form a part of the open spaces asset class and are not detailed in this survey and are instead managed inside the Buildings Asset Management Plan. However, there were also several comments regarding the lack of good, accessible and clean public toilets in and near open spaces. Examples include (please note that the quotes used here may be sections of longer quotes):
- “My eight year old even said the other day I just can’t go to the toilets at Main Beach anymore I feel like vomiting.”
- “There is … not enough toilets when there are sporting days on the toilet clogs up and are not able to be used, it is not nice when you have visitors to the area, especially when you go to other towns and the public toilets are a lot brighter and cleaner.”

24
Key Findings Open spaces are well used, with many respondents regularly visiting weekly or even more than once a week.
Condition and disability access are the main areas of public dissatisfaction with levels of service. Skate parks performed very poorly across all the criteria. The community appears to value quality over quantity of infrastructure. The vast majority of respondents (75%) would prefer upgrading existing infrastructure to building new facilities. Requests for upgrading infrastructure were spread out across the open spaces. In the general comments section, the majority of comments related to the need to upgrade existing assets at specific locations. While there is goodwill towards open spaces within Byron Shire, this is tempered by the condition of many facilities.
Recommendations Focus on maintaining or upgrading existing open spaces rather than building new facilities. Create dialogue with sporting teams to understand issues with the condition of current open spaces and help set expectations. Prioritise upgrades, particularly disability access upgrades, based on individual space performance. Consider a public awareness campaign for online reporting of issues with the condition of open spaces. Consider a public awareness campaign to inform the community that the three parks at Brunswick Heads: Torakina, Banner and The Terrace Parks are not council managed open spaces. Review the relationship between public toilet locations and open spaces.

25
AppendixFull list of responses by open space

26
Full breakdown of Level of Service by open space
1Excellent
2Good
3Fair
4Poor
5Very Poor
No Response

27

28
Table. Performance by criteria - by open space