OPEN-SOURCE DIGITAL ELEVATION MODEL (DEMs) EVALUATION WITH ... · OPEN-SOURCE DIGITAL ELEVATION...
8
OPEN-SOURCE DIGITAL ELEVATION MODEL (DEMs) EVALUATION WITH GPS AND LiDAR DATA. N F Khalid a , A H M Din a, b *, K M Omar a , M F A Khanan a , A H Omar a , A I A Hamid a and M F Pa’suya a a Geomatic Innovation Research Group (GIG), Faculty of Geoinformation and Real Estate, Universiti Teknologi Malaysia, 81310 Johor Bahru, Johor, Malaysia. b Geoscience and Digital Earth Centre (INSTEG), Universiti Teknologi Malaysia, 81310 Johor Bahru, Johor, Malaysia. *[email protected] KEY WORDS: Digital Elevation Model, inundation mapping, vertical accuracy, LiDAR, scale factor, coastal inundation risk assessment ABSTRACT: Advanced Spaceborne Thermal Emission and Reflection Radiometer-Global Digital Elevation Model (ASTER GDEM), Shuttle Radar Topography Mission (SRTM), and Global Multi-resolution Terrain Elevation Data 2010 (GMTED2010) are freely available Digital Elevation Model (DEM) datasets for environmental modeling and studies. The quality of spatial resolution and vertical accuracy of the DEM data source has a great influence particularly on the accuracy specifically for inundation mapping. Most of the coastal inundation risk studies used the publicly available DEM to estimated the coastal inundation and associated damaged especially to human population based on the increment of sea level. In this study, the comparison between ground truth data from Global Positioning System (GPS) observation and DEM is done to evaluate the accuracy of each DEM. The vertical accuracy of SRTM shows better result against ASTER and GMTED10 with an RMSE of 6.054 m. On top of the accuracy, the correlation of DEM is identified with the high determination of coefficient of 0.912 for SRTM. For coastal zone area, DEMs based on airborne light detection and ranging (LiDAR) dataset was used as ground truth data relating to terrain height. In this case, the LiDAR DEM is compared against the new SRTM DEM after applying the scale factor. From the findings, the accuracy of the new DEM model from SRTM can be improved by applying scale factor. The result clearly shows that the value of RMSE exhibit slightly different when it reached 0.503 m. Hence, this new model is the most suitable and meets the accuracy requirement for coastal inundation risk assessment using open source data. The suitability of these datasets for further analysis on coastal management studies is vital to assess the potentially vulnerable areas caused by coastal inundation. 1. INTRODUCTION Nowadays, Digital Elevation Model (DEM) data is widely used in the coastal modeling processing due to the fact that they do not only represent the land elevation but also the bathymetry data. Additionally, most of the coastal inundation risk assessment uses DEM to project sea level rise in order to predict coastal inundation and related damages to human lives along coastal lines. The accuracy and resolution of DEM plays a major role in coastal inundation risk studies, as land elevation largely decides whether a specific area will be inundated or remain dry during the sea level rise event. However, inundation extent was found to be very sensitive to terrain representation especially in the low-lying deltaic area (van de Sande et. al, 2012). Yet, these areas are most vulnerable to coastal inundation and adequate risk assessments are needed. DEM datasets can be generated using various techniques such as air-borne for instance photogrammetric and Light Detection and Ranging (LiDAR) methods, space-borne interferometry, radar altimetry, and conventional surveying techniques (e.g Global Positioning System (GPS) and leveling) (Mukherjee et al., 2012 and Athmania & Achour, 2014). Nevertheless, the entire techniques have its own advantages and disadvantage in terms of accuracy, sampling density, pre-processing, and price tag. Within airborne context, LiDAR produces high accuracy datasets and are able to collect terrain data over large areas (Leon et. al, 2014). Although accurate, the availability of LiDAR data for some regions may be limited due to relatively higher cost plus time constraint. As a result, many decide to instead use the freely available DEM datasets for coastal inundation risk assessment. The freely available open-source DEM datasets such as Advanced Spaceborne Thermal Emission and Reflection Radiometer-Global Digital Elevation Model (ASTER GDEM), Shuttle Radar Topography Mission (SRTM), and Global Multi-resolution Terrain Elevation Data 2010 (GMTED2010) are usually used for coastal inundation risk assessment even though these datasets have coarser resolution and relatively low accuracy. The International Archives of the Photogrammetry, Remote Sensing and Spatial Information Sciences, Volume XLII-4/W1, 2016 International Conference on Geomatic and Geospatial Technology (GGT) 2016, 3–5 October 2016, Kuala Lumpur, Malaysia This contribution has been peer-reviewed. doi:10.5194/isprs-archives-XLII-4-W1-299-2016 299
-
Upload
hoangkhanh -
Category
Documents
-
view
223 -
download
0
Transcript of OPEN-SOURCE DIGITAL ELEVATION MODEL (DEMs) EVALUATION WITH ... · OPEN-SOURCE DIGITAL ELEVATION...

OPEN-SOURCE DIGITAL ELEVATION MODEL (DEMs) EVALUATION WITH GPS AND LiDAR DATA.
N F Khalid a, A H M Din a, b*, K M Omar a, M F A Khanan a, A H Omar a , A I A Hamid a and M F Pa’suya a
aGeomatic Innovation Research Group (GIG), Faculty of Geoinformation and Real Estate, Universiti Teknologi Malaysia, 81310 Johor Bahru, Johor, Malaysia.
bGeoscience and Digital Earth Centre (INSTEG), Universiti Teknologi Malaysia, 81310 Johor Bahru, Johor,
Malaysia. *[email protected]
KEY WORDS: Digital Elevation Model, inundation mapping, vertical accuracy, LiDAR, scale factor, coastal inundation risk assessment
ABSTRACT: Advanced Spaceborne Thermal Emission and Reflection Radiometer-Global Digital Elevation Model (ASTER GDEM), Shuttle Radar Topography Mission (SRTM), and Global Multi-resolution Terrain Elevation Data 2010 (GMTED2010) are freely available Digital Elevation Model (DEM) datasets for environmental modeling and studies. The quality of spatial resolution and vertical accuracy of the DEM data source has a great influence particularly on the accuracy specifically for inundation mapping. Most of the coastal inundation risk studies used the publicly available DEM to estimated the coastal inundation and associated damaged especially to human population based on the increment of sea level. In this study, the comparison between ground truth data from Global Positioning System (GPS) observation and DEM is done to evaluate the accuracy of each DEM. The vertical accuracy of SRTM shows better result against ASTER and GMTED10 with an RMSE of 6.054 m. On top of the accuracy, the correlation of DEM is identified with the high determination of coefficient of 0.912 for SRTM. For coastal zone area, DEMs based on airborne light detection and ranging (LiDAR) dataset was used as ground truth data relating to terrain height. In this case, the LiDAR DEM is compared against the new SRTM DEM after applying the scale factor. From the findings, the accuracy of the new DEM model from SRTM can be improved by applying scale factor. The result clearly shows that the value of RMSE exhibit slightly different when it reached 0.503 m. Hence, this new model is the most suitable and meets the accuracy requirement for coastal inundation risk assessment using open source data. The suitability of these datasets for further analysis on coastal management studies is vital to assess the potentially vulnerable areas caused by coastal inundation.
1. INTRODUCTION Nowadays, Digital Elevation Model (DEM) data is widely used in the coastal modeling processing due to the fact that they do not only represent the land elevation but also the bathymetry data. Additionally, most of the coastal inundation risk assessment uses DEM to project sea level rise in order to predict coastal inundation and related damages to human lives along coastal lines. The accuracy and resolution of DEM plays a major role in coastal inundation risk studies, as land elevation largely decides whether a specific area will be inundated or remain dry during the sea level rise event. However, inundation extent was found to be very sensitive to terrain representation especially in the low-lying deltaic area (van de Sande et. al, 2012). Yet, these areas are most vulnerable to coastal inundation and adequate risk assessments are needed. DEM datasets can be generated using various techniques such as air-borne for instance photogrammetric and Light Detection and Ranging (LiDAR) methods, space-borne interferometry, radar altimetry, and conventional surveying
techniques (e.g Global Positioning System (GPS) and leveling) (Mukherjee et al., 2012 and Athmania & Achour, 2014). Nevertheless, the entire techniques have its own advantages and disadvantage in terms of accuracy, sampling density, pre-processing, and price tag. Within airborne context, LiDAR produces high accuracy datasets and are able to collect terrain data over large areas (Leon et. al, 2014). Although accurate, the availability of LiDAR data for some regions may be limited due to relatively higher cost plus time constraint. As a result, many decide to instead use the freely available DEM datasets for coastal inundation risk assessment.
The freely available open-source DEM datasets such as Advanced Spaceborne Thermal Emission and Reflection Radiometer-Global Digital Elevation Model (ASTER GDEM), Shuttle Radar Topography Mission (SRTM), and Global Multi-resolution Terrain Elevation Data 2010 (GMTED2010) are usually used for coastal inundation risk assessment even though these datasets have coarser resolution and relatively low accuracy.
The International Archives of the Photogrammetry, Remote Sensing and Spatial Information Sciences, Volume XLII-4/W1, 2016 International Conference on Geomatic and Geospatial Technology (GGT) 2016, 3–5 October 2016, Kuala Lumpur, Malaysia
This contribution has been peer-reviewed. doi:10.5194/isprs-archives-XLII-4-W1-299-2016
299

Since SRTM, ASTER-GDEM, and GDTEM2010 data are open to the public, a significant amount of researchers are interested to study their accuracy using different techniques for validation. However, the overall accuracy assessment of DEM requires GPS data measurement that includes regional ground truth data with higher precision level to verify the DEM data accuracy (Gorokhovich & Voustianiouk, 2006 and Du et al., 2012).
Many validations of this DEMs have been completed at global and region due to its great potential use, more specific evaluation on regional would be analyzed (Hirt et. al., 2010 and Shortridge & Messina, 2011) It would give more benefits to the global user due to the various accuracy of these elevation models over the difference regional. According Luana et. al., (2015) ASTER-GDEM version 2 was generally proved to be more accurate than another model with an RMSE of 12.12m for the coastal zone of the Shandong Province, Eastern China and widely used in coastal environmental studies for that particular area. Gunduz & Kara, (2015) undertook an assessment for deriving DEMs in a flood prone at California, United States. Different type of DEMs with different resolution and accuracy such as LiDAR, SRTM, ASTER, and G-TOPO were used to evaluate the influence of the DEM resolution on the quality and accuracy of coastal inundation. These models were compared to two scenarios for determining the extent and depth of the inundation. They found that the LiDAR and SRTM show the highest absolute elevation accuracies as it reflects the variations in topography which is extremely crucial in hydrological connectivity.
Moreover, Sanders, (2007) stated that the SRTM vertical accuracy is greater on relatively flat terrain, such as flood plains compared to high relief area. For unsteady flow St, Francis River, SRTM yielded a flood area just 12% larger than national elevation data (NED) data. In addition, 25% of flood zone are produced by SRTM for steady flow at Santa Clara River.
The focus of this study is to perform an assessment of the DEM datasets accuracy such as SRTM, ASTER-GDEM and GDTEM2010 in terms of vertical accuracy with validation using ground truth data. The relationship and correlation between ground control points retrieved from GPS observation and DEM dataset are important in order to provide a better DEM estimation within coastal area specifically for coastal inundation risk assessment. 1.1 Global Elevation Model
Digital elevation dataset comes in many different forms either global or near global coverage. DEM can be used for generating three-dimensional (3D) graphics displaying terrain slope, aspect (direction of slope), and terrain profiles between selected points.
As one of the digital elevation data source, SRTM is a collaboration product of National Aeronautics and Space Administration (NASA), National Imagery and Mapping Agency (NIMA), the German space agency (DLR) and Italian
space agency (ASI) for generating near-global DEM using satellite radar interferometry. SRTM has successfully obtained a complete global DEM after the 11 days mission starting from 11th February until 22nd February 2000. According to Du et al. (2012), SRTM has access to worldwide public in the future, where the whole datasets have been fully orthographically processed.
SRTM dataset has a spatial resolution of 90 m (3 arc-second) which is available for the entire earth land between latitudes 60°N to 56°S including Malaysia region. However, 1 arc-second (30 m) spatial resolution is only available for the United States. Concurrently, it produces 16 m absolute vertical height accuracy or 90 % linear error and the absolute horizontal accuracy is 20 m (90 % circular error) (NASA, 2015). The data is referenced to the World Geodetic System 1984 (WGS84) ellipsoid on the horizontal directions, and Earth Geopotential Model 1996 (EGM96) geoid in the vertical direction. Figure 1 shows the left hand image has data sample spaced every 90 meters (295 feet) while the right hand image has sample spaced every 30 meters (98 feet).
Figure 1.Spatial resolution of SRTM imagery data (NASA, 2015).
ASTER-GDEM dataset is jointly developed by Japan’s Ministry of Economy, Trade, and Industry (METI) and National Aeronautics and Space Administration (NASA) on 2009. ASTER-GDEM has an along-track stereoscopic capability to obtain stereo images with a base-to-height ratio of 0.6 using near infrared spectral band (3N) and its nadir-viewing and backward-viewing (3B) telescope is 27.7 angles. ASTER-GDEM product is generated by applying the stereo correlation methodology towards its 1.5 million stereo pairs. The spatial resolution of band 3N and 3B is 15 m and the generated DEM is 30 m. It covers land surfaces between 83°N and 83°S (Abrams & Hook, 2002). The absolute vertical accuracy of ASTER GDEM version-1 is 20 m at 95% confidence level. ASTER GDEM is referenced to the WGS84 and Earth Geopotential Model 1996 (EGM96) geoid for horizontal and vertical direction respectively.
The United States Geological Survey (USGS) and The National Geospatial-Intelligence Agency (NGA) came out with a new digital elevation product known as GMTED2010 to replace the existing model designed as Global 30 Arc-Second Elevation (GTOPO30). GMTED2010 became available to public since 2010 (Athmania & Achour, 2014). The GMTED2010 data has three different resolutions on horizontal spacing of 7.5 arc-second (about 250 meter), 15 arc-second (about 500 meter) and 30 arc-second (about 1 kilometer) and is based on data derived from 11 raster based elevation sources using DEM fusion technique.
The International Archives of the Photogrammetry, Remote Sensing and Spatial Information Sciences, Volume XLII-4/W1, 2016 International Conference on Geomatic and Geospatial Technology (GGT) 2016, 3–5 October 2016, Kuala Lumpur, Malaysia
This contribution has been peer-reviewed. doi:10.5194/isprs-archives-XLII-4-W1-299-2016
300
The GMTED2010 primary dataset source is a 1 arc-second SRTM Digital Terrain Elevation data. To fill in the remaining area outside SRTM coverage, the following data sources are used
1. non-SRTM digital terrain elevation data (DTED) 2. Canadian Digital Elevation Data (CDED) at two
resolutions. 3. Satellite Pour Observation de la Terre (SPOT 5) in
3 dimensional (3D). 4. National Elevation Dataset (NED) for the
continental United States and Alaska. 5. GEODATA 9 arc-second digital elevation model
(DEM) for Australia. 6. Antarctica satellite radar and laser altimeter DEM 7. Greenland satellite radar altimeter DEM.
(Danielson & Gesch, 2011)
This new product was generated based on an aggregation method such as breakline emphasis, systematic subsample, minimum height, maximum height, mean height, median height, and standard deviation of elevation. Geographical reference system of the entire product is referred to WGS84 for horizontal datum and EGM96 for vertical datum. The vertical accuracy is ±90 meters, or approximately ±40 meter root mean square error (RMSE) for 30 arc-second GMTED10 data. 1.2 Reference Elevation Model LiDAR is an airborne method that uses light in the shape of pulsed laser to measure ranges (variable distances) to the Earth. These light pulses are combined with other data recorded by the airborne system to obtain precise, 3D information about the shape of the globe and its surface characteristics. LiDAR DEM resolves terrain with the accuracy of vertical RMSE of 0.05 m - 0.20 m. LiDAR DEM dataset is widely used in different fields including for estimating inundation over coastline. Unfortunately, these data are very expensive.
In order to obtain the data for conducting this study, the LiDAR survey was conducted on board an aircraft in the year 2008 that covered the Kelantan area. Using GPS method, LiDAR data are collected with reference to the ground data control point since there was no reference elevation dataset available. The bare earth point was processed to a grid horizontal resolution of 3 m. With an RMSE of 0.117 m and a standard deviation of 0.117 m compared to the ground control point, LiDAR DEM was considered acceptable. The absolute vertical accuracy of LiDAR DEM is 0.15 m. LiDAR DEM of Kelantan area is referred to the MRSO projection system with Kertau 1948 for horizontal datum and MyGeoid on vertical datum.
2. STUDY APPROACH 2.1 Study Area
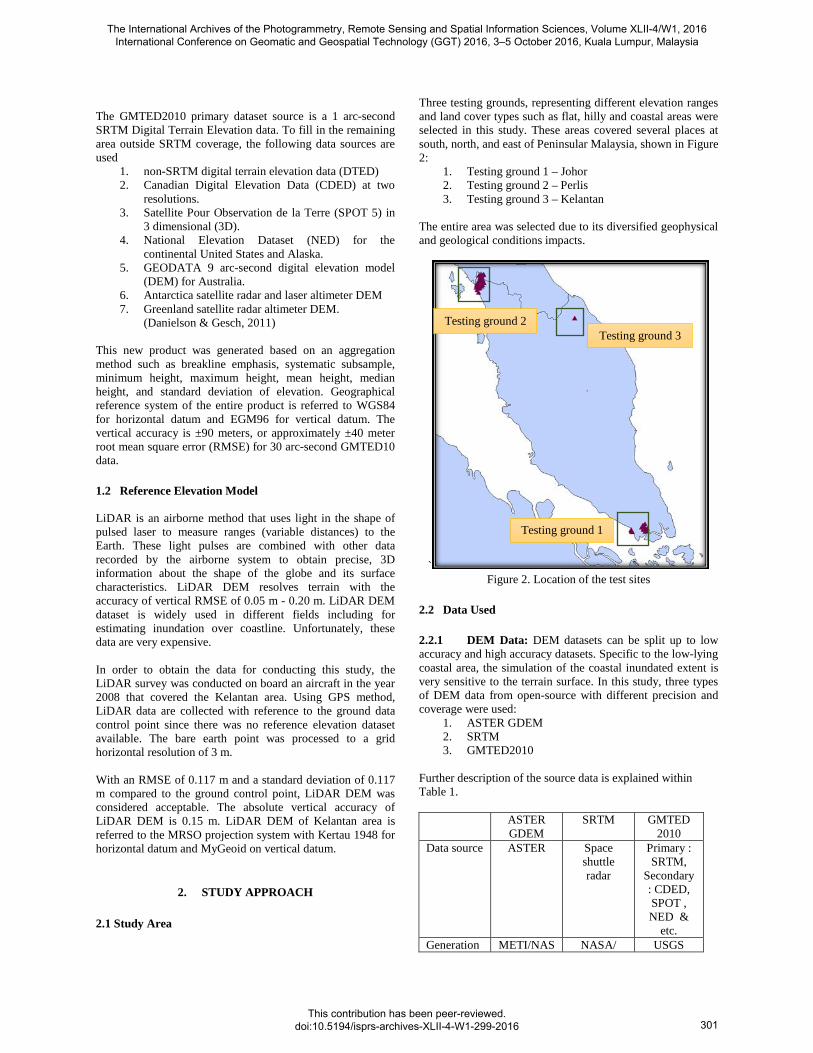
Three testing grounds, representing different elevation ranges and land cover types such as flat, hilly and coastal areas were selected in this study. These areas covered several places at south, north, and east of Peninsular Malaysia, shown in Figure 2:
1. Testing ground 1 – Johor 2. Testing ground 2 – Perlis 3. Testing ground 3 – Kelantan
The entire area was selected due to its diversified geophysical and geological conditions impacts.
` Figure 2. Location of the test sites
2.2 Data Used 2.2.1 DEM Data: DEM datasets can be split up to low accuracy and high accuracy datasets. Specific to the low-lying coastal area, the simulation of the coastal inundated extent is very sensitive to the terrain surface. In this study, three types of DEM data from open-source with different precision and coverage were used:
1. ASTER GDEM 2. SRTM 3. GMTED2010
Further description of the source data is explained within Table 1.
ASTER GDEM
SRTM GMTED 2010
Data source ASTER Space shuttle radar
Primary : SRTM,
Secondary : CDED, SPOT , NED &
etc. Generation METI/NAS NASA/ USGS
Testing ground 2 Testing ground 3
Testing ground 1
The International Archives of the Photogrammetry, Remote Sensing and Spatial Information Sciences, Volume XLII-4/W1, 2016 International Conference on Geomatic and Geospatial Technology (GGT) 2016, 3–5 October 2016, Kuala Lumpur, Malaysia
This contribution has been peer-reviewed. doi:10.5194/isprs-archives-XLII-4-W1-299-2016
301

and distribution
A CGIAR-CSI-
Release year
2009 2003 2010
Data acquisition period
2000 - ongoing
11 days (in 2000)
-
Resolution 1 arc-second (30m)
3 arc-second (90m)
7.5 arc-second (±1km)
DEM accuracy (vertical.)
20m 10-16m ±90m
DEM coverage
83 degrees north - 83 degrees south
60 degrees north - 56 degrees south
84 degrees north - 90 degrees south
Reference System
WGS84 / EGM96-
geoid
WGS84 / EGM96-
geoid
WGS84 / EGM96-
geoid Area Cover Malaysian
Region Malaysian
Region Malaysian
Region Table 1. DEM data input characteristics
2.2.2 Ground Truth Data: In this study, data from GPS survey were used as ground truth data. GPS ground truth data is able to produce the much needed high accuracy DEM on land. Several areas were used to cover flat land, hills, and coastline to obtain few points as ground truth data. The GPS data used in this study are acquired using a static method. These GPS data observations were connected with MyRTKnet stations which was indicated as known positions while performing data observation and processing. 2.3 Data Preparation and Processing
DEM datasets were obtained freely from these websites:
1. ASTER GDEM from http://gdex.cr.usgs.gov/gdex/ 2. SRTM from http://srtm.csi.cgiar.org/ 3. GMTED2010 from
http://topotools.cr.usgs.gov/gmted_viewer/viewer.htm
These DEMs are projected using World Geodetic System (WGS84) and then clipped to the extent of each testing ground. Subsequently, the three DEMs were assigned orthometric heights with respect to the geoid model computed using EGM96. The extraction of elevation value of DEM was done using the export-bound functionality of Global Mapper Software. However, the GPS data observation provided the Geocentric Datum for Malaysia (GDM2000) as default vertical datum to compute the relative heights. Using the Geodetic Datum Transformation Suite (GDTS) software, the DEM was transformed into WGS84. After the transformation, the elevation of the DEM was converted to orthometric height. Therefore, GPS geometric height had to be converted to orthometric height by subtracting the height of the geoid at each GPS point location. The basic formula for these conversions is:
H = h – N (1)
where H = orthometric height h = ellipsoidal height N = geoid height (EGM96)
This conversion was made due to the entire open-source DEMs that used similar reference which is EGM96 for vertical datum. The image of the entire open-source DEMs are shown in Figure 3.
(a)
(b)
(c)
Figure 3. Open-source DEMs from different data sets: (a) SRTM, (b) ASTER-GDEM, (c) GMTED2010.
2.4 Data Validation Statistical indices in this study can be used to evaluate, validate and compare the DEM against GPS data. From this statistical study, the vertical accuracy of the DEM can be
The International Archives of the Photogrammetry, Remote Sensing and Spatial Information Sciences, Volume XLII-4/W1, 2016 International Conference on Geomatic and Geospatial Technology (GGT) 2016, 3–5 October 2016, Kuala Lumpur, Malaysia
This contribution has been peer-reviewed. doi:10.5194/isprs-archives-XLII-4-W1-299-2016
302

determined. This also assists to understand the correlation, trends and error propagation between the DEM and GPS dataset. For each point, an elevation error was computed as the difference between model and reference data. (See Equation 2) (Athmania & Achour, 2014):
Zdiff = Zmodel – Zref (2) In Equation 2, Zdiff is the elevation error, Zmodel is the elevation of the DEM and Zref is the elevation of the GPS points. Later, the value of mean error (ME), RMSE were computed for each model (See Equation 3 and 4) .
ME = (3)
RMSE = (4)
RMSE are measures of surface quality and provide the understanding of differences between two types of data (predicted by model and observed data). The level of agreement between ASTER GDEM, SRTM and GMTED2010 derived elevation values and GPS data were also evaluated in terms of linear regression and correlation, R2
by comparing the value of each DEM against GPS validation points.
3. RESULT AND DISCUSSION 3.1 Validation of the DEM and GPS data In order to do the evaluation between these two data which is from ground truth data and open-sources DEM data, 71 points from GPS station distributed around the Johor Bahru, Perlis and Kelantan was picked randomly representing the area of flat land, hilly and coastal line. Extraction and validation values between DEM and GPS points were obtained using Global Mapper software. However, when it come to the DEM validation, the best achievable accuracy of the DEM was required. Figure 4 presents the comparison between ground truth data and SRTM, ASTER-GDEM and GMTED2010 data images around Johor, Perlis and Kelantan.
Figure 4: Comparison of DEM and Orthometric Height from GPS Data.
In this study, correlation for the entire DEM models was computed. By plotting the point between orthometric height (GPS) and DEM height (SRTM, ASTER-GDEM, and GMTED2010), the result of the regression value, R2 are shown in Figure 5.
Graphs in Figure 5 indicate highly confident and correlation level between orthometric height from GPS and elevation
height from SRTM, ASTER-GDEM, and GMTED2010 values. The relationship, whether strong or weak between orthometric height (GPS) and DEM height (SRTM, ASTER-GDEM, and GMTED2010) can be determined by referring to the result from the regression model. This means, the most suitable and strongest model was selected as the best model for the low accuracy DEM in order to identify the potential areas to be inundated.
The International Archives of the Photogrammetry, Remote Sensing and Spatial Information Sciences, Volume XLII-4/W1, 2016 International Conference on Geomatic and Geospatial Technology (GGT) 2016, 3–5 October 2016, Kuala Lumpur, Malaysia
This contribution has been peer-reviewed. doi:10.5194/isprs-archives-XLII-4-W1-299-2016
303

(a)
(b)
(c)
Figure 5. Correlation coefficient analysis between DEMs
datasets and GPS data.
The overall result from the R2 indicated that SRTM has the correlation which is 0.912, while the ASTER GDEM, and GMTED2010 shows the correlation of 0.761 and 0.900, respectively. The basic statistical analysis for these DEMs highlighted that the accuracy of SRTM is much better with SD and RMSE of 4.714 m and 6.054 m compared to other DEMs (see Table 2). ASTER GDEM exhibited the largest residual error with a RMSE of 7.885 m. However, GMTED2010 significantly improved with a RMSE of 6.078 m.
SRTM ASTER GDEM
GMTED2010
Min (m) -0.116 -12.667 -10.011 Max (m) 34.523 43.774 36.676 Mean (m) 3.839 -0.922 3.464 RMSE (m) 6.054 7.885 6.078
Table 2. Statistical analysis of the validation of the SRTM,
ASTER-GDEM, and GMTED2010 This means, SRTM model will be used as an elevation model to identify the potential inundated area for the low-accuracy DEM data during simulation. 3.2 Generation of a New DEM by Applying Scale Factor
From the previous result, the DEM with the lowest RMSE is subsequently selected in order to produce a better elevation model within Malaysian region. Hence, SRTM with a RMSE of 6.054 m is used as a scale factor to generate the new DEM. The RMSE value was subtracted with the existing SRTM model using the scale factor formula. The scatter plot from this new DEM was drawn after applying the scale factor value. The result shows that the correlation was significantly improved when the R2 indicated is 0.951. Figure 6 shows the linear regression parameter of the new DEM and GPS data.
Figure 6. Correlation between new SRTM and GPS. After executing the scale factor onto SRTM, the statistical analysis was concluded. The mean error of the new SRTM and GPS data was found to be ± 13.960 m. For the new SRTM, the value of RMSE was 3.737 m, respectively. Table 3 summarizes the statistical results of the elevation value.
SRTM Σ Error2 (m) 949.285 Mean Error2 (m) 13.960 RMSE (m) 3.736
Table 3. Statistical result between the new
SRTM and GPS data generation.
The International Archives of the Photogrammetry, Remote Sensing and Spatial Information Sciences, Volume XLII-4/W1, 2016 International Conference on Geomatic and Geospatial Technology (GGT) 2016, 3–5 October 2016, Kuala Lumpur, Malaysia
This contribution has been peer-reviewed. doi:10.5194/isprs-archives-XLII-4-W1-299-2016
304

3.3 The Comparison between New SRTM Model and LiDAR Data
In this section, the vertical accuracy between the new SRTM data is evaluated based on the LiDAR data obtained at Kelantan area. However, the assessment of the vertical accuracy was more focused on the coastal area of the Kelantan. Since the LiDAR elevation data is relative to the Malaysia Rectified Skew Orthomorphic (MRSO) projection and the height of Malaysian Geoid (MyGeoid), the data should be transferred to the same reference system before comparing these two types of elevation data. The processed data was only compared with test points containing 50 individual point heights. Figure 7 displays the location of these 50 points overlaid with elevation models.
Figure 7. LiDAR overlaid on top of the new SRTM dataset with point validation.
The comparison was made with an extraction of LiDAR points, overlaid with the new SRTM points in order to compare the heights on the exact test points horizontal (Easting, Northing) locations. Validation value for the data in this study was done internally and surpasses the expectation accuracy. Table 4 shows the descriptive statistical result for the new SRTM versus LiDAR data for the Kelantan area. From this result, the mean error of the new SRTM data was found to be -0.054 m. Apparently, the range error between the new SRTM and LiDAR is from -0.873 m (minimum) and 0.905 m (maximum). The value of RMSE exhibit slight difference when it reached 0.449 m.
SRTM versus LIDAR Min (m) -0.873 Max (m) 0.905 Mean Error (m) -0.054 RMSE (m) 0.449
Table 4. Statistical error of new SRTM versus LiDAR data.
4. CONCLUSION AND RECOMMENDATION This study was conducted to investigate the quality of three differences types of open-source DEM datasets over three testing grounds located at Johor, Perlis, and Kelantan within Peninsular Malaysia. Freely available DEM datasets from SRTM, ASTER GDEM, and GMTED2010 with high accuracy of vertical resolution were used in this study. Initially, the characteristics of DEMs were described in detail. Then, an evaluation was made between open-source DEM and high accuracy vertical elevation measurement (LIDAR) with respect to GPS data observation. It can be seen that the resultant DEMs assessment on SRTM DEM came up with the highest correlation of 0.912 m. Furthermore, RMSE and SD of SRTM also reached the lowest value of 6.054 m and 4.714 m compared against other open-source DEMs. This simply means SRTM produced the highest accuracy from the validation using the GPS points. On top of that, the new generated SRTM DEM proved to be more accurate than the previous SRTM DEM when a scale factor was applied. A Linear regression model between the new SRTM and GPS data was developed where a higher correlation of 0.951 m was achieved. LIDAR DEM represents a reliable source of terrain data for coastal inundation modeling due to its vertical and horizontal accuracies. The analysis of the relationship between the new SRTM and LiDAR data found that the range of RMSE is 0.449 m. Therefore, it can be conclude that the new model based on the SRTM datasets especially using the scale factor can be used to improve the accuracy of DEM. The results from this assessment are crucial to determine the suitability of these datasets whether the quality and vertical resolutions of the DEM chosen good enough to continue with further analysis on inundation risk management studies especially for potentially vulnerable areas caused by coastal inundation.
ACKNOWLEDGMENT The authors would like to acknowledge The Geomatic Innovation Research Group (GnG), Geoscience and Digital Earth Centre (INSTeG), and The Geospatial Imaging and Information Research Group (GI2RG), all from UTM for their contributions on this projects. The authors wish to express their sincere appreciation to ICGEM, CGIAR-CSI, NASA, NIMA, METI, and USGS LP DAAC for making this
The International Archives of the Photogrammetry, Remote Sensing and Spatial Information Sciences, Volume XLII-4/W1, 2016 International Conference on Geomatic and Geospatial Technology (GGT) 2016, 3–5 October 2016, Kuala Lumpur, Malaysia
This contribution has been peer-reviewed. doi:10.5194/isprs-archives-XLII-4-W1-299-2016
305

work possible by freely providing DEM and EGM96 data for the scientific community. High appreciation goes to Department of Irrigation and Drainage for providing LiDAR data over Kelantan area. Our gratitude also goes to The Ministry of Higher Education Malaysia (MOHE) for their financial support of this study, under the Fundamental Research Grant Scheme (FRGS), Vote Number R.J130000.7827.4F706
REFERENCES Abrams, M., & Hook, S. (2002). ASTER User Handbook Version 2. Jet Propulsion (Vol. 2003). Retrieved from Abrams2002NASA.pdf Athmania, D., & Achour, H. (2014). External validation of the ASTER GDEM2, GMTED2010 and CGIAR-CSI- SRTM v4.1 free access digital elevation models (DEMs) in Tunisia and Algeria. Remote Sensing, 6(5), 4600–4620. http://doi.org/10.3390/rs6054600 Danielson, J., & Gesch, D. (2011). Global Multi-resolution Terrain Elevation Data 2010. Terrain (Vol. 2010). Du, X., Guo, H., Fan, X., Zhu, J., Yan, Z., & Zhan, Q. (2012). Vertical accuracy assessment of SRTM and ASTER GDEM over coastal regions of China: A comparative analysis. 33rd Asian Conference on Remote Sensing 2012, ACRS 2012, 2, 1236–1243. Retrieved from http://www.scopus.com/inward/record.url?eid=2-s2.0-84880028729&partnerID=tZOtx3y1 Gorokhovich, Y., & Voustianiouk, A. (2006). Accuracy assessment of the processed SRTM-based elevation data by CGIAR using field data from USA and Thailand and its relation to the terrain characteristics. Remote Sensing of Environment, 104(4), 409–415. http://doi.org/10.1016/j.rse.2006.05.012 Gunduz, O., & Kara, G. T. (2015). Influence of DEM Resolution on GIS-Based Inundation Analysis, Hirt, C., Filmer, M. S., & Featherstone, W. E. (2010). Comparison and validation of the recent freely available ASTER-GDEM ver1, SRTM ver4.1 and GEODATA DEM-9S ver3 digital elevation models over Australia. Australian Journal of Earth Sciences, 57(3), 337–347. http://doi.org/10.1080/08120091003677553 Leon, J. X., Heuvelink, G. B. M., & Phinn, S. R. (2014). Incorporating DEM uncertainty in coastal inundation mapping. PLoS ONE, 9(9), 1–12. http://doi.org/10.1371/journal.pone.0108727 Luana, S., Hou, X., & Wang, Y. (2015). Assessing the Accuracy of SRTM Dem and Aster Gdem Datasets for the Coastal Zone of Shandong Province, Eastern China. Polish Maritime Research, 22(s1), 15–20. http://doi.org/10.1515/pomr-2015-0026
Mukherjee, S., Joshi, P. K., Mukherjee, S., Ghosh, A., Garg, R. D., & Mukhopadhyay, A. (2012). Evaluation of vertical accuracy of open source Digital Elevation Model (DEM). International Journal of Applied Earth Observation and Geoinformation, 21(1), 205–217. http://doi.org/10.1016/j.jag.2012.09.004 NASA Jet Propulsion Laboratory. (2016, January 26). Retrieved from Shuttle Radar Topography Mission (SRTM): http://www2.jpl.nasa.gov/srtm/ Sanders, B. F. (2007). Evaluation of on-line DEMs for flood inundation modeling. Advances in Water Resources, 30(8), 1831–1843. http://doi.org/10.1016/j.advwatres.2007.02.005 Shortridge, A., & Messina, J. (2011). Spatial structure and landscape associations of SRTM error. Remote Sensing of Environment, 115(6), 1576–1587. http://doi.org/10.1016/j.rse.2011.02.017 van de Sande, B., Lansen, J., & Hoyng, C. (2012). Sensitivity of Coastal Flood Risk Assessments to Digital Elevation Models. Water, 4(3), 568–579. http://doi.org/10.3390/w4030568
The International Archives of the Photogrammetry, Remote Sensing and Spatial Information Sciences, Volume XLII-4/W1, 2016 International Conference on Geomatic and Geospatial Technology (GGT) 2016, 3–5 October 2016, Kuala Lumpur, Malaysia
This contribution has been peer-reviewed. doi:10.5194/isprs-archives-XLII-4-W1-299-2016
306