Open Research Onlineoro.open.ac.uk/45000/7/methodsinplantfoliarvolatileotrganic... · Methods in...
12
Open Research Online The Open University’s repository of research publications and other research outputs Methods in Plant Foliar Volatile Organic Compounds Research Journal Item How to cite: Materi´ c, Duˇ san; Bruhn, Dan; Turner, Claire; Morgan, Geraint; Mason, Nigel and Gauci, Vincent (2015). Methods in Plant Foliar Volatile Organic Compounds Research. Applications in Plant Sciences, 3(12), article no. 1500044. For guidance on citations see FAQs . c 2015 Materi´ c et al. Version: Version of Record Link(s) to article on publisher’s website: http://dx.doi.org/doi:10.3732/apps.1500044 Copyright and Moral Rights for the articles on this site are retained by the individual authors and/or other copyright owners. For more information on Open Research Online’s data policy on reuse of materials please consult the policies page. oro.open.ac.uk
Transcript of Open Research Onlineoro.open.ac.uk/45000/7/methodsinplantfoliarvolatileotrganic... · Methods in...

Open Research OnlineThe Open University’s repository of research publicationsand other research outputs
Methods in Plant Foliar Volatile Organic CompoundsResearchJournal Item
How to cite:
Materic, Dusan; Bruhn, Dan; Turner, Claire; Morgan, Geraint; Mason, Nigel and Gauci, Vincent (2015). Methods inPlant Foliar Volatile Organic Compounds Research. Applications in Plant Sciences, 3(12), article no. 1500044.
For guidance on citations see FAQs.
c© 2015 Materic et al.
Version: Version of Record
Link(s) to article on publisher’s website:http://dx.doi.org/doi:10.3732/apps.1500044
Copyright and Moral Rights for the articles on this site are retained by the individual authors and/or other copyrightowners. For more information on Open Research Online’s data policy on reuse of materials please consult the policiespage.
oro.open.ac.uk

BioOne sees sustainable scholarly publishing as an inherently collaborative enterprise connecting authors, nonprofit publishers, academic institutions, researchlibraries, and research funders in the common goal of maximizing access to critical research.
Methods in Plant Foliar Volatile Organic Compounds ResearchAuthor(s): Dušan Materić, Dan Bruhn, Claire Turner, Geraint Morgan, Nigel Mason, and Vincent GauciSource: Applications in Plant Sciences, 3(12)Published By: Botanical Society of AmericaDOI: http://dx.doi.org/10.3732/apps.1500044URL: http://www.bioone.org/doi/full/10.3732/apps.1500044
BioOne (www.bioone.org) is a nonprofit, online aggregation of core research in the biological, ecological, andenvironmental sciences. BioOne provides a sustainable online platform for over 170 journals and books publishedby nonprofit societies, associations, museums, institutions, and presses.
Your use of this PDF, the BioOne Web site, and all posted and associated content indicates your acceptance ofBioOne’s Terms of Use, available at www.bioone.org/page/terms_of_use.
Usage of BioOne content is strictly limited to personal, educational, and non-commercial use. Commercial inquiriesor rights and permissions requests should be directed to the individual publisher as copyright holder.

1 of 10
Applications in Plant Sciences 2015 3 ( 12 ): 1500044
Applications in Plant Sciences 2015 3 ( 12 ): 1500044; http://www.bioone.org/loi/apps © 2015 Materić et al. Published by the Botanical Society of America. This work is licensed under a Creative Commons Attribution License (CC-BY-NC-SA).
ApApplicatitionsonsinin Pl Plant t ScienSciencesces
Plant leaves are a major source of volatile organic com-pounds (VOCs; for a list of abbreviations used in this article, see Appendix 1 ) emitted in the atmosphere. VOCs play an im-portant role in protecting plants from high temperature stress ( Sharkey and Yeh, 2001 ). Plants also use VOCs as a means of interacting with other plants and organisms ( Baldwin et al., 2002 ; Ruther and Kleier, 2005 ; Babikova et al., 2013 ). Plants also, through VOCs, infl uence troposphere chemistry by con-tributing to biogenic aerosol formation and ozone production in the lower troposphere ( Sharkey and Yeh, 2001 ).
Different plant organs (root, fl owers, fruits, leaves) emit dif-ferent groups of VOCs; however, in this work we focus on fo-liar VOCs. Among the many plant foliar VOCs, C 6 and some other compounds like methyl salicylate and jasmonic acid methyl ester are relevant to a plant’s response to wounding and
plant interactions with other organisms, whereas the VOCs most relevant for climate change are isoprene, monoterpenes, and sesquiterpenes (e.g., isoprenoids, terpenoids) ( Baldwin et al., 2002 ; Loreto et al., 2006 ; Babikova et al., 2013 ).
C 6 compounds are a group of green leaf VOCs that are emit-ted during physical damage of leaf tissue, following membrane denaturation ( Loreto et al., 2006 ). The most notable example of C 6 VOC emission is the smell released after cutting grass. These C 6 aldehydes and alcohols and their oxidation products originate from linoleic and α -linolenic acids, and belong to the hexanal and hexenal families ( Fall et al., 1999 ).
Isoprene (C 5 H 8 , 2-methyl-1,3-butadiene) is the most abun-dant VOC emitted by plants and is the focus of considerable current research because of its infl uence on the troposphere. The total contribution of isoprene to the atmosphere is esti-mated to be 500–750 Tg (440–660 Tg of carbon) per year, which exceeds carbon emissions from all sources of atmospheric methane combined ( Guenther et al., 2006 ). Isoprene is emitted by many plant species, and a summary of isoprene-emitted taxa has been published elsewhere ( Harley et al., 1999 ). Every major plant group is known to emit isoprene but not every plant species ( Harley et al., 1999 ). More isoprene is emitted in tropi-cal humid forests than any other biome because more isoprene-emitting species are present there than in other ecosystems ( Sharkey et al., 2008 ).
Monoterpenes (C 10 H 16 ) and sesquiterpenes (C 15 H 24 ) are com-posed of two or three isoprene-like molecules (C 5 H 8 ). Monoter-penes are major compounds in plant resin, and the main source
1 Manuscript received 21 April 2015; revision accepted 23 October 2015. The authors thank the Proton Ionization Molecular Mass Spectrometry
(PIMMS) Initial Training Network (ITN) for fi nancial support, training, and the opportunity to link with leaders of cutting-edge analytical techniques. We also acknowledge the GC-MS training received via the training partnership between the Science Faculty at The Open University and Anthias Consulting Ltd.
5 Author for correspondence: [email protected] 6 Current address: Department of Chemistry and Bioscience, Aalborg
University, Fredrik Bajers Vej 7H, 9220 Aalborg East, Denmark
doi:10.3732/apps.1500044
REVIEW ARTICLE
METHODS IN PLANT FOLIAR VOLATILE ORGANIC COMPOUNDS RESEARCH 1
DU Š AN MATERI Ć 2, 5 , DAN BRUHN 2,6 , CLAIRE TURNER 3 , GERAINT MORGAN 4 , NIGEL MASON 4 , AND VINCENT GAUCI 2
2 Department of Environment, Earth and Ecosystems, The Open University, Walton Hall, Milton Keynes MK7 6AA, United Kingdom; 3 Department of Life, Health and Chemical Sciences, The Open University, Walton Hall, Milton Keynes MK7 6AA,
United Kingdom; and 4 Department of Physical Sciences, The Open University, Walton Hall, Milton Keynes MK7 6AA, United Kingdom
Plants are a major atmospheric source of volatile organic compounds (VOCs). These secondary metabolic products protect plants from high-temperature stress, mediate in plant–plant and plant–insect communication, and affect our climate globally. The main challenges in plant foliar VOC research are accurate sampling, the inherent reactivity of some VOC compounds that makes them hard to detect directly, and their low concentrations. Plant VOC research relies on analytical techniques for trace gas analysis, usually based on gas chromatography and soft chemical ionization mass spectrometry. Until now, these techniques (especially the latter one) have been developed and used primarily by physicists and analytical scientists, who have used them in a wide range of scientifi c research areas (e.g., aroma, disease biomarkers, hazardous compound detection, atmospheric chemistry). The interdisci-plinary nature of plant foliar VOC research has recently attracted the attention of biologists, bringing them into the fi eld of applied environmental analytical sciences. In this paper , we review the sampling methods and available analytical techniques used in plant foliar VOC research to provide a comprehensive resource that will allow biologists moving into the fi eld to choose the most ap-propriate approach for their studies.
Key words: gas chromatography–mass spectrometry (GC-MS); leaf cuvette; plant volatile organic compound (VOC); proton transfer reaction–mass spectrometry (PTR-MS); selected ion fl ow tube–mass spectrometry (SIFT-MS); thermal desorption–gas chromatography–mass spectrometry (TD-GC-MS).

2 of 10
Applications in Plant Sciences 2015 3 ( 12 ): 1500044 Materić et al.—Methods in plant VOCs doi:10.3732/apps.1500044
http://www.bioone.org/loi/apps
ANALYTICAL METHODS
The two most commonly used techniques in quantitative and qualitative analysis of plant VOCs are: (1) gas chromatography (GC)–based techniques such as gas chromatography–mass spectrometry (GC-MS), GC with fl ame ion-ization detector (GC-FID), and thermal desorption–gas chromatography–mass spectrometry (TD-GC-MS); and (2) mass spectrometry based on soft chemical ionization, such as selected ion fl ow tube–mass spectrometry (SIFT-MS) and proton transfer reaction–mass spectrometry (PTR-MS).
Gas chromatography–based methods
Method overview— GC is a well-established technique that is suitable for qualitative and quantitative analysis of plant foliar VOCs. The core part of a gas chromatograph is the column, which is placed in the oven of the instrument ( Fig. 1 ) . Generally, there are two types of columns: (1) packed and (2) capillary. Although packed columns are still in use for some applications, capillary col-umns are more commonly used in plant VOC research. The most important property of the column that needs to be considered is its stationary phase. Now-adays, capillary columns are coated with various stationary phases, ranging from nonpolar to polar, depending on the functionality of the target compounds. There is a range of columns that can be used for plant foliar VOC research; therefore, referring to successful published reports about a compound of inter-est and contacting column manufacturers are good starting points for method development. In general, for good separation of polar VOCs, a polar column is required, whereas nonpolar VOCs require a nonpolar column. Thus, general advice for the analysis of rich mixtures of foliar VOCs is to start with a 5% phenyl-substituted (polar) column. The usual length of a column for plant foliar VOCs research is between 15 and 60 m, depending on the compounds of interest.
The GC instrument consists of a temperature-controlled oven, capable of being rapidly ramped up reproducibly from room temperature to over 300 ° C. The instrument also houses a series of pressure control systems and provides the interfaces for the introduction of samples and the analytical detectors. Inside the oven is an open tubular column (30–60 m), containing a stationary-phase fi lm capable of separating compounds according to their physical and chemical properties. One end of the gas chromatograph column is connected to the inlet (usually an injector), and the other end (outlet) is connected to the detector. Samples are introduced via a heated inlet and then transported by the carrier gas fl ow (usually helium) through the column. Each of the VOCs interacts differ-ently with the stationary phase of the column and is therefore differentially partitioned between the stationary phase and mobile phase (helium). An in-crease in temperature changes the partition coeffi cient, ultimately resulting in the compound being completely moved into the mobile phase and being swept into the detector, via a heated transfer line. Thus, different VOCs come out of the column at different times (known as retention time), and after exiting the column, they may be identifi ed and quantifi ed by a mass spectrometer or other detector ( Fig. 1 ).
The most common gas chromatograph detectors for plant VOC research are fl ame ionization detectors (FID) and mass spectrometers. FIDs are simple, low-cost detectors for organic compounds (VOCs, such as hydrocarbons, which can be detected when burnt). When a mass spectrometer is used as a detector, analy-sis of the fragmentation patterns of the ions at each point in the total ion chro-matogram enables compound identifi cation. Deconvolution software can also be used to identify/separate overlapping peaks ( Colby, 1992 ). Compound iden-tifi cation is also facilitated by the use of a library of previously generated spec-tra, such as the National Institute of Standards and Technology (NIST) library. Characteristic ions are then selected for each compound to enable quantifi cation through comparison with the responses determined during calibration. Ideally, an internal standard is also introduced to enable corrections for any instrument variations over time.
Modern gas chromatograph systems are highly reproducible and therefore both the characteristic retention times (known as the Kovats retention index) and the mass fragmentation pattern can be used to identify and quantify the in-jected compounds.
GC can be used to directly analyze plant VOCs in tissue extracts (solvent extraction of leaves). However, the concentration of plant VOCs emitted from plant surfaces is quite low and usually requires preconcentration to reach detec-tion limits.
The samples trapped on TD tubes are thermally desorbed, over several min-utes, and retrapped on a cold trap in the thermal desorption instrument ( Fig. 1 ). The cold trap, which is a tube containing packing material, is then rapidly heated and the VOCs are released and transferred through a heated transfer line
of monoterpene emissions is conifer needles. α - and β -pinene, together with Δ -3-carene, are the most signifi cant and abundant monoterpenes found in conifer woodlands ( Tingey et al., 1980 ; Räisänen et al., 2009 ). The most signifi cant factors that infl u-ence monoterpene emission are a combination of vapor pres-sure, ambient temperature, and size of the monoterpene pool in plant tissue ( Tingey et al., 1980 ). Sesquiterpenes are among the least-studied groups of VOCs because of their high reactivity and low vapor pressure, which make them diffi cult to analyze ( Duhl et al., 2008 ).
Further details on plant VOC biosynthesis and functions of VOCs can be found elsewhere ( Muhlemann et al., 2014 ).
Plant foliar VOC research is usually related to two main fi elds of study: (1) their impact on global climate change and (2) their role as mediators of interactions between plants and other organisms.
Individual VOCs can have both a positive and negative con-tribution to climate change. For example, when emitted in the presence of a high concentration of NO x , isoprene contributes to the formation of ozone in the lower troposphere, which af-fects the quality of urban air; therefore, it is seen as a negative contribution. However, when in the presence of low NO x abun-dances, as is frequently found in rural environments, isoprene keeps ozone concentrations lower than would otherwise be ex-pected ( Sharkey et al., 2008 ). VOCs also compete for hydroxyl radicals (OH), which are the primary atmospheric sink of meth-ane ( Peñuelas and Staudt, 2010 ). Thus, during their short mo-lecular lifetime, VOCs increase tropospheric ozone formation, signifi cantly prolong the lifetime of methane, and fi nally oxidize and contribute to CO 2 in the troposphere. In contrast to the role of isoprene, monoterpenes and their oxidation products contrib-ute to aerosol and cloud formation, which potentially have a cooling effect ( Peñuelas and Staudt, 2010 ; Riccobono et al., 2014 ).
Plant foliar VOCs also play a biological communication role in ecosystems ( Clavijo McCormick et al., 2014 ; Pierik et al., 2014 ). They can be released from plants that are grazed by her-bivores where they may function as a chemical signal of the hazard to neighboring and usually downwind plants ( Baldwin et al., 2002 ; Ruther and Kleier, 2005 ). Multiple stress interac-tions (abiotic and biotic) and their impact on VOC emission are reviewed elsewhere ( Holopainen and Gershenzon, 2010 ).
Research in the fi eld of plant foliar VOCs is challenging for a range of reasons, the principal ones being: (1) VOCs are very reactive to other compounds in the atmosphere; (2) VOCs can react with monitoring equipment surfaces and some monitoring equipment materials can emit VOCs; (3) during the sampling, plants need to be enclosed in a special chamber, which may stress the plant (e.g., change of light condition, wounding) and result in unrepresentative emissions; (4) the measured concen-trations are often very low—usually 1–100 ppb (sometimes <1 ppb)—thus challenging the detection limits of analytical instru-ments. These factors make plant foliar VOCs research unique with challenges in sampling and analysis. To address these challenging tasks, diverse analytical methodologies (e.g., chemi-cal ionization mass spectrometry) and sampling techniques have recently been developed and used.
In this paper, we review available methodologies in plant fo-liar VOC research to provide a comprehensive resource for plant scientists with no background in physics or analytical sci-ences to move into the fi eld of plant foliar VOC research and select the most appropriate analytical method and sampling approach.

Applications in Plant Sciences 2015 3 ( 12 ): 1500044 Materić et al.—Methods in plant VOCs doi:10.3732/apps.1500044
3 of 10http://www.bioone.org/loi/apps
Because sample preconcentration is usually required, TD-GC-MS is the most widely used GC technique for plant foliar VOC research. TD-GC-MS is suitable for the analysis (identifi cation, separation, and quantifi cation) of iso-mers such as terpenoids, as well as for fi eld VOC emission estimation where real-time analysis is not currently possible ( Hakola et al., 2006 ; Ruuskanen et al., 2007 ; Räisänen et al., 2009 ).
Usage of GC systems in plant foliar VOC research requires estimation of the detection limit and calibration. The limit of the detection (LOD) and limit of the quantifi cation (LOQ) can easily be determined for the compound of interest by measuring 20 replicates of the background signal ( Armbruster and Pry, 2008 ). In plant VOC research, the LOD is usually calculated as a sum of the mean and three standard deviations of the background replicates (LOD = MEAN blank + SD blank * 3). Calibration is done by loading a known concentration of the VOCs of interest before or after the sample analysis, and readings are used to generate a calibration curve. Loaded amounts of standards are usually in the range of 10–50 ng, and fi ve known concentrations are optimal for a good calibration ( Janson, 1993 ; Räisänen et al., 2009 ; Materi ć et al., 2015 ).
Selected ion fl ow tube–mass spectrometry
Method overview— SIFT-MS is a soft chemical ionization technique that utilizes chemical ionization of the VOC with H 3 O + , NO + , and O 2 + as precursor ions (reagent ions). SIFT-MS is a sensitive instrument suitable for real-time monitoring of plant VOCs ( Smith and Španěl, 2005 ; Sovová et al., 2011 ). The basics of the instrument are explained here, but more details may be found in earlier reviews ( Smith and Španěl, 2005 ). To generate precursor ions, the in-strument uses water and air in a microwave resonator, producing many different ions. A quadrupole mass fi lter enables the user to select the desired precursor ion (H 3 O + , NO + , or O 2 + ). Precursor ions enter the fl ow tube (a metal cylinder), where helium is used as a carrier gas. The sample is introduced into the fl ow tube via a heated sampling capillary with a constant fl ow (usually 30 mL/min). Further down the fl ow tube, the precursor ions react with the sample VOCs and ionize them. The ionized VOCs are fi ltered by the detection quadrupole and detected by the ion detector ( Fig. 2 ) .
Using the precursor ions count and a well-established kinetics library for the fl ow tube, it is possible to calculate the concentrations of trace gases without further calibration of the instrument. The instrument has an option of multiple
to the GC. From the cold trap, the sample can be split and a portion of the sample may be saved in a TD tube for later use, which is particularly useful if the sample is rare and precious. The cold trap is also required to ensure that the compounds are transferred to the column effi ciently. Optimized injection parameters are needed to ensure good chromatographic peak shapes, optimal peak resolution (i.e., how well peaks are separated), and peak capacity (i.e., how many peaks can be resolved). The interface of a commercial TD system with a gas chromato-graph and mass spectrometer as a detector (TD-GC-MS) is shown in Fig. 1 .
Advantages and disadvantages— The main advantages of using GC in plant foliar VOC research are: (1) the sample may be taken, stored in tubes, and ana-lyzed later (usually within a month); (2) sampling using thermal desorption preconcentrates target compounds, achieving very high sensitivity; (3) the method can separate very similar chemical compounds (isomers such α - and β -pinene); (4) instruments can be custom-made inexpensively and designed for analysis of a particular compound (or group of compounds) (e.g., the zNose [Electronic Sensor Technology, Newbury Park, California, USA], described by Kunert et al. [2002] ); and (5) the instrument can be miniaturized for fi eldwork (e.g., Tridion-9 GC-MS [Torion, American Fork, Utah, USA]).
The main disadvantage of GC-based instruments is that it is not a real -time instrumental approach, thus it is not suitable for research where high time reso-lution is needed. Furthermore, TD-GC-MS is sometimes considered to be semi-quantitative because of the unknown effects of two-stage trapping. This is especially true when complex samples are used and where high concentrations of VOCs are absorbed. However, this should not be a problem when the instru-ment is calibrated correctly on the compounds of interest.
Usage— GC comes in many variations (e.g., injection method or detector type), thus usage of the technique in plant foliar VOC research is broad. Direct sampling (syringe or loop injection) of plant foliar VOCs into a gas chromato-graph is usually not possible due to the low VOC concentration in the sample. However, coupling GC with a high-sensitivity detector/instrument can give good results ( Materi ć et al., 2015 ). Direct injection is also suitable when esti-mating VOCs emission potentials by analyzing tissue (solvent) extraction ( Thoss et al., 2007 ; Räisänen et al., 2009 ; Lusebrink et al., 2011 ; Ormeño et al., 2011 ).
Fig. 1. Thermal desorption–gas chromatograph–mass spectrometer. VOC samples trapped onto TD tubes are introduced into the autosampler . The autosampler collects a tube and heats it up according to the setup. VOCs are then retrapped onto material in the cold trap . The cold trap heats up rapidly, and VOCs are introduced into the GC column . VOCs are separated in the GC column , thus escaping the column at different times (retention time). Escaped VOCs are analyzed by a mass spectrometer.

4 of 10
Applications in Plant Sciences 2015 3 ( 12 ): 1500044 Materić et al.—Methods in plant VOCs doi:10.3732/apps.1500044
http://www.bioone.org/loi/apps
Proton transfer reaction–mass spectrometry
Method overview— PTR-MS is the most sensitive real-time technique that uses soft ionization of hydronium ions (H 3 O + ) to ionize VOCs in a drift tube. PTR-MS is suitable for online VOC monitoring with high sensitivity and high resolution. The basics of the technique are explained here (see Fig. 3 ) , but a more extensive explanation may be found elsewhere ( Blake et al., 2009 ; Ellis and Mayhew, 2014 ).
PTR-MS uses a hollow-cathode discharge source combined with a source drift region to generate hydronium ions with a purity of more than 99.5%. The ions enter the drift tube, which is a series of metal rings (electrodes) insulated from one another. The gas sample is introduced close to the beginning of the drift tube, where chemical ionization occurs. The ionized VOCs are pulled out of the drift tube by the fi eld generated by electrodes, and focused toward the detection part of the instrument. It is possible to manipulate the voltage across the drift tube, which changes the ionization conditions inside the tube.
The ionized VOCs are separated either by a quadrupole (QUAD) or by a time-of-fl ight (TOF) mass spectrometer, and counted by a detector. The instru-ment gives raw data in counts per second (cps), which need to be converted to give concentrations in parts per billion (ppb).
Advantages and disadvantages— The main advantages of using PTR-MS in plant foliar VOC research are: (1) PTR-MS is the most sensitive instrument for real-time VOC research; (2) PTR-MS instruments come equipped with either quadrupole (PTR-QUAD-MS, or just PTR-MS) or time-of-fl ight mass spec-trometers (PTR-TOF-MS); (3) instruments can be equipped to have different precursor ions, which increase the analytical power of the instrument; (4) the ion-molecule collision energy in a drift tube (more precisely, E/N) can easily be changed by changing the electric fi eld parameters on the electrodes, and hence improving the analytical power of the instrument ( Blake et al., 2009 ; Ellis and Mayhew, 2014 ); (5) PTR-MS could be coupled with fastGC for isomer analysis ( Materi ć et al., 2015 ).
The main disadvantages of PTR-MS are: (1) the method requires calibra-tion gas standards to perform quantitative analysis; (2) the instrument is not suitable for qualitative analysis of isomers because it gives the concentration of all compounds of the same molecular weight; and (3) unlike the SIFT-MS, where switching the reagent ions is achieved in seconds, such switching in PTR-MS is not that straightforward and requires a stabilization period of sev-eral minutes.
ion monitoring (MIM) mode, which is particularly useful for online monitoring of certain compounds (such as isoprene, methanol, and monoterpenes). Re-peated sampling enables the user to average the concentration during a desired time slot.
Advantages and disadvantages— Advantages of using SIFT-MS in plant foliar VOC research are the following: (1) SIFT-MS is suitable for online (real-time) VOC measurements; (2) different precursor ions are available, which increases the qualitative performance of the instrument (identifi cation of the gas); (3) SIFT-MS is direct and quantitative, so concentrations in parts per bil-lion may be obtained automatically; (4) the instrument does not require calibra-tion against gas standards.
The main disadvantages of SIFT-MS when applied to plant foliar VOC research are: (1) isoprene and monoterpenes cannot be measured simultane-ously. Isoprene-H + , which is generated through the reaction of isoprene with the H 3 O + precursor, has a mass-to-charge ratio (m/z) of 69, which overlaps with that of protonated methanol linked with two water molecules (CH 3 OH-H + -(H 2 O) x2 ). For this reason, isoprene should be analyzed using the NO + precursor for analytical accuracy ( Smith and Španěl, 2005 ). (2) SIFT-MS is less sensitive than PTR-MS ( Milligan et al., 2007 ; Blake et al., 2009 ). (3) Compared to GC-MS, differentiating isomers is extremely diffi cult for both SIFT-MS and PTR-MS. (4) Current SIFT-MS instruments use a quadrupole, so the time and mass resolution is quite low compared to PTR-TOF-MS (see below).
Usage— SIFT-MS is suitable for online monitoring of the major VOCs emitted from plant leaves ( Smith and Španěl, 2011 ; Amelynck et al., 2013 ; Akpolat and Barringer, 2015 ). It can be used in different ionization modes (H 3 O + , NO + , or O 2 + ), allowing different qualitative applications. Most of the common foliar VOCs are well studied and the kinetics of these compounds are well known, so quantifi cation is straightforward, directly given by the software. However, the limit of the detection should be estimated as described earlier. It should be pointed out that humidity can affect the concentration readings and condensate water must not enter the instrument.
For VOC monitoring over time, the MIM mode is most suitable. The opera-tor should set the instrument to measure all water cluster ions, the analytes of interest, and their fragments. Generally, the number of ions monitored by the instrument in MIM mode should be set as low as possible (up to 10), but suffi -cient for any particular experiment, as they compete for quadrupole time in a measurement cycle.
Fig. 2. Selected ion fl ow tube–mass spectrometer. VOCs are introduced into the fl ow tube of the instrument via the inlet , where they are ionized by a beam of precursor ions (H 3 O + , NO + , or O 2 + ) generated by the ion source. Ionized VOCs, their fragments, and water clusters are separated by the detector quadrupole mass fi lter and detected by a channeltron ion detector.

Applications in Plant Sciences 2015 3 ( 12 ): 1500044 Materić et al.—Methods in plant VOCs doi:10.3732/apps.1500044
5 of 10http://www.bioone.org/loi/apps
Fig. 3. Proton transfer reaction–mass spectrometer. VOCs are introduced into the drift tube of the instrument via a sample inlet , where they are ionized by a beam of reagent ions (H 3 O + ) generated by the ion source. Ionized VOCs and their fragments are separated by the detector quadrupole mass fi lter (or time-of-fl ight) and detected by the detector.
Usage— PTR-MS is the most sensitive technique for real-time plant foliar VOC analysis ( Fall et al., 1999 ; Tani et al., 2003 ; Ruuskanen et al., 2005 ; Loreto et al., 2006 ; Brilli et al., 2011 ). PTR-TOF-MS is suitable for real-time experiments with high time (<1 s) and mass resolutions. PTR-QUAD-MS has similar applications to SIFT-MS. If specifi c isomers need to be analyzed, the instrument should be run in parallel with GC-FID/MS ( Lindinger et al., 2005 ; Ruuskanen et al., 2005 ). Furthermore, recent developments in coupling PTR-MS with fastGC showed successful monoterpene separation at low concentra-tions, applicable in plant foliar VOC research ( Materi ć et al., 2015 ).
To convert raw data (cps) into absolute concentrations, the instrument needs to be calibrated with a mixture of standard gases that have a known concentra-tion. Ideally, the VOC of interest should be included in the mixture; otherwise, the mixture should contain standard gases with different molecular masses that cover the instrument’s available mass range.
There are several solutions available for instrument calibration. The most popular one is to use gas cylinders containing several gases with known con-centrations (usually 1 ppm) and make a sequence of dilutions using fl ow con-trollers. Alternatively, permeation tubes or a diffusion source could be used as a cheaper solution ( Maria et al., 2002 ; Tumbiolo et al., 2005 ; Thompson and Perry, 2009 ).
Usually, a scripting language such Perl, MATLAB, R, or Python is essential to use to process large amounts of raw data and convert them into concentra-tions and emission rates ( Müller et al., 2013 ; Materi ć and Gonzalez, 2014 ).
SAMPLING METHODS
The choice of sampling method for plant foliar VOC research mainly de-pends on the spatial scale at which the experiment is meant to operate ( Hewitt et al., 2011 ). The most common sampling approaches are leaf/branch enclo-sures and tower-based measurements ( Dabberdt et al., 1993 ; Hewitt et al., 2011 ). In addition, solvent extraction of plant foliar VOCs from leaf tissue is a common approach to estimate VOC reservoirs and essential oils ( Thoss et al., 2007 ; Räisänen et al., 2009 ; Lusebrink et al., 2011 ; Ormeño et al., 2011 ; Bicchi and Maffei, 2012 ).
However, in this paper, only the leaf/branch enclosure systems are reviewed because they are the most common in plant foliar research. Other systems, including a fl ower enclosure, are described elsewhere ( Tholl et al., 2006 ; Kallenbach et al., 2014 ).
Chamber materials— Leaf cuvettes and branch chambers ( Fig. 4 ) are usu-ally custom-made, using VOC semineutral materials such as: polytetrafl uoro-ethylene (PTFE/Tefl on), stainless steel, brass, glass, and perfl uoroalkoxy (PFA) ( Tholl et al., 2006 ; Hewitt et al., 2011 ). Although there is no completely ideal material, the best available is PTFE (Tefl on). An adapted photosynthesis leaf cuvette can also be used for some experimental setups, but this is not the best solution because some standard materials (such as rubber and plastics) in these cuvettes may emit or adsorb VOCs.
Chamber design — Chambers or leaf cuvettes vary in design from the very simple (a bag with internal support to prevent contact of the plant tissue with the chamber itself) to quite complex chambers (a chamber with a fan, tempera-ture and humidity sensors, and controls, controlled by a computer), including robotic systems ( Tholl et al., 2006 ; Kolari et al., 2012 ). At least one wall of the chamber should be transparent, allowing uninterrupted photosynthesis, as emis-sion of some VOCs is light dependent ( Schuh et al., 1997 ; Sharkey and Yeh, 2001 ; Duhl et al., 2008 ).
Leaf cuvettes should be designed in such a way that good air mixing is achieved during fl ushing, and in the case of a large-volume branch chamber, the use of a fan should be considered. If a fan needs to be used, the best solution would be to situate the fan’s motor outside of the chamber. A fan should be used carefully because high speed and turbulence may cause plant stress and thus artifi cially induce VOC emission. However, good air mixing is vital to ensure homogeneous gas concentrations and stable temperature within the cuvette.
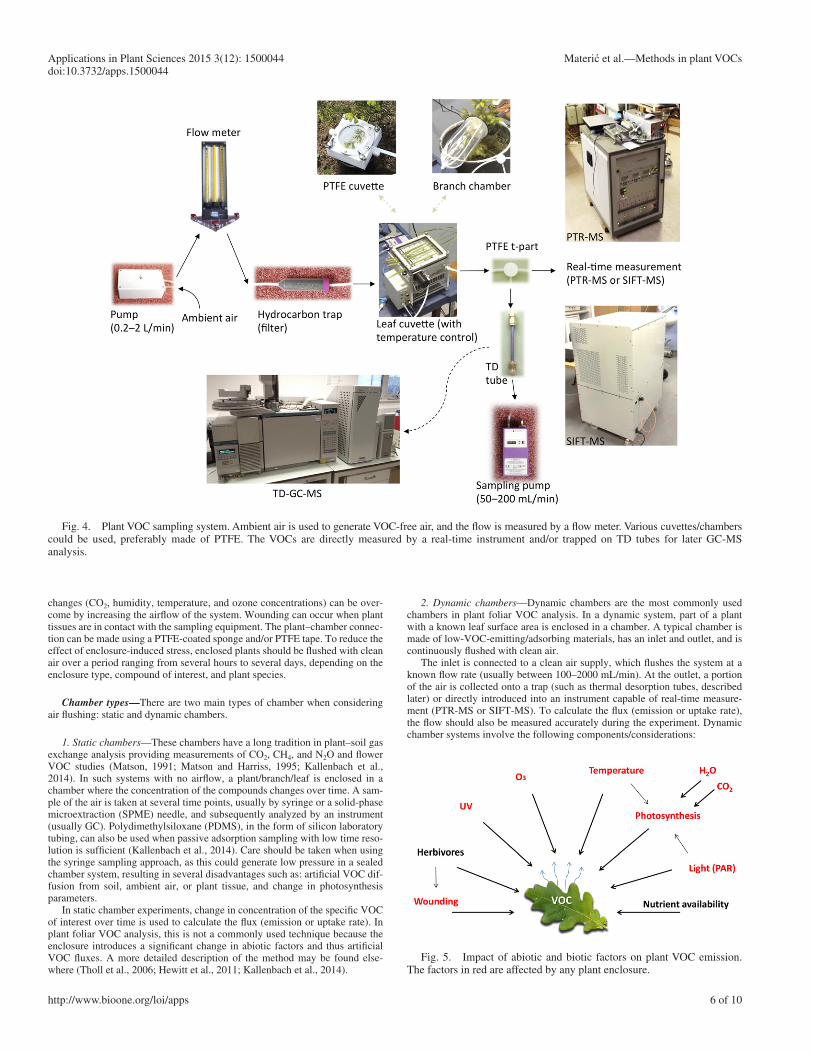
Any plant enclosure brings some changes in abiotic factors that could affect VOC emission (see Fig. 5 ) , such as: mechanical wounding, a shift in CO 2 con-centration, increased humidity, changes in temperature, changes in ozone con-centration, and changes in light conditions. Thus, the enclosure system should be designed in a way that reduces these factors to a minimum. Most of these
6 of 10
Applications in Plant Sciences 2015 3 ( 12 ): 1500044 Materić et al.—Methods in plant VOCs doi:10.3732/apps.1500044
http://www.bioone.org/loi/apps
2. Dynamic chambers— Dynamic chambers are the most commonly used chambers in plant foliar VOC analysis. In a dynamic system, part of a plant with a known leaf surface area is enclosed in a chamber. A typical chamber is made of low-VOC-emitting/adsorbing materials, has an inlet and outlet, and is continuously fl ushed with clean air.
The inlet is connected to a clean air supply, which fl ushes the system at a known fl ow rate (usually between 100–2000 mL/min). At the outlet, a portion of the air is collected onto a trap (such as thermal desorption tubes, described later) or directly introduced into an instrument capable of real-time measure-ment (PTR-MS or SIFT-MS). To calculate the fl ux (emission or uptake rate), the fl ow should also be measured accurately during the experiment . Dynamic chamber systems involve the following components/considerations:
changes (CO 2 , humidity, temperature, and ozone concentrations) can be over-come by increasing the airfl ow of the system. Wounding can occur when plant tissues are in contact with the sampling equipment. The plant–chamber connec-tion can be made using a PTFE-coated sponge and/or PTFE tape. To reduce the effect of enclosure-induced stress, enclosed plants should be fl ushed with clean air over a period ranging from several hours to several days, depending on the enclosure type, compound of interest, and plant species.
Chamber types — There are two main types of chamber when considering air fl ushing: static and dynamic chambers.
1. Static chambers— These chambers have a long tradition in plant–soil gas exchange analysis providing measurements of CO 2 , CH 4 , and N 2 O and fl ower VOC studies ( Matson, 1991 ; Matson and Harriss, 1995 ; Kallenbach et al., 2014 ). In such systems with no airfl ow, a plant/branch/leaf is enclosed in a chamber where the concentration of the compounds changes over time. A sam-ple of the air is taken at several time points, usually by syringe or a solid-phase microextraction (SPME) needle, and subsequently analyzed by an instrument (usually GC). Polydimethylsiloxane (PDMS), in the form of silicon laboratory tubing, can also be used when passive adsorption sampling with low time reso-lution is suffi cient ( Kallenbach et al., 2014 ). Care should be taken when using the syringe sampling approach, as this could generate low pressure in a sealed chamber system, resulting in several disadvantages such as: artifi cial VOC dif-fusion from soil, ambient air, or plant tissue, and change in photosynthesis parameters.
In static chamber experiments, change in concentration of the specifi c VOC of interest over time is used to calculate the fl ux (emission or uptake rate). In plant foliar VOC analysis, this is not a commonly used technique because the enclosure introduces a signifi cant change in abiotic factors and thus artifi cial VOC fl uxes. A more detailed description of the method may be found else-where ( Tholl et al., 2006 ; Hewitt et al., 2011 ; Kallenbach et al., 2014 ).
Fig. 4. Plant VOC sampling system. Ambient air is used to generate VOC-free air, and the fl ow is measured by a fl ow meter. Various cuvettes/chambers could be used, preferably made of PTFE. The VOCs are directly measured by a real-time instrument and/or trapped on TD tubes for later GC-MS analysis.
Fig. 5. Impact of abiotic and biotic factors on plant VOC emission. The factors in red are affected by any plant enclosure.

Applications in Plant Sciences 2015 3 ( 12 ): 1500044 Materić et al.—Methods in plant VOCs doi:10.3732/apps.1500044
7 of 10http://www.bioone.org/loi/apps
to be conducted in real time or the results need to be qualitative, then TD-GC-MS is the gold standard. On the other hand, real-time experiments require PTR-MS or SIFT-MS ( Smith and Španěl, 2005 , 2011 ; Blake et al., 2009 ; Ellis and Mayhew, 2014 ). There are several reasons why PTR-MS is used more often than SIFT-MS: (1) PTR-MS is more sensitive; (2) it comes as either a quadrupole or time-of-fl ight mass spectrom-eter; and (3) the instrument is produced by several companies, which results in it being more readily available.
PTR-TOF-MS is the most expensive and the best instrument for real-time plant VOC research, particularly if the compounds of interest are well characterized ( Fig. 7 ). The technique is evolving every year, so sensitivity and resolution are constantly increasing. Current PTR-TOF-MS systems have time resolu-tion <1 s, mass resolution between 1500 and 10,000 m/ Δ m full width at half maximum (FWHM), and a detection limit less than 1 part per trillion by volume (pptv) ( Sulzer et al., 2014 ). Thus, PTR-TOF-MS is needed in experiments where time and mass resolution are crucial (e.g., plant signaling, emission rate monitoring of many compounds). However, such high acquisi-tion rates raise issues of storage and data analysis, because the instrument can easily generate 1 TB of data per operational day.
PTR-QUAD-MS is more affordable and the most sensitive instrument on the market (<1 pptv). However, novel PTR-TOF-MS upgrades are obtaining this sensitivity, showing the way for future PTR-MS development ( Sulzer et al., 2014 ). Despite this, quadrupole PTR-MS still has its place in long-term online VOC monitoring, and is well suited to fi eldwork, as it is more com-pact, lighter, and easier in terms of data storage and analysis.
SIFT-MS may be applied to plant VOC research in a similar way to PTR-QUAD-MS, with some advantages and disadvan-tages. To its advantage, it is a truly analytical instrument with a well-established kinetics library, so it does not require calibra-tion ( Smith and Španěl, 2005 ). On the other hand, it has a lower sensitivity and the disadvantage that the instrument cannot si-multaneously measure isoprene and monoterpene concentra-tions using the H 3 O + precursor ion (as explained earlier) ( Milligan et al., 2007 ). However, an analytical method has been developed to analyze these two compounds simultaneously us-ing NO + as the precursor ion ( Wang et al., 2003 ).
How to choose the sampling method — Apart from instru-ment availability, the main factors to be considered in choosing
A. Pumps—All dynamic chamber systems require (1) vacuum pumps or compressors and (2) clean air. Vacuum pumps are used to pull the air into the analytical instrument or into a VOC trap. The mass spectrometric techniques PTR-MS and SIFT-MS have a negative pressure at the inlet, so a vacuum pump is not needed for sampling. However, a low-fl ow vacuum pump (usually 50–200 mL/min) is needed for TD-GC-MS. Air compressors are used to ensure a constant fl ushing fl ow of air over the enclosed branch/leaf. It is crucial to main-tain constant airfl ow, and hence to monitor it during the experiment. Thus, a fl ow meter is usually part of the sampling system ( Fig. 4 ). However, a voltme-ter/data-logger can be used instead, because the fl ow rate generated by a pump will linearly correlate with its operating voltage, when applied to a given length of the pipe with a specifi c conductance. Thus, a simple calibration should be performed at three to fi ve different voltages on a given sampling system measuring the exact fl ow, generating a calibration line that can be used subsequently.
B. Zero air—Dynamic sampling systems usually use incoming VOC-free air (called zero air), which can be obtained in several ways. The simplest way of obtaining zero air, useful for both laboratory and fi eldwork, is to use fi lters packed with a hydrocarbon trap (called scrubbers), commonly used in GC, SIFT-MS, and PTR-MS laboratories. For some applications, such as low (sub-ppb) measurements, hydrocarbon traps might not give suffi ciently pure air, which can result in a low signal-to-noise ratio and hence high limits of detec-tion. Thus, more advanced, high-temperature-based zero air generators need to be used.
For the smaller laboratory applications, zero air can be supplied from a gas cylinder and used as such, or mixed with nitrogen, oxygen, CO 2 , and water vapor to make the desired composition of synthetic air. Alternatively, zero air generators can be used to generate a high amount of VOC-free air, which can be useful for work in laboratories and fi eld stations ( Kolari et al., 2012 ).
If ambient air must be used, the foliar VOCs should be measured/sampled from both the enclosure inlet and outlet. This may be challenging in an online measurement design (for example using SIFT-MS or PTR-MS), as appropriate automatic solenoid valves or switchers need to be inserted in the piping to con-trol the direction of the fl ows in the system and enable the instrument to mea-sure inlet and outlet VOC concentrations simultaneously, in time sequence.
C. Sample preconcentration—To reach detection limit of particular VOCs, in some cases sample preconcentration is required. Preconcentration is achieved either by using a sorbent material(s) or by cold trapping. Sorbent material (such as Tenax TA [Tenax Corporation, Baltimore, Maryland, USA]) is packed in a glass-coated stainless steel tube, known as a thermal desorption tube. An exact amount of air (<10 L) is pumped through the tube at a low rate (usually 50–200 mL/min), allowing adsorption of VOCs onto the trapping material.
DISCUSSION
How to choose the analytical technique — The choice of in-strument in plant foliar VOC research depends mainly on three factors: the research question, instrument availability, and bud-get. The major consideration to take into account is the trade-off between time resolution and separation. Real-time instruments cannot separate isomers (unless coupled with GC with the time cost), and the best-optimized GC system cannot achieve time resolutions of less than a couple of minutes ( Fig. 6 ) ( Blake et al., 2009 ; Misztal et al., 2012 ; Shen et al., 2012 ; Ellis and Mayhew, 2014 ; Materi ć et al., 2015 ).
If the goal of the research does not require real-time VOC measurement, then GC-based techniques are suitable and less expensive ( Figs. 6 and 7 ) . GC sampling can be accomplished through direct air injection (usually via a loop) or preconcentra-tion (usually by TD). Direct injection is suitable only if the compound of interest has a suitable concentration, which usu-ally is not the case when analyzing plant foliar VOCs. Precon-centration, on the other hand, leads to higher sensitivities, but the approach brings additional variables to the quantifi cation (trapping, retrapping, desorption), which could make the method only semiquantitative. While performing experiments based on TD-GC instruments, adequate calibration of the VOCs of interest is crucial for quantifi cation. If the experiment is not
Fig. 6. Relation between instrument cost and time resolution.

8 of 10
Applications in Plant Sciences 2015 3 ( 12 ): 1500044 Materić et al.—Methods in plant VOCs doi:10.3732/apps.1500044
http://www.bioone.org/loi/apps
Fig. 7. Instrument choice with respect to (A) required sampling method, (B) time resolution, and (C) mass resolution. *Cumulative measurement by a real-time instrument. **Molecules that have the same molecular mass but are composed from different atoms.
the sampling method are: (1) the concentration of the foliar VOCs in the system, (2) the time resolution required, and (3) the level of VOC separation required ( Fig. 7 ).
Real-time experiments, which have a time resolution of around 1 s (see the sections on SIFT-MS and PTR-MS), require a mini-mum fl ow rate of approximately 30 mL/min, and thus require a dynamic chamber ( Räisänen et al., 2009 ; Kolari et al., 2012 ). Sample dilution in a dynamic system is usually not a problem for these instruments, as they have sub-ppb sensitivities (refer to manufacturer’s specifi cations: IONICON Analytik, Innsbruck, Austria; KORE Technology, Cambridgeshire, United Kingdom; Syft Technologies, Middleton, New Zealand).
Near-real-time and offl ine experiments, with time resolu-tions of a couple of minutes to a couple of hours (see section on TD-GC-MS), can be used in static and dynamic chambers. If the concentrations of the VOCs are high enough, which is usu-ally not the case when measuring foliar VOC emissions, direct GC sampling can be used. However, when the VOC concentra-tion is low, sample preconcentration must be performed. Sor-bent tube/cartridge preconcentrations require an airfl ow, so a dynamic chamber is required as described in Janson (1993) . On the other hand, passive (static) sorption/adsorption can be ap-plied in static systems using PDMS and SPME ( Kallenbach et al., 2014 ). However, quantifi cation of VOCs in such a system is diffi cult and would require a calibration method development similar to Bouvier-Brown et al. (2007) .
Future (and current) developments in methods in plant foliar VOCs are linked to development of instrumentation/methodology
that can analyze samples with low concentration of VOCs (sub-ppb levels), but with high time resolution (up to 5 min) and high analytical power (isomer separation). This goal led to the development of a group of “cloned” methods, which lie be-tween GC, SIFT-MS, and PTR-MS, such as: (1) fastGC-PTR-MS—a method with GC time resolution of less than 2 min with all of the sensitivity benefi ts of PTR-MS ( Romano et al., 2014 ; Materi ć et al., 2015 ); (2) SIFT–drift tube–MS—a method devel-oped to increase analytical performance of SIFT-MS by vary-ing E/N ( Spesyvyi and Španěl, 2015 ); (3) switchable reagent ion–PTR-MS—a method that, apart from H 3 O + , utilizes NO + , O 2 + , and Ar + for better analytical performance ( Jordan et al., 2009 ; Lanza et al., 2013 ); (4) quadrupole-interfaced PTR-MS—a method that uses a quadrupole in front of the drift tube, in order to get better instrument sensitivity ( Sulzer et al., 2014 ). Miniatur-ization of the instruments and use of different sampling meth-ods and detectors have made GC methodology the only portable measurement solution so far ( Overton et al., 2001 ; Bicchi and Maffei, 2012 ). Thus, more synergistic methods and approaches are expected for plant foliar VOC research in the future.
LITERATURE CITED
AKPOLAT , H. , AND S. A. BARRINGER . 2015 . The effect of pH and tempera-ture on cabbage volatiles during storage. Journal of Food Science 80 : S1878 – S1884 .
AMELYNCK , C. , N. SCHOON , AND F. DHOOGHE . 2013 . SIFT ion chemistry studies underpinning the measurement of volatile organic compound emissions by vegetation. Current Analytical Chemistry 9 : 540 – 549 .

Applications in Plant Sciences 2015 3 ( 12 ): 1500044 Materić et al.—Methods in plant VOCs doi:10.3732/apps.1500044
9 of 10http://www.bioone.org/loi/apps
KOLARI , P. , J. BÄCK , R. TAIPALE , T. M. RUUSKANEN , M. K. KAJOS , J. RINNE , M. KULMALA , AND P. HARI . 2012 . Evaluation of accuracy in measure-ments of VOC emissions with dynamic chamber system. Atmospheric Environment 62 : 344 – 351 .
KUNERT , M. , A. BIEDERMANN , T. KOCH , AND W. BOLAND . 2002 . Ultrafast sampling and analysis of plant volatiles by a hand-held miniaturised GC with pre-concentration unit: Kinetic and quantitative aspects of plant volatile production. Journal of Separation Science 25 : 677 – 684 .
LANZA , M. , W. J. ACTON , S. JÜRSCHIK , P. SULZER , K. BREIEV , A. JORDAN , E. HARTUNGEN , ET AL . 2013 . Distinguishing two isomeric mephedrone substitutes with selective reagent ionisation mass spectrometry (SRI-MS). Journal of Mass Spectrometry 48 : 1015 – 1018 .
LINDINGER , C. , P. POLLIEN , S. ALI , C. YERETZIAN , I. BLANK , AND T. MÄRK . 2005 . Unambiguous identifi cation of volatile organic compounds by proton-transfer reaction mass spectrometry coupled with GC/MS. Analytical Chemistry 77 : 4117 – 4124 .
LORETO , F. , C. BARTA , F. BRILLI , AND I. NOGUES . 2006 . On the induction of volatile organic compound emissions by plants as consequence of wounding or fl uctuations of light and temperature. Plant, Cell & Environment 29 : 1820 – 1828 .
LUSEBRINK , I. , M. L. EVENDEN , F. G. BLANCHET , J. E. K. COOKE , AND N. ERBILGIN . 2011 . Effect of water stress and fungal inoculation on monoterpene emission from an historical and a new pine host of the Mountain Pine Beetle. Journal of Chemical Ecology 37 : 1013 – 1026 .
MARIA , P. C. , J. F. GAL , M. BALZA , E. PERÉ-TREPAT , S. TUMBIOLO , AND J. M. COURET . 2002 . Using thermogravimetry for weight loss monitoring of permeation tubes used for generation of trace concentration gas standards. Analytical Chemistry 74 : 305 – 307 .
MATERI Ć , D. , AND R. M. GONZALEZ . 2014 . PeakCalc: A program for PTR-TOF-MS data analysis. Website https://github.com/dusanac/PeakCalc [accessed 9 April 2015].
MATERI Ć , D. , M. LANZA , P. SULZER , J. HERBIG , D. BRUHN , C. TURNER , N. MASON , AND V. GAUCI . 2015 . Monoterpene separation by coupling proton transfer reaction time-of-fl ight mass spectrometry with fastGC. Analytical and Bioanalytical Chemistry 407 : 7757 – 7763 .
MATSON , P. 1991 . Trace gas emissions by plants: A summary. In T. D. Sharkey, E. Holland, and H. A. Mooney [eds.], Trace gas emissions by plants, 341–345. Academic Press, San Diego, California, USA.
MATSON , P. A. , AND R. C. HARRISS [eds.] 1995 . Biogenic trace gases: Measuring emissions from soil and water. Wiley-Blackwell, Cambridge Blackwell Scientifi c Publishing, Cambridge, United Kingdom.
MILLIGAN , D. B. , G. J. FRANCIS , B. J. PRINCE , AND M. J. MCEWAN . 2007 . Demonstration of selected ion fl ow tube MS detection in the parts per trillion range. Analytical Chemistry 79 : 2537 – 2540 .
MISZTAL , P. K. , M. R. HEAL , E. NEMITZ , AND J. N. CAPE . 2012 . Development of PTR-MS selectivity for structural isomers: Monoterpenes as a case study. International Journal of Mass Spectrometry 310 : 10 – 19 .
MUHLEMANN , J. K. , A. KLEMPIEN , AND N. DUDAREVA . 2014 . Floral vola-tiles: From biosynthesis to function. Plant, Cell & Environment 37 : 1936 – 1949 .
MÜLLER , M. , T. MIKOVINY , W. JUD , B. D’ANNA , AND A. WISTHALER . 2013 . A new software tool for the analysis of high resolution PTR-TOF mass spectra. Chemometrics and Intelligent Laboratory Systems 127 : 158 – 165 .
ORMEÑO , E. , A. GOLDSTEIN , AND Ü. NIINEMETS . 2011 . Extracting and trap-ping biogenic volatile organic compounds stored in plant species. Trends in Analytical Chemistry 30 : 978 – 989 .
OVERTON , E. B. , K. R. CARNEY , N. ROQUES , AND H. P. DHARMASENA . 2001 . Fast GC instrumentation and analysis for fi eld applications. Field Analytical Chemistry & Technology 5 : 97 – 105 .
PEÑUELAS , J. , AND M. STAUDT . 2010 . BVOCs and global change. Trends in Plant Science 15 : 133 – 144 .
PIERIK , R. , C. L. BALLARÉ , AND M. DICKE . 2014 . Ecology of plant volatiles: Taking a plant community perspective. Plant, Cell & Environment 37 : 1845 – 1853 .
RÄISÄNEN , T. , A. RYYPPÖ , AND S. KELLOMÄKI . 2009 . Monoterpene emis-sion of a boreal Scots pine ( Pinus sylvestris L.) forest. Agricultural and Forest Meteorology 149 : 808 – 819 .
ARMBRUSTER , D. A. , AND T. PRY . 2008 . Limit of blank, limit of de-tection and limit of quantitation. Clinical Biochemist Reviews 29 : S49 – S52 .
BABIKOVA , Z. , L. GILBERT , T. J. A. BRUCE , M. BIRKETT , J. C. CAULFIELD , C. WOODCOCK , J. A. PICKETT , AND D. JOHNSON . 2013 . Underground sig-nals carried through common mycelial networks warn neighbouring plants of aphid attack. Ecology Letters 16 : 835 – 843 .
BALDWIN , I. T. , A. KESSLER , AND R. HALITSCHKE . 2002 . Volatile signaling in plant–plant–herbivore interactions: What is real? Current Opinion in Plant Biology 5 : 351 – 354 .
BICCHI , C. , AND M. MAFFEI . 2012 . The plant volatilome: Methods of analy-sis. Methods in Molecular Biology 918 : 289 – 310 .
BLAKE , R. S. , P. S. MONKS , AND A. M. ELLIS . 2009 . Proton-transfer reac-tion mass spectrometry. Chemical Reviews 109 : 861 – 896 .
BOUVIER-BROWN , N. C. , R. HOLZINGER , K. PALITZSCH , AND A. H. GOLDSTEIN . 2007 . Quantifying sesquiterpene and oxygenated terpene emissions from live vegetation using solid-phase microextraction fi bers. Journal of Chromatography A 1161 : 113 – 120 .
BRILLI , F. , T. M. RUUSKANEN , R. SCHNITZHOFER , M. MÜLLER , M. BREITENLECHNER , V. BITTNER , G. WOHLFAHRT , ET AL . 2011 . Detection of plant volatiles after leaf wounding and darkening by proton transfer reaction “time-of-fl ight” mass spectrometry (PTR-TOF). PLoS One 6 : e20419 .
CLAVIJO MCCORMICK , A. , J. GERSHENZON , AND S. B. UNSICKER . 2014 . Little peaks with big effects: Establishing the role of minor plant volatiles in plant-insect interactions . Plant, Cell & Environment 37 : 1836 – 1844 .
COLBY , B. N. 1992 . Spectral deconvolution for overlapping GC/MS com-ponents. Journal of the American Society for Mass Spectrometry 3 : 558 – 562 .
DABBERDT , W. F. , D. H. LENSCHOW , T. W. HORST , P. R. ZIMMERMAN , S. P. ONCLEY , AND A. C. DELANY . 1993 . Atmosphere-surface exchange measurements. Science 260 : 1472 – 1481 .
DUHL , T. R. , D. HELMIG , AND A. GUENTHER . 2008 . Sesquiterpene emissions from vegetation: A review. Biogeosciences 5 : 761 – 777 .
ELLIS , A. M. , AND C. A. MAYHEW . 2014 . Proton transfer reaction mass spectrometry: Principles and applications . Wiley, Chichester, West Sussex, United Kingdom.
FALL , R. , T. KARL , A. HANSEL , A. JORDAN , AND W. LINDINGER . 1999 . Volatile organic compounds emitted after leaf wounding: On-line analysis by proton-transfer-reaction mass spectrometry. Journal of Geophysical Research, D, Atmospheres 104 : 15963 – 15974 .
GUENTHER , A. , T. KARL , P. HARLEY , C. WIEDINMYER , P. I. PALMER , AND C. GERON . 2006 . Estimates of global terrestrial isoprene emissions using MEGAN (Model of Emissions of Gases and Aerosols from Nature). Atmospheric Chemistry and Physics 6 : 3181 – 3210 .
HAKOLA , H. , V. TARVAINEN , J. BÄCK , H. RANTA , B. BONN , J. RINNE , AND M. KULMALA . 2006 . Seasonal variation of mono- and sesquiterpene emission rates of Scots pine. Biogeosciences 3 : 93 – 101 .
HARLEY , P. C. , R. K. MONSON , AND M. T. LERDAU . 1999 . Ecological and evolutionary aspects of isoprene emission from plants. Oecologia 118 : 109 – 123 .
HEWITT , C. N. , B. LANGFORD , M. POSSELL , T. KARL , AND S. M. OWEN . 2011 . Quantifi cation of VOC emission rates from the biosphere. Trends in Analytical Chemistry 30 : 937 – 944 .
HOLOPAINEN , J. K. , AND J. GERSHENZON . 2010 . Multiple stress factors and the emission of plant VOCs. Trends in Plant Science 15 : 176 – 184 .
JANSON , R. W. 1993 . Monoterpene emissions from Scots pine and Norwegian spruce. Journal of Geophysical Research, D, Atmospheres 98 : 2839 – 2850 .
JORDAN , A. , S. HAIDACHER , G. HANEL , E. HARTUNGEN , J. HERBIG , L. MÄRK , R. SCHOTTKOWSKY , ET AL . 2009 . An online ultra-high sensitivity pro-ton-transfer-reaction mass-spectrometer combined with switchable reagent ion capability (PTR + SRI − MS). International Journal of Mass Spectrometry 286 : 32 – 38 .
KALLENBACH , M. , Y. OH , E. J. EILERS , D. VEIT , I. T. BALDWIN , AND M. C. SCHUMAN . 2014 . A robust, simple, high-throughput technique for time-resolved plant volatile analysis in fi eld experiments. Plant Journal 78 : 1060 – 1072 .
10 of 10
Applications in Plant Sciences 2015 3 ( 12 ): 1500044 Materić et al.—Methods in plant VOCs doi:10.3732/apps.1500044
http://www.bioone.org/loi/apps
SOVOVÁ , K. , K. DRYAHINA , AND P. ŠPANĚL . 2011 . Selected ion fl ow tube (SIFT) studies of the reactions of H 3 O + , NO + and O 2 + with six volatile phytogenic esters. International Journal of Mass Spectrometry 300 : 31 – 38 .
SPESYVYI , A. , AND P. ŠPANĚL . 2015 . Determination of residence times of ions in a resistive glass selected ion fl ow-drift tube using the Hadamard transformation. Rapid Communications in Mass Spectrometry 29 : 1563 – 1570 .
SULZER , P. , E. HARTUNGEN , G. HANEL , S. FEIL , K. WINKLER , P. MUTSCHLECHNER , S. HAIDACHER , ET AL . 2014 . A proton transfer re-action-quadrupole interface time-of-fl ight mass spectrometer (PTR-QiTOF): High speed due to extreme sensitivity. International Journal of Mass Spectrometry 368 : 1 – 5 .
TANI , A. , S. HAYWARD , AND C. N. HEWITT . 2003 . Measurement of mono-terpenes and related compounds by proton transfer reaction-mass spectrometry (PTR-MS). International Journal of Mass Spectrometry 223–224 : 561 – 578 .
THOLL , D. , W. BOLAND , A. HANSEL , F. LORETO , U. S. R. RÖSE , AND J.-P. SCHNITZLER . 2006 . Practical approaches to plant volatile analysis. Plant Journal 45 : 540 – 560 .
THOMPSON , J. M. , AND D. B. PERRY . 2009 . A new system of refi llable and uniquely identifi able diffusion tubes for dynamically generating VOC and SVOC standard atmospheres at ppm and ppb concentra-tions for calibration of fi eld and laboratory measurements. Journal of Environmental Monitoring 11 : 1543 – 1544 .
THOSS , V. , J. O’REILLY-WAPSTRA , AND G. R. IASON . 2007 . Assessment and implications of intraspecifi c and phenological variability in monoter-penes of Scots Pine ( Pinus sylvestris ) foliage. Journal of Chemical Ecology 33 : 477 – 491 .
TINGEY , D. T. , M. MANNING , L. C. GROTHAUS , AND W. F. BURNS . 1980 . Infl uence of light and temperature on monoterpene emission rates from Slash Pine. Plant Physiology 65 : 797 – 801 .
TUMBIOLO , S. , L. VINCENT , J. F. GAL , AND P. C. MARIA . 2005 . Thermo-gravimetric calibration of permeation tubes used for the preparation of gas standards for air pollution analysis. Analyst 130 : 1369 – 1374 .
WANG , T. , P. ŠPANĚL , AND D. SMITH . 2003 . Selected ion fl ow tube, SIFT, studies of the reactions of H 3 O + , NO + and O 2 + with eleven C 10 H 16 mono-terpenes. International Journal of Mass Spectrometry 228 : 117 – 126 .
RICCOBONO , F. , S. SCHOBESBERGER , C. E. SCOTT , J. DOMMEN , I. K. ORTEGA , L. RONDO , J. ALMEIDA , ET AL . 2014 . Oxidation products of biogenic emissions contribute to nucleation of atmospheric particles. Science 344 : 717 – 721 .
ROMANO , A. , L. FISCHER , J. HERBIG , H. CAMPBELL-SILLS , J. COULON , P. LUCAS , L. CAPPELLIN , AND F. BIASIOLI . 2014 . Wine analysis by FastGC pro-ton-transfer reaction-time-of-fl ight-mass spectrometry. International Journal of Mass Spectrometry 369 : 81 – 86 .
RUTHER , J. , AND S. KLEIER . 2005 . Plant–plant signaling: Ethylene syner-gizes volatile emission in Zea mays induced by exposure to ( Z )-3-Hexen-1-ol. Journal of Chemical Ecology 31 : 2217 – 2222 .
RUUSKANEN , T. M. , P. KOLARI , J. BÄCK , M. KULMALA , J. RINNE , H. HAKOLA , R. TAIPALE , ET AL . 2005 . On-line fi eld measurements of monoterpene emissions from Scots pine by proton-transfer-reaction mass spectrom-etry. Boreal Environment Research 10 : 553 – 567 .
RUUSKANEN , T. M. , H. HAKOLA , M. K. KAJOS , H. HELLÉN , V. TARVAINEN , AND J. RINNE . 2007 . Volatile organic compound emissions from Siberian larch. Atmospheric Environment 41 : 5807 – 5812 .
SCHUH , G. , A. C. HEIDEN , T. HOFFMANN , J. KAHL , P. ROCKEL , J. RUDOLPH , AND J. WILDT . 1997 . Emissions of volatile organic compounds from sunfl ower and beech: Dependence on temperature and light intensity. Journal of Atmospheric Chemistry 27 : 291 – 318 .
SHARKEY , T. D. , AND S. YEH . 2001 . Isoprene emission from plants. Annual Review of Plant Physiology and Plant Molecular Biology 52 : 407 – 436 .
SHARKEY , T. D. , A. E. WIBERLEY , AND A. R. DONOHUE . 2008 . Isoprene emission from plants: Why and how. Annals of Botany 101 : 5 – 18 .
SHEN , C. , J. LI , Y. WANG , H. WANG , H. HAN , AND Y. CHU . 2012 . Discrimination of isomers and isobars by varying the reduced-fi eld across drift tube in proton-transfer-reaction mass spectrom-etry (PTR-MS). International Journal of Environmental Analytical Chemistry 92 : 289 – 301 .
SMITH , D. , AND P. ŠPANĚL . 2005 . Selected ion fl ow tube mass spectrometry (SIFT-MS) for on-line trace gas analysis. Mass Spectrometry Reviews 24 : 661 – 700 .
SMITH , D. , AND P. ŠPANĚL . 2011 . Direct, rapid quantitative analyses of BVOCs using SIFT-MS and PTR-MS obviating sample collection. Trends in Analytical Chemistry 30 : 945 – 959 .
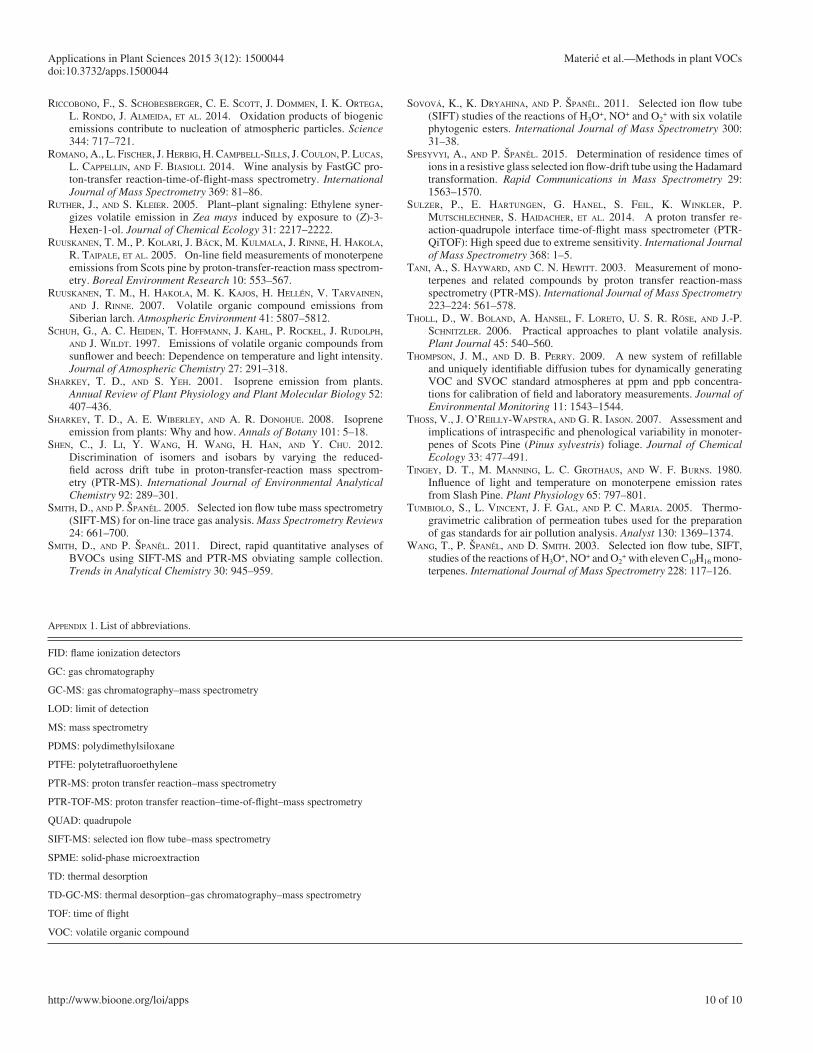
APPENDIX 1. List of abbreviations.
FID: fl ame ionization detectors
GC: gas chromatography
GC-MS: gas chromatography–mass spectrometry
LOD: limit of detection
MS: mass spectrometry
PDMS: polydimethylsiloxane
PTFE: polytetrafl uoroethylene
PTR -MS: proton transfer reaction–mass spectrometry
PTR-TOF-MS: proton transfer reaction–time-of-fl ight–mass spectrometry
QUAD: quadrupole
SIFT-MS: selected ion fl ow tube–mass spectrometry
SPME: solid-phase microextraction
TD: thermal desorption
TD-GC-MS: thermal desorption–gas chromatography–mass spectrometry
TOF: time of fl ight
VOC: volatile organic compound