Open Policy Forum on Child Injury Prevention
23
Mortality, hospital admissions and self/carer reports of child unitentional injury in the RoI: 2006-2015 Open Policy Forum on Child Injury Prevention Dublin Castle, November 18, 2016 Prof Kevin Balanda & Dr Jude Cosgrove Institute of Public Health in Ireland 1
-
Upload
institute-of-public-health-in-ireland -
Category
Healthcare
-
view
77 -
download
1
Transcript of Open Policy Forum on Child Injury Prevention

Mortality, hospital admissions and
self/carer reports of child unitentional
injury in the RoI: 2006-2015
Open Policy Forum on Child Injury Prevention
Dublin Castle, November 18, 2016
Prof Kevin Balanda & Dr Jude Cosgrove
Institute of Public Health in Ireland
1

Overview
Unintentional injuries among 0-19 year olds
Statistical context for the development of the Child
Injury Action Plan:
• Injury fatalities: 2008–2015
• Hospital-treated child injuries: 2006–2015
• Self/carer-reported child injury: GUI and HBSC
Injuries grouped with TACTICS framework
(www.eurosafe.eu.com) (mostly)
2

Data sources
CSO Statbank (2015 not final)
HIPE microdata extract
GUI Longitudinal Study:
• Infant cohort (9 months 2008/09, years 2010/11, 5 years
2013)
• Child cohort (9 years 2007/08,13 years 20111/12)
• Mainly carer-reported lifetime prevalence, context
HBSC cross-sectional surveys:
• 11-18 year-olds (2010 & 2014)
• Self-reported 12-month prevalence, context
3

Child injury fatalities: 2008 - 2015
672 injury deaths
55% unintentional injuries, 36% intentional self-harm, 3%
assault, and 6% other causes
Unintentional child injury fatalities were due:
• Road traffic accidents: 59%
• Accidental drownings: 12%
• Accidental poisonings: 10.5%
• Being struck by an object: 6%
• Choking or strangulations – Falls - Fires, burns or
scalds: each less than 5%
Unintentional injury deaths more common among boys &
adolescents
4

Trends in child injury fatalities (%): 2008-2015
Unintentional child injury fatalities (ICD-10 codes V01-X49) expressed as percentages of all child
deaths, overall and by sex and age, RoI, 2008-2015
Source: CSO Statbank, www.cso.ie
0
5
10
15
20
25
30
35
All Males Females Age 0-4 Age 5-9 Age 10-14 Age 15-19
2008-2009 2010-2011 2012-2013 2014-2015
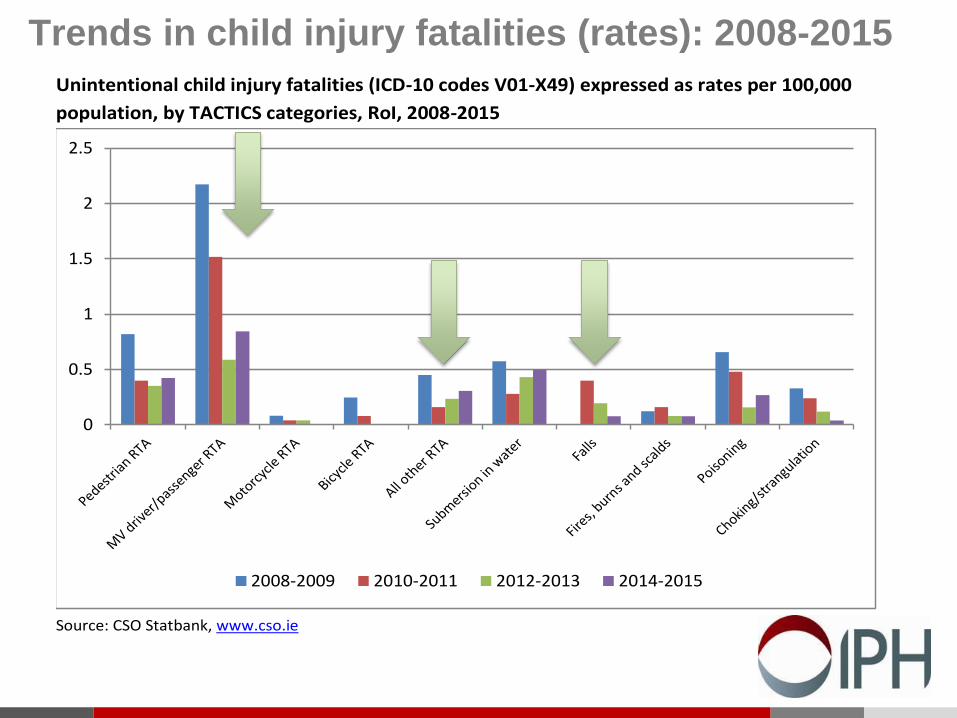
Trends in child injury fatalities (rates): 2008-2015
Unintentional child injury fatalities (ICD-10 codes V01-X49) expressed as rates per 100,000
population, by TACTICS categories, RoI, 2008-2015
Source: CSO Statbank, www.cso.ie
0
0.5
1
1.5
2
2.5
2008-2009 2010-2011 2012-2013 2014-2015

Child injury hospitalisation: 2006-2016
62%-65% of hospital admissions were of males.
One-third 0-4 years, about 40% 5-14 years & a quarter 15-19 years
As a percentage of all unintentional child injury admissions:
• Accidental falls: 42% - 48% (highest rates among males & 0-
4 year olds)
• Accidentally struck by an object or person: one in four
• Accidental submersion in water: 1% or less (rates higher
among males & 0-4 year olds)
• Transport accident: (consistently higher among males &15-19
year olds
• Accidental burns and scalds & accidental poisoning: each
between 2-4% (rates higher among 0-4 year olds)

Trends in unintentional child injury
hospitalisation (rates): 2006-2015
All child unintentional injury hospital admission rates per 100,000 population by age and sex,
2006-2015
Source: HIPE microdata extract, www.hpo.ie
700
800
900
1000
1100
1200
1300
1400
1500
1600
1700
1800
Year:2006
Year:2007
Year:2008
Year:2009
Year:2010
Year:2011
Year:2012
Year:2013
Year:2014
Year:2015
Males Females Age 0-4 Age 5-9 Age 10-14 Age 15-19 All

Serious injury hospitalisations (%): 2006-2015 Percentages of all unintentional injuries, and percentage of these admitted to hospital as serious
injuries, 2006-2015 totals, RoI
Source: HIPE microdata extract, www.hpo.ie
0.0
10.0
20.0
30.0
40.0
50.0
All land transport Submersion Fall Burn Poison Struck by object/person
Other/undetermined
% of all injuries % of these admitted as severe injuries

Carer-reported injuries among young children
Prevalence of injury among children from GUI, overall and by sex
Cohort/Wave Age Sample
size Measure All Males Females
Infant W1 2008/2009 9 months 11134 Ever … requiring hospital treatment/admission
4.2 4.3 4.2
Infant W2 2010/2011 3 years 9793 Ever ... requiring hospital treatment/admission
16.1 17.7 14.4
Infant W3 2013 5 years 9001 Ever ... taken to doctor, health centre or hospital
28.3 31.2 25.2
Child W1 2007/2008 9 years 8568 Ever... requiring hospital treatment/admission
34.3 36.6 32.1
Child W2 2011/2012 13 years 7525 Past 12 months … requiring hospital treatment/admission
13.8 16.8 10.6
Source: GUI anonymised microdata file, ISSDA, https://www.ucd.ie/issda/
Bold indicates a statistically significant difference (p < .001).

Location of carer-reported injuries (5 year
olds): 2012/13

Location of self-reported injuries
among 11-18 year olds: 2014

Type of carer-reported injury (5 year olds): 2012/13

Risk of carer-reported injuries (5 year olds): 2012/13
Characteristic (Reference group)
Comparison group
Not brought to hospital vs. Brought to ED
Not brought to hospital vs. Admitted as inpatient
p Odds Ratio
95% Confidence Interval for OR Odds
Ratio
95% Confidence Interval for OR
Lower Upper Lower Upper
Gender (Female) Male 1.225 1.100 1.364 1.679 1.296 2.175 <.001
Family structure (Two parents, two or more children)
Two parents, one child 0.875 0.709 1.079 0.744 0.426 1.299
<.001 One parent, two or more children
1.321 1.064 1.641 1.105 0.683 1.788
One parent, one child 1.198 0.938 1.529 1.822 1.146 2.896
Household occupation class (Managerial, professional or technical)
Not in paid work 0.826 0.654 1.043 1.781 1.125 2.819
<.001
Non-manual 0.984 0.847 1.144 1.052 0.726 1.523
Skilled manual 0.909 0.772 1.069 1.135 0.774 1.663
Semi-skilled and unskilled manual
1.005 0.836 1.208 1.131 0.731 1.748
Community type (Rural) Urban 1.350 1.211 1.506 1.045 0.807 1.354 <.001
Accommodation (Suitable for family's needs)
Unsuitable for family's needs
1.164 0.985 1.377 1.746 1.244 2.449 .003
Source: GUI anonymised microdata file, ISSDA, https://www.ucd.ie/issda/
Bold indicates a statistically significant difference (p < .001).

Self-reported injuries among older children :
2010-2014 Prevalence of injury among children from HBSC, overall and by sex
Cohort/Wave Age Sample
size Measure All Males Females
HBSC 2010 10-11 years
1613 Past 12 months ... requiring treatment from doctor or nurse
34.5 42.7 25.9
HBSC 2010 12-14 years
6088 Past 12 months ... requiring treatment from doctor or nurse
37.5 43.6 31.1
HBSC 2010 15-18 years
4636 Past 12 months ... requiring treatment from doctor or nurse
37.8 45.5 29.6
HBSC 2014 10-11 years
1555 Past 12 months ... requiring treatment from doctor or nurse
36.2 40.8 31.9
HBSC 2014 12-14 years
4777 Past 12 months ... requiring treatment from doctor or nurse
41.2 47.0 35.2
HBSC 2014 15-18 years
4164 Past 12 months ... requiring treatment from doctor or nurse
43.4 51.8 34.6
Source: HBSC 2010 and 2014 data compiled by the HBSC Ireland Team, NUI, Galway, with thanks to Catherine Perry, Eimear Keane, and Michal Molcho. The HBSC Ireland homepage is http://www.nuigalway.ie/hbsc/
Bold indicates a statistically significant difference (p < .001).

Activities during self-reported injuries (11-18 year olds): 2014

Risk factors for self-reported injuries
among 11-18 year olds: 2014
Characteristic (Reference group)
Comparison group
No days missed vs. 1-2 days missed
No days missed vs. 3+ days missed
p Odds Ratio
95% Confidence Interval for OR Odds
Ratio
95% Confidence Interval for OR
Lower Upper Lower Upper
Age 10-11
Gender (Female) Male 1.901 1.199 3.013 2.749 1.764 4.286 <.001
Age 12-14
Gender (Female) Male 1.270 1.032 1.564 1.988 1.635 2.416 <.001
Age 15-18
Gender (Female) Male 1.637 1.282 2.091 1.919 1.565 2.352 <.001
Source: HBSC 2010 compiled by the HBSC Ireland Team, NUI, Galway, with thanks to Catherine Perry, Eimear Keane, and Michal Molcho. The HBSC Ireland homepage is http://www.nuigalway.ie/hbsc/
Patterning (preliminary conclusions)
• Mortality rates: highest among boys & older children &
adolescents
• Hospital admission: risk highest among boys & 0-4 years olds
• Hospital admission for severe injuries: more likely among boys
Sex-age patterning depends on the type of injury:
• Land transport accidents rates highest among adolescents
• Accidental poisoning - Burns and scalds rates are higher
among children aged 0-4 years.
Location of injury also depends on age:
• Younger children: more likely in home
• Adolescents: more likely during sports & recreation
Trends (preliminary conclusions)
Overall decline in unintentional child injury mortality &
hospitalisation rates is positive
However, these mortality rates and hospitalisation rates
appear have plateaued in the past 2-3 years
Trends in mortality rates does not appear to depend on
TACTICS category of injury
However, trends in hospitalisation rates do appear to
depend on TACTICS category of injury

Child injury prevention (preliminary conclusions)
Different age groups require different focii
Different contextual factors play different roles in different
injuries (particularly amongst younger children)
Some possible focii:
• Home safety among younger children (particularly
“bangs” and falls)
• Safety during sports and recreation (particularly
among older children & adolescents)
• Cycling safety (particularly among younger children)
• Promotion of a culture of safety and ‘safe play’ among
boys (at all ages but particularly in older age groups
and adolescents)

Research & data gaps (preliminary conclusions)
Data gaps:
• Data quality in existing data sources
• ED treated injury
• GP treated injury
• Survey questions that map to TACTICS framework
• Harmonised content & wording across study
waves and across surveys
Research gaps:
• Wider range of contextual factors (location,
activity, severity, etc) for particular injury types
• Explorie other data sources such as ED data

Thank you
Any questions?
Email : [email protected]
Web: www.publichealth.ie
www.thehealthwell.info
www.twitter.com/publichealthie
22
Trends in child injury hospitalisation rates:
2006-2015 (%)
As percentage of all admissions for unintentional injuries:
• Land transport accidents: steadily decreased from 15% in
2006 to 10% in 2015
• Motor vehicle driver/passenger injuries: decreased
steadily
• Bicycle accidents: not changed substantially
• Struck by an object or person: not changed substantially