Open Path CO /H O Gas Analyzer - Catec · Section1.GeneralInformation What’sWhat...
190
Open Path CO2/H2O Gas Analyzer Instruction Manual
Transcript of Open Path CO /H O Gas Analyzer - Catec · Section1.GeneralInformation What’sWhat...
Open Path CO2/H2O Gas AnalyzerInstruction Manual


LI-7500RSOpen Path CO2/H2O Gas Analyzer
LI-COR BiosciencesGlobalHeadquarters4647 Superior StreetLincoln, Nebraska 68504Phone: +1-402-467-3576 • Toll free: 800-447-3576 • Fax: [email protected] • [email protected] • www.licor.com/env
Regional OfficesLI-COR GmbH, GermanyServing Andorra, Albania, Cyprus, Estonia, Germany, Iceland, Latvia, Lithuania,Liechtenstein, Malta, Moldova, Monaco, San Marino, Ukraine, and Vatican City.LI-COR Biosciences GmbHSiemensstraße 25A • 61352 Bad HomburgGermanyPhone: +49 (0) 6172 17 17 771 • Fax: +49 (0) 6172 17 17 [email protected] • [email protected]
LI-COR Ltd., United KingdomServing Denmark, Finland, Ireland, Norway, Sweden, and UK.LI-COR Biosciences UK Ltd.St. John’s Innovation CentreCowley Road • Cambridge • CB4 0WSUnited KingdomPhone: +44 (0) 1223 422102 • Fax: +44 (0) 1223 [email protected] • [email protected]
LI-COR Distributor Network:www.licor.com/env/distributors
NOTICE
The information contained in this document is subject to change without notice.
LI-COR MAKES NO WARRANTY OF ANY KIND WITH REGARD TO THIS MATERIAL, INCLUDING, BUTNOT LIMITED TO THE IMPLIED WARRANTIES OF MERCHANTABILITY AND FITNESS FOR APARTICULAR PURPOSE. LI-COR shall not be liable for errors contained herein or for incidental or consequentialdamages in connection with the furnishing, performance, or use of this material.
This document contains proprietary information which is protected by copyright. All rights are reserved. No part ofthis document may be photocopied, reproduced, or translated to another language without prior written consent ofLI-COR, Inc.
The LI-7500RS is covered by U.S. patents 6,317,212; 9,121,793, and foriegn equivalents. Other patents pending.
EddyPro® Software and the SMARTFlux System are trademarks of LI-COR, Inc. Microsoft® and Windows® areregistered trademarks of Microsoft Corporation. Eurofast® is a registered trademark of Turck, Inc. Campbell Scien-tific® is a registered trademark of Campbell Scientific, Inc. Dropbox and the Dropbox logo are trademarks of Drop-box, Inc. All other trademarks or registered trademarks are property of their respective owners.
Printing History
Publication Number 984-15811
© Copyright 2015, LI-COR, Inc.
New editions of this manual will incorporate all material since the previous editions. Update packages may be usedbetween editions which contain replacement and additional pages to be merged into the manual by the user. Themanual printing date indicates its current edition. The printing date changes when a new edition is printed. (Minorcorrections and updates which are incorporated at reprint do not cause the date to change).
Version Number Publication Date Changes1st Printing November, 2015 Not applicable.
Updated on Wednesday, January 20, 2016.
Lead (Pb) Mercury (Hg) Cadmium (Cd)
Chromium VI
Compounds
(Cr6+
)
Polybrominated
Biphenyls
(PBB)
Polybrominated
Diphenyl Ethers
(PBDE)
OOO OOXylbmessAdaeH
(Pb) (Hg) (Cd) (Cr6+
) (PBB) (PBDE)
X: this component does contain this hazardous substance above the maxiumum concentration values in homogeneous materials
specified in the SJ/T 11363-2006 Industry Standard (Company can explain the technical reasons for the "X")
Hazardous Substances or Elements
Component Name
O: this component does not contain this hazardous substance above the maxiumum concentration values in homogeneous
materials specified in the SJ/T 11363-2006 Industry Standard.
X: SJ/T 11363-2006 o ( ,
"X" o )
CO2/H2O
O: SJ/T 11363-2006 o
LI-7200
LI-7200
X O O X O OO
ii

iii
CE MarkingThis product is a CE-marked product. For conformity information, contact LI-COR Support [email protected]. Outside of the U.S., contact your local sales office or distributor.
A bit of history...The LI-7500RS model is the followup to the LI-7500A, and the LI-7500 beforethat. Developed initially to be a component of homemade eddy covariance sys-tems, the LI-7500 was the first open path gas analyzer to find widespread use ineddy covariance measurements. The LI-7500A brought datalogging, networkingcapabilities, and a number of improvements to the measurement, but most sig-nificantly, it grew into the core component of a stand-alone, full featured eddycovariance system.
The RS models present improvements to the optical hardware, and theseimprovements will directly affect the quality of data collected and the cleaningfrequency of optical components.
New instruments will provide a noticeable difference in measurements in manycircumstances. Older instruments can be upgraded to the new hardware. If youdon't want to purchase the upgrade, you can still update your instrument soft-ware to the most current version—so you are not left behind by the new modelnumber.
Even if you do not upgrade your instrument hardware, you can use this manualto guide your use of an original LI-7500A. We invite you to install the new soft-ware on older instruments. It is available for free from the LI-COR web site. Wealso invite your feedback—what do you like? What do you dislike? What do youwant to measure that you can't measure now?
iv
v
Contents
A bit of history... iv
Section 1. General Information
What’s What 1-2Spare Parts Kits 1-2Cables 1-3Air Temperature Sensor 1-4Calibration Certificate 1-5LI-7550 Analyzer Interface Unit 1-6
Section 2. Initial Setup
Getting Started Tutorial 2-1Installing the LI-7500RS and Components 2-4
Mounting the LI-7550 Analyzer Interface Unit 2-4Mounting the Sensor Head 2-5Connecting the Sensor Head Cable 2-6
Tips for Successful Use of the LI-7500RS 2-7Dew 2-7Rain and Snow 2-7Dust, Pollen, and Salt Deposits 2-8Vibrations 2-8
Using the 7550-101 Auxiliary Sensor Interface 2-9Mounting the ASI 2-9Terminal Connections 2-10Electrical Connections 2-11Connecting Sensors to the ASI 2-11
Section 3. Operation
Installing the PC Software 3-1Connecting with the Analyzer 3-1
Connect over Ethernet 3-1Connect over Serial RS-232 3-3Run Disconnected 3-4
Dashboard 3-5Instrument Information 3-6
IRGA Status and Connectivity 3-7Eddy Covariance Flux Graphs 3-8Data Display 3-10
Configuring Eddy Covariance Measurements 3-13Eddy Covariance Checklist 3-14System Clock 3-16Configuring the USB Log File 3-17Entering the Site Description 3-18Entering Anemometer Information 3-20Entering CO2/H2O Analyzer Information 3-27Entering LI-7700 Information 3-30Entering Biomet System Information 3-33Connecting with the SmartFlux System 3-35Begin Logging Data 3-36Transferring Logged Data 3-39
Running SmartFlux 3-41Express Processing 3-41Overview of Advanced Processing 3-42SmartFlux Results Files 3-52
Section 4. Calibration
How Stable are Zero and Span? 4-1Checking the Zero 4-2Checking the Span 4-3Step-by-Step Calibration Instructions 4-5Considerations for Setting the Secondary Span 4-8Step-by-Step Secondary CO2 Span 4-8Step-by-Step Secondary H2O Span 4-9What Actually Happens 4-9
Section 5. Maintenance
Schedule 5-1Cleaning the Optical Path 5-2Replacing the Fuses 5-3
Power Supply Fuse 5-3Accessory Fuse 5-4
Replacing the Internal Chemicals 5-4
vi
vii
Section 6. Troubleshooting
Power On Problems 6-1Ethernet Connection Problems 6-1RS-232 serial connection problems 6-2Bad Temperature Readings 6-3Bad Pressure Readings 6-4Bad CO2 or H2O Readings 6-4
Section 7. Software Reference
Settings 7-1Time 7-1Network 7-4Manual 7-7Advanced—Chopper Housing Temperature 7-7Integration 7-8
LI-7500RS Menu Overview 7-10Auxiliary Inputs 7-10Outputs 7-12Calibration Overview 7-21Changing Sensor Heads 7-24
Diagnostic Messages 7-25General indicators 7-25Test Point Values 7-26Waveform 7-29
Charting 7-30PC Logging 7-32Configuration Files 7-33Software Updates 7-33
Embedded Instrument Software 7-34PC Software Update 7-35
Section 8. Theory of Operation
Relating Absorption to Concentration 8-1Measuring Absorptance 8-2Cross Sensitivity 8-3Zero Drift 8-3Equation Summary 8-4
H2O 8-4CO2 8-4
LI-7500RS Implementation 8-6A Note About Pressure And Temperature 8-7LI-7500RS Diagnostics 8-7
CO2 Signal Strength 8-7
Appendix A. Specifications
Appendix B. Pin Assignments
Appendix C. Suppliers
Appendix D. Configuration Grammar
Appendix E. Warranty
Index
viii
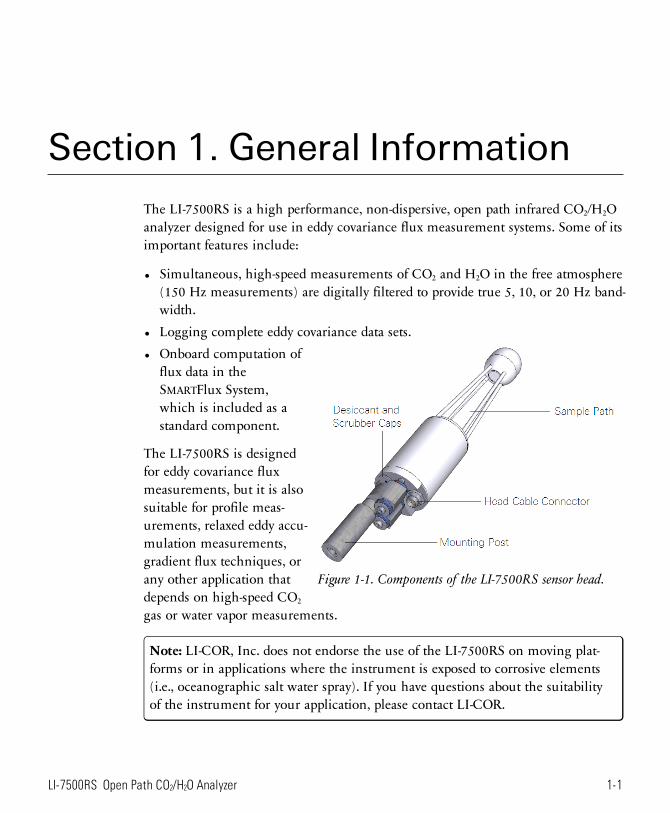
Section 1. General InformationThe LI-7500RS is a high performance, non-dispersive, open path infrared CO2/H2Oanalyzer designed for use in eddy covariance flux measurement systems. Some of itsimportant features include:
l Simultaneous, high-speed measurements of CO2 and H2O in the free atmosphere(150 Hz measurements) are digitally filtered to provide true 5, 10, or 20 Hz band-width.
l Logging complete eddy covariance data sets.l
Figure 1-1. Components of the LI-7500RS sensor head.
Onboard computation offlux data in theSMARTFlux System,which is included as astandard component.
The LI-7500RS is designedfor eddy covariance fluxmeasurements, but it is alsosuitable for profile meas-urements, relaxed eddy accu-mulation measurements,gradient flux techniques, orany other application thatdepends on high-speed CO2
gas or water vapor measurements.
Note: LI-COR, Inc. does not endorse the use of the LI-7500RS on moving plat-forms or in applications where the instrument is exposed to corrosive elements(i.e., oceanographic salt water spray). If you have questions about the suitabilityof the instrument for your application, please contact LI-COR.
1-1LI-7500RS Open Path CO2/H2O Analyzer
Section 1. General Information
What’s WhatIf you have just taken delivery of your LI-7500RS, check the packing list to verifythat you have received everything that was ordered.
Note: You need the PC software to configure the instrument. Download it fromthe LI-COR technical support web site: www.licor.com/env/support. Select yourinstrument and you'll find the software downloads.
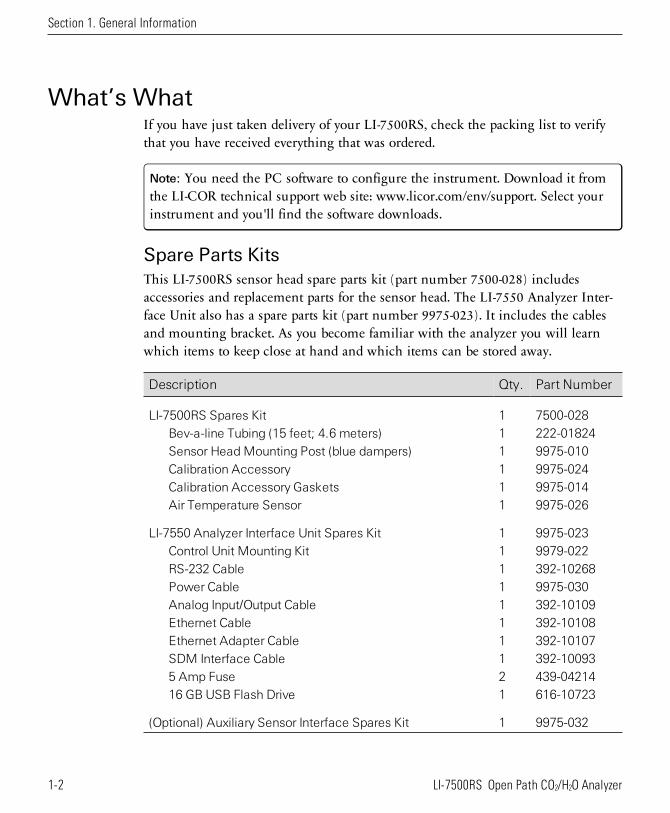
Spare Parts KitsThis LI-7500RS sensor head spare parts kit (part number 7500-028) includesaccessories and replacement parts for the sensor head. The LI-7550 Analyzer Inter-face Unit also has a spare parts kit (part number 9975-023). It includes the cablesand mounting bracket. As you become familiar with the analyzer you will learnwhich items to keep close at hand and which items can be stored away.
Description Qty. Part Number
LI-7500RS Spares Kit 1 7500-028Bev-a-line Tubing (15 feet; 4.6 meters) 1 222-01824Sensor Head Mounting Post (blue dampers) 1 9975-010Calibration Accessory 1 9975-024Calibration Accessory Gaskets 1 9975-014Air Temperature Sensor 1 9975-026
LI-7550 Analyzer Interface Unit Spares Kit 1 9975-023Control Unit Mounting Kit 1 9979-022RS-232 Cable 1 392-10268Power Cable 1 9975-030Analog Input/Output Cable 1 392-10109Ethernet Cable 1 392-10108Ethernet Adapter Cable 1 392-10107SDM Interface Cable 1 392-100935 Amp Fuse 2 439-0421416 GB USB Flash Drive 1 616-10723
(Optional) Auxiliary Sensor Interface Spares Kit 1 9975-032
1-2 LI-7500RS Open Path CO2/H2O Analyzer
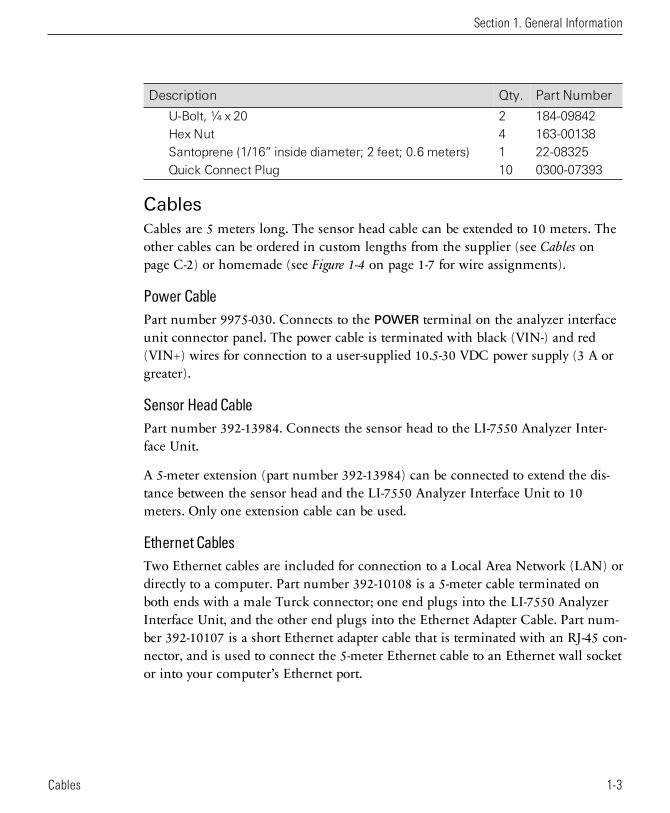
Description Qty. Part Number
U-Bolt, ¼ x 20 2 184-09842Hex Nut 4 163-00138Santoprene (1/16” inside diameter; 2 feet; 0.6 meters) 1 22-08325Quick Connect Plug 10 0300-07393
CablesCables are 5 meters long. The sensor head cable can be extended to 10 meters. Theother cables can be ordered in custom lengths from the supplier (see Cables onpage C-2) or homemade (see Figure 1-4 on page 1-7 for wire assignments).
Power CablePart number 9975-030. Connects to the POWER terminal on the analyzer interfaceunit connector panel. The power cable is terminated with black (VIN-) and red(VIN+) wires for connection to a user-supplied 10.5-30 VDC power supply (3 A orgreater).
Sensor Head CablePart number 392-13984. Connects the sensor head to the LI-7550 Analyzer Inter-face Unit.
A 5-meter extension (part number 392-13984) can be connected to extend the dis-tance between the sensor head and the LI-7550 Analyzer Interface Unit to 10meters. Only one extension cable can be used.
Ethernet CablesTwo Ethernet cables are included for connection to a Local Area Network (LAN) ordirectly to a computer. Part number 392-10108 is a 5-meter cable terminated onboth ends with a male Turck connector; one end plugs into the LI-7550 AnalyzerInterface Unit, and the other end plugs into the Ethernet Adapter Cable. Part num-ber 392-10107 is a short Ethernet adapter cable that is terminated with an RJ-45 con-nector, and is used to connect the 5-meter Ethernet cable to an Ethernet wall socketor into your computer’s Ethernet port.
Section 1. General Information
1-3Cables
Section 1. General Information
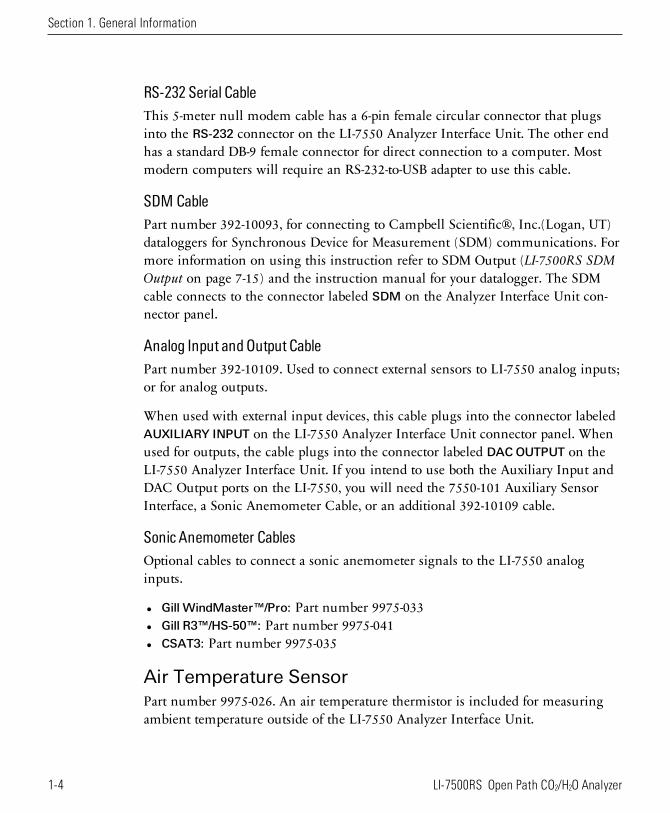
RS-232 Serial CableThis 5-meter null modem cable has a 6-pin female circular connector that plugsinto the RS-232 connector on the LI-7550 Analyzer Interface Unit. The other endhas a standard DB-9 female connector for direct connection to a computer. Mostmodern computers will require an RS-232-to-USB adapter to use this cable.
SDM CablePart number 392-10093, for connecting to Campbell Scientific®, Inc.(Logan, UT)dataloggers for Synchronous Device for Measurement (SDM) communications. Formore information on using this instruction refer to SDM Output (LI-7500RS SDMOutput on page 7-15) and the instruction manual for your datalogger. The SDMcable connects to the connector labeled SDM on the Analyzer Interface Unit con-nector panel.
Analog Input and Output CablePart number 392-10109. Used to connect external sensors to LI-7550 analog inputs;or for analog outputs.
When used with external input devices, this cable plugs into the connector labeledAUXILIARY INPUT on the LI-7550 Analyzer Interface Unit connector panel. Whenused for outputs, the cable plugs into the connector labeled DACOUTPUT on theLI-7550 Analyzer Interface Unit. If you intend to use both the Auxiliary Input andDAC Output ports on the LI-7550, you will need the 7550-101 Auxiliary SensorInterface, a Sonic Anemometer Cable, or an additional 392-10109 cable.
Sonic Anemometer CablesOptional cables to connect a sonic anemometer signals to the LI-7550 analoginputs.
l Gill WindMaster™/Pro: Part number 9975-033l Gill R3™/HS-50™: Part number 9975-041l CSAT3: Part number 9975-035
Air Temperature SensorPart number 9975-026. An air temperature thermistor is included for measuringambient temperature outside of the LI-7550 Analyzer Interface Unit.
1-4 LI-7500RS Open Path CO2/H2O Analyzer

Calibration CertificateProvides the calibration coefficients for your sensor head. These values are uniqueto each sensor head and have been entered into the corresponding LI-7550 at thefactory. Keep this sheet in case you need to re-enter these values. You can alsoacquire a copy of your calibration certificate from the LI-COR support web site.
Section 1. General Information
1-5Calibration Certificate
Section 1. General Information
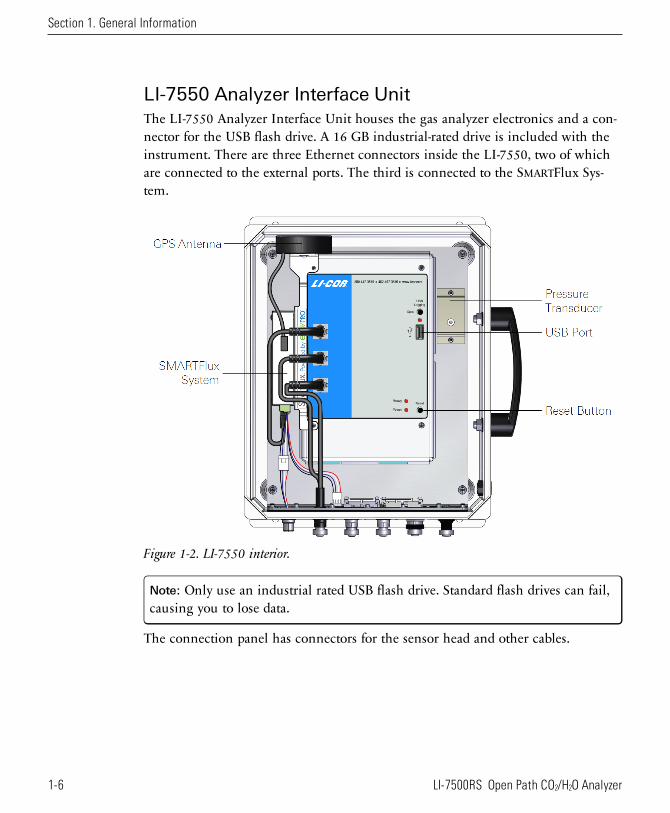
LI-7550 Analyzer Interface UnitThe LI-7550 Analyzer Interface Unit houses the gas analyzer electronics and a con-nector for the USB flash drive. A 16 GB industrial-rated drive is included with theinstrument. There are three Ethernet connectors inside the LI-7550, two of whichare connected to the external ports. The third is connected to the SMARTFlux Sys-tem.
Figure 1-2. LI-7550 interior.
Note: Only use an industrial rated USB flash drive. Standard flash drives can fail,causing you to lose data.
The connection panel has connectors for the sensor head and other cables.
1-6 LI-7500RS Open Path CO2/H2O Analyzer
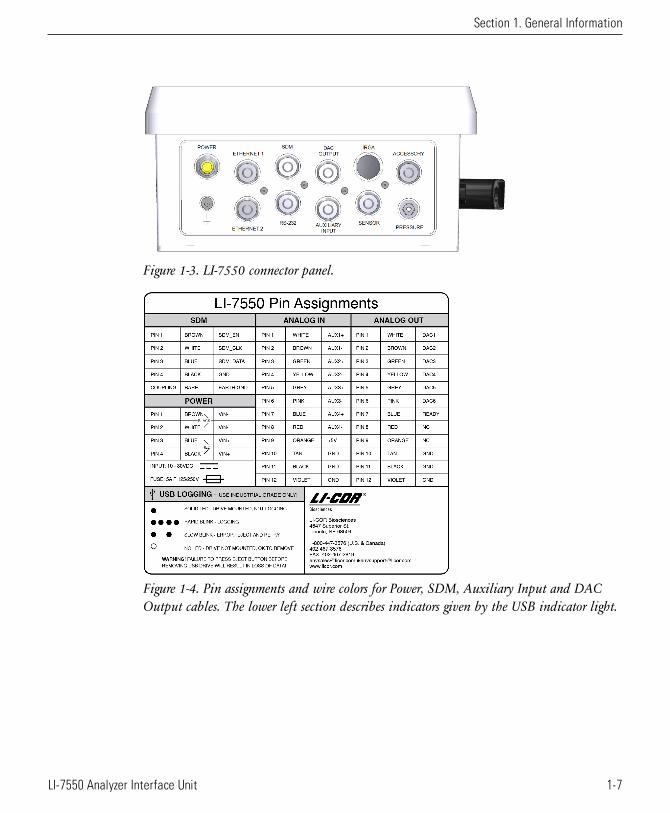
Figure 1-3. LI-7550 connector panel.
Figure 1-4. Pin assignments and wire colors for Power, SDM, Auxiliary Input and DACOutput cables. The lower left section describes indicators given by the USB indicator light.
Section 1. General Information
1-7LI-7550 Analyzer Interface Unit

Section 1. General Information
1-8 LI-7500RS Open Path CO2/H2O Analyzer
Section 2. Initial SetupThis section describes how to mount the analyzer and accessories in a typical eddycovariance application.
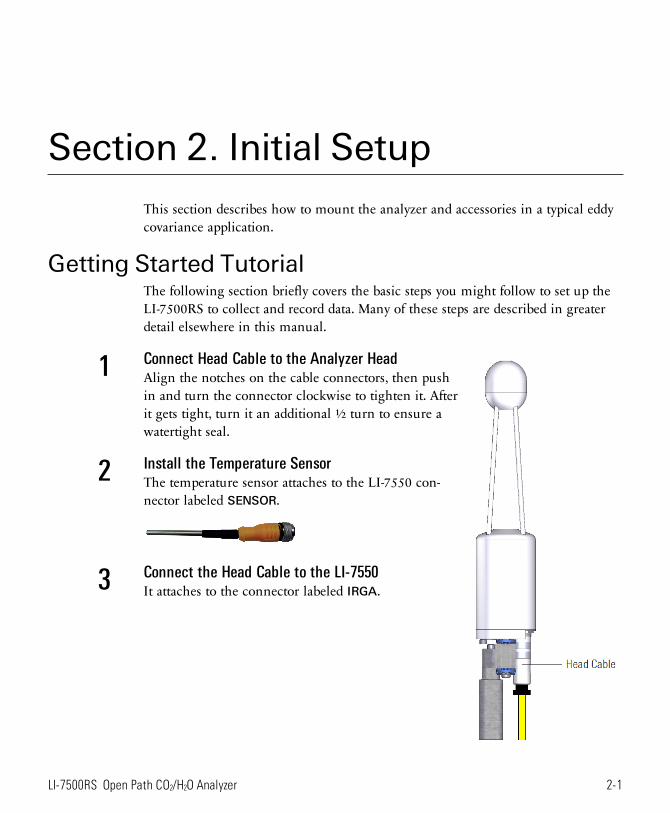
Getting Started TutorialThe following section briefly covers the basic steps you might follow to set up theLI-7500RS to collect and record data. Many of these steps are described in greaterdetail elsewhere in this manual.
1 Connect Head Cable to the Analyzer HeadAlign the notches on the cable connectors, then pushin and turn the connector clockwise to tighten it. Afterit gets tight, turn it an additional ½ turn to ensure awatertight seal.
2 Install the Temperature SensorThe temperature sensor attaches to the LI-7550 con-nector labeled SENSOR.
3 Connect the Head Cable to the LI-7550It attaches to the connector labeled IRGA.
2-1LI-7500RS Open Path CO2/H2O Analyzer
Section 2. Initial Setup
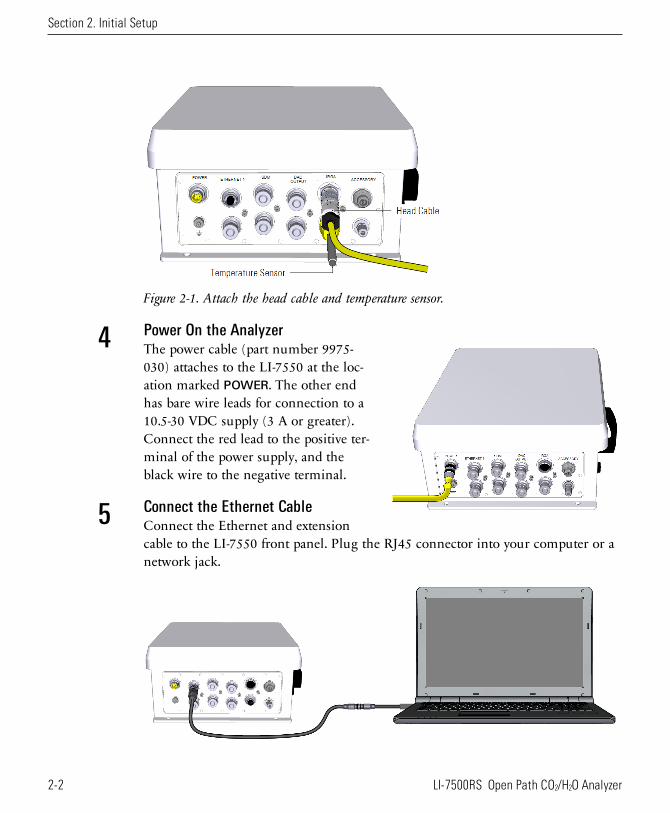
Figure 2-1. Attach the head cable and temperature sensor.
4 Power On the AnalyzerThe power cable (part number 9975-030) attaches to the LI-7550 at the loc-ation marked POWER. The other endhas bare wire leads for connection to a10.5-30 VDC supply (3 A or greater).Connect the red lead to the positive ter-minal of the power supply, and theblack wire to the negative terminal.
5 Connect the Ethernet CableConnect the Ethernet and extensioncable to the LI-7550 front panel. Plug the RJ45 connector into your computer or anetwork jack.
2-2 LI-7500RS Open Path CO2/H2O Analyzer
6 Install the PC SoftwareGo to www.licor.com/env/support, select your instrument and then select Software.Download the software and install it on your computer. The program icon will bein the Programs menu under the LI-COR folder.
7 Connect with the InstrumentLaunch the PC software, then select your instrument from the list and click Con-
nect.
8 Verify the Instrument ResponseIf the instrument is indoors it will probably have very high CO2 readings. Exhalethrough the sample path. You should see a sudden spike in the CO2 and H2O read-ings.
9 Configure Site SetupFor eddy covariance measurements using EddyPro® Software or the SMARTFlux Sys-tem, configure the site setup (see Configuring Eddy Covariance Measurements on page3-13).
Section 2. Initial Setup
2-3Getting Started Tutorial
Section 2. Initial Setup
Installing the LI-7500RS and ComponentsThe LI-7500RSis typically installed on a tripod or tower for eddy covariance applic-ations. This section describes how to install the instrument and its associated com-ponents.
Mounting the LI-7550 Analyzer Interface UnitThe mounting kit (part number 9979-022) is used to mount the LI-7550 to a tripodor other post. You can also attach the box directly to a flat surface. The LI-7550 willoperate according to specifications in direct sun.
Determine the height at which the sensor head will be mounted, and plan tomount the Analyzer Interface Unit accordingly. The head cable is 5 meters long.An extension cable can extend the total cable length to a maximum of 10 meters.
1
1
2
37
8
4
5
6
2
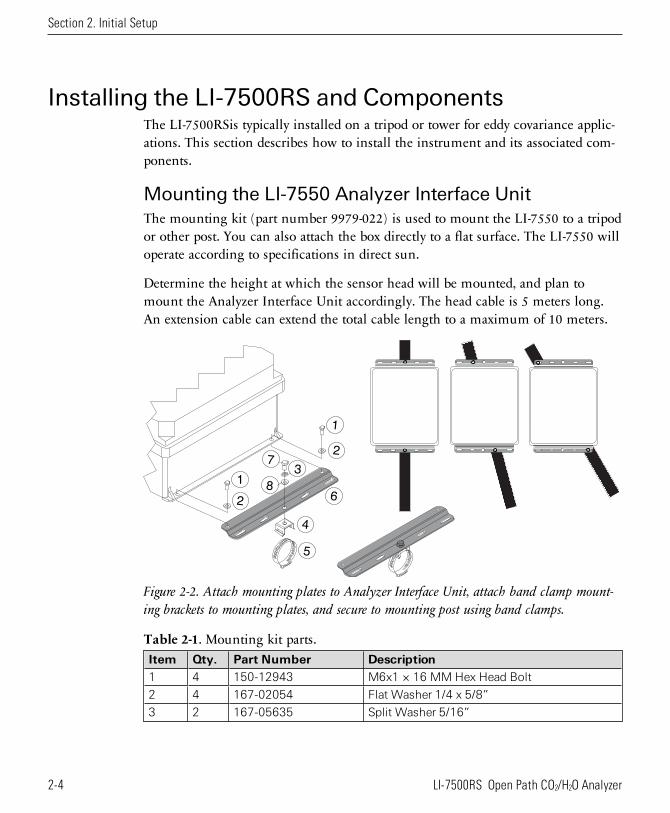
Figure 2-2. Attach mounting plates to Analyzer Interface Unit, attach band clamp mount-ing brackets to mounting plates, and secure to mounting post using band clamps.
Item Qty. Part Number Description1 4 150-12943 M6x1 × 16 MM Hex Head Bolt
2 4 167-02054 Flat Washer 1/4 x 5/8”
3 2 167-05635 Split Washer 5/16”
Table 2-1. Mounting kit parts.
2-4 LI-7500RS Open Path CO2/H2O Analyzer
Item Qty. Part Number Description4 2 235-13234 Single Bolt Flared Leg Mounting Bracket
5 2 300-13293 Hose Clamp, 9/16”
6 2 9879-045 Mounting Plate
7 2 included w/ item #4 5/16-24 × 1/2” Hex Head Bolt
8 2 included w/ item #4 5/16” Flat Washer
Table 2-1. Mounting kit parts. (...continued)
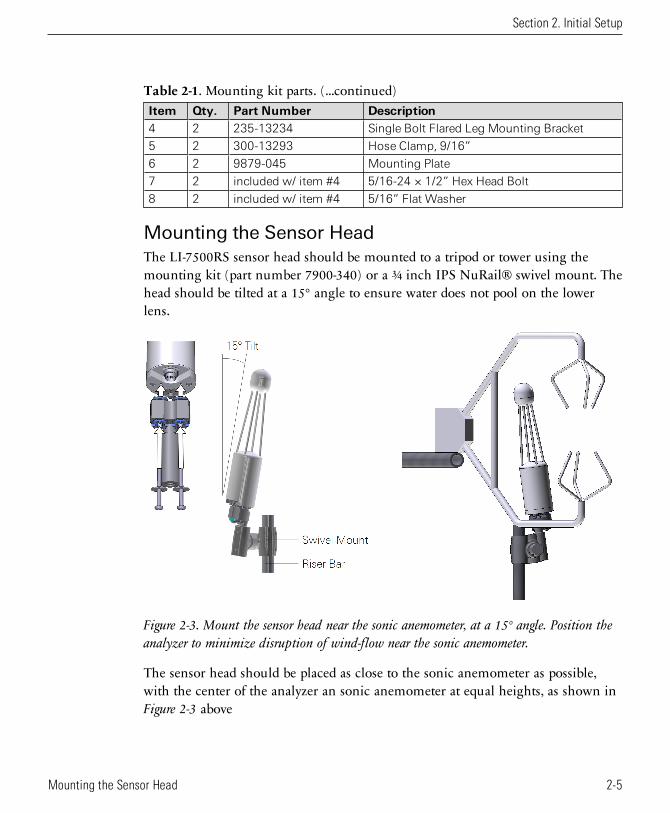
Mounting the Sensor HeadThe LI-7500RS sensor head should be mounted to a tripod or tower using themounting kit (part number 7900-340) or a ¾ inch IPS NuRail® swivel mount. Thehead should be tilted at a 15° angle to ensure water does not pool on the lowerlens.
Figure 2-3. Mount the sensor head near the sonic anemometer, at a 15° angle. Position theanalyzer to minimize disruption of wind-flow near the sonic anemometer.
The sensor head should be placed as close to the sonic anemometer as possible,with the center of the analyzer an sonic anemometer at equal heights, as shown inFigure 2-3 above
Section 2. Initial Setup
2-5Mounting the Sensor Head
Section 2. Initial Setup
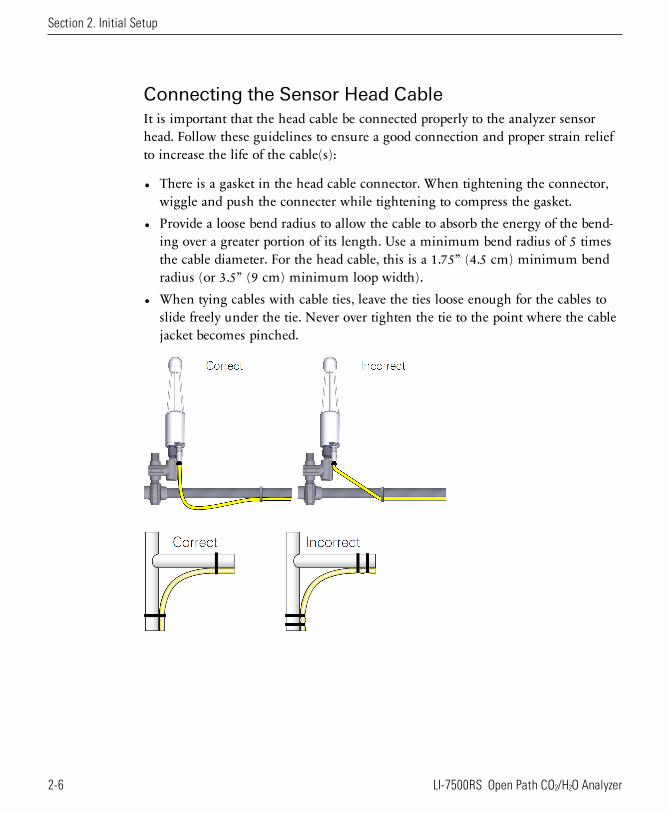
Connecting the Sensor Head CableIt is important that the head cable be connected properly to the analyzer sensorhead. Follow these guidelines to ensure a good connection and proper strain reliefto increase the life of the cable(s):
l There is a gasket in the head cable connector. When tightening the connector,wiggle and push the connecter while tightening to compress the gasket.
l Provide a loose bend radius to allow the cable to absorb the energy of the bend-ing over a greater portion of its length. Use a minimum bend radius of 5 timesthe cable diameter. For the head cable, this is a 1.75” (4.5 cm) minimum bendradius (or 3.5” (9 cm) minimum loop width).
l When tying cables with cable ties, leave the ties loose enough for the cables toslide freely under the tie. Never over tighten the tie to the point where the cablejacket becomes pinched.
2-6 LI-7500RS Open Path CO2/H2O Analyzer
Tips for Successful Use of the LI-7500RS
DewThe LI-7500RS can tolerate droplets on the windows to a certain extent. The auto-matic gain control will increase, but the calibration is unchanged. If the dropletscoalesce and get big enough, the CO2 Signal Strength will approach 0, and even-tually the readings will become unusable. This can be minimized by tilting thesensor head 10 to 15° from vertical and by applying a water-shedding coating suchas RainX® to the lower window.
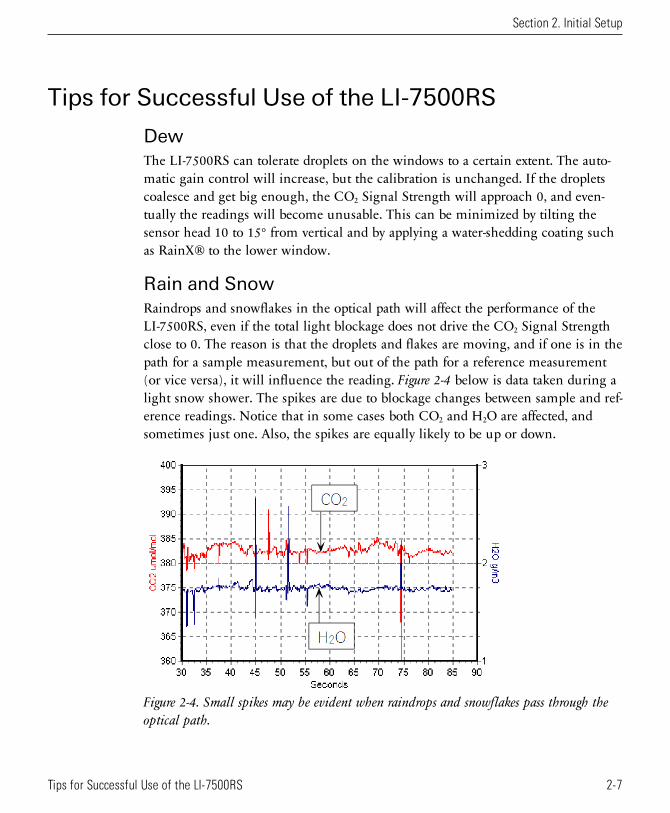
Rain and SnowRaindrops and snowflakes in the optical path will affect the performance of theLI-7500RS, even if the total light blockage does not drive the CO2 Signal Strengthclose to 0. The reason is that the droplets and flakes are moving, and if one is in thepath for a sample measurement, but out of the path for a reference measurement(or vice versa), it will influence the reading. Figure 2-4 below is data taken during alight snow shower. The spikes are due to blockage changes between sample and ref-erence readings. Notice that in some cases both CO2 and H2O are affected, andsometimes just one. Also, the spikes are equally likely to be up or down.
Figure 2-4. Small spikes may be evident when raindrops and snowflakes pass through theoptical path.
Section 2. Initial Setup
2-7Tips for Successful Use of the LI-7500RS
Section 2. Initial Setup
The higher the bandwidth, the more pronounced this effect, since less averaging isdone.
Dust, Pollen, and Salt DepositsThe LI-7500RS is quite tolerant of particulates on the windows, as long as they aresmall, and spectrally neutral. Pollen and salt deposits may become a problembecause they are sticky and can accumulate, so monitor the CO2 Signal Strengthvalue and clean the windows as needed.
VibrationsThe LI-7500RS is vibration sensitive to frequencies of 150 Hz ± the bandwidth.Thus, if the bandwidth is 10 Hz, the frequency problem range is 140 to 160 Hz(and upper harmonics). The instrument is completely insensitive to vibrationsslower than this, and very slightly sensitive at frequencies higher than this.
For land-based installations, probably the most likely source of vibrational problemswould be on a tower with tight guy wires. For other settings (aircraft, ships, etc.)where there may be vibrations in the problem range, you should try to minimizethe problem through alternative mounting attachments.
2-8 LI-7500RS Open Path CO2/H2O Analyzer
Using the 7550-101 Auxiliary Sensor Interface
PLUGS PLUGS
P1
P2
LK
1LI-
75
50
LI-
75
50
LI-
77
00
LI-
77
00
36
0-0
93
33
R
ev 2
Ma
de
in
US
A
ww
w.lic
or.
co
m
AU
X1
AU
X2
GN
D
AU
X3
AU
X4
GN
D
AU
X1
+
AU
X1
-
GN
D
AU
X2
+
AU
X2
-
GN
D
DA
C1
DA
C2
GN
D
DA
C3
DA
C4
GN
D
AN
AL
OG
IN
A IN
A O
UT
T1
T2
T3
T_
RE
F
RE
SE
RV
ED
RE
SE
RV
ED
+5
V
GN
D
AU
X3
+
AU
X3
-
AU
X4
+
GN
D
AU
X4
-
GN
D
+5
V
GN
D
DA
C5
DA
C6
RE
AD
Y
GN
D
NC
GN
D
NC
GN
D
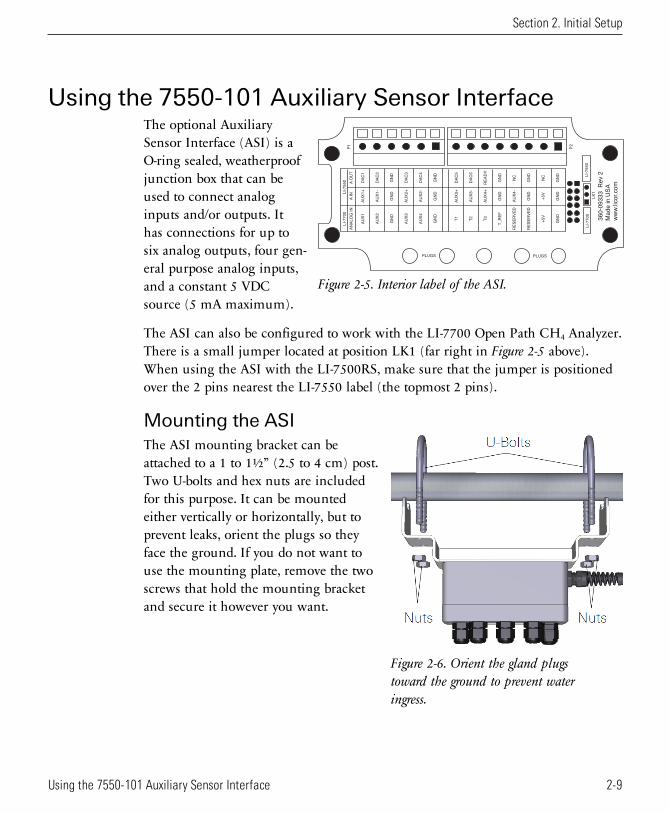
Figure 2-5. Interior label of the ASI.
The optional AuxiliarySensor Interface (ASI) is aO-ring sealed, weatherproofjunction box that can beused to connect analoginputs and/or outputs. Ithas connections for up tosix analog outputs, four gen-eral purpose analog inputs,and a constant 5 VDCsource (5 mA maximum).
The ASI can also be configured to work with the LI-7700 Open Path CH4 Analyzer.There is a small jumper located at position LK1 (far right in Figure 2-5 above).When using the ASI with the LI-7500RS, make sure that the jumper is positionedover the 2 pins nearest the LI-7550 label (the topmost 2 pins).
Mounting the ASI
Figure 2-6. Orient the gland plugstoward the ground to prevent wateringress.
The ASI mounting bracket can beattached to a 1 to 1½” (2.5 to 4 cm) post.Two U-bolts and hex nuts are includedfor this purpose. It can be mountedeither vertically or horizontally, but toprevent leaks, orient the plugs so theyface the ground. If you do not want touse the mounting plate, remove the twoscrews that hold the mounting bracketand secure it however you want.
Section 2. Initial Setup
2-9Using the 7550-101 Auxiliary Sensor Interface
Section 2. Initial Setup
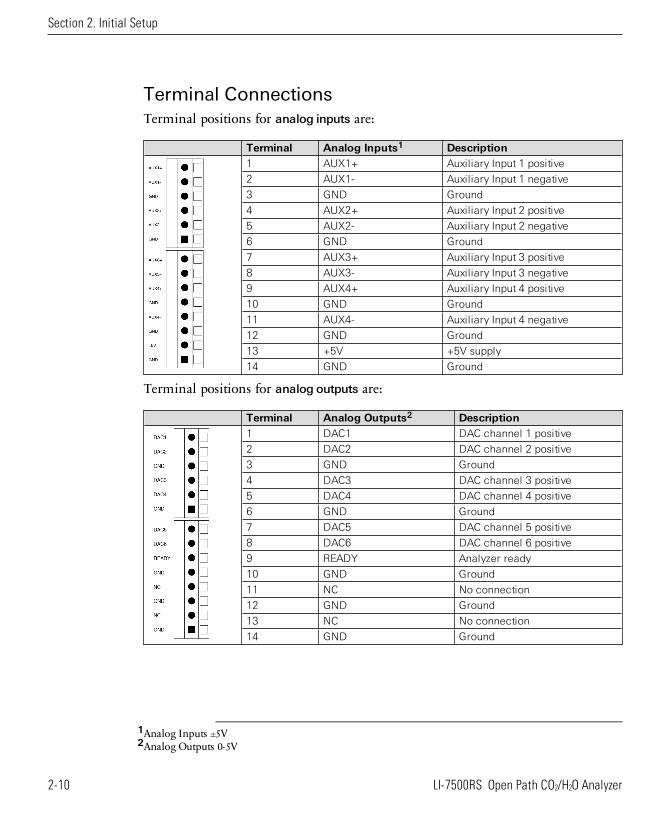
Terminal ConnectionsTerminal positions for analog inputs are:
Terminal Analog Inputs1 Description1 AUX1+ Auxiliary Input 1 positive
2 AUX1- Auxiliary Input 1 negative
3 GND Ground
4 AUX2+ Auxiliary Input 2 positive
5 AUX2- Auxiliary Input 2 negative
6 GND Ground
7 AUX3+ Auxiliary Input 3 positive
8 AUX3- Auxiliary Input 3 negative
9 AUX4+ Auxiliary Input 4 positive
10 GND Ground
11 AUX4- Auxiliary Input 4 negative
12 GND Ground
13 +5V +5V supply
14 GND Ground
Terminal positions for analog outputs are:
Terminal Analog Outputs2 Description1 DAC1 DAC channel 1 positive
2 DAC2 DAC channel 2 positive
3 GND Ground
4 DAC3 DAC channel 3 positive
5 DAC4 DAC channel 4 positive
6 GND Ground
7 DAC5 DAC channel 5 positive
8 DAC6 DAC channel 6 positive
9 READY Analyzer ready
10 GND Ground
11 NC No connection
12 GND Ground
13 NC No connection
14 GND Ground
1Analog Inputs ±5V2Analog Outputs 0-5V
2-10 LI-7500RS Open Path CO2/H2O Analyzer
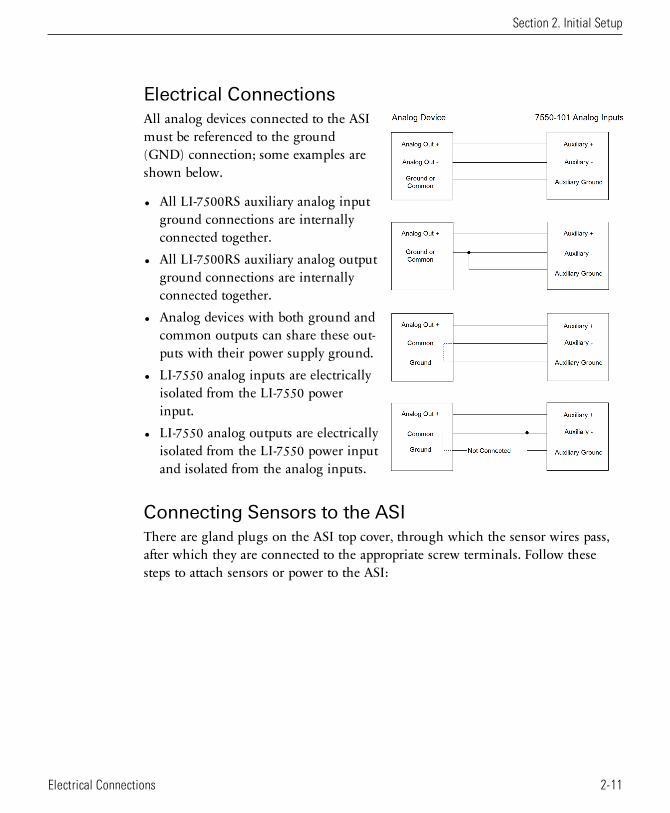
Electrical ConnectionsAll analog devices connected to the ASImust be referenced to the ground(GND) connection; some examples areshown below.
l All LI-7500RS auxiliary analog inputground connections are internallyconnected together.
l All LI-7500RS auxiliary analog outputground connections are internallyconnected together.
l Analog devices with both ground andcommon outputs can share these out-puts with their power supply ground.
l LI-7550 analog inputs are electricallyisolated from the LI-7550 powerinput.
l LI-7550 analog outputs are electricallyisolated from the LI-7550 power inputand isolated from the analog inputs.
Connecting Sensors to the ASIThere are gland plugs on the ASI top cover, through which the sensor wires pass,after which they are connected to the appropriate screw terminals. Follow thesesteps to attach sensors or power to the ASI:
Section 2. Initial Setup
2-11Electrical Connections
Section 2. Initial Setup
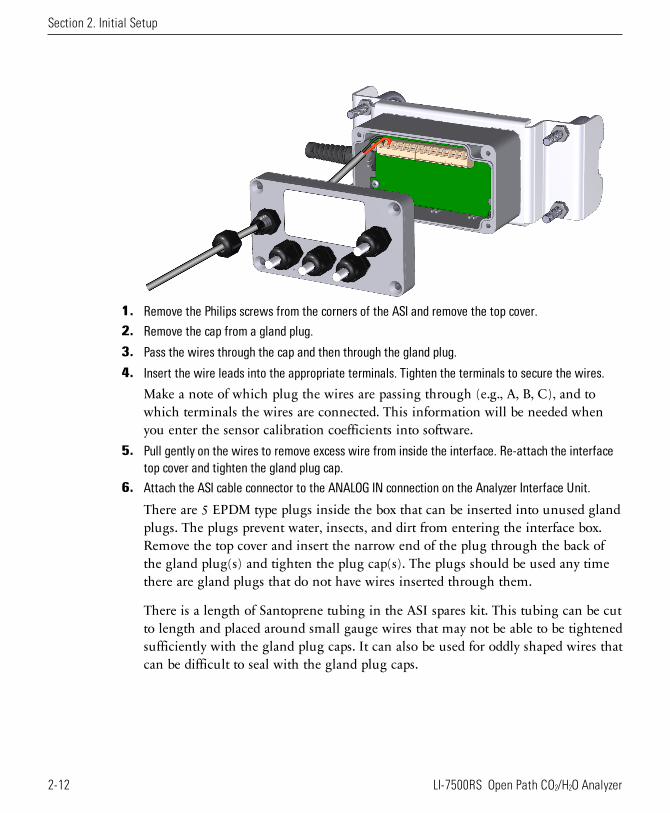
1. Remove the Philips screws from the corners of the ASI and remove the top cover.
2. Remove the cap from a gland plug.
3. Pass the wires through the cap and then through the gland plug.
4. Insert the wire leads into the appropriate terminals. Tighten the terminals to secure the wires.
Make a note of which plug the wires are passing through (e.g., A, B, C), and towhich terminals the wires are connected. This information will be needed whenyou enter the sensor calibration coefficients into software.
5. Pull gently on the wires to remove excess wire from inside the interface. Re-attach the interfacetop cover and tighten the gland plug cap.
6. Attach the ASI cable connector to the ANALOG IN connection on the Analyzer Interface Unit.
There are 5 EPDM type plugs inside the box that can be inserted into unused glandplugs. The plugs prevent water, insects, and dirt from entering the interface box.Remove the top cover and insert the narrow end of the plug through the back ofthe gland plug(s) and tighten the plug cap(s). The plugs should be used any timethere are gland plugs that do not have wires inserted through them.
There is a length of Santoprene tubing in the ASI spares kit. This tubing can be cutto length and placed around small gauge wires that may not be able to be tightenedsufficiently with the gland plug caps. It can also be used for oddly shaped wires thatcan be difficult to seal with the gland plug caps.
2-12 LI-7500RS Open Path CO2/H2O Analyzer
Section 3. OperationThis section describes how to configure your instrument for eddy covariance meas-urements. The LI-7500RS can be configured from any computer that is runningWindows 10, 8/8.1, or 7. You can connect over Ethernet, USB with a USB-to-RS-232adapter, or RS-232 serial.
Installing the PC SoftwareGo to www.licor.com/env/support, select your instrument and then select Software.Download the software and install it on your computer. The program icon will bein the Programs menu under the LI-COR folder.
Connecting with the AnalyzerLaunch the software to open the Connect window. Here you set the parameters forcommunication between the instrument and your computer.
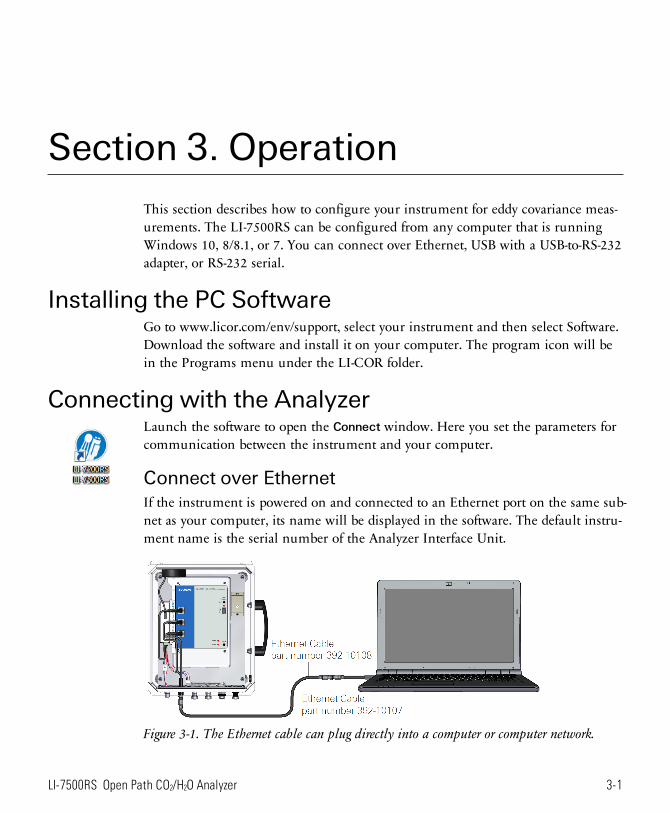
Connect over EthernetIf the instrument is powered on and connected to an Ethernet port on the same sub-net as your computer, its name will be displayed in the software. The default instru-ment name is the serial number of the Analyzer Interface Unit.
Figure 3-1. The Ethernet cable can plug directly into a computer or computer network.
3-1LI-7500RS Open Path CO2/H2O Analyzer
Section 3. Operation
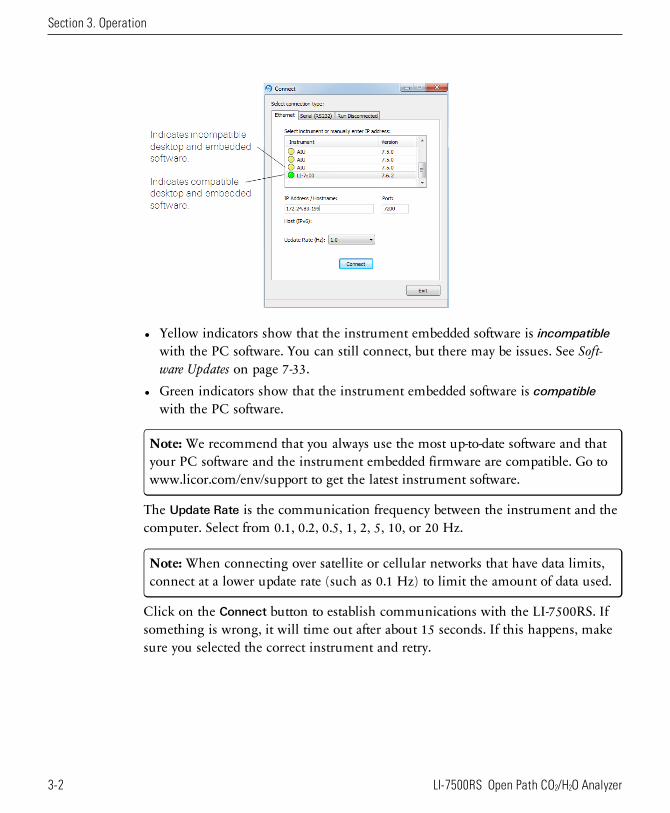
l Yellow indicators show that the instrument embedded software is incompatiblewith the PC software. You can still connect, but there may be issues. See Soft-ware Updates on page 7-33.
l Green indicators show that the instrument embedded software is compatiblewith the PC software.
Note: We recommend that you always use the most up-to-date software and thatyour PC software and the instrument embedded firmware are compatible. Go towww.licor.com/env/support to get the latest instrument software.
The Update Rate is the communication frequency between the instrument and thecomputer. Select from 0.1, 0.2, 0.5, 1, 2, 5, 10, or 20 Hz.
Note: When connecting over satellite or cellular networks that have data limits,connect at a lower update rate (such as 0.1 Hz) to limit the amount of data used.
Click on the Connect button to establish communications with the LI-7500RS. Ifsomething is wrong, it will time out after about 15 seconds. If this happens, makesure you selected the correct instrument and retry.
3-2 LI-7500RS Open Path CO2/H2O Analyzer
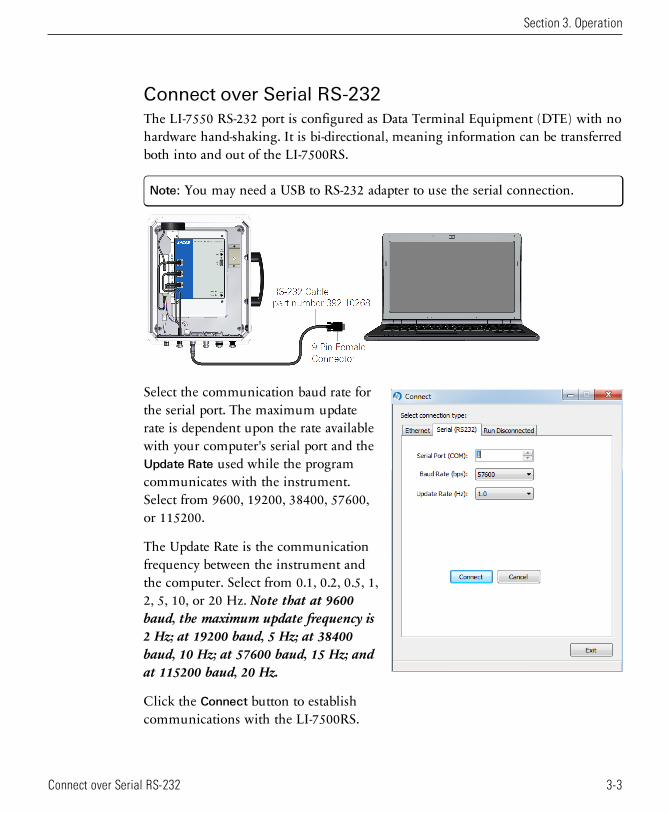
Connect over Serial RS-232The LI-7550 RS-232 port is configured as Data Terminal Equipment (DTE) with nohardware hand-shaking. It is bi-directional, meaning information can be transferredboth into and out of the LI-7500RS.
Note: You may need a USB to RS-232 adapter to use the serial connection.
Select the communication baud rate forthe serial port. The maximum updaterate is dependent upon the rate availablewith your computer's serial port and theUpdate Rate used while the programcommunicates with the instrument.Select from 9600, 19200, 38400, 57600,or 115200.
The Update Rate is the communicationfrequency between the instrument andthe computer. Select from 0.1, 0.2, 0.5, 1,2, 5, 10, or 20 Hz. Note that at 9600baud, the maximum update frequency is2 Hz; at 19200 baud, 5 Hz; at 38400baud, 10 Hz; at 57600 baud, 15 Hz; andat 115200 baud, 20 Hz.
Click the Connect button to establishcommunications with the LI-7500RS.
Section 3. Operation
3-3Connect over Serial RS-232
Section 3. Operation
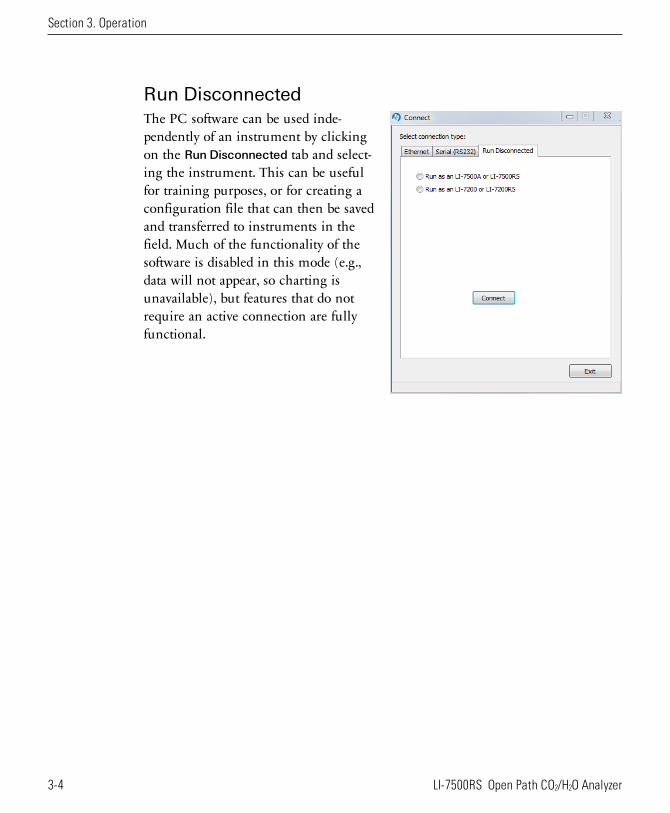
Run DisconnectedThe PC software can be used inde-pendently of an instrument by clickingon the Run Disconnected tab and select-ing the instrument. This can be usefulfor training purposes, or for creating aconfiguration file that can then be savedand transferred to instruments in thefield. Much of the functionality of thesoftware is disabled in this mode (e.g.,data will not appear, so charting isunavailable), but features that do notrequire an active connection are fullyfunctional.
3-4 LI-7500RS Open Path CO2/H2O Analyzer
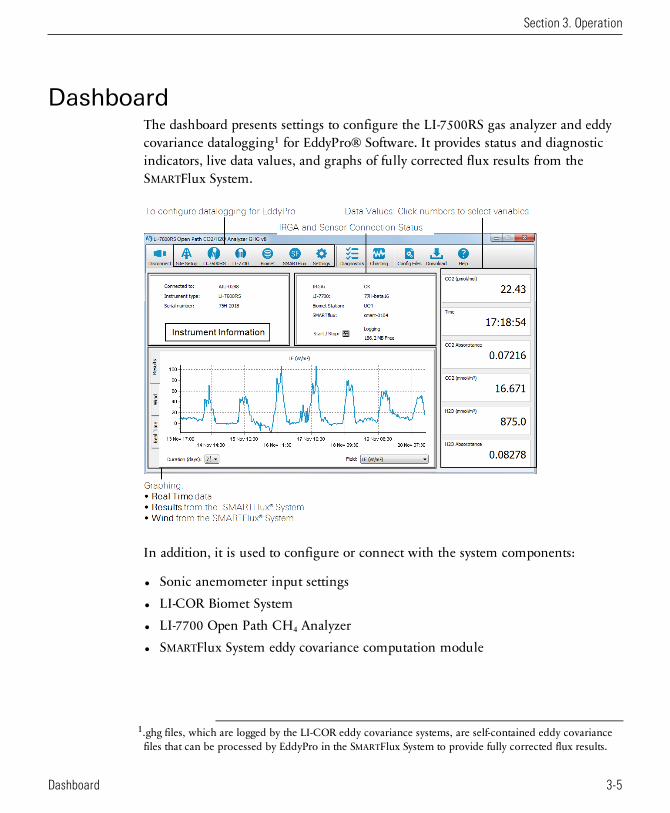
DashboardThe dashboard presents settings to configure the LI-7500RS gas analyzer and eddycovariance datalogging1 for EddyPro® Software. It provides status and diagnosticindicators, live data values, and graphs of fully corrected flux results from theSMARTFlux System.
In addition, it is used to configure or connect with the system components:
l Sonic anemometer input settingsl LI-COR Biomet Systeml LI-7700 Open Path CH4 Analyzerl SMARTFlux System eddy covariance computation module
1.ghg files, which are logged by the LI-COR eddy covariance systems, are self-contained eddy covariancefiles that can be processed by EddyPro in the SMARTFlux System to provide fully corrected flux results.
Section 3. Operation
3-5Dashboard
Section 3. Operation
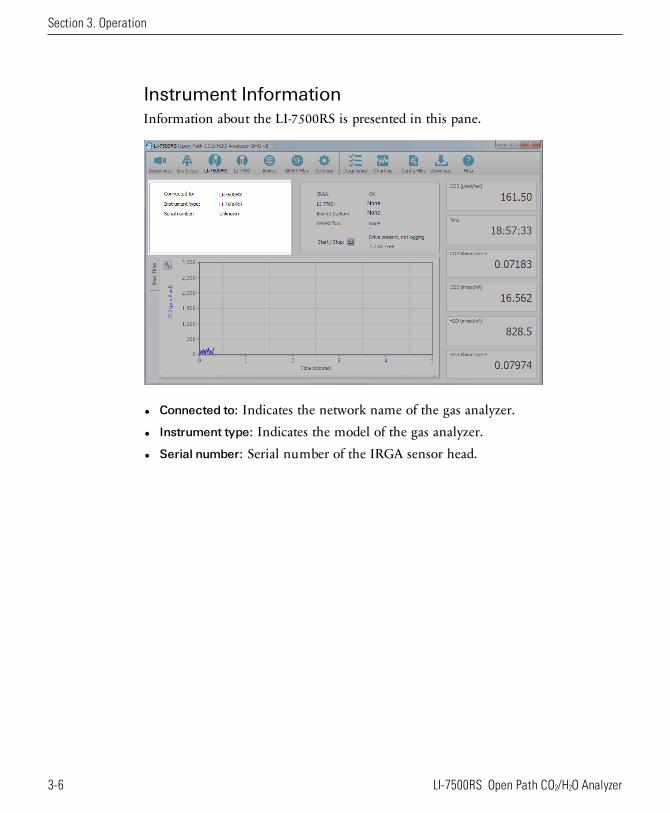
Instrument InformationInformation about the LI-7500RS is presented in this pane.
l Connected to: Indicates the network name of the gas analyzer.l Instrument type: Indicates the model of the gas analyzer.l Serial number: Serial number of the IRGA sensor head.
3-6 LI-7500RS Open Path CO2/H2O Analyzer
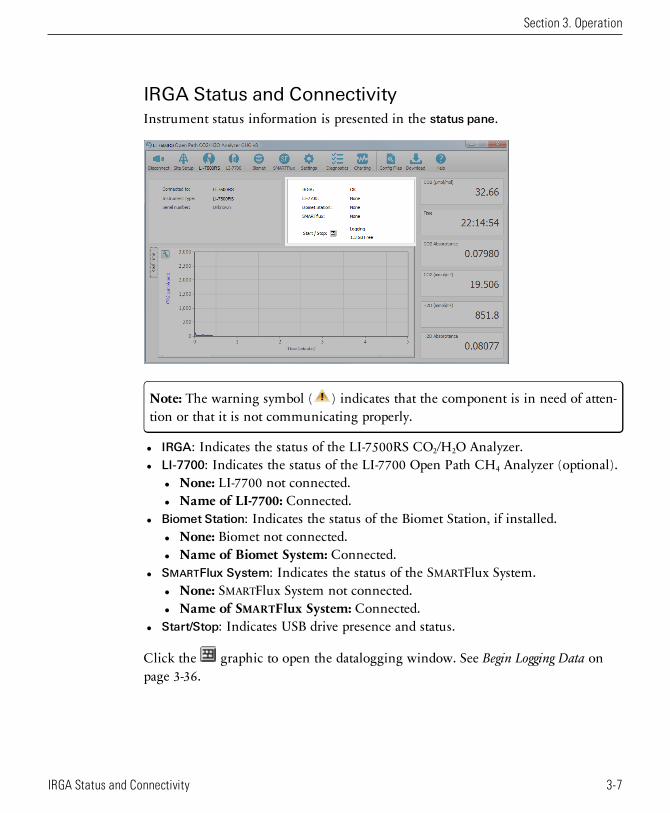
IRGA Status and ConnectivityInstrument status information is presented in the status pane.
Note: The warning symbol ( ) indicates that the component is in need of atten-tion or that it is not communicating properly.
l IRGA: Indicates the status of the LI-7500RS CO2/H2O Analyzer.l LI-7700: Indicates the status of the LI-7700 Open Path CH4 Analyzer (optional).
l None: LI-7700 not connected.l Name of LI-7700: Connected.
l Biomet Station: Indicates the status of the Biomet Station, if installed.l None: Biomet not connected.l Name of Biomet System: Connected.
l SMARTFlux System: Indicates the status of the SMARTFlux System.l None: SMARTFlux System not connected.l Name of SMARTFlux System: Connected.
l Start/Stop: Indicates USB drive presence and status.
Click the graphic to open the datalogging window. See Begin Logging Data onpage 3-36.
Section 3. Operation
3-7IRGA Status and Connectivity

Section 3. Operation
Eddy Covariance Flux GraphsThe graphing pane provides real-time graphing of measured variables, as well aseddy covariance flux results from the SMARTFlux System and a wind speed graph.
l Real Time: Current data measured by the instrument. Click the button toopen the charting dialog (see Charting on page 7-30).
Note: It may take several minutes after you select a tab for data to load into thegraph.
l Results: If the SMARTFlux System is properly configured, this tab presents fullycorrected flux results for the variables that are measured at your site. Durationindicates the days of data that are displayed (maximum of 7 days). Field indicatesthe flux variable that is displayed. The variables available are:l H (W/m2),l LE (W/m2),l ET (mm/h),l CO2 Flux (µmol/m2/s),l CH4 Flux (µmol/m2/s; LI-7700 required),l u* (m/s),l CO2 (µmol/mol),
3-8 LI-7500RS Open Path CO2/H2O Analyzer
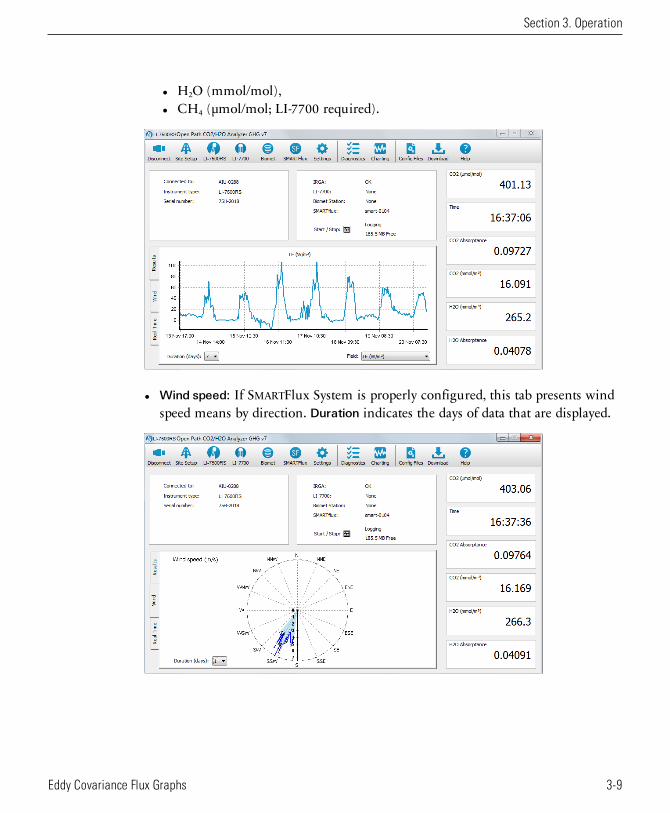
l H2O (mmol/mol),l CH4 (µmol/mol; LI-7700 required).
l Wind speed: If SMARTFlux System is properly configured, this tab presents windspeed means by direction. Duration indicates the days of data that are displayed.
Section 3. Operation
3-9Eddy Covariance Flux Graphs
Section 3. Operation
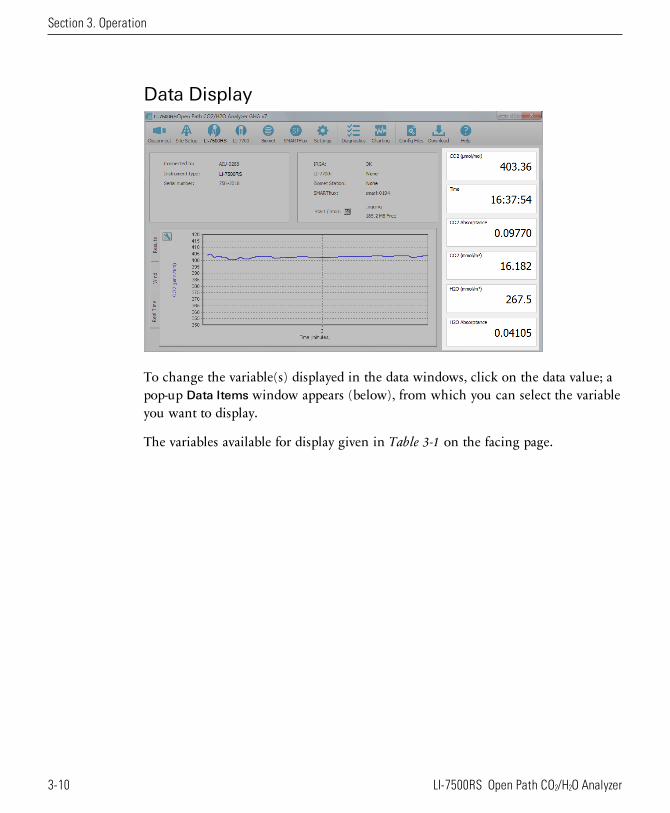
Data Display
To change the variable(s) displayed in the data windows, click on the data value; apop-up Data Items window appears (below), from which you can select the variableyou want to display.
The variables available for display given in Table 3-1 on the facing page.
3-10 LI-7500RS Open Path CO2/H2O Analyzer
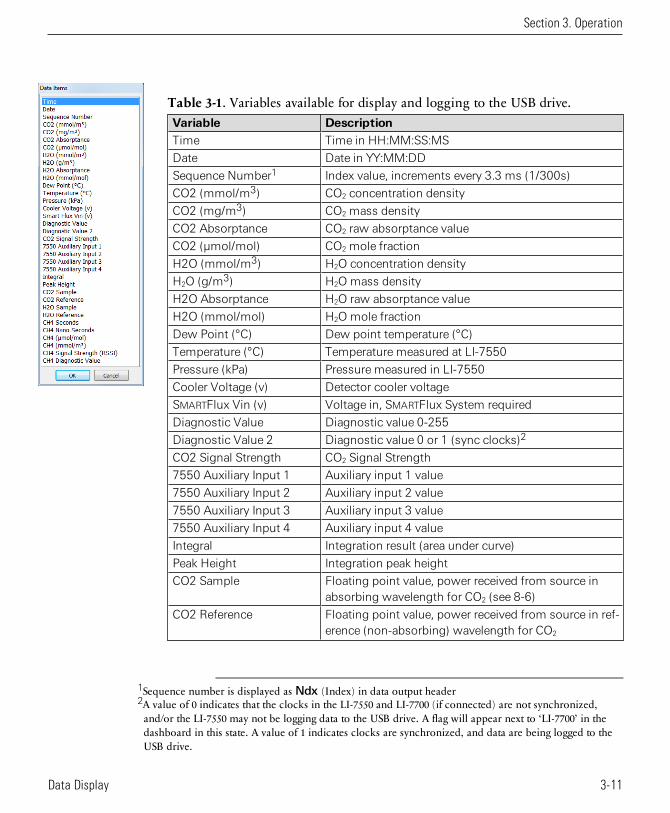
Variable DescriptionTime Time in HH:MM:SS:MS
Date Date in YY:MM:DD
Sequence Number1 Index value, increments every 3.3 ms (1/300s)
CO2 (mmol/m3) CO2 concentration density
CO2 (mg/m3) CO2 mass density
CO2 Absorptance CO2 raw absorptance value
CO2 (µmol/mol) CO2 mole fraction
H2O (mmol/m3) H2O concentration density
H2O (g/m3) H2O mass density
H2O Absorptance H2O raw absorptance value
H2O (mmol/mol) H2O mole fraction
Dew Point (°C) Dew point temperature (°C)
Temperature (°C) Temperature measured at LI-7550
Pressure (kPa) Pressure measured in LI-7550
Cooler Voltage (v) Detector cooler voltage
SMARTFlux Vin (v) Voltage in, SMARTFlux System required
Diagnostic Value Diagnostic value 0-255
Diagnostic Value 2 Diagnostic value 0 or 1 (sync clocks)2
CO2 Signal Strength CO2 Signal Strength
7550 Auxiliary Input 1 Auxiliary input 1 value
7550 Auxiliary Input 2 Auxiliary input 2 value
7550 Auxiliary Input 3 Auxiliary input 3 value
7550 Auxiliary Input 4 Auxiliary input 4 value
Integral Integration result (area under curve)
Peak Height Integration peak height
CO2 Sample Floating point value, power received from source inabsorbing wavelength for CO2 (see 8-6)
CO2 Reference Floating point value, power received from source in ref-erence (non-absorbing) wavelength for CO2
Table 3-1. Variables available for display and logging to the USB drive.
1Sequence number is displayed as Ndx (Index) in data output header2A value of 0 indicates that the clocks in the LI-7550 and LI-7700 (if connected) are not synchronized,
and/or the LI-7550 may not be logging data to the USB drive. A flag will appear next to ‘LI-7700’ in thedashboard in this state. A value of 1 indicates clocks are synchronized, and data are being logged to theUSB drive.
Section 3. Operation
3-11Data Display
Section 3. Operation
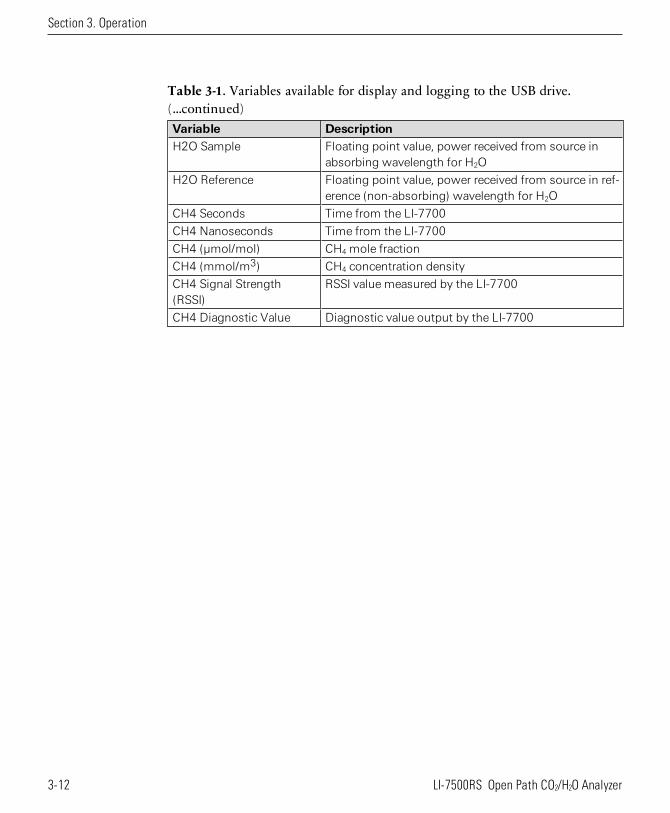
Variable DescriptionH2O Sample Floating point value, power received from source in
absorbing wavelength for H2O
H2O Reference Floating point value, power received from source in ref-erence (non-absorbing) wavelength for H2O
CH4 Seconds Time from the LI-7700
CH4 Nanoseconds Time from the LI-7700
CH4 (µmol/mol) CH4 mole fraction
CH4 (mmol/m3) CH4 concentration density
CH4 Signal Strength(RSSI)
RSSI value measured by the LI-7700
CH4 Diagnostic Value Diagnostic value output by the LI-7700
Table 3-1. Variables available for display and logging to the USB drive.(...continued)
3-12 LI-7500RS Open Path CO2/H2O Analyzer
Configuring Eddy Covariance MeasurementsThe Site Setup window is where you configure most of the eddy covariance systemsettings. The information entered here will comprise the metadata file, whichdescribes the system setup. A more complete description of the metadata file can befound in the online help information provided with EddyPro® Software(http://licor.com/env/help/eddypro/index.html). The addition of the metadata fileinside the .ghg file, while adding a negligible amount of bytes (it contributes about0.1% to the file size), allows you to:
l Avoid duplicate retrieving and re-typing of information needed for processing thefile from any external data source;
l Easily store raw data for future reprocessing;l Account for dynamic site parameters that change over the course of the data col-
lection period (e.g., the canopy height of a crop);l To a large extent, simultaneously process files acquired with different set-ups.
IMPORTANT: The SMARTFlux System will not compute flux results if metadataare not entered properly.
Ideally, you are not required to consider the metadata file explicitly, as it is createdand modified by the gas analyzer data logging software and used unobtrusively byEddyPro®. Nevertheless, all information is stored as plain text and can be retrievedand edited at any time.
Section 3. Operation
3-13Configuring Eddy Covariance Measurements
Section 3. Operation
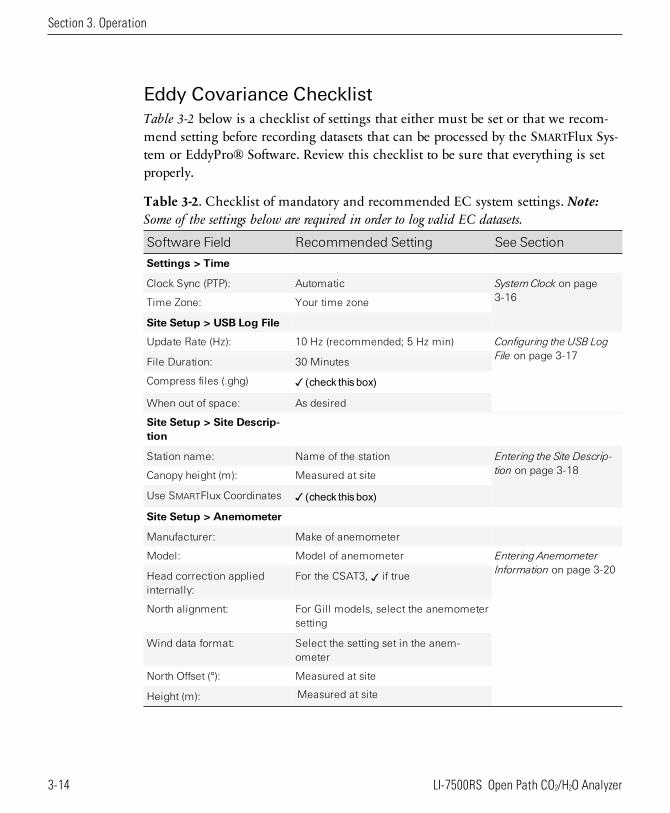
Eddy Covariance ChecklistTable 3-2 below is a checklist of settings that either must be set or that we recom-mend setting before recording datasets that can be processed by the SMARTFlux Sys-tem or EddyPro® Software. Review this checklist to be sure that everything is setproperly.
Software Field Recommended Setting See Section
Settings > Time
Clock Sync (PTP): Automatic SystemClock on page3-16Time Zone: Your time zone
Site Setup > USB Log File
Update Rate (Hz): 10 Hz (recommended; 5 Hz min) Configuring the USB LogFile on page 3-17
File Duration: 30 Minutes
Compress files (.ghg) (check this box)
When out of space: As desired
Site Setup > Site Descrip-tion
Station name: Name of the station Entering the Site Descrip-tion on page 3-18Canopy height (m): Measured at site
Use SMARTFlux Coordinates (check this box)
Site Setup > Anemometer
Manufacturer: Make of anemometer
Model: Model of anemometer Entering AnemometerInformation on page 3-20
Head correction appliedinternally:
For the CSAT3, if true
North alignment: For Gill models, select the anemometersetting
Wind data format: Select the setting set in the anem-ometer
North Offset (°): Measured at site
Height (m): Measured at site
Table 3-2. Checklist of mandatory and recommended EC system settings. Note:Some of the settings below are required in order to log valid EC datasets.
3-14 LI-7500RS Open Path CO2/H2O Analyzer

Software Field Recommended Setting See Section
Anemometer > Input Set-tings
Aux1 Type: U; Units: m/s Configuring the Anem-ometer Inputs on page3-23
Aux2 Type: V; Units: m/s
Aux3 Type: W; Units: m/s
Aux4 Type: Ts; Units: °C
Site Setup > CO2/H2O Ana-lyzer
Northward separation (cm): Measured at site Entering CO2/H2OAna-lyzer Information on page3-27
Eastward separation (cm): Measured at site
Vertical separation (cm): Measured at site
CO2/H2O Log Values Select All or Default
Site Setup > CH4 Analyzer (if using an LI-7700)
Connect to LI-7700 Select if using LI-7700 Entering LI-7700 Inform-ation on page 3-30Northward separation (cm): Measured at site
Eastward separation (cm): Measured at site
Vertical separation (cm): Measured at site
CH4 Log Values Select All or Default
Site Setup > Biomet (if using a Biomet system)
Connect to Biomet Select if using Biomet system Entering Biomet SystemInformation on page 3-33Sync clock to 7550 (check this box)
SMARTFlux
Connect to SMARTFlux Sys-tem
Click the SMARTFlux button and selectthe unit
Connectingwith theSmartFlux System on page3-35
Table 3-2. Checklist of mandatory and recommended EC system settings. Note:Some of the settings below are required in order to log valid EC datasets.(...continued)
Section 3. Operation
3-15Eddy Covariance Checklist
Section 3. Operation
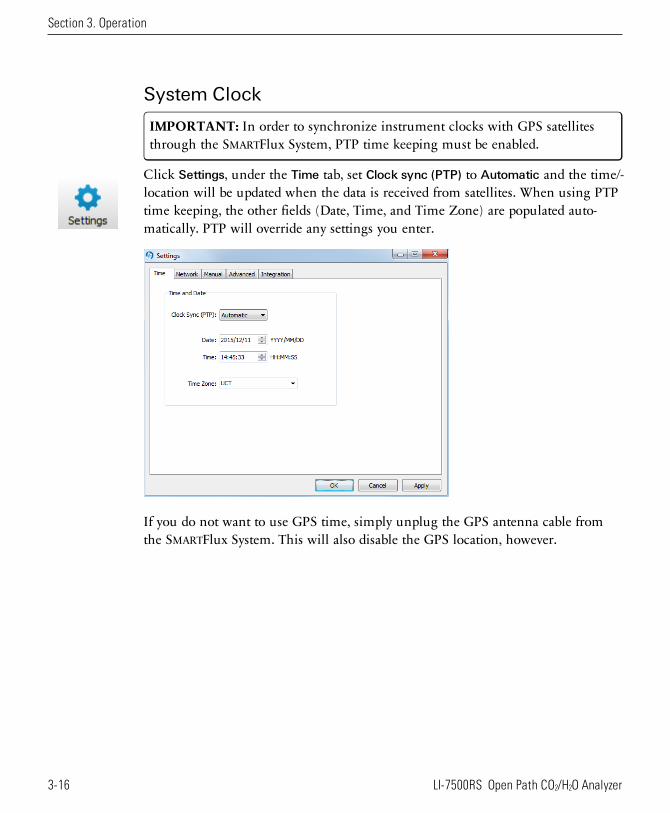
System Clock
IMPORTANT: In order to synchronize instrument clocks with GPS satellitesthrough the SMARTFlux System, PTP time keeping must be enabled.
Click Settings, under the Time tab, set Clock sync (PTP) to Automatic and the time/-location will be updated when the data is received from satellites. When using PTPtime keeping, the other fields (Date, Time, and Time Zone) are populated auto-matically. PTP will override any settings you enter.
If you do not want to use GPS time, simply unplug the GPS antenna cable fromthe SMARTFlux System. This will also disable the GPS location, however.
3-16 LI-7500RS Open Path CO2/H2O Analyzer
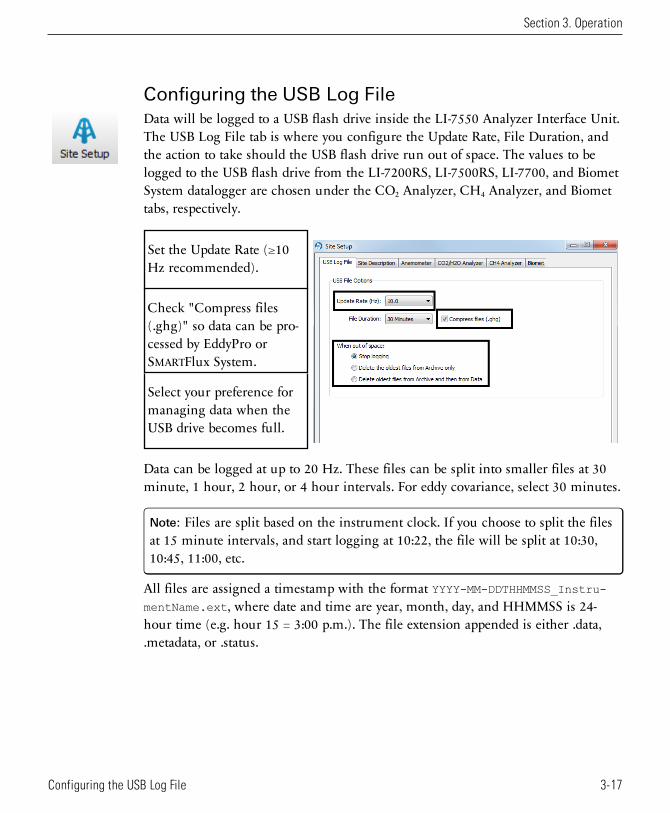
Configuring the USB Log FileData will be logged to a USB flash drive inside the LI-7550 Analyzer Interface Unit.The USB Log File tab is where you configure the Update Rate, File Duration, andthe action to take should the USB flash drive run out of space. The values to belogged to the USB flash drive from the LI-7200RS, LI-7500RS, LI-7700, and BiometSystem datalogger are chosen under the CO2 Analyzer, CH4 Analyzer, and Biomettabs, respectively.
Set the Update Rate (≥10Hz recommended).
Check "Compress files(.ghg)" so data can be pro-cessed by EddyPro orSMARTFlux System.
Select your preference formanaging data when theUSB drive becomes full.
Data can be logged at up to 20 Hz. These files can be split into smaller files at 30minute, 1 hour, 2 hour, or 4 hour intervals. For eddy covariance, select 30 minutes.
Note: Files are split based on the instrument clock. If you choose to split the filesat 15 minute intervals, and start logging at 10:22, the file will be split at 10:30,10:45, 11:00, etc.
All files are assigned a timestamp with the format YYYY-MM-DDTHHMMSS_Instru-mentName.ext, where date and time are year, month, day, and HHMMSS is 24-hour time (e.g. hour 15 = 3:00 p.m.). The file extension appended is either .data,.metadata, or .status.
Section 3. Operation
3-17Configuring the USB Log File
Section 3. Operation
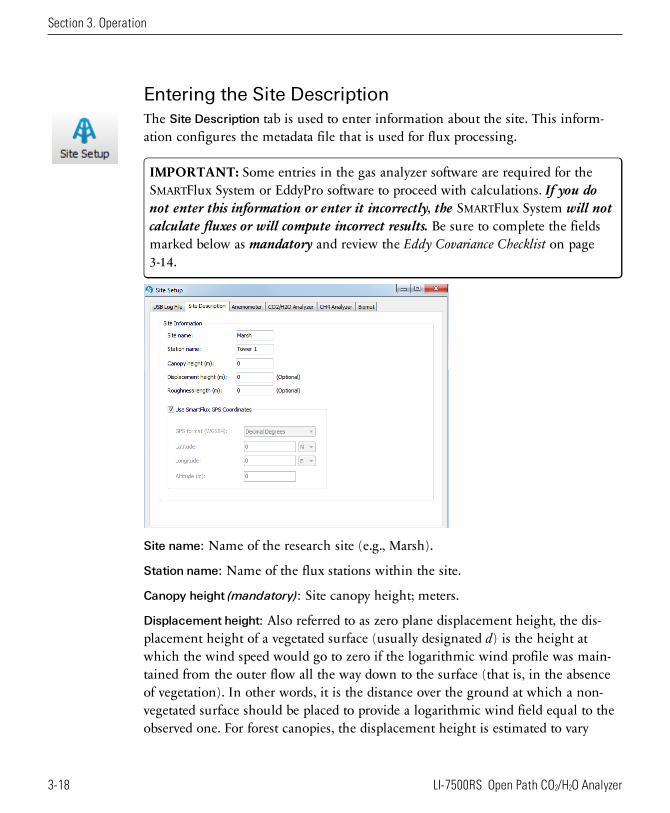
Entering the Site DescriptionThe Site Description tab is used to enter information about the site. This inform-ation configures the metadata file that is used for flux processing.
IMPORTANT: Some entries in the gas analyzer software are required for theSMARTFlux System or EddyPro software to proceed with calculations. If you donot enter this information or enter it incorrectly, the SMARTFlux System will notcalculate fluxes or will compute incorrect results. Be sure to complete the fieldsmarked below as mandatory and review the Eddy Covariance Checklist on page3-14.
Site name: Name of the research site (e.g., Marsh).
Station name: Name of the flux stations within the site.
Canopy height (mandatory): Site canopy height; meters.
Displacement height: Also referred to as zero plane displacement height, the dis-placement height of a vegetated surface (usually designated d) is the height atwhich the wind speed would go to zero if the logarithmic wind profile was main-tained from the outer flow all the way down to the surface (that is, in the absenceof vegetation). In other words, it is the distance over the ground at which a non-vegetated surface should be placed to provide a logarithmic wind field equal to theobserved one. For forest canopies, the displacement height is estimated to vary
3-18 LI-7500RS Open Path CO2/H2O Analyzer
between 0.6 and 0.8 times the height of the canopy. If not entered explicitly,EddyPro computes displacement height as:
3-1d = 0.67 x canopy height
Roughness length: In the logarithmic wind profile, the roughness length is theheight at which wind speed is zero (indicated by z0). It provides an estimate of theaverage roughness elements of the surface. With vegetated surfaces, because thevegetation itself provides a certain roughness, the logarithmic wind profile goes tozero at a height equal to the displacement height plus the roughness length. If notentered explicitly, EddyPro computes roughness length as:
3-2z0 = 0.15 x canopy height
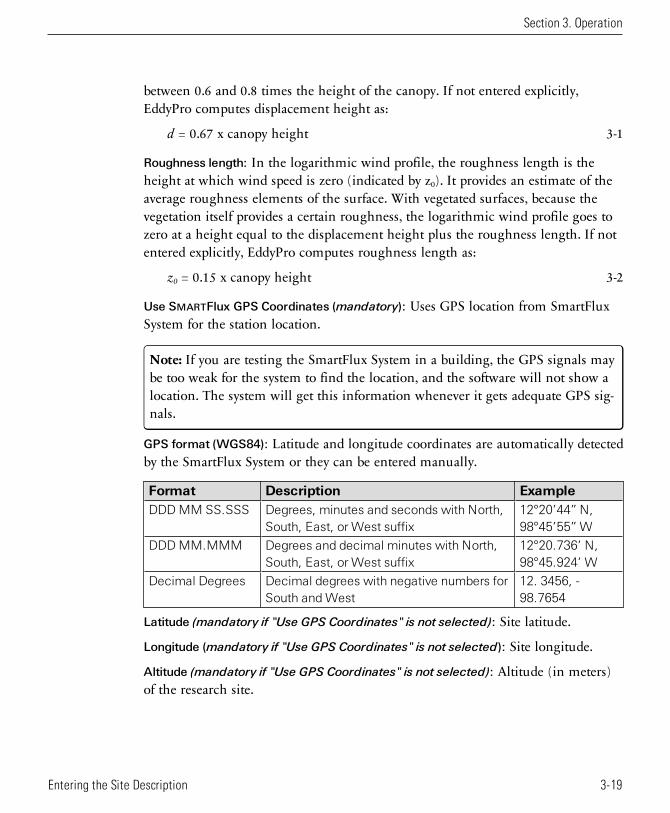
Use SMARTFlux GPS Coordinates (mandatory): Uses GPS location from SmartFluxSystem for the station location.
Note: If you are testing the SmartFlux System in a building, the GPS signals maybe too weak for the system to find the location, and the software will not show alocation. The system will get this information whenever it gets adequate GPS sig-nals.
GPS format (WGS84): Latitude and longitude coordinates are automatically detectedby the SmartFlux System or they can be entered manually.
Format Description ExampleDDD MM SS.SSS Degrees, minutes and seconds with North,
South, East, or West suffix12°20’44” N,98°45’55” W
DDD MM.MMM Degrees and decimal minutes with North,South, East, or West suffix
12°20.736’ N,98°45.924’ W
Decimal Degrees Decimal degrees with negative numbers forSouth and West
12. 3456, -98.7654
Latitude (mandatory if "Use GPS Coordinates" is not selected): Site latitude.
Longitude (mandatory if "Use GPS Coordinates" is not selected): Site longitude.
Altitude (mandatory if "Use GPS Coordinates" is not selected): Altitude (in meters)of the research site.
Section 3. Operation
3-19Entering the Site Description
Section 3. Operation
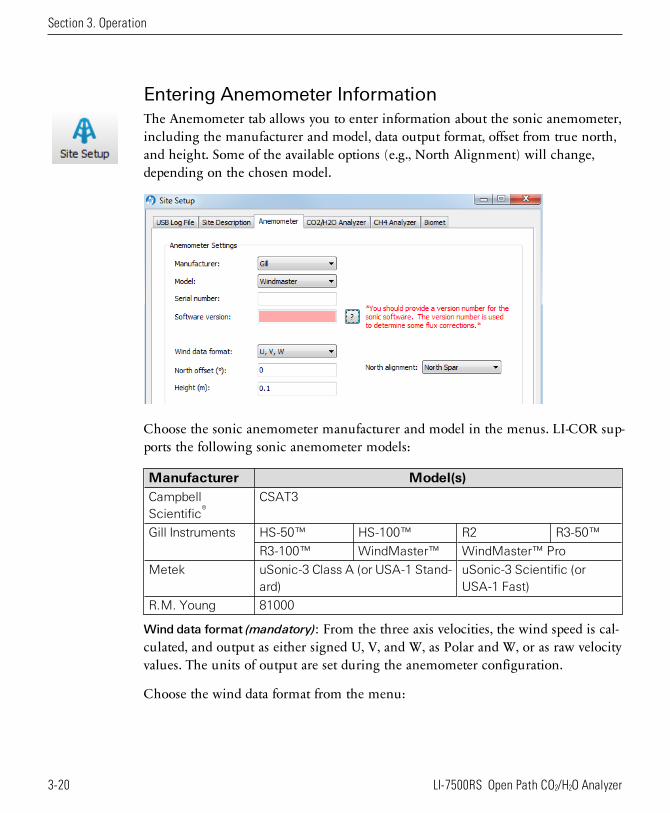
Entering Anemometer InformationThe Anemometer tab allows you to enter information about the sonic anemometer,including the manufacturer and model, data output format, offset from true north,and height. Some of the available options (e.g., North Alignment) will change,depending on the chosen model.
Choose the sonic anemometer manufacturer and model in the menus. LI-COR sup-ports the following sonic anemometer models:
Manufacturer Model(s)CampbellScientific®
CSAT3
Gill Instruments HS-50™ HS-100™ R2 R3-50™
R3-100™ WindMaster™ WindMaster™ Pro
Metek uSonic-3 Class A (or USA-1 Stand-ard)
uSonic-3 Scientific (orUSA-1 Fast)
R.M. Young 81000
Wind data format (mandatory): From the three axis velocities, the wind speed is cal-culated, and output as either signed U, V, and W, as Polar and W, or as raw velocityvalues. The units of output are set during the anemometer configuration.
Choose the wind data format from the menu:
3-20 LI-7500RS Open Path CO2/H2O Analyzer
l U, V, W (some Gill anemometers): U is defined as toward the direction in linewith the north spar, as shown in the diagram below. V is defined as toward thedirection of 90° counter-clockwise from the N/Reference spar. W is defined asvertically up the mounting shaft.
l Polar, W - The wind speed in the UV plane, with direction in degrees from 0 to359°, with respect to the Reference spar (normally aligned to North).
l Axis velocities - Raw velocity values for U, V, W.
North offset (°): Offset, in degrees (0-359°) from which the Reference spar/axis or ori-entation of the anemometer varies from geographic/magnetic north.
Important note on North Offset:
EddyPro requires the offset with respect to geographic north as two pieces ofinformation: The offset with respect to geographic north and the magnetic declin-ation. Currently the software does not provide an entry for magnetic declination.For the best results, enter the North Offset to magnetic North. This will createsmall differences in the wind direction between EddyPro and the SMARTFlux res-ults (a constant offset equal to the magnetic declination), but the flux results willbe the same, if all other settings are the same.
Height (m) (mandatory): Sonic anemometer height above the ground, in meters,measured to center of the anemometer sample volume.
Input Settings (mandatory): The button opens the AuxiliaryInputs window, where you configure the measurement type, units, label, and scal-ing coefficients. See Configuring the Anemometer Inputs on page 3-23.
About Sonic Anemometer InputsLI-COR offers a variety of sonic anemometers manufactured by Gill InstrumentsLtd. (Hampshire, England). You can use an anemometer from another man-ufacturer as well, provided it has a linear voltage output and a maximum voltageoutput of ±5V.
When purchased from LI-COR, the Gill Instruments sonic anemometers are con-figured for eddy covariance measurements, however, you will be well served toreview and change the anemometer settings for your site and setup.
Section 3. Operation
3-21Entering Anemometer Information
Section 3. Operation
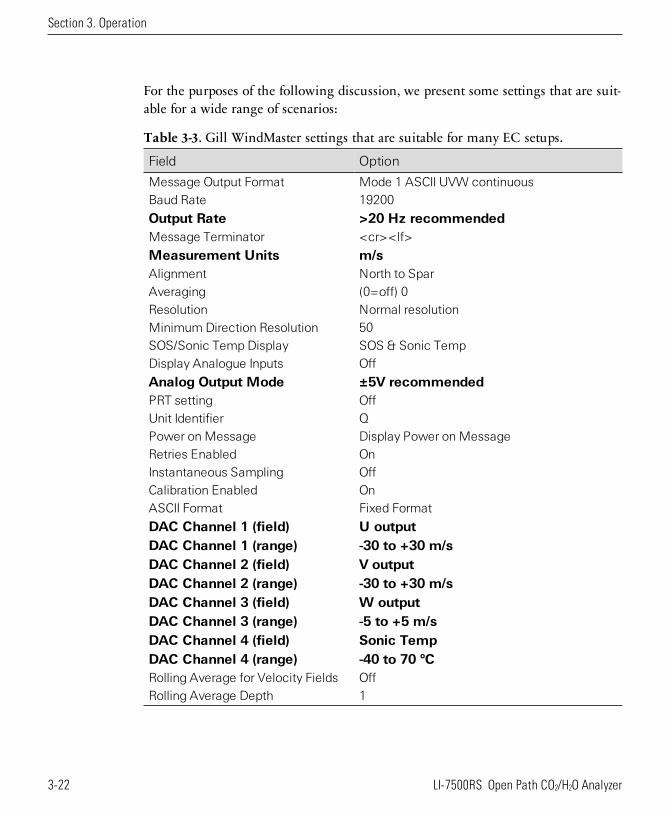
For the purposes of the following discussion, we present some settings that are suit-able for a wide range of scenarios:
Field Option
Message Output Format Mode 1 ASCII UVW continuousBaud Rate 19200
Output Rate >20 Hz recommendedMessage Terminator <cr><lf>
Measurement Units m/sAlignment North to SparAveraging (0=off) 0Resolution Normal resolutionMinimum Direction Resolution 50SOS/Sonic Temp Display SOS & Sonic TempDisplay Analogue Inputs Off
Analog Output Mode ±5V recommendedPRT setting OffUnit Identifier QPower on Message Display Power on MessageRetries Enabled OnInstantaneous Sampling OffCalibration Enabled OnASCII Format Fixed Format
DAC Channel 1 (field) U outputDAC Channel 1 (range) -30 to +30 m/sDAC Channel 2 (field) V outputDAC Channel 2 (range) -30 to +30 m/sDAC Channel 3 (field) W outputDAC Channel 3 (range) -5 to +5 m/sDAC Channel 4 (field) Sonic TempDAC Channel 4 (range) -40 to 70 °CRolling Average for Velocity Fields OffRolling Average Depth 1
Table 3-3. Gill WindMaster settings that are suitable for many EC setups.
3-22 LI-7500RS Open Path CO2/H2O Analyzer
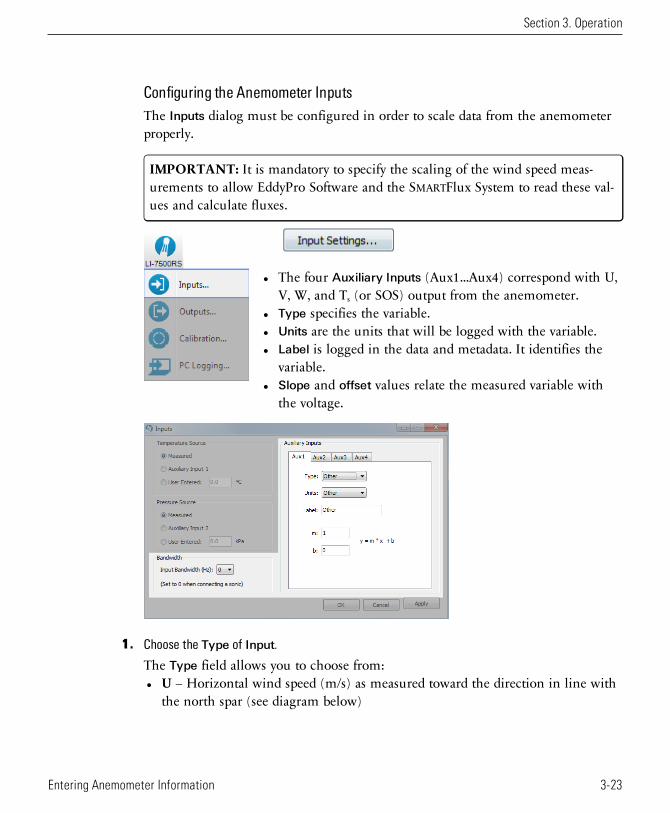
Configuring the Anemometer InputsThe Inputs dialog must be configured in order to scale data from the anemometerproperly.
IMPORTANT: It is mandatory to specify the scaling of the wind speed meas-urements to allow EddyPro Software and the SMARTFlux System to read these val-ues and calculate fluxes.
l The four Auxiliary Inputs (Aux1...Aux4) correspond with U,V, W, and Ts (or SOS) output from the anemometer.
l Type specifies the variable.l Units are the units that will be logged with the variable.l Label is logged in the data and metadata. It identifies the
variable.l Slope and offset values relate the measured variable with
the voltage.
1. Choose the Type of Input.
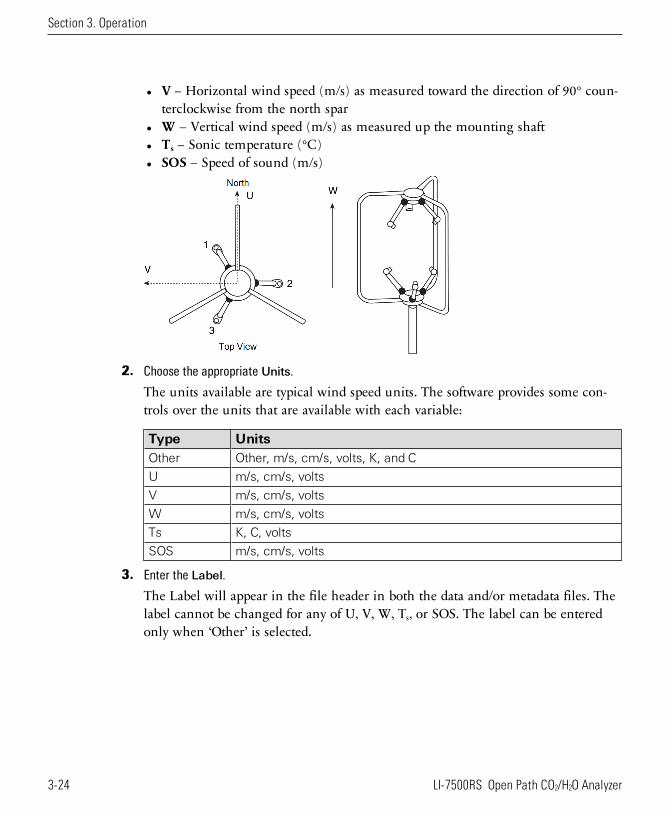
The Type field allows you to choose from:l U – Horizontal wind speed (m/s) as measured toward the direction in line with
the north spar (see diagram below)
Section 3. Operation
3-23Entering Anemometer Information
Section 3. Operation
l V – Horizontal wind speed (m/s) as measured toward the direction of 90° coun-terclockwise from the north spar
l W – Vertical wind speed (m/s) as measured up the mounting shaftl Ts – Sonic temperature (°C)l SOS – Speed of sound (m/s)
2. Choose the appropriate Units.
The units available are typical wind speed units. The software provides some con-trols over the units that are available with each variable:
Type UnitsOther Other, m/s, cm/s, volts, K, and C
U m/s, cm/s, volts
V m/s, cm/s, volts
W m/s, cm/s, volts
Ts K, C, volts
SOS m/s, cm/s, volts
3. Enter the Label.
The Label will appear in the file header in both the data and/or metadata files. Thelabel cannot be changed for any of U, V, W, Ts, or SOS. The label can be enteredonly when ‘Other’ is selected.
3-24 LI-7500RS Open Path CO2/H2O Analyzer
Slope Offset ExamplesThe units selected for each auxiliary input determine the units label recorded in thedata file header, as well as the file header in the metadata file used with EddyPro®
Software. As such, it is important convert the anemometer output from voltage todata using the multiplier and offset.
For example, if you have configured your sonic anemometer to output U, V, and Wvalues in volts, but want the data file and metadata file to record these values inm/s, you will need to set the multiplier and offset values to rescale the data.
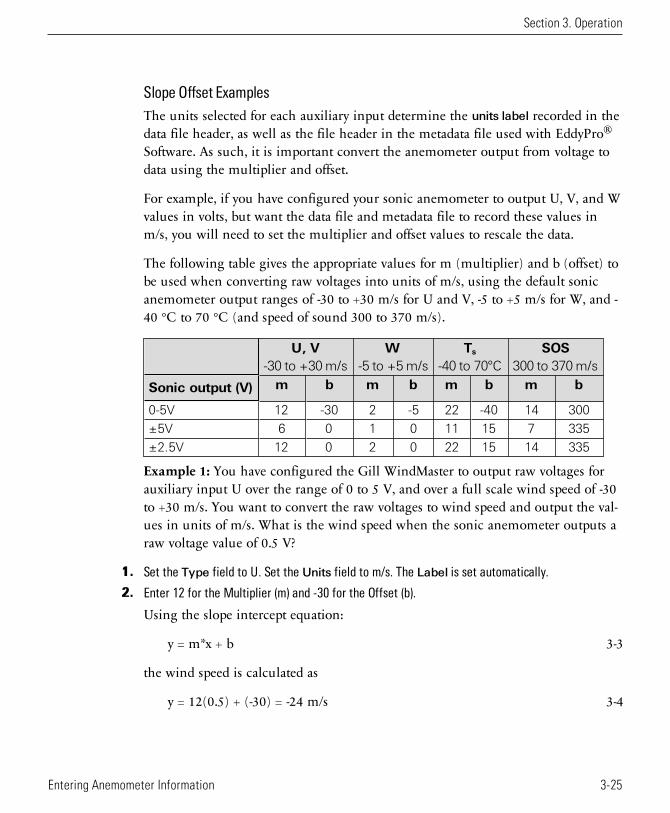
The following table gives the appropriate values for m (multiplier) and b (offset) tobe used when converting raw voltages into units of m/s, using the default sonicanemometer output ranges of -30 to +30 m/s for U and V, -5 to +5 m/s for W, and -40 °C to 70 °C (and speed of sound 300 to 370 m/s).
U, V-30 to +30 m/s
W-5 to +5 m/s
Ts-40 to 70°C
SOS300 to 370 m/s
Sonic output (V) m b m b m b m b
0-5V 12 -30 2 -5 22 -40 14 300
±5V 6 0 1 0 11 15 7 335
±2.5V 12 0 2 0 22 15 14 335
Example 1: You have configured the Gill WindMaster to output raw voltages forauxiliary input U over the range of 0 to 5 V, and over a full scale wind speed of -30to +30 m/s. You want to convert the raw voltages to wind speed and output the val-ues in units of m/s. What is the wind speed when the sonic anemometer outputs araw voltage value of 0.5 V?
1. Set the Type field to U. Set the Units field to m/s. The Label is set automatically.
2. Enter 12 for the Multiplier (m) and -30 for the Offset (b).
Using the slope intercept equation:
3-3y = m*x + b
the wind speed is calculated as
3-4y = 12(0.5) + (-30) = -24 m/s
Section 3. Operation
3-25Entering Anemometer Information
Section 3. Operation
Example 2: You have configured the Gill WindMaster to output raw voltages forauxiliary input U over the range of ±5V, and over a full scale wind speed of -30 to+30 m/s. You want to convert the raw voltages to wind speed and output the valuesin units of m/s. What is the wind speed when the sonic anemometer outputs a rawvoltage value of 1.5V?
1. Set the Type field to U. Set the Units field to m/s. The Label is set automatically.
2. Enter 6 for the Multiplier (m) and 0 for the Offset (b).
Using equation 3-3 on the previous page, the wind speed is calculated as
3-5y = 6(1.5) + 0 = 9 m/s
3-26 LI-7500RS Open Path CO2/H2O Analyzer

Entering CO2/H2O Analyzer InformationThe CO2/H2O Analyzer tabshows the type of CO2/H2Oanalyzer used (LI-7500RS orLI-7200RS), the values tolog to the USB drive, andthe gas analyzer position rel-ative to the sonic anem-ometer.
The distance between thegas analyzer and sonicanemometer is used toestimate the high-frequencyflux losses. Distances areprovided in a Cartesiancoordinate system, whichallows EddyPro® to determine the distance from a gas analyzer and the anem-ometer.
Important: At least one separation must be different from 0. Values are relativeto the sonic anemometer and measured at the site. Entering wrong values willresult in incorrect flux calculations.
l Measurements must be provided in the indicated units.l The anemometer is the center (0, 0) of the coordinate system.l For all gas analyzers, the distances from the reference anemometer are
provided along the north-south east-west axes.
Section 3. Operation
3-27Entering CO2/H2O Analyzer Information
Section 3. Operation
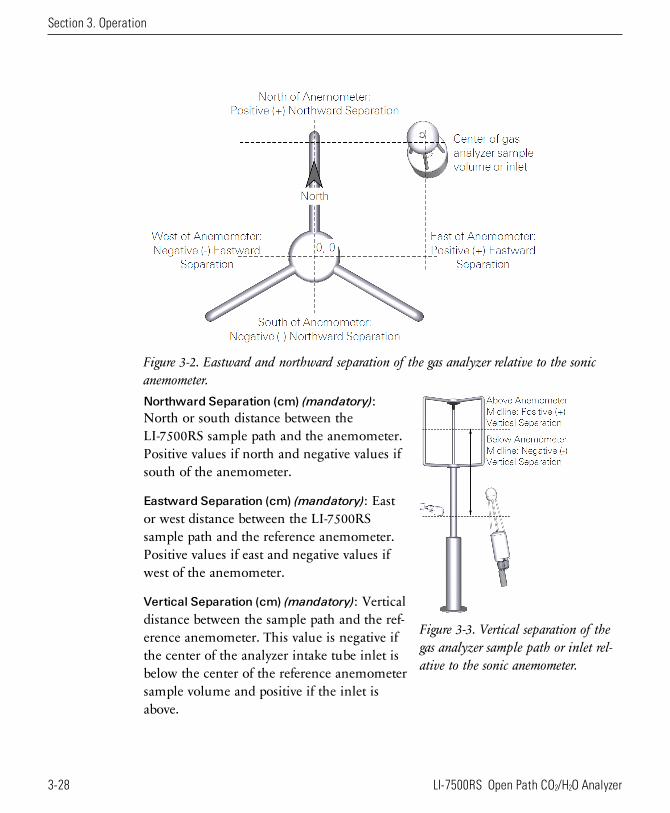
Figure 3-2. Eastward and northward separation of the gas analyzer relative to the sonicanemometer.
Figure 3-3. Vertical separation of thegas analyzer sample path or inlet rel-ative to the sonic anemometer.
Northward Separation (cm) (mandatory):North or south distance between theLI-7500RS sample path and the anemometer.Positive values if north and negative values ifsouth of the anemometer.
Eastward Separation (cm) (mandatory): Eastor west distance between the LI-7500RSsample path and the reference anemometer.Positive values if east and negative values ifwest of the anemometer.
Vertical Separation (cm) (mandatory): Verticaldistance between the sample path and the ref-erence anemometer. This value is negative ifthe center of the analyzer intake tube inlet isbelow the center of the reference anemometersample volume and positive if the inlet isabove.
3-28 LI-7500RS Open Path CO2/H2O Analyzer

CO2/H2O Log Values (mandatory): Click Default to select data records recommendedfor use with SMARTFlux System and EddyPro Software.
Section 3. Operation
3-29Entering CO2/H2O Analyzer Information
Section 3. Operation
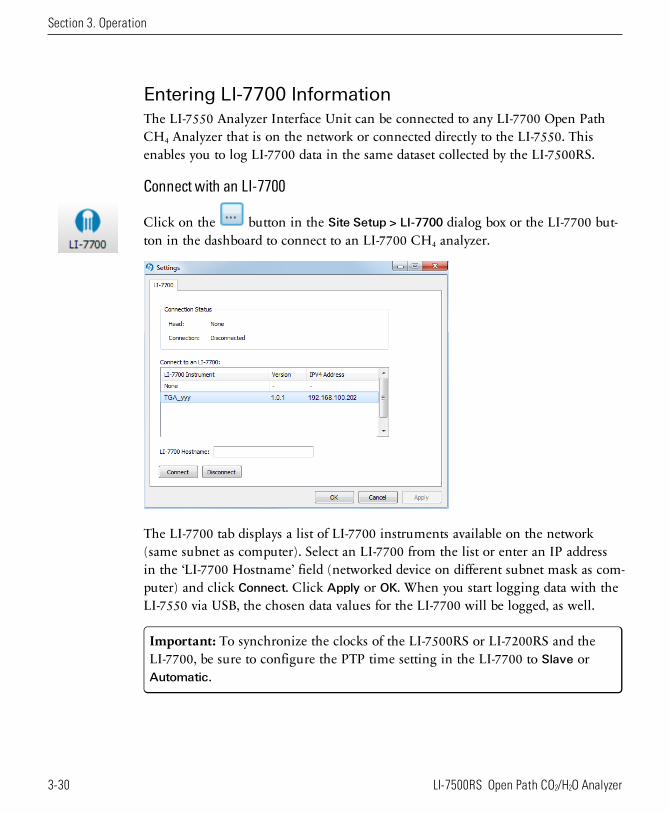
Entering LI-7700 InformationThe LI-7550 Analyzer Interface Unit can be connected to any LI-7700 Open PathCH4 Analyzer that is on the network or connected directly to the LI-7550. Thisenables you to log LI-7700 data in the same dataset collected by the LI-7500RS.
Connect with an LI-7700
Click on the button in the Site Setup > LI-7700 dialog box or the LI-7700 but-ton in the dashboard to connect to an LI-7700 CH4 analyzer.
The LI-7700 tab displays a list of LI-7700 instruments available on the network(same subnet as computer). Select an LI-7700 from the list or enter an IP addressin the ‘LI-7700 Hostname’ field (networked device on different subnet mask as com-puter) and click Connect. Click Apply or OK. When you start logging data with theLI-7550 via USB, the chosen data values for the LI-7700 will be logged, as well.
Important: To synchronize the clocks of the LI-7500RS or LI-7200RS and theLI-7700, be sure to configure the PTP time setting in the LI-7700 to Slave orAutomatic.
3-30 LI-7500RS Open Path CO2/H2O Analyzer
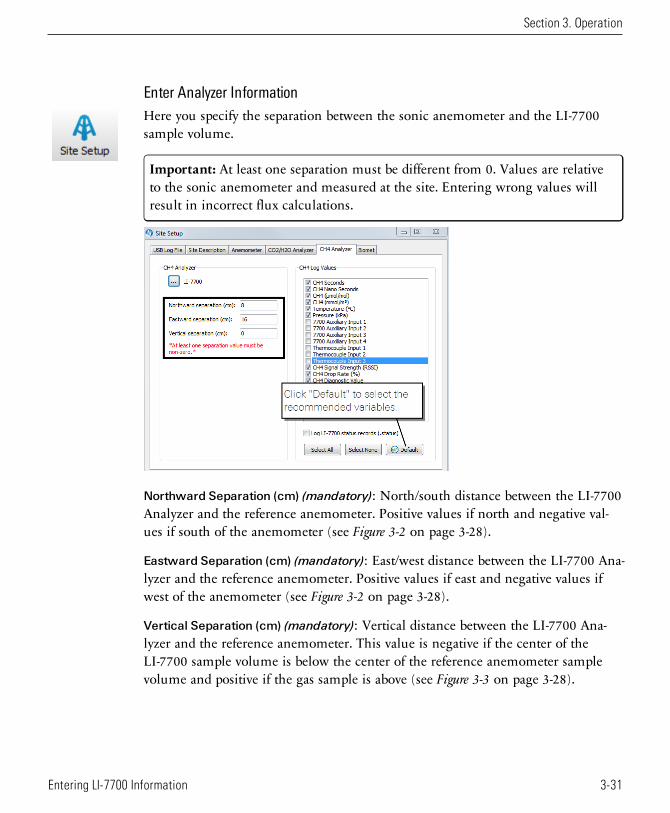
Enter Analyzer InformationHere you specify the separation between the sonic anemometer and the LI-7700sample volume.
Important: At least one separation must be different from 0. Values are relativeto the sonic anemometer and measured at the site. Entering wrong values willresult in incorrect flux calculations.
Northward Separation (cm) (mandatory): North/south distance between the LI-7700Analyzer and the reference anemometer. Positive values if north and negative val-ues if south of the anemometer (see Figure 3-2 on page 3-28).
Eastward Separation (cm) (mandatory): East/west distance between the LI-7700 Ana-lyzer and the reference anemometer. Positive values if east and negative values ifwest of the anemometer (see Figure 3-2 on page 3-28).
Vertical Separation (cm) (mandatory): Vertical distance between the LI-7700 Ana-lyzer and the reference anemometer. This value is negative if the center of theLI-7700 sample volume is below the center of the reference anemometer samplevolume and positive if the gas sample is above (see Figure 3-3 on page 3-28).
Section 3. Operation
3-31Entering LI-7700 Information
Section 3. Operation
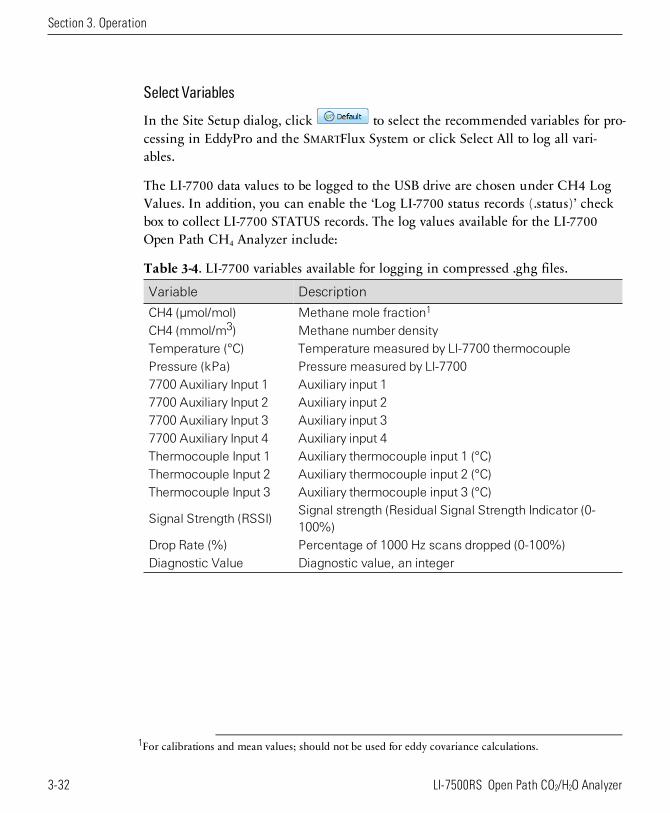
Select Variables
In the Site Setup dialog, click to select the recommended variables for pro-cessing in EddyPro and the SMARTFlux System or click Select All to log all vari-ables.
The LI-7700 data values to be logged to the USB drive are chosen under CH4 LogValues. In addition, you can enable the ‘Log LI-7700 status records (.status)’ checkbox to collect LI-7700 STATUS records. The log values available for the LI-7700Open Path CH4 Analyzer include:
Variable Description
CH4 (µmol/mol) Methane mole fraction1
CH4 (mmol/m3) Methane number densityTemperature (°C) Temperature measured by LI-7700 thermocouplePressure (kPa) Pressure measured by LI-77007700 Auxiliary Input 1 Auxiliary input 17700 Auxiliary Input 2 Auxiliary input 27700 Auxiliary Input 3 Auxiliary input 37700 Auxiliary Input 4 Auxiliary input 4Thermocouple Input 1 Auxiliary thermocouple input 1 (°C)Thermocouple Input 2 Auxiliary thermocouple input 2 (°C)Thermocouple Input 3 Auxiliary thermocouple input 3 (°C)
Signal Strength (RSSI)Signal strength (Residual Signal Strength Indicator (0-100%)
Drop Rate (%) Percentage of 1000 Hz scans dropped (0-100%)Diagnostic Value Diagnostic value, an integer
Table 3-4. LI-7700 variables available for logging in compressed .ghg files.
1For calibrations and mean values; should not be used for eddy covariance calculations.
3-32 LI-7500RS Open Path CO2/H2O Analyzer
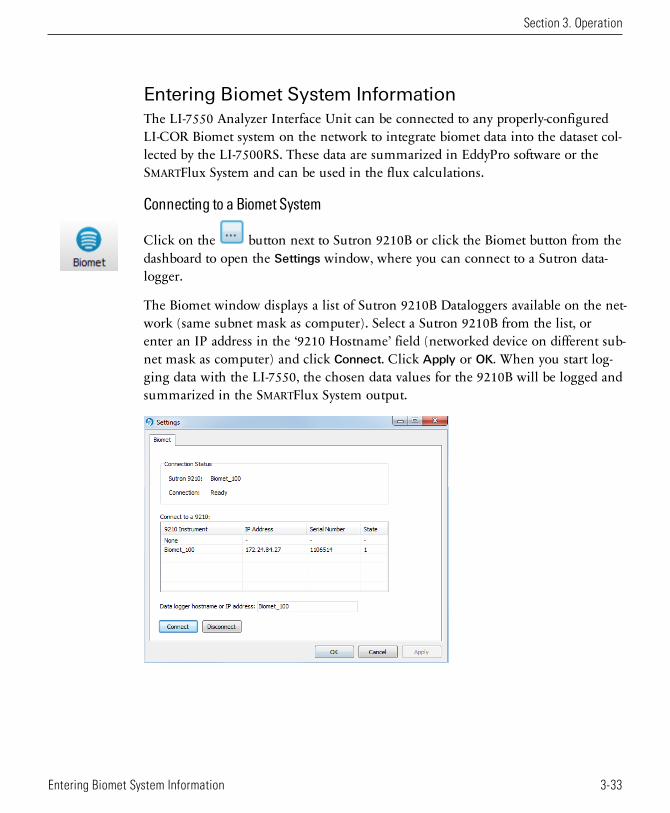
Entering Biomet System InformationThe LI-7550 Analyzer Interface Unit can be connected to any properly-configuredLI-COR Biomet system on the network to integrate biomet data into the dataset col-lected by the LI-7500RS. These data are summarized in EddyPro software or theSMARTFlux System and can be used in the flux calculations.
Connecting to a Biomet System
Click on the button next to Sutron 9210B or click the Biomet button from thedashboard to open the Settings window, where you can connect to a Sutron data-logger.
The Biomet window displays a list of Sutron 9210B Dataloggers available on the net-work (same subnet mask as computer). Select a Sutron 9210B from the list, orenter an IP address in the ‘9210 Hostname’ field (networked device on different sub-net mask as computer) and click Connect. Click Apply or OK. When you start log-ging data with the LI-7550, the chosen data values for the 9210B will be logged andsummarized in the SMARTFlux System output.
Section 3. Operation
3-33Entering Biomet System Information
Section 3. Operation
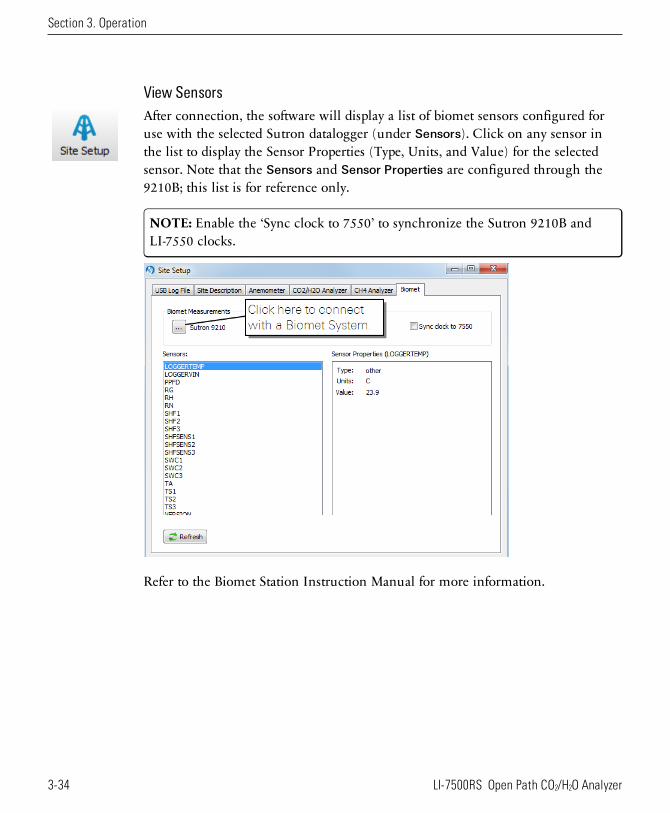
View SensorsAfter connection, the software will display a list of biomet sensors configured foruse with the selected Sutron datalogger (under Sensors). Click on any sensor inthe list to display the Sensor Properties (Type, Units, and Value) for the selectedsensor. Note that the Sensors and Sensor Properties are configured through the9210B; this list is for reference only.
NOTE: Enable the ‘Sync clock to 7550’ to synchronize the Sutron 9210B andLI-7550 clocks.
Refer to the Biomet Station Instruction Manual for more information.
3-34 LI-7500RS Open Path CO2/H2O Analyzer
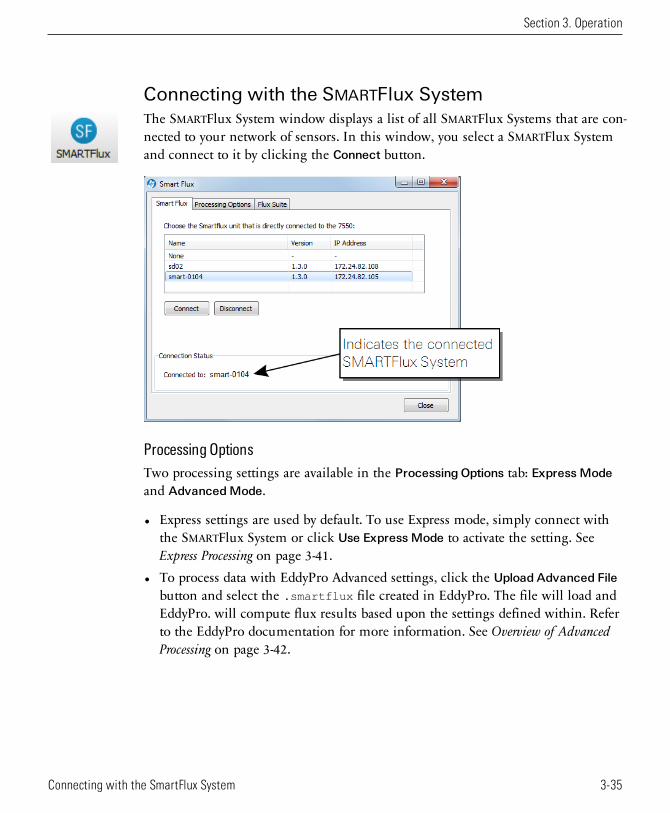
Connecting with the SMARTFlux SystemThe SMARTFlux System window displays a list of all SMARTFlux Systems that are con-nected to your network of sensors. In this window, you select a SMARTFlux Systemand connect to it by clicking the Connect button.
Processing OptionsTwo processing settings are available in the Processing Options tab: Express Modeand AdvancedMode.
l Express settings are used by default. To use Express mode, simply connect withthe SMARTFlux System or click Use Express Mode to activate the setting. SeeExpress Processing on page 3-41.
l To process data with EddyPro Advanced settings, click the Upload Advanced Filebutton and select the .smartflux file created in EddyPro. The file will load andEddyPro. will compute flux results based upon the settings defined within. Referto the EddyPro documentation for more information. See Overview of AdvancedProcessing on page 3-42.
Section 3. Operation
3-35Connecting with the SmartFlux System
Section 3. Operation
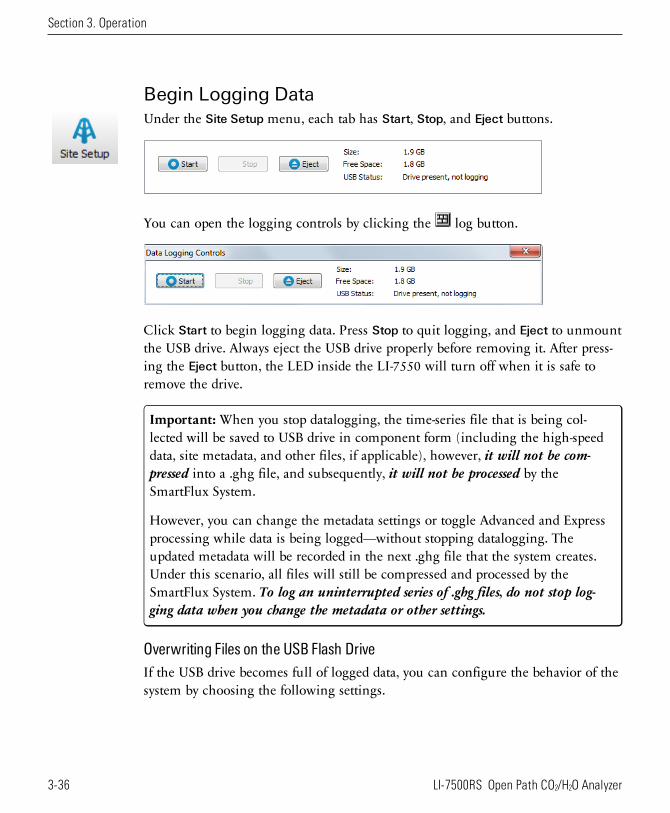
Begin Logging DataUnder the Site Setup menu, each tab has Start, Stop, and Eject buttons.
You can open the logging controls by clicking the log button.
Click Start to begin logging data. Press Stop to quit logging, and Eject to unmountthe USB drive. Always eject the USB drive properly before removing it. After press-ing the Eject button, the LED inside the LI-7550 will turn off when it is safe toremove the drive.
Important: When you stop datalogging, the time-series file that is being col-lected will be saved to USB drive in component form (including the high-speeddata, site metadata, and other files, if applicable), however, it will not be com-pressed into a .ghg file, and subsequently, it will not be processed by theSmartFlux System.
However, you can change the metadata settings or toggle Advanced and Expressprocessing while data is being logged—without stopping datalogging. Theupdated metadata will be recorded in the next .ghg file that the system creates.Under this scenario, all files will still be compressed and processed by theSmartFlux System. To log an uninterrupted series of .ghg files, do not stop log-ging data when you change the metadata or other settings.
Overwriting Files on the USB Flash DriveIf the USB drive becomes full of logged data, you can configure the behavior of thesystem by choosing the following settings.
3-36 LI-7500RS Open Path CO2/H2O Analyzer
l Stop loggingl Delete files from the archive (if files are present there) and continue loggingl Delete files from the archive first, followed by the oldest data files
The file transfer program (see Transferring Logged Data on page 3-39) that can beused to transfer files from the USB drive to your computer remotely, provided youare connected to the LI-7550 Analyzer Interface Unit via an Ethernet connection.This, coupled with the optional file compression described above can obviate theneed to retrieve the USB flash drive to download data. We recommend, however,that you periodically check the USB drive to make sure it is functioning correctly,and to not depend upon the USB drive as a permanent archive for logged data.
About File Compression (USB Logging Only)CO2/H2O measurements, wind speed measurements, CH4 measurements (with theLI-7700), Biomet measurements (with the Biomet System) and site metadata arelogged in a compressed archive if you click the ‘Compress files (.ghg)’ check box.Files are typically compressed at a ratio of about 4:1 (can be as high as 10:1, depend-ing on file attributes). As an example, if the LI-7500RS and LI-7700 CH4 Analyzerare both logging data at 20 HZ, with 53 columns of data, a one hour file would beapproximately 30 MB uncompressed, and 7 MB compressed, for an approximate 4xcompression ratio.
File compression is essential to log .ghg files that are processed in EddyPro softwareor the SmartFlux System. The .ghg file contains an archive consisting of the datafile (.data extension), a metadata file (.metadata extension), and an optional LI-7700status file (.status extension).
When file compression is enabled, an archive is created and the file name is appen-ded with a .ghg file extension. To view the contents of a .ghg file, you can changethe file extension to .zip and unzip it with the extraction tool included with Win-dows® or unzip the .ghg file using a program such as 7-zip.
Files are saved and compressed after the File Duration interval has elapsed. If the fileduration is set to 15 minutes, the first .data file will be collected for 15 minutes (orsome part thereof), after which it will be compressed, and the second data file willcommence for 15 minutes, after which it is compressed, and so on.
Note: If the file duration is set to Continuous, files will not be compressed.
Section 3. Operation
3-37Begin Logging Data
Section 3. Operation
If you log all variables at 10 Hz (10 samples per second), approximately 180 MB ofdata will be generated each day. Thus, the 16 GB drive can collect about 80 days ofdata with no compression. With compression, a daily file would be about 50 MB;the 16 GB drive can collect about 288 days of data.
File TypesThe data file is an ASCII text table with a header, and tab-delimited rows of data.When paired with the metadata file, the data file header is ignored by EddyPro®Software, which uses the metadata file to interpret the data columns and to retrievethe appropriate meta-information needed to calculate fluxes. The metadata inform-ation is stored as plain text, and can be retrieved and edited as desired. Typicalmetadata includes information such as site and setup, the instruments, and the vari-able definitions, including physical units.
3-38 LI-7500RS Open Path CO2/H2O Analyzer
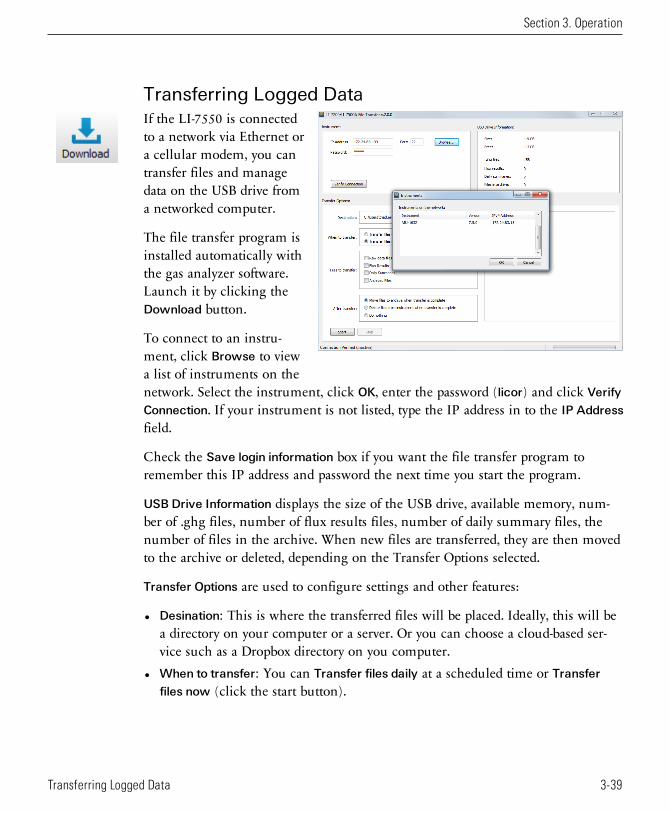
Transferring Logged DataIf the LI-7550 is connectedto a network via Ethernet ora cellular modem, you cantransfer files and managedata on the USB drive froma networked computer.
The file transfer program isinstalled automatically withthe gas analyzer software.Launch it by clicking theDownload button.
To connect to an instru-ment, click Browse to viewa list of instruments on thenetwork. Select the instrument, click OK, enter the password (licor) and click Verify
Connection. If your instrument is not listed, type the IP address in to the IP Addressfield.
Check the Save login information box if you want the file transfer program toremember this IP address and password the next time you start the program.
USB Drive Information displays the size of the USB drive, available memory, num-ber of .ghg files, number of flux results files, number of daily summary files, thenumber of files in the archive. When new files are transferred, they are then movedto the archive or deleted, depending on the Transfer Options selected.
Transfer Options are used to configure settings and other features:
l Desination: This is where the transferred files will be placed. Ideally, this will bea directory on your computer or a server. Or you can choose a cloud-based ser-vice such as a Dropbox directory on you computer.
l When to transfer: You can Transfer files daily at a scheduled time or Transferfiles now (click the start button).
Section 3. Operation
3-39Transferring Logged Data
Section 3. Operation
Note: You can close the application to your system tray (close it, but choose No)so it continues running in the background. Also be sure your computer does notgo to sleep before the scheduled transfer.
l Files to transfer: Select Raw data files (.ghg, .data., metadata) to transfer all rawdata files. Select Flux Results to transfer SMARTFlux System results. Select DailySummaries to download a small summary of the flux results. Select Archivedfiles to copy the archives.Note: When you check a box a corresponding tab will be added to the box. Hereyou can choose which files you want to download.
l After transfer: You can choose Move files to the archive. This is useful if youwant to keep a copy of the files on the USB drive but you want them compressedto save space. You can Delete files from the instrument will remove them fromthe USB drive. Use this option if you want to clear space from the flash drive andyou have backed up the data elsewhere. You can also choose to Do nothing afterthe transfer.
After configuring the transfer and selecting files, click Start.
Tips for Automatic Data Transfer:
l Set the download to begin at 00:15 (1:15 am) if you are using SMARTFlux.That way all the logged files will be processed before the download begins.
l Close the application to your system tray to keep it running in the back-ground.
l Be sure the computer that runs the application is on and not in power savermode.
l Download files daily, if possible, to avoid long wait times for data transfer.
You can also use third-party applications to transfer data, such as WinSCP. In thiscase, use:
l Port: 22l Username: licorl Passord: licor
3-40 LI-7500RS Open Path CO2/H2O Analyzer
Running SMARTFluxWhen using SMARTFlux System with express settings, there really is nothing addi-tional for you to do beyond entering site information and configuring your sensors.But, when your site conditions or objectives require advanced settings, you will useEddyPro to create the SMARTFlux advanced configuration file. This section providesa detailed summary of the steps involved with configuring the SMARTFlux withAdvanced settings.
Express ProcessingEddyPro Express mode is the default configuration for the flux computation in theSMARTFlux System. Express settings are loaded automatically unless you specify anEddyPro Advanced configuration file. In most cases, EddyPro Express provides final,fully corrected and valid fluxes that can be directly used for further analysis. In afew special cases, however, Express fluxes may not be fully accurate and only serve adiagnostic purpose.
Automatic Variable SelectionIn standard EddyPro, even when running in Express mode, you still can select thevariables to be used in flux computation, in the Basic Settings > Select Items forflux computation section. More precisely, EddyPro provides default choices based onthe variables described in the metadata file (either embedded in .ghg files, or cre-ated in Project Creation > Metadata file editor), and you can keep these choices orpick other variables. For example, CO2 fluxes from the LI-7200RS can be calculatedfrom CO2 measurements available as either mixing ratio, mole fraction or numberdensity. If all of these measurements are available in the metadata file, thenEddyPro defaults to the mixing ratio, and you are allowed to either keep this choiceor pick one of the other two.
EddyPro defaults, and the order in which other viable variables are listed in thedrop-down menus, reflect best practices suggested by LI-COR and depend on thedeployed instrument(s). The exact same logic is used in SMARTFlux to select the vari-ables to be used when multiple choices are available. In particular:
l CO2/H2Omeasured by an LI-7200RS: The order of preference is (1) mixing ratio,(2) mole fraction and (3) number density
Section 3. Operation
3-41Running SmartFlux
Section 3. Operation
l CO2/H2Omeasured by an LI-7500RS: Only number density can be used for fluxcomputation
l CH4measured by an LI-7700: Only number density can be used for flux com-putation
l Air temperature and pressure: Precedence is given to measurements from anLI-7700 if available.
l Diagnostics flags: If available for the deployed instruments, diagnostic flags areused to filter out individual raw data based on diagnostic information.
Overview of Advanced ProcessingAdvanced Mode provides you with the high-level capabilities of the EddyProAdvanced, computing fully corrected flux results in real-time with the processingoptions of your choice.
The SMARTFlux configuration file, needed to run EddyPro in Advanced mode insidethe SMARTFlux System, is created in EddyPro 5 or higher. This, and subsequent ver-sions of EddyPro provide the capability to export a SMARTFlux configuration file,that can then be uploaded via the gas analyzer PC software. Complete doc-umentation is provided in the EddyPro help.
There are additional considerations if you use EddyPro Advanced in SMARTFlux.For many scenarios, you will simply need to configure the advanced settings as yousee best, and load the SMARTFlux configuration file into SMARTFlux following theinstruction provided hereafter.
However, if you wish to use a Planar-fit method for Axis Rotation, the AutomaticTime Lag Optimization option, or one of the in-situ spectral correction methods(Horst, 1997; Ibrom et al., 2007), you will need to process an existing data set from thesite in order to configure the parameters for these settings, as explained in Using Planar Fit,In-situ Spectral Corrections and Timelag Optimization in SmartFlux on page 3-49.
3-42 LI-7500RS Open Path CO2/H2O Analyzer
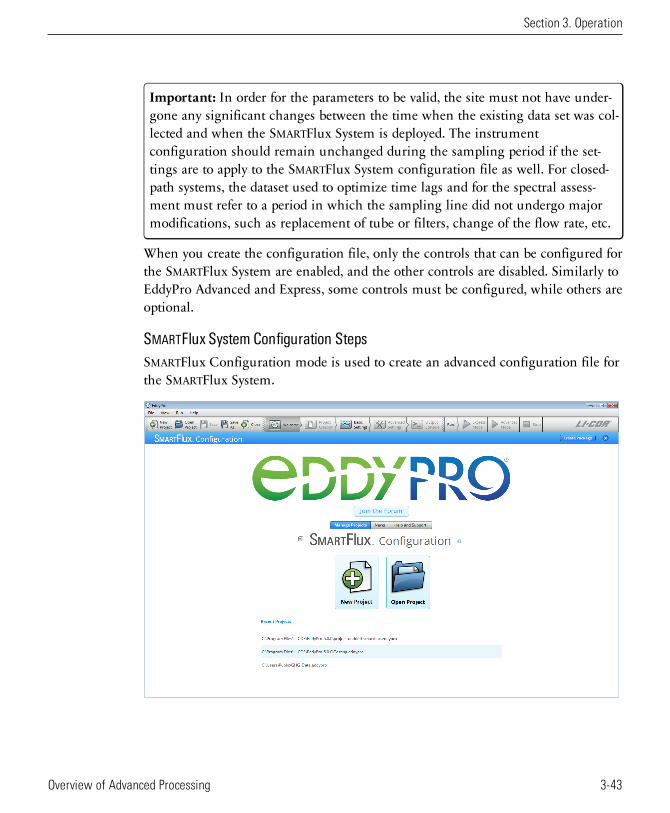
Important: In order for the parameters to be valid, the site must not have under-gone any significant changes between the time when the existing data set was col-lected and when the SMARTFlux System is deployed. The instrumentconfiguration should remain unchanged during the sampling period if the set-tings are to apply to the SMARTFlux System configuration file as well. For closed-path systems, the dataset used to optimize time lags and for the spectral assess-ment must refer to a period in which the sampling line did not undergo majormodifications, such as replacement of tube or filters, change of the flow rate, etc.
When you create the configuration file, only the controls that can be configured forthe SMARTFlux System are enabled, and the other controls are disabled. Similarly toEddyPro Advanced and Express, some controls must be configured, while others areoptional.
SMARTFlux System Configuration StepsSMARTFlux Configuration mode is used to create an advanced configuration file forthe SMARTFlux System.
Section 3. Operation
3-43Overview of Advanced Processing
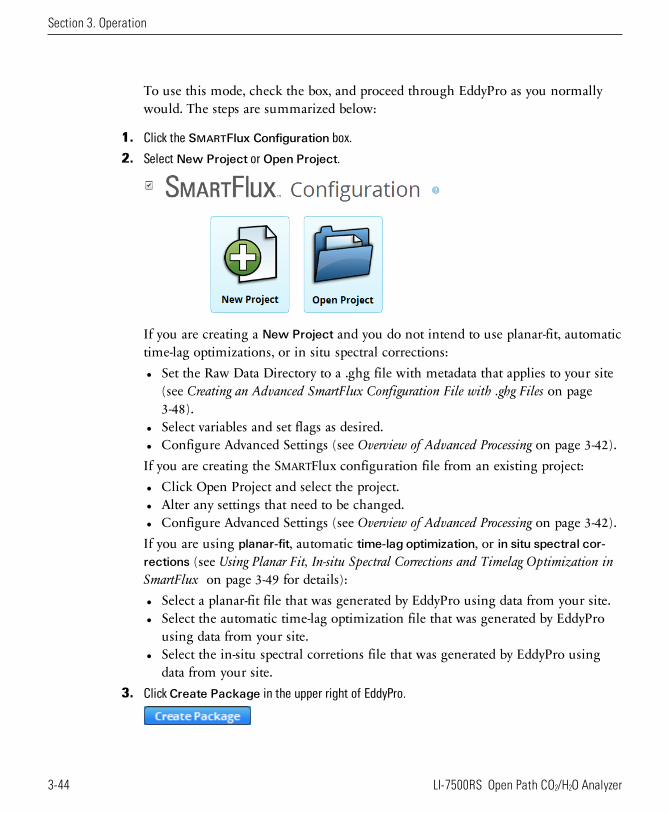
Section 3. Operation
To use this mode, check the box, and proceed through EddyPro as you normallywould. The steps are summarized below:
1. Click the SMARTFlux Configuration box.
2. Select New Project or Open Project.
If you are creating a New Project and you do not intend to use planar-fit, automatictime-lag optimizations, or in situ spectral corrections:l Set the Raw Data Directory to a .ghg file with metadata that applies to your site
(see Creating an Advanced SmartFlux Configuration File with .ghg Files on page3-48).
l Select variables and set flags as desired.l Configure Advanced Settings (see Overview of Advanced Processing on page 3-42).If you are creating the SMARTFlux configuration file from an existing project:l Click Open Project and select the project.l Alter any settings that need to be changed.l Configure Advanced Settings (see Overview of Advanced Processing on page 3-42).If you are using planar-fit, automatic time-lag optimization, or in situ spectral cor-rections (see Using Planar Fit, In-situ Spectral Corrections and Timelag Optimization inSmartFlux on page 3-49 for details):l Select a planar-fit file that was generated by EddyPro using data from your site.l Select the automatic time-lag optimization file that was generated by EddyPro
using data from your site.l Select the in-situ spectral corretions file that was generated by EddyPro using
data from your site.3. Click Create Package in the upper right of EddyPro.
3-44 LI-7500RS Open Path CO2/H2O Analyzer
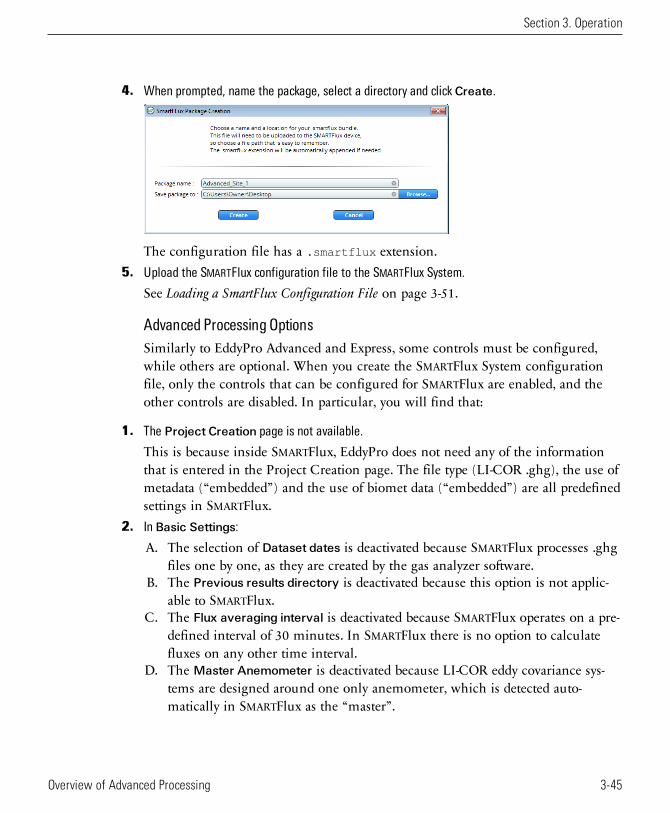
4. When prompted, name the package, select a directory and click Create.
The configuration file has a .smartflux extension.5. Upload the SMARTFlux configuration file to the SMARTFlux System.
See Loading a SmartFlux Configuration File on page 3-51.
Advanced Processing OptionsSimilarly to EddyPro Advanced and Express, some controls must be configured,while others are optional. When you create the SMARTFlux System configurationfile, only the controls that can be configured for SMARTFlux are enabled, and theother controls are disabled. In particular, you will find that:
1. The Project Creation page is not available.
This is because inside SMARTFlux, EddyPro does not need any of the informationthat is entered in the Project Creation page. The file type (LI-COR .ghg), the use ofmetadata (“embedded”) and the use of biomet data (“embedded”) are all predefinedsettings in SMARTFlux.
2. In Basic Settings:
A. The selection of Dataset dates is deactivated because SMARTFlux processes .ghgfiles one by one, as they are created by the gas analyzer software.
B. The Previous results directory is deactivated because this option is not applic-able to SMARTFlux.
C. The Flux averaging interval is deactivated because SMARTFlux operates on a pre-defined interval of 30 minutes. In SMARTFlux there is no option to calculatefluxes on any other time interval.
D. The Master Anemometer is deactivated because LI-COR eddy covariance sys-tems are designed around one only anemometer, which is detected auto-matically in SMARTFlux as the “master”.
Section 3. Operation
3-45Overview of Advanced Processing
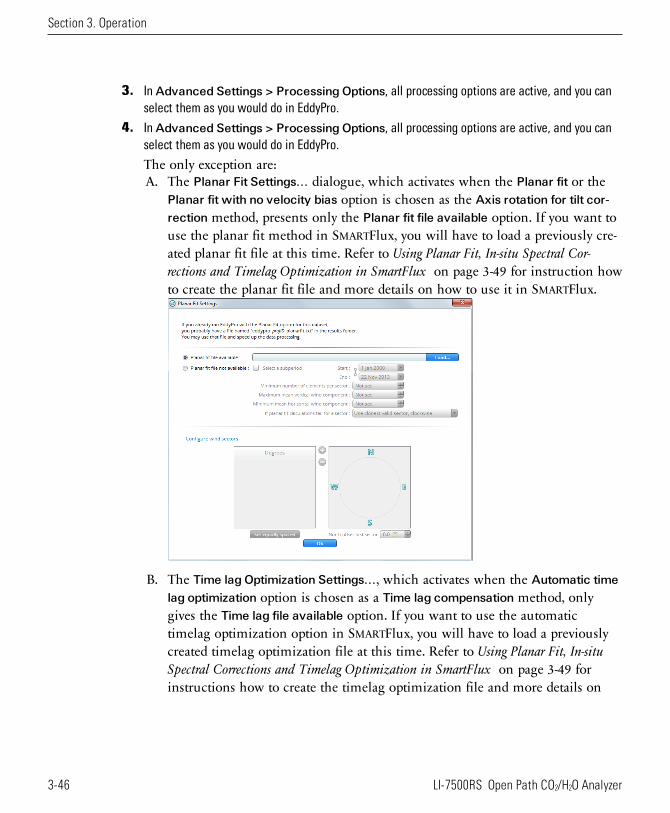
Section 3. Operation
3. In Advanced Settings > Processing Options, all processing options are active, and you canselect them as you would do in EddyPro.
4. In Advanced Settings > Processing Options, all processing options are active, and you canselect them as you would do in EddyPro.
The only exception are:A. The Planar Fit Settings... dialogue, which activates when the Planar fit or the
Planar fit with no velocity bias option is chosen as the Axis rotation for tilt cor-rection method, presents only the Planar fit file available option. If you want touse the planar fit method in SMARTFlux, you will have to load a previously cre-ated planar fit file at this time. Refer to Using Planar Fit, In-situ Spectral Cor-rections and Timelag Optimization in SmartFlux on page 3-49 for instruction howto create the planar fit file and more details on how to use it in SMARTFlux.
B. The Time lag Optimization Settings..., which activates when the Automatic timelag optimization option is chosen as a Time lag compensation method, onlygives the Time lag file available option. If you want to use the automatictimelag optimization option in SMARTFlux, you will have to load a previouslycreated timelag optimization file at this time. Refer to Using Planar Fit, In-situSpectral Corrections and Timelag Optimization in SmartFlux on page 3-49 forinstructions how to create the timelag optimization file and more details on
3-46 LI-7500RS Open Path CO2/H2O Analyzer
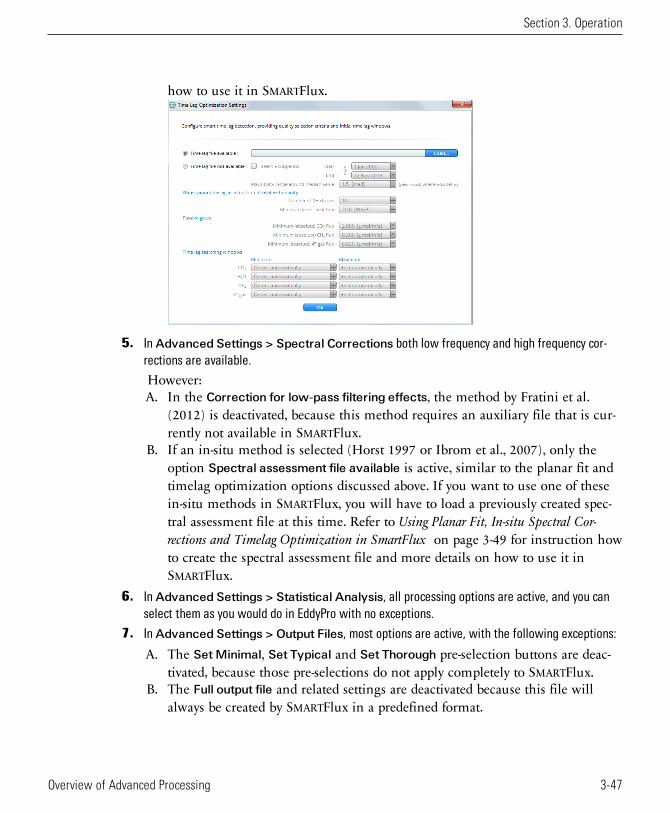
how to use it in SMARTFlux.
5. In Advanced Settings > Spectral Corrections both low frequency and high frequency cor-rections are available.
However:A. In the Correction for low-pass filtering effects, the method by Fratini et al.
(2012) is deactivated, because this method requires an auxiliary file that is cur-rently not available in SMARTFlux.
B. If an in-situ method is selected (Horst 1997 or Ibrom et al., 2007), only theoption Spectral assessment file available is active, similar to the planar fit andtimelag optimization options discussed above. If you want to use one of thesein-situ methods in SMARTFlux, you will have to load a previously created spec-tral assessment file at this time. Refer to Using Planar Fit, In-situ Spectral Cor-rections and Timelag Optimization in SmartFlux on page 3-49 for instruction howto create the spectral assessment file and more details on how to use it inSMARTFlux.
6. In Advanced Settings > Statistical Analysis, all processing options are active, and you canselect them as you would do in EddyPro with no exceptions.
7. In Advanced Settings > Output Files, most options are active, with the following exceptions:
A. The SetMinimal, Set Typical and Set Thorough pre-selection buttons are deac-tivated, because those pre-selections do not apply completely to SMARTFlux.
B. The Full output file and related settings are deactivated because this file willalways be created by SMARTFlux in a predefined format.
Section 3. Operation
3-47Overview of Advanced Processing
Section 3. Operation
C. The Ensemble averaged cospectra andmodels is unchecked and deactivated,because this output cannot be created in SMARTFlux, were .ghg files are pro-cessed one at a time. To create those outputs, use standard EddyPro instead.
D. All full length (co)spectra outputs are deactivated. These files occupy largeamounts of disk space and are thus not allowed in SMARTFlux. To obtain fulllength (co)spectra files, use standard EddyPro instead.
E. Processed raw data outputs are deactivated. These files occupy large amounts ofdisk space and are thus not allowed in SMARTFlux. To obtain those outputs, usestandard EddyPro instead.
Creating an Advanced SMARTFlux Configuration Filewithout .ghg FilesIf you don’t have any .ghg files from the EC system for which you are going to usethe SMARTFlux System, you can customize the Advanced processing options, butyou will have to rely on EddyPro’s selection of variables to be used for flux com-putation, because at this stage you will have no means to indicate which variablesyou are going to collect and which ones you want to use for fluxes. See AutomaticVariable Selection on page 3-41 for more details on EddyPro default selections.
Once you have chosen the processing options of your preference, simply click onthe Create File button on the right side of the blue SMARTFlux ribbon. This will cre-ate a bundle with extension .smartflux and save it in the selected output directory.
Creating an Advanced SMARTFlux Configuration Filewith .ghg FilesIf you have at least one .ghg file from the EC system for which you are going touse SMARTFlux, you can customize the Advanced processing options, and select thevariables you prefer for computing fluxes on-the-fly. In this case, in Basic Settings
simply select the Raw data directory where your raw data are stored, and EddyProwill automatically populate the section Select Items for flux computation, as it usu-ally does when used in the standard mode.
At this point, select the variables, configure the flags, and set the processing optionsof your preference and simply click the Create File button visible on the right sideof the blue SMARTFlux ribbon. This will create a bundle with extension .smartflux
and save it in the selected output directory.
3-48 LI-7500RS Open Path CO2/H2O Analyzer
Using Planar Fit, In-situ Spectral Corrections and Timelag Optimization in SMARTFlux
In order to use planar-fit, in-situ spectral corrections or timelag optimization in theSMARTFlux System, EddyPro needs to access the respective “planar_fit”, “spectral_assessment” and “timelag_optimization” files, referred to as “additional con-figuration files” hereafter. These files contain summaries of calculations performedon relatively large datasets (Table 3-5 below) and that apply also to data to be col-lected in the future.
For example, you can use three-months of data to calculate a spectral assessment,and then use this spectral assessment that is summarized in a short text file, to cor-rect fluxes calculated from data collected after those three months, if the system con-figuration didn’t change to such an extent, that the spectral assessment is no longerrepresentative. Similar considerations apply to the planar fit and the timelag optim-ization procedures. Refer to EddyPro documentation for more details on when andhow to use these three advanced procedures.
The additional configuration files are created by EddyPro (3.0 and above), whenused in the standard desktop mode. If you have been running your EC system – forwhich you intend to user SMARTFlux—for some time, you may already have createdone or more of these files, or you may have a .ghg dataset suitable for creatingthem, if the corresponding implementation is deemed necessary to calculate accur-ate fluxes (again, refer to EddyPro documentation to learn more about when it issuggested to use these options). If you do not have previously collected .ghg files,then you will need to run the system for a suitable amount of time (for exampleusing SMARTFlux in Express mode), then use EddyPro in desktop mode to createthe additional configuration files of your interest, and then provide them toSMARTFlux as explained below.
EddyPro Advanced Setting Recommended Data-set
Planar Fit Settings 2 weeks minimum; < 2months
Time Lag Optimization 1 to 2 months or more
Spectral Corrections, Assessment of high frequencyattenuation
1 month or more
Table 3-5. Recommended dataset durations for Advanced settings.
Section 3. Operation
3-49Overview of Advanced Processing
Section 3. Operation
Thus, assuming that you have a sufficiently long .ghg dataset (Table 3-5 on the pre-vious page), the procedure to correctly configure SMARTFlux to use planar-fit, in-situspectral corrections or timelag optimization is illustrated here, using the in-situspectral corrections as an example. Analogous procedures shall be followed for theplanar-fit or the timelag optimization.
1. Open EddyPro (5.0 or above recommended) in normal desktop mode and complete the ProjectCreation and Basic Settings pages as usual (refer to EddyPro documentation if needed).
In the Advanced Settings > Spectral Corrections, configure Corrections for low-pass filtering effects to use one of the in-situ methods, i.e. Horst (1997), Ibrom etal. (2007) or Fratini et al. (2012). In the same page, customize the settings toinstruct EddyPro to use the dataset of your choice and to filter data appropriately, soas to obtain a sound assessment of spectral attenuations. Click Run and when this iscompleted, locate the spectral assessment file (it contains the string “spectral_assess-ment” in the file name) in the subdirectory \spectral_analysis that you will findinside the selected Output folder. This is the file that you will use for SMARTFlux.
2. Open EddyPro (5.0 or above) in SMARTFlux Setup Mode.
Configure everything as explained in the previous sections. In the Advanced Set-tings > Spectral Corrections, configure Corrections for low-pass filtering effects touse one of the in-situ methods among Horst (1997) and Ibrom et al. (2007) (themethod of Fratini et al. (2012) is currently not usable in SMARTFlux). In the “Spec-tral assessment file available” entry, select the spectral assessment file createdearlier. Then proceed normally and when done, click on the Create File button tocreate the .smartflux bundle, as explained above.An analogous procedure can be used to create and use the planar fit and thetimelag optimization configuration files.
3-50 LI-7500RS Open Path CO2/H2O Analyzer
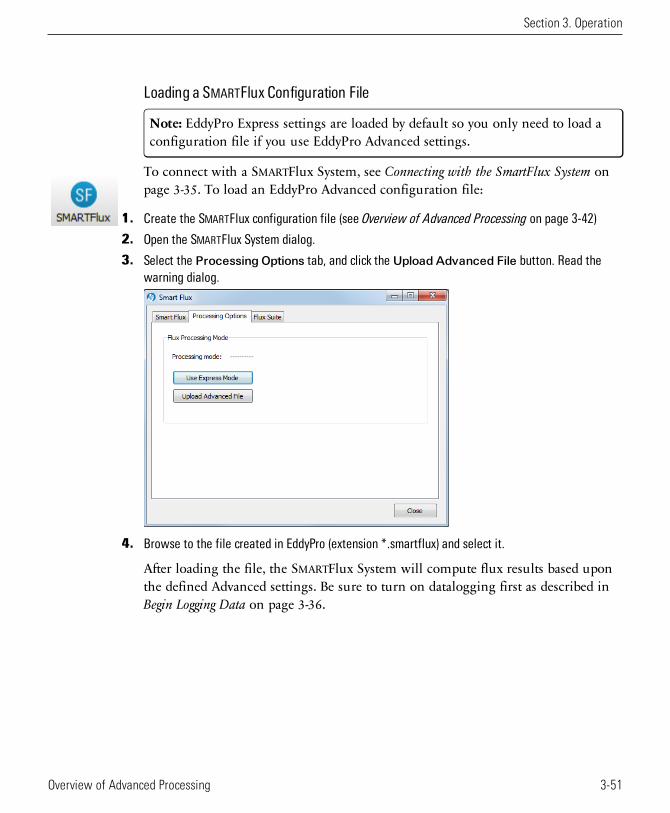
Loading a SMARTFlux Configuration File
Note: EddyPro Express settings are loaded by default so you only need to load aconfiguration file if you use EddyPro Advanced settings.
To connect with a SMARTFlux System, see Connecting with the SmartFlux System onpage 3-35. To load an EddyPro Advanced configuration file:
1. Create the SMARTFlux configuration file (see Overview of Advanced Processing on page 3-42)
2. Open the SMARTFlux System dialog.
3. Select the Processing Options tab, and click the Upload Advanced File button. Read thewarning dialog.
4. Browse to the file created in EddyPro (extension *.smartflux) and select it.
After loading the file, the SMARTFlux System will compute flux results based uponthe defined Advanced settings. Be sure to turn on datalogging first as described inBegin Logging Data on page 3-36.
Section 3. Operation
3-51Overview of Advanced Processing
Section 3. Operation
SMARTFlux Results FilesThe SMARTFlux System writes EddyPro results files to the USB flash drive in theLI-7550. In addition to the raw .ghg files (including any .data and .metadata files),you can retrieve flux results files, daily summary files, and archived files.
Flux ResultsThese are the output files from EddyPro. They follow a format typical of EddyProoutputs, as described in detail in the EddyPro help(http://www.licor.com/env/help/eddypro/index.html).
Daily SummariesThese logged data summaries, typically named something like YYYY-MM-DD_AIU-
xxxx_Summary, include the high-speed data logged in the LI-7550 analyzer interfaceunit. These are the variables selected in Entering CO2/H2O Analyzer Information onpage 3-27.
The EddyPro summaries, typically named somethings like YYYY-MM-DD_EP-Sum-
mary, include the half-hour eddy covariance flux results. This file is created at theend of each day by collecting the results of each 30-minute file and placing them ina row. The variables included in this file are specified in EddyPro automatically ifyou select Basic processing or manually if you select Advanced processing (seeAdvanced Processing Options on page 3-45).
Data BackupAn emergency data backup archive is stored on the MicroSD card, which may beuseful if data are lost for any reason. The backup files are limited to the latest filesrecorded—the oldest files are overwritten when the MicroSD card gets full. Do notdepend upon the MicroSD card as a primary backup for your data, however,because old files are automatically overwritten by new ones.
3-52 LI-7500RS Open Path CO2/H2O Analyzer
Section 4. CalibrationThe LI-7500RS’s measurement accuracy depends upon its calibration. There are twomajor components to the calibration: 1) determining the values of calibration coef-ficients, and 2) setting zero and span. During a factory calibration, both of thesesteps are performed. The values of the coefficients that are determined should bevalid for several years. The zero and span adjustments are used to bring theLI-7500RS's actual response into line with its previously determined factoryresponse, at least at two points.
Important: Check the zero and span at regular intervals; monthly at first, andthen adjust the frequency according to the stability of the instrument; see HowStable are Zero and Span? below.
How Stable are Zero and Span?The analyzer's zero is primarily affected by temperature, and the state of the internalchemicals. The internal chemicals should be changed annually (see Replacing theInternal Chemicals on page 5-4). The zero's response to temperature is relativelysmall (typically 0.1 or 0.2 ppm per °C for CO2, or 0.01 mmol/mol/°C for H2O).Also, this drift is measured at the factory, and subsequently compensated for in soft-ware (equation 8-10), so the effective zero drift should be quite small. Therefore, thezero should be quite stable over a several month period, but you might want tocheck it after an extreme temperature change (>30 °C).
The analyzer's span is affected by temperature, pressure, and the state of the internalchemicals.
l Temperature: A 10 °C change will typically change the H2O span by 1 to 2%.For CO2 at ambient concentrations, the span is very insensitive to temperature.
4-1LI-7500RS Open Path CO2/H2O Analyzer
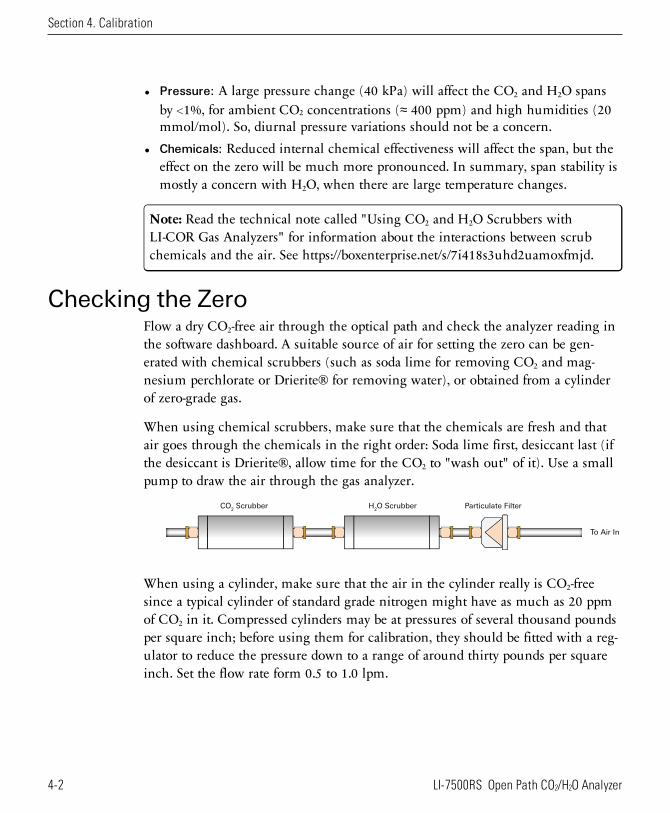
Section 4. Calibration
l Pressure: A large pressure change (40 kPa) will affect the CO2 and H2O spansby <1%, for ambient CO2 concentrations (≈ 400 ppm) and high humidities (20mmol/mol). So, diurnal pressure variations should not be a concern.
l Chemicals: Reduced internal chemical effectiveness will affect the span, but theeffect on the zero will be much more pronounced. In summary, span stability ismostly a concern with H2O, when there are large temperature changes.
Note: Read the technical note called "Using CO2 and H2O Scrubbers withLI-COR Gas Analyzers" for information about the interactions between scrubchemicals and the air. See https://boxenterprise.net/s/7i418s3uhd2uamoxfmjd.
Checking the ZeroFlow a dry CO2-free air through the optical path and check the analyzer reading inthe software dashboard. A suitable source of air for setting the zero can be gen-erated with chemical scrubbers (such as soda lime for removing CO2 and mag-nesium perchlorate or Drierite® for removing water), or obtained from a cylinderof zero-grade gas.
When using chemical scrubbers, make sure that the chemicals are fresh and thatair goes through the chemicals in the right order: Soda lime first, desiccant last (ifthe desiccant is Drierite®, allow time for the CO2 to "wash out" of it). Use a smallpump to draw the air through the gas analyzer.
CO2 Scrubber H
2O Scrubber Particulate Filter
To Air In
When using a cylinder, make sure that the air in the cylinder really is CO2-freesince a typical cylinder of standard grade nitrogen might have as much as 20 ppmof CO2 in it. Compressed cylinders may be at pressures of several thousand poundsper square inch; before using them for calibration, they should be fitted with a reg-ulator to reduce the pressure down to a range of around thirty pounds per squareinch. Set the flow rate form 0.5 to 1.0 lpm.
4-2 LI-7500RS Open Path CO2/H2O Analyzer
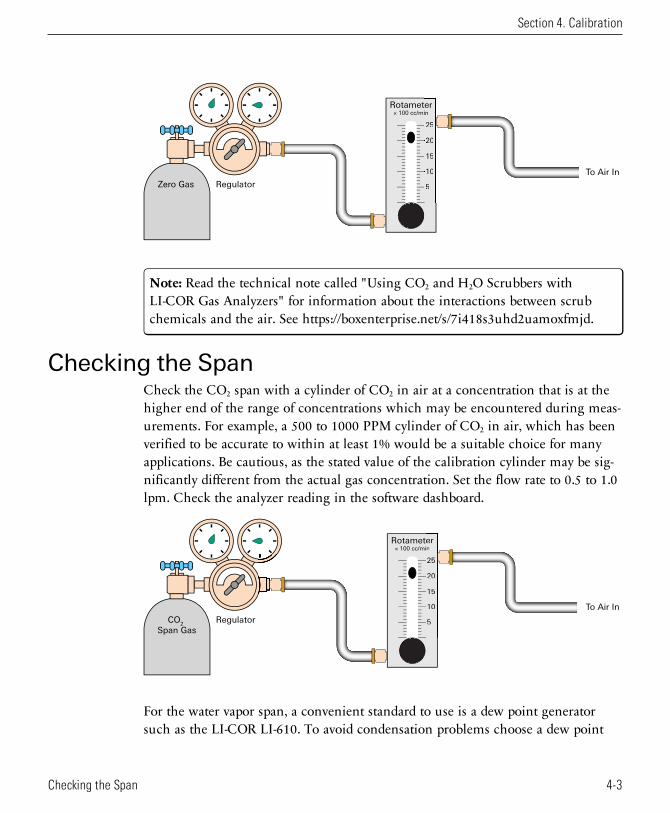
Zero Gas Regulator
Rotameter× 100 cc/min
5
10
20
15
25
terin
5
10
20
15
25
To Air In
Note: Read the technical note called "Using CO2 and H2O Scrubbers withLI-COR Gas Analyzers" for information about the interactions between scrubchemicals and the air. See https://boxenterprise.net/s/7i418s3uhd2uamoxfmjd.
Checking the SpanCheck the CO2 span with a cylinder of CO2 in air at a concentration that is at thehigher end of the range of concentrations which may be encountered during meas-urements. For example, a 500 to 1000 PPM cylinder of CO2 in air, which has beenverified to be accurate to within at least 1% would be a suitable choice for manyapplications. Be cautious, as the stated value of the calibration cylinder may be sig-nificantly different from the actual gas concentration. Set the flow rate to 0.5 to 1.0lpm. Check the analyzer reading in the software dashboard.
CO2
Span Gas
Regulator
Rotameter× 100 cc/min
5
10
20
15
25
terin
5
10
20
15
25
To Air In
For the water vapor span, a convenient standard to use is a dew point generatorsuch as the LI-COR LI-610. To avoid condensation problems choose a dew point
Section 4. Calibration
4-3Checking the Span
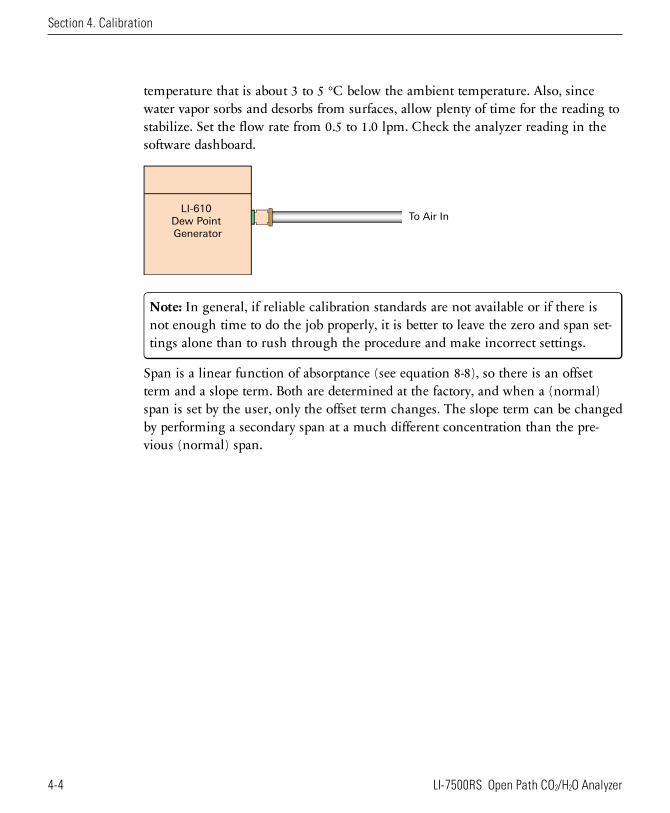
Section 4. Calibration
temperature that is about 3 to 5 °C below the ambient temperature. Also, sincewater vapor sorbs and desorbs from surfaces, allow plenty of time for the reading tostabilize. Set the flow rate from 0.5 to 1.0 lpm. Check the analyzer reading in thesoftware dashboard.
To Air InLI-610
Dew Point
Generator
Note: In general, if reliable calibration standards are not available or if there isnot enough time to do the job properly, it is better to leave the zero and span set-tings alone than to rush through the procedure and make incorrect settings.
Span is a linear function of absorptance (see equation 8-8), so there is an offsetterm and a slope term. Both are determined at the factory, and when a (normal)span is set by the user, only the offset term changes. The slope term can be changedby performing a secondary span at a much different concentration than the pre-vious (normal) span.
4-4 LI-7500RS Open Path CO2/H2O Analyzer
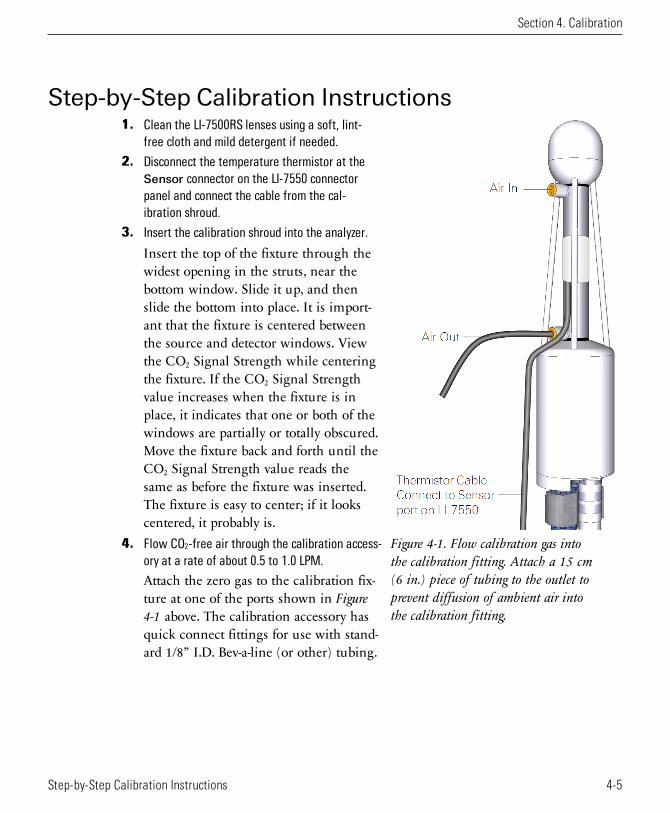
Step-by-Step Calibration Instructions
Figure 4-1. Flow calibration gas intothe calibration fitting. Attach a 15 cm(6 in.) piece of tubing to the outlet toprevent diffusion of ambient air intothe calibration fitting.
1. Clean the LI-7500RS lenses using a soft, lint-free cloth and mild detergent if needed.
2. Disconnect the temperature thermistor at theSensor connector on the LI-7550 connectorpanel and connect the cable from the cal-ibration shroud.
3. Insert the calibration shroud into the analyzer.
Insert the top of the fixture through thewidest opening in the struts, near thebottom window. Slide it up, and thenslide the bottom into place. It is import-ant that the fixture is centered betweenthe source and detector windows. Viewthe CO2 Signal Strength while centeringthe fixture. If the CO2 Signal Strengthvalue increases when the fixture is inplace, it indicates that one or both of thewindows are partially or totally obscured.Move the fixture back and forth until theCO2 Signal Strength value reads thesame as before the fixture was inserted.The fixture is easy to center; if it lookscentered, it probably is.
4. Flow CO2-free air through the calibration access-ory at a rate of about 0.5 to 1.0 LPM.
Attach the zero gas to the calibration fix-ture at one of the ports shown in Figure4-1 above. The calibration accessory hasquick connect fittings for use with stand-ard 1/8” I.D. Bev-a-line (or other) tubing.
Section 4. Calibration
4-5Step-by-Step Calibration Instructions
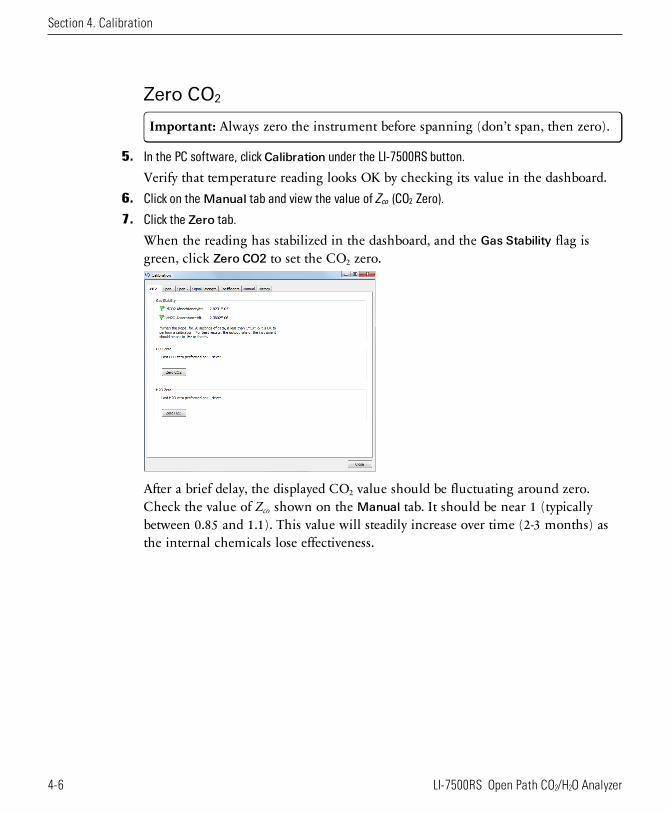
Section 4. Calibration
Zero CO2
Important: Always zero the instrument before spanning (don’t span, then zero).
5. In the PC software, click Calibration under the LI-7500RS button.
Verify that temperature reading looks OK by checking its value in the dashboard.6. Click on theManual tab and view the value of Zco (CO2 Zero).
7. Click the Zero tab.
When the reading has stabilized in the dashboard, and the Gas Stability flag isgreen, click Zero CO2 to set the CO2 zero.
After a brief delay, the displayed CO2 value should be fluctuating around zero.Check the value of Zco shown on the Manual tab. It should be near 1 (typicallybetween 0.85 and 1.1). This value will steadily increase over time (2-3 months) asthe internal chemicals lose effectiveness.
4-6 LI-7500RS Open Path CO2/H2O Analyzer
Zero H2ONow is a good time to check or set the H2O zero, if you have been flowing dry,CO2-free air through the optical path.
8. Click theManual tab, and note the present value of Zwo (H2O Zero).
Wait for the H2O reading to stabilize in the dashboard (3 or 4 minutes). The GasStability flag will turn from a red ‘X’ to a green flag when it is OK to perform thecalibration.
9. Click the Zero tab, and click Zero H2O. Note the new value of Zwo (typically between 0.65 and0.85).
Span CO2
10. Flow a CO2 span gas through the calibration tube at 0.5 to 1 liter/minute.
11. Click on the Span tab and enter the mole fraction in the Span gas concentration field.
12. When stable (1-2 minutes) click Span CO2.
Click the Manual tab and check the new CO2 Span value Sc (typically 0.9-1.1).
Span H2O13. To set the H2O span, flow air of known dew point through the calibration tube at about 0.5 to 1.0
LPM.
To prevent condensation, use a dew point temperature several degrees below theambient temperature.
14. Click theManual tab, and note the present value of the H2O Span value Sw.
Go back to the Span tab and enter the span gas dew point temperature in the Dewpoint temperature field.
15. Observe the H2O dew point in the dashboard and wait for it to stabilize.
The Gas Stability flag will turn from a red ‘X’ to a green flag when it is OK to per-form the calibration. This may take up to 15 or 20 minutes.
16. When the reading has stabilized, click Span H2O.
Click the Manual tab again and note the new H2O Span value Sw (typically 0.9-1.1).
Section 4. Calibration
4-7Step-by-Step Calibration Instructions
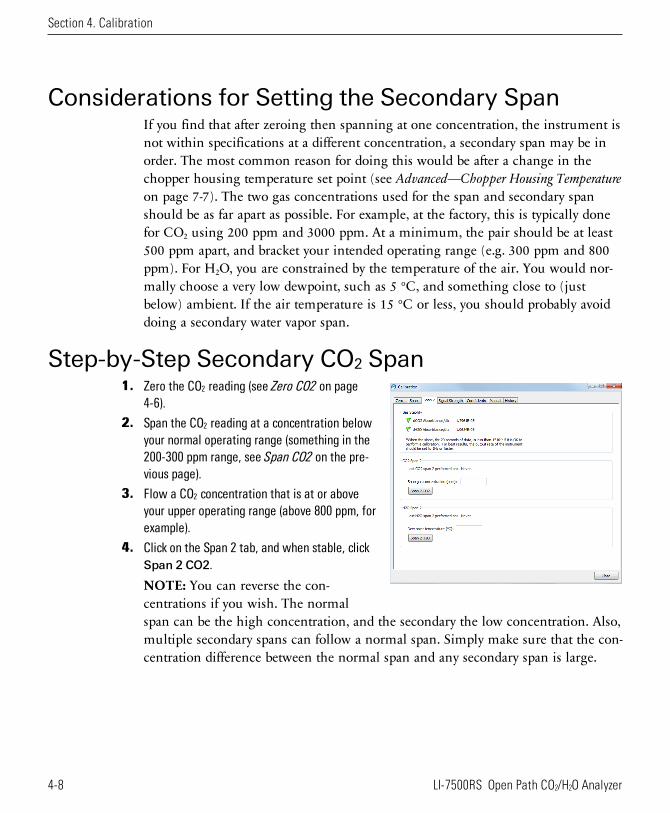
Section 4. Calibration
Considerations for Setting the Secondary SpanIf you find that after zeroing then spanning at one concentration, the instrument isnot within specifications at a different concentration, a secondary span may be inorder. The most common reason for doing this would be after a change in thechopper housing temperature set point (see Advanced—Chopper Housing Temperatureon page 7-7). The two gas concentrations used for the span and secondary spanshould be as far apart as possible. For example, at the factory, this is typically donefor CO2 using 200 ppm and 3000 ppm. At a minimum, the pair should be at least500 ppm apart, and bracket your intended operating range (e.g. 300 ppm and 800ppm). For H2O, you are constrained by the temperature of the air. You would nor-mally choose a very low dewpoint, such as 5 °C, and something close to (justbelow) ambient. If the air temperature is 15 °C or less, you should probably avoiddoing a secondary water vapor span.
Step-by-Step Secondary CO2 Span1. Zero the CO2 reading (see Zero CO2 on page
4-6).
2. Span the CO2 reading at a concentration belowyour normal operating range (something in the200-300 ppm range, see Span CO2 on the pre-vious page).
3. Flow a CO2 concentration that is at or aboveyour upper operating range (above 800 ppm, forexample).
4. Click on the Span 2 tab, and when stable, clickSpan 2 CO2.
NOTE: You can reverse the con-centrations if you wish. The normalspan can be the high concentration, and the secondary the low concentration. Also,multiple secondary spans can follow a normal span. Simply make sure that the con-centration difference between the normal span and any secondary span is large.
4-8 LI-7500RS Open Path CO2/H2O Analyzer
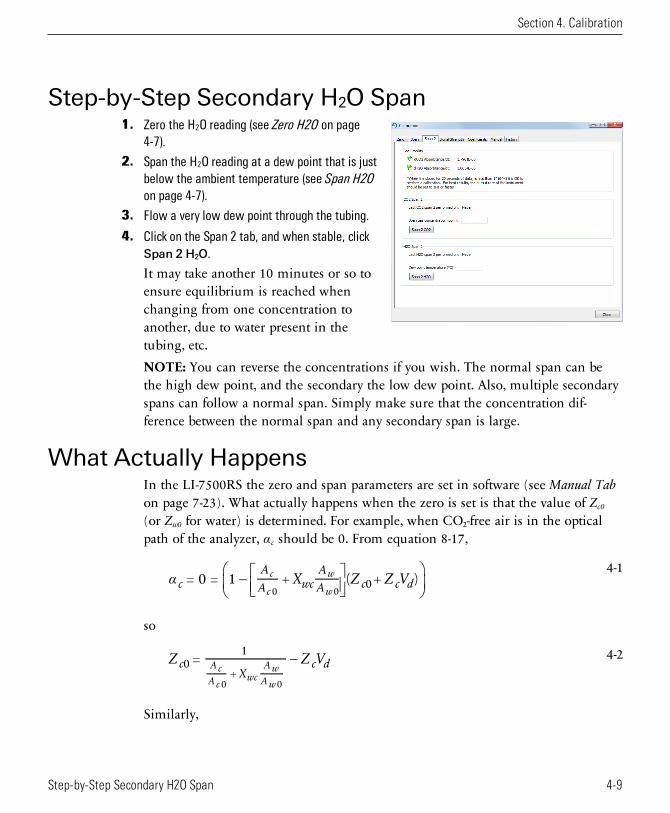
Step-by-Step Secondary H2O Span1. Zero the H2O reading (see Zero H2O on page
4-7).
2. Span the H2O reading at a dew point that is justbelow the ambient temperature (see Span H2Oon page 4-7).
3. Flow a very low dew point through the tubing.
4. Click on the Span 2 tab, and when stable, clickSpan 2 H2O.
It may take another 10 minutes or so toensure equilibrium is reached whenchanging from one concentration toanother, due to water present in thetubing, etc.NOTE: You can reverse the concentrations if you wish. The normal span can bethe high dew point, and the secondary the low dew point. Also, multiple secondaryspans can follow a normal span. Simply make sure that the concentration dif-ference between the normal span and any secondary span is large.
What Actually HappensIn the LI-7500RS the zero and span parameters are set in software (see Manual Tabon page 7-23). What actually happens when the zero is set is that the value of Zc0
(or Zw0 for water) is determined. For example, when CO2-free air is in the opticalpath of the analyzer, α c should be 0. From equation 8-17,
4-1X Z Z V= 0 = 1 + ( + )c
A
A wc
A
A c c d0c
c
w
w0 0
−
α
so
4-2Z Z V=cX
c d0
1
+Ac
A cwc
Aw
Aw0 0
−
Similarly,
Section 4. Calibration
4-9Step-by-Step Secondary H2O Span
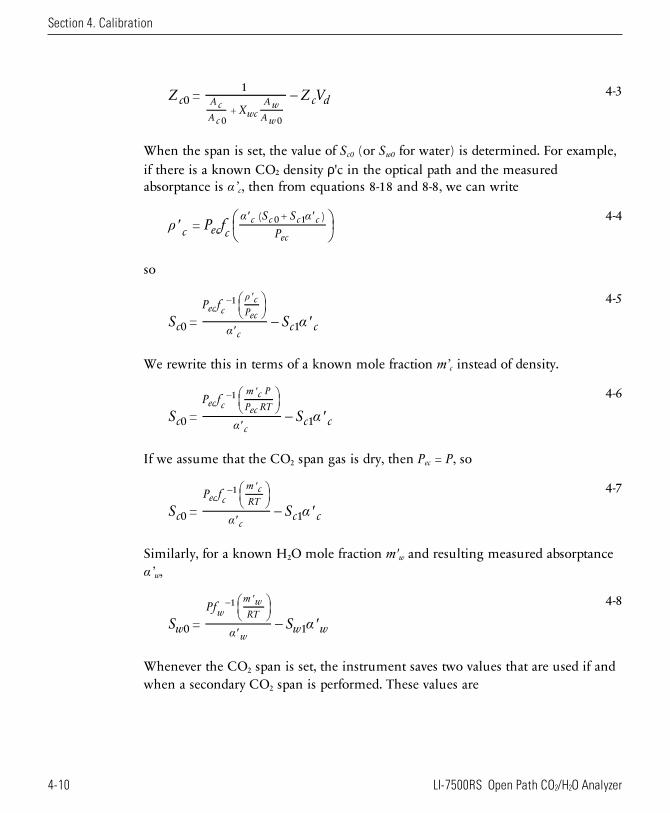
Section 4. Calibration
4-3Z Z V=cX
c d0
1
+Ac
A cwc
Aw
Aw0 0
−
When the span is set, the value of Sc0 (or Sw0 for water) is determined. For example,if there is a known CO2 density ρ'c in the optical path and the measuredabsorptance is α ’c, then from equations 8-18 and 8-8, we can write
4-4P f=c ec c
S S
P
( + )c c c c
ec
0 1 ′
′ ′ρ
α α
so
4-5
S S=c
P f
c c0 1
ec cc
Pec
c
1
− ′
′
− ′
αα
ρ
We rewrite this in terms of a known mole fraction m’c instead of density.
4-6
S S=c
P f
c c0 1
ec c
m c P
Pec RT
c
1
− ′
′
− ′
αα
If we assume that the CO2 span gas is dry, then Pec = P, so
4-7
S S=c
P f
c c0 1
ec c
m c
RT
c
1
− ′
′
− ′
αα
Similarly, for a known H2O mole fraction m'w and resulting measured absorptanceα ’w,
4-8
S S=w
Pf
w w0 1
w
m w
RT
w
1
− ′
′
− ′
αα
Whenever the CO2 span is set, the instrument saves two values that are used if andwhen a secondary CO2 span is performed. These values are
4-10 LI-7500RS Open Path CO2/H2O Analyzer
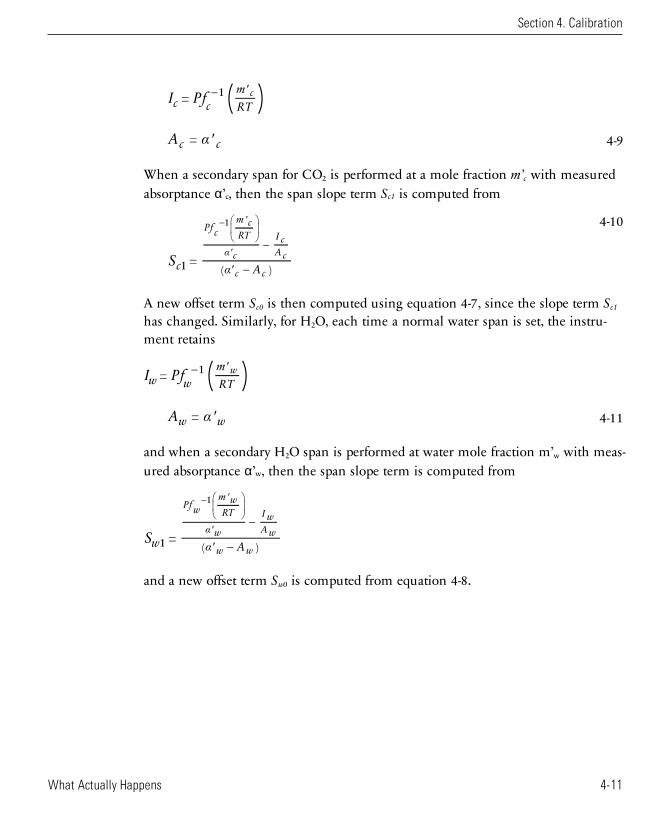
( )I Pf=c c
m
RT1 c− ′
4-9A =c c′α
When a secondary span for CO2 is performed at a mole fraction m’c with measuredabsorptance α’c, then the span slope term Sc1 is computed from
4-10
S =c A1 ( )
Pfcm c
RT
c
I cA c
c c
1
−
′ −
−
′
′
α
α
A new offset term Sc0 is then computed using equation 4-7, since the slope term Sc1
has changed. Similarly, for H2O, each time a normal water span is set, the instru-ment retains
( )I Pf=w w
m
RT1 w− ′
4-11A =w w′α
and when a secondary H2O span is performed at water mole fraction m’w with meas-ured absorptance α’w, then the span slope term is computed from
S =w A1 ( )
Pfwm w
RT
w
I wAw
w w
1
−
′ −
−
′
′
α
α
and a new offset term Sw0 is computed from equation 4-8.
Section 4. Calibration
4-11What Actually Happens

Section 4. Calibration
4-12 LI-7500RS Open Path CO2/H2O Analyzer
Section 5. MaintenanceThe section describes maintenance procedures. A good maintenance plan willensure good performance of the instrument, reduce data gaps, and give you greaterconfidence that the measurements truthfully represent physical processes. FluxSuiteSoftware can help immensely with your maintenance plan.1
Schedule
When you first deploy the instrument:Check the signal strength and record this for a baseline. This will help you determ-ine when the optics should be cleaned.
Every day or every few days:Check the overall performance of the instruments, including the measured valuesand diagnostic information. This will ensure that you don't lose data (or that youlose less data) if something is wrong.Check the measured values. Air temperature, pressure, sonic temperature, dewpoint, gas concentrations, covariances and fluxes. Any unexpected readings mayindicate an issue.Check the diagnostics. Signal strength, detector temperature, chopper housing tem-perature, and thermocouples.
Once per week:Check the signal strength. There is no absolute guideline for good or bad signalstrength, but 100% is very good and 0% is very bad. If the signal strength hasdropped it is a good idea to clean the optics. Over time you'll learn how often youneed to check the signal strength. Typically it is much less often than once perweek.
1Please forgive this shameless plug. But do check out www.fluxsuite.com.
5-1LI-7500RS Open Path CO2/H2O Analyzer
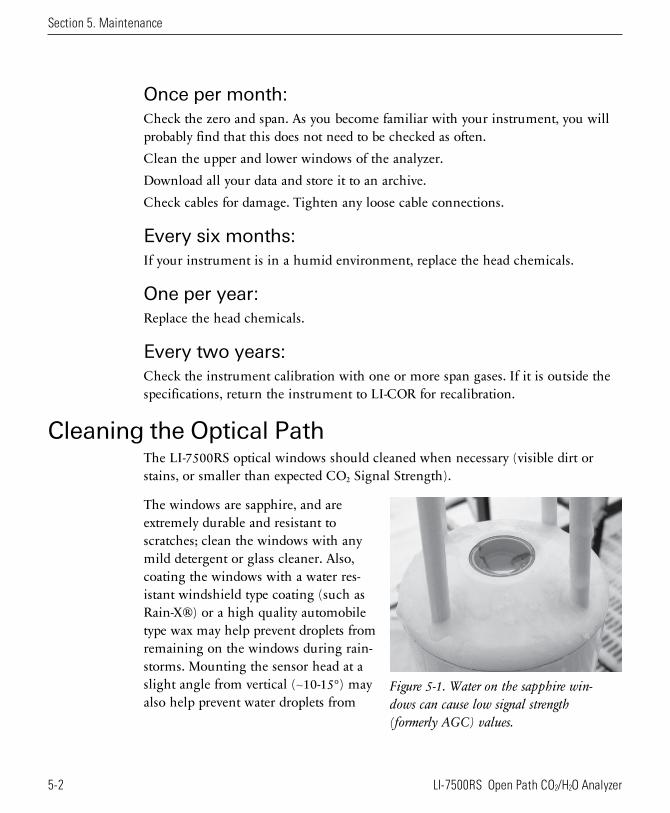
Section 5. Maintenance
Once per month:Check the zero and span. As you become familiar with your instrument, you willprobably find that this does not need to be checked as often.Clean the upper and lower windows of the analyzer.Download all your data and store it to an archive.Check cables for damage. Tighten any loose cable connections.
Every six months:If your instrument is in a humid environment, replace the head chemicals.
One per year:Replace the head chemicals.
Every two years:Check the instrument calibration with one or more span gases. If it is outside thespecifications, return the instrument to LI-COR for recalibration.
Cleaning the Optical PathThe LI-7500RS optical windows should cleaned when necessary (visible dirt orstains, or smaller than expected CO2 Signal Strength).
Figure 5-1. Water on the sapphire win-dows can cause low signal strength(formerly AGC) values.
The windows are sapphire, and areextremely durable and resistant toscratches; clean the windows with anymild detergent or glass cleaner. Also,coating the windows with a water res-istant windshield type coating (such asRain-X®) or a high quality automobiletype wax may help prevent droplets fromremaining on the windows during rain-storms. Mounting the sensor head at aslight angle from vertical (~10-15°) mayalso help prevent water droplets from
5-2 LI-7500RS Open Path CO2/H2O Analyzer
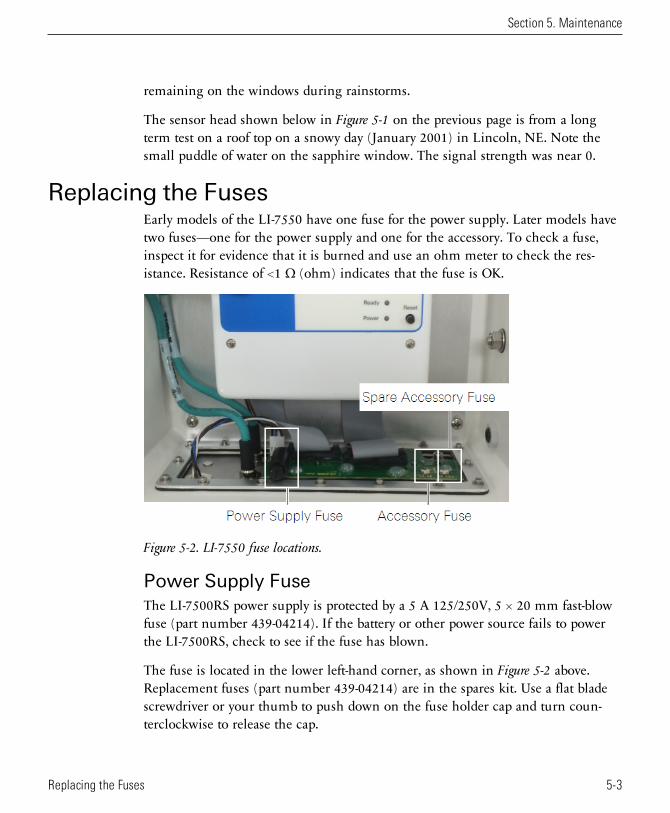
remaining on the windows during rainstorms.
The sensor head shown below in Figure 5-1 on the previous page is from a longterm test on a roof top on a snowy day (January 2001) in Lincoln, NE. Note thesmall puddle of water on the sapphire window. The signal strength was near 0.
Replacing the FusesEarly models of the LI-7550 have one fuse for the power supply. Later models havetwo fuses—one for the power supply and one for the accessory. To check a fuse,inspect it for evidence that it is burned and use an ohm meter to check the res-istance. Resistance of <1 Ω (ohm) indicates that the fuse is OK.
Figure 5-2. LI-7550 fuse locations.
Power Supply FuseThe LI-7500RS power supply is protected by a 5 A 125/250V, 5 × 20 mm fast-blowfuse (part number 439-04214). If the battery or other power source fails to powerthe LI-7500RS, check to see if the fuse has blown.
The fuse is located in the lower left-hand corner, as shown in Figure 5-2 above.Replacement fuses (part number 439-04214) are in the spares kit. Use a flat bladescrewdriver or your thumb to push down on the fuse holder cap and turn coun-terclockwise to release the cap.
Section 5. Maintenance
5-3Replacing the Fuses
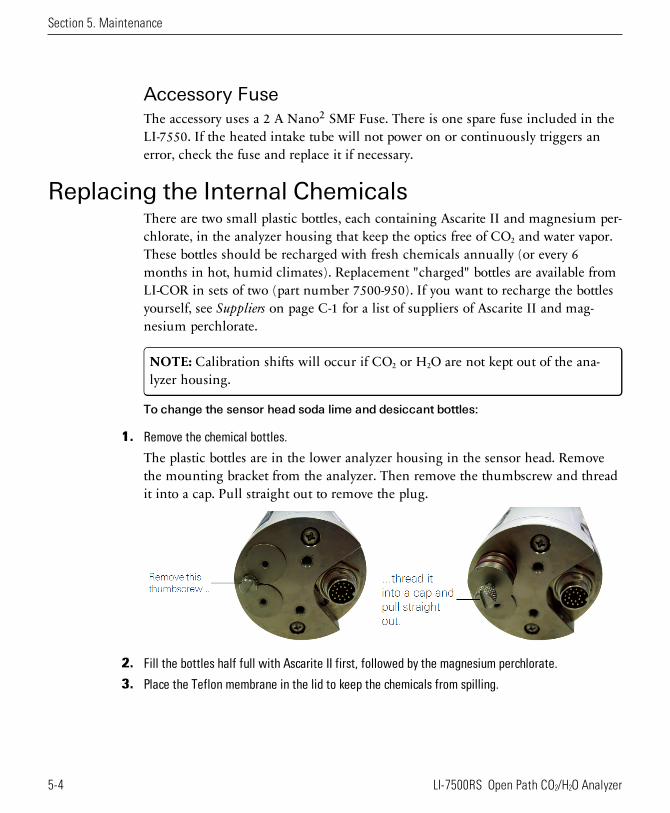
Section 5. Maintenance
Accessory FuseThe accessory uses a 2 A Nano2 SMF Fuse. There is one spare fuse included in theLI-7550. If the heated intake tube will not power on or continuously triggers anerror, check the fuse and replace it if necessary.
Replacing the Internal ChemicalsThere are two small plastic bottles, each containing Ascarite II and magnesium per-chlorate, in the analyzer housing that keep the optics free of CO2 and water vapor.These bottles should be recharged with fresh chemicals annually (or every 6months in hot, humid climates). Replacement "charged" bottles are available fromLI-COR in sets of two (part number 7500-950). If you want to recharge the bottlesyourself, see Suppliers on page C-1 for a list of suppliers of Ascarite II and mag-nesium perchlorate.
NOTE: Calibration shifts will occur if CO2 or H2O are not kept out of the ana-lyzer housing.
To change the sensor head soda lime and desiccant bottles:
1. Remove the chemical bottles.
The plastic bottles are in the lower analyzer housing in the sensor head. Removethe mounting bracket from the analyzer. Then remove the thumbscrew and threadit into a cap. Pull straight out to remove the plug.
2. Fill the bottles half full with Ascarite II first, followed by the magnesium perchlorate.
3. Place the Teflon membrane in the lid to keep the chemicals from spilling.
5-4 LI-7500RS Open Path CO2/H2O Analyzer
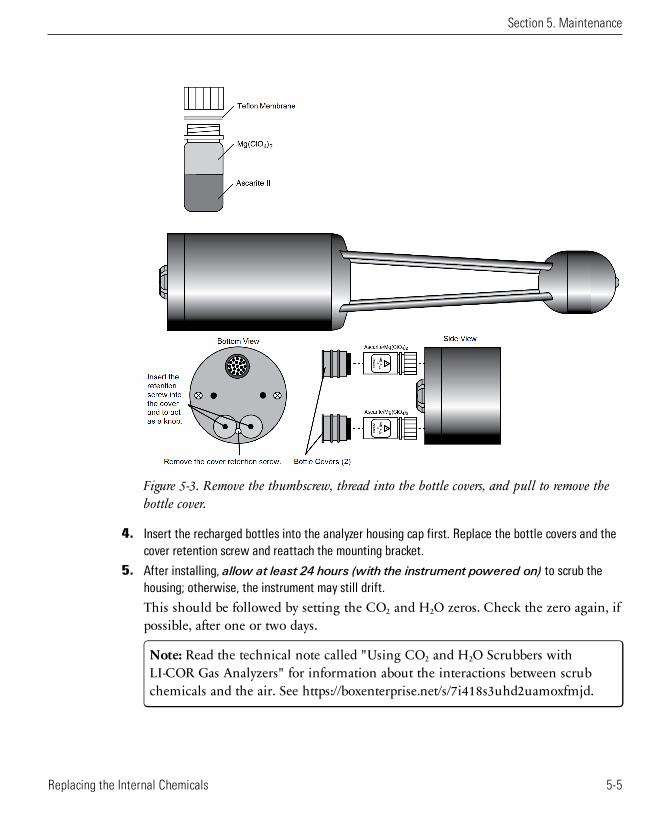
Figure 5-3. Remove the thumbscrew, thread into the bottle covers, and pull to remove thebottle cover.
4. Insert the recharged bottles into the analyzer housing cap first. Replace the bottle covers and thecover retention screw and reattach the mounting bracket.
5. After installing, allow at least 24 hours (with the instrument powered on) to scrub thehousing; otherwise, the instrument may still drift.
This should be followed by setting the CO2 and H2O zeros. Check the zero again, ifpossible, after one or two days.
Note: Read the technical note called "Using CO2 and H2O Scrubbers withLI-COR Gas Analyzers" for information about the interactions between scrubchemicals and the air. See https://boxenterprise.net/s/7i418s3uhd2uamoxfmjd.
Section 5. Maintenance
5-5Replacing the Internal Chemicals

Section 5. Maintenance
5-6 LI-7500RS Open Path CO2/H2O Analyzer
Section 6. TroubleshootingWe address common problems in this section.
Power On ProblemsAdequate power supply? The instrument requires between 11.5 and 30 VDC (up to30 W) to start up and 10 to 30 VDC (about 10 W) during normal operation. If thePower LED blinks the power supply is not sufficient to start up the instrument.Measure the voltage at the 4-pin connector inside the LI-7550 (rather than thevoltage at the battery bank). The blue/black leads are positive (+), the brown/whiteleads are negative (-). If voltage at the connector is below 11.5 VDC, shorten thelength of the power cable if possible, or boost the voltage.
Loose connection? Make sure the power cable connector is tight. Also check thecable for damage and the connections to the power supply.
Blown fuse? Check the fuse, as described in Replacing the Fuses on page 5-3. Notethat a blown fuse usually indicates some other problem. If the fuse blowsrepeatedly, carefully check the wiring.
Ethernet Connection ProblemsMost Ethernet problems are related to firewalls or network settings.
Instrument not visible in softwareFirewall rules prohibiting the connection? Attempt to connect to the gas analyzerusing the RS-232 connection. If you are able to connect as expected, the problemmay be related to your computer firewall settings. In this case, you’ll need to createan exception that allows the gas analyzer through the firewall. If you are using theWindows® firewall, follow the instructions provided by Microsoft® at win-dows.microsoft.com/en-us/windows/open-port-windows-firewall. If you are usinganother firewall, refer to documentation provided with that software.
6-1LI-7500RS Open Path CO2/H2O Analyzer
Section 6. Troubleshooting
Instrument network settings incompatible with computer or local area network set-tings? If the instrument IP address is set to Static, you probably will not be able toconnect to the instrument over a network unless you change the instrument IPaddress to Dynamic (Obtain IP address automatically). See Network on page 7-4.Alternatively, connect to the instrument using the RS-232 serial connection.
RS-232 serial connection problemsWhen connecting with RS-232 serial, the Connect button in the PC software iscauses the program sets a break condition on the communication line, signalingthe instrument to change to 9600 baud and send its current configuration. The PCthen sends the desired configuration (update rate, baud rate, etc.) back to the instru-ment. Both instruments then change to the desired baud rate, and operations begin.When the Disconnect button is clicked, the PC signals to the instrument to changeits RS-232 configuration back to what it was originally (or to that set up in the RS-232 panel).
"Port in use or does not exist"Correct COM port selected? This message indicates that the COM port setting onthe Connect page is either incorrect, or else that COM port is already in use bysome other program. If you are sure that the COM port is correct, and there is noth-ing else running, try rebooting the instrument.
"Not able to connect successfully"Click Connect again. Sometimes it takes a couple of attempts. If repeated attemptsfail, then make sure the correct COM port is selected. Make sure the instrument ispowered and running and see if the LED lights for about 5 seconds.
“Parse Error”Incompatible PC and instrument software? Install new PC and instrument software(see Software Updates on page 7-33).
Baud rate and update rate incompatible? In the Connect window, the Baud Ratemenu is used to set the baud rate at which to communicate with the instrument.The rate of data transfer is also dependent upon the maximum rate available with
6-2 LI-7500RS Open Path CO2/H2O Analyzer
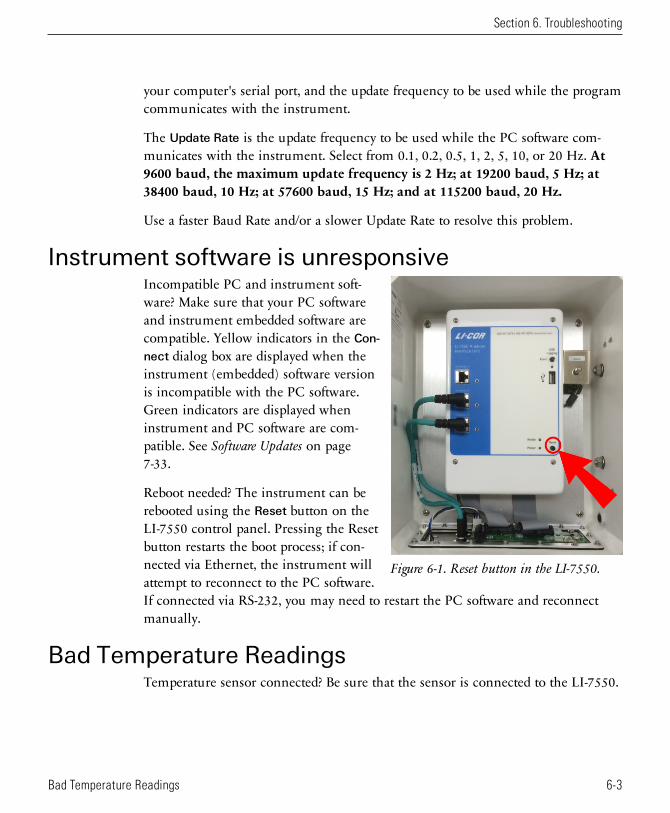
your computer's serial port, and the update frequency to be used while the programcommunicates with the instrument.
The Update Rate is the update frequency to be used while the PC software com-municates with the instrument. Select from 0.1, 0.2, 0.5, 1, 2, 5, 10, or 20 Hz. At9600 baud, the maximum update frequency is 2 Hz; at 19200 baud, 5 Hz; at38400 baud, 10 Hz; at 57600 baud, 15 Hz; and at 115200 baud, 20 Hz.
Use a faster Baud Rate and/or a slower Update Rate to resolve this problem.
Instrument software is unresponsive
Figure 6-1. Reset button in the LI-7550.
Incompatible PC and instrument soft-ware? Make sure that your PC softwareand instrument embedded software arecompatible. Yellow indicators in the Con-nect dialog box are displayed when theinstrument (embedded) software versionis incompatible with the PC software.Green indicators are displayed wheninstrument and PC software are com-patible. See Software Updates on page7-33.
Reboot needed? The instrument can berebooted using the Reset button on theLI-7550 control panel. Pressing the Resetbutton restarts the boot process; if con-nected via Ethernet, the instrument willattempt to reconnect to the PC software.If connected via RS-232, you may need to restart the PC software and reconnectmanually.
Bad Temperature ReadingsTemperature sensor connected? Be sure that the sensor is connected to the LI-7550.
Section 6. Troubleshooting
6-3Bad Temperature Readings
Section 6. Troubleshooting
Bad Pressure ReadingsPressure source set incorrectly? You can select the source of pressure meas-urements, as described in Auxiliary Inputs on page 7-10. If the source is Measured,the readings come from the pressure sensor inside the LI-7550. If the source is Aux-iliary Input 2 , then the pressure is from an external sensor that you have connected.This signal is modified according to the Auxiliary Coefficients that appear on thatsame page. If the source is User-Entered, then whatever you enter manually in thetext box is used for the value.
Instrument pressure doesn't match your barometer? The pressure sensor in theLI-7550 is good to about 0.1%. For operating purposes, it doesn't need to be verygood (see A Note About Pressure And Temperature on page 8-7). When setting thespan(s) of the instrument, however, it is more important.
Bad CO2 or H2O ReadingsCalibration coefficients correct? Make sure all of the coefficients on LI-7500RS > Cal-
ibration > Coefficients match the calibration sheet for the head. You can get yourcalibration information from the LI-COR web site. The Band Broadening coef-ficient should be 1.15.
Signal strength OK? Under the Diagnostics page and check the values of SignalStrength. Even if the signal strength is good, you may need to clean the optical win-dows.
Are any of the diagnostic flags (PLL, etc.) OK? Under Diagnostics, check the dia-gnostics. See Diagnostic Messages on page 7-25 for more information.
Zero and Span OK? Go to the Calibration page and make sure the current values ofzero and span are near 1.
Absorptances Make Sense, Densities Don'tIf the absorptance value seems correct (rough rule of thumb: absorptance = 0 whendensity = 0, CO2 absorptance is about 0.1 with a mole fraction of about 400 ppm,and H2O absorptance is about 0.1 with a mole fraction of about 20 mmol/mol), butthe displayed values of density or mole fraction are obviously bad, then the problem
6-4 LI-7500RS Open Path CO2/H2O Analyzer
is in one of the following: calibration coefficients, span parameter, pressure value,and the band broadening value (CO2 only).
Readings Very NoisyPut the calibration tube in place to dampen the natural fluctuations. You don'tneed a gas flowing through the tube. The variability in absorptance values shouldbe low, with only the 4th decimal place changing once in a while. If density ormole fraction is still noisy, watch the temperature and pressure values to see if theyare the source of the noise (or change to a hand entered, constant value to try this).Check the calibration coefficients and band broadening value (if the problem iswith CO2) to make sure they are correct.
Section 6. Troubleshooting
6-5Bad CO2 or H2O Readings

Section 6. Troubleshooting
6-6 LI-7500RS Open Path CO2/H2O Analyzer
Section 7. Software ReferenceThis section describes features that have not been described elsewhere.
SettingsUnder Settings, you can set the instrument time, network configuration, send com-mands, change the chopper housing temperature set point, and integrate CO2 meas-urements.
TimeThis is where you set theinstrument time and date.The clock in the LI-7550Analyzer Interface Unit usesthe Precision Time Protocol(PTP) time keeping system.PTP is a high precisiontime synchronization pro-tocol for networked devices.Devices controlled withPTP can maintain accuracyin the sub-microsecondrange with a sufficientlyaccurate master clock. PTPis defined in the IEEE 1588-2002 and 1588-2008 standards, entitled “Standards for Precision Clock Syn-chronization Protocol for Networked Measurement and Control Systems.” Adetailed summary of IEEE-1588 is available at www.ieee1588.com. Full doc-umentation is available for purchase from the Institute of Electrical and ElectronicsEngineers (IEEE) at www.ieee.org.
7-1LI-7500RS Open Path CO2/H2O Analyzer
Section 7. Software Reference
The basic principle behind PTP is that the best time keeping can be accomplishedwith multiple networked devices by synchronizing all device clocks to the most pre-cise clock on the network. Each clock on the network has a rating that indicates itsrelative accuracy. The IEEE 1588 protocol specifies the use of a Best Master Clockalgorithm to determine which clock on the network is the most accurate. On a net-work, the most accurate clock becomes the master clock and all other clocks syncto the master clock.
The software implementation of PTP in the LI-7550 provides accuracy in the 10microsecond range. Implementation of PTP is most important when theLI-7550 is used in combination with other network-based sensors such as theLI-7700 Open Path CH4 Analyzer. When used with the SMARTFlux System, the GPSclocks will become the master clock for the system.
About LI-7500RS Time KeepingThe LI-7500RS is a network-based instrument and it is possible for multiple usersto log data from a single instrument over multiple TCP/IP connections via theLI-7550 Analyzer Interface Unit. Consequently, the analyzer uses CoordinatedUniversal Time (UTC) for its onboard timekeeping tasks. The default time stamp istherefore UTC based, but local time can be set, if desired.
Generally, we recommended that the system synchronizes its time the GPS clocks.The LI-7500RS uses a time zone database that includes local time zones that arekept as constant offset from UTC. These time zones are listed as ‘Etc/GMT’ + offset.However, these time zone names beginning with ‘Etc/GMT’ have their signreversed from what is commonly used. Thus, zones west of GMT have a positivesign, and those east have a negative sign. For example, US/Central Standard Time is6 hours behind GMT, and in the database this time zone is listed as ‘Etc/GMT-6’.
Unix time is the number of seconds elapsed since the Unix epoch of 00:00 Coordin-ated Universal Time (UTC) January 1, 1970 (or 1970-01-01T00:00:0Z ISO 8601).For example, the time stamp 1262884605 translates to 01/07/2010 at 05:16:45 UTC.The date and time are converted to a conventional display format (YYYY-MM-DD;HH:MM:SS) and adjusted based on the time zone setting that you select.
The time stamp in each file header shows the instrument time and time zone.
7-2 LI-7500RS Open Path CO2/H2O Analyzer
Setting the Clock1. Connect to the LI-7500RS.
2. Open the Settings dialog box.
3. Set the Clock Sync (PTP).
4. Choose your time zone.
5. ClickApply or OK.
The PTP clock settings available are:
l Off: Turns PTP time keeping system off. Instrument time will be determined bythe Date and Time set by the user, even if there is a better clock on the network.
l Automatic: The LI-7550 searches the network and syncs to the most accurateclock using the Best Master Clock algorithm (could be LI-7550). This settingshould be used in most circumstances.
l Slave Only: The LI-7550 always syncs to another clock. It will search the net-work and synchronize to the best clock.
l Preferred: The LI-7550 uses its own internal clock unless it finds a better clockon the network.
When connecting the LI-7500RS/LI-7550 to the LI-7700 CH4 Analyzer (see EnteringLI-7700 Information on page 3-30 ), or to the 9210B datalogger (see Entering BiometSystem Information on page 3-33) we recommend that you set the LI-7550 to Pre-ferred, and the LI-7700 and/or 9210B to Automatic.
Section 7. Software Reference
7-3Time
Section 7. Software Reference
NetworkBy default, the instrumentname that appears in theEthernet Connect dialog isthe Analyzer Interface Unitprefix and its associatedserial number (e.g., AIU-0650). You can change thisname in Settings > Net-
work.
The IP address (InternetProtocol) is a numericalidentifier that is assigned todevices participating in acomputer network. Inmany cases this address isassigned automatically (Dynamic IP address). In other cases, your network admin-istrator may assign a permanent address (Static IP address) that can be enteredmanually.
If you enable the ‘Obtain an IP address automatically’ radio button, the IP address,Subnet mask, and Default Gateway fields are filled in automatically; if you chooseto enter the IP address manually, the address fields are editable.
The Subnet mask is a set of 4 octets used to separate an IP address into two parts;the network address and the host address. The Gateway is a node that routes trafficto another network.
Manual AddressingAlternatively, you can manually enter the IPv4 Address or Hostname (if known) ofthe instrument to which you want to connect. The IP address can be obtained auto-matically or assigned manually in the Settings dialog box. If IPv6 (Internet Pro-tocol version 6) addressing is available on the network and enabled on thecomputer, the instrument’s IPv6 address is displayed as well.
7-4 LI-7500RS Open Path CO2/H2O Analyzer
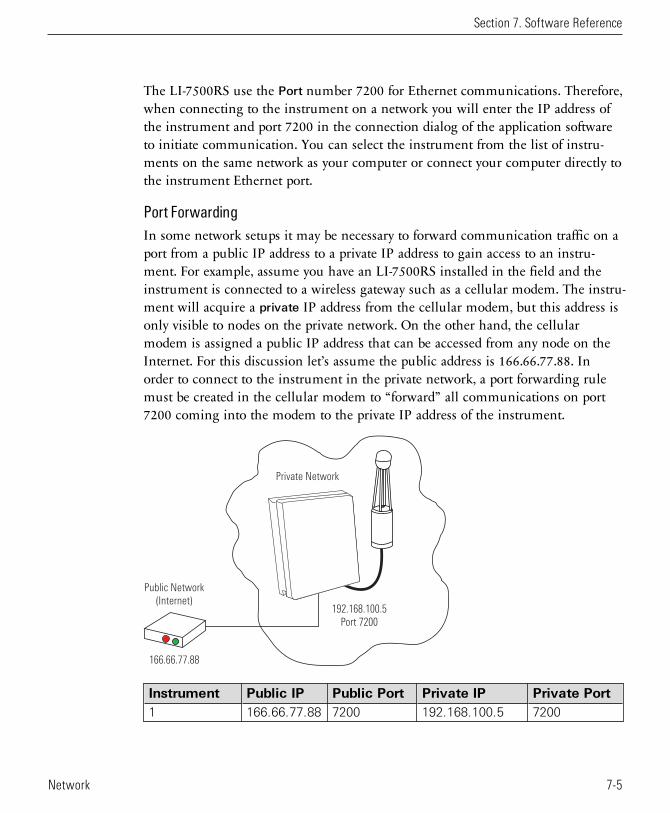
The LI-7500RS use the Port number 7200 for Ethernet communications. Therefore,when connecting to the instrument on a network you will enter the IP address ofthe instrument and port 7200 in the connection dialog of the application softwareto initiate communication. You can select the instrument from the list of instru-ments on the same network as your computer or connect your computer directly tothe instrument Ethernet port.
Port ForwardingIn some network setups it may be necessary to forward communication traffic on aport from a public IP address to a private IP address to gain access to an instru-ment. For example, assume you have an LI-7500RS installed in the field and theinstrument is connected to a wireless gateway such as a cellular modem. The instru-ment will acquire a private IP address from the cellular modem, but this address isonly visible to nodes on the private network. On the other hand, the cellularmodem is assigned a public IP address that can be accessed from any node on theInternet. For this discussion let’s assume the public address is 166.66.77.88. Inorder to connect to the instrument in the private network, a port forwarding rulemust be created in the cellular modem to “forward” all communications on port7200 coming into the modem to the private IP address of the instrument.
Public Network
(Internet)
Private Network
166.66.77.88
192.168.100.5
Port 7200
Instrument Public IP Public Port Private IP Private Port1 166.66.77.88 7200 192.168.100.5 7200
Section 7. Software Reference
7-5Network
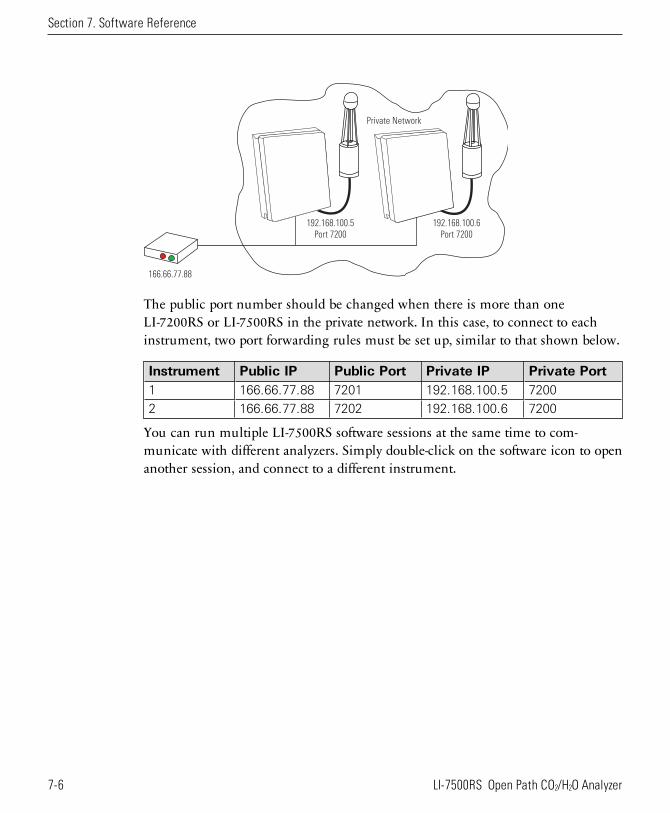
Section 7. Software Reference
Private Network
166.66.77.88
192.168.100.5
Port 7200
192.168.100.6
Port 7200
The public port number should be changed when there is more than oneLI-7200RS or LI-7500RS in the private network. In this case, to connect to eachinstrument, two port forwarding rules must be set up, similar to that shown below.
Instrument Public IP Public Port Private IP Private Port1 166.66.77.88 7201 192.168.100.5 7200
2 166.66.77.88 7202 192.168.100.6 7200
You can run multiple LI-7500RS software sessions at the same time to com-municate with different analyzers. Simply double-click on the software icon to openanother session, and connect to a different instrument.
7-6 LI-7500RS Open Path CO2/H2O Analyzer
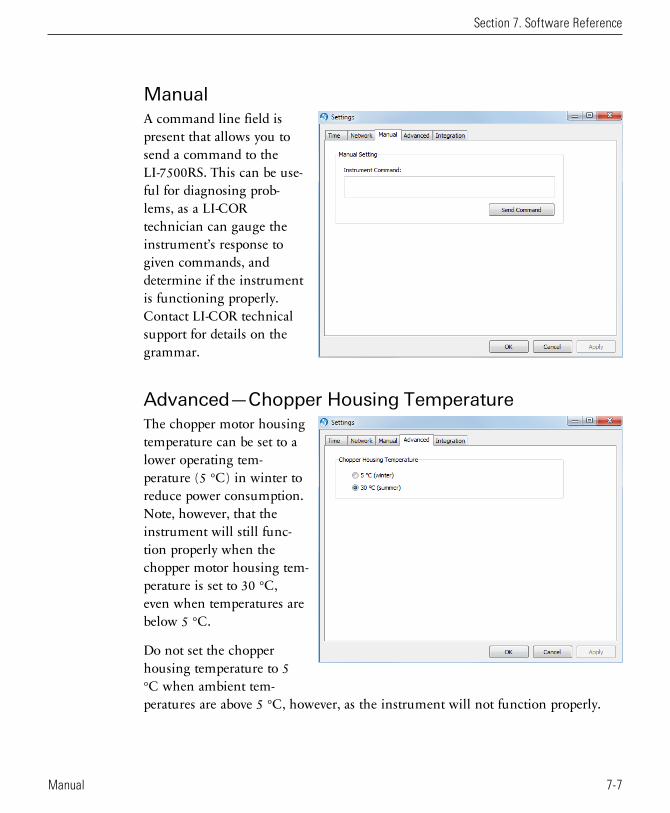
ManualA command line field ispresent that allows you tosend a command to theLI-7500RS. This can be use-ful for diagnosing prob-lems, as a LI-CORtechnician can gauge theinstrument’s response togiven commands, anddetermine if the instrumentis functioning properly.Contact LI-COR technicalsupport for details on thegrammar.
Advanced—Chopper Housing TemperatureThe chopper motor housingtemperature can be set to alower operating tem-perature (5 °C) in winter toreduce power consumption.Note, however, that theinstrument will still func-tion properly when thechopper motor housing tem-perature is set to 30 °C,even when temperatures arebelow 5 °C.
Do not set the chopperhousing temperature to 5°C when ambient tem-peratures are above 5 °C, however, as the instrument will not function properly.
Section 7. Software Reference
7-7Manual
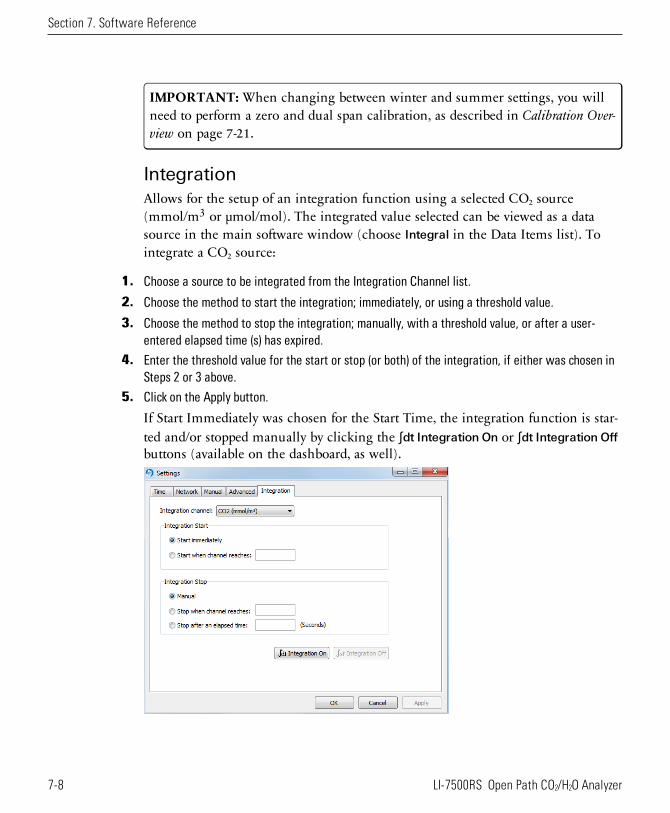
Section 7. Software Reference
IMPORTANT: When changing between winter and summer settings, you willneed to perform a zero and dual span calibration, as described in Calibration Over-view on page 7-21.
IntegrationAllows for the setup of an integration function using a selected CO2 source(mmol/m3 or µmol/mol). The integrated value selected can be viewed as a datasource in the main software window (choose Integral in the Data Items list). Tointegrate a CO2 source:
1. Choose a source to be integrated from the Integration Channel list.
2. Choose the method to start the integration; immediately, or using a threshold value.
3. Choose the method to stop the integration; manually, with a threshold value, or after a user-entered elapsed time (s) has expired.
4. Enter the threshold value for the start or stop (or both) of the integration, if either was chosen inSteps 2 or 3 above.
5. Click on the Apply button.
If Start Immediately was chosen for the Start Time, the integration function is star-ted and/or stopped manually by clicking the ∫dt Integration On or ∫dt Integration Offbuttons (available on the dashboard, as well).
7-8 LI-7500RS Open Path CO2/H2O Analyzer
Example: Start integrating CO2 (µmol/mol) after it reaches a value of 500 µmolmol-1, and continue integrating for 5 minutes.
6. Choose CO2 (µmol/m3) from the Integration Channel list.
7. Click the Start when channel reaches radio button and enter 500 in the text entry field.
8. Click the Stop after an elapsed time radio button and enter 300 (seconds) in the text entryfield.
9. ClickApply.
10. Click the ∫dt Integration On button. ClickOK to dismiss the dialog.
The integration result (area under the curve) can be viewed in the dashboard.
Section 7. Software Reference
7-9Integration
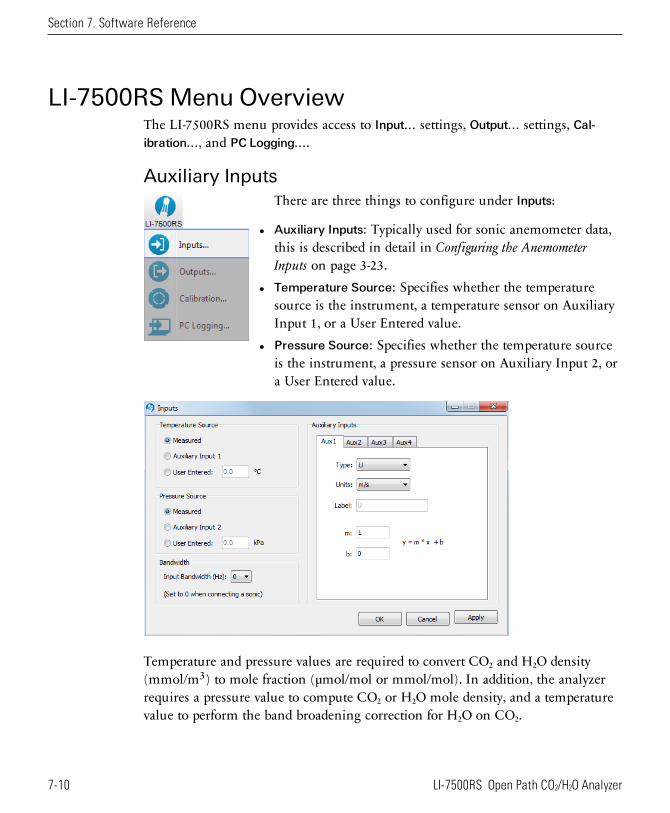
Section 7. Software Reference
LI-7500RS Menu OverviewThe LI-7500RS menu provides access to Input... settings, Output... settings, Cal-ibration..., and PC Logging....
Auxiliary InputsThere are three things to configure under Inputs:
l Auxiliary Inputs: Typically used for sonic anemometer data,this is described in detail in Configuring the AnemometerInputs on page 3-23.
l Temperature Source: Specifies whether the temperaturesource is the instrument, a temperature sensor on AuxiliaryInput 1, or a User Entered value.
l Pressure Source: Specifies whether the temperature sourceis the instrument, a pressure sensor on Auxiliary Input 2, ora User Entered value.
Temperature and pressure values are required to convert CO2 and H2O density(mmol/m3) to mole fraction (µmol/mol or mmol/mol). In addition, the analyzerrequires a pressure value to compute CO2 or H2O mole density, and a temperaturevalue to perform the band broadening correction for H2O on CO2.
7-10 LI-7500RS Open Path CO2/H2O Analyzer
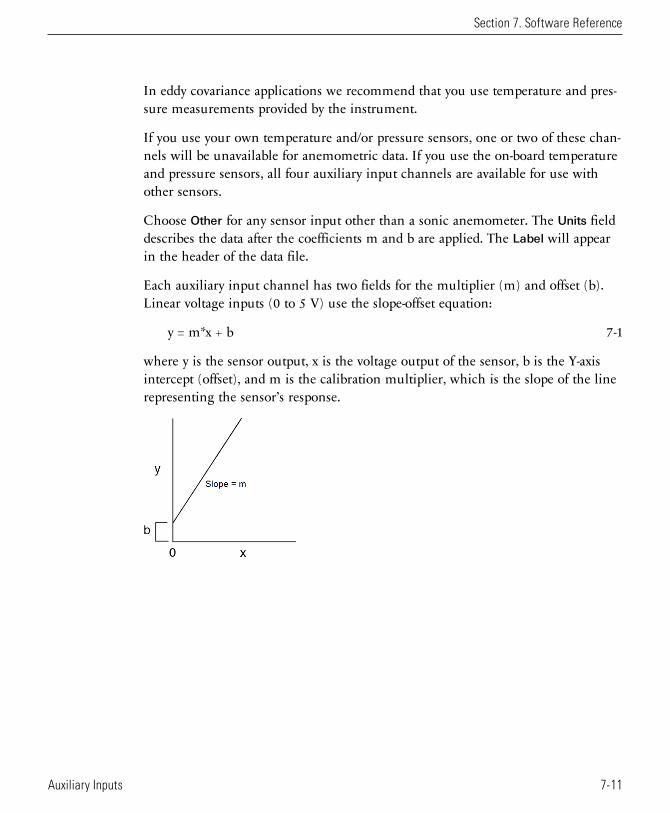
In eddy covariance applications we recommend that you use temperature and pres-sure measurements provided by the instrument.
If you use your own temperature and/or pressure sensors, one or two of these chan-nels will be unavailable for anemometric data. If you use the on-board temperatureand pressure sensors, all four auxiliary input channels are available for use withother sensors.
Choose Other for any sensor input other than a sonic anemometer. The Units fielddescribes the data after the coefficients m and b are applied. The Label will appearin the header of the data file.
Each auxiliary input channel has two fields for the multiplier (m) and offset (b).Linear voltage inputs (0 to 5 V) use the slope-offset equation:
7-1y = m*x + b
where y is the sensor output, x is the voltage output of the sensor, b is the Y-axisintercept (offset), and m is the calibration multiplier, which is the slope of the linerepresenting the sensor’s response.
Section 7. Software Reference
7-11Auxiliary Inputs
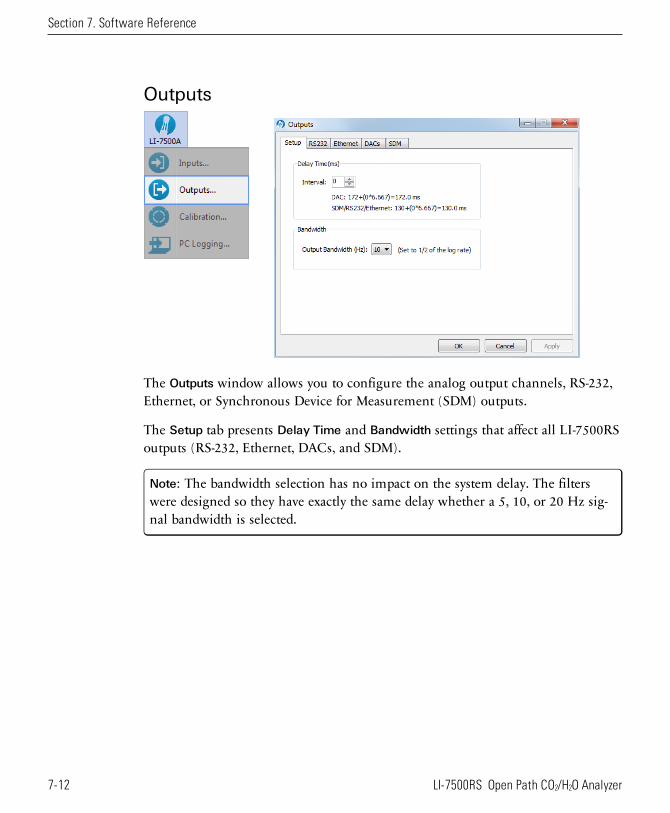
Section 7. Software Reference
Outputs
The Outputs window allows you to configure the analog output channels, RS-232,Ethernet, or Synchronous Device for Measurement (SDM) outputs.
The Setup tab presents Delay Time and Bandwidth settings that affect all LI-7500RSoutputs (RS-232, Ethernet, DACs, and SDM).
Note: The bandwidth selection has no impact on the system delay. The filterswere designed so they have exactly the same delay whether a 5, 10, or 20 Hz sig-nal bandwidth is selected.
7-12 LI-7500RS Open Path CO2/H2O Analyzer
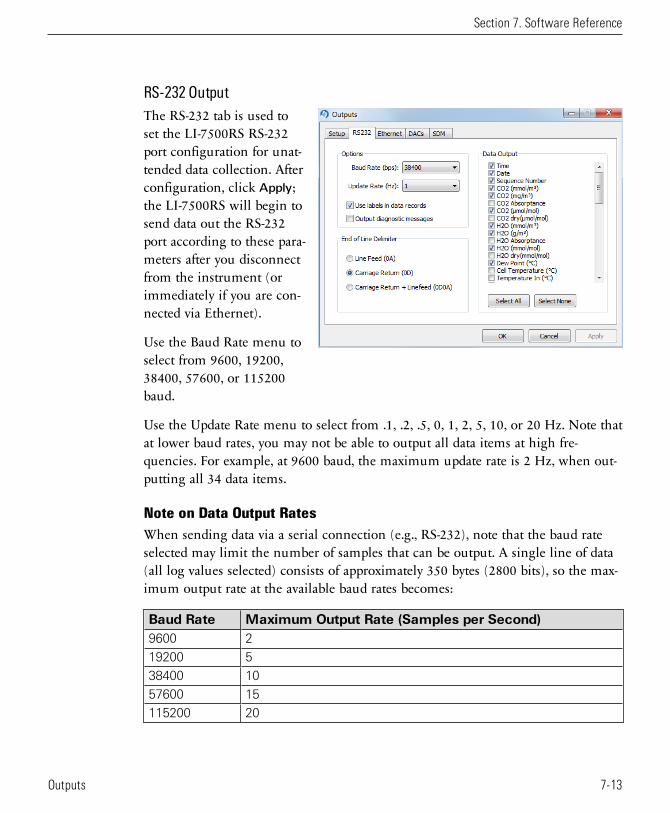
RS-232 OutputThe RS-232 tab is used toset the LI-7500RS RS-232port configuration for unat-tended data collection. Afterconfiguration, click Apply;the LI-7500RS will begin tosend data out the RS-232port according to these para-meters after you disconnectfrom the instrument (orimmediately if you are con-nected via Ethernet).
Use the Baud Rate menu toselect from 9600, 19200,38400, 57600, or 115200baud.
Use the Update Rate menu to select from .1, .2, .5, 0, 1, 2, 5, 10, or 20 Hz. Note thatat lower baud rates, you may not be able to output all data items at high fre-quencies. For example, at 9600 baud, the maximum update rate is 2 Hz, when out-putting all 34 data items.
Note on Data Output RatesWhen sending data via a serial connection (e.g., RS-232), note that the baud rateselected may limit the number of samples that can be output. A single line of data(all log values selected) consists of approximately 350 bytes (2800 bits), so the max-imum output rate at the available baud rates becomes:
Baud Rate Maximum Output Rate (Samples per Second)9600 2
19200 5
38400 10
57600 15
115200 20
Section 7. Software Reference
7-13Outputs
Section 7. Software Reference
Under Options, you can choose whether or not to output labels with each datarecord, and whether to output diagnostic text records. An example of a data recordsent with and without labels is shown below.
Data format with labels:
(Data (Ndx 87665) (DiagVal 757) (Date 2009-09-10) (Time14:06:44:140) CO2Raw 0.0332911) (H2ORaw 0.19299) (CO2D 5.20672)(H2OD 755.566) (Temp 15.517) (Pres 99.4361)…
Data format without labels:
87665 757 2009-09-10 14:06:44:140 0.0332911 0.19299 5.20672…
The End of Line Delimiters determine the character(s) that terminate the datarecords. Depending on your recording device, a line feed, carriage return, or bothmay be required to properly parse the data records.
Under Data Output, select the data records that you want to output; click Select All
to choose all, or Select None to disable all checked values.
Ethernet OutputThe Ethernet tab is used to set the LI-7500RS Ethernet port network com-munication. After configuration, click Apply and the analyzer will begin to senddata out the Ethernet port according to these parameters.
Use the Update Rate menu to select from .1, .2, .5, 0, 1, 2, 5, 10, or 20 Hz.
Under Options, you can choose whether or not to output labels with each datarecord, and whether to output diagnostic text records. An example of a data recordsent with and without labels is shown below.
Data format with labels:
(Data (Ndx 87665) (DiagVal 757) (Date 2009-09-10) (Time14:06:44:140) CO2Raw 0.0332911) (H2ORaw 0.19299) (CO2D 5.20672)(H2OD 755.566) (Temp 15.517) (Pres 99.4361)…
Data format without labels
87665 757 2009-09-10 14:06:44:140 0.0332911 0.19299 5.20672…
7-14 LI-7500RS Open Path CO2/H2O Analyzer
The End of Line Delimiters determine the character(s) that terminate the datarecords. Depending on your recording device, a line feed, carriage return, or bothmay be required to properly parse the data records.
Under Data Output, select the data records that you want to output; click Select All
to choose all, or Select None to disable all checked values. The data items availablefor display given in on page 3-5.
DAC ConfigurationThe LI-7550 has the capability to output up to 6 variables on DAC channels 1-6.The DACs page allows you to configure the DAC output channels by specifying thesource channel (e.g., CO2 mmol/m3) that drives the analog signal, the source chan-nel value that corresponds to zero volts, and the source channel value that cor-responds to full scale voltage (5V).
For example, to configure DAC #1 to output a voltage signal proportional to CO2
mmol/m3, 20 mmol/m3 full scale, select CO2 mmol/m3 under DAC1 'Source', andset 0V = 0, and 5V = 20.
0V → 0(Xo, zero volts corresponds to 0 mmol/m3)5V → 20(XF, full scale corresponds to 20 mmol/m3)
When a voltage range R is selected, the DAC output voltage V resulting from a CO2
molar value X is given by
7-2V R=
X X
X XF
0
0
−
−
where R = 5V.
The DACs are linear, so in the example above, a measured voltage signal of 3 voltswould correspond to a CO2 mmol/m3 value of 12.
For test purposes, you can also choose Set Point for the Source, and enter a SetPoint voltage value; the DAC channel will then output that voltage continuously.
LI-7500RS SDM OutputSDM addressing allows multiple SDM-compatible peripherals to be connected to asingle Campbell Scientific® datalogger. Choose an address under the SDM tab
Section 7. Software Reference
7-15Outputs
Section 7. Software Reference
between 0 and 14.
SDM communications are enabled in Campbell Scientific dataloggers with one oftwo instructions, depending on the datalogger. For dataloggers programmed inEdLog (e.g. CR23X) SDM communications are enabled using instruction 189:SDMLI-7500. When using this instruction, parameter two (SDM Address) should be setto match the SDM address of the LI-7500RS. Parameter three (Option) is used todefine what variables the datalogger collects from the instrument, and can take onvalues from 0 to 6 (see table 4-1 for variables included in each option). Below is aprogramming example of instruction 189 used to collect data from an LI-7500RS atSDM address 0:
1: SDM-LI7500 (P189)
1: 1 Reps2: 0 SDM Address3: 6 Get CO2 & H2O molar density, pressure,and cell diagnostic value4: 49 Loc [ LI75000 ]
For dataloggers programmed in CRBasic (e.g. CR5000) SDM communications areenabled using the instruction CS7500. When using this instruction, parameterthree (SDMAddress) should be set to match the SDM address of the LI-7500RS.Parameter four (CS7500Cmd) is used to define what variables the datalogger col-lects from the instrument. Unlike instruction 189, the CS7500 instruction supportsa group trigger mode, so it can take on values from 0 to 7 (see Table 7-1 on thefacing page for variables included in each option). Below is a programmingexample of the CS7500 instruction used to collect data from an LI-7500RS at SDMaddress 0:
CS7500 (LI-7500(),1,0,6)
7-16 LI-7500RS Open Path CO2/H2O Analyzer
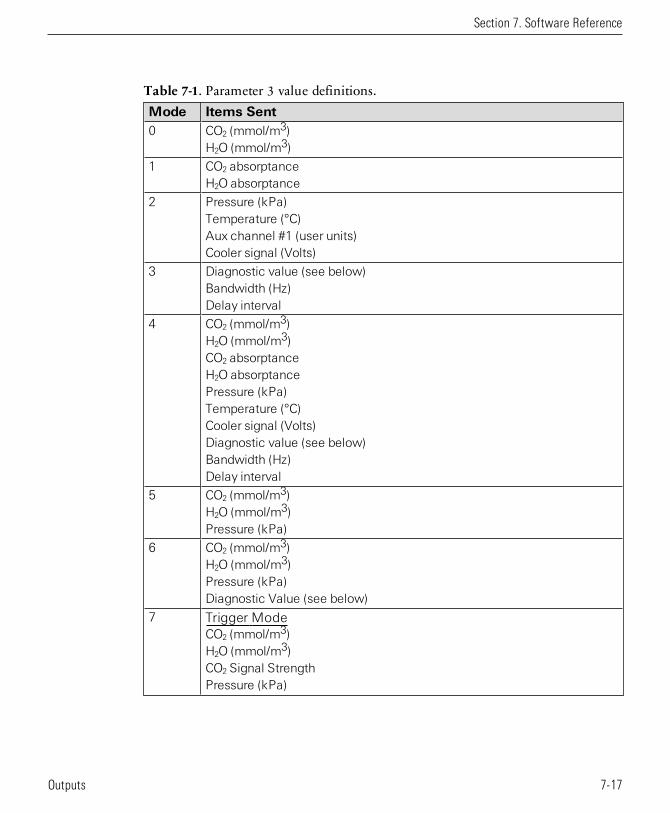
Mode Items Sent0 CO2 (mmol/m3)
H2O (mmol/m3)
1 CO2 absorptanceH2O absorptance
2 Pressure (kPa)Temperature (°C)Aux channel #1 (user units)Cooler signal (Volts)
3 Diagnostic value (see below)Bandwidth (Hz)Delay interval
4 CO2 (mmol/m3)H2O (mmol/m3)CO2 absorptanceH2O absorptancePressure (kPa)Temperature (°C)Cooler signal (Volts)Diagnostic value (see below)Bandwidth (Hz)Delay interval
5 CO2 (mmol/m3)H2O (mmol/m3)Pressure (kPa)
6 CO2 (mmol/m3)H2O (mmol/m3)Pressure (kPa)Diagnostic Value (see below)
7 Trigger ModeCO2 (mmol/m3)H2O (mmol/m3)CO2 Signal StrengthPressure (kPa)
Table 7-1. Parameter 3 value definitions.
Section 7. Software Reference
7-17Outputs
Section 7. Software Reference
Mode Items SentNOTES: LI-7500RS Mode 7 requires the Campbell datalogger to broadcast a group
trigger to cause data to be registered. The registered data set is held andnot updated until the next group trigger.
All serial transfers on the SDM bus are bit reversed. This means that theleast significant bit is sent first and the most significant bit is sent last.This includes sending the signature.
Table 7-1. Parameter 3 value definitions. (...continued)
Delay TimeThe output signal from the LI-7500RS optical bench is sampled by a high-speedanalog-to-digital converter and input into a digital signal processor (DSP). This sig-nal is processed digitally and gas densities are computed from it. There is a fixeddelay in this process, and an additional user-programmable delay that can be usedto make the LI-7500RS output occur on even sampling intervals.
The LI-7500RS has a fixed throughput delay of 172 milliseconds for the DAC out-puts, and 130 ms for the SDM, RS-232, and Ethernet outputs. This delay can beincreased in increments of 1/150 seconds (6.667 ms), to minimize offsets betweenthe LI-7500RS and other sensors.
For example, suppose you are sampling (via SDM output) the LI-7500RS with aCampbell Scientific CR5000 datalogger at 10 Hz (0.1 s). Setting the delay count ofthe LI-7500RS to 25 yields a total delay of 0.297 seconds, which means theLI-7500RS data will have a delay of 3 execution intervals (0.297 s/0.1 s), which thelogger can allow for in synchronizing the data to the sonic anemometer or otheranalog measurements made by the datalogger. Thus, the “unaccounted for” lag is0.003s. Without this extra delay, the lag time would be 0.130 seconds, which is 1execution interval (0.1 seconds) plus 0.03 seconds unaccounted for.
Similarly, if you are sampling the LI-7500RS with the DAC outputs, setting thedelay count to 19 yields a total delay of 0.299 seconds. The lag will be 0.001s.
Total System Delay ExamplesTotal System Delay (ms) = Delay Time + (Delay Step × Delay Step Increment)
7-18 LI-7500RS Open Path CO2/H2O Analyzer
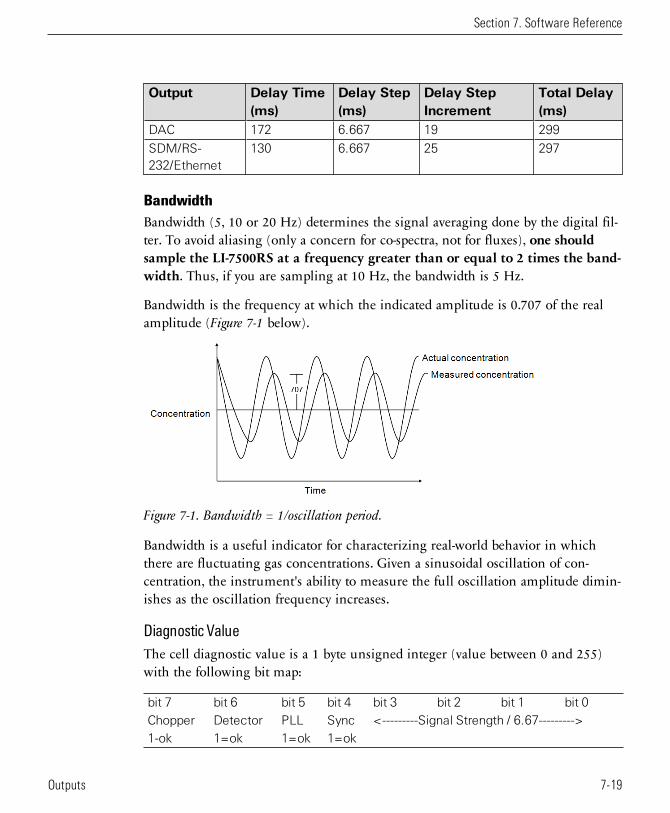
Output Delay Time(ms)
Delay Step(ms)
Delay StepIncrement
Total Delay(ms)
DAC 172 6.667 19 299
SDM/RS-232/Ethernet
130 6.667 25 297
BandwidthBandwidth (5, 10 or 20 Hz) determines the signal averaging done by the digital fil-ter. To avoid aliasing (only a concern for co-spectra, not for fluxes), one shouldsample the LI-7500RS at a frequency greater than or equal to 2 times the band-width. Thus, if you are sampling at 10 Hz, the bandwidth is 5 Hz.
Bandwidth is the frequency at which the indicated amplitude is 0.707 of the realamplitude (Figure 7-1 below).
Figure 7-1. Bandwidth = 1/oscillation period.
Bandwidth is a useful indicator for characterizing real-world behavior in whichthere are fluctuating gas concentrations. Given a sinusoidal oscillation of con-centration, the instrument's ability to measure the full oscillation amplitude dimin-ishes as the oscillation frequency increases.
Diagnostic ValueThe cell diagnostic value is a 1 byte unsigned integer (value between 0 and 255)with the following bit map:
bit 7 bit 6 bit 5 bit 4 bit 3 bit 2 bit 1 bit 0Chopper Detector PLL Sync <---------Signal Strength / 6.67--------->1-ok 1=ok 1=ok 1=ok
Section 7. Software Reference
7-19Outputs
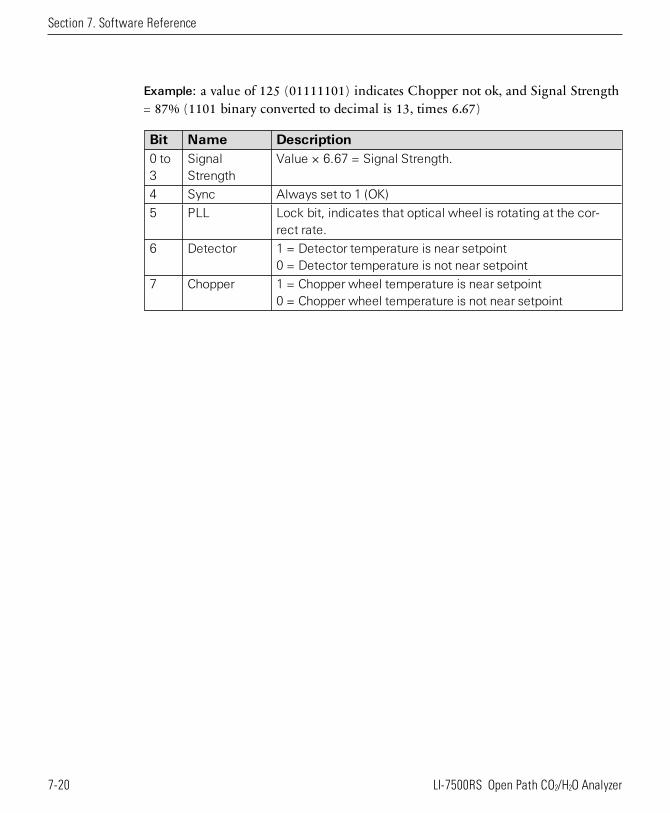
Section 7. Software Reference
Example: a value of 125 (01111101) indicates Chopper not ok, and Signal Strength= 87% (1101 binary converted to decimal is 13, times 6.67)
Bit Name Description0 to3
SignalStrength
Value × 6.67 = Signal Strength.
4 Sync Always set to 1 (OK)
5 PLL Lock bit, indicates that optical wheel is rotating at the cor-rect rate.
6 Detector 1 = Detector temperature is near setpoint0 = Detector temperature is not near setpoint
7 Chopper 1 = Chopper wheel temperature is near setpoint0 = Chopper wheel temperature is not near setpoint
7-20 LI-7500RS Open Path CO2/H2O Analyzer
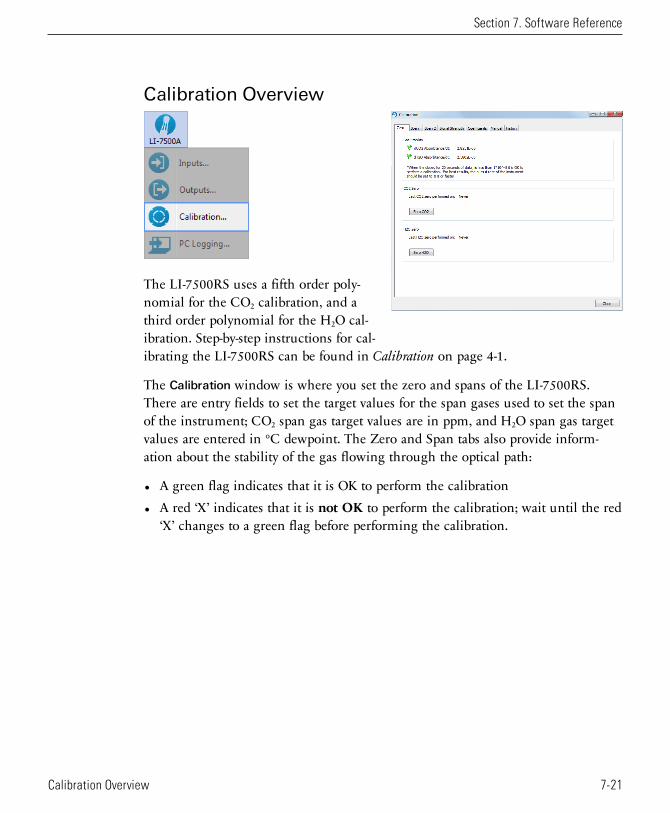
Calibration Overview
The LI-7500RS uses a fifth order poly-nomial for the CO2 calibration, and athird order polynomial for the H2O cal-ibration. Step-by-step instructions for cal-ibrating the LI-7500RS can be found in Calibration on page 4-1.
The Calibration window is where you set the zero and spans of the LI-7500RS.There are entry fields to set the target values for the span gases used to set the spanof the instrument; CO2 span gas target values are in ppm, and H2O span gas targetvalues are entered in °C dewpoint. The Zero and Span tabs also provide inform-ation about the stability of the gas flowing through the optical path:
l A green flag indicates that it is OK to perform the calibrationl A red ‘X’ indicates that it is not OK to perform the calibration; wait until the red
‘X’ changes to a green flag before performing the calibration.
Section 7. Software Reference
7-21Calibration Overview
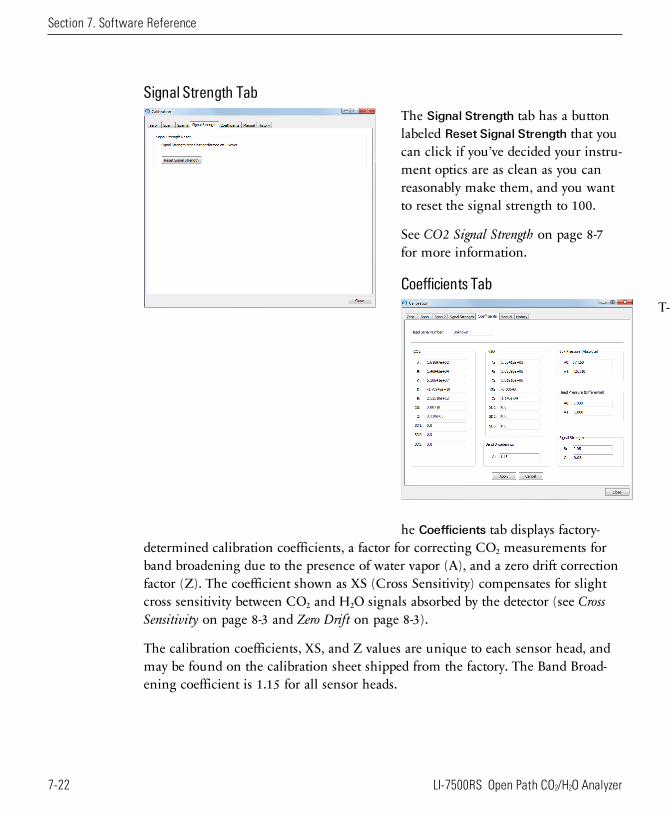
Section 7. Software Reference
Signal Strength TabThe Signal Strength tab has a buttonlabeled Reset Signal Strength that youcan click if you’ve decided your instru-ment optics are as clean as you canreasonably make them, and you wantto reset the signal strength to 100.
See CO2 Signal Strength on page 8-7for more information.
Coefficients TabT-
he Coefficients tab displays factory-determined calibration coefficients, a factor for correcting CO2 measurements forband broadening due to the presence of water vapor (A), and a zero drift correctionfactor (Z). The coefficient shown as XS (Cross Sensitivity) compensates for slightcross sensitivity between CO2 and H2O signals absorbed by the detector (see CrossSensitivity on page 8-3 and Zero Drift on page 8-3).
The calibration coefficients, XS, and Z values are unique to each sensor head, andmay be found on the calibration sheet shipped from the factory. The Band Broad-ening coefficient is 1.15 for all sensor heads.
7-22 LI-7500RS Open Path CO2/H2O Analyzer
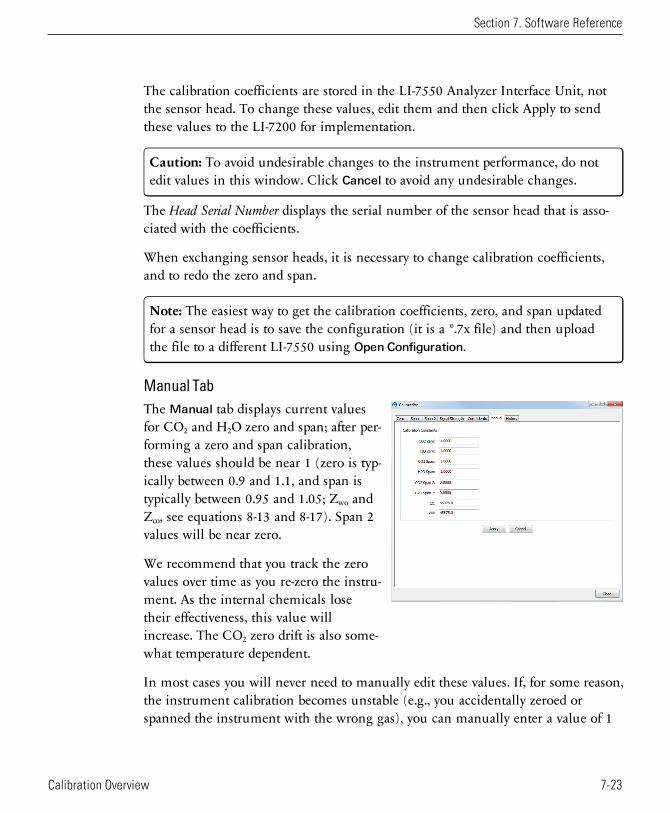
The calibration coefficients are stored in the LI-7550 Analyzer Interface Unit, notthe sensor head. To change these values, edit them and then click Apply to sendthese values to the LI-7200 for implementation.
Caution: To avoid undesirable changes to the instrument performance, do notedit values in this window. Click Cancel to avoid any undesirable changes.
The Head Serial Number displays the serial number of the sensor head that is asso-ciated with the coefficients.
When exchanging sensor heads, it is necessary to change calibration coefficients,and to redo the zero and span.
Note: The easiest way to get the calibration coefficients, zero, and span updatedfor a sensor head is to save the configuration (it is a *.7x file) and then uploadthe file to a different LI-7550 using Open Configuration.
Manual TabThe Manual tab displays current valuesfor CO2 and H2O zero and span; after per-forming a zero and span calibration,these values should be near 1 (zero is typ-ically between 0.9 and 1.1, and span istypically between 0.95 and 1.05; Zwo andZco, see equations 8-13 and 8-17). Span 2values will be near zero.
We recommend that you track the zerovalues over time as you re-zero the instru-ment. As the internal chemicals losetheir effectiveness, this value willincrease. The CO2 zero drift is also some-what temperature dependent.
In most cases you will never need to manually edit these values. If, for some reason,the instrument calibration becomes unstable (e.g., you accidentally zeroed orspanned the instrument with the wrong gas), you can manually enter a value of 1
Section 7. Software Reference
7-23Calibration Overview
Section 7. Software Reference
for each of these parameters (and zero for Span 2 values), and click Apply. This willreturn the instrument to a more normal state, after which you can perform zeroand span calibrations again. Alternatively, if you have performed at least one pre-vious (successful) calibration, you can restore those values using the History tab.
History TabThe History tab displays a list of previous calibration backup files generated duringa zero and/or span calibration of the instrument (when used with the same com-puter used to connect to the instrument). You can click on any previous calibrationin the list to view the details; you can also restore the values from a previous cal-ibration by choosing a file in the list and clicking the Restore button. Click Delete
to permanently remove calibration files from the list stored on the computer.
Changing Sensor HeadsSensor heads are freely interchangeable between LI-7550 Analyzer Interface Units.However, the LI-7550 must have the correct calibration coefficients and currentzero and span information for the attached sensor head. This can be done by hand,or "automatically".
By Hand1. Attach the new sensor head to the LI-7550
2. Connect the instrument to a computer and establish communications.
3. Enter the calibration coefficients from the Calibration Certificate under the Coefficients tab.
4. Zero and span the instrument.
AutomaticAcquire a calibration file for your instrument. You can get it from the LI-COR sup-port site (www.licor.com/env/support) under calibration information, or you cansave it from the LI-7550 (Config Files > Save Configuration). The file has a *.7xextension. To move a sensor head to another LI-7550:
1. Attach the new sensor head to the LI-7550.
2. Connect the instrument to a computer and establish communications.
3. Select Config Files > Open Configuration. Choose the file saved earlier; the coefficients willautomatically be loaded.
7-24 LI-7500RS Open Path CO2/H2O Analyzer
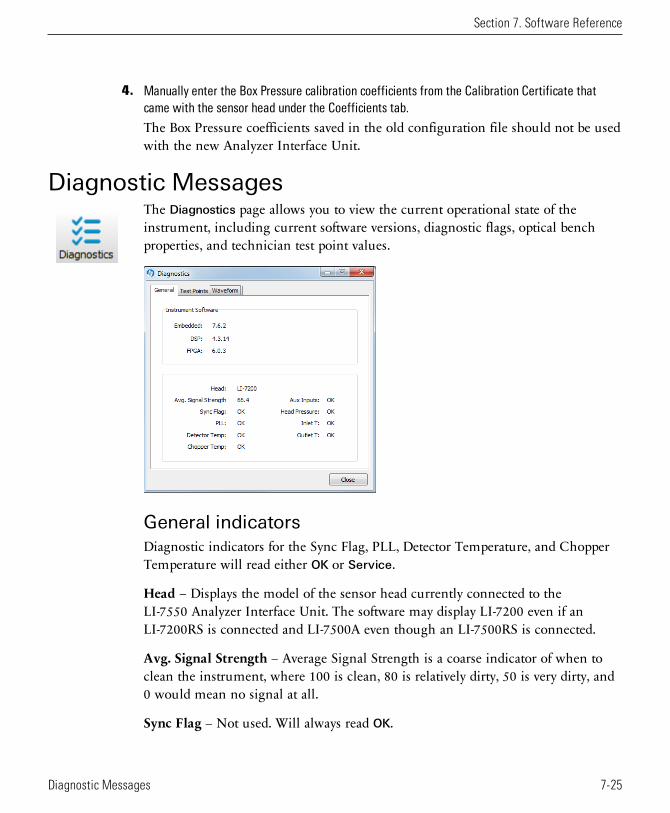
4. Manually enter the Box Pressure calibration coefficients from the Calibration Certificate thatcame with the sensor head under the Coefficients tab.
The Box Pressure coefficients saved in the old configuration file should not be usedwith the new Analyzer Interface Unit.
Diagnostic MessagesThe Diagnostics page allows you to view the current operational state of theinstrument, including current software versions, diagnostic flags, optical benchproperties, and technician test point values.
General indicatorsDiagnostic indicators for the Sync Flag, PLL, Detector Temperature, and ChopperTemperature will read either OK or Service.
Head – Displays the model of the sensor head currently connected to theLI-7550 Analyzer Interface Unit. The software may display LI-7200 even if anLI-7200RS is connected and LI-7500A even though an LI-7500RS is connected.
Avg. Signal Strength – Average Signal Strength is a coarse indicator of when toclean the instrument, where 100 is clean, 80 is relatively dirty, 50 is very dirty, and0 would mean no signal at all.
Sync Flag – Not used. Will always read OK.
Section 7. Software Reference
7-25Diagnostic Messages
Section 7. Software Reference
PLL - Phase Lock Loop offset, indicates the status of the optical filter wheel for theIRGA. Common causes of a service indication are not having a sensor head con-nected to the LI-7550, the head cable is not been tightened properly, or the cablehas failed.
Detector Temperature - If not OK, indicates the detector cooler is not maintainingthe proper temperature: this will happen at temperatures above 50 °C. This doesnot always indicate a serious problem; the cooler may simply have not yet reachedthe target temperature during instrument startup, or it may be out of range due toexternal environmental conditions. Readings may still be OK. The sensor head maynot be attached to the LI-7550, or the IRGA cable may not be tight. Check cablesand wiring.
Chopper Temperature - If not OK, indicates the chopper temperature controller isout of range, hot or cold. As with the Detector Temperature indicator above, thismay or may not indicate a serious problem. The chopper should be able to tem-perature control when ambient is between +50 and -25 °C. Check that the sensorhead cables to the LI-7550 are tight, and make sure the chopper temperature is notset to Winter when measuring in high ambient temperatures.
Aux Inputs – If not OK, indicates that the two reference voltages on the LI-7550analog circuit board cannot be checked properly. The LI-7550 needs service.
Head Pressure – If not OK, the pressure reading at the LI-7500RS sensor head isoutside of its normal range. A service indication can also be caused by a loose ormissing cable between the LI-7550 and the LI-7500RS sensor head.
Test Point ValuesThe Test Points ab displays voltages and raw counts of a variety of diagnostic testpoints. Though primarily for LI-COR technician reference, values outside of thenormal range may give you an indication of where problems may be originating.
7-26 LI-7500RS Open Path CO2/H2O Analyzer
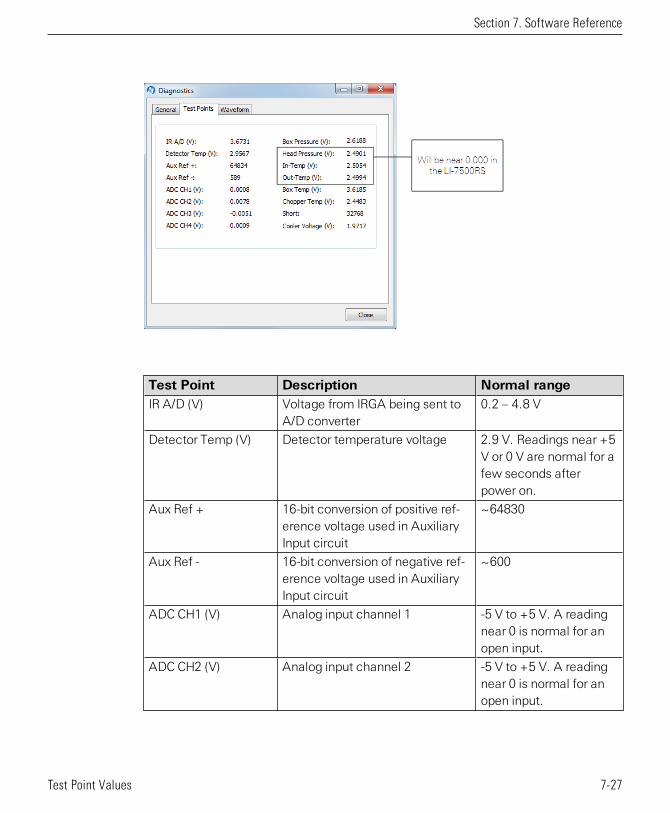
Test Point Description Normal rangeIR A/D (V) Voltage from IRGA being sent to
A/D converter0.2 – 4.8 V
Detector Temp (V) Detector temperature voltage 2.9 V. Readings near +5V or 0 V are normal for afew seconds afterpower on.
Aux Ref + 16-bit conversion of positive ref-erence voltage used in AuxiliaryInput circuit
~64830
Aux Ref - 16-bit conversion of negative ref-erence voltage used in AuxiliaryInput circuit
~600
ADC CH1 (V) Analog input channel 1 -5 V to +5 V. A readingnear 0 is normal for anopen input.
ADC CH2 (V) Analog input channel 2 -5 V to +5 V. A readingnear 0 is normal for anopen input.
Section 7. Software Reference
7-27Test Point Values
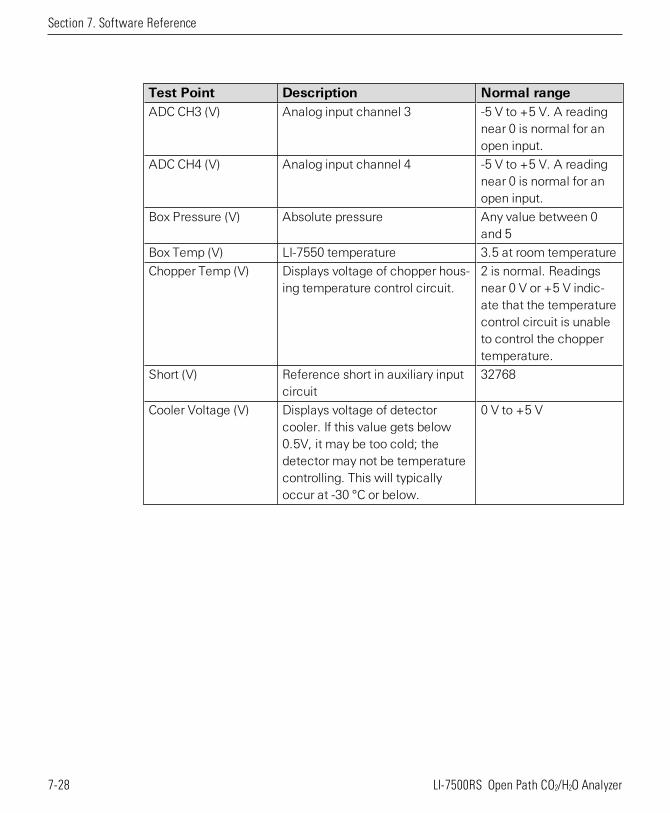
Section 7. Software Reference
Test Point Description Normal rangeADC CH3 (V) Analog input channel 3 -5 V to +5 V. A reading
near 0 is normal for anopen input.
ADC CH4 (V) Analog input channel 4 -5 V to +5 V. A readingnear 0 is normal for anopen input.
Box Pressure (V) Absolute pressure Any value between 0and 5
Box Temp (V) LI-7550 temperature 3.5 at room temperature
Chopper Temp (V) Displays voltage of chopper hous-ing temperature control circuit.
2 is normal. Readingsnear 0 V or +5 V indic-ate that the temperaturecontrol circuit is unableto control the choppertemperature.
Short (V) Reference short in auxiliary inputcircuit
32768
Cooler Voltage (V) Displays voltage of detectorcooler. If this value gets below0.5V, it may be too cold; thedetector may not be temperaturecontrolling. This will typicallyoccur at -30 °C or below.
0 V to +5 V
7-28 LI-7500RS Open Path CO2/H2O Analyzer
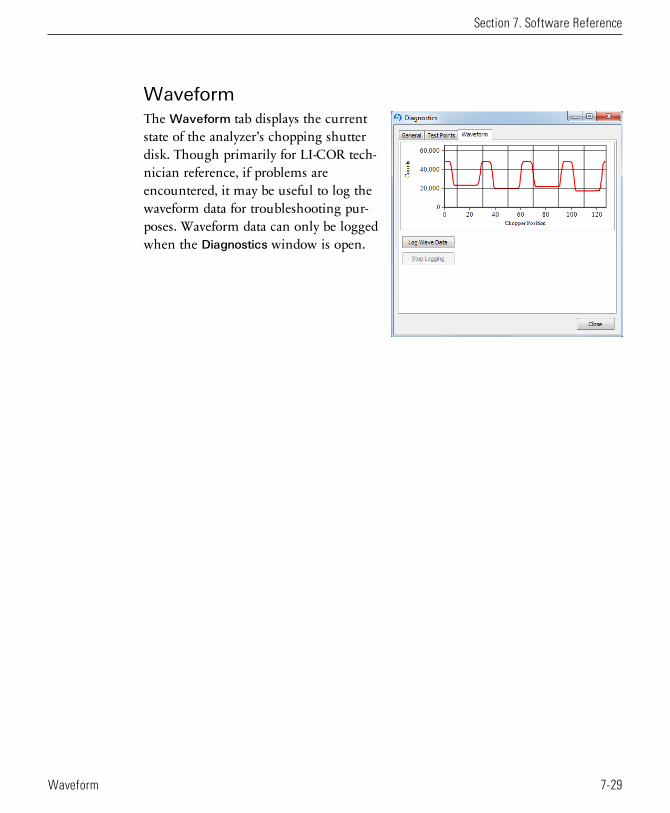
WaveformThe Waveform tab displays the currentstate of the analyzer’s chopping shutterdisk. Though primarily for LI-COR tech-nician reference, if problems areencountered, it may be useful to log thewaveform data for troubleshooting pur-poses. Waveform data can only be loggedwhen the Diagnostics window is open.
Section 7. Software Reference
7-29Waveform
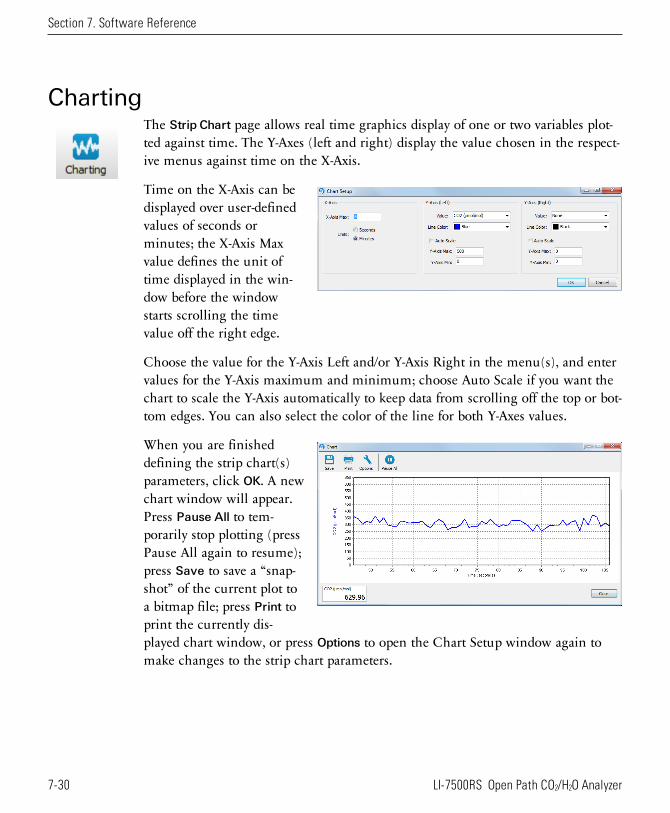
Section 7. Software Reference
ChartingThe Strip Chart page allows real time graphics display of one or two variables plot-ted against time. The Y-Axes (left and right) display the value chosen in the respect-ive menus against time on the X-Axis.
Time on the X-Axis can bedisplayed over user-definedvalues of seconds orminutes; the X-Axis Maxvalue defines the unit oftime displayed in the win-dow before the windowstarts scrolling the timevalue off the right edge.
Choose the value for the Y-Axis Left and/or Y-Axis Right in the menu(s), and entervalues for the Y-Axis maximum and minimum; choose Auto Scale if you want thechart to scale the Y-Axis automatically to keep data from scrolling off the top or bot-tom edges. You can also select the color of the line for both Y-Axes values.
When you are finisheddefining the strip chart(s)parameters, click OK. A newchart window will appear.Press Pause All to tem-porarily stop plotting (pressPause All again to resume);press Save to save a “snap-shot” of the current plot toa bitmap file; press Print toprint the currently dis-played chart window, or press Options to open the Chart Setup window again tomake changes to the strip chart parameters.
7-30 LI-7500RS Open Path CO2/H2O Analyzer

Note: You can rescale both Y-axes of an active strip chart by right clicking on thechart, holding, and dragging up or down. You can also open as many chart win-dows as you want.
Section 7. Software Reference
7-31Charting
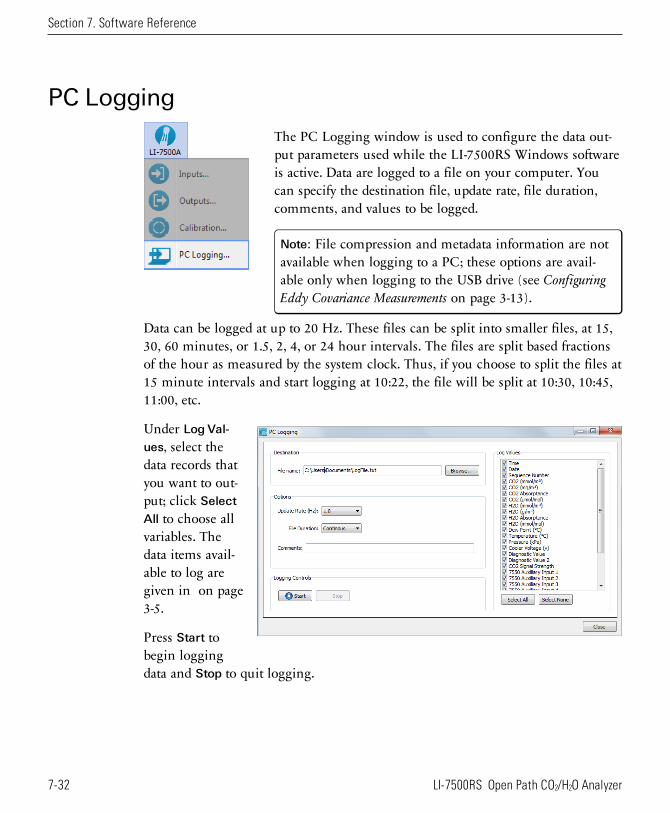
Section 7. Software Reference
PC Logging
The PC Logging window is used to configure the data out-put parameters used while the LI-7500RS Windows softwareis active. Data are logged to a file on your computer. Youcan specify the destination file, update rate, file duration,comments, and values to be logged.
Note: File compression and metadata information are notavailable when logging to a PC; these options are avail-able only when logging to the USB drive (see ConfiguringEddy Covariance Measurements on page 3-13).
Data can be logged at up to 20 Hz. These files can be split into smaller files, at 15,30, 60 minutes, or 1.5, 2, 4, or 24 hour intervals. The files are split based fractionsof the hour as measured by the system clock. Thus, if you choose to split the files at15 minute intervals and start logging at 10:22, the file will be split at 10:30, 10:45,11:00, etc.
Under Log Val-ues, select thedata records thatyou want to out-put; click Select
All to choose allvariables. Thedata items avail-able to log aregiven in on page3-5.
Press Start tobegin loggingdata and Stop to quit logging.
7-32 LI-7500RS Open Path CO2/H2O Analyzer
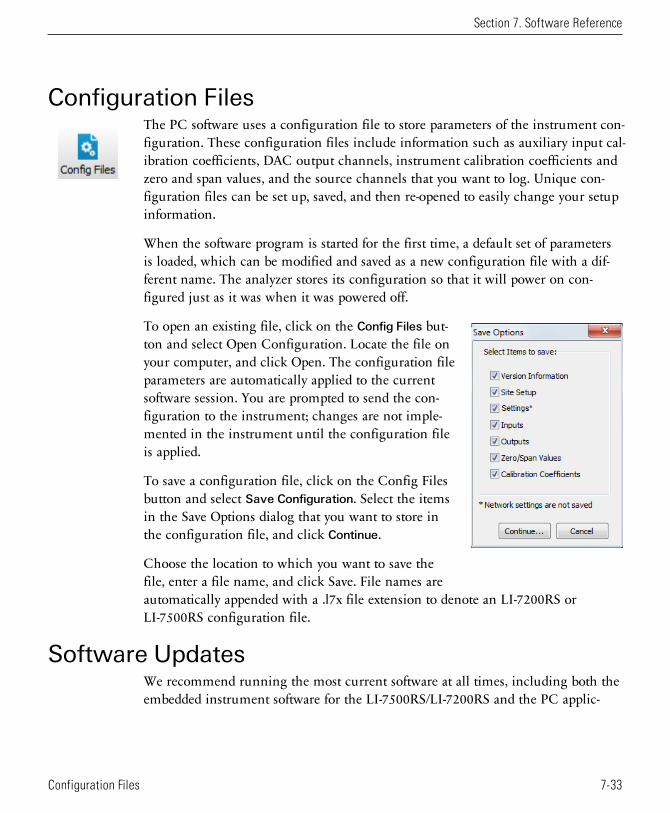
Configuration FilesThe PC software uses a configuration file to store parameters of the instrument con-figuration. These configuration files include information such as auxiliary input cal-ibration coefficients, DAC output channels, instrument calibration coefficients andzero and span values, and the source channels that you want to log. Unique con-figuration files can be set up, saved, and then re-opened to easily change your setupinformation.
When the software program is started for the first time, a default set of parametersis loaded, which can be modified and saved as a new configuration file with a dif-ferent name. The analyzer stores its configuration so that it will power on con-figured just as it was when it was powered off.
To open an existing file, click on the Config Files but-ton and select Open Configuration. Locate the file onyour computer, and click Open. The configuration fileparameters are automatically applied to the currentsoftware session. You are prompted to send the con-figuration to the instrument; changes are not imple-mented in the instrument until the configuration fileis applied.
To save a configuration file, click on the Config Filesbutton and select Save Configuration. Select the itemsin the Save Options dialog that you want to store inthe configuration file, and click Continue.
Choose the location to which you want to save thefile, enter a file name, and click Save. File names areautomatically appended with a .l7x file extension to denote an LI-7200RS orLI-7500RS configuration file.
Software UpdatesWe recommend running the most current software at all times, including both theembedded instrument software for the LI-7500RS/LI-7200RS and the PC applic-
Section 7. Software Reference
7-33Configuration Files
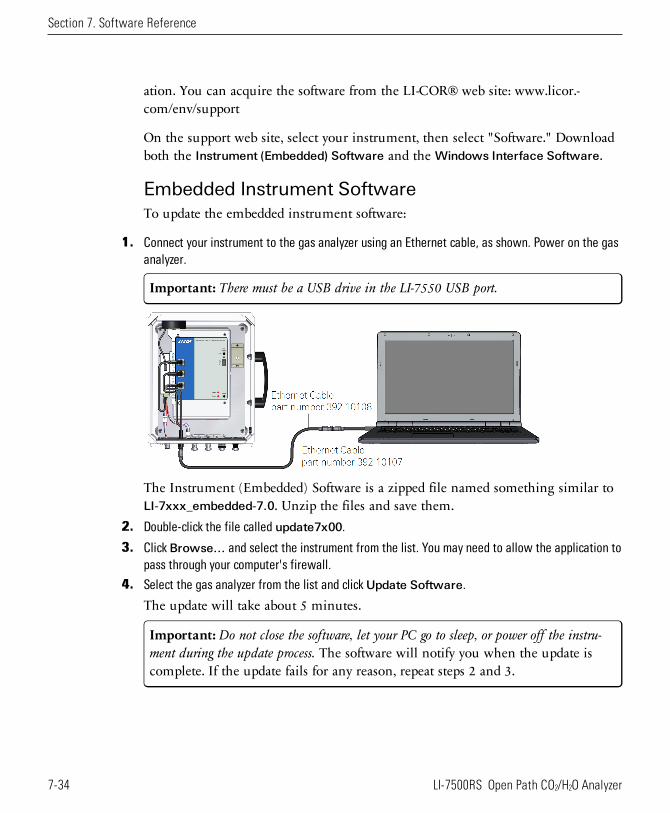
Section 7. Software Reference
ation. You can acquire the software from the LI-COR® web site: www.licor.-com/env/support
On the support web site, select your instrument, then select "Software." Downloadboth the Instrument (Embedded) Software and the Windows Interface Software.
Embedded Instrument SoftwareTo update the embedded instrument software:
1. Connect your instrument to the gas analyzer using an Ethernet cable, as shown. Power on the gasanalyzer.
Important: There must be a USB drive in the LI-7550 USB port.
The Instrument (Embedded) Software is a zipped file named something similar toLI-7xxx_embedded-7.0. Unzip the files and save them.
2. Double-click the file called update7x00.
3. Click Browse... and select the instrument from the list. You may need to allow the application topass through your computer's firewall.
4. Select the gas analyzer from the list and clickUpdate Software.
The update will take about 5 minutes.
Important: Do not close the software, let your PC go to sleep, or power off the instru-ment during the update process. The software will notify you when the update iscomplete. If the update fails for any reason, repeat steps 2 and 3.
7-34 LI-7500RS Open Path CO2/H2O Analyzer
If you are updating from embedded version 4.x.x or earlier, you must also run theFPGA update. To check if this update is necessary click the Check FPGA button.Note: Do not check the FPGA version until you update the system software.If the FPGA update is needed the Update FPGA button will become enabled in theapplication. The update takes approximately 8 minutes.
Important: Do not close the software or reset the instrument while the update is takingplace. The software will notify you once the FPGA programming is finished.
5. After updating the software, check all your instrument configuration settings. The instrumentshould retain all settings through a software update, but in unusual circumstances, some settingsmay be lost.
Troubleshooting: Getting an update error? There must be a USB drive installedin the LI-7550 USB port before you can update. Also, if the drive is inserted forthe first time, the instrument will take a few minutes to connect with the drive.
PC Software UpdateTo update the PC Desktop Software:
1. The PC Desktop Software is an executable file named something similar to LI-7xxx_win-7.0.Double click to launch the installer.
2. Follow the Windows Installation wizard to install the application.
Section 7. Software Reference
7-35PC Software Update

Section 7. Software Reference
7-36 LI-7500RS Open Path CO2/H2O Analyzer
Section 8. Theory of Operation
Relating Absorption to ConcentrationThe scaling law of Jaimeson et. al., (1963) shows the effect of pressure on infraredabsorption. If the amount of absorber of some gas ui (mol m-2) and absorption in aband are related by some function hi(), then
8-1h=
P i
u
P
i
ei
i
ei
α
The subscript i denotes a particular (ith) gas. Pressure is denoted as Pei because it isthe equivalent pressure for the ith gas. Equivalent pressure is potentially differentfrom total pressure P if there are gases present other than i that affect how the ithgas absorbs radiation.
We rewrite this in terms of number density (mol m-3) by introducing a path lengthλ, and noting that ui = ρ iλ . Substituting this into equation 8-1, and solving for thenumber density ρ i of gas i yield
8-2h=
i
P
i P
1ei i
ei
−ρ
λ
α
We rewrite equation 8-2 as
8-3P= f
i ei i P
i
ei
ρ
α
by combining λ and the inverse h() functions into a new function fi(). The cal-ibration function fi() is generated by measuring a range of known densities ρ i andfitting a curve to ρ i/Pei plotted against αi/Pei. Since gas standards are not available in“known densities”, the ρ i values are computed from known concentrations mi
(moles of gas per mole of air) using the ideal gas law
8-1LI-7500RS Open Path CO2/H2O Analyzer
Section 8. Theory of Operation
8-4m=
i i
P
RTρ
Measuring AbsorptanceGiven a source with radiant power Φ, and a detector some distance away, in theabsence of reflection, absorptance by gas i can be determined from
8-5= 1 = 1i i
i
o
− −α τΦ
Φ
where iτ is transmittance through gas i, iΦ is transmitted radiant power in theabsorption band with some concentration of gas i present, and oΦ is the trans-mitted radiant power in the absorption band with zero concentration of i present.The LI-7500RS approximates absorptance by
8-6= 1i
A
A
i
io
−
α
where Ai is the power received from the source in an absorbing wavelength for gasi, and Aio is the power received from the source in a reference wavelength that doesnot absorb gas i. The LI-7500RS measures Ai and Aio alternately 150 times persecond.
If we combine equations 8-6 and 8-3, we can write the full equation for computingmolar density from absorptance.
8-7P f z= 1i ei i
A
A iS
Pi
io
i
ei
−
ρ
Note the zeroing term zi and the span adjustment term Si in equation 8-7. The spanadjustment term is a linear function of absorptance (see What Actually Happens onpage 4-9):
8-8S S S= +i i i i0 1α
8-2 LI-7500RS Open Path CO2/H2O Analyzer
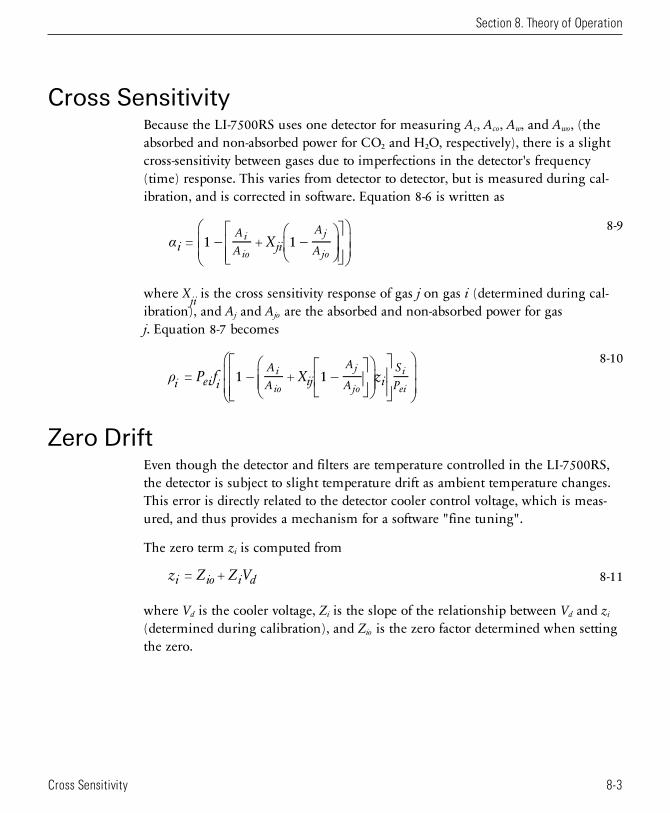
Cross SensitivityBecause the LI-7500RS uses one detector for measuring Ac, Aco, Aw, and Awo, (theabsorbed and non-absorbed power for CO2 and H2O, respectively), there is a slightcross-sensitivity between gases due to imperfections in the detector's frequency(time) response. This varies from detector to detector, but is measured during cal-ibration, and is corrected in software. Equation 8-6 is written as
8-9X= 1 + 1i
A
A ji
A
A
i
io
j
jo
−
−
α
where Xji is the cross sensitivity response of gas j on gas i (determined during cal-ibration), and Aj and Ajo are the absorbed and non-absorbed power for gasj. Equation 8-7 becomes
8-10P f X z= 1 + 1i ei i
A
A ij
A
A iS
Pi
io
j
jo
i
ei
−
−
ρ
Zero DriftEven though the detector and filters are temperature controlled in the LI-7500RS,the detector is subject to slight temperature drift as ambient temperature changes.This error is directly related to the detector cooler control voltage, which is meas-ured, and thus provides a mechanism for a software "fine tuning".
The zero term zi is computed from
8-11z Z Z V= +i io i d
where Vd is the cooler voltage, Zi is the slope of the relationship between Vd and zi
(determined during calibration), and Zio is the zero factor determined when settingthe zero.
Section 8. Theory of Operation
8-3Cross Sensitivity
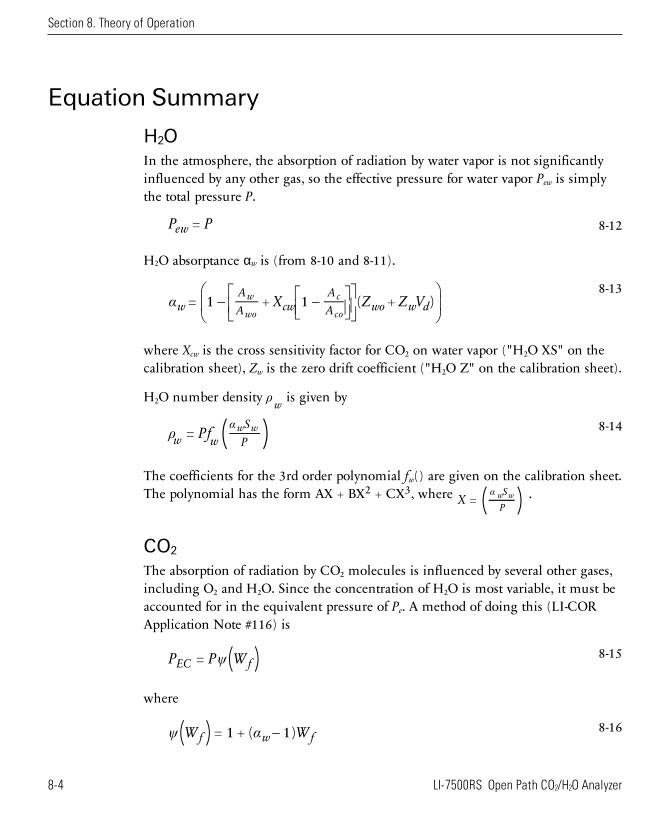
Section 8. Theory of Operation
Equation Summary
H2OIn the atmosphere, the absorption of radiation by water vapor is not significantlyinfluenced by any other gas, so the effective pressure for water vapor Pew is simplythe total pressure P.
8-12P P=ew
H2O absorptance αw is (from 8-10 and 8-11).
8-13X Z Z V= 1 + 1 ( + )w
A
A cw
A
A wo w dw
wo
c
co
−
−
α
where Xcw is the cross sensitivity factor for CO2 on water vapor ("H2O XS" on thecalibration sheet), Zw is the zero drift coefficient ("H2O Z" on the calibration sheet).
H2O number density ρw is given by
8-14( )Pf=w w
S
Pw w
ρα
The coefficients for the 3rd order polynomial fw() are given on the calibration sheet.The polynomial has the form AX + BX2 + CX3, where ( )X =
S
P
w wα .
CO2
The absorption of radiation by CO2 molecules is influenced by several other gases,including O2 and H2O. Since the concentration of H2O is most variable, it must beaccounted for in the equivalent pressure of Pe. A method of doing this (LI-CORApplication Note #116) is
8-15( )P P W=EC fψ
where
8-16( )W W= 1 + ( 1)f w f−ψ α
8-4 LI-7500RS Open Path CO2/H2O Analyzer
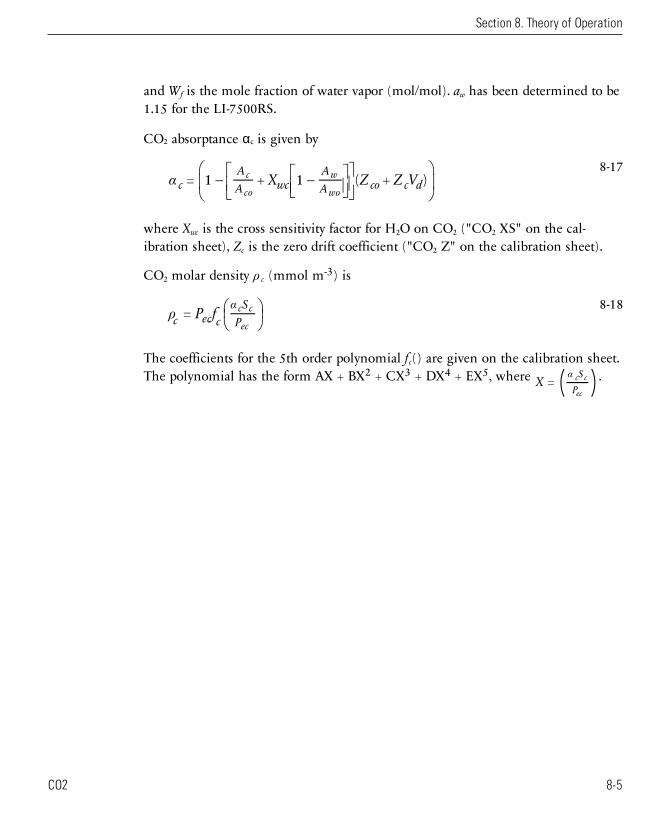
and Wf is the mole fraction of water vapor (mol/mol). aw has been determined to be1.15 for the LI-7500RS.
CO2 absorptance αc is given by
8-17X Z Z V= 1 + 1 ( + )c
A
A wc
A
A co c dc
co
w
wo
−
−
α
where Xwc is the cross sensitivity factor for H2O on CO2 ("CO2 XS" on the cal-ibration sheet), Zc is the zero drift coefficient ("CO2 Z" on the calibration sheet).
CO2 molar density ρ c (mmol m-3) is
8-18P f=c ec c
S
Pc c
ec
ρ
α
The coefficients for the 5th order polynomial fc() are given on the calibration sheet.The polynomial has the form AX + BX2 + CX3 + DX4 + EX5, where ( )X =
S
P
c c
ec
α .
Section 8. Theory of Operation
8-5CO2
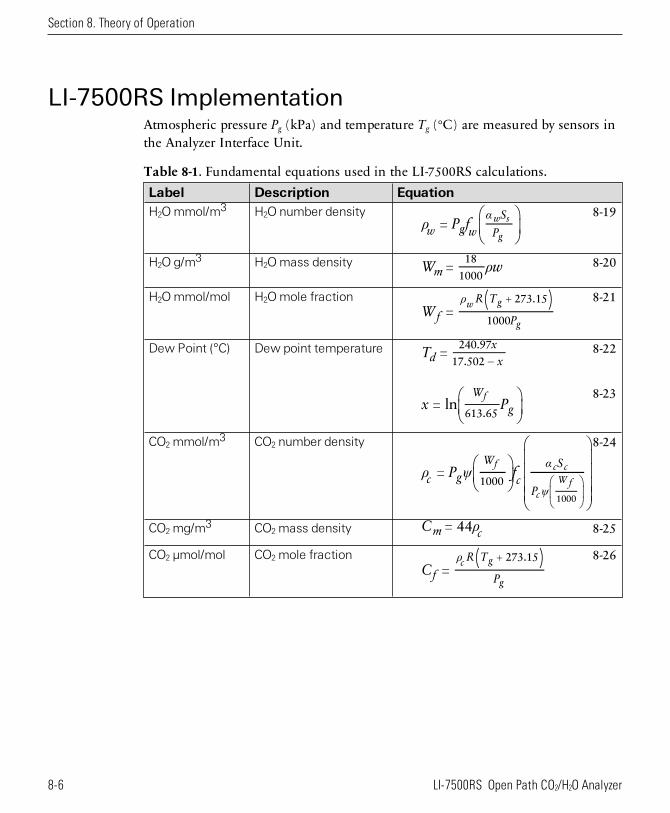
Section 8. Theory of Operation
LI-7500RS ImplementationAtmospheric pressure Pg (kPa) and temperature Tg (°C) are measured by sensors inthe Analyzer Interface Unit.
Label Description EquationH2O mmol/m3 H2O number density 8-19
P f=w g w
S
Pw s
g
ρ
α
H2O g/m3 H2O mass density 8-20W w=m
18
1000ρ
H2O mmol/mol H2O mole fraction 8-21( )W =f
R T
P
+ 273.15
1000
w g
g
ρ
Dew Point (°C) Dew point temperature 8-22T =d
x
x
240.97
17.502 −
8-23x P= ln
W
g613.65
f
CO2 mmol/m3 CO2 number density 8-24
P f=c g
W
c
S
P1000
f c c
c
W f
1000
ρ ψα
ψ
CO2 mg/m3 CO2 mass density 8-25C = 44m cρ
CO2 µmol/mol CO2 mole fraction 8-26( )C =f
R T
P
+ 273.15c g
g
ρ
Table 8-1. Fundamental equations used in the LI-7500RS calculations.
8-6 LI-7500RS Open Path CO2/H2O Analyzer
A Note About Pressure And TemperatureSince the LI-7500RS is calibrated for number density, accurate temperature is notrequired for the calculation, and accurate pressure measurement is not required,either (equations 8-19 and 8-24). For example, if you introduce a 1% error in thepressure sensor on a perfectly calibrated instrument, the resulting CO2 mole densityerror would be about 0.25%, and the H2O mole density error about 0.5% in typicalambient conditions.
When calibrating (specifically when setting spans), temperature and pressure aremore important. Calibrating with a 1% pressure error will cause the resulting CO2
mole density to have a 1% error, but no error in the resulting H2O mole density(because the water span target is computed from dew point, not mole fraction). A1% error in temperature (3 °C) will cause a 1% error in both CO2 and H2O moledensity.
LI-7500RS Diagnostics
CO2 Signal StrengthThe raw reference signal Aco (for CO2) can be used for diagnostic purposes. Aco isinsensitive to CO2 and H2O concentrations, so if it is reduced, it could be due toobstructions (dirt, precipitation, etc.) in the optical path. The value of this signal byitself is not very informative: all you are guaranteed of is that it will be somewherebetween 0 and 65535, but more typically between 25000 to 50000. To get a usefuldiagnostic out of Aco, one needs to know the expected value for a particular instru-ment when everything is clean and normal. If Acx is the maximum expected valuefor Aco, then we could calculate a signal strength Sc for CO2 from
8-27S = × 100c
A
A
co
cx
Sc is on a 0 to 100 scale, where 100 is clean. This value is not ‘clipped’ at 0 or 100,so may slightly exceed 100, especially after signal strength is reset. This simplyreflects slight differences from reality of the temperature compensation function f(T), as shown below in 8-29.
Section 8. Theory of Operation
8-7A Note About Pressure And Temperature
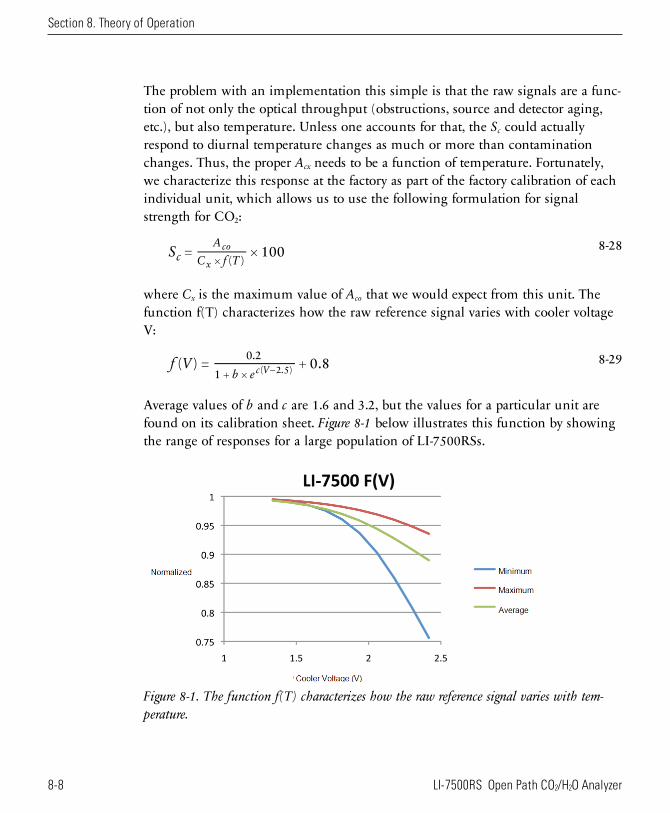
Section 8. Theory of Operation
The problem with an implementation this simple is that the raw signals are a func-tion of not only the optical throughput (obstructions, source and detector aging,etc.), but also temperature. Unless one accounts for that, the Sc could actuallyrespond to diurnal temperature changes as much or more than contaminationchanges. Thus, the proper Acx needs to be a function of temperature. Fortunately,we characterize this response at the factory as part of the factory calibration of eachindividual unit, which allows us to use the following formulation for signalstrength for CO2:
8-28S = × 100cA
C f T× ( )
co
x
where Cx is the maximum value of Aco that we would expect from this unit. Thefunction f(T) characterizes how the raw reference signal varies with cooler voltageV:
8-29f V( ) = + 0.8b e
0.2
1 + × c V( 2.5)−
Average values of b and c are 1.6 and 3.2, but the values for a particular unit arefound on its calibration sheet. Figure 8-1 below illustrates this function by showingthe range of responses for a large population of LI-7500RSs.
Figure 8-1. The function f(T) characterizes how the raw reference signal varies with tem-perature.
8-8 LI-7500RS Open Path CO2/H2O Analyzer
The Cx value is determined at the factory, but it is not really a “factory parameter”; itwill likely change over time, due to source or detector aging, or even some thin-film contaminant that gets on a window that you just can’t clean off. Thus, theLI-7500RS has a provision for you to easily reset Cx to a value that reflects the realityof your instrument at any point in time. The Calibration button of the WindowsInterface program (see Calibration on page 4-1) opens a window with a SignalStrength tab. There you will find a button labeled “Reset Signal Strength” that youcan push if you’ve decided your instrument is as clean as you can reasonably makeit, and you want to reset the signal strength to 100. It does this by using the currentvalue of Aco and performing the following computation:
8-30C =xA
f V( )
co
A signal strength-based value is available from the LI-7500RS when using the PCsoftware. The instrument’s grammar also makes Sc available for output.
Section 8. Theory of Operation
8-9CO2 Signal Strength

Section 8. Theory of Operation
8-10 LI-7500RS Open Path CO2/H2O Analyzer
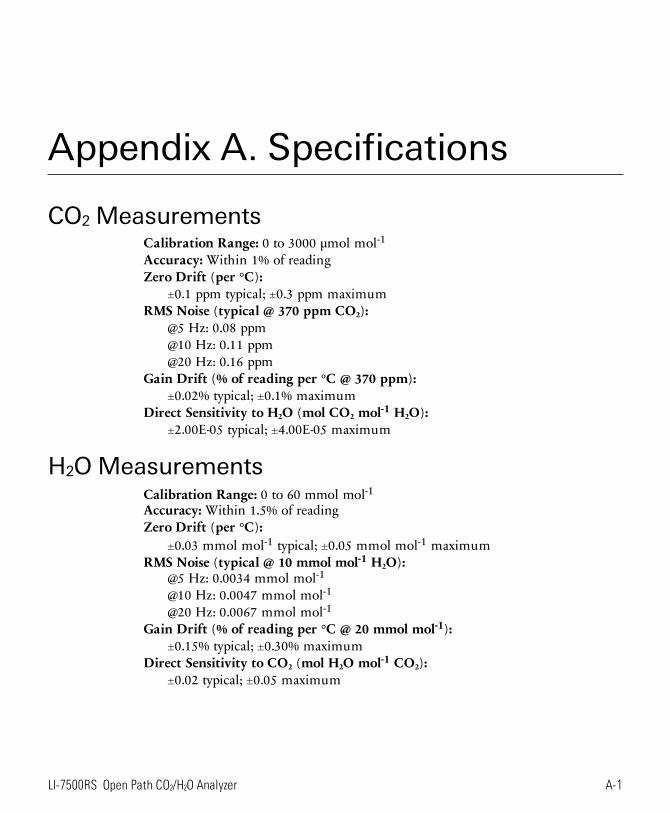
Appendix A. Specifications
CO2MeasurementsCalibration Range: 0 to 3000 µmol mol-1Accuracy: Within 1% of readingZero Drift (per °C):
±0.1 ppm typical; ±0.3 ppm maximumRMS Noise (typical @ 370 ppm CO2):
@5 Hz: 0.08 ppm@10 Hz: 0.11 ppm@20 Hz: 0.16 ppm
Gain Drift (% of reading per °C @ 370 ppm):±0.02% typical; ±0.1% maximum
Direct Sensitivity to H2O (mol CO2 mol-1 H2O):±2.00E-05 typical; ±4.00E-05 maximum
H2OMeasurementsCalibration Range: 0 to 60 mmol mol-1Accuracy: Within 1.5% of readingZero Drift (per °C):
±0.03 mmol mol-1 typical; ±0.05 mmol mol-1 maximum RMS Noise (typical @ 10 mmol mol-1 H2O):
@5 Hz: 0.0034 mmol mol-1@10 Hz: 0.0047 mmol mol-1@20 Hz: 0.0067 mmol mol-1
Gain Drift (% of reading per °C @ 20 mmol mol-1):±0.15% typical; ±0.30% maximum
Direct Sensitivity to CO2 (mol H2O mol-1 CO2):±0.02 typical; ±0.05 maximum
A-1LI-7500RS Open Path CO2/H2O Analyzer
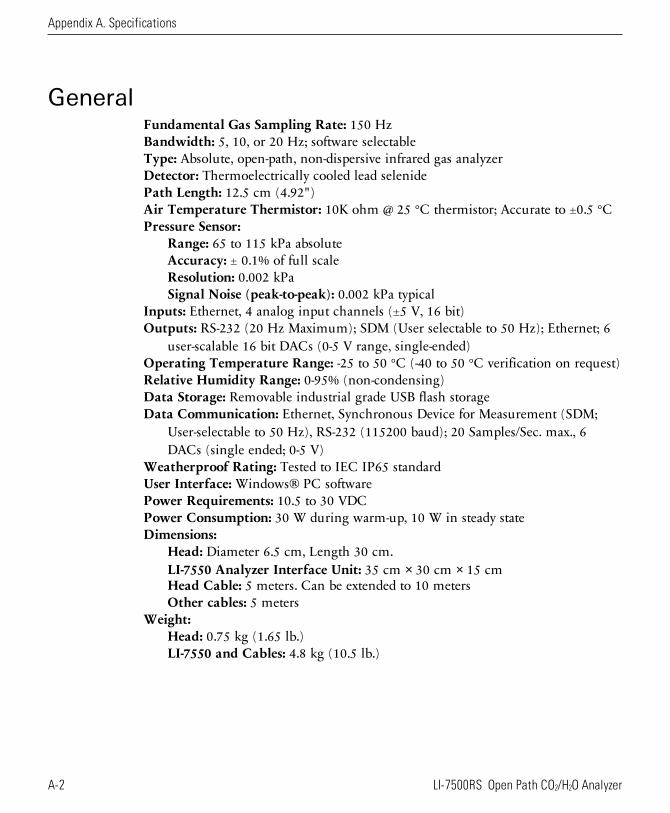
Appendix A. Specifications
GeneralFundamental Gas Sampling Rate: 150 HzBandwidth: 5, 10, or 20 Hz; software selectableType: Absolute, open-path, non-dispersive infrared gas analyzerDetector: Thermoelectrically cooled lead selenidePath Length: 12.5 cm (4.92")Air Temperature Thermistor: 10K ohm @ 25 °C thermistor; Accurate to ±0.5 °CPressure Sensor:
Range: 65 to 115 kPa absoluteAccuracy: ± 0.1% of full scaleResolution: 0.002 kPaSignal Noise (peak-to-peak): 0.002 kPa typical
Inputs: Ethernet, 4 analog input channels (±5 V, 16 bit)Outputs: RS-232 (20 Hz Maximum); SDM (User selectable to 50 Hz); Ethernet; 6
user-scalable 16 bit DACs (0-5 V range, single-ended)Operating Temperature Range: -25 to 50 °C (-40 to 50 °C verification on request)Relative Humidity Range: 0-95% (non-condensing)Data Storage: Removable industrial grade USB flash storageData Communication: Ethernet, Synchronous Device for Measurement (SDM;
User-selectable to 50 Hz), RS-232 (115200 baud); 20 Samples/Sec. max., 6DACs (single ended; 0-5 V)
Weatherproof Rating: Tested to IEC IP65 standardUser Interface: Windows® PC softwarePower Requirements: 10.5 to 30 VDCPower Consumption: 30 W during warm-up, 10 W in steady stateDimensions:
Head: Diameter 6.5 cm, Length 30 cm.LI-7550 Analyzer Interface Unit: 35 cm × 30 cm × 15 cmHead Cable: 5 meters. Can be extended to 10 metersOther cables: 5 meters
Weight:Head: 0.75 kg (1.65 lb.)LI-7550 and Cables: 4.8 kg (10.5 lb.)
A-2 LI-7500RS Open Path CO2/H2O Analyzer

Gas Analyzer Dimensions
Appendix A. Specifications
A-3Appendix A. Specifications
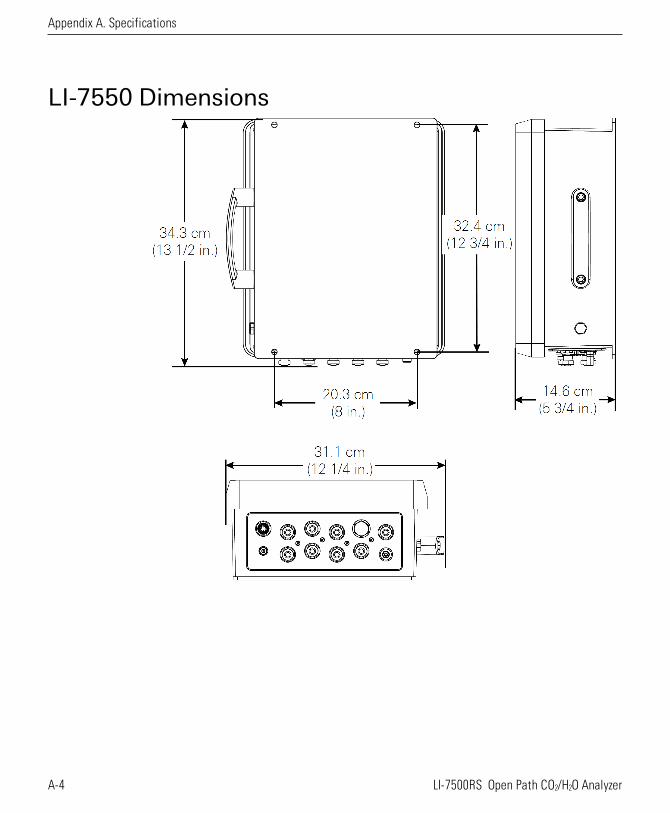
Appendix A. Specifications
LI-7550 Dimensions
A-4 LI-7500RS Open Path CO2/H2O Analyzer

Appendix B. Pin Assignments
SDM
POWER
AUXILIARY INPUT DAC OUTPUT
INPUT: 10.5 - 30VDC
FUSE: 5A F 125/250V
PIN 1
PIN 2
PIN 3
PIN 4
COUPLING
BROWN
WHITE
BLUE
BLACK
BARE
SDM_EN
SDM_CLK
SDM_DATA
GND
EARTH GND
PIN 1
PIN 2
PIN 3
PIN 4
PIN 5
PIN 6
PIN 7
PIN 8
PIN 9
PIN 10
PIN 11
PIN 12
WHITE
BROWN
GREEN
YELLOW
GREY
PINK
BLUE
RED
ORANGE
TAN
BLACK
VIOLET
AUX1+
AUX1-
AUX2+
AUX2-
AUX3+
AUX3-
AUX4+
AUX4-
+5V
GND
GND
GND
PIN 1
PIN 2
PIN 3
PIN 4
PIN 5
PIN 6
PIN 7
PIN 8
PIN 9
PIN 10
PIN 11
PIN 12
WHITE
BROWN
GREEN
YELLOW
GREY
PINK
BLUE
RED
ORANGE
TAN
BLACK
VIOLET
DAC1
DAC2
DAC3
DAC4
DAC5
DAC6
READY
NC
NC
GND
GND
GND
PIN 1
PIN 2
PIN 3
PIN 4
VIN-
VIN-
VIN+
VIN+
BROWN
WHITE
BLUE
BLACK
LI-7550 Pin Assignments
BLACK
RED
DB-9 Connector on RS-232 CableThe serial cable (part number 392-10268) has a roundconnector that attaches to the LI-7550 and a femaleDB-9 connector attaches to a computer. Note that notall pins are used for communication between theLI-7550 and a computer.
B-1LI-7500RS Open Path CO2/H2O Analyzer

Appendix B. Pin Assignments
B-2 LI-7500RS Open Path CO2/H2O Analyzer
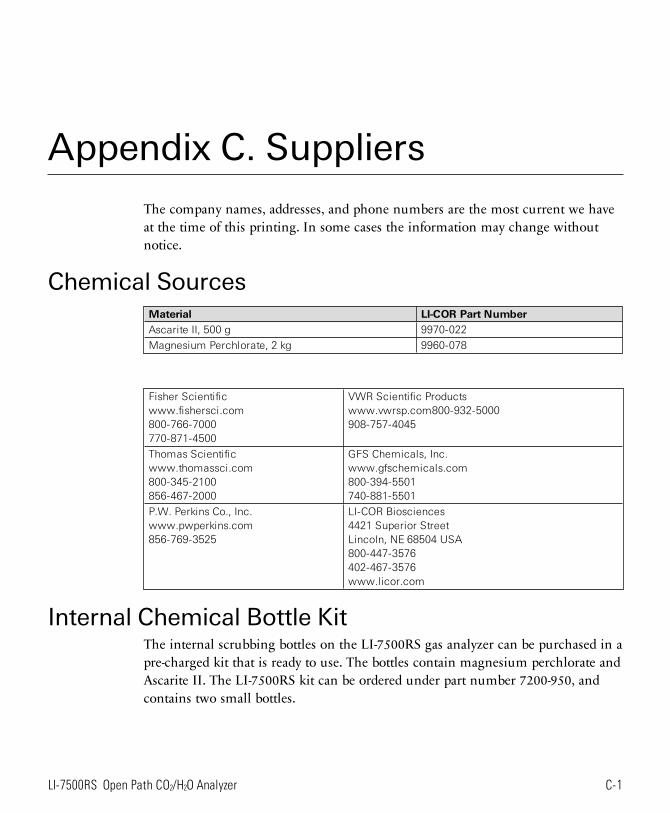
Appendix C. SuppliersThe company names, addresses, and phone numbers are the most current we haveat the time of this printing. In some cases the information may change withoutnotice.
Chemical SourcesMaterial LI-COR Part NumberAscarite II, 500 g 9970-022
Magnesium Perchlorate, 2 kg 9960-078
Fisher Scientificwww.fishersci.com800-766-7000770-871-4500
VWR Scientific Productswww.vwrsp.com800-932-5000908-757-4045
Thomas Scientificwww.thomassci.com800-345-2100856-467-2000
GFS Chemicals, Inc.www.gfschemicals.com800-394-5501740-881-5501
P.W. Perkins Co., Inc.www.pwperkins.com856-769-3525
LI-COR Biosciences4421 Superior StreetLincoln, NE 68504 USA800-447-3576402-467-3576www.licor.com
Internal Chemical Bottle KitThe internal scrubbing bottles on the LI-7500RS gas analyzer can be purchased in apre-charged kit that is ready to use. The bottles contain magnesium perchlorate andAscarite II. The LI-7500RS kit can be ordered under part number 7200-950, andcontains two small bottles.
C-1LI-7500RS Open Path CO2/H2O Analyzer
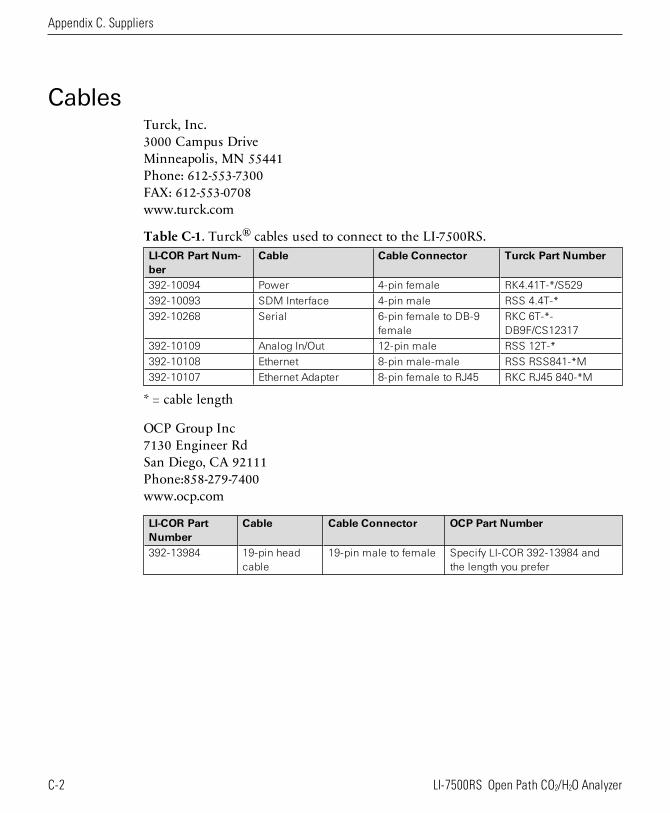
Appendix C. Suppliers
CablesTurck, Inc.3000 Campus DriveMinneapolis, MN 55441Phone: 612-553-7300FAX: 612-553-0708www.turck.com
LI-COR Part Num-ber
Cable Cable Connector Turck Part Number
392-10094 Power 4-pin female RK4.41T-*/S529
392-10093 SDM Interface 4-pin male RSS 4.4T-*
392-10268 Serial 6-pin female to DB-9female
RKC 6T-*-DB9F/CS12317
392-10109 Analog In/Out 12-pin male RSS 12T-*
392-10108 Ethernet 8-pin male-male RSS RSS841-*M
392-10107 Ethernet Adapter 8-pin female to RJ45 RKC RJ45 840-*M
Table C-1. Turck® cables used to connect to the LI-7500RS.
* = cable length
OCP Group Inc7130 Engineer RdSan Diego, CA 92111Phone:858-279-7400www.ocp.com
LI-COR PartNumber
Cable Cable Connector OCP Part Number
392-13984 19-pin headcable
19-pin male to female Specify LI-COR 392-13984 andthe length you prefer
C-2 LI-7500RS Open Path CO2/H2O Analyzer

Industrial Rated USB Flash Drives16 GB industrial grade drives are available directly from LI-COR. Contact us formore information.
NOTE: The USB flash drive listed below has been tested by LI-COR; if you wantto use other drives in the LI-7550, please contact LI-COR for more information.
APRO Co., Ltd.www.apro-tw.com16GB Drive:LI-COR Part Number: 616-10723APRO Part Number: WMUFD016G-ACCMC/3C
Appendix C. Suppliers
C-3Appendix C. Suppliers

Appendix C. Suppliers
C-4 LI-7500RS Open Path CO2/H2O Analyzer
Appendix D. ConfigurationGrammar
Note: This grammar supports the core features of the instrument, but some func-tions are not fully described. Contact technical support at [email protected] you have questions.
This section describes the protocol used by the instrument to communicate via RS-232 and Ethernet, for both configuration and data output purposes. Commandssent to the instrument have a certain structure that must be followed, and data sentby the instrument comes packaged in a particular way. For example, to set the Band-width to 10Hz, the following string
(Outputs(BW 10))
should be sent followed by a line feed character (decimal 10). Each commandbegins with a left parenthesis ‘(‘, and ends with a right parenthesis ‘)’. Some com-mands, such as (BW...) contain a single value, while other commands, such as(Outputs...), can contain one or more commands. The parentheses mark thestart and stop of the command, and extra characters before or after are ignored, aswell as white space (spaces and tabs) before or after the parentheses. This stringwould work equally as well, for example:
This is ignored ( Outputs (BW 10 )) and so is this
The LI-7500RS does not try parsing a command string until a line feed is received.Since "extra" characters are ignored, commands can be terminated with carriagereturn and line feeds equally as well.
Another example of a command string is
(Outputs(RS232(Freq 10)(Pres TRUE))(BW 5))
D-1LI-7500RS Open Path CO2/H2O Analyzer
Appendix D. Configuration Grammar
In this case, we are setting the RS-232 output frequency to 10Hz, requesting thatPressure be included in the output records, and that the bandwidth be 5 Hz. Noticethe 2 parentheses at the end of (Pres TRUE)). This is because (Pres..) and(Freq..) are (RS232..) commands, while (BW..) is not. (BW..) and (RS232..)
are both (Outputs..) commands, however, and the “extra” parenthesis at the endof (BW 5)) signals the end of the (Outputs..) command.
An illegal command string would be
(BW 5)
because the (BW...) command is only recognized within the context of an (Out-
puts...) command.
The configuration grammar is case sensitive. That is, (Outputs(BW 10)) will work,while (outputs(bw 10)) will not.
Who Sends WhatNot all of the commands in the instrument grammar are really commands. Someare designed to be used by the instrument to package outgoing data. The (Data..)
command, or record, might look like this
(Data (CO2D 2.2083146e1)(H2OD 3.5485935e2)(Temp 2.5886261e1)(Pres9.8157062e1))
This record is showing the latest values of CO2 and H2O mole density (mmol m-3),temperature (°C), and pressure (kPa). The fields present in a (Data..) record, andhow often they are output, is determined by the (Outputs..) command.
Once it has established communications with a host computer (discussed in thenext section), the instrument’s RS-232 communications is largely made of up ofoutgoing (Data..) and (Diagnostics..) records. The only other type of recordsit might send are (Error..) and (Ack..). The (Error..) record is sent wheneverthe instrument receives a command it cannot parse or recognize, and the (Ack..)
record acknowledges a configuration change. It is also used to pass back the newzero or span setting after a (Calibrate..) command.
Command SummaryIn the following sections, some abbreviations are used:
D-2 LI-7500RS Open Path CO2/H2O Analyzer
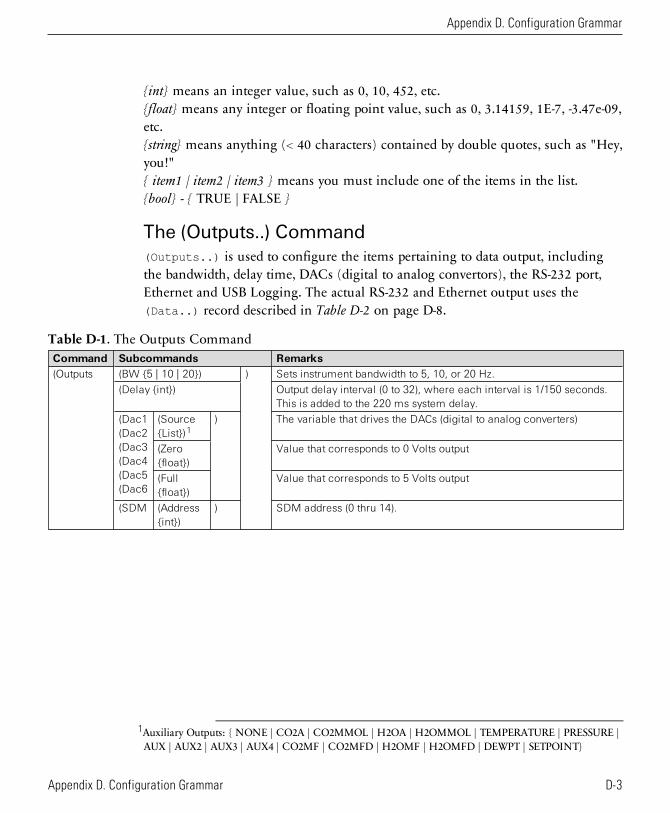
int means an integer value, such as 0, 10, 452, etc.float means any integer or floating point value, such as 0, 3.14159, 1E-7, -3.47e-09,etc.string means anything (< 40 characters) contained by double quotes, such as "Hey,you!" item1 | item2 | item3 means you must include one of the items in the list.bool - TRUE | FALSE
The (Outputs..) Command(Outputs..) is used to configure the items pertaining to data output, includingthe bandwidth, delay time, DACs (digital to analog convertors), the RS-232 port,Ethernet and USB Logging. The actual RS-232 and Ethernet output uses the(Data..) record described in Table D-2 on page D-8.
Command Subcommands Remarks(Outputs (BW 5 | 10 | 20) ) Sets instrument bandwidth to 5, 10, or 20 Hz.
(Delay int) Output delay interval (0 to 32), where each interval is 1/150 seconds.This is added to the 220 ms system delay.
(Dac1(Dac2(Dac3(Dac4(Dac5(Dac6
(SourceList)1
) The variable that drives the DACs (digital to analog converters)
(Zerofloat)
Value that corresponds to 0 Volts output
(Fullfloat)
Value that corresponds to 5 Volts output
(SDM (Addressint)
) SDM address (0 thru 14).
Table D-1. The Outputs Command
1Auxiliary Outputs: NONE | CO2A | CO2MMOL | H2OA | H2OMMOL | TEMPERATURE | PRESSURE |AUX | AUX2 | AUX3 | AUX4 | CO2MF | CO2MFD | H2OMF | H2OMFD | DEWPT | SETPOINT
Appendix D. Configuration Grammar
D-3Appendix D. Configuration Grammar
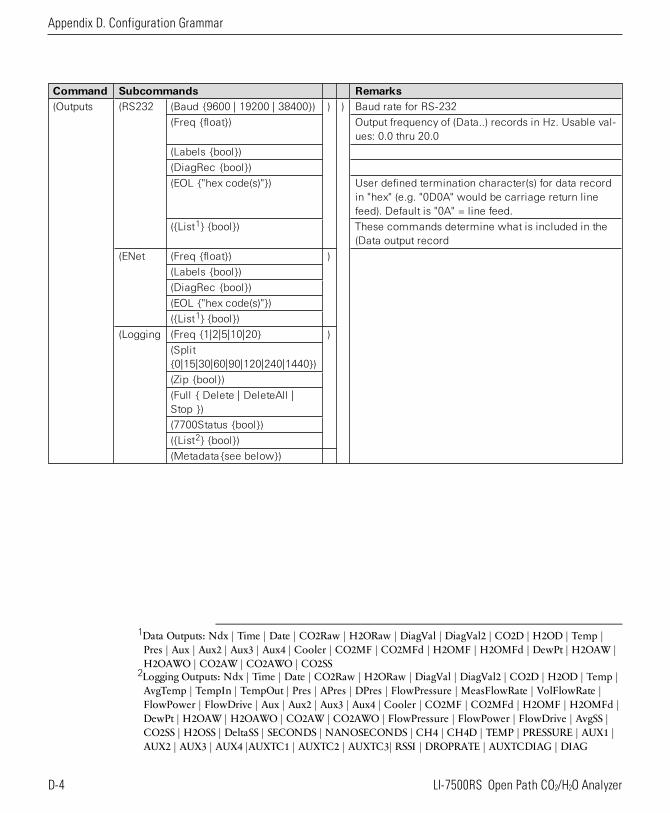
Appendix D. Configuration Grammar
Command Subcommands Remarks(Outputs (RS232 (Baud 9600 | 19200 | 38400) ) ) Baud rate for RS-232
(Freq float) Output frequency of (Data..) records in Hz. Usable val-ues: 0.0 thru 20.0
(Labels bool)
(DiagRec bool)
(EOL "hex code(s)") User defined termination character(s) for data recordin "hex" (e.g. "0D0A" would be carriage return linefeed). Default is "0A" = line feed.
(List1 bool) These commands determine what is included in the(Data output record
(ENet (Freq float) )
(Labels bool)
(DiagRec bool)
(EOL "hex code(s)")
(List1 bool)
(Logging (Freq 1|2|5|10|20 )
(Split0|15|30|60|90|120|240|1440)
(Zip bool)
(Full Delete | DeleteAll |Stop )
(7700Status bool)
(List2 bool)
(Metadatasee below)
1Data Outputs: Ndx | Time | Date | CO2Raw | H2ORaw | DiagVal | DiagVal2 | CO2D | H2OD | Temp |Pres | Aux | Aux2 | Aux3 | Aux4 | Cooler | CO2MF | CO2MFd | H2OMF | H2OMFd | DewPt | H2OAW |H2OAWO | CO2AW | CO2AWO | CO2SS
2Logging Outputs: Ndx | Time | Date | CO2Raw | H2ORaw | DiagVal | DiagVal2 | CO2D | H2OD | Temp |AvgTemp | TempIn | TempOut | Pres | APres | DPres | FlowPressure | MeasFlowRate | VolFlowRate |FlowPower | FlowDrive | Aux | Aux2 | Aux3 | Aux4 | Cooler | CO2MF | CO2MFd | H2OMF | H2OMFd |DewPt | H2OAW | H2OAWO | CO2AW | CO2AWO | FlowPressure | FlowPower | FlowDrive | AvgSS |CO2SS | H2OSS | DeltaSS | SECONDS | NANOSECONDS | CH4 | CH4D | TEMP | PRESSURE | AUX1 |AUX2 | AUX3 | AUX4 |AUXTC1 | AUXTC2 | AUXTC3| RSSI | DROPRATE | AUXTCDIAG | DIAG
D-4 LI-7500RS Open Path CO2/H2O Analyzer
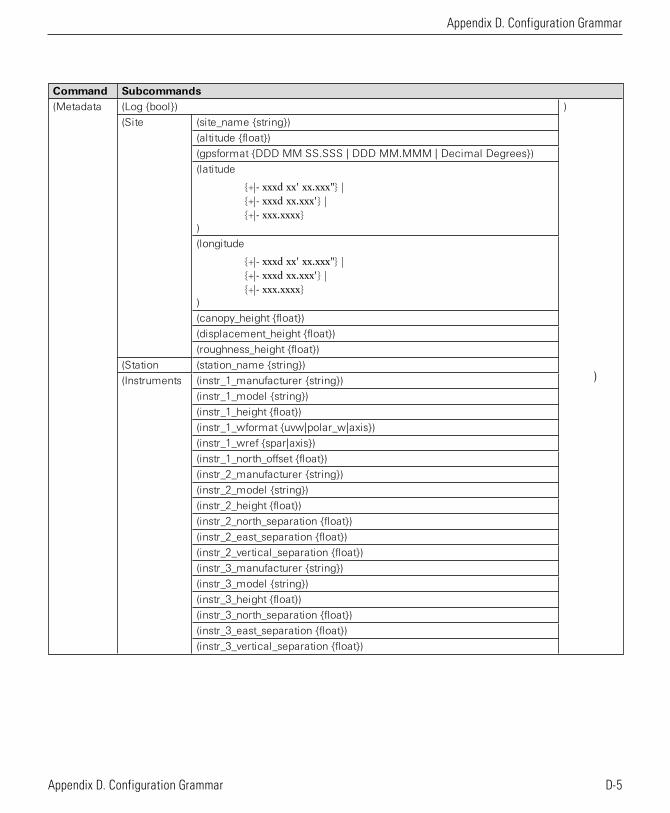
Command Subcommands(Metadata (Log bool) )
)
(Site (site_name string)
(altitude float)
(gpsformat DDD MM SS.SSS | DDD MM.MMM | Decimal Degrees)
(latitude
+|- xxxd xx' xx.xxx" |+|- xxxd xx.xxx' |+|- xxx.xxxx
)
(longitude
+|- xxxd xx' xx.xxx" |+|- xxxd xx.xxx' |+|- xxx.xxxx
)
(canopy_height float)
(displacement_height float)
(roughness_height float)
(Station (station_name string)
(Instruments (instr_1_manufacturer string)
(instr_1_model string)
(instr_1_height float)
(instr_1_wformat uvw|polar_w|axis)
(instr_1_wref spar|axis)
(instr_1_north_offset float)
(instr_2_manufacturer string)
(instr_2_model string)
(instr_2_height float)
(instr_2_north_separation float)
(instr_2_east_separation float)
(instr_2_vertical_separation float)
(instr_3_manufacturer string)
(instr_3_model string)
(instr_3_height float)
(instr_3_north_separation float)
(instr_3_east_separation float)
(instr_3_vertical_separation float)
Appendix D. Configuration Grammar
D-5Appendix D. Configuration Grammar
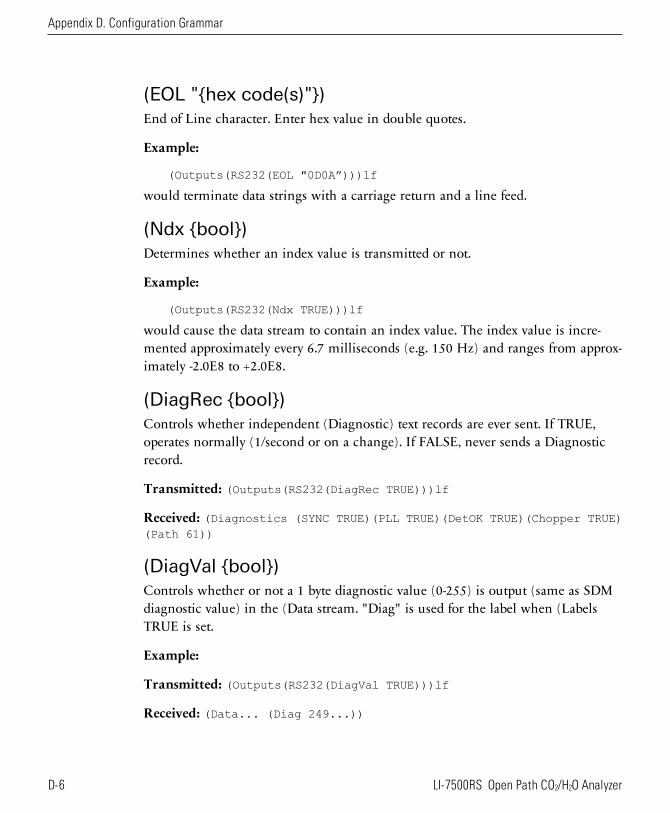
Appendix D. Configuration Grammar
(EOL "hex code(s)")End of Line character. Enter hex value in double quotes.
Example:
(Outputs(RS232(EOL "0D0A”)))lf
would terminate data strings with a carriage return and a line feed.
(Ndx bool)Determines whether an index value is transmitted or not.
Example:
(Outputs(RS232(Ndx TRUE)))lf
would cause the data stream to contain an index value. The index value is incre-mented approximately every 6.7 milliseconds (e.g. 150 Hz) and ranges from approx-imately -2.0E8 to +2.0E8.
(DiagRec bool)Controls whether independent (Diagnostic) text records are ever sent. If TRUE,operates normally (1/second or on a change). If FALSE, never sends a Diagnosticrecord.
Transmitted: (Outputs(RS232(DiagRec TRUE)))lf
Received: (Diagnostics (SYNC TRUE)(PLL TRUE)(DetOK TRUE)(Chopper TRUE)(Path 61))
(DiagVal bool)Controls whether or not a 1 byte diagnostic value (0-255) is output (same as SDMdiagnostic value) in the (Data stream. "Diag" is used for the label when (LabelsTRUE is set.
Example:
Transmitted: (Outputs(RS232(DiagVal TRUE)))lf
Received: (Data... (Diag 249...))
D-6 LI-7500RS Open Path CO2/H2O Analyzer
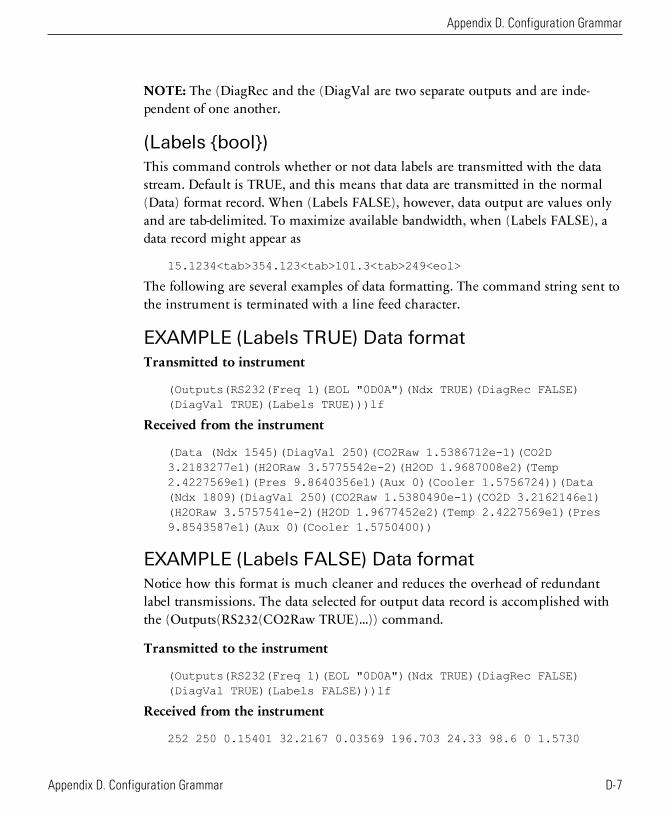
NOTE: The (DiagRec and the (DiagVal are two separate outputs and are inde-pendent of one another.
(Labels bool)This command controls whether or not data labels are transmitted with the datastream. Default is TRUE, and this means that data are transmitted in the normal(Data) format record. When (Labels FALSE), however, data output are values onlyand are tab-delimited. To maximize available bandwidth, when (Labels FALSE), adata record might appear as
15.1234<tab>354.123<tab>101.3<tab>249<eol>
The following are several examples of data formatting. The command string sent tothe instrument is terminated with a line feed character.
EXAMPLE (Labels TRUE) Data formatTransmitted to instrument
(Outputs(RS232(Freq 1)(EOL "0D0A")(Ndx TRUE)(DiagRec FALSE)(DiagVal TRUE)(Labels TRUE)))lf
Received from the instrument
(Data (Ndx 1545)(DiagVal 250)(CO2Raw 1.5386712e-1)(CO2D3.2183277e1)(H2ORaw 3.5775542e-2)(H2OD 1.9687008e2)(Temp2.4227569e1)(Pres 9.8640356e1)(Aux 0)(Cooler 1.5756724))(Data(Ndx 1809)(DiagVal 250)(CO2Raw 1.5380490e-1)(CO2D 3.2162146e1)(H2ORaw 3.5757541e-2)(H2OD 1.9677452e2)(Temp 2.4227569e1)(Pres9.8543587e1)(Aux 0)(Cooler 1.5750400))
EXAMPLE (Labels FALSE) Data formatNotice how this format is much cleaner and reduces the overhead of redundantlabel transmissions. The data selected for output data record is accomplished withthe (Outputs(RS232(CO2Raw TRUE)...)) command.
Transmitted to the instrument
(Outputs(RS232(Freq 1)(EOL "0D0A")(Ndx TRUE)(DiagRec FALSE)(DiagVal TRUE)(Labels FALSE)))lf
Received from the instrument
252 250 0.15401 32.2167 0.03569 196.703 24.33 98.6 0 1.5730
Appendix D. Configuration Grammar
D-7Appendix D. Configuration Grammar

Appendix D. Configuration Grammar
511 250 0.15404 32.2174 0.03572 196.816 24.42 98.5 0 1.5683765 250 0.15402 32.2342 0.03579 196.995 24.49 98.6 0 1.57031033 250 0.15400 32.2097 0.03571 196.771 24.63 98.5 0 1.57241288 250 0.15405 32.2341 0.03578 196.838 24.76 98.5 0 1.57341544 250 0.15406 32.2385 0.03575 196.782 24.72 98.5 0 1.5724
Examples:
To set the instrument to output only CO2 and H2O molar densities once every 2seconds:
(Outputs(RS232(Freq .5)(Pres FALSE)(Temp FALSE)(Aux FALSE)(CO2RawFALSE)(CO2D TRUE)(H2ORaw FALSE)(H2OD TRUE)(Cooler FALSE)))
To configure DAC #1 to output CO2 mole density with this scaling: 0V = 12 mmolm-3, and 5V = 15 mmol m-3.
(Outputs(Dac1(Source CO2MMOL)(Zero 12)(Full 15)))
Data and Status RecordsThe (Data..) and (Diagnostics..) records are the vehicles with which theinstrument outputs data through its RS-232 port. The frequency with which it out-puts (Data..) records is determined by the (Outputs(RS232(Freq..))) com-mand. Data and status record formats are determined by the (Outputs(RS232
(boolean controlled command structure. (EOL "hex codes") and (Labels
boolean) determine the termination characters and whether or not (Data labelsare output.
Record Subcommands Remarks(Data (Ndx int) ) Index value. Increments
by 150 every second.The values included areset by (Outputs(...)). Howoften this is output isdetermined by (Outputs(Freq...)).
(Time ) Time
(Date ) Date
(Temp float) Block temperature, °C
(Pres float) Total pressure, kPa
(Aux float) Auxiliary input value
(Aux2 float) Auxiliary input value 2
(Aux3 float) Auxiliary input value 3
(Aux4 float) Auxiliary input value 4
Table D-2. Data and Diagnostic Records
D-8 LI-7500RS Open Path CO2/H2O Analyzer
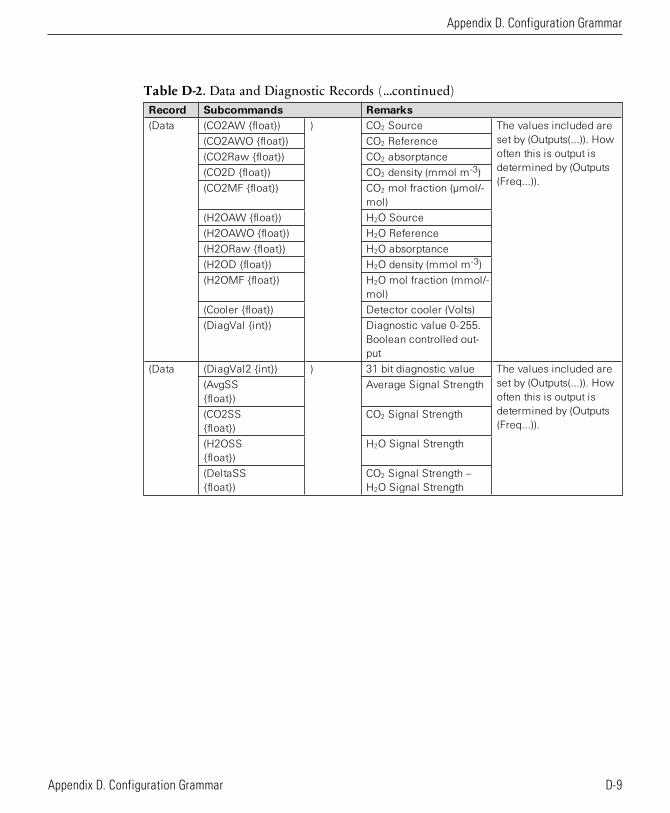
Record Subcommands Remarks(Data (CO2AW float) ) CO2 Source The values included are
set by (Outputs(...)). Howoften this is output isdetermined by (Outputs(Freq...)).
(CO2AWO float) CO2 Reference
(CO2Raw float) CO2 absorptance
(CO2D float) CO2 density (mmol m-3)
(CO2MF float) CO2 mol fraction (µmol/-mol)
(H2OAW float) H2O Source
(H2OAWO float) H2O Reference
(H2ORaw float) H2O absorptance
(H2OD float) H2O density (mmol m-3)
(H2OMF float) H2O mol fraction (mmol/-mol)
(Cooler float) Detector cooler (Volts)
(DiagVal int) Diagnostic value 0-255.Boolean controlled out-put
(Data (DiagVal2 int) ) 31 bit diagnostic value The values included areset by (Outputs(...)). Howoften this is output isdetermined by (Outputs(Freq...)).
(AvgSSfloat)
Average Signal Strength
(CO2SSfloat)
CO2 Signal Strength
(H2OSSfloat)
H2O Signal Strength
(DeltaSSfloat)
CO2 Signal Strength –H2O Signal Strength
Table D-2. Data and Diagnostic Records (...continued)
Appendix D. Configuration Grammar
D-9Appendix D. Configuration Grammar
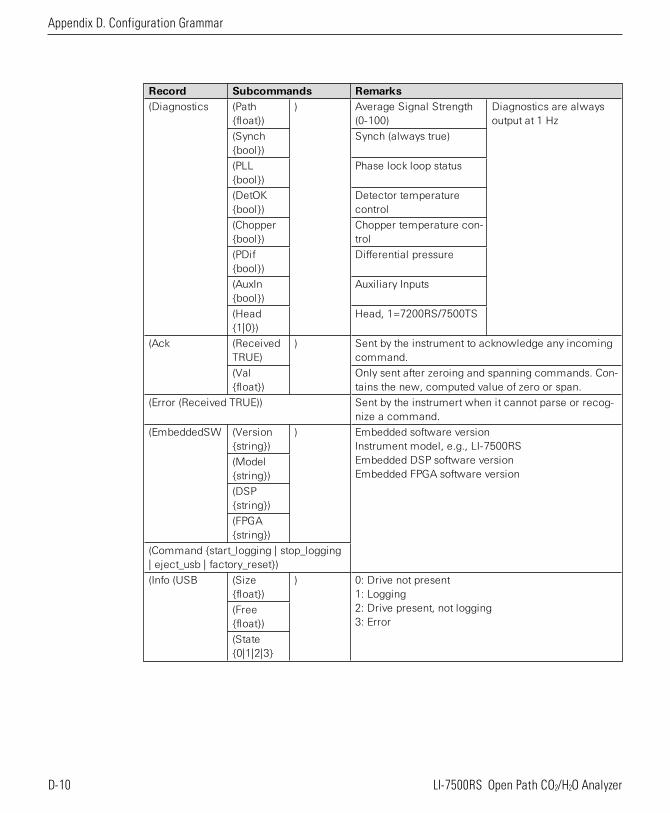
Appendix D. Configuration Grammar
Record Subcommands Remarks(Diagnostics (Path
float)) Average Signal Strength
(0-100)Diagnostics are alwaysoutput at 1 Hz
(Synchbool)
Synch (always true)
(PLLbool)
Phase lock loop status
(DetOKbool)
Detector temperaturecontrol
(Chopperbool)
Chopper temperature con-trol
(PDifbool)
Differential pressure
(AuxInbool)
Auxiliary Inputs
(Head1|0)
Head, 1=7200RS/7500TS
(Ack (ReceivedTRUE)
) Sent by the instrument to acknowledge any incomingcommand.
(Valfloat)
Only sent after zeroing and spanning commands. Con-tains the new, computed value of zero or span.
(Error (Received TRUE)) Sent by the instrumert when it cannot parse or recog-nize a command.
(EmbeddedSW (Versionstring)
) Embedded software versionInstrument model, e.g., LI-7500RSEmbedded DSP software versionEmbedded FPGA software version
(Modelstring)
(DSPstring)
(FPGAstring)
(Command start_logging | stop_logging| eject_usb | factory_reset)
(Info (USB (Sizefloat)
) 0: Drive not present1: Logging2: Drive present, not logging3: Error
(Freefloat)
(State0|1|2|3
D-10 LI-7500RS Open Path CO2/H2O Analyzer
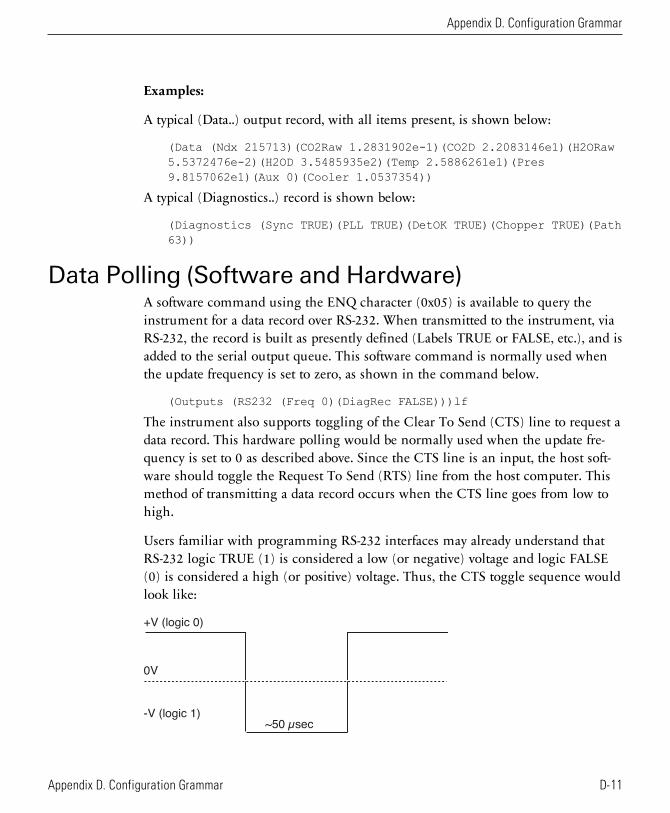
Examples:
A typical (Data..) output record, with all items present, is shown below:
(Data (Ndx 215713)(CO2Raw 1.2831902e-1)(CO2D 2.2083146e1)(H2ORaw5.5372476e-2)(H2OD 3.5485935e2)(Temp 2.5886261e1)(Pres9.8157062e1)(Aux 0)(Cooler 1.0537354))
A typical (Diagnostics..) record is shown below:
(Diagnostics (Sync TRUE)(PLL TRUE)(DetOK TRUE)(Chopper TRUE)(Path63))
Data Polling (Software and Hardware)A software command using the ENQ character (0x05) is available to query theinstrument for a data record over RS-232. When transmitted to the instrument, viaRS-232, the record is built as presently defined (Labels TRUE or FALSE, etc.), and isadded to the serial output queue. This software command is normally used whenthe update frequency is set to zero, as shown in the command below.
(Outputs (RS232 (Freq 0)(DiagRec FALSE)))lf
The instrument also supports toggling of the Clear To Send (CTS) line to request adata record. This hardware polling would be normally used when the update fre-quency is set to 0 as described above. Since the CTS line is an input, the host soft-ware should toggle the Request To Send (RTS) line from the host computer. Thismethod of transmitting a data record occurs when the CTS line goes from low tohigh.
Users familiar with programming RS-232 interfaces may already understand thatRS-232 logic TRUE (1) is considered a low (or negative) voltage and logic FALSE(0) is considered a high (or positive) voltage. Thus, the CTS toggle sequence wouldlook like:
+V (logic 0)
-V (logic 1)
0V
~50 µsec
Appendix D. Configuration Grammar
D-11Appendix D. Configuration Grammar
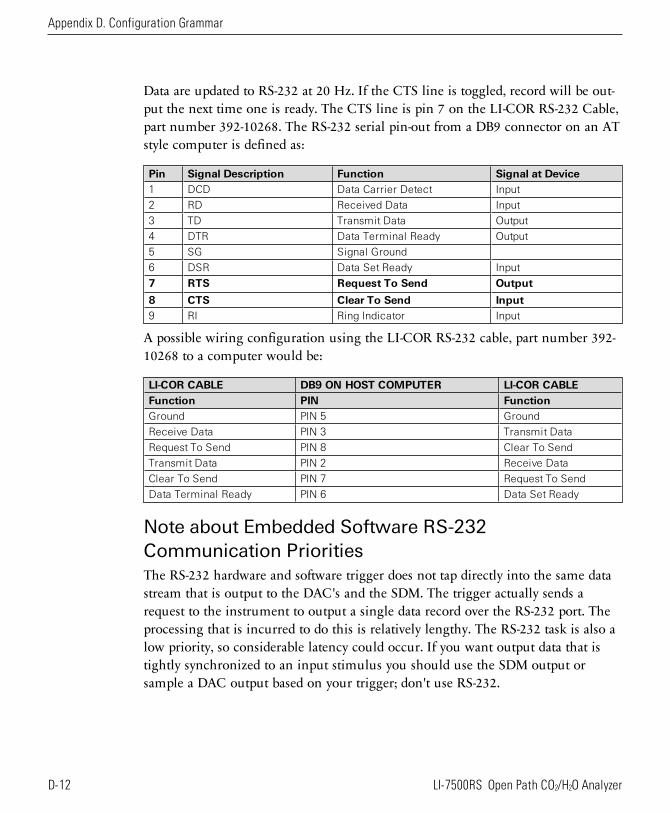
Appendix D. Configuration Grammar
Data are updated to RS-232 at 20 Hz. If the CTS line is toggled, record will be out-put the next time one is ready. The CTS line is pin 7 on the LI-COR RS-232 Cable,part number 392-10268. The RS-232 serial pin-out from a DB9 connector on an ATstyle computer is defined as:
Pin Signal Description Function Signal at Device1 DCD Data Carrier Detect Input
2 RD Received Data Input
3 TD Transmit Data Output
4 DTR Data Terminal Ready Output
5 SG Signal Ground
6 DSR Data Set Ready Input
7 RTS Request To Send Output
8 CTS Clear To Send Input9 RI Ring Indicator Input
A possible wiring configuration using the LI-COR RS-232 cable, part number 392-10268 to a computer would be:
LI-COR CABLE DB9 ON HOST COMPUTER LI-COR CABLEFunction PIN FunctionGround PIN 5 Ground
Receive Data PIN 3 Transmit Data
Request To Send PIN 8 Clear To Send
Transmit Data PIN 2 Receive Data
Clear To Send PIN 7 Request To Send
Data Terminal Ready PIN 6 Data Set Ready
Note about Embedded Software RS-232Communication PrioritiesThe RS-232 hardware and software trigger does not tap directly into the same datastream that is output to the DAC's and the SDM. The trigger actually sends arequest to the instrument to output a single data record over the RS-232 port. Theprocessing that is incurred to do this is relatively lengthy. The RS-232 task is also alow priority, so considerable latency could occur. If you want output data that istightly synchronized to an input stimulus you should use the SDM output orsample a DAC output based on your trigger; don't use RS-232.
D-12 LI-7500RS Open Path CO2/H2O Analyzer
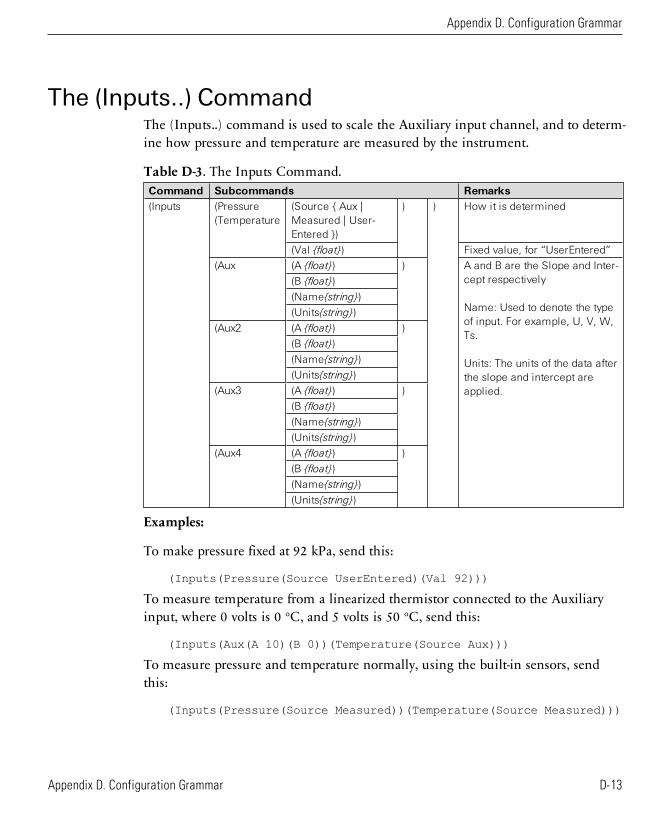
The (Inputs..) CommandThe (Inputs..) command is used to scale the Auxiliary input channel, and to determ-ine how pressure and temperature are measured by the instrument.
Command Subcommands Remarks(Inputs (Pressure
(Temperature(Source Aux |Measured | User-Entered )
) ) How it is determined
(Val float) Fixed value, for “UserEntered”
(Aux (A float) ) A and B are the Slope and Inter-cept respectively
Name: Used to denote the typeof input. For example, U, V, W,Ts.
Units: The units of the data afterthe slope and intercept areapplied.
(B float)
(Namestring)
(Unitsstring)
(Aux2 (A float) )
(B float)
(Namestring)
(Unitsstring)
(Aux3 (A float) )
(B float)
(Namestring)
(Unitsstring)
(Aux4 (A float) )
(B float)
(Namestring)
(Unitsstring)
Table D-3. The Inputs Command.
Examples:
To make pressure fixed at 92 kPa, send this:
(Inputs(Pressure(Source UserEntered)(Val 92)))
To measure temperature from a linearized thermistor connected to the Auxiliaryinput, where 0 volts is 0 °C, and 5 volts is 50 °C, send this:
(Inputs(Aux(A 10)(B 0))(Temperature(Source Aux)))
To measure pressure and temperature normally, using the built-in sensors, sendthis:
(Inputs(Pressure(Source Measured))(Temperature(Source Measured)))
Appendix D. Configuration Grammar
D-13Appendix D. Configuration Grammar
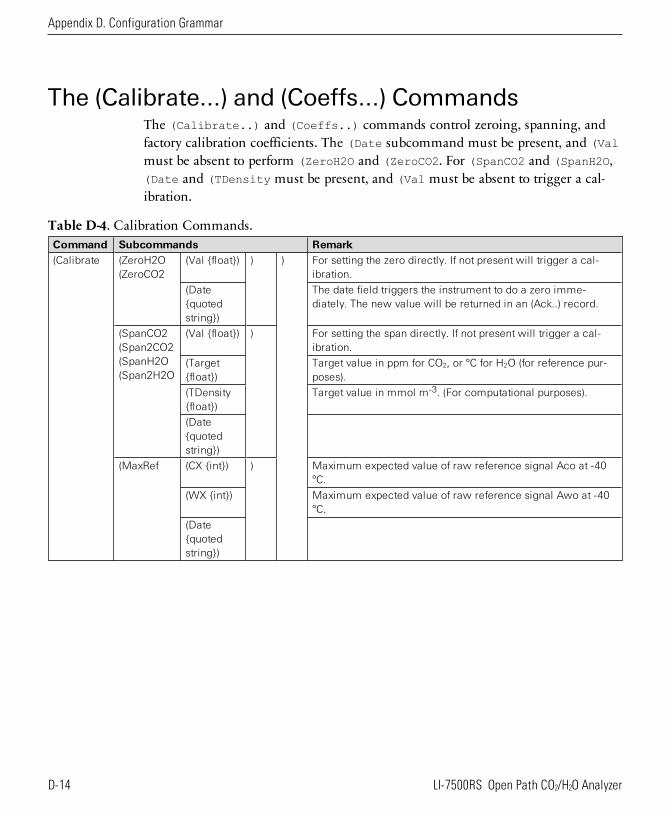
Appendix D. Configuration Grammar
The (Calibrate...) and (Coeffs...) CommandsThe (Calibrate..) and (Coeffs..) commands control zeroing, spanning, andfactory calibration coefficients. The (Date subcommand must be present, and (Val
must be absent to perform (ZeroH2O and (ZeroCO2. For (SpanCO2 and (SpanH2O,(Date and (TDensity must be present, and (Val must be absent to trigger a cal-ibration.
Command Subcommands Remark(Calibrate (ZeroH2O
(ZeroCO2(Val float) ) ) For setting the zero directly. If not present will trigger a cal-
ibration.
(Datequotedstring)
The date field triggers the instrument to do a zero imme-diately. The new value will be returned in an (Ack..) record.
(SpanCO2(Span2CO2(SpanH2O(Span2H2O
(Val float) ) For setting the span directly. If not present will trigger a cal-ibration.
(Targetfloat)
Target value in ppm for CO2, or °C for H2O (for reference pur-poses).
(TDensityfloat)
Target value in mmol m-3. (For computational purposes).
(Datequotedstring)
(MaxRef (CX int) ) Maximum expected value of raw reference signal Aco at -40°C.
(WX int) Maximum expected value of raw reference signal Awo at -40°C.
(Datequotedstring)
Table D-4. Calibration Commands.
D-14 LI-7500RS Open Path CO2/H2O Analyzer
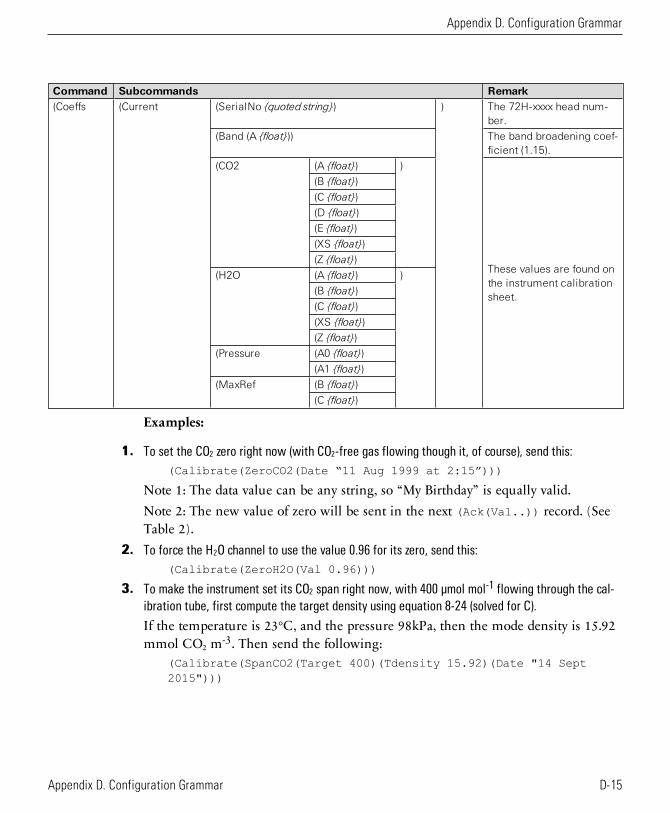
Command Subcommands Remark(Coeffs (Current (SerialNo quoted string) ) The 72H-xxxx head num-
ber.
(Band (A float)) The band broadening coef-ficient (1.15).
(CO2 (A float) )
These values are found onthe instrument calibrationsheet.
(B float)
(C float)
(D float)
(E float)
(XS float)
(Z float)
(H2O (A float) )
(B float)
(C float)
(XS float)
(Z float)
(Pressure (A0 float)
(A1 float)
(MaxRef (B float)
(C float)
Examples:
1. To set the CO2 zero right now (with CO2-free gas flowing though it, of course), send this:(Calibrate(ZeroCO2(Date “11 Aug 1999 at 2:15”)))
Note 1: The data value can be any string, so “My Birthday” is equally valid.Note 2: The new value of zero will be sent in the next (Ack(Val..)) record. (SeeTable 2).
2. To force the H2O channel to use the value 0.96 for its zero, send this:(Calibrate(ZeroH2O(Val 0.96)))
3. To make the instrument set its CO2 span right now, with 400 µmol mol-1 flowing through the cal-ibration tube, first compute the target density using equation 8-24 (solved for C).
If the temperature is 23°C, and the pressure 98kPa, then the mode density is 15.92mmol CO2 m-3. Then send the following:
(Calibrate(SpanCO2(Target 400)(Tdensity 15.92)(Date "14 Sept2015")))
Appendix D. Configuration Grammar
D-15Appendix D. Configuration Grammar
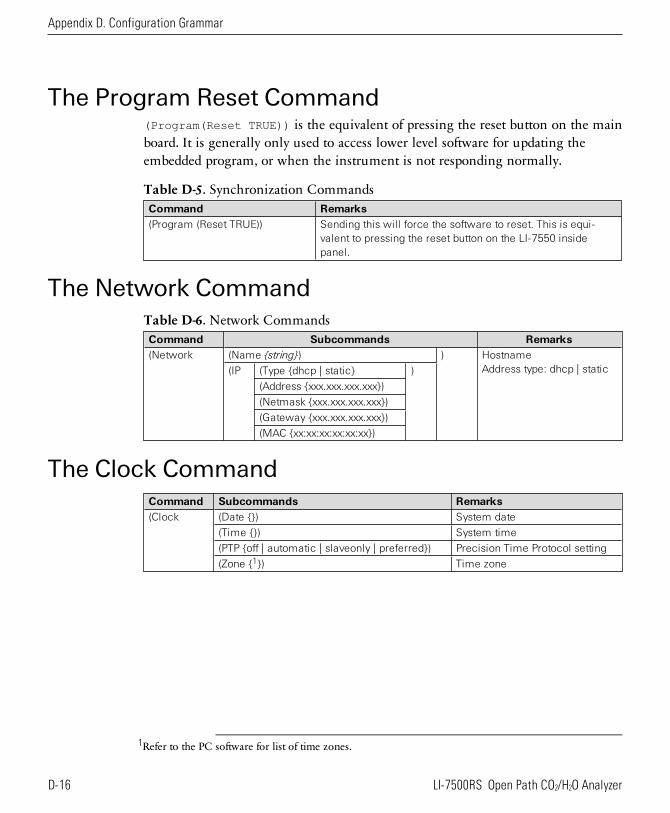
Appendix D. Configuration Grammar
The Program Reset Command(Program(Reset TRUE)) is the equivalent of pressing the reset button on the mainboard. It is generally only used to access lower level software for updating theembedded program, or when the instrument is not responding normally.
Command Remarks(Program (Reset TRUE)) Sending this will force the software to reset. This is equi-
valent to pressing the reset button on the LI-7550 insidepanel.
Table D-5. Synchronization Commands
The Network Command
Command Subcommands Remarks(Network (Name string) ) Hostname
Address type: dhcp | static(IP (Type dhcp | static )
(Address xxx.xxx.xxx.xxx)
(Netmask xxx.xxx.xxx.xxx)
(Gateway xxx.xxx.xxx.xxx)
(MAC xx:xx:xx:xx:xx:xx)
Table D-6. Network Commands
The Clock CommandCommand Subcommands Remarks(Clock (Date ) System date
(Time ) System time
(PTP off | automatic | slaveonly | preferred) Precision Time Protocol setting
(Zone 1) Time zone
1Refer to the PC software for list of time zones.
D-16 LI-7500RS Open Path CO2/H2O Analyzer
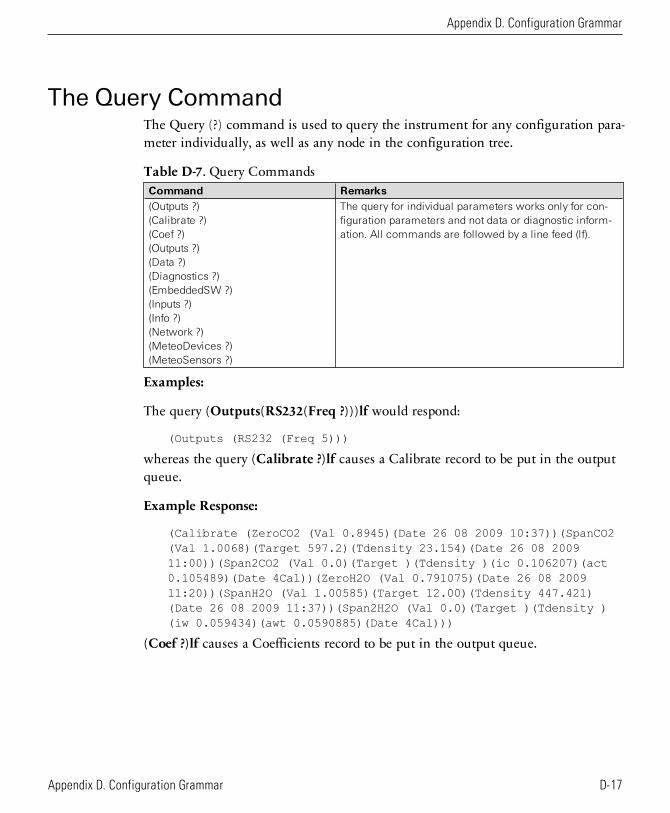
The Query CommandThe Query (?) command is used to query the instrument for any configuration para-meter individually, as well as any node in the configuration tree.
Command Remarks(Outputs ?)(Calibrate ?)(Coef ?)(Outputs ?)(Data ?)(Diagnostics ?)(EmbeddedSW ?)(Inputs ?)(Info ?)(Network ?)(MeteoDevices ?)(MeteoSensors ?)
The query for individual parameters works only for con-figuration parameters and not data or diagnostic inform-ation. All commands are followed by a line feed (lf).
Table D-7. Query Commands
Examples:
The query (Outputs(RS232(Freq ?)))lf would respond:
(Outputs (RS232 (Freq 5)))
whereas the query (Calibrate ?)lf causes a Calibrate record to be put in the outputqueue.
Example Response:
(Calibrate (ZeroCO2 (Val 0.8945)(Date 26 08 2009 10:37))(SpanCO2(Val 1.0068)(Target 597.2)(Tdensity 23.154)(Date 26 08 200911:00))(Span2CO2 (Val 0.0)(Target )(Tdensity )(ic 0.106207)(act0.105489)(Date 4Cal))(ZeroH2O (Val 0.791075)(Date 26 08 200911:20))(SpanH2O (Val 1.00585)(Target 12.00)(Tdensity 447.421)(Date 26 08 2009 11:37))(Span2H2O (Val 0.0)(Target )(Tdensity )(iw 0.059434)(awt 0.0590885)(Date 4Cal)))
(Coef ?)lf causes a Coefficients record to be put in the output queue.
Appendix D. Configuration Grammar
D-17Appendix D. Configuration Grammar
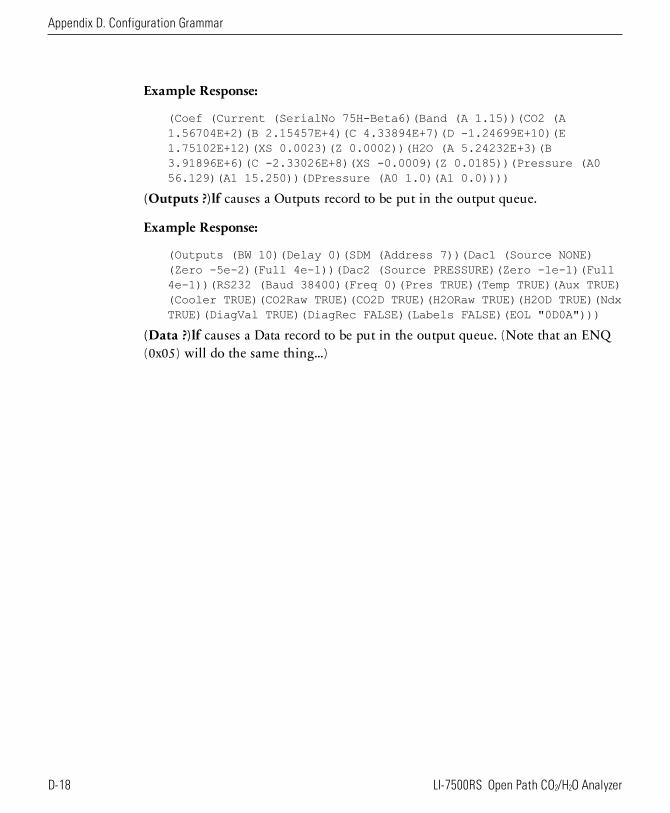
Appendix D. Configuration Grammar
Example Response:
(Coef (Current (SerialNo 75H-Beta6)(Band (A 1.15))(CO2 (A1.56704E+2)(B 2.15457E+4)(C 4.33894E+7)(D -1.24699E+10)(E1.75102E+12)(XS 0.0023)(Z 0.0002))(H2O (A 5.24232E+3)(B3.91896E+6)(C -2.33026E+8)(XS -0.0009)(Z 0.0185))(Pressure (A056.129)(A1 15.250))(DPressure (A0 1.0)(A1 0.0))))
(Outputs ?)lf causes a Outputs record to be put in the output queue.
Example Response:
(Outputs (BW 10)(Delay 0)(SDM (Address 7))(Dac1 (Source NONE)(Zero -5e-2)(Full 4e-1))(Dac2 (Source PRESSURE)(Zero -1e-1)(Full4e-1))(RS232 (Baud 38400)(Freq 0)(Pres TRUE)(Temp TRUE)(Aux TRUE)(Cooler TRUE)(CO2Raw TRUE)(CO2D TRUE)(H2ORaw TRUE)(H2OD TRUE)(NdxTRUE)(DiagVal TRUE)(DiagRec FALSE)(Labels FALSE)(EOL "0D0A")))
(Data ?)lf causes a Data record to be put in the output queue. (Note that an ENQ(0x05) will do the same thing...)
D-18 LI-7500RS Open Path CO2/H2O Analyzer
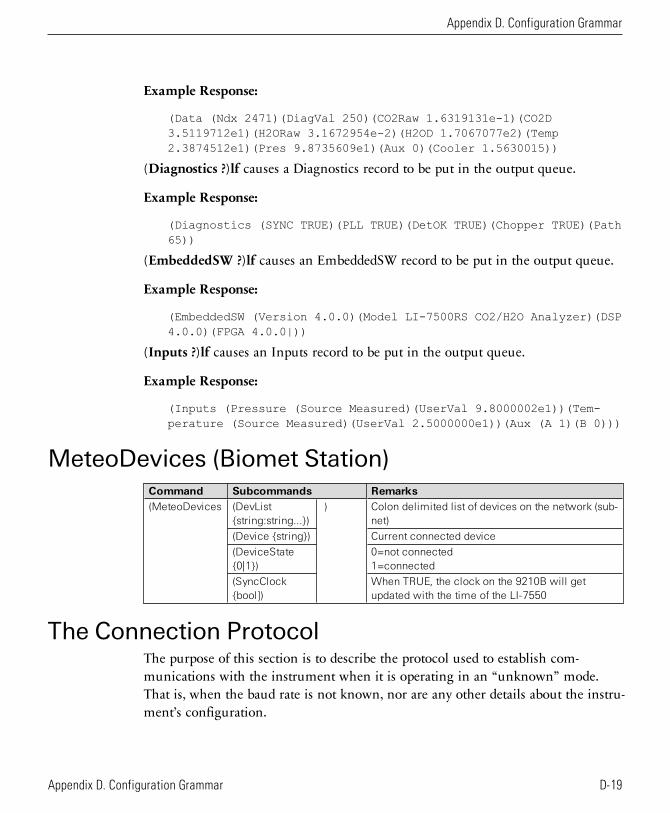
Example Response:
(Data (Ndx 2471)(DiagVal 250)(CO2Raw 1.6319131e-1)(CO2D3.5119712e1)(H2ORaw 3.1672954e-2)(H2OD 1.7067077e2)(Temp2.3874512e1)(Pres 9.8735609e1)(Aux 0)(Cooler 1.5630015))
(Diagnostics ?)lf causes a Diagnostics record to be put in the output queue.
Example Response:
(Diagnostics (SYNC TRUE)(PLL TRUE)(DetOK TRUE)(Chopper TRUE)(Path65))
(EmbeddedSW ?)lf causes an EmbeddedSW record to be put in the output queue.
Example Response:
(EmbeddedSW (Version 4.0.0)(Model LI-7500RS CO2/H2O Analyzer)(DSP4.0.0)(FPGA 4.0.0|))
(Inputs ?)lf causes an Inputs record to be put in the output queue.
Example Response:
(Inputs (Pressure (Source Measured)(UserVal 9.8000002e1))(Tem-perature (Source Measured)(UserVal 2.5000000e1))(Aux (A 1)(B 0)))
MeteoDevices (Biomet Station)Command Subcommands Remarks(MeteoDevices (DevList
string:string...) ) Colon delimited list of devices on the network (sub-
net)
(Device string) Current connected device
(DeviceState0|1)
0=not connected1=connected
(SyncClockbool])
When TRUE, the clock on the 9210B will getupdated with the time of the LI-7550
The Connection ProtocolThe purpose of this section is to describe the protocol used to establish com-munications with the instrument when it is operating in an “unknown” mode.That is, when the baud rate is not known, nor are any other details about the instru-ment’s configuration.
Appendix D. Configuration Grammar
D-19Appendix D. Configuration Grammar
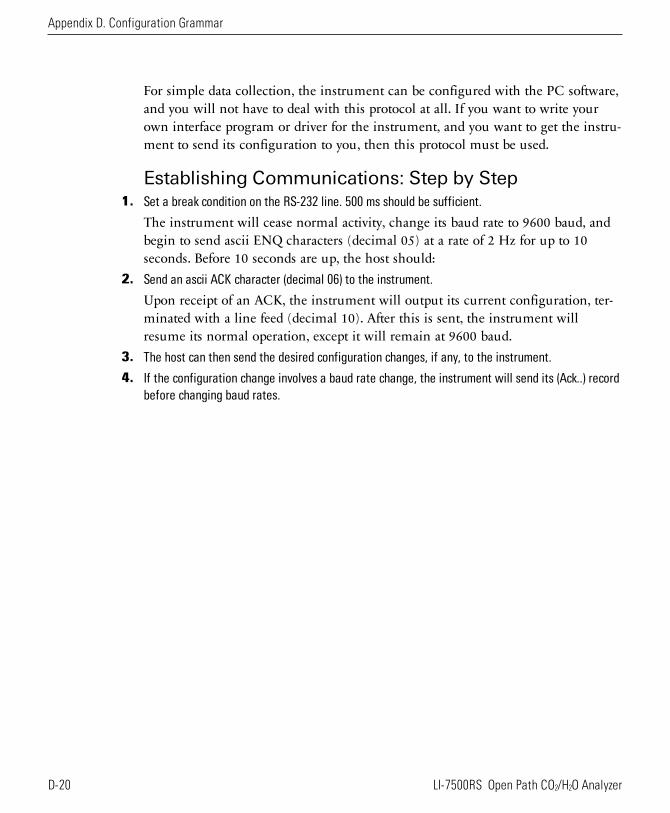
Appendix D. Configuration Grammar
For simple data collection, the instrument can be configured with the PC software,and you will not have to deal with this protocol at all. If you want to write yourown interface program or driver for the instrument, and you want to get the instru-ment to send its configuration to you, then this protocol must be used.
Establishing Communications: Step by Step1. Set a break condition on the RS-232 line. 500 ms should be sufficient.
The instrument will cease normal activity, change its baud rate to 9600 baud, andbegin to send ascii ENQ characters (decimal 05) at a rate of 2 Hz for up to 10seconds. Before 10 seconds are up, the host should:
2. Send an ascii ACK character (decimal 06) to the instrument.
Upon receipt of an ACK, the instrument will output its current configuration, ter-minated with a line feed (decimal 10). After this is sent, the instrument willresume its normal operation, except it will remain at 9600 baud.
3. The host can then send the desired configuration changes, if any, to the instrument.
4. If the configuration change involves a baud rate change, the instrument will send its (Ack..) recordbefore changing baud rates.
D-20 LI-7500RS Open Path CO2/H2O Analyzer
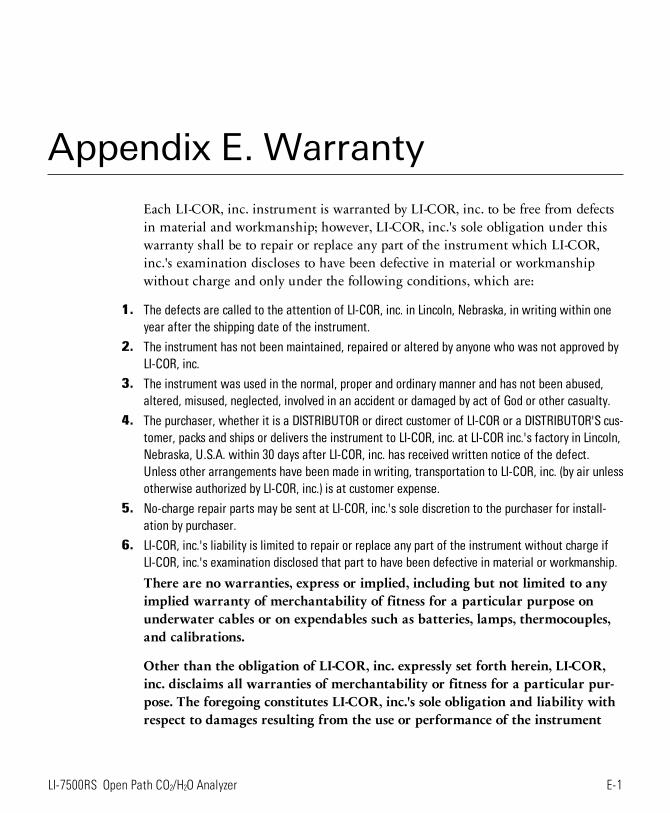
Appendix E. WarrantyEach LI-COR, inc. instrument is warranted by LI-COR, inc. to be free from defectsin material and workmanship; however, LI-COR, inc.'s sole obligation under thiswarranty shall be to repair or replace any part of the instrument which LI-COR,inc.'s examination discloses to have been defective in material or workmanshipwithout charge and only under the following conditions, which are:
1. The defects are called to the attention of LI-COR, inc. in Lincoln, Nebraska, in writing within oneyear after the shipping date of the instrument.
2. The instrument has not been maintained, repaired or altered by anyone who was not approved byLI-COR, inc.
3. The instrument was used in the normal, proper and ordinary manner and has not been abused,altered, misused, neglected, involved in an accident or damaged by act of God or other casualty.
4. The purchaser, whether it is a DISTRIBUTOR or direct customer of LI-COR or a DISTRIBUTOR'S cus-tomer, packs and ships or delivers the instrument to LI-COR, inc. at LI-COR inc.'s factory in Lincoln,Nebraska, U.S.A. within 30 days after LI-COR, inc. has received written notice of the defect.Unless other arrangements have been made in writing, transportation to LI-COR, inc. (by air unlessotherwise authorized by LI-COR, inc.) is at customer expense.
5. No-charge repair parts may be sent at LI-COR, inc.'s sole discretion to the purchaser for install-ation by purchaser.
6. LI-COR, inc.'s liability is limited to repair or replace any part of the instrument without charge ifLI-COR, inc.'s examination disclosed that part to have been defective in material or workmanship.
There are no warranties, express or implied, including but not limited to anyimplied warranty of merchantability of fitness for a particular purpose onunderwater cables or on expendables such as batteries, lamps, thermocouples,and calibrations.
Other than the obligation of LI-COR, inc. expressly set forth herein, LI-COR,inc. disclaims all warranties of merchantability or fitness for a particular pur-pose. The foregoing constitutes LI-COR, inc.'s sole obligation and liability withrespect to damages resulting from the use or performance of the instrument
E-1LI-7500RS Open Path CO2/H2O Analyzer

Appendix E. Warranty
and in no event shall LI-COR, inc. or its representatives be liable for damagesbeyond the price paid for the instrument, or for direct, incidental or con-sequential damages.
The laws of some locations may not allow the exclusion or limitation on impliedwarranties or on incidental or consequential damaged, so the limitations hereinmay not apply directly. This warranty gives you specific legal rights, and you mayalready have other rights which vary from state to state. All warranties that apply,whether included by this contract or by law, are limited to the time period of thiswarranty which is a twelve-month period commencing from the date the instru-ment is shipped to a user who is a customer or eighteen months from the date ofshipment to LI-COR, inc.'s authorized distributor, whichever is earlier.
This warranty supersedes all warranties for products purchased prior to June 1,1984, unless this warranty is later superseded. To the extent not superseded by theterms of any extended warranty, the terms and conditions of LI-COR’s Warrantystill apply.
DISTRIBUTOR or the DISTRIBUTOR's customers may ship the instruments dir-ectly to LI-COR if they are unable to repair the instrument themselves even thoughthe DISTRIBUTOR has been approved for making such repairs and has agreed withthe customer to make such repairs as covered by this limited warranty.
Further information concerning this warranty may be obtained by writing or tele-phoning Warranty manager at LI-COR, inc.
E-2 LI-7500RS Open Path CO2/H2O Analyzer
Index
AAdvanced Eddy Covariance Flux Pro-
cessing, 3-49Analog Inputs, See Auxiliary InputsAnemometer, See Sonic AnemometerAscarite II, 5-4Auxiliary Inputs
configuring, 7-10Auxiliary Sensor Interface, 2-9
about connections, 2-11connecting sensors, 2-11mounting, 2-9terminals, 2-10
BBackup, 3-52Bandwidth, 7-19Baud Rate
set, 3-3Biomet
about, 3-33connecting, 3-33
CCables
connection panel, 1-7custom lengths, C-2
Calibration, 7-21coefficients, 7-22history, 7-24restore, 7-24
Cell Pressure, 8-7Cell Temperature, 8-7Charts, 7-30
Chopper Housing Temperature, 7-7Clock, 7-1, 7-2
GPS, 3-16Commands, D-2, D-8
biomet sensors, D-19Compression, 3-17, 3-37Configuration Files, 7-33Connecting
Biomet system, 3-33LI-7700, 3-30
Cross-sensitivitycorrection, 8-3
DData
inputs, 7-10logging, 3-17outputs, 7-12polling, D-11
Data Backup, 3-52Desiccant, 4-2Dessiccant, 5-4Dew, 2-7Diagnostic
indicators, 7-25test point, 7-26
Dust, 2-8
EEastward Separation, 3-28, 3-31Eddy Covariance
CH4 Log Values, 3-32CO2/H2O Log Values, 3-29file description, 3-38gas analyzer information, 3-27
F-1Index
instruments, 3-13logging datasets, 3-17Site Setup, 3-13sonic anemometer inputs, 3-21
EddyProadvanced mode, 3-42
Equations, 8-6absorptance, 8-2
Ethernet Cableconnection, 3-33
Ethernet Communicationabout, 3-1
Ethernet Connection, 7-14
FFile Compression, 3-37Formulas, 8-6Fuse
replacing, 5-3
GGHG file
defined, 3-5GHG Software, 3-1
update, 7-33GPS
clock, 3-16format, 3-19
Grammer, D-1Graphs, 7-30
HHeads
interchanging, 7-24
IIn-situ Spectral Corrections, 3-49Installing
LI-7550 Analyzer Interface Unit, 2-4Windows software, 3-1
Integration, 7-8
LLI-7550
about, 1-6LI-7700
connecting, 3-30Logging Data
important note, 3-36start, 3-36to a personal computer, 7-32
MMeteorological measurements, 3-33
NNetwork Settings, 7-4Northward Separation, 3-28, 3-31
OOutput
DAC, 7-15Ethernet, 7-14rates, 7-13RS-232 Serial, 7-13
PPlanar Fit, 3-49Plots, 7-30Pollen, 2-8Port, 3-1Power
connecting, 2-2Pressure
errors, 6-3PTP Clock, 3-16, 7-2
RRain/Snow, 2-7Results Files, 3-52RS-232
connect, 3-3pin assignments, B-1
Index
F-2LI-7500RS Open Path CO2/H2O Analyzer
SSalt Deposites, 2-8Secondary Span, 4-8
CO2, 4-8H2O, 4-9
Sensor Separation, 3-28, 3-31Serial Connection, 3-3Signal Strength, 7-22, 8-7Site Information
entering, 3-18SMARTFlux
advanved mode, 3-42clock, 3-16configuration file, 3-51connect, 3-35
Soda Lime, 5-4Software Update
GHG, 7-33LI-7200RS, 7-33LI-7500RS, 7-33
Sonic Anemometerinputs, 3-23
Sonic Anemometer Information, 3-20Span
about, 4-3command, D-14secondary, 4-8secondary CO2, 4-8secondary H2O, 4-9stability, 4-1
Spectral Corrections, 3-49Subnet, 3-1Summer Setting, 7-7Sutron, 3-33
TTemperature
errors, 6-3Time, 7-1
about, 7-2Timelag, 3-49Transmit Data, D-7
Troubleshooting, 6-1, 6-4
UUSB
logging, 3-37settings, 3-36
VVertical Separation, 3-28, 3-31Vibrations, 2-8
WWindows Software, 3-1Winter Setting, 7-7
XXML, D-1, D-2, D-8
example commands, D-14sending commands, 7-7
ZZero
checking, 4-2command, D-14stability, 4-1
Index
F-3Index

F-4 LI-7500RS Open Path CO2/H2O Analyzer


LI-COR Biosciences
Global Headquarters
4647 Superior StreetLincoln, Nebraska 68504Phone: +1-402-467-3576Toll free: 800-447-3576Fax: [email protected] • [email protected] • www.licor.com/env
LI-COR GmbH, GermanyServing Andorra, Albania, Cyprus, Estonia, Germany, Iceland, Latvia, Lithuania, Liechtenstein, Malta, Moldova, Monaco, San Marino, Ukraine, and Vatican City.LI-COR Biosciences GmbHSiemensstraße 25A61352 Bad HomburgGermanyPhone: +49 (0) 6172 17 17 771Fax: +49 (0) 6172 17 17 [email protected] • [email protected]
LI-COR Ltd., United KingdomServing Denmark, Finland, Ireland, Norway, Sweden, and UK.LI-COR Biosciences UK Ltd.St. John’s Innovation CentreCowley RoadCambridgeCB4 0WSUnited KingdomPhone: +44 (0) 1223 422102Fax: +44 (0) 1223 [email protected] • [email protected]
LI-COR Distributor Network: www.licor.com/env/distributors
Regional Offices
C
M
Y
CM
MY
CY
CMY
K
cover_back.pdf 1 11/10/15 9:56 AM
984-15811