Open data, democracy and public sector · PDF fileA look at open government data use from data...
47
Page 1 of 47 Open data, democracy and public sector reform. A look at open government data use from data.gov.uk August 2010 Tim Davies [email protected] @timdavies Based on an MSc Dissertation submitted for examination in Social Science of the Internet, at the University of Oxford, Summer 2010. Commentable version available at http://www.practicalparticipation.co.uk/odi/report/
Transcript of Open data, democracy and public sector · PDF fileA look at open government data use from data...
Page 1 of 47
Open data, democracy and public sector reform.
A look at open government data use from data.gov.uk
August 2010
Tim Davies [email protected]
@timdavies
Based on an MSc Dissertation submitted for examination in Social Science of the Internet, at the University of Oxford, Summer 2010.
Commentable version available at
http://www.practicalparticipation.co.uk/odi/report/
Page 2 of 47
Research Summary About This is an edited version of an MSc Dissertation exploring the use of open government data (OGD) from data.gov.uk: taking a theoretical and empirical look at who is using OGD, how it is being used, and what possible implications that has for different models of democratic change and public sector reform. The underlying study adopted a pragmatic mixed-method research design: exploring 55 instances of OGD use in overview and 14 more-detailed embedded cases of data use from data.gov.uk. It also draws upon survey, interview and participant-observation data. Introduction Many arguments have been put forward to justify the release of government data: transparency and accountability arguments; arguments that OGD can allow citizens greater control over public sector reform; economic benefit arguments and arguments that OGD can help develop a web of linked-data. Whilst the later two arguments are addressed by economic and web-science literatures respectively, the first two have received limited scrutiny. Towards open government data Collection and dissemination of information and data are key tools of government. Governments gather large amounts of data and hold significant national datasets. To be made meaningful data must be represented or contextualized in some way – converted into information. In an increasingly digital society where data can be transferred and analyzed using freely accessible platforms and tools, the monopoly government historically had on processing and interpreting data is undermined. Pressures for governments to open access to data come from both a Public Sector Information (PSI) lobby focused on commercial re-use of data and from campaigners interested in Freedom of Information (FOI) and open government. The last 10 years have seen significant progress for both open-PSI and open-government campaigns, leading to notable progress in the opening of access to government datasets (See timeline in §2.2). Definitions of open government data (OGD) generally require that the data must be accessible (e.g. online), in standard and re-useable formats, and under licenses that allow for data to be re-used in different contexts. Many local and national governments have created ‘data portals’ to list their available OGD, with the UK national data.gov.uk launched publically in January 2010. Data.gov.uk launched with a ‘developers beta’, suggesting the implicit assumption that the majority of uses of OGD will involve technically oriented developers. Findings How is OGD being used? The ends to which open data is put are diverse, though many current uses of data from data.gov.uk are exploratory and experimental. This study puts forward five distinct processes of OGD use:

Page 3 of 47
• Data to fact – often underestimated in accounts of ‘data for developers’ – individuals may seek out specific facts in a newly open dataset. These facts may support their engagement in civic or bureaucratic processes, or in business planning. Facts could be found through online interfaces, but also by browsing downloaded Excel spreadsheets.
• Data to information – creating a static representation and interpretation of one or more data sources. Leading to visualizations, blog posts, info-graphics and written reports.
• Data to Interface – creating a means to interactively access and explore one or more datasets. For example, creating a searchable mapping mash-up, or providing a tool to browse a large dataset and crowd source feedback or scrutiny. Interfaces often also include ‘static’ interpretations of data (data to information) – showing particular summary statistics or algorithmically derived assessments of underlying data.
• Data to data – sharing derived data (either simply an original dataset in a new format, or data that is augmented, combined with other data, or manipulated in some way. A whole dataset may be shared, an API onto a dataset created, or an interface that makes it easy to download subsets of a large dataset.
• Data to service – where OGD plays a ‘behind the scenes’ role in making some online or offline service function. For example, the use of boundary data to route messages reporting potholes to the responsible authority.
These processes of OGD use are not mutually exclusive, and many OGD uses employ multiple processes. By mapping out the path from original OGD to end-use in different cases, certain trends, such as the frequent caching of bulk datasets become visible, raising questions about how well current OGD infrastructures and patterns of use will cope with updates to original datasets. Gaps between the development of interfaces onto data, and the find-ability of interfaces from the data.gov.uk portal were also observable. Who is using OGD? Demographically, in early 2010, users of OGD were overwhelmingly male (6-to-1 in survey results), and generally split between micro-enterprise and SME business in the private sector, local and national public sector institutions, and academic institutions, with a very limited representation of voluntary sector workers. Looking at the motivations of OGD users, six sets of drivers for engaging with OGD can be identified:
• Government focus: wanting to better understand government and to promote efficiency and accountability;
FactSearchBrowseExtract
Data
InformationManipulate
Statistically analyseVisualise
ContextualiseReport
Data
InterfaceClean, Combine, Subset Data
Configure interface toolsWrite custom codeProvide interface
Data
DataConvert format
Filter dataAugment/combine data
Provide APIDataset for download
Data
Service?
Integrate into existing product/service
Create new service
Data

Page 4 of 47
• Technology innovation focused: interested in creating new platforms and
tools, and in semantic-web/linked-data technology; • Reward focused: seeking recognition and/or profit;
• Digitizing government: Seeking technologically driven improvements in
efficiency and functioning of government;
• Problem solving: using OGD to meet specific challenges;
• Social/public sector enterprise: using OGD to provide services in/to the public sector;
Figure 4 in §4.1 indicates relationship between these motivations. Alongside the policy, social and business entrepreneurs interested in exploring how OGD could be exploited, many OGD users have some degree of ‘digitizing government’ motivation. Some digitizing government motivations can be conceptualized as part of a ‘Computerization Movement’ (Kling & Iacono 1988b) in which “advocates focus on computer-based systems as instruments to bring about a new social order” (Kling & Iacono 1995, p.122). Whilst it is meaningful to speak of a UK OGD-using community, the current community, mediated through mailing lists, online social networking, and events, is technology-focused, and does not include all OGD users. Many actors with experience of data-use in civic contexts are absent or on the periphery of current OGD use communities. Data impacts: democratic engagement and public sector reform
Section 2.4 sets out a number of models of democratic engagement and public sector reform. In §4.3 the paper returns to these to explore how OGD is acting on the civic domain in practice. Whilst examples of OGD use to support scrutiny of formal political processes are apparent, there is more evidence of OGD use supporting co-production of public services between social and commercial entrepreneurs and the state, and of OGD being used to create improved information services for ‘citizen consumers’, emphasizing notions of ‘personal’ over ‘collective’ democracy. OGD impacts upon markets for public services where OGD is a key input into service
(a) Political participation(b) Collaborative / community based
participation(c) Individual choice / market participation
a1. Supporting scrutinya2. Informing citizens as votersa3. Informing citizens on specific issuesa4. Supporting campaigning and lobbying
b1. Co-produced planningb2. Co-produced servicesb3. Co-produced information
c1. Improving the quality of demand (better informed consumers)c2. Improving the quality of provision(competitive innovation)
Page 5 of 47
provision. OGD can also reduce friction in co-production of services between different levels of the state. A number of cases of OGD were also evident where open data helped to challenge power imbalances between citizen and state in bureaucratic processes (e.g. applying for funding; appealing about a school admissions decision). Implications A number of key themes can be drawn out from the analysis of how OGD is being used to inform policy and practice around OGD.
1. Data is not just for developers – direct access to trusted sources of facts is valuable for many individuals: either to be able to look up a specific fact, or to work with a dataset in familiar desktop software (e.g. Excel) in order to write s report or analyze the data for making a decision. It is not clear that all datasets will have accessible interfaces built on top of them, or that those interfaces will present all the relevant underlying data – so human readable raw datasets may, in many cases, be as valuable as machine-readable ones.
2. OGD changes the gatekeepers, and the role of civic actors – with mainstream media, independent citizens, companies and different levels of government are all afforded the possibility of advancing their own interpretations and representations of data. Government, however, can retain some gate-keeping power by setting the categories and structure in which data is recorded and released.
There will be greater need in future for capacity both in state and society to be able to debate the meaning of data, and to find responsible ways of using open data in democratic debate.
3. OGD supports innovation in public services – although it is not yet clear
that there are strong models for the use of OGD in allowing communities to collectively debate and drive local change. Social and commercial entrepreneurs play a core role at present in turning OGD into new services or inputs into public services.
4. A focus on digitizing government underlies much OGD use, and can lead
to concerns of politics, power and justice being under-valued in the development of OGD infrastructure – a focus on idealized digital infrastructures also risks loosing site of practical end-uses of OGD, thus care must be taken to identify and work with real use-cases, and civic and democratic use-cases, in considering how OGD use is further developed.
Further practice focused implications arising this study will be blogged at http://www.practicalparticipation.co.uk/odi/ throughout 2010.

Page 6 of 47
Table of Contents 1. Introduction 2. Literature Review
2.1. Government Data: from origins to openness 2.2. Open Government Data: towards data.gov.uk 2.3. Data and Information 2.4. Data, Democracy and Public Service Reform 2.4.1. Formal politics 2.4.2. Collaborative and community-based participation
2.4.3. Market-based participation and personal democracy 2.5. Research questions
3. Methodology
3.1. Overview 3.2. Methods 3.3. Methods 3.3.1. Exploratory research and participant observation
3.3.2. Online survey 3.2.3. Interviews 3.3.4. Ethical considerations
3.4. Analysis and embedded cases 3.4.1. Embedded case selection
3.5. Generalization
4. Data 4.1. Understanding OGD users (RQ1)
4.2. OGD use in practice (RQ2) 4.2.1. Processes of OGD use 4.2.2. Detailed comparisons and emerging themes 4.2.3. Direct access to facts 4.2.4. Interfaces, information and interpretation 4.2.5. Technological and social infrastructures 4.2.6. Impact
4.3. Civic uses of OGD (RQ3) 4.3.1. Politics 4.3.2. Co-production 4.3.3. Markets
5. Discussion: civic implications of OGD (RQ4)
5.1. Changing gatekeeping 5.2. Empowering individuals 5.3. Innovation and reform 5.4. Digitized government: equitable architectures?
6. Conclusions
6.1. Directions for further research 6.2. Contributions and conclusion

Page 7 of 47
1. Introduction The last 18 months have seen dramatic developments in the release of open government data (OGD) across the world. In the UK, datasets ranging from crime statistics to transport data, school locations to government-‐wide spending data, have been placed online in machine-‐readable formats, licensed for re-‐use. At the preview launch of the UK data.gov.uk data portal (Cabinet Office 2009), Director of Digital Engagement Andrew Stott outlined four agendas driving the development of the platform and surrounding policy1:
• Promoting transparency and accountability • Empowering citizens to drive public sector reform • Releasing the economic and social value of information • Putting Britain at the leading edge of semantic-‐web developments.
For these agendas to be realized, OGD must be put into use in some way. That data.gov.uk launched with a ‘developers beta’ reveals a particular expectation that technology developers will be the primary users of datasets. Whilst economic incentives are expected to encourage developers to pursue commercial exploitation of OGD2, the expectation that developers will make widespread use of OGD in civic contexts requires further justification and the connections between OGD and democratic empowerment or public sector reform need to be outlined in more detail. This exploratory case study of data.gov.uk draws upon participant observation; survey data; qualitative interviews and documentary evidence to identify how, since the beta and launch of data.gov.uk, OGD has been used in practice. It asks: Who is using OGD? How are they using it? Why are they engaging with OGD? What technical approaches are being adopted? And what are the implications of all this for democratic engagement and the reform of public services? Through looking at uses of data from data.gov.uk, it seeks to draw out findings that can be tested in the case of other OGD programmes, both in comparable national contexts; and in the local OGD contexts presently emerging across the UK.
1 Paraphrased from authors own notes from bloggers briefing on data.gov.uk developers launch on 1st October 2009. 2 The market for the re-‐use of OGD has been extensively explored in work on Public Sector Information (PSI) re-‐use around the EU PSI Directive (European Commission 2003b; Dekkers et al. 2006; Uhlir 2009)

Page 8 of 47
2. Literature Review Discussions of OGD are becoming widespread in practice and academic literatures on contemporary government (Pizzicannella 2010; Stephenson 2009; Lathrop & Ruma 2010; Coleman & Boland 2010; Robinson et al. 2008; Allan 2009; Parycek & Sachs 2010), and the desirability of increased openness of government datasets is emerging as political orthodoxy in the US (Obama 2010), UK (Cameron 2010; Brown 2009) and across Europe (Visby Declaration 2009; European Commission 2003a). However, much literature, although optimistic about OGD’s potential, is blighted by a lack of clarity on relationships between data and information, and vagueness on exactly how data plays a role in change processes. The following section begins by outlining the development of OGD initiatives in the UK, and then defines the relationship between data and information, before turning to literatures on information and democracy, and data, information and public sector reform. 2.1 Government Data: from origins to openness Hood and Margetts (2007) offer a functional model of government as operating through two sets of tools: detectors and effectors. Detectors gather information (and data) from society, and effectors seek to influence individuals and society (p. 3), often (but not exclusively) through dissemination of data and information. Beniger (1986) argues that since industrial revolutions in manufacturing and transportation in the 19th Century, governments have sought increasingly advanced data collection and dissemination systems, responding to a ‘crisis of control’ created by increasingly complex societies. From the post-‐World-‐War-‐II era onwards the Weberian bureaucracy computerized (ibid. p.6), with government effectors and detectors becoming increasingly data-‐driven. Governments now manage vast data resources, frequently, in digital forms. The Measuring European Public Sector Information Resources (MEPSIR) study identified six domains of data/information3: Business, Geographic, Legal, Meteorological, Social and Transport (Dekkers et al. 2006). Alongside administrative data, governments also generate large amounts of ‘political’ data and information (e.g. records of parliamentary discussions; voting records of elected representatives). Historically, many European governments have closely controlled their data/information resources (PIRA 2000; Weiss 2004) releasing only limited content, often in costly and inflexible formats (e.g. printed documents) or under restrictive licenses and through trading funds (De Saulles 2005; Pollock 2009). Restrictions on access to public data/information have origins both in cultures of governmental secrecy (Bennett 1985; Worthy 2008), and progressive attempts by governments, following recognition of it’s attractive and exploitable features (datasets with universal coverage, long-‐term time-‐series and high accuracy levels etc.), to capture some of the commercial and social value of PSI (Burkert 2004). However, over the last decade open data movements have made considerable progress calling for government data to be available as raw-‐data under open licenses and in re-‐useable formats. Advocacy has come from both
3 Public Sector Information (PSI) can generally be taken to be a term inclusive of data.

Page 9 of 47
European-‐level lobbies focused on developing markets for PSI (Aichholzer & Burkert 2004) and from open government and freedom of information (FOI) activists in domestic contexts, drawing upon examples and inspiration from other countries. Fig. 1 outlines key events since 2003 contributing to developments in UK OGD policy and platforms, within wider European and US contexts4.
4 For an overview of developments beyond the UK and US, see Davies and Lithwick’s report for the Canadian Parliament (2010) covering OGD initiatives in seven countries.

Page 10 of 47
JF
MA
JJ
AO
SN
DM
JF
MA
JJ
AO
SN
DM
JF
MA
JJ
AO
SN
DM
JF
MA
JJ
AO
SN
DM
JF
MA
JJ
AO
SN
DM
JF
MA
JJ
AO
SN
DM
JF
MA
JJ
AO
SN
DM
JF
MA
JJ
AO
SN
DM
2003
2004
2005
20062007
2008
20092010
April 2003Advisory Panel on Public Sector Information (APPSI) is established to advise on and encourage “opportunities in the information industry for greater re-use of public sector information”. November 2003
European Public Sector Information Directive is adopted. States must implement it by July 2005.
January 2009President Obama issues Memo on Transparency and Open Government as one of his first acts in Office.
July 2008Office of Public Sector Information Data Unlocking Service is launched.
July 2005Re-use of Public Sector Information directive comes into force.
January 2005Freedom of Information Act comes fully into force.
June 2004TheyWorkForYou.com is launched at NotCon '04 using data on political decision making scraped from the Hansard website. The site is later adopted by MySociety.org.
May 2008“Models of Public Sector Information Provision via Trading Funds” (Newbury, Pollock et. al 2008) published alongside the 2008 UK Budget which included commitment to ensure information from Trading Funds “is made available as widely as possible for use in downstream markets”
March 2008Interim Power of Information report published and Power of Information taskforce established
October 2007The District of Columbia launch the first major government data catalogue bringing together data formerly published in different areas of the DC website, and creating pressure for the release of further data.
January 2007Power of Information Report commissioned. Co-authored by MySociety director Tom Steinberg and Ed Mayo.
June 2006MEPSIR (Measuring EU Public Sector Information Resources) Study estimates mean potential value from PSI re-use across Europe at €27bn.
June 2008Show Us a Better Way competition announced.
October 2008Apps for Democracy programme run to encourage re-use of data from the DC data catalogue.
September 2009The Cabinet Office Director of Digital Engagement issues a call for developers to help test the new Data.gov.uk site launched in developers beta. The launch includes a number of datasets in RDF.
June 2009Tim Berners-Lee and Nigel Shadbolt appointed as advisors to the UK Government on opening up access to government data.
May 2009Data.gov launched in the US with 47 datasets.
March 2009First Rewired State Hack the Government Day held in the UK, with 80 developers building applications - many of which involved scraping government data.
February 2009Final Power of Information Report published.
February 2009Tim Berners-Lee talks to the TED Conference about the need for Raw Data Now from governments.
March 2009Raw Data on Cycle Accidents released through the Directgov Innovate programme. A range of mash-ups are created, and the cycle data is frequently cited as an example of the potential of releasing raw data.
March 2010Further Rewired State events take place, with backing and funding from UK Government departments.
January 2010Data.gov.uk officially launched and made availble to all. London also launches datastore for the capital.
December 2009Putting the Frontline First strategy commits government to greater openness in the release of data. The report also establishes a Local Data Panel to focus in the release of local authority data.
December 2009The US Open Government Directive establishes deadlines for US Government Departments to get more information online.
April 2010Ordnance Survey release significant GeoData as open data following a long 'Free our data' campaign by the Guardian, and consistent calls from developers for better access to geodata.
May 2010Prime Minister David Cameron sends a letter to government departments asking for specific action on opening up government data and establishes a new 'Transparency Board' to include Tim Berners-Lee, Nigel Shadbolt, Tom Steinberg (Founder of MySociety) & Rufus Pollock
June 2010COINS (UK Government Spending) dataset released.
Government Led
Community Led
Research
UK
US
Europe
Milestone Event Other Events
Key
March 2006Guardian 'Free Our Data' campaign is launched.
Figure 1. Timeline of selected events relating to UK OGD 2003–2010.

Page 11 of 47
2.2 Open Government Data: towards data.gov.uk Data.gov.uk provides listings of non-‐personal government-‐held data, contributed by government departments, or available through the Office of Public Sector Information Data Unlocking Service5. Whilst often described as ‘raw-‐data’ many catalogue records currently refer to derived data and summary statistics, or link to query interfaces providing interactive access to sub-‐sets of data, rather than bulk dataset downloads. Providing open government data is a matter of accessibility, format and license. Data must be available (generally online), in forms, and under licenses, allowing for re-‐use (i.e. non-‐proprietary formats; open license). David Eaves expresses a version of these ideas in ‘The Three Laws of Open Government Data’:
1) If it can’t be spidered or indexed, it doesn’t exist 2) If it isn’t available in open and machine-‐readable format, it can’t engage 3) If a legal framework doesn’t allow it to be repurposed, it doesn’t empower (Eaves 2009)
The much-‐cited Resource.org OGD principles (Malmud et al. 2007) emphasize the need for complete and primary data, “with the highest possible level of granularity, not in aggregate or modified forms”. The Open Knowledge Definition (OKD) defines knowledge as “…open if you are free to use, reuse, and redistribute it — subject only, at most, to the requirement to attribute and share-‐alike” (OKF 2006). For datasets, which are not subject to standard copyright protection under UK law, but which may be covered by other intellectual property rights, permission for re-‐use needs to be explicitly stated (Hatcher & Waelde 2007). Many open data advocates oppose ‘non-‐commercial’ license terms, and any other terms imposing requirements on downstream users of data, such as restrictions on production of derivative works (Murray-‐Rust et al. 2009). Data.gov.uk lists datasets available under Crown Copyright, which is not OKD-‐compliant, and under ‘Crown Copyright with data.gov.uk rights’, which explicitly permits use, re-‐use and sub-‐licensing of data. At the time of writing6, Data.gov.uk hosts 3396 datasets, 1773 of which are recorded as OKD-‐compliant. Particular efforts have been undertaken with data.gov.uk to encourage use of linked-‐data conventions for publishing data (Alani et al. 2007; Berners-‐Lee 2009; Tennison & Sheridan 2010; Ding et al. 2010) whereby data is represented using flexible RDF schemas, and datasets are linked to create a ‘web of linked-‐data’. The skills, experience-‐base and tool-‐chains for working with linked-‐data are still at relatively early stages of development (Tennison & Sheridan 2010; Pellegrini 2009), but advocates of linked-‐data approaches believe it has the “potential to enable a revolution in how data is accessed and utilized” (Bizer et al. 2009). It should be noted, however, that few data.gov.uk datasets are, as yet, published as linked data.
5 See http://data.gov.uk/faq/ Accessed 1st June 2010 6 Based on an archive of listings from 9th July 2010.

Page 12 of 47
The European Commission’s PSI Programme has developed methodologies for tracking economic value of PSI. In the UK Pollock (2009) and Newbury et al. (2008) have estimated the economic value to be realized by releasing data from trading funds. The Web Science community are tracking the successes and challenges of ‘bootstrapping the semantic web’ (Alani et al. 2007) from government data. However, as Hogge notes in her recent review of global potentials for OGD programmes, although OGD release has seem dramatic progress, further research is needed into “the social impact of … data catalogues like data.gov and data.gov.uk” (Hogge 2010, p.42). Understanding the different ways in which OGD is being used is essential groundwork to such an evaluation. The following section sets out a theoretical background to data use; exploring relationships between data and information. 2.3. Data and Information It is not uncommon to find the terminology of ‘opening access to information’ and ‘opening data’ used interchangeably (Parycek & Sachs 2010). Although integrally connected, the two concepts should be kept distinct. Data can be literally defined as “a thing given or granted; something known or assumed as fact” (OED Online 2000). Data may be raw/primary data (the direct product of measurement), derivative data (e.g. cross-‐tabulations; sums; reshaped data), meta-‐data (data about data) or operational data (data about data use) (Floridi 2004). Whilst data underlies many acts of human decision-‐making, we generally operate on the basis of information, which, in the philosophical General Definition of Information (GDI) is defined as “data + meaning” (Floridi 2004). In knowledge management the data-‐information relationship is often expressed as a hierarchy (Fig. 2), with data as the foundation layer, and information atop it (Rowley 2007). The GDI summarizes the relationship between data and information with the thesis: “no information without data representation” (Floridi 2004), that is, all information contains data, and data is represented to become information. Generally representation reduces the amount of data to be taken in (e.g. ordering entries in a table so readers need only look at particular sections, or summarizing aggregates through visualizations or text), whilst also giving context to the data (Rowley 2007; Chi 2000). However, visualization can also increase the information that can be communicated in a small amount of space and time, as is achieved in Hans Rosling’s GapMinder visualizations of poverty statistics7 (Card 2009; Rosling 2007; Rosling 2006). Whilst in pre-‐Internet times, carrying out analysis data reduction inside governmental bureaucracy may have been necessary to produce something concise enough for dissemination, increased data storage capacity and processing power, standard data formats, and the development of digital data exchange (particularly online), mean that possibilities for on-‐demand data analysis have grown dramatically (Butler 2007). Information that was formerly expensive and complex to render can now be extracted from datasets using freely available online query and visualization tools (Viégas et al. 2007). This technological shift provides the foundation for ‘democratization’ of information
7 See http://www.gapminder.org/ for details and examples.

Page 13 of 47
creation, breaking governmental monopolies on representing an interpreting data, and fuelling calls for policy change. Mayo and Steinberg’s Power of Information Report (2007, p.27) argues for separation of data, analysis and presentation ‘layers’ of government information, opening data and analysis for re-‐use (Fig. 2). Rosling is clear, however, that increased availability of data and data-‐processing tools does not remove the need for statistical and data analysis expertise (2010). Figure 2. Relating data and information
Increased utility of raw-‐data can increase pressures to collect raw-‐data. Allan (2009) notes that much PSI is “simply not collected in a usable form at present”, either as paper records with “no electronic or otherwise easily accessible version” or in arcane and unusable formats. Snowdon (2010) has argued for a focus on the rendering of information as data, as much as a focus on rendering data as information. However, although extracting data from information can increase the re-‐use potential of the content concerned, the codification of information into data is not a neutral act (Bowker 2000), involving decisions that affect the ease of different future data uses. The very act of government data collection, by virtue of government’s central role in society, can also effect as well as detect change on the ground (Scott 1998). 2.4. Data, Democracy and Public Service Reform There exist many diverse theoretical and empirical specifications of what makes for a democratic state and democratic participation (Dahl 2000; Dahl 1989; Dryzek & Dunleavy 2009; Held 2006; Beetham 1994). Democracy can be valued intrinsically, or on the basis of some other value (such as freedom or equality) that it promotes; or it can be valued instrumentally for producing better outcomes in terms of laws and public services. It is theoretically possible for public services to be improved in the absence of, or in contradiction with, improvements in democracy. This study adopts a three-‐fold distinction between modes of democratic engagement, each linked to mechanisms of public service reform. Democratic engagement can take the form of (a) formal participation in political institutions:
Data
Information
Knowledge
Wisdom
Know what: answers 'what', 'why', 'where' questions
Knowing what is best
Abstract facts
Know how; How to..
Representation.Adding meaning
& context
Simplified summary of DIKW modelDrawing on Rowley (2007)
EncodingSelecting schema
and recording
Data, Analysis, Presentation modelDrawing on Power of Information Taskforce Report
Mayo and Steinberg (2007 p.27)
Data Layer
Analysis Layer
Presentation Layer In a digital publishing
environement an 'access layer'
should be provided at each of these points

Page 14 of 47
e.g. voting, petitions and direct lobbying of actors in power; (b) participatory, collaborative and/or community based action: including collaboration between citizens and state, and collaboration amongst citizens to solve problems outside the state; (c) individual choice: selecting services so that market processes aggregate signals about citizen preferences. In each type of interaction the information required to support an improvement of outcomes (i.e. better public services) varies, as does the mechanism by which change occurs. Table 1 illustrates this with examples of information needs and resulting decisions/actions in each type of interaction. Table 1: Models of democratic change and public sector reform
2.4.1 Formal politics Relationships between information and political decision making have received extensive treatment in the literature, particularly relating to greater citizen access to political information brought about by the rise of the Internet (Lievrouw 1994; Castells 2009; Kamarck et al. 2002; Hague & Loader 1999). The opening of government data can have two impacts on the availability of politically relevant information. Firstly, it can lead to the release of the data
Model of change:
(a) Formal politics / political
participation
(b) Collaborative / community based
participation
(c) Individual choice / market
participation
Actor as: Citizen Citizen / co-producer Consumer
Party policies;
Performance of politicians;
Current performance of departments / local authority etc.
Performance data for specific services;
Local funding arrangements and budgets;
Specific details of issues / problems to be solved;
Performance data for specific services;
Eligibility for different services;
Location, cost, availability of different services;
Example information needs:
Example decisions / actions:
Who to vote for;
Who to donate to;
Who to lobby and what to lobby on;
Collaborations between citizens to provide services;
Collaboration between citizens, enterprise and state to redesign services;
Which services to use;
To establish a new service / adapt an existing service based on demographic / demand data.
Mechanism of change / reform:
Changing leadership and policy from the top; Sending signals to policy makers.
Working together to solve problems; Changing individual preferences through dialogue. Distributed innovation.
Market signals increase efficient allocation of resources.

Page 15 of 47
underlying formerly available information, removing the role of government as sole interpreter of the data. Secondly, it can lead to new data being released, covering topics where neither data nor information were available before. The idea that “the informed citizen is the empowered citizen” (HMG 2009) is intuitively plausible, and Dahl emphasizes the importance of removing information inequalities between citizens, and between citizen and state in order to realize greater democratic governance (Dahl 2000). However, questions have been raised about both rationalist assumptions that more information in general improves the quality of democratic participation (Dervin 1994), and claims that the Internet necessarily leads to a democratization of the information environment (Hindman 2009). Bimber (2003), drawing on Downs’ ‘economic theory of democracy’ (1957a; 1957b) argues that a rational-‐choice model of citizen interaction with political information can explain how increased ‘information abundance’ affects levels of active democratic participation. Rational individuals seek to reduce their political uncertainty (e.g. over who to vote for) and seek new information until its marginal return equals the marginal cost of obtaining it. However, given it is generally impossible to know, a priori, the return on information, individuals establish “a few gatherers and transmitters of information and mold them into a personal information-‐acquisition system” (Downs in Bimber 2003 p.202). Bimber’s ‘fourth information revolution’ involves the shift from that network consisting primarily in limited and partisan mainstream media, to a situation in which individuals have greater capacity to craft their own digital information environments. With the introduction of OGD, the possibilities for individuals to craft highly personalized information environments around themselves increases. For Sunstein (2007) this creates ‘echo-‐chambers’ and is profoundly undemocratic: harmful to unified public spheres. But Bimber argues it can bring moderate numbers of new actors into democratic life, creating a ‘revolution in the middle’ (2003, p.205) between elites and masses. Bimber notes that, if the purpose of information acquisition is reducing uncertainty, this has greatest benefit for “those with the highest uncertainty and who also exhibit a strong preference over outcomes, all else being equal” (2003, p.205). If Bimber’s theory holds, then we might anticipate increasing availability of OGD to support data uses which extend this revolution in the middle and support new individuals with strong political preference, but high uncertainty, to engage more in political life. Alongside equipping citizens for electoral decision-‐making, and with information required to lobby on issues, it is often argued that OGD can increase the ‘transparency and accountability’ of politicians and officials. However, Heald (2006) notes that although “at very low levels of transparency, more transparency is likely to be beneficial”, when transparency is already high then trade-‐offs can restrict the value of further increases. High levels of transparency can create perverse incentives for policy makers (Prat 2006) and may in practice restrict the scope for deliberative forms of democratic decision-‐making (Stasavage 2006). Fung and Weil (2010) also note that excessive governmental transparency can harm the effectiveness of a government and dis-‐empower the state vis-‐à-‐vis opaque corporate interests, specifically, it might be added, media

Page 16 of 47
corporations (Castells 2009). However, Fung and Weil do not take this as reason for restricting transparency, but rather argue for a broader ‘open society’ movement, where the state is not the only body pushed to increase its transparency and accountability. 2.4.2. Collaborative and community-based participation Notions of collaborative democracy and communicative government (Noveck 2010; Noveck 2009; Boland & Coleman 2008) seek to reframe relationships between citizen and state in an era of OGD: focusing on how state employees and citizens can work together to solve problems. Noveck’s notion of collaborative democracy is articulated as a critique of direct and deliberative democracy. Rather than openness supporting procedurally uniform dialogue and deliberation between citizens, an emphasis on “[c]ollaboration shifts the focus to the effectiveness of decision making and outputs.” (Noveck 2010, p.62). The strong emphasis on action, and upon “breaking down a problem into component parts that can be parceled out and assigned to members of the public and officials” (ibid.) draws on ideas from open-‐source development and from software development patterns (Dierking 2010), and upon ideas of crowd-‐sourcing and open innovation (Von Hippel 2005; Lakhani 2009), opening up data in order that specialists from outside the bureaucracy can input alongside officials, and that platforms may be developed to harness the ‘wisdom of crowds’ (Sifry 2010; Noveck 2006). Boland and Coleman emphasize the nature of communicative government as a reaction to the rationalist decision making models of New Public Management, questioning the role of government as interpreter of data, and advocating for raw-‐data rather than contextualized data in government transparency (Boland & Colman forthcoming; Boland & Coleman 2008). Using raw-‐data, they suggest, citizens can apply their own interpretations and in dialogue with local and national government suggest alternative priorities in interactive ways – often in dialogue with officials rather than elected representatives. 2.4.3. Market-based participation and personal democracy Crenson and Ginsberg (2003, p.174) argue that in recent decades “a new politics of individualized access to government and a new era of personal democracy” has developed in which “it has become standard practice to deal with government as an individual ‘customer’ rather than as a member of a mobilized public”8. Market forces have progressively been introduced into public service delivery in many contexts, and competition is widely claimed as essential for promoting both efficiency (Le Grand 2007) and innovation. Accurate, timely and relevant information is essential to the effective functioning of markets (Stiglitz 2000). The use of markets in public service provision can be valued for two reasons. Firstly, markets are argued to provide better outcomes where competition rather than centralized planning leads to better services. Secondly, it is argued that markets inherently promote freedom (Hayek 1944), even more so in markets where means of cultural production and civic engagement are
8 This usage of “personal democracy” is distinct from the more nebulous notion linking together ideas shared the “Personal Democracy Forum” (Fine et al. 2008). which span all models of democratic change in Table 1.

Page 17 of 47
open (Benkler 2007). Raw-‐data from governments can improve the information available to consumer-‐citizens; as well as acting as an input for innovative service providers to work with whilst developing service provision. 2.5. Research questions The above sections set out the historical context of OGD, and draw out the theoretical connections between OGD use, democracy and public sector reform. Sections 4 and 5 will explore OGD use in practice, guided by four core research questions:
• RQ1: Who is using OGD? What motivates their engagement with OGD?
• RQ2: How is OGD from data.gov.uk being used in practice? What technical processes are being adopted?
• RQ3: What models of democratic engagement and public sector reform does OGD support in practice?
• RQ4: What are the potential implications of OGD use for future democratic engagement and public sector reform?

Page 18 of 47
3. Methodology In attempting to tackle emerging phenomena this study is deliberately broad based. Considerable attention is given to explaining each methodological choice. 3.1. Approach Mixed-‐method research combines qualitative and quantitative research within a pragmatist paradigm (Tashakkori & Teddlie 1998). Pragmatism offers both an epistemic framework focused on the ‘primacy of practice’ (Putnam 1995, p.52; Hookway 2008) and, from Dewey (1938), a democratic ‘logic of inquiry’ (Putnam & Conant 1995, p.198). Pragmatic enquiry need not only ask how far OGD allows users to meet certain pre-‐specified ends, but can contribute to rational analysis of the ends to which OGD is put (ibid p.201). In offering an empirically grounded descriptive story of often-‐overlooked processes of data use, and exploring the potential civic implications of OGD use, this study contributes to that analysis. It is, in Daniel’s terminology, ‘strategic research’: facing both academia and practice, seeking to balance a focus on “problems likely to emerge in the medium-‐term future” with concern for “the state of scientific knowledge” (1993, p.5). By adopting the role of participant-‐observer in activities and discussions around OGD use and by contributing draft findings from the study back into those discussions (including through project blogging) I have approached enquiry as a “process that helps to clarify, inform, stimulate and provoke” (Skolnick 1995, p.iv). 3.2. Design The study centres on a core case: the data.gov.uk OGD directory. Using data from multiple methods it adopts Brewer and Hunter’s approach to multi-‐method research as a way to “attack a research problem with an arsenal of methods that have non-‐overlapping weakness in addition to their complementary strength” (2006, p.4). Fig. 3 illustrates the layered research design, in which data collection methods are deployed sequentially, progressively focusing in on data.gov.uk to understand the case in context, and then drawing on both survey data and generating a series of detailed embedded cases to draw out key themes within the core case. 3.3. Methods Miles and Huberman (1994) encourage mixed-‐methods researchers to explicitly outline their research process. The data collection Fig. 2 above took place in sequential but overlapping steps, each informing subsequent data collection. The analysis draws upon data resources in parallel. 3.3.1. Exploratory research & participant observation Between January 5th and June 30th 2010 a custom-‐built CAQDAS9 system was used to record and analyze public Twitter messages including the ‘#opendata’ hash-‐tag (Huang et al. 2010), presenting data in tag-‐clouds for exploration (Rivadeneira et al. 2007). Tweets were regularly reviewed and emerging themes recorded through a private wiki-‐based research journal (Borg 2001; Janesick
9 Computer Assisted Qualitative Data Analysis System: documented on the project blog.

Page 19 of 47
1999). In March and April 2010 I participated in multiple open-‐data events, including two ‘hack-‐days’, attended by over 60 people. As an announced participant-‐observer (Gray 2009) at these events I observed and engaged with a range of OGD uses. Further reflective journaling throughout this phase was used to identify key questions and themes for later analysis, as well as deepening my understanding of issues relating to OGD use. Figure 3. Phases and focus of the research process
3.2.2. Online survey Initial exploratory research highlighted underrepresentation of certain OGD users and uses in mainstream digital discourses. Online survey methods offer a cost-‐effective way to gather input from large numbers of people (Gray 2009, 13; Fink 2006). An online survey was designed to identify wide-‐ranging open data uses, beyond commonly cited examples, though focusing on UK OGD. Dekkers et al. (2006) note the difficulty of generating clear sampling frames of OGD re-‐users. Lacking a clearly bounded population that would allow statistical sampling (Kish 1965), the study adopts opportunistic sampling whilst seeking wide dissemination of the survey. A careful balance had to be struck between introducing excessive ‘selection bias’ by heavy dissemination to particular OGD user communities, and getting adequate responses. A prize-‐draw incentive was
Potential users/uses of data
Users/uses of open data
Users/uses of open government data
Users & uses of
Data.gov.uk data
Exploratory research& Literature review
Participant Observation & Documentary evidence
Online Survey
Interviews & embedded cases
Jan - June 2010
March/April 2010
May/June 2010
June 2010
Research design
Generalisation

Page 20 of 47
offered to reduce non-‐response (Couper 2000) and the project blog was developed to demonstrate the authenticity of the research and a commitment to sharing research findings (Cho & LaRose 1999). The online survey, of 35 questions, was available between May 11th and June 14th, receiving 72 responses, 44 describing OGD use from data.gov.uk. Given its non-‐probability sample, the survey design focused on collecting information about instances of OGD use; and inviting respondents to indicate their views on key statements developed from prior phases of research. Exploratory factor analysis (Bartholomew et al. 2008, 7 -‐ 9; Costello & Osborne 2005; Lawley & Maxwell 1962), bootstrapped cluster analysis (Suzuki & Shimodaira 2006) and visual analysis of correlations were conducted within the R statistical software (Becker et al. 1988). This analysis informed the description of OGD users and their motivations. A full copy of survey questions, anonymous response data and details of survey promotion can be found on the project blog10. 3.2.3. Interviews Eight purposively sampled semi-‐structured interviews (Bryman 2008, chap.18) were carried out to complement survey data. Interviews invited respondents to give detailed elaboration of particular OGD uses, their reasons for working with OGD, and challenges they encountered, as well as exploring their general attitudes to OGD. All but one interview took place by phone, recorded, transcribed and coded for key themes using TAMS Analyser (Weinstein 2008), with GraphViz used to visualize relationships between themes (Bilgin et al. 2009). 3.2.4. Ethical considerations Alongside adopting good practice for informed consent in online surveys, interviews (Varnhagen et al. 2005) and participant-‐observation (Gray 2009, chap.4), particular attention was paid in this study’s data collection and analysis to problems of ‘privacy in public’ (Nissenbaum 1998). The inherently searchable nature of many OGD uses means that even basic descriptions can allow readers to, in practice, link quotes to individuals, even though responses were collected under offer of anonymity. This necessitates care in how respondents are quoted, and obtaining additional permission in certain instances. Sensitivity to the context in which information was shared has guided the direct use of content from exploratory/participant-‐observer phases of the research (Eynon et al. 2008). 3.4. Analysis & Embedded Cases Analysis is carried out with a fully mixed-‐method approach, selecting appropriate methods to begin and pursue exploration on the basis of each RQ and the available data. Analysis of RQ1 starts from exploratory statistical analysis, checked against qualitative reading of survey responses and complemented by insights from the literature, interviews and participants-‐observation. Analysis of RQ2, 3 and 4 all follow a holistic process of analysis
10 http://www.practicalparticipation.co.uk/odi/survey/

Page 21 of 47
(Wiber 1999) predominantly seeded by exploration and visualization of data use instances. Diesing explains: “Holist theorizing should always proceed in intimate contact with particular cases, so that each theoretical step can be immediately checked against a range of examples” (1971, p.182) A key challenge for holistic researchers is finding an n of detailed cases sufficient enough to draw insights from, but manageable enough to work with. The 44 data-‐use instances identified by the survey were too shallow, and too numerous, for detailed comparison. Consequently, two sets of embedded cases of data.gov.uk OGD use, using a ‘multiple case, embedded case’ design (Yin 2008; Gray 2009, p.256) were generated from existing and additional data to allow a more careful and in-‐depth analysis of emerging themes. Readers are encouraged to attend carefully to diagrams and tables, as much of the detail of findings is presented here, without repetition in the text. 3.4.1. Embedded case selection Embedded case selection was theoretically informed, drawing on earlier research phases to create a broad-‐based sample allowing for both contrast and comparison between cases. Each case was written up using a range of sources and entered into the custom CAQDAS (see 3.2.1). Embedded cases were also treated separately as data use instances for §4.2, giving 55 instances of data use in total (some cases and instances overlapped). Embedded cases are listed in §4.2 along with details of the sources for each. The first set focus on education data from data.gov.uk, selected both because of the political saliency of education data, and because the EduBase dataset is available as RDF linked data. Case selection drew upon leads from survey responses (E5-‐E7) and analysis of online discussions around education OGD (E1-‐E4 & E8). Whilst E1 does not strictly constitute a use of data.gov.uk OGD, drawing on datasets prior to their release as open data by scraping the relevant content, it is included to facilitate comparison against E4. The second set of embedded cases focus on a different topic, to ensure emerging themes were not education data specific or overly skewed by the shared topic of the datasets. Where E1-‐E8 cover a range of datasets, C1-‐C6 focus on a single dataset: COINS public spending data, selected both because of its high profile launch during the period of study (generating considerable documentary data to analyze about each case) and because it was newly released data, not just made more accessible through directory listings or updated licensing. 3.5. Generalization The second arrow in Fig. 3 indicates the route to generalization of findings from the study. The controlled comparison approach of the core study could be adopted to check the relevance of findings ‘vertically’ against other uses of open data, or ‘horizontally’, against other specific data directories, including local government data directories. The articulation of many findings from the study in the form of typologies is also designed to facilitate their re-‐use in other contexts, with their validity tested on pragmatic grounds.

Page 22 of 47
4. Data The following sections approach the first three research questions in turn, before §5 takes an analytical approach to respond to RQ4. 4.1. Understanding OGD users (RQ1)
“Geeks Meet Government” Tag-line of Rewired State hack-days
It is hard to understand how OGD is being used without having an understanding of who uses OGD and what factors motivate their engagement with open data, and government data in particular. Whilst making no claims to be a representative sample, this study’s survey data suggests most OGD users are male (1-‐to-‐6; a similar ratio was observed at OGD events), better educated than the population average, and working either in private sector SME firms (39%)11, or in the public sector (34%) with only a few (3%) from the voluntary sector. Asked about labels they would ascribe to themselves (from a pre-‐specified list), survey respondents in general associated strongly with the labels ‘Citizen’, ‘Open Data Advocate’, ‘IT Specialist’, ‘Data Specialist’ and ‘Web Developer’, but very weakly with labels including ‘Policy Maker’, ‘Politician’, and surprisingly, given the proportion of the sample government employers, ‘Civil Servant’. O’Reilly blogger Nat Torkington (2010) has suggested there are five types of people with an interest in OGD: “… [1] low-‐polling governments who want to see a PR win from opening their data, [2] transparency advocates who want a more efficient and honest government, [3] citizen advocates who want services and information to make their lives better, [4] open advocates who believe that governments act for the people therefore government data should be available for free to the people, and [5] wonks who are hoping that releasing datasets …will deliver…economic benefits to the country”. However, whilst statements that would capture each of these motivations were included in the survey, rather than finding neat divisions between different motivations for working with OGD, this study finds a range of overlapping motivations, many tied together by an ideological focus on digitized and efficient government. Nat’s list notably omits policy, social and business entrepreneurs interested in exploring how OGD may be exploited. These groups featured strongly in the survey sample and in participant-‐observer research environments. Exploratory analysis of respondents’ self-‐assessed motivations for engaging with OGD led to the identification of six overlapping motivational clusters: government focused; technology & innovation focused; reward focused; digitizing government focused; problem solving; and social or public sector entrepreneurialism12. Using multidimensional scaling we can plot the
11 Defined to include micro-‐enterprises and firms with less than 250 employees. 12 Space precludes the presentation of the full exploratory analysis here. Full details are presented at http://www.practicalparticipation.co.uk/odi/survey where the underlying data is also available. In summary: survey respondents rated their motivations on a scale from ‘Not-‐at-‐all-‐important’ to ‘Very-‐Important’. The correlation matrix of response was visualized and candidate

Page 23 of 47
relationship between these motivational clusters in two-‐dimensional space as in Fig. 4 below. Figure 4.
The small cluster of OGD users who can be described as ‘Problem solvers (5)’, engaged with OGD because it was the best tool to help them meet a pre-‐defined goal (their own, or given by a client/colleague). They may have learnt new skills to work with the data. This group’s interest in government data and the
motivation clusters identified before detailed checks on cluster coherence were made (including checking against factor and bootstrapped cluster analysis, and checking interpretability against qualitative data). A composite scale for each cluster was created summing responses for each item in that cluster. The inverse of the correlation matrix of composite clusters provides a distance matrix for multidimensional-‐scaling.
Motivations for Engaging with Open Government DataMultidimensional scaling of composite clusters based on respondents
identification of motivations important to them. n=72
Technology Focus
Gov
ernm
ent f
ocus
6) Social/public sector enterpriseProviding services based on PSI/OGD
3) Reward Seeking recognition or profit
2) Technology innovationFocussed on creating new platforms; Interested in semantic web/linked-data
1) Government focussedWanting to better understanding government,& to promote efficiency & accountability
4) Digitising governmentFocus on technologicallydriven efficiency & improvement
Based on the correlations between six composite clusters of response items to survey Q5 (Use Motivations). Composite clusters based on overall correlations of motivation question items. Descriptions based on clustered item text and correlation with other survey items. Arrows indicate relationships between clusters based on correlation of clusters and qualitative data.
5) Problem solvingSeeking to meet particular challenges;willing to learn new skills & engage with OGD to do so.
0.4
0.2
0.0
-0.2
-0.4
-0.4 -0.2 0.0 0.2 0.4

Page 24 of 47
technologies for using it is based on its functional value for specific tasks. A separate cluster (6), are also interested in OGD for its functional value, but have more direct interest in government data, often as small private-‐sector businesses or social enterprises providing services to government, or with core business based around PSI. The remaining motivational clusters are more closely interrelated: few individuals can be isolated who are driven by just one set of these motivations. For example, engagement with OGD may take place both interests in technological innovation and political views regarding the current inefficiency and unaccountability of the state. The arrows in Fig. 4 draw on both correlation between clusters and qualitative data to indicate common relationships between these clusters. Some OGD users had prior interests in the accountability and efficiency of government, but for many OGD users a focus on government data emerges from the availability of that data. The fact that many of the technologically skilled OGD users who have developed a focus on government data work within small entrepreneurial private sector businesses may explain the focus on government efficiency, and on reforms designed to reduce the size of the state and to prioritize private sector innovation in many of the statements made in survey responses and interviews. The relationship between a ‘Reward’ motivation (3) and ‘Technology innovation’ motivation (2) may be partially understood through the lens of open-‐source and online hacker culture (Castells 2001, p.47), where “prestige, reputation and social esteem” are gained by contributions to the community. In the case of OGD, where ‘the community’ increasingly includes governmental decision makers and budget holders, there are also potential power and patronage factors involved. The most significant motivational cluster (4) has been labeled ‘Digitising government’ to capture a set of beliefs concerning use of technology to reform government. Respondents in this motivational cluster are likely to believe that “Releasing OGD is a matter of principle” and “Government currently makes poor use of data”. However, it may also be possible to more richly conceptualize this category by drawing on Kling and Lacono’s (2003; 1988b) notion of ‘Computerization Movements’ as way of describing a “movement whose advocates focus on computer-‐based systems as instruments to bring about a new social order” (1995, p.122). They note “few CM activists, including those who publish their arguments, assert their key ideological themes directly” (1988a, p.235). This supports an identification of this ‘Digitising government’ cluster as motivated by a belief in the capacity of OGD to bring governmental and political reform, whilst the potentially divisive details of such reform are left unelaborated. The overlap between an OGD CM and those motivated by an interest in linked-‐data and semantic-‐web technologies (motivational cluster 2) is notable. In summary, OGD users span a wide range of contexts, although currently the voluntary-‐sector is under-‐represented. Multiple motivations drive engagement with OGD, and Fig. 4 presents these on axes relating to their government or technology focus. Further insights into the nature of OGD users will be gained as this study turns to explore OGD use in practice.

Page 25 of 47
4.2. OGD use in practice (RQ2) “Calling Open Data Developers: We need your help… we want developers to work with us to use the data to create great applications;...” Digital Engagement Blog post, Cabinet Office (2009)
The narrative of developers as primary users of open data is widespread, alongside ideas that the main use of OGD is to create ‘applications’. However, the survey component of this study, developed to explore uses of OGD beyond readily accessible high-‐profile examples, suggests data use is more diverse. 4.2.1. Processes of OGD use A careful analysis of all 55 instances of OGD use reveals five distinct processes of data use. These are shown in table 2 where the identified processes are represented in schematic form below:
Every use of data starts with at least one open dataset. An operation is performed which results in an output. All 55 data use instances have been coded against at least one process, and from this, common ‘operations’ performed for certain processes have been identified. The list of operations in these diagrams is an and/or list. The current lists should be understood as non-‐exhaustive13.
13 Only four instances of Data>Service uses were reported via the survey, limiting the detail for this process.
Outputpossible operations
Final operation
Data

Page 26 of 47
Table 2: Processes of OGD use with selected examples
A dataset is used directly to identify a specific fact of interest.
E.g. Finding out the voting history of a local constituency.
Content from a dataset is given a single representation or interpretation that is reported in text or graphics.
E.g. Composing a report that “profile[s] communities of interest within [the local area] as part of the Council's equality & diversity agenda”.
An interface is provided allowing interactive representation of a dataset – providing information customized to the userʼs input.
E.g. Creating a searchable interactive online map of stations and former British rail assets.
A derivative dataset is provided for download, or access via an API
E.g. I “took Westminster Constituency data, combined it with scraped [General Election] 2005 data and exposed it as RDF.”
A service is provided that relies on open data, whilst not necessarily exposing it to the end-user.
E.g. Using boundary data from the Census to run an application that forwards reports of Potholes to the correct Highways authority.
Process Summary (and example)
FactSearchBrowseExtract
Data
InformationManipulate
Statistically analyseVisualise
ContextualiseReport
Data
InterfaceClean, Combine, Subset Data
Configure interface toolsWrite custom codeProvide interface
Data
DataConvert format
Filter dataAugment/combine data
Provide APIDataset for download
Data
Service?
Integrate into existing product/service
Create new service
Data
(n=8)
(n=19)
(n=instances)
(n=26)
(n=17)
(n=4)

Page 27 of 47
4.2.2. Detailed comparisons and emerging themes Many uses of data involve multiple steps, or have multiple outputs. Table 3 and 4 (overleaf) extend the schematic of Table 2 to outline the 14 detailed embedded cases collected (see §3.3.2), summarizing the different processes at work in each case. Annotations identify technologies used, and the shading indicates stages of the processes publically open and online for re-‐use. The following sections draw upon a comparative analysis of these cases, and wider data, in order to explore key emerging themes related to OGD use in practice. 4.2.3. Direct access to facts Advocacy for OGD release often focuses on ‘machine-‐readable data’, sometimes implicitly, if not explicitly, to the detriment of focusing on human-‐readable data. This can be based on assumptions that interfaces will inevitably be built onto data, providing non-‐technical users with access to the facts and information they desire. In both E6 (Refugee Charity Research) and E7 (School Admission Appeals), although the data-‐users were technically skilled14, their data use relied upon directly exploring spreadsheets. Either relevant facts were only available with
14 It is notable that even non-‐developer uses of data in the survey were carried out by people with wider interests in OGD and technology backgrounds. This is likely to be in-‐part down to sampling bias in the survey, but may also be an artifact of the developer-‐focused launch of data.gov.uk and the way that certain high-‐profile dataset releases (such as the Ordnance Survey geodata) have caught the interest of particular groups. This contrasts with the US experience where data.gov was launched alongside the launch of citizen-‐focused Recovery.org, and which arguably accounts for PEW study figures indicating “Some 40% of [US] adult internet users have gone online for raw-‐data about government spending and activities” (Smith 2010).

Page 28 of 47
Data (DCSF, EduBase, ?)
Information(Ofsted, ?)*
*Full technical processes unknown. Certain details are not publicly documented
Data(Project database)
Search Interface (Postcode / school search with map & icon interface)
School Information (Summarised data in sentences & using colour / icons. Links
back to source data/information.)
Case ID: Title, CreatorDescription of data use
Sources for embedded case
Data use schematicE1: UK Schools Map, Independent developerSearchable list of school locations and performance, presented on a map. Created before widespread availability of OGD in 2006. (Scripts released open source on Google Code)
Blog posts, Source code, Direct exploration.
Data(as CSV,cached)
Data (EduBase)(Web pages)
Interface (Postcode search and
then map & table interface)
Data(as CSV,cached)
Data (DSCF)(Web pages)
Data (EduBase)(Format unknown)
Data (RDF in Triple Store w/
SPARQL endpoint; cached;)
Data (RESTFUL API)
E2: EduBase as RDF, Data.gov.uk team and partnersConverting the EduBase data to RDF and exposing it via a SPARQL endpoint and API
Blog posts, Direct exploration.
(Process w/Perl scripts)
(Scraped w/Perl scripts)
(Choose schema, convert)
(Extract, Convert: Scripts accessing underlying RDF live via SPARQL)
Data (EduBase)(As RDF)
Data (As KML file, cached)
Interface(Browseable map of
council services)
E3: Lichfield My Area Map, Local authority web managerPlotting school locations on a District Council website online map. Sharing code and tools to help others to do the same.
Interview, Blog posts, Direct exploration.
(SPARQL query, using PHP & XML)
(Integrate with existing online map)
E4: Schooloscope.com, Commercial developers. Funded by 4IPProviding a visually rich interface onto school performance - translating statistics into graphics and plain English statements
Blog posts, Direct exploration.
E5: School Revenue Balance FAQ, School GovernorAnalyzing school performance against school ʻRevenue Balancesʼ and blogging the results.
Interview, Blog posts, Survey.
Information(Blog post)(Statistically analyse
Report)
Data(SQL database)
DfE Performance tables(Excel)
School Revenue Balances(Excel)
Other data(School attributes, political control of local councils,...)* *The project explored multiple relationships and correlations but only reported on one
(Clean, convert,format, reconcile)
E6: Refugee Charity Research, MSc StudentExploring a spreadsheet of local demographics on young people to inform planning and funding bids for a local charity.
Interview, Survey.
E7: School Admissions Appeals, Project managerExploring a spreadsheet to identify the success rate of school admission appeals in a specific area and comparing with other appeal success rates.
E8: Guardian Data Blog - Admission Appeals, Data JournalistDatablog entry on school admissions appeals data. Published as Google Spreadsheet; sortable list and heat-map. Written up as news story on the website and in newspaper.
Facts(Shared with colleague)(Download & explore)
DfE Data Tables(Excel)
Fact(Informs decision)(Download & find fact)
School Appeal Stats(Excel)
Interview, Survey.
Interview, Direct exploration.
School Appeal Stats(Excel)
Data & Interface(Google Spreadsheet,
online table)
Information(Blog post)
Information(Newspaper report)
Information(Online Heatmap)
Download.Convert
Analyse, Report
Summarise, Report
Visualise
('')('')
Query, Visualise,
Summarise
(Parse structured text)
(Convert)
Shading identifies 'open' ouputs from the process
Table 3: Embedded cases of education data-use

Page 29 of 47
Table 4. Embedded cases of COINS data-use.
C1: PublicSpendingData.co.uk, Unknown Direct exploration.
Information (Percentages of dept. budget
covered by account)
Interface(Drill-down into tables
by department & account)COINS
(2008-2010; Database dump)
Data(List of CSV files - subsets or original
CSV from each drill-down section. Original format)
C2: RA.Pid Explorer, Rosslyn AnalyticsLoading the data into an existing spending analysis platform and providing public access to it. Allows navigation and visualization (graphs) of the data.
Blog posts, Direct exploration.
COINS(2005-2010; Database dump)
Interface(Browse by category, graphs of top spending,
comparisons of spending)Information
(Selected static graphs on RA.Pid log-in page)
C3: COINS Data Explorer, The GuardianFaceted browsing interface allowing search and exploration of transactions, with CSV download. Inviting reports of interesting data to The Guardian, who ran a number of newspaper stories based on the data.
Interview, Direct exploration, Documention.
COINS(2005-2010;
Database dump)
Interface(Tables. Search & filter by multiple fields inc. year, months, dept, programme etc.)
Data(CSV extracts, dynamically
generated. Simplified format)
Data(API: Programatic access to data as CSV. Guide for generating JSON via YQL given)
C4: Where Does My Money Go (WDMMG), OKFLoading the data into the WDMMG data store where it can be accessed through a search interface or via a JSON and XML API. Adding comment service to transactions to allow transaction-level commenting. Inviting ʻcrowd sourcedʼ reports of interesting items to a Google Spreadsheet.
Blog posts, Direct exploration, Documention.
Interface(Paginated transactions. Search for transactions.
Transaction level commenting)Data
(Search based API providing records in JSON or XML)
COINS(2005-2010;
Database dump)Data
(WDMMG Data Store)
* Some conversation of the data and storage in a local database is likely to have taken place here.
*
*
C5: Comparison of COINS and PESA, BloggerA set of open source python scripts for processing COINS data to generate reports similar to the official Treasure public spending PESA reports, produced from the data; accompanied by a blog post outlining the process and highlighting differences between the generated and official results.
Blog posts, Source code.
COINS(any year;
Database dump)Data
(Cleaned in CSV)(Python script
to run locally)(Python script to run locally)
Data(CSV for Excel)Data
(SQLite databasel)
Information(Tables with
space for PESA figures to be
added for comparison)
(Sample SQL queries in
python script)
C6: SAS Import Code, Operational ResearchersShared source code for importing COINS data into the SAS Statistical software, posted on the company website.
*
COINS(any year; Database
dump)
Data(In SAS Statisical
software)
Information(No examples given on Andalus
site)(Shared import code) (Analysis)
Source code.
Providing interface to browse spending by department or account; and to download CSV files of data subsets. Provides percentages and easily readable numbers (e.g. 1 billion instead of 1,000,000,000)

Page 30 of 47
enough granularity from these datasets, or they were searching for any relevant data they could find, as in E7, where the interviewee was pursuing a school admissions appeal:
“…when you're in that sort of situation you want to know about what happens to other people and how likely it is [that you will win]… you want information, you're desperate for any.”
Engaging with single datasets to extract facts can be a quick task, taking minutes and hours, rather than the hours and days required for interface development. Facts identified may empower individuals or organization in their interactions with the state, whether conflictual (in school appeals) or collaborative (in putting together funding proposals for charity-‐provided services). However, both the actors behind E6 and E7 noted it may have been useful to develop interfaces onto the datasets they explored, making it easier for their own organizations, or others in similar situations, to find relevant facts in future. As the interviewee for E6 explained:
“If there was some other larger purpose for it, what I might have done is take that Excel spreadsheet and create something a bit more …user-‐friendly from it …but, to be honest, … an Excel spreadsheet is interesting if you know what you are looking for.”
Interestingly, school admission appeals data has had simpler web-‐based interfaces to it provided by The Guardian (E8). Users of the Guardian Datablog can access admission appeal facts straight from a web-‐page without downloading data. However, there are no web-‐links between data.gov.uk and this data re-‐use, in either direction. Whilst data.gov.uk is seeking to become the point of access for government data, it is not, as yet, prioritizing the ease of end-‐user access to specific facts within datasets. In the case of COINS the task of providing simple access to data (e.g. CSV format) has been clearly passed to third-‐parties building on the original, non-‐standard, data. 4.2.4. Interfaces, information and interpretation Allowing third-‐parties to create interfaces onto OGD can lead to a diversity of interfaces. Within days of the release of COINS data at least four different platforms were available for navigating the dataset (C1-‐C4), and open-‐source code was available that actors could use to generate their own interpretation of the data via familiar tools (C5-‐C6). Each interface has a differing emphasis. The RA.Pid (C2) explorer focuses on presenting quantities of spending graphically, whereas the Guardian’s COINS explorer (C3) focuses on crowd-‐sourcing more information about the nature of specific transactions and categories in the dataset. Creating interfaces onto data, and informational representations of datasets, involves making value judgments, both about what to present, and how to present it. Reflecting on the changing role of newspapers in relation to data, data-‐journalist Simon Rogers explained:
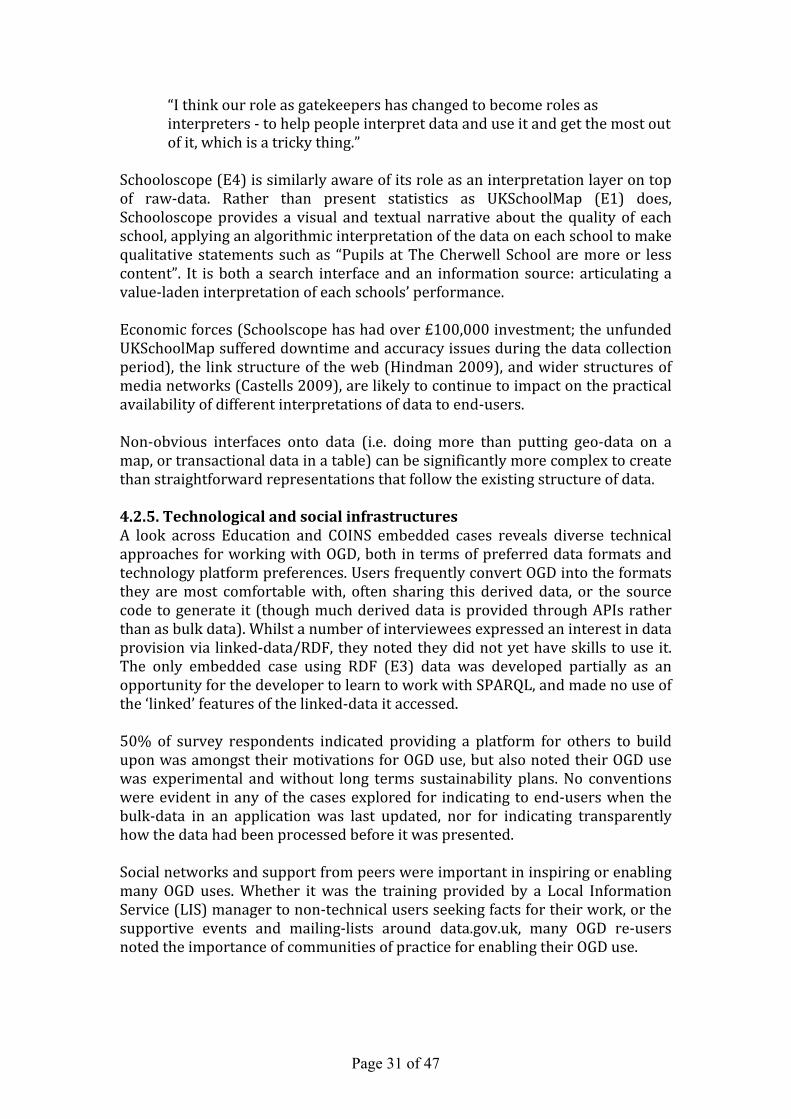
Page 31 of 47
“I think our role as gatekeepers has changed to become roles as interpreters -‐ to help people interpret data and use it and get the most out of it, which is a tricky thing.”
Schooloscope (E4) is similarly aware of its role as an interpretation layer on top of raw-‐data. Rather than present statistics as UKSchoolMap (E1) does, Schooloscope provides a visual and textual narrative about the quality of each school, applying an algorithmic interpretation of the data on each school to make qualitative statements such as “Pupils at The Cherwell School are more or less content”. It is both a search interface and an information source: articulating a value-‐laden interpretation of each schools’ performance. Economic forces (Schoolscope has had over £100,000 investment; the unfunded UKSchoolMap suffered downtime and accuracy issues during the data collection period), the link structure of the web (Hindman 2009), and wider structures of media networks (Castells 2009), are likely to continue to impact on the practical availability of different interpretations of data to end-‐users. Non-‐obvious interfaces onto data (i.e. doing more than putting geo-‐data on a map, or transactional data in a table) can be significantly more complex to create than straightforward representations that follow the existing structure of data. 4.2.5. Technological and social infrastructures A look across Education and COINS embedded cases reveals diverse technical approaches for working with OGD, both in terms of preferred data formats and technology platform preferences. Users frequently convert OGD into the formats they are most comfortable with, often sharing this derived data, or the source code to generate it (though much derived data is provided through APIs rather than as bulk data). Whilst a number of interviewees expressed an interest in data provision via linked-‐data/RDF, they noted they did not yet have skills to use it. The only embedded case using RDF (E3) data was developed partially as an opportunity for the developer to learn to work with SPARQL, and made no use of the ‘linked’ features of the linked-‐data it accessed. 50% of survey respondents indicated providing a platform for others to build upon was amongst their motivations for OGD use, but also noted their OGD use was experimental and without long terms sustainability plans. No conventions were evident in any of the cases explored for indicating to end-‐users when the bulk-‐data in an application was last updated, nor for indicating transparently how the data had been processed before it was presented. Social networks and support from peers were important in inspiring or enabling many OGD uses. Whether it was the training provided by a Local Information Service (LIS) manager to non-‐technical users seeking facts for their work, or the supportive events and mailing-‐lists around data.gov.uk, many OGD re-‐users noted the importance of communities of practice for enabling their OGD use.

Page 32 of 47
“When I saw the EduBase dataset was out there I didn't know anything about RDF or linked data at the time, but luckily…there's a good community of people around data.gov.uk…” Local authority web-manager
Attentiveness to those excluded from, or peripheral to core socio-‐technical networks around OGD is important in future analysis of the democratic potentials of OGD. The close connections between technically-‐oriented OGD re-‐users, and data.gov.uk OGD providers is notable, and potentially reinforces the ‘data for developers’ focus of the platform. One interviewee, responsible for a LIS noted that training and capacity building were as important as tool building in getting data used effectively:
"It's a long process -‐ it has taken several years really to build people's confidence [in using data in their work].” LIS Manager
4.2.6. Impact Of the data.gov.uk users in this study with matching survey responses (n=44), just 31% agreed with the statement “This project makes a direct impact on peoples’ lives”, and 36% with the statement “This project contributes to improved local or national democracy”. Whilst partially attributable to such impacts not being goals of the OGD use, in other cases it is evident that OGD use stops short of pursuing wider social impact. The school governor behind E5 noted the limits of the statistical analysis conducted and explained, “It's worth a blog, but that's about all”, although suggesting the data may prove useful in future. The blogger who compared PESA and COINS data, and identified some discrepancies noted that “I’ve satisfied my curiosity about the COINS data” and that he would not be carrying on any further exploration of the data. OGD users motivated by innovation, creating applications/websites without clear business models, have little incentive to move from proof-‐of-‐concept to production uses of data.

Page 33 of 47
4.3. Civic uses of OGD (RQ3)
“Open data is not a panacea, but it is a start.” Brian Hoadley, Twitter, 21st January 2010 (public launch of data.gov.uk)
Although most embedded cases cannot identify their direct social impact, they do posses implicit or explicit connections with different models of public sector reform/democratic change. Across the full 55 instances of OGD use, a total of 9 distinct types of civic OGD-‐use can be identified, set out in Table 5 and framed by the typology outlined in §2.4. Table 5. Civic uses of OGD and mechanisms of change
Many OGD uses fit into multiple categories. For example, Schooloscope is both oriented towards improving the quality of demand by giving better information to children and parents as ‘consumers’ of education, and could constitute a co-‐produced information resource. The following sections draw on instance and embedded case examples to elaborate on specific connections from Table 4. 4.3.1. Politics Looking at the use of COINS we see conventional forms of scrutiny (C4, newspaper led) complemented by crowd-‐sourcing initiatives (C3-‐C4) and independent individuals (C1, C5) and companies (C2) providing their own platforms for members of the public to explore government spending, and, in theory, to scrutinize that spending. The availability of multiple education datasets also allowed an independent school governor (E5) to scrutinize a specific government policy. However, as noted in 4.2.6 much scrutiny can fall short: unless data is also used to lobby for change. Scrutiny-‐type processes may however feed into individuals voting choices, or direct interaction with elected representatives and senior officials. A number of instances refer to the use of political data to explore electoral histories, perhaps for strategic voting. Data-‐journalist Simon Rogers notes that during the 2010 UK Election “numbers were debated every single day”, suggesting that data is coming to play an increasingly fundamental role in political debate. That role can
(a) Political participation(b) Collaborative / community based
participation(c) Individual choice / market participation
a1. Supporting scrutinya2. Informing citizens as votersa3. Informing citizens on specific issuesa4. Supporting campaigning and lobbying
b1. Co-produced planningb2. Co-produced servicesb3. Co-produced information
c1. Improving the quality of demand (better informed consumers)c2. Improving the quality of provision(competitive innovation)

Page 34 of 47
be direct, when OGD allows citizens or media outlets to check the claims made by politicians, or may be more subtle, though no less political. For example, the ‘Facebook Crime Quiz’ takes data on crime rates in a local area and makes a game out of checking whether a user’s perception of crime matches the reality. The ‘Awsometer’ mobile-‐phone application takes a user’s location and checks a variety of open datasets for positive public provision nearby, giving an ‘Awsomeness score’ to that location. The application’s developer was inspired to create it as a response to the ASBOrometer iPhone application which displays anti-‐social behavior statistics for a locality, describing it as a form of “digital pamphleteering”. 4.3.2. Co-production It was difficult from the data available to identify instances in which OGD supported significant engagement between state and citizens, or state and service providers that could be clearly described as “collaborative” or “community based” where community is understood as a community of interest or local community. Rather, loose linkages between public services and independent actors facilitated by the flow of OGD support a range of models of ‘co-‐production’ (Brudney & England 1983; Needham 2008; Pizzicannella 2010). Co-‐production of information was most common, although a number of survey responses also described the co-‐production of planning: small enterprises using OGD resources to create environmental, education or housing reports subsequently sold to or shared with government to inform strategic planning. The Lichfield My Area Map (E3) illustrates that informational (and other forms of) co-‐production may also occur between layers of government: allowing a council to seamlessly provide information on services provided by another tier of government. Few examples of co-‐produced services were available in the sample, but, in reducing ‘friction’ in information exchange, there is clearly potential for OGD to play a role in the functioning of commissioned-‐out services. 4.3.3. Markets UKSchoolsMap and Schooloscope (E1, E4) are illustrative of OGD interfaces that support ‘consumers’ of services to choose provision based on their specific preferences, although the impact these can have depends on how underlying markets are functioning (and how effective market forces are in specific public service domains). Whilst demand-‐side market-‐based OGD use is more visible, a number of data-‐use instances, survey responses and interviews suggested OGD has a key role in stimulating a competitive marketplace for public services. 80% of all survey respondents agreed with the statement “Innovators from outside government will use OGD to build better online services than government can”. The perceived incapacity of government to develop in-‐house, or to procure small-‐scale, modular and agile services (not only online services) was a recurring theme in discussions with participants at hack-‐day events. As one interviewee noted, when government’s effective monopoly in specific areas

Page 35 of 47
of data collection is converted into monopoly control of that data it “actually drives others out of the marketplace” and crowds out innovation. When data is open then access to the data does not provide a competitive advantage to firms with exclusive data-‐access agreements. Competitive advantage has to come from offering innovative value-‐added services on top of the data.

Page 36 of 47
5. Discussion: civic implications of OGD (RQ4) This section returns to the four arguments for releasing OGD noted at the start of this study. These were that OGD release will play a role in:
• Promoting transparency and accountability • Empowering citizens to drive public sector reform • Releasing the economic and social value of information • Putting Britain at the leading edge of semantic web developments.
Assessing the magnitude of impact that OGD can have in these respects is beyond the scope of this study. However, a number of modest remarks can be made from the evidence-‐base presented in §4 regarding democratic and public sector reform implications of OGD use. 5.1. Changing gatekeeping OGD users have been exploring how scrutiny can be crowd-‐sourced, and have been using data to check state information and policies. The availability of OGD removes one aspect of both the state (and mainstream media’s) gatekeeping power (Castells 2009), although other socio-‐economic structures may constrain the extent to which new actors can widely advance their alternative interpretations of data. With both high-‐profile (COINS) and niche (School Revenue Balance) datasets this study has seen individuals able to create their own interpretations of government data, and to contribute those interpretations to spaces of online debate. However, where OGD has allowed a ‘revolution in the middle’ (Bimber 2003), with new actors using data to enter public debate, those actors are, at present, technically skilled, as well as issue-‐interested, and thus far the engagement to be observed is data-‐aware individuals engaging with issues, rather than conventional issue-‐based civil society institutions engaging with OGD. Notions of communicative governance (§2.4.2) suggest OGD should allow citizens to debate the meaning of data with the state. Within the core network of actors around data.gov.uk debate was occurring, but the debate is frequently dominated by technical and data-‐standard type concerns. Widespread capacity within the state to engage with debate around meanings of data, and to use data as the starting point for democratic dialogue is yet to develop. 5.2. Empowering individuals Exploring OGD can give individuals greater understanding of the state, and direct access to facts and information can empower individuals in their interactions with the state – addressing the information inequalities that concerned Dahl (2000). There is a risk that a focus on data-‐for-‐developers, and expectation that all data will be accessed through online interfaces can lead to a neglect of mechanisms for direct OGD access, although infrastructures and principles of data publishing could be developed to ensure all citizens have good opportunities to go direct to a trusted data source to get the detailed and granular information they need. In-‐so-‐far-‐as new mediators of government information, such as UKSchoolMap and Schooloscope give information on topics over which citizen-‐consumers have

Page 37 of 47
genuine choice, then these can also empower individuals through market-‐mechanisms. It is notable though that both market and non-‐market models of empowerment described in this section are individual centred: and how OGD feeds into models of collective empowerment is unclear from the instances considered in this study. Attentiveness to Bowker (2000) and Scott’s (1998) concern that schemas of data collection can impact its future use, is warranted in this context, particularly if geographies of data collection (wards, super-‐output-‐areas etc.) do not match geographies of civic mobilization. 5.3. Innovation and reform The OGD related drivers for public sector reform evident so far appear to come not from citizen engagement with the planning process, but from OGD-‐enabled innovation and the use by third-‐parties (often commercial or social enterprises) of OGD to provide planning support and new services to the state. OGD can create a space for innovation outside the bureaucracy, and at present, many OGD users are motivated to pursue innovative development on a speculative basis – either for personal learning, or potential reward in terms of recognition, profits or patronage. How far this innovation can move from dealing directly in predominantly digital and informational services to impact upon wider areas of public sector reform is yet to be seen, and certain issues may arise about the accountability gains or losses that result if OGD drives a transfer of public functions to private enterprise. However, particularly given the economic focus of EU PSI agendas, it is within the entrepreneurial use of state-‐centric OGD that some of the most significant implications for public sector reform are likely to be. 5.4. Digitized government: equitable architectures? In section 4.1 it was suggested that the motivational driver shared by many OGD users of ‘digitizing government’, in part a response to a critical assessment of past government ICT initiatives (Dunleavy et al. 2006), has many of the hallmarks of a ‘Computerization Movement’, focused on problem-‐solving via application of technology to a situation, and noting no limitations of appropriate digitization. Via the same routes noted for general innovation above, OGD can support the development of new modular digital infrastructures around government data, and many of the processes of OGD use noted in §4.2 do adopt a very modular approach, providing components of an OGD infrastructure for others to build on. However, Hood and Margetts (2007), drawing on Dunlop and Kling (1991), note that visions of technology-‐driven change often suppose situations in which “conflict, politics and adversarial legalism are unknown or at least unimportant” (p. 179). There is a risk that many claims about the potential implications of digitized government via OGD ignore, and thus do not address and seek to tackle, key constraints to the equitable distribution of benefits (and power) that can be created/shared through OGD use. Unequal distributions of skills, social capital, and time have a big impact on who is making use of OGD, and the reach they can have with OGD use. Similarly, some problems remain difficult to solve, even with (and sometimes because of) government datasets, and the appropriate response to such problems may be social rather than technological.

Page 38 of 47
6. Conclusions 6.1. Directions for further research This exploratory study has undertaken wide-‐reaching preliminary work exploring OGD use. The typologies it offers require further work to generate operational definitions for each, and to further test their adequacy on a larger sample of OGD use-‐cases. Whilst this study inevitably touched on OGD supply, further work looking directly at relationships between supply and use of OGD would be valuable. Two strategies are relevant for this wider work. Firstly, a Socio-‐Technical Interaction Networks approach (Meyer 2010) would build on identification of a possible OGD Computerization Movement (§4.1), and would support more comprehensive analysis of ideologies driving OGD use, and of how actors and technologies are interacting, whilst also drawing attention to the actors missing from, or peripheral to, networks around OGD. Secondly, work to explore downstream uses of OGD (e.g. use of interfaces built with OGD) would provide illumination beyond the direct OGD use explored in this study, allowing deeper evaluation of OGD value-‐chains. Understanding the full civic value-‐chain of OGD use is important to inform future investment decisions concerning OGD supply. 6.2. Contributions and Conclusion This paper makes three contributions. Firstly, it outlines a model for thinking about different processes of OGD use, based on careful analysis of real-‐world use cases. Secondly, it sketches connections that can be drawn between OGD and models of democratic engagement and public sector reform. This lays the foundations for future studies, including those oriented towards normative assessment of the relationship between OGD and civic change. Thirdly, in focusing on OGD from the end-‐use perspective, rather than more common perspectives of data and tool providers, and in addressing the democratic and public service arguments for OGD distinct from economic benefit arguments, it contributes to a rebalancing of the OGD debate towards civic over technological or economic concerns. By way of conclusion concerning the implications of OGD use, it notes that whilst unambiguous (though not always realized) pathways for OGD to impact on reforming public services are apparent, the relationship between data and democracy, (democracy understood as something other than ‘personal democracy’) is harder to define, more equivocal, and worthy of much further theoretical and practical attention.

Page 39 of 47
Bibliography 2009. Creating impact for an eUnion 2015 – "The Visby Declaration", Visby.
Available at: http://www.se2009.eu/polopoly_fs/1.22793!menu/standard/file/conclusions%20visby.pdf.
Aichholzer, G. & Burkert, H., 2004. Public sector information in the digital age:
between markets, public management and citizens' rights, Edward Elgar Publishing.
Alani, H. et al., 2007. Unlocking the potential of public sector information with
semantic web technology. Lecture Notes in Computer Science, 4825, 708. Allan, R., 2009. The Power of Government Information. In J. Gøtze & C. B.
Pedersen, eds. State of the eUnion: Government 2.0 and Onwards. AuthorHouse.
Bartholomew, D.J. et al., 2008. Analysis of Multivariate Social Science Data, Second
Edition (Chapman & Hall/Crc Statistics in the Social and Behavioral Scie) 2nd ed., Chapman and Hall/CRC.
Becker, R.A., Chambers, J.M. & Wilks, A.R., 1988. The new S language: a
programming environment for data analysis and graphics. Beetham, D., 1994. Defining and measuring democracy, Sage Publications Ltd. Beniger, J.R., 1986. The control revolution: Technological and economic origins of
the information society, Harvard Univ Pr. Benkler, Y., 2007. The wealth of networks: How social production transforms
markets and freedom, Yale Univ Pr. Bennett, C., 1985. From the Dark to the Light: The Open Government Debate in
Britain. Journal of Public Policy, 5(02), 187-213. Berners-Lee, T., 2009. Putting Government Data online - Design Issues. Available at:
http://www.w3.org/DesignIssues/GovData.html [Accessed May 19, 2010]. Bilgin, A. et al., 2009. Graphviz-Graph Visualization Software, Graphviz. Bimber, B.A., 2003. Information and American democracy: Technology in the
evolution of political power, Cambridge Univ Pr. Bizer, C., Heath, T. & Berners-Lee, T., 2009. Linked data–the story so far.
International Journal on Semantic Web and Information Systems, 5(3), 1–22. Boland, L. & Coleman, E., 2008. New Development: What Lies Beyond Service
Delivery? Leadership Behaviours for Place Shaping in Local Government. Public Money & Management, 28(5), 313–318.

Page 40 of 47
Boland, L. & Colman, E., Can Leviathan stop gobbling people up and start really listening to them?
Borg, S., 2001. The research journal: a tool for promoting and understanding
researcher development. Language Teaching Research, 156 -177. Bowker, G.C., 2000. Biodiversity datadiversity. Social Studies of Science, 643–683. Brewer, J. & Hunter, A., 2006. Foundations of multimethod research, SAGE. Brown, G., 2009. Speech on Building Britain’s Digital Future. Available at:
http://www.number10.gov.uk/Page22897 [Accessed April 13, 2010]. Brudney, J.L. & England, R.E., 1983. Toward a Definition of the Coproduction
Concept. Public Administration Review, 43(1), 59-65. Bryman, A., 2008. Social Research Methods 3rd ed., OUP Oxford. Burkert, H., 2004. The Mechanics of Public Sector Information. In G. Aichholzer &
H. Burkert, eds. Public sector information in the digital age: between markets, public management and citizens' rights. Edward Elgar Publishing.
Butler, D., 2007. Data sharing: the next generation. Nature, 446(7131), 10-11. Cabinet Office, 2009. Calling Open Data Developers: We need your help. Cabinet
Office: Digital Engagement Blog. Available at: http://blogs.cabinetoffice.gov.uk/digitalengagement/post/2009/09/30/Calling-Open-Data-Developers-We-need-your-help.aspx [Accessed November 27, 2009].
Cameron, D., 2010. Letter to Government departments on opening up data |
Number10.gov.uk. Available at: http://www.number10.gov.uk/news/statements-and-articles/2010/05/letter-to-government-departments-on-opening-up-data-51204 [Accessed July 9, 2010].
Card, S., 2009. Information Visualization. In J. A. Jacko, ed. Human-Computer
Interaction. CRC Press. Castells, M., 2009. Communication power, Oxford ;;New York: Oxford University
Press. Castells, M., 2001. The Internet Galaxy: Reflections on the Internet, Business, and
Society 1st ed., Oxford University Press, USA. Chi, E.H., 2000. A taxonomy of visualization techniques using the data state reference
model. In Proceedings of the IEEE Symposium on Information Visualization. pp. 69–75.
Cho, H. & LaRose, R., 1999. Privacy issues in Internet surveys. Social Science
Computer Review, 17(4), 421.

Page 41 of 47
Coleman, E. & Boland, L., 2010. Can Leviathan stop gobbling people up and start
really listening to them? A call for a new form of public sector governance. Costello, A.B. & Osborne, J.W., 2005. Best practices in exploratory factor analysis:
four recommendations for getting the most from your analysis. Practical Assessment, Research & Evaluation, 10(7), 1–9.
Couper, M.P., 2000. Web surveys - a review of issues and approaches. Public opinion
quarterly, 64(4), 464–494. Crenson, M.A. & Ginsberg, B., 2003. From popular to personal democracy. National
Civic Review, 92(2), 173–189. Dahl, R.A., 1989. Democracy and its Critics, Yale Univ Pr. Dahl, R.A., 2000. On democracy, Yale Univ Pr. Daniel, W.W., 1993. Strategic research: Political convenience or practical reality?
Policy Studies, 14(3), 4–17. Davies, A. & Lithwick, D., 2010. Government 2.0 and Access to Information: 2.
Recent Developments in Proactive Disclosure and Open Data in the United States and Other Countries (2010-15E), Library of Parliament, Canada. Available at: http://www2.parl.gc.ca/Content/LOP/ResearchPublications/2010-15-e.htm#a4 [Accessed May 24, 2010].
De Saulles, M., 2005. e-Government and the Re-use of Public Sector Information. In
5th European conference on e-government: University of Antwerp, Belgium 16-17 June 2005. p. 121.
Dekkers, M. et al., 2006. MEPSIR - Measuring European Public Sector Information
Resources, Available at: http://ec.europa.eu/information_society/policy/psi/actions_eu/policy_actions/mepsir/index_en.htm [Accessed December 21, 2009].
Dervin, B., 1994. Information <-> democracy: An examination of underlying
assumptions. Journal of the American Society for Information Science, 45(6), 369-385.
Dewey, J., 1938. Logic-the theory of inquiry, Henry Holt and Company. Dierking, H., 2010. Engineering Good Government. In D. Lathrop & L. Ruma, eds.
Open Government: Collaboration, Transparency, and Participation in Practice. O'Reilly Media.
Diesing, P., 1971. Patterns of Discovery in the Social Sciences Reprint.,
AldineTransaction.

Page 42 of 47
Ding, L. et al., 2010. Making Sense of Open Government Data. Downs, A., 1957a. An Economic Theory of Democracy, Addison Wesley. Downs, A., 1957b. An Economic Theory of Political Action in a Democracy. The
Journal of Political Economy, 65(2), 135-150. Dryzek, J. & Dunleavy, P., 2009. Theories of the Democratic State, Palgrave
Macmillan. Dunleavy, P. et al., 2006. Digital era governance: IT corporations, the state, and E-
government, Oxford University Press, USA. Dunlop, C. & Kling, R., 1991. Computerization and controversy: value conflicts and
social choices, Academic Press Professional, Inc. San Diego, CA, USA. Eaves, D., 2009. Three Laws of Open Data (International Edition. Eaves.ca.
Available at: http://eaves.ca/2009/11/29/three-laws-of-open-data-international-edition/ [Accessed June 1, 2010].
European Commission, 2003a. Directive 2003/9 8/EC of Parliament and Council on
the re-use of public sector information, Available at: http://ec.europa.eu/information_society/policy/psi/docs/pdfs/directive/psi_directive_en.pdf.
European Commission, 2003b. Public Sector Information Directive, Available at:
http://ec.europa.eu/information_society/policy/psi/actions_eu/policy_actions/index_en.htm [Accessed December 21, 2009].
Eynon, R., Fry, J. & Schroeder, R., 2008. The ethics of internet research. The SAGE
handbook of online research methods, 23. Fine, A. et al., 2008. Rebooting America; Ideas for Redesigning American Democracy
for the Internet Age, Fink, A., 2006. How to conduct surveys : a step-by-step guide 3rd ed., Thousand Oaks
; London: Sage. Floridi, L., 2004. Information. In L. Floridi, ed. The Blackwell Guide to the
Philosophy of Computing and Information. Wiley-Blackwell. Fung, A. & Weil, D., 2010. Open Government and Open Society. In D. Lathrop & L.
Ruma, eds. Open Government: Collaboration, Transparency, and Participation in Practice. O'Reilly Media.
Gray, D.E., 2009. Doing research in the real world, Sage Publications Ltd. Hague, B.N. & Loader, B., 1999. Digital democracy, Routledge. Hatcher, J. & Waelde, C., 2007. Open Data Commons » Licenses. Available at:

Page 43 of 47
http://www.opendatacommons.org/licenses/ [Accessed June 1, 2010]. Hayek, F.A., 1944. The road to serfdom, Heald, D., 2006. Transparency as an instrumental value. In Proceedings of the British
Academy. p. 59. Held, D., 2006. Models of democracy, Polity Pr. Hindman, M.S., 2009. The myth of digital democracy, Princeton Univ Pr. HMG, 2009. Putting the Frontline First: Smarter Government. Available at:
http://www.hmg.gov.uk/frontlinefirst/action1/transparency.aspx [Accessed March 7, 2010].
Hogge, B., 2010. Open Data Study, Open Society Institute. Available at:
http://www.soros.org/initiatives/information/focus/communication/articles_publications/publications/open-data-study-20100519.
Hood, C.C. & Margetts, H.Z., 2007. The Tools of Government in the Digital Age 2nd
ed., Palgrave Macmillan. Hookway, C., 2008. Pragmatism. Available at:
http://plato.stanford.edu/entries/pragmatism/ [Accessed June 23, 2010]. Huang, J., Thornton, K.M. & Efthimiadis, E.N., 2010. Conversational Tagging in
Twitter. Janesick, V.J., 1999. A Journal About Journal Writing as a Qualitative Research
Technique: History, Issues, and Reflections. Qualitative Inquiry, 505 -524. Kamarck, E.C., Nye, J.S. & (Program), V.O.G.I.T.2.C., 2002. Governance.com,
Brookings Institution Press. Kish, L., 1965. Survey sampling., New York ; Toronto: J. Wiley. Kling, R. & Iacono, S., 1995. Computerization movements and the mobilization of
support for computerization. In S. L. Star, ed. Ecologies of knowledge: Work and politics in science and technology. pp. 119–153.
Kling, R. & Iacono, S., 1988a. Mobilization of Support for Computerization: The
Role of Computerization Movements, The. Soc. Probs., 35, 226. Kling, R. & Iacono, S., 1988b. The Mobilization of Support for Computerization: The
Role of Computerization Movements. Social Problems, 35, 226. Kling, R., McKim, G. & King, A., 2003. A bit more to it: Scholarly communication
forums as socio-technical interaction networks. Journal of the American Society for Information Science and Technology, 54(1), 47–67.

Page 44 of 47
Lakhani, K.B., 2009. Innocentive.com (A), Lathrop, D. & Ruma, L., 2010. Open Government: Collaboration, Transparency, and
Participation in Practice 1st ed., O'Reilly Media. Lawley, D.N. & Maxwell, A.E., 1962. Factor Analysis as a Statistical Method.
Journal of the Royal Statistical Society. Series D (The Statistician), 12(3), 209-229.
Le Grand, J., 2007. The other invisible hand: delivering public services through
choice and competition, Princeton Univ Pr. Lievrouw, L.A., 1994. Information Resources and Democracy: Understanding the
Paradox. Journal of the American Society for Information Science, 45(6), 350–57.
Malmud, C. et al., 2007. 8 Principles of Open Government Data. Available at:
http://resource.org/8_principles.html [Accessed June 1, 2010]. Mayo, E. & Steinberg, T., 2007. Power of Information Taskforce Report, Available
at: http://www.cabinetoffice.gov.uk/reports/power_of_information.aspx [Accessed December 1, 2009].
Meyer, E., 2010. Socio-technical Interaction Networks: A discussion of the strengths,
weaknesses and future of Kling’s STIN model. Social Informatics: An Information Society for all? In Remembrance of Rob Kling, 37–48.
Miles, M.B. & Huberman, A.M., 1994. Qualitative data analysis: An expanded
sourcebook, SAGE publications, Inc. Murray-Rust, P. et al., 2009. Panton Principles. Available at:
http://pantonprinciples.org/ [Accessed March 4, 2010]. Needham, C., 2008. Realising the Potential of Co-Production: Negotiating
Improvements in Public Services. Social Policy and Society, 7(02), 221-231. Newbery, D., Bently, L. & Pollock, R., 2008. Models of public sector information
provision via trading funds. Nissenbaum, H., 1998. Protecting privacy in an information age: The problem of
privacy in public. Law and Philosophy, 17(5), 559–596. Noveck, B.S., 2006. Peer to Patent: Collective Intelligence, Open Review, and Patent
Reform. Harv. JL & Tech., 20, 123. Noveck, B.S., 2010. The Single Point of Failure. In D. Lathrop & L. Ruma, eds. Open
Government: Collaboration, Transparency, and Participation in Practice. O'Reilly Media.
Noveck, B.S., 2009. Wiki government: how technology can make government better,

Page 45 of 47
democracy stronger, and citizens more powerful, Brookings Inst Pr. Obama, B., 2010. Memo from President Obama on Transparency and Open
Government. In D. Lathrop & L. Ruma, eds. Open Government. Available at: http://www.whitehouse.gov/open/documents/open-government-directive [Accessed April 18, 2010].
OED Online, 2000. datum. In Oxford English Dictionary. Oxford University Press.
Available at: http://dictionary.oed.com/cgi/entry/50057802/ [Accessed May 22, 2010].
OKF - Open Knowledge Foundation, 2006. Open Knowledge Definition. Available
at: http://www.opendefinition.org/ [Accessed March 4, 2010]. Parycek, P. & Sachs, M., 2010. Open Government – Information Flow in Web 2.0.
European Journal of ePractice, (9). Available at: http://www.epractice.eu/en/document/313345 [Accessed May 23, 2010].
Pellegrini, T., 2009. Semantic Web Awareness 2009, The Semantic Web Company.
Available at: http://www.semantic-web.at/file_upload/1_tmpphpvuVU1T.pdf [Accessed May 23, 2010].
PIRA, 2000. Commercial exploitation of Europe's Public Sector Information, Pizzicannella, R., 2010. Co-production and open data: the right mix for public service
effectiveness? In Draft papers. 10th European Conference on eGovernment. Limerick, Ireland. Available at: http://pizzican.wordpress.com/2010/05/23/co-production-and-open-data-in-public-services/#comment-3 [Accessed May 24, 2010].
Pollock, R., 2009. The Economics of Public Sector Information. Available at:
http://econpapers.repec.org/paper/camcamdae/0920.htm [Accessed March 4, 2010].
Prat, A., 2006. The more closely we are watched, the better we behave? In
PROCEEDINGS-BRITISH ACADEMY. p. 91. Putnam, H., 1995. Pragmatism: an open question, Wiley-Blackwell. Putnam, H. & Conant, J., 1995. Words and life, Harvard Univ Pr. Rivadeneira, A.W. et al., 2007. Getting our head in the clouds: toward evaluation
studies of tagclouds. In Proceedings of the SIGCHI conference on Human factors in computing systems. San Jose, California, USA: ACM, pp. 995-998. Available at: http://portal.acm.org/citation.cfm?id=1240624.1240775 [Accessed July 17, 2010].
Robinson, D. et al., 2008. Government data and the invisible hand. Yale Journal of
Law and Technology, 11, 160.
Page 46 of 47
Rosling, H., 2006. Hans Rosling shows the best stats you've ever seen, Available at: http://www.ted.com/talks/hans_rosling_shows_the_best_stats_you_ve_ever_seen.html [Accessed May 23, 2010].
Rosling, H., 2010. The Changing World -- A New Mindset for a Multipolar World,
The World Bank, New York. Available at: http://www.youtube.com/watch?v=cfCdZv1KiSU [Accessed May 23, 2010].
Rosling, H.A., 2007. Visual technology unveils the beauty of statistics and swaps
policy from dissemination to access. Statistical Journal of the IAOS: Journal of the International Association for Official Statistics, 24(1), 103-104.
Rowley, J.E., 2007. The wisdom hierarchy: representations of the DIKW hierarchy.
Journal of Information Science, 0165551506070706v1. Scott, J.C., 1998. Seeing like a state, Yale University Press New Haven, CT. Sifry, M.L., 2010. "You Can Be the Eyes and Years": Barak Obama and the Wisdom
of Crowds. In D. Lathrop & L. Ruma, eds. Open Government: Collaboration, Transparency, and Participation in Practice. O'Reilly Media.
Skolnick, B.P., 1995. The uses of social science research: a report of a workshop
organised by the ESRC Programme on Information and Communication Technologies,
Smith, A., 2010. Government Online, Pew Research Centre. Snowdon, D., 2010. Its information to data we need, not DIKW. Cognitive Edge.
Available at: http://www.cognitive-edge.com/blogs/dave/2010/05/its_information_to_data_we_nee.php [Accessed May 19, 2010].
Stasavage, D., 2006. Does Transparency Make a Difference? The Example of the
European Council of Ministers. In PROCEEDINGS-BRITISH ACADEMY. p. 165.
Stephenson, D.W., 2009. Data Triggers Transformation. In J. Gøtze & C. B.
Pedersen, eds. State of the eUnion: Government 2.0 and Onwards. AuthorHouse.
Stiglitz, J.E., 2000. The contributions of the economics of information to twentieth
century economics. Technology, 1441. Sunstein, C.R., 2007. Republic. com 2.0, Princeton Univ Pr. Suzuki, R. & Shimodaira, H., 2006. Pvclust: an R package for assessing the
uncertainty in hierarchical clustering. Bioinformatics, 22(12), 1540. Tashakkori, A. & Teddlie, C., 1998. Mixed methodology: Combining qualitative and
quantitative approaches, Sage Publications, Inc.
Page 47 of 47
Tennison, J. & Sheridan, J., 2010. Linking UK Government Data. In Linked Data on
the Web (LDOW2010). WWW2010, Raleigh, North Carolina. Available at: http://events.linkeddata.org/ldow2010/ [Accessed May 19, 2010].
Torkington, N., 2010. Rethinking Open Data - O'Reilly Radar. O'Reilly Radar.
Available at: http://radar.oreilly.com/2010/02/rethinking-open-data.html [Accessed July 18, 2010].
Uhlir, P., 2009. The Socioeconomic Effects of Public Sector Information on Digital
Networks: Toward a Better Understanding of Different Access and Reuse Policies: Workshop Summary, Available at: http://www.nap.edu/catalog.php?record_id=12687 [Accessed September 30, 2009].
Varnhagen, C.K. et al., 2005. How Informed Is Online Informed Consent? Ethics &
Behavior, 15(1), 37. Viégas, F.B. et al., 2007. Manyeyes: a site for visualization at internet scale. IEEE
Transactions on Visualization and Computer Graphics, 13(6), 1121–1128. Von Hippel, E., 2005. Democratizing innovation, the MIT Press. Weinstein, M., 2008. TAMS Analyser for Macintosh OS X, Available at:
http://tamsys.sourceforge.net/. Weiss, P., 2004. Borders in Cyberspace: Conflicting Public Sector Information
Policies and Their Economic Impacts. In G. Aichholzer & H. Burkert, eds. Public sector information in the digital age. Edward Elgar Publishing.
Wiber, C.K., 1999. Holistic Method. In P. A. O'Hara, ed. Encyclopedia of political
economy. Routledge, p. 451. Worthy, B., 2008. The Future of Freedom of Information in the United Kingdom.
Political Quarterly, 79(1), 100-108. Yin, R.K., 2008. Case study research: Design and methods, Sage Publications, Inc.