Open Access Research Understanding negative feedback from ...
8
Understanding negative feedback from South Asian patients: an experimental vignette study Jenni Burt, 1 Gary Abel, 2 Natasha Elmore, 1 Cathy Lloyd, 3 John Benson, 4 Lara Sarson, 5 Anna Carluccio, 5 John Campbell, 6 Marc N Elliott, 7 Martin Roland 1 To cite: Burt J, Abel G, Elmore N, et al. Understanding negative feedback from South Asian patients: an experimental vignette study. BMJ Open 2016;6:e011256. doi:10.1136/bmjopen-2016- 011256 ▸ Prepublication history and additional material is available. To view please visit the journal (http://dx.doi.org/ 10.1136/bmjopen-2016- 011256). Received 22 January 2016 Revised 18 May 2016 Accepted 19 May 2016 1 Cambridge Centre for Health Services Research, Institute of Public Health, Forvie Site, University of Cambridge School of Clinical Medicine, Cambridge, UK 2 University of Exeter Medical School, Exeter, UK 3 Faculty of Health and Social Care, The Open University, Milton Keynes, UK 4 Primary Care Unit, Institute of Public Health, Forvie Site, University of Cambridge School of Clinical Medicine, Cambridge, UK 5 Ipsos MORI, London, UK 6 University of Exeter Medical School, Exeter, UK 7 RAND Corporation, Santa Monica, California, USA Correspondence to Dr Jenni Burt; [email protected] ABSTRACT Objectives: In many countries, minority ethnic groups report poorer care in patient surveys. This could be because they get worse care or because they respond differently to such surveys. We conducted an experiment to determine whether South Asian people in England rate simulated GP consultations the same or differently from White British people. If these groups rate consultations similarly when viewing identical simulated consultations, it would be more likely that the lower scores reported by minority ethnic groups in real surveys reflect real differences in quality of care. Design: Experimental vignette study. Trained fieldworkers completed computer-assisted personal interviews during which participants rated 3 video recordings of simulated GP–patient consultations, using 5 communication items from the English GP Patient Survey. Consultations were shown in a random order, selected from a pool of 16. Setting: Geographically confined areas of ∼130 households (output areas) in England, selected using proportional systematic sampling. Participants: 564 White British and 564 Pakistani adults recruited using an in-home face-to-face approach. Main outcome measure: Mean differences in communication score (on a scale of 0–100) between White British and Pakistani participants, estimated from linear regression. Results: Pakistani participants, on average, scored consultations 9.8 points higher than White British participants (95% CI 8.0 to 11.7, p<0.001) when viewing the same consultations. When adjusted for age, gender, deprivation, self-rated health and video, the difference increased to 11.0 points (95% CI 8.5 to 13.6, p<0.001). The largest differences were seen when participants were older (>55) and where communication was scripted to be poor. Conclusions: Substantial differences in ratings were found between groups, with Pakistani respondents giving higher scores than White British respondents to videos showing the same care. Our findings suggest that the lower scores reported by Pakistani patients in national surveys represent genuinely worse experiences of communication compared to the White British majority. INTRODUCTION Communication between doctors and patients is a core component of patient experience. 1 Patients’ evaluations of doctors’ interpersonal skills are widely used in assess- ments of the quality of care, with an increas- ing focus on the public reporting of patient feedback. 2 In the USA and the UK, certain minority ethnic groups report lower patient experience scores compared to the majority population. 3–8 For example, analysis of the English General Practice Patient Survey found that South Asian groups report par- ticularly low scores compared to the White British majority, with Bangladeshi and Strengths and limitations of this study ▪ This is the first study to exclusively use a video vignette approach to assess the extent to which ethnic differences in reported patient experience of primary care reflect real differences rather than differences in expectations, perceptions or in the use of scales. ▪ Our experimental design enables us to control the content of the consultations being rated by respondents in order to explore how differences in reporting may or may not explain the dispar- ities in minority ethnic experience in real-life surveys. ▪ While our in-home face-to-face recruitment approach ensured access to a wide range of respondents, respondents who agreed to partici- pate in this study may differ in a number of unidentified ways from the population as a whole. ▪ Our study involved face-to-face interviews in which consultations were viewed and rated: this differs from the postal mode of the national GP Patient Survey, and in completing questionnaire items via an interviewer rather than independ- ently, social desirability bias may be an issue. ▪ To enable the same vignettes to be viewed by all participants, the study was conducted in English, limiting our ability to understand evaluations by those with low English language proficiency. Burt J, et al. BMJ Open 2016;6:e011256. doi:10.1136/bmjopen-2016-011256 1 Open Access Research on January 17, 2022 by guest. Protected by copyright. http://bmjopen.bmj.com/ BMJ Open: first published as 10.1136/bmjopen-2016-011256 on 8 September 2016. Downloaded from
Transcript of Open Access Research Understanding negative feedback from ...

Understanding negative feedback fromSouth Asian patients: an experimentalvignette study
Jenni Burt,1 Gary Abel,2 Natasha Elmore,1 Cathy Lloyd,3 John Benson,4
Lara Sarson,5 Anna Carluccio,5 John Campbell,6 Marc N Elliott,7 Martin Roland1
To cite: Burt J, Abel G,Elmore N, et al.Understanding negativefeedback from South Asianpatients: an experimentalvignette study. BMJ Open2016;6:e011256.doi:10.1136/bmjopen-2016-011256
▸ Prepublication history andadditional material isavailable. To view please visitthe journal (http://dx.doi.org/10.1136/bmjopen-2016-011256).
Received 22 January 2016Revised 18 May 2016Accepted 19 May 2016
1Cambridge Centre for HealthServices Research, Instituteof Public Health, Forvie Site,University of CambridgeSchool of Clinical Medicine,Cambridge, UK2University of Exeter MedicalSchool, Exeter, UK3Faculty of Health and SocialCare, The Open University,Milton Keynes, UK4Primary Care Unit, Instituteof Public Health, Forvie Site,University of CambridgeSchool of Clinical Medicine,Cambridge, UK5Ipsos MORI, London, UK6University of Exeter MedicalSchool, Exeter, UK7RAND Corporation, SantaMonica, California, USA
Correspondence toDr Jenni Burt;[email protected]
ABSTRACTObjectives: In many countries, minority ethnic groupsreport poorer care in patient surveys. This could bebecause they get worse care or because they responddifferently to such surveys. We conducted anexperiment to determine whether South Asian peoplein England rate simulated GP consultations the sameor differently from White British people. If thesegroups rate consultations similarly when viewingidentical simulated consultations, it would be morelikely that the lower scores reported by minority ethnicgroups in real surveys reflect real differences in qualityof care.Design: Experimental vignette study. Trainedfieldworkers completed computer-assisted personalinterviews during which participants rated 3 videorecordings of simulated GP–patient consultations,using 5 communication items from the English GPPatient Survey. Consultations were shown in a randomorder, selected from a pool of 16.Setting: Geographically confined areas of ∼130households (output areas) in England, selected usingproportional systematic sampling.Participants: 564 White British and 564 Pakistaniadults recruited using an in-home face-to-faceapproach.Main outcome measure: Mean differences incommunication score (on a scale of 0–100) betweenWhite British and Pakistani participants, estimated fromlinear regression.Results: Pakistani participants, on average, scoredconsultations 9.8 points higher than White Britishparticipants (95% CI 8.0 to 11.7, p<0.001) whenviewing the same consultations. When adjusted forage, gender, deprivation, self-rated health and video,the difference increased to 11.0 points (95% CI 8.5 to13.6, p<0.001). The largest differences were seenwhen participants were older (>55) and wherecommunication was scripted to be poor.Conclusions: Substantial differences in ratings werefound between groups, with Pakistani respondentsgiving higher scores than White British respondents tovideos showing the same care. Our findings suggestthat the lower scores reported by Pakistani patients innational surveys represent genuinely worse experiencesof communication compared to the White Britishmajority.
INTRODUCTIONCommunication between doctors andpatients is a core component of patientexperience.1 Patients’ evaluations of doctors’interpersonal skills are widely used in assess-ments of the quality of care, with an increas-ing focus on the public reporting of patientfeedback.2 In the USA and the UK, certainminority ethnic groups report lower patientexperience scores compared to the majoritypopulation.3–8 For example, analysis of theEnglish General Practice Patient Surveyfound that South Asian groups report par-ticularly low scores compared to the WhiteBritish majority, with Bangladeshi and
Strengths and limitations of this study
▪ This is the first study to exclusively use a videovignette approach to assess the extent to whichethnic differences in reported patient experienceof primary care reflect real differences ratherthan differences in expectations, perceptions orin the use of scales.
▪ Our experimental design enables us to controlthe content of the consultations being rated byrespondents in order to explore how differencesin reporting may or may not explain the dispar-ities in minority ethnic experience in real-lifesurveys.
▪ While our in-home face-to-face recruitmentapproach ensured access to a wide range ofrespondents, respondents who agreed to partici-pate in this study may differ in a number ofunidentified ways from the population as awhole.
▪ Our study involved face-to-face interviews inwhich consultations were viewed and rated: thisdiffers from the postal mode of the national GPPatient Survey, and in completing questionnaireitems via an interviewer rather than independ-ently, social desirability bias may be an issue.
▪ To enable the same vignettes to be viewed by allparticipants, the study was conducted in English,limiting our ability to understand evaluations bythose with low English language proficiency.
Burt J, et al. BMJ Open 2016;6:e011256. doi:10.1136/bmjopen-2016-011256 1
Open Access Research
on January 17, 2022 by guest. Protected by copyright.
http://bmjopen.bm
j.com/
BM
J Open: first published as 10.1136/bm
jopen-2016-011256 on 8 Septem
ber 2016. Dow
nloaded from
Pakistani groups providing the lowest scores.9 Aroundhalf of the difference in these scores is explained by theconcentration of South Asian patients in low-scoringprimary care practices.7 The remaining difference cur-rently remains unexplained.Several potential explanations have, however, been
proposed for the lower ratings given by South Asianrespondents. Broadly, these relate to whether SouthAsian patients receive lower quality care, or whetherthey receive similar care, but rate this more negatively.8
For example, differences in the use of questionnaireresponse scales10 may lead to South Asian groups beingless likely to endorse the most positive options whenasked to evaluate a doctor’s communication skills.Alternatively, there may be systematic variations in eva-luations of consultations because South Asian respon-dents vary in their expectations of, or preferences for,care.Understanding why minority ethnic groups often give
poorer evaluations of care is critical to forming an effect-ive response in policy and practice. One approach is touse item response theory to explore whether itemsreceive systematically different responses by the ethnicgroup. Recent analysis of the GP Patient Survey suggeststhat this is not the case for differences observed betweenSouth Asian and White British groups.11 However, amore robust approach to determining whether differ-ences in evaluations of care reflect real differences is toask respondents to rate standardised clinical scenarios(‘vignettes’).12 A US study using primarily written vign-ettes in an online survey concluded that score variationsobserved on national surveys among African-American,Latino and white respondents were likely to reflect truedifferences in real-life experiences, at least for itemsusing an ‘Always-to-Never’ Response Scale.10 13
This study aimed to examine whether people from aPakistani background rate the communication withinsimulated GP consultations differently than WhiteBritish people do. If these groups rate simulated consul-tations similarly when viewing identical video vignettes,it is more likely that the lower scores observed amongSouth Asian people in national patient experiencesurveys reflect real differences in quality of communica-tion within consultations.
METHODSWe undertook an experimental vignette study in whichvideos of simulated GP–patient consultations wereshown to two groups of people, who were asked to ratethe quality of the communication within each consult-ation. The primary outcome of interest was communica-tion score (on a scale of 0–100).
Simulated consultationsTo ensure generalisability and to avoid the chance inclu-sion of a characteristic or event which, unknown to us,might systematically be rated differently by our two
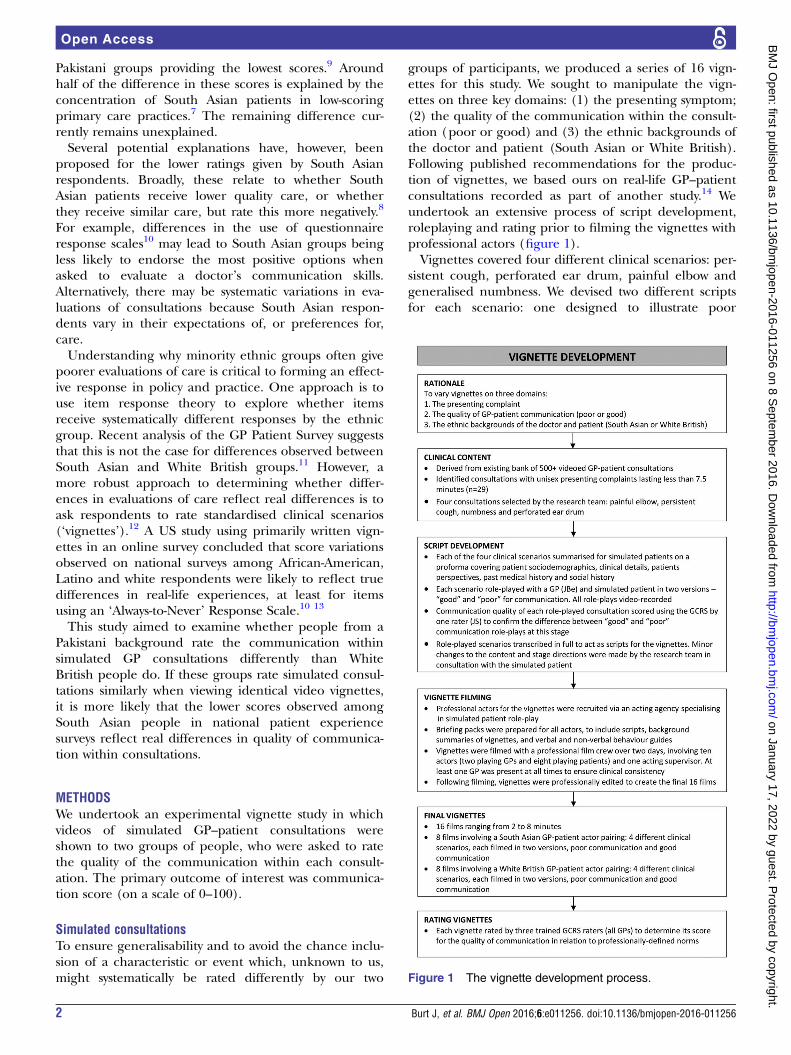
groups of participants, we produced a series of 16 vign-ettes for this study. We sought to manipulate the vign-ettes on three key domains: (1) the presenting symptom;(2) the quality of the communication within the consult-ation (poor or good) and (3) the ethnic backgrounds ofthe doctor and patient (South Asian or White British).Following published recommendations for the produc-tion of vignettes, we based ours on real-life GP–patientconsultations recorded as part of another study.14 Weundertook an extensive process of script development,roleplaying and rating prior to filming the vignettes withprofessional actors (figure 1).Vignettes covered four different clinical scenarios: per-
sistent cough, perforated ear drum, painful elbow andgeneralised numbness. We devised two different scriptsfor each scenario: one designed to illustrate poor
Figure 1 The vignette development process.
2 Burt J, et al. BMJ Open 2016;6:e011256. doi:10.1136/bmjopen-2016-011256
Open Access
on January 17, 2022 by guest. Protected by copyright.
http://bmjopen.bm
j.com/
BM
J Open: first published as 10.1136/bm
jopen-2016-011256 on 8 Septem
ber 2016. Dow
nloaded from

communication by the doctor, and one designed to illus-trate good communication. Standards of communicationwere formulated according to the Global ConsultationRating Scale (GCRS), an observer-rated measure of com-munication competence derived from the widely usedCalgary-Cambridge guide to the medical interview.15–17
The GCRS covers 12 domains including ‘initiating thesession’, ‘gathering information’, ‘building the relation-ship’ and ‘achieving a shared understanding’. The‘poor’ and ‘good’ versions of the four clinical scenarioswere then used to film two sets of vignettes, first withWhite British actors playing the GP and patient, andthen with South Asian actors playing the GP andpatient. The GP role was acted throughout by either oneWhite British or one South Asian actor; eight differentactors (four White British and four South Asian) role-played patients, each participating in one clinical scen-ario. The restriction of vignettes to the same-ethnicitypairings, rather than including mixed pairings, is a func-tion of wishing to introduce some variation to ensuregeneralisability while keeping the number of vignettes toa manageable number. The final 16 videos were eachscored by 3 clinical raters using the GCRS to assess com-munication quality in relation to professionally definednorms.15 The ‘poor’ communication vignettes had meanGCRS scores between 0.6 and 2.4 (out of 10) while the‘good’ communication vignettes mean scores werebetween 5.1 and 8.4.
Data collectionWe worked with a UK market research company, IpsosMORI, to collect the data. We aimed to recruit 1120adult respondents who self-identified as either Pakistanior White British, across a broad age range. Eachrespondent was asked to rate three vignettes. Oursample size calculation was based on data from thenational GP Patient Survey, as we used the same commu-nication questions for our respondents as are used inthis national survey. Inclusion of 560 Pakistani respon-dents and 560 White British respondents gave over 80%power to detect a 3.1-point difference (on a 0–100 scale)seen between these two groups after controlling for age,gender, deprivation, self-rated health and practice. Asethnic disparities are largest in older ages, we aimed torecruit equal numbers above and below the age of 55within each ethnic group.9
We used different recruitment strategies for the differ-ent ethnic groups. To recruit Pakistani respondents, geo-graphically confined areas in England of ∼130households (output areas) were selected in which atleast 35% of the populations were identified as Pakistaniin 2011 Census data. These were then ranked accordingto the proportion of the population aged over 50.Trained fieldworkers recruited participants within theseareas using an in-home face-to-face approach, starting inthe output areas with the highest proportion of residentsover the age of 50. Available Census age categories droveour use of ‘over 50’ rather than ‘over 55’ at sampling:
however, recruitment was based on an ‘over 55’ cutpoint. Fieldworkers were also provided with one or twoneighbouring output areas to recruit from if necessary.Snowball recruitment (eg, known neighbours) and add-itional household interviews were allowed. To recruitWhite British participants, we first excluded output areaswith low proportions of White British residents (<90%)and residents aged over 50. The remaining output areaswere ranked by social grade (the percentage of peoplewho were Social Grade A/B according to 2011 Censusdata) and geography. Output areas to approach werethen selected using proportional systematic sampling.Potential participants were screened by fieldworkers
for ethnicity (using the Office for National Statistics18-group categorisation) and English language compe-tency (using a screening question regarding self-reported confidence in understanding short videos inEnglish). Eligible respondents who consented then com-pleted a computer-assisted personal interview (CAPI)using a standardised script. Each participant viewedthree simulated consultation videos. Following eachvideo, the participant was asked to rate the communica-tion within the consultation using five items taken fromthe national GP–Patient Survey (table 1). Videos wereassigned so each participant saw three different present-ing conditions, with at least one of the videos featuringeach of the two ethnic GP/patient pairings, and at leastone of the videos scripted to feature each of the twolevels of GP–patient communication. The selection ofvideos shown to each participant was such that approxi-mately equal numbers of all possible combinations wereused, given the restrictions described. Participants alsocompleted basic sociodemographic questions (age, self-rated health, whether born in the UK, language spokenmost often at home). All interview questions and ratingswere completed verbally, with responses recorded byinterviewers directly onto the CAPI software. An area-based measure of socioeconomic deprivation (Index ofMultiple Deprivation) was calculated.
AnalysisWe scored each participant’s rating of each consultationby linearly scaling the response options between 0 (verypoor) and 100 (very good) and averaging all informativeanswers when at least three of the five items were com-pleted. Linear regression was used to model the meandifference between White British and Pakistani partici-pants’ ratings of doctor–patient communication. We esti-mated the unadjusted difference in ratings, as well asthe difference adjusting for patient age, gender, self-rated health, deprivation and a set of 15 indicator vari-ables for the video. No analysis of interaction terms wasoriginally planned. However, the effect size found wasmuch larger than that anticipated, and so interactionswere investigated between participant ethnicity and thefollowing variables: (1) relating to the video: ethnicity ofGP/patient and quality of GP–patient communication,and (2) relating to the participant: age, gender and
Burt J, et al. BMJ Open 2016;6:e011256. doi:10.1136/bmjopen-2016-011256 3
Open Access
on January 17, 2022 by guest. Protected by copyright.
http://bmjopen.bm
j.com/
BM
J Open: first published as 10.1136/bm
jopen-2016-011256 on 8 Septem
ber 2016. Dow
nloaded from

deprivation. When modelling interactions, only variablesfor the video attributes were used (rather than usingindicator variables for all videos). For interactions involv-ing age, the oldest two age groups were combined and acontinuous version of age groups was used in the inter-action term only. CIs and p values were estimated usingbootstrapping with 500 replications (given non-normaldata), clustered by participants (with each participantsupplying three communication scores). A sensitivityanalysis that clustered the bootstrap resampling byoutput area rather than by participants (to account formultiple sampling in households and small geographicareas) made only trivial changes to SEs, so we do notreport it here.
RESULTSParticipantsA total of 1128 participants were recruited, 564 (50%)self-identified White British and 564 (50%) self-identified Pakistani participants. The sociodemographicprofile of participants appears in table 2. While the sam-pling restriction that half of participants in each groupshould be aged 55 or above increased the similarity ofthe groups’ age distribution, Pakistani participants wereyounger than the White British participants within eachage stratum. Pakistani participants were also more likelyto be man (58% vs 52%); to be in fair or poor health(38% vs 26%) and to live in the most deprived areas(82% vs 14%). The geographic locations where
Table 1 GP–patient communication items
Thinking about the doctor you have just seen in the video, how good was the doctor at:
Very
good Good
Neither
good
nor
poor Poor
Very
poor
Doesn’t
apply*
Giving enough time……………………………… □ … □ … □ … □ … □ … □Listening…………………………………………….. □ … □ … □ … □ … □ … □Explaining tests and treatments…………….. □ … □ … □ … □ … □ … □Involving in decisions about care …………….. □ … □ … □ … □ … □ … □Treating with care and concern…………….. □ … □ … □ … □ … □ … □*Considered to be uninformative for the purposes of our analysis.
Table 2 Sociodemographic profile of study participants
All White British Pakistani
n Per cent n Per cent n Per cent
Age (years)
18–24 88 7.8 40 7.1 48 8.5
25–34 154 13.7 56 9.9 98 17.4
35–44 151 13.4 70 12.4 81 14.4
45–54 175 15.5 118 20.9 57 10.1
55–64 267 23.7 94 16.7 173 30.7
65–74 179 15.9 109 19.3 70 12.4
75–84 95 8.4 63 11.2 32 5.7
85 or over 19 1.7 14 2.5 5 0.9
Gender
Male 583 51.7 255 45.2 328 58.2
Female 545 48.3 309 54.8 236 41.8
Self-rated health
Excellent 132 11.7 82 14.5 50 8.9
Very good 289 25.6 181 32.1 108 19.1
Good 348 30.9 157 27.8 191 33.9
Fair 207 18.4 86 15.2 121 21.5
Poor 152 13.5 58 10.3 94 16.7
Deprivation
1—least deprived 108 9.6 100 17.7 8 1.4
2 137 12.1 137 24.3 0 0.0
3 122 10.8 111 19.7 11 2.0
4 221 19.6 138 24.5 83 14.7
5—most deprived 540 47.9 78 13.8 462 81.9
4 Burt J, et al. BMJ Open 2016;6:e011256. doi:10.1136/bmjopen-2016-011256
Open Access
on January 17, 2022 by guest. Protected by copyright.
http://bmjopen.bm
j.com/
BM
J Open: first published as 10.1136/bm
jopen-2016-011256 on 8 Septem
ber 2016. Dow
nloaded from
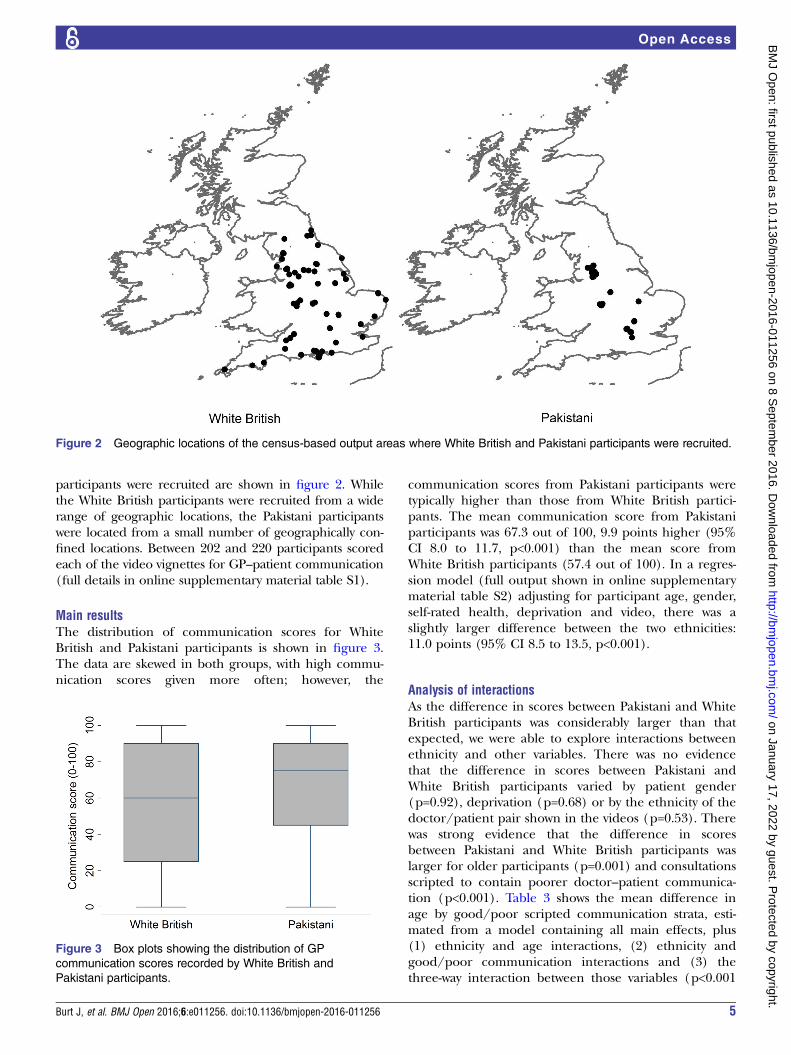
participants were recruited are shown in figure 2. Whilethe White British participants were recruited from a widerange of geographic locations, the Pakistani participantswere located from a small number of geographically con-fined locations. Between 202 and 220 participants scoredeach of the video vignettes for GP–patient communication(full details in online supplementary material table S1).
Main resultsThe distribution of communication scores for WhiteBritish and Pakistani participants is shown in figure 3.The data are skewed in both groups, with high commu-nication scores given more often; however, the
communication scores from Pakistani participants weretypically higher than those from White British partici-pants. The mean communication score from Pakistaniparticipants was 67.3 out of 100, 9.9 points higher (95%CI 8.0 to 11.7, p<0.001) than the mean score fromWhite British participants (57.4 out of 100). In a regres-sion model (full output shown in online supplementarymaterial table S2) adjusting for participant age, gender,self-rated health, deprivation and video, there was aslightly larger difference between the two ethnicities:11.0 points (95% CI 8.5 to 13.5, p<0.001).
Analysis of interactionsAs the difference in scores between Pakistani and WhiteBritish participants was considerably larger than thatexpected, we were able to explore interactions betweenethnicity and other variables. There was no evidencethat the difference in scores between Pakistani andWhite British participants varied by patient gender(p=0.92), deprivation (p=0.68) or by the ethnicity of thedoctor/patient pair shown in the videos (p=0.53). Therewas strong evidence that the difference in scoresbetween Pakistani and White British participants waslarger for older participants (p=0.001) and consultationsscripted to contain poorer doctor–patient communica-tion (p<0.001). Table 3 shows the mean difference inage by good/poor scripted communication strata, esti-mated from a model containing all main effects, plus(1) ethnicity and age interactions, (2) ethnicity andgood/poor communication interactions and (3) thethree-way interaction between those variables (p<0.001
Figure 2 Geographic locations of the census-based output areas where White British and Pakistani participants were recruited.
Figure 3 Box plots showing the distribution of GP
communication scores recorded by White British and
Pakistani participants.
Burt J, et al. BMJ Open 2016;6:e011256. doi:10.1136/bmjopen-2016-011256 5
Open Access
on January 17, 2022 by guest. Protected by copyright.
http://bmjopen.bm
j.com/
BM
J Open: first published as 10.1136/bm
jopen-2016-011256 on 8 Septem
ber 2016. Dow
nloaded from
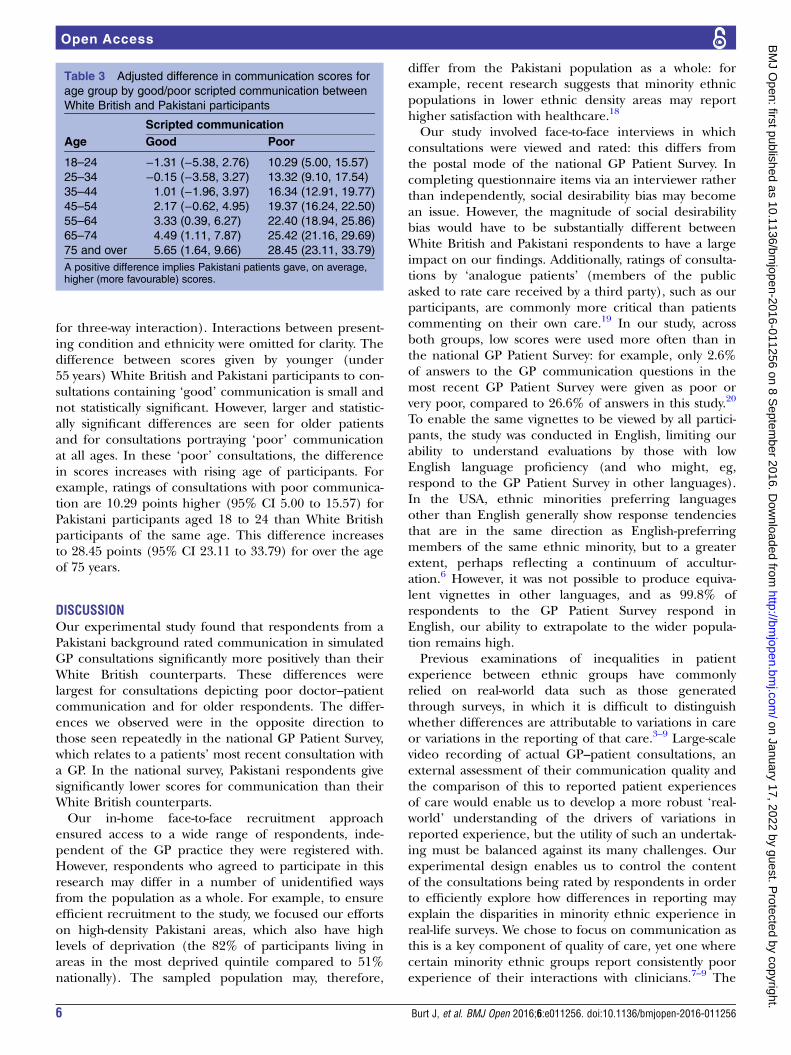
for three-way interaction). Interactions between present-ing condition and ethnicity were omitted for clarity. Thedifference between scores given by younger (under55 years) White British and Pakistani participants to con-sultations containing ‘good’ communication is small andnot statistically significant. However, larger and statistic-ally significant differences are seen for older patientsand for consultations portraying ‘poor’ communicationat all ages. In these ‘poor’ consultations, the differencein scores increases with rising age of participants. Forexample, ratings of consultations with poor communica-tion are 10.29 points higher (95% CI 5.00 to 15.57) forPakistani participants aged 18 to 24 than White Britishparticipants of the same age. This difference increasesto 28.45 points (95% CI 23.11 to 33.79) for over the ageof 75 years.
DISCUSSIONOur experimental study found that respondents from aPakistani background rated communication in simulatedGP consultations significantly more positively than theirWhite British counterparts. These differences werelargest for consultations depicting poor doctor–patientcommunication and for older respondents. The differ-ences we observed were in the opposite direction tothose seen repeatedly in the national GP Patient Survey,which relates to a patients’ most recent consultation witha GP. In the national survey, Pakistani respondents givesignificantly lower scores for communication than theirWhite British counterparts.Our in-home face-to-face recruitment approach
ensured access to a wide range of respondents, inde-pendent of the GP practice they were registered with.However, respondents who agreed to participate in thisresearch may differ in a number of unidentified waysfrom the population as a whole. For example, to ensureefficient recruitment to the study, we focused our effortson high-density Pakistani areas, which also have highlevels of deprivation (the 82% of participants living inareas in the most deprived quintile compared to 51%nationally). The sampled population may, therefore,
differ from the Pakistani population as a whole: forexample, recent research suggests that minority ethnicpopulations in lower ethnic density areas may reporthigher satisfaction with healthcare.18
Our study involved face-to-face interviews in whichconsultations were viewed and rated: this differs fromthe postal mode of the national GP Patient Survey. Incompleting questionnaire items via an interviewer ratherthan independently, social desirability bias may becomean issue. However, the magnitude of social desirabilitybias would have to be substantially different betweenWhite British and Pakistani respondents to have a largeimpact on our findings. Additionally, ratings of consulta-tions by ‘analogue patients’ (members of the publicasked to rate care received by a third party), such as ourparticipants, are commonly more critical than patientscommenting on their own care.19 In our study, acrossboth groups, low scores were used more often than inthe national GP Patient Survey: for example, only 2.6%of answers to the GP communication questions in themost recent GP Patient Survey were given as poor orvery poor, compared to 26.6% of answers in this study.20
To enable the same vignettes to be viewed by all partici-pants, the study was conducted in English, limiting ourability to understand evaluations by those with lowEnglish language proficiency (and who might, eg,respond to the GP Patient Survey in other languages).In the USA, ethnic minorities preferring languagesother than English generally show response tendenciesthat are in the same direction as English-preferringmembers of the same ethnic minority, but to a greaterextent, perhaps reflecting a continuum of accultur-ation.6 However, it was not possible to produce equiva-lent vignettes in other languages, and as 99.8% ofrespondents to the GP Patient Survey respond inEnglish, our ability to extrapolate to the wider popula-tion remains high.Previous examinations of inequalities in patient
experience between ethnic groups have commonlyrelied on real-world data such as those generatedthrough surveys, in which it is difficult to distinguishwhether differences are attributable to variations in careor variations in the reporting of that care.3–9 Large-scalevideo recording of actual GP–patient consultations, anexternal assessment of their communication quality andthe comparison of this to reported patient experiencesof care would enable us to develop a more robust ‘real-world’ understanding of the drivers of variations inreported experience, but the utility of such an undertak-ing must be balanced against its many challenges. Ourexperimental design enables us to control the contentof the consultations being rated by respondents in orderto efficiently explore how differences in reporting mayexplain the disparities in minority ethnic experience inreal-life surveys. We chose to focus on communication asthis is a key component of quality of care, yet one wherecertain minority ethnic groups report consistently poorexperience of their interactions with clinicians.7–9 The
Table 3 Adjusted difference in communication scores for
age group by good/poor scripted communication between
White British and Pakistani participants
Scripted communication
Age Good Poor
18–24 −1.31 (−5.38, 2.76) 10.29 (5.00, 15.57)
25–34 −0.15 (−3.58, 3.27) 13.32 (9.10, 17.54)
35–44 1.01 (−1.96, 3.97) 16.34 (12.91, 19.77)
45–54 2.17 (−0.62, 4.95) 19.37 (16.24, 22.50)
55–64 3.33 (0.39, 6.27) 22.40 (18.94, 25.86)
65–74 4.49 (1.11, 7.87) 25.42 (21.16, 29.69)
75 and over 5.65 (1.64, 9.66) 28.45 (23.11, 33.79)
A positive difference implies Pakistani patients gave, on average,higher (more favourable) scores.
6 Burt J, et al. BMJ Open 2016;6:e011256. doi:10.1136/bmjopen-2016-011256
Open Access
on January 17, 2022 by guest. Protected by copyright.
http://bmjopen.bm
j.com/
BM
J Open: first published as 10.1136/bm
jopen-2016-011256 on 8 Septem
ber 2016. Dow
nloaded from

study builds on previous vignette research by using mul-tiple video vignettes manipulating several key attri-butes.12 13 Video vignettes have so far been littleemployed in this field, in spite of evidence of viewersperceiving them as realistic and enabling immersion inthe situation at hand, although well-crafted vignettes areessential to ensure good construct validity.14 In the USA,Weinick et al, reported no evidence of differencesamong White, African-American and Latino evaluationsof doctor–patient communication in vignettes whenusing an ‘Always-to-Never’ Response Scale; they con-cluded that variations within national surveys on suchitems for these groups were likely to reflect differencesin real-life experiences.13 In our study, however, wefound substantially more positive ratings by Pakistani incomparison to White British respondents.This study was designed to explore whether people
from a Pakistani background rate the communicationwithin simulated GP consultations differently fromratings provided by White British people. Similar ratingsof simulated consultations from both ethnic groupswould have suggested that the low scores observed innational surveys from Pakistani respondents reflect realdifferences in the quality of communication experiencedby these patients in comparison to White Britishpatients. The substantially more positive ratings fromPakistani respondents that we observed in our experi-mental study suggest that not only are there differencesin the quality of communication in real-life consulta-tions, but also that these differences are even greaterthan those identified in real-life surveys, such as thosewe have previously reported from findings using the GPPatient Survey.7 9 We suggest that Pakistani patientsexperience genuinely worse standards of communica-tion. However, while we can be confident that differ-ences in experience exist, it is difficult to extrapolateour vignette-derived data to estimate the magnitude ofdifference in real life. Poor communication for thesegroups may arise from system-level, provider-level and/or patient-level factors.21 For example, language barrierswithin consultations may lead to more negative experi-ences of care for doctors and patients.22 23 Levels ofacculturation may be linked with a patient’s ability tonavigate the healthcare system, with consequent impactson patient experiences of care.24 Discrimination andbias are sensitive and challenging topics – whether atthe level of the system or provider. However, they needto be considered as key contributors to inequalities incare.25
CONCLUSIONSOur findings add substantial weight to the likelihoodthat inequalities affecting South Asian people innational surveys reflect systematic variations in thequality of communication within consultations. Whilethere is a body of research into the drivers of inequal-ities in care, future research needs to focus on how
factors including language barriers, health literacy,provider-side discrimination and system-level failurescombine to inhibit good communication within individ-ual consultations.
Twitter Follow Jenni Burt at @jenniaburt
Acknowledgements The authors thank the members of the public who kindlyagreed to participate in this study and without whom the study would nothave been possible. The authors thank all those whose contributions werecrucial to the set up and conduct of this work, including those involved in thedevelopment, acting and filming of the clinical vignettes; the clinical raterswho assessed the vignettes and the whole team at Ipsos MORI for theirenthusiastic and efficient collection of data. They also thank the ImproveAdvisory Group for their input and support throughout this study. Finally, theythank the three reviewers whose comments helped to improve the clarity andrigour of this paper.
Contributors JBu designed the study, managed the production of thevignettes, oversaw the conduct of the study and drafted and revised thepaper. GA designed the study, wrote the statistical analysis plan, conductedthe analysis and drafted and revised the paper. NE assisted with the conductof the study, produced the vignettes and commented on draft versions of thepaper. CL contributed to the design of the study and commented on draftversions of the paper. JBe contributed to the design of the study, assistedwith the production of the vignettes and commented on draft versions of thepaper. LS and AC contributed to the design of the study, oversaw datacollection and commented on draft versions of the paper. JC contributed tothe design of the study and commented on draft versions of the paper. MNEcontributed to the design of the study, contributed to the statistical analysisplan and revised the paper. MR designed the study, oversaw the conduct ofthe study and commented on draft versions of the paper. MR is theguarantor.
Funding This work was funded by the National Institute for Health ResearchProgramme Grants for Applied Research (NIHR PGfAR) Programme(RP-PG-0608-10050). The study was sponsored by Cambridgeshire andPeterborough Clinical Commissioning Group.
Disclaimer The views expressed are those of the authors and not necessarilythose of the NHS, the NIHR or the Department of Health. The researchersconfirm their independence from the study funders, the National Institute forHealth Research.
Competing interests All authors have completed the ICMJE uniformdisclosure form at http://www.icmje.org/coi_disclosure.pdf. MR, JC, JBe, JBu,GA and NE declare support from the National Institute for Health Research forthe submitted work.
Ethics approval The Central Office for Research Ethics Committee (COREC)advised that the survey does not require formal medical research ethicalapproval, but it adheres to the Market Research Society code of ethics.
Data sharing statement The data set is available on request from theauthors: contact Jenni Burt ( [email protected]).
Open Access This is an Open Access article distributed in accordance withthe terms of the Creative Commons Attribution (CC BY 4.0) license, whichpermits others to distribute, remix, adapt and build upon this work, forcommercial use, provided the original work is properly cited. See: http://creativecommons.org/licenses/by/4.0/
REFERENCES1. Ahmed F, Burt J, Roland M. Measuring patient experience: concepts
and methods. Patient 2014;7:235–41.2. Fung CH, Lim YW, Mattke S, et al. Systematic review: the evidence
that publishing patient care performance data improves quality ofcare. Ann Intern Med 2008;148:111–23.
3. Weech-Maldonado R, Elliott MN, Adams JL, et al. Do racial/ethnicdisparities in quality and patient experience within Medicare plansgeneralize across measures and racial/ethnic groups? Health ServRes 2015;50:1829–49.
Burt J, et al. BMJ Open 2016;6:e011256. doi:10.1136/bmjopen-2016-011256 7
Open Access
on January 17, 2022 by guest. Protected by copyright.
http://bmjopen.bm
j.com/
BM
J Open: first published as 10.1136/bm
jopen-2016-011256 on 8 Septem
ber 2016. Dow
nloaded from

4. Price RA, Haviland AM, Hambarsoomian K, et al. Do experienceswith Medicare managed care vary according to the proportion ofsame-race/ethnicity/language individuals enrolled in One’s Contract?Health Serv Res 2015;50:1649–87.
5. Goldstein E, Elliott MN, Lehrman WG, et al. Racial/ethnic differencesin patients’ perceptions of inpatient care using the HCAHPS survey.Med Care Res Rev 2010;67:74–92.
6. Weech-Maldonado R, Morales LS, Elliott M, et al. Race/ethnicity,language, and patients’ assessments of care in Medicaid managedcare. Health Serv Res 2003;38:789–808.
7. Lyratzopoulos G, Elliott M, Barbiere JM, et al. Understanding ethnicand other socio-demographic differences in patient experience ofprimary care: evidence from the English General Practice PatientSurvey. BMJ Qual Saf 2012;21:21–9.
8. Mead N, Roland M. Understanding why some ethnic minoritypatients evaluate medical care more negatively than White patients:a cross sectional analysis of a routine patient survey in Englishgeneral practices. BMJ 2009;339:b3450.
9. Burt J, Lloyd CE, Campbell J, et al. Variations in GP–patientcommunication by ethnicity, age and gender: evidence from anational patient survey. Br J Gen Pract 2016;66:e47–52.
10. Elliott MN, Haviland AM, Kanouse DE, et al. Adjusting forsubgroup differences in extreme response tendency in ratings ofhealth care: impact on disparity estimates. Health Serv Res2009;44:542–61.
11. Setodji CM, Elliott MN, Abel G, et al. Evaluating differential itemfunctioning in the English General Practice Patient Survey:comparison of South Asian and White British subgroups. Med Care2015;539:809–17.
12. King G, Murray CJ, Salomon JA, et al. Enhancing the validity andcross-cultural comparability of measurement in survey research.Am Polit Sci Rev 2004;98:191–207.
13. Weinick RM, Elliott MN, Volandes AE, et al. Using standardizedencounters to understand reported racial/ethnic disparities in patientexperiences with care. Health Serv Res 2011;46:491–509.
14. Hillen MA, van Vliet LM, de Haes HCJM, et al. Developing andadministering scripted video vignettes for experimental research ofpatient–provider communication. Patient Educ Couns2013;91:295–309.
15. Burt J, Abel G, Elmore N, et al. Assessing communication quality ofconsultations in primary care: initial reliability of the GlobalConsultation Rating Scale, based on the Calgary-Cambridge Guideto the Medical Interview. BMJ Open 2014;4:e004339.
16. Kurtz S, Silverman J, Benson J, et al. Marrying content and processin clinical method teaching: enhancing the Calgary-Cambridgeguides. Acad Med 2003;78:802–9.
17. Kurtz SM, Silverman JD. The Calgary-Cambridge ReferencedObservation Guides: an aid to defining the curriculum andorganizing the teaching in communication training programmes.Med Ed 1996;30:83–9.
18. Bécares L, Das-Munshi J. Ethnic density, health care seekingbehaviour and expected discrimination from health services amongethnic minority people in England. Health Place 2013;22:48–55.
19. van Vliet LM, van der Wall E, Albada A, et al. The validity of usinganalogue patients in practitioner–patient communication research:systematic review and meta-analysis. J Gen Intern Med2012;27:1528–43.
20. NHS England. GP Patient Survey: Survey and Reports 2014. https://gp-patient.co.uk/surveys-and-reports#july-2014 (accessed 27 Jul2015).
21. Institute of Medicine. Unequal treatment: confronting racial andethnic disparities in health care. Washington, DC: The NationalAcademic Press, 2003.
22. Parsons JA, Baker NA, Smith-Gorvie T, et al. To ‘Get by’ or ‘gethelp’? A qualitative study of physicians’ challenges and dilemmaswhen patients have limited English proficiency. BMJ Open 2014;4:e004613.
23. Ahmed F, Abel GA, Lloyd CE, et al. Does the availability of a SouthAsian language in practices improve reports of doctor–patientcommunication from South Asian patients? Cross sectional analysisof a national patient survey in English general practices. BMC FamPract 2015;16:55.
24. Hasnain M, Schwartz A, Girotti J, et al. Group UICEoCP. Differencesin patient-reported experiences of care by race and acculturationstatus. J Immigr Minor Health 2013;15:517–24.
25. Burgess DJ. Addressing racial healthcare disparities: how can weshift the focus from patients to providers? J Gen Intern Med2011;26:828–30.
8 Burt J, et al. BMJ Open 2016;6:e011256. doi:10.1136/bmjopen-2016-011256
Open Access
on January 17, 2022 by guest. Protected by copyright.
http://bmjopen.bm
j.com/
BM
J Open: first published as 10.1136/bm
jopen-2016-011256 on 8 Septem
ber 2016. Dow
nloaded from