Open Access Research Exploring the effects of transfers ...
10
1 Lopez D, et al. BMJ Open 2017;7:e019226. doi:10.1136/bmjopen-2017-019226 Open Access ABSTRACT Objectives To develop a method for categorising coronary heart disease (CHD) subtype in linked data accounting for different CHD diagnoses across records, and to compare hospital admission numbers and ratios of unlinked versus linked data for each CHD subtype over time, and across age groups and sex. Design Cohort study. Data source Person-linked hospital administrative data covering all admissions for CHD in Western Australia from 1988 to 2013. Main outcome Ratios of (1) unlinked admission counts to contiguous admission (CA) counts (accounting for transfers), and (2) 28-day episode counts (accounting for transfers and readmissions) to CA counts stratified by CHD subtype, sex and age group. Results In all CHD subtypes, the ratios changed in a linear or quadratic fashion over time and the coefficients of the trend term differed across CHD subtypes. Furthermore, for many CHD subtypes the ratios also differed by age group and sex. For example, in women aged 35–54 years, the ratio of unlinked to CA counts for non-ST elevation myocardial infarction admissions in 2000 was 1.10, and this increased in a linear fashion to 1.30 in 2013, representing an annual increase of 0.0148. Conclusion The use of unlinked counts in epidemiological estimates of CHD hospitalisations overestimates CHD counts. The CA and 28-day episode counts are more aligned with epidemiological studies of CHD. The degree of overestimation of counts using only unlinked counts varies in a complex manner with CHD subtype, time, sex and age group, and it is not possible to apply a simple correction factor to counts obtained from unlinked data. INTRODUCTION Coronary heart disease (CHD) remains a major cause of death in Australia. 1 Clinically it manifests across a spectrum of subtypes, from ST elevation myocardial infarction (STEMI) (the most severe), non-STEMI (NSTEMI), unstable angina and stable angina, through to other chronic presenta- tions. There is increasing evidence that less severe forms of CHD, such as stable angina, also have an increased risk of major adverse cardiovascular events. 2 Therefore, accurate information on population trends in CHD event rates and its subtypes is an indicator of the healthcare burden and essential for plan- ning and evaluation of appropriate public health measures and clinical services. The focus on myocardial infarction (MI) alone fails to provide a complete understanding of the size of the problem of suspected CHD or its outcomes, and reliable estimates of CHD events at the population level are predicated on accurate stratification of CHD subtypes, for which there are limited data in Australia. Population hospital administrative data provide a valuable data source in this regard Exploring the effects of transfers and readmissions on trends in population counts of hospital admissions for coronary heart disease: a Western Australian data linkage study Derrick Lopez, 1 Lee Nedkoff, 1 Matthew Knuiman, 1 Michael S T Hobbs, 1 Thomas G Briffa, 1 David B Preen, 1 Joseph Hung, 2 John Beilby, 3 Sushma Mathur, 4 Anna Reynolds, 4 Frank M Sanfilippo 1 To cite: Lopez D, Nedkoff L, Knuiman M, et al. Exploring the effects of transfers and readmissions on trends in population counts of hospital admissions for coronary heart disease: a Western Australian data linkage study. BMJ Open 2017;7:e019226. doi:10.1136/ bmjopen-2017-019226 ► Prepublication history and additional material for this paper are available online. To view these files, please visit the journal online (http://dx.doi. org/10.1136/bmjopen-2017- 019226). Received 21 August 2017 Accepted 13 October 2017 1 School of Population and Global Health, The University of Western Australia, Crawley, Western Australia, Australia 2 School of Medicine, The University of Western Australia, Crawley, Western Australia, Australia 3 School of Biomedical Sciences, The University of Western Australia, Crawley, Western Australia, Australia 4 Health Group, Australian Institute of Health and Welfare, Canberra, Australia Correspondence to Dr Derrick Lopez; [email protected] Research Strengths and limitations of this study ► Use of state-wide administrative data captures all hospital admissions in Western Australia. ► Record linkage allowed the identification of contiguous admissions to account for transfers and 28-day episodes to account for readmissions. ► While the complex pattern of counts and ratios presented is from a single jurisdiction in Australia, it is likely that the methods described will be generalisable to other states and territories. However, the ratios obtained may not be generalisable outside Western Australia (because of differences in healthcare systems) or beyond the study period. ► Another limitation is the validity of coding for coronary heart disease in administrative data. ► The use of 28-day episodes may miss a small number of related readmissions that occur beyond 28 days. on April 7, 2022 by guest. Protected by copyright. http://bmjopen.bmj.com/ BMJ Open: first published as 10.1136/bmjopen-2017-019226 on 17 November 2017. Downloaded from
Transcript of Open Access Research Exploring the effects of transfers ...

1Lopez D, et al. BMJ Open 2017;7:e019226. doi:10.1136/bmjopen-2017-019226
Open Access
ABSTRACTObjectives To develop a method for categorising coronary heart disease (CHD) subtype in linked data accounting for different CHD diagnoses across records, and to compare hospital admission numbers and ratios of unlinked versus linked data for each CHD subtype over time, and across age groups and sex.Design Cohort study.Data source Person-linked hospital administrative data covering all admissions for CHD in Western Australia from 1988 to 2013.Main outcome Ratios of (1) unlinked admission counts to contiguous admission (CA) counts (accounting for transfers), and (2) 28-day episode counts (accounting for transfers and readmissions) to CA counts stratified by CHD subtype, sex and age group.Results In all CHD subtypes, the ratios changed in a linear or quadratic fashion over time and the coefficients of the trend term differed across CHD subtypes. Furthermore, for many CHD subtypes the ratios also differed by age group and sex. For example, in women aged 35–54 years, the ratio of unlinked to CA counts for non-ST elevation myocardial infarction admissions in 2000 was 1.10, and this increased in a linear fashion to 1.30 in 2013, representing an annual increase of 0.0148.Conclusion The use of unlinked counts in epidemiological estimates of CHD hospitalisations overestimates CHD counts. The CA and 28-day episode counts are more aligned with epidemiological studies of CHD. The degree of overestimation of counts using only unlinked counts varies in a complex manner with CHD subtype, time, sex and age group, and it is not possible to apply a simple correction factor to counts obtained from unlinked data.
InTRODuCTIOnCoronary heart disease (CHD) remains a major cause of death in Australia.1 Clinically it manifests across a spectrum of subtypes, from ST elevation myocardial infarction (STEMI) (the most severe), non-STEMI (NSTEMI), unstable angina and stable
angina, through to other chronic presenta-tions. There is increasing evidence that less severe forms of CHD, such as stable angina, also have an increased risk of major adverse cardiovascular events.2 Therefore, accurate information on population trends in CHD event rates and its subtypes is an indicator of the healthcare burden and essential for plan-ning and evaluation of appropriate public health measures and clinical services. The focus on myocardial infarction (MI) alone fails to provide a complete understanding of the size of the problem of suspected CHD or its outcomes, and reliable estimates of CHD events at the population level are predicated on accurate stratification of CHD subtypes, for which there are limited data in Australia.
Population hospital administrative data provide a valuable data source in this regard
Exploring the effects of transfers and readmissions on trends in population counts of hospital admissions for coronary heart disease: a Western Australian data linkage study
Derrick Lopez,1 Lee Nedkoff,1 Matthew Knuiman,1 Michael S T Hobbs,1 Thomas G Briffa,1 David B Preen,1 Joseph Hung,2 John Beilby,3 Sushma Mathur,4 Anna Reynolds,4 Frank M Sanfilippo1
To cite: Lopez D, Nedkoff L, Knuiman M, et al. Exploring the effects of transfers and readmissions on trends in population counts of hospital admissions for coronary heart disease: a Western Australian data linkage study. BMJ Open 2017;7:e019226. doi:10.1136/bmjopen-2017-019226
► Prepublication history and additional material for this paper are available online. To view these files, please visit the journal online (http:// dx. doi. org/ 10. 1136/ bmjopen- 2017- 019226).
Received 21 August 2017Accepted 13 October 2017
1School of Population and Global Health, The University of Western Australia, Crawley, Western Australia, Australia2School of Medicine, The University of Western Australia, Crawley, Western Australia, Australia3School of Biomedical Sciences, The University of Western Australia, Crawley, Western Australia, Australia4Health Group, Australian Institute of Health and Welfare, Canberra, Australia
Correspondence toDr Derrick Lopez; derrick. lopez@ uwa. edu. au
Research
Strengths and limitations of this study
► Use of state-wide administrative data captures all hospital admissions in Western Australia.
► Record linkage allowed the identification of contiguous admissions to account for transfers and 28-day episodes to account for readmissions.
► While the complex pattern of counts and ratios presented is from a single jurisdiction in Australia, it is likely that the methods described will be generalisable to other states and territories. However, the ratios obtained may not be generalisable outside Western Australia (because of differences in healthcare systems) or beyond the study period.
► Another limitation is the validity of coding for coronary heart disease in administrative data.
► The use of 28-day episodes may miss a small number of related readmissions that occur beyond 28 days.
on April 7, 2022 by guest. P
rotected by copyright.http://bm
jopen.bmj.com
/B
MJ O
pen: first published as 10.1136/bmjopen-2017-019226 on 17 N
ovember 2017. D
ownloaded from

2 Lopez D, et al. BMJ Open 2017;7:e019226. doi:10.1136/bmjopen-2017-019226
Open Access
where each admission is a separate record and diagnosis. However, this data source is not specifically designed for research purposes, and admission counts are susceptible to overinflation if the patient is transferred or readmitted multiple times during their clinical course for essentially a single episode of care. Additionally, recording of CHD subtype can differ between records in the same episode of care, requiring consideration when categorising CHD subtype for the episode. This is especially true for the management of CHD, which has historically been char-acterised with high rates of hospital transfers and early readmissions.3 Indeed, contemporary Australian data have shown that around 18%–30% of patients hospital-ised for MI are transferred to another hospital,4 5 often for highly specialised coronary artery procedures, most notably coronary angiography and revascularisation by percutaneous coronary intervention (PCI). These special-ised coronary care services are generally located at major population centres, and many patients, especially those from non-urban areas, are transferred to one of these hospitals for treatment and management of their condi-tion.6 In addition, a significant number of patients with MI are readmitted for complications post-MI (such as repeat MI or heart failure), for elective procedures (such as coronary artery revascularisation or electrophysiolog-ical investigation), and to a lesser degree, for non-cardi-ac-related admissions.7 8
There is a potential to overestimate hospitalisation rates of CHD subtypes using unlinked data because transfers and readmissions are not accounted for. This could differ-entially affect CHD subtype rates, depending on the use of different diagnosis codes when patients are transferred or for early readmissions. For jurisdictions where only unlinked data are available, it is important to understand the degree of overestimation of the number of admissions across subtypes, and whether this changes over time or by age group and sex. Where person-linked hospital data are available, there is a need to assign a single relevant diag-nosis to a group of admissions related by transfers or read-missions. To the best of our knowledge, approaches to these issues have not been addressed previously. Hence, our aims were to (1) develop an approach to identify and categorise admissions for each CHD subtype accounting for different CHD diagnoses across hospital transfers and readmission records from linked hospital data; (2) compare counts of unlinked CHD admissions with linked data accounting for transfers and readmissions; and (3) examine whether the ratios of these counts show similar or disparate patterns over time and across age and sex groups for each CHD subtype.
MeThODSData source and study populationFor this cohort study, we used person-linked adminis-trative health data from the Hospital Morbidity Data Collection, one of the core data sets of the Western Australian Data Linkage System. Western Australia
(WA) is representative of national sociodemographic and health indicators,9 with an estimated resident popu-lation of 2.6 million in 2013.10 The available data set included all hospital records for any person hospitalised with CHD in WA from 1988 to 2013. We included all fatal and non-fatal admissions, with age restricted to 35–84 years. Variables available included demographic infor-mation, admission and discharge dates, principal and 20 secondary discharge diagnosis fields, and hospital locations.
Identification of ChD subtypes for individual (unlinked) admissionsAll CHD admissions were identified from the principal discharge diagnosis field based on the International Clas-sification of Diseases, Ninth Revision, Clinical Modifica-tion (ICD-9-CM) (1 January 1988 to 30 June 1999) and the International Statistical Classification of Diseases and Related Health Problems, Tenth Revision, Australian Modification (ICD-10-AM) (1 July 1999 to the present). CHD subtypes were defined as transmural MI/STEMI (ICD-9-CM: 410.0–410.6, 410.8; ICD-10-AM: I21.0-I21.3) (hereafter STEMI), subendocardial MI/NSTEMI (410.7; I21.4) (hereafter NSTEMI), unspecified MI (410.9; I21.9), unstable angina (411.1; I20.0), stable angina (413; I20.1-I20.9), and Other CHD (411.0, 411.81, 411.89, 412, 414; I23-I25). Other CHD includes complications following MI and chronic ischaemic heart disease. An addition to the labelling of transmural or subendocardial MI was added in ICD-10-AM in 2004, with reference to STEMI (‘transmural or STEMI’) and NSTEMI (‘suben-docardial or NSTEMI’) included. All MI is a combination of STEMI, NSTEMI and unspecified MI; acute coronary syndrome (ACS) is a combination of All MI and unstable angina; and All CHD is a combination of ACS, stable angina and Other CHD.
Identifying transfers and readmissionsAn interhospital transfer occurs when a patient is discharged from one hospital and directly admitted to another hospital within 1 day. Patients can have multiple transfers related to the same presentation. We introduce the concept of a contiguous admission (CA), which may represent a single isolated admission or an uninterrupted continuous hospital stay as a result of one or more trans-fers between hospitals. The admission date for the CA is the admission date of the first admission in the sequence. We also define a 28-day episode of care, which comprises an index CA and any subsequent CAs occurring within 28 days of the admission date of the index CA. A CA that begins more than 28 days after the index CA is considered a new episode of care. The 28-day period is commonly used in epidemiological studies.11–13
Assigning principal diagnosis for ChD subtype to each CA and 28-day episodeEach admission in a CA has its own principal discharge diagnosis code that may vary between admissions. We
on April 7, 2022 by guest. P
rotected by copyright.http://bm
jopen.bmj.com
/B
MJ O
pen: first published as 10.1136/bmjopen-2017-019226 on 17 N
ovember 2017. D
ownloaded from

3Lopez D, et al. BMJ Open 2017;7:e019226. doi:10.1136/bmjopen-2017-019226
Open Access
have calculated CA counts based on four approaches described below.
Diagnosis hierarchyThis is based on the work of Sanfilippo et al,14 and reflects the severity of the CHD subtypes from STEMI (most severe), NSTEMI, unstable angina and stable angina, to Other CHD (least severe). For a CA with multiple prin-cipal diagnoses, the most severe diagnostic category is used.
Hospital hierarchyThe hierarchy is metropolitan tertiary hospital (special-ised cardiac care, diagnostic angiography and PCI), private metropolitan hospital (with and without afore-mentioned tertiary care), metropolitan non-tertiary hospital and rural/remote hospital. During the study period, all three metropolitan tertiary and four private hospitals had a cardiac catheter laboratory.15 None of the metropolitan non-tertiary or rural/remote hospitals had a cardiac catheter laboratory at the time of this study. For a CA with multiple principal diagnoses, the principal diag-nosis from the hospital highest in the hierarchy is used.
First admissionThe principal diagnosis recorded from the first admis-sion in the CA is used. Given the acute nature of CHD, the first admission in a CA is presumed to be due to this condition, while subsequent transfers are for procedures or resultant complications or cardiac rehabilitation.
Last admissionThe principal diagnosis recorded from the last admission in the CA is used. The last hospital admission in the CA is presumed to be when the most definitive diagnosis is made among all admissions.
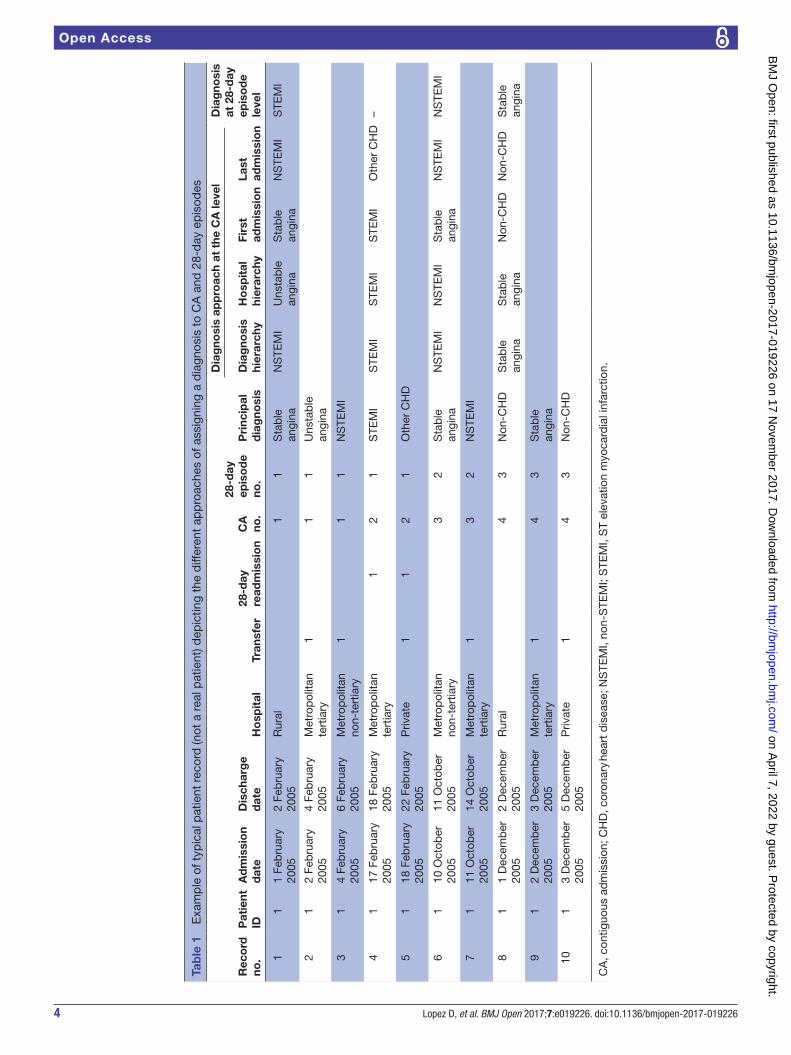
The diagnostic CHD subtype assigned to each 28-day episode was based on the diagnosis hierarchy approach, that is, the most severe subtype of all the CAs that comprise the 28-day episode is used. Table 1 illus-trates how diagnoses (CHD subtypes) are assigned to CAs (four approaches) and to 28-day episodes for a hypothet-ical patient with 10 hospital admissions, grouped into four CAs and three 28-day episodes.
Statistical analysisAnnual counts for each CHD subtype and combination subtypes are presented at the unlinked, CA and 28-day episode levels for 1988–2013. The ratio of unlinked admission count to CA count was calculated for each age group (35–54 years, 55–74 years, 75–84 years) and gender in each year to determine the relative overes-timation of each CHD subtype. To examine the impact on counts from using 28-day episodes, we calculated the ratio of 28-day episode to CA counts for each age group and gender in each year, for each CHD subtype. Linear regression (with robust SEs) was used to compare the ratios statistically across age groups and gender, and assess trends over time. This analysis was restricted to the period
2000–2013 as CHD counts were more consistent during this time. All models included sex, age group, sex × age group interaction term and year as a continuous variable, and year squared was also included where a curved trend was indicated (Wald test, P<0.01). We fitted extended models with time interaction terms to test if there were differences in time trends by sex and age group (ie, we tested sex × year, age group × year, and sex × age group × year for ratios without curved trends, and for ratios with curved trends, also tested sex × year squared, age group × year squared, and sex × age group × year squared). Only a few of the time interaction tests had P<0.01, and in lieu of the large number of time interactions tested and the lack of any consistent pattern to these results, these were considered not to be real and were ignored (ie, consid-ered as false-positive time interactions). Analyses were performed using Stata V.13.1.
ethics approvalThe study was granted a waiver of informed consent.
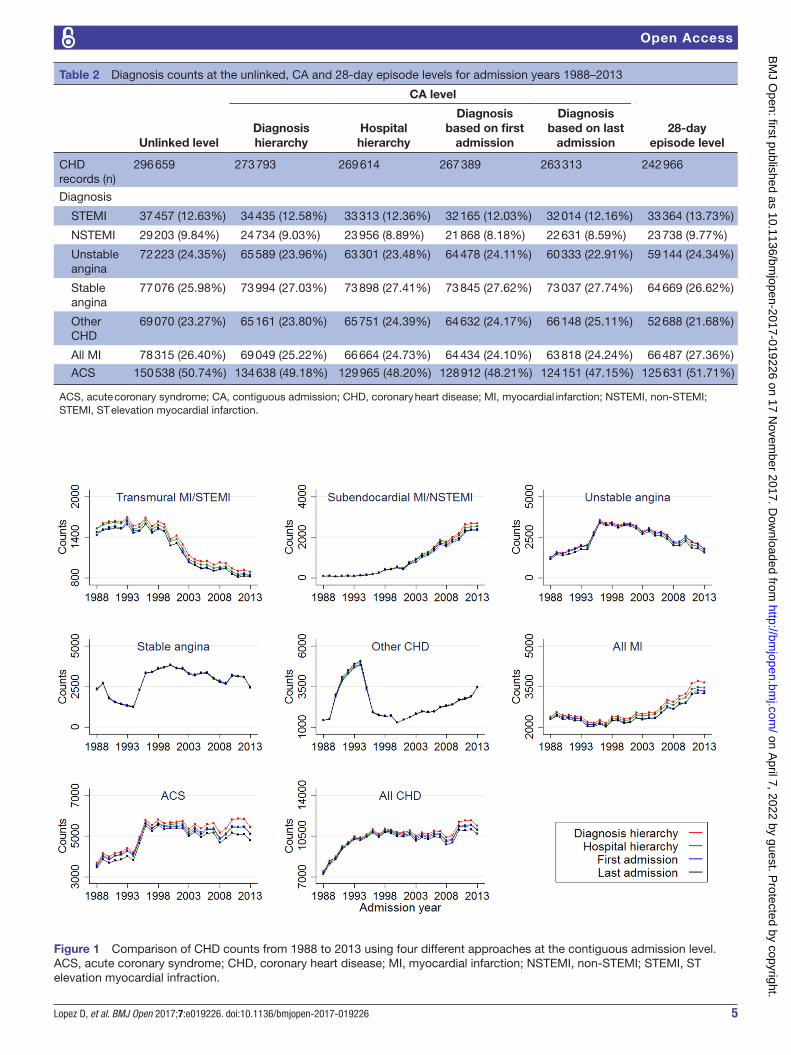
ReSulTSThere were 296 659 unlinked hospital admissions for CHD from 1988 to 2013 in WA (table 2). The diagnosis hierarchy approach resulted in the highest count of CHD admissions (n=273 793), and the approach based on the diagnosis from last admission resulted in the lowest count (n=263 313). The number of 28-day episodes was 242 966. The counts at the unlinked, CA level and 28-day episode level for each CHD subtype are shown in table 2.
Figure 1 shows trends in annual admission counts for each CHD subtype and combination subtypes at the CA level, using the diagnosis hierarchy approach and the three alternative approaches. The diagnosis hier-archy approach resulted in highest counts for the more severe CHD subtypes compared with the three alternative approaches, but all methods had similar trends over time for each CHD subtype.
Figure 2 compares annual CHD counts at the unlinked, CA (using diagnosis hierarchy approach) and 28-day episode levels from 1988 to 2013. The use of unlinked records resulted in the highest counts of all subtypes, while 28-day episode records resulted in the lowest counts. The difference between unlinked and CA counts tended to be greater in the latter half of the study period for STEMI, NSTEMI and unstable angina, while the reverse was apparent for Other CHD. The difference between unlinked and CA counts for NSTEMI, All MI and ACS increased from around 2000 onwards. The difference between CA and 28-day episode counts tended to increase from around 2000 onwards for NSTEMI but narrowed for STEMI and unstable angina.
Table 3 and online supplementary table 1 present esti-mated ratios for unlinked to CA counts (based on diag-nosis hierarchy approach) from fitted regression models by CHD subtype, sex and age group for the period 2000–2013. In women aged 35–54 years, the ratio of unlinked
on April 7, 2022 by guest. P
rotected by copyright.http://bm
jopen.bmj.com
/B
MJ O
pen: first published as 10.1136/bmjopen-2017-019226 on 17 N
ovember 2017. D
ownloaded from
4 Lopez D, et al. BMJ Open 2017;7:e019226. doi:10.1136/bmjopen-2017-019226
Open Access
Tab
le 1
E
xam
ple
of t
ypic
al p
atie
nt r
ecor
d (n
ot a
rea
l pat
ient
) dep
ictin
g th
e d
iffer
ent
app
roac
hes
of a
ssig
ning
a d
iagn
osis
to
CA
and
28-
day
ep
isod
es
Rec
ord
no
.P
atie
nt
IDA
dm
issi
on
dat
eD
isch
arg
e d
ate
Ho
spit
alTr
ansf
er28
-day
re
adm
issi
on
CA
no
.
28-d
ay
epis
od
e no
.P
rinc
ipal
d
iag
nosi
s
Dia
gno
sis
app
roac
h at
the
CA
leve
lD
iag
nosi
s at
28-
day
ep
iso
de
leve
lD
iag
nosi
s hi
erar
chy
Ho
spit
al
hier
arch
yFi
rst
adm
issi
on
Last
ad
mis
sio
n
11
1 Fe
bru
ary
2005
2 Fe
bru
ary
2005
Rur
al1
1S
tab
le
angi
naN
STE
MI
Uns
tab
le
angi
naS
tab
le
angi
naN
STE
MI
STE
MI
21
2 Fe
bru
ary
2005
4 Fe
bru
ary
2005
Met
rop
olita
n te
rtia
ry1
11
Uns
tab
le
angi
na
31
4 Fe
bru
ary
2005
6 Fe
bru
ary
2005
Met
rop
olita
n no
n-te
rtia
ry1
11
NS
TEM
I
41
17 F
ebru
ary
2005
18 F
ebru
ary
2005
Met
rop
olita
n te
rtia
ry1
21
STE
MI
STE
MI
STE
MI
STE
MI
Oth
er C
HD
–
51
18 F
ebru
ary
2005
22 F
ebru
ary
2005
Priv
ate
11
21
Oth
er C
HD
61
10 O
ctob
er
2005
11 O
ctob
er
2005
Met
rop
olita
n no
n-te
rtia
ry3
2S
tab
le
angi
naN
STE
MI
NS
TEM
IS
tab
le
angi
naN
STE
MI
NS
TEM
I
71
11 O
ctob
er
2005
14 O
ctob
er
2005
Met
rop
olita
n te
rtia
ry1
32
NS
TEM
I
81
1 D
ecem
ber
20
052
Dec
emb
er
2005
Rur
al4
3N
on-C
HD
Sta
ble
an
gina
Sta
ble
an
gina
Non
-CH
DN
on-C
HD
Sta
ble
an
gina
91
2 D
ecem
ber
20
053
Dec
emb
er
2005
Met
rop
olita
n te
rtia
ry1
43
Sta
ble
an
gina
101
3 D
ecem
ber
20
055
Dec
emb
er
2005
Priv
ate
14
3N
on-C
HD
CA
, con
tiguo
us a
dm
issi
on; C
HD
, cor
onar
y he
art
dis
ease
; NS
TEM
I, no
n-S
TEM
I; S
TEM
I, S
T el
evat
ion
myo
card
ial i
nfar
ctio
n.
on April 7, 2022 by guest. P
rotected by copyright.http://bm
jopen.bmj.com
/B
MJ O
pen: first published as 10.1136/bmjopen-2017-019226 on 17 N
ovember 2017. D
ownloaded from
5Lopez D, et al. BMJ Open 2017;7:e019226. doi:10.1136/bmjopen-2017-019226
Open Access
Table 2 Diagnosis counts at the unlinked, CA and 28-day episode levels for admission years 1988–2013
Unlinked level
CA level
28-day episode level
Diagnosis hierarchy
Hospital hierarchy
Diagnosis based on first
admission
Diagnosis based on last
admission
CHD records (n)
296 659 273 793 269 614 267 389 263 313 242 966
Diagnosis
STEMI 37 457 (12.63%) 34 435 (12.58%) 33 313 (12.36%) 32 165 (12.03%) 32 014 (12.16%) 33 364 (13.73%)
NSTEMI 29 203 (9.84%) 24 734 (9.03%) 23 956 (8.89%) 21 868 (8.18%) 22 631 (8.59%) 23 738 (9.77%)
Unstable angina
72 223 (24.35%) 65 589 (23.96%) 63 301 (23.48%) 64 478 (24.11%) 60 333 (22.91%) 59 144 (24.34%)
Stable angina
77 076 (25.98%) 73 994 (27.03%) 73 898 (27.41%) 73 845 (27.62%) 73 037 (27.74%) 64 669 (26.62%)
Other CHD
69 070 (23.27%) 65 161 (23.80%) 65 751 (24.39%) 64 632 (24.17%) 66 148 (25.11%) 52 688 (21.68%)
All MI 78 315 (26.40%) 69 049 (25.22%) 66 664 (24.73%) 64 434 (24.10%) 63 818 (24.24%) 66 487 (27.36%)
ACS 150 538 (50.74%) 134 638 (49.18%) 129 965 (48.20%) 128 912 (48.21%) 124 151 (47.15%) 125 631 (51.71%)
ACS, acute coronary syndrome; CA, contiguous admission; CHD, coronary heart disease; MI, myocardial infarction; NSTEMI, non-STEMI; STEMI, ST elevation myocardial infarction.
Figure 1 Comparison of CHD counts from 1988 to 2013 using four different approaches at the contiguous admission level. ACS, acute coronary syndrome; CHD, coronary heart disease; MI, myocardial infarction; NSTEMI, non-STEMI; STEMI, ST elevation myocardial infraction.
on April 7, 2022 by guest. P
rotected by copyright.http://bm
jopen.bmj.com
/B
MJ O
pen: first published as 10.1136/bmjopen-2017-019226 on 17 N
ovember 2017. D
ownloaded from

6 Lopez D, et al. BMJ Open 2017;7:e019226. doi:10.1136/bmjopen-2017-019226
Open Access
Figure 2 Comparison of CHD counts at the unlinked, CA (diagnosis hierarchy approach) and 28-day episode levels from 1988 to 2013. ACS, acute coronary syndrome; CA, contiguous admission; CHD, coronary heart disease; MI, myocardial infarction; NSTEMI, non-STEMI; STEMI, ST elevation myocardial infarction.
to CA counts for NSTEMI admissions in 2000 was 1.10 (ie, 10% higher in unlinked), and this increased in a linear fashion to 1.30 (ie, 30% higher) in 2013, representing an increase of 0.0148 per year. Conversely, the overcount for STEMI and All MI followed a curved (quadratic) trend. For subtypes with a linear trend, the trend coefficients were largest in the most severe CHD subtype (NSTEMI: increase of 0.0148/year) and smallest in the least severe subtype (Other CHD: non-significant increase of 0.0003/year). The sex × age group interaction term was not signif-icant in any individual or combination subtype, but the ratios were significantly higher in the youngest age group for STEMI, NSTEMI, stable angina and all combination subtypes. Men had significantly higher ratios than women for unstable angina and ACS.
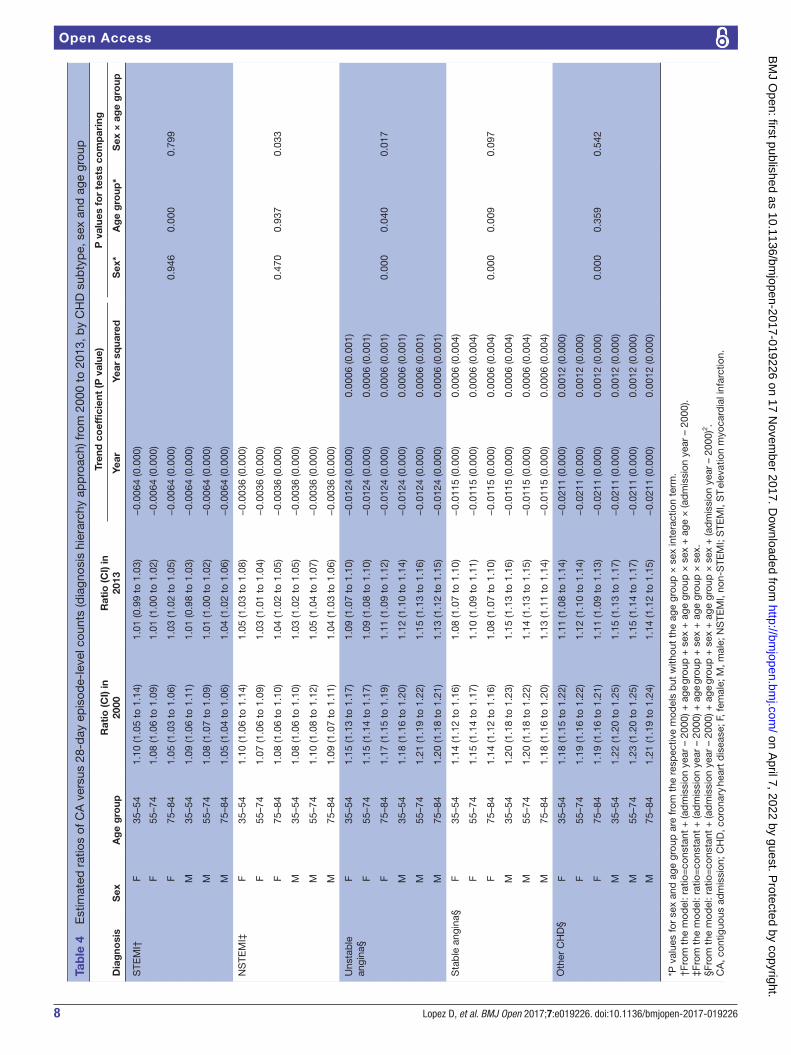
Table 4 and online supplementary table 2 present the estimated ratios for CA versus 28-day episode counts. For example, in women aged 35–54 years, the ratio for STEMI was 1.10 in 2000 (ie, 10% higher for CA counts), and this decreased to 1.01 in 2013 (ie, 1% higher), repre-senting a 0.0064 decrease per year. Ratios for unstable angina, stable angina, Other CHD and All CHD followed a curved (quadratic) trend. For example in women aged 35–54 years, the ratio for unstable angina was 1.15 in
2000 before levelling out at 1.09 from 2010 onwards. For unstable angina, stable angina, Other CHD, ACS and All CHD, the ratios were significantly higher in men than in women. Differences in ratios between age groups were seen for All CHD subtypes except for NSTEMI and Other CHD.
DISCuSSIOnWe developed different approaches to assign CHD diag-noses to a sequence of consecutive admissions and 28-day episodes that account for transfers and readmissions, thereby avoiding the overcount that occurs with unlinked administrative data. Hospitalisation data from 1988 to 2013 show that for each CHD subtype, unlinked records overcounted the number of CHD hospitalisations relative to CA counts and 28-day episode counts. Our analyses of ratios from 2000 to 2013 showed a complex pattern of overcounting in unlinked data due to transfers and read-missions. In almost All CHD subtypes, the ratios changed in a linear or quadratic fashion over time, and the coef-ficients of the trends differed across CHD subtypes. Further, for many CHD subtypes, the ratios also differed by age group and sex.
on April 7, 2022 by guest. P
rotected by copyright.http://bm
jopen.bmj.com
/B
MJ O
pen: first published as 10.1136/bmjopen-2017-019226 on 17 N
ovember 2017. D
ownloaded from

7Lopez D, et al. BMJ Open 2017;7:e019226. doi:10.1136/bmjopen-2017-019226
Open Access
Tab
le 3
E
stim
ated
rat
ios
of u
nlin
ked
ver
sus
CA
-lev
el c
ount
s (d
iagn
osis
hie
rarc
hy a
pp
roac
h) fr
om 2
000
to 2
013,
by
CH
D s
ubty
pe,
sex
and
age
gro
up
Dia
gno
sis
Sex
Ag
e g
roup
Rat
io (C
I) in
200
0R
atio
(CI)
in 2
013
Tren
d c
oef
fici
ent
(P v
alue
)P
val
ues
for
test
s co
mp
arin
g
Year
Year
sq
uare
dS
ex*
Ag
e g
roup
*S
ex ×
ag
e g
roup
STE
MI†
F35
–54
1.12
(1.0
9 to
1.1
5)1.
14 (1
.11
to 1
.18)
0.01
74 (0
.000
)−
0.00
12 (0
.000
)
F55
–74
1.09
(1.0
6 to
1.1
1)1.
11 (1
.08
to 1
.14)
0.01
74 (0
.000
)−
0.00
12 (0
.000
)
F75
–84
1.05
(1.0
2 to
1.0
9)1.
07 (1
.02
to 1
.13)
0.01
74 (0
.000
)−
0.00
12 (0
.000
)0.
946
0.00
00.
945
M35
–54
1.12
(1.1
0 to
1.1
5)1.
15 (1
.11
to 1
.19)
0.01
74 (0
.000
)−
0.00
12 (0
.000
)
M55
–74
1.08
(1.0
6 to
1.1
0)1.
10 (1
.08
to 1
.13)
0.01
74 (0
.000
)−
0.00
12 (0
.000
)
M75
–84
1.05
(1.0
3 to
1.0
8)1.
08 (1
.04
to 1
.11)
0.01
74 (0
.000
)−
0.00
12 (0
.000
)
NS
TEM
I‡F
35–5
41.
10 (1
.08
to 1
.13)
1.30
(1.2
7 to
1.3
3)0.
0148
(0.0
00)
F55
–74
1.08
(1.0
6 to
1.1
0)1.
27 (1
.25
to 1
.29)
0.01
48 (0
.000
)
F75
–84
1.04
(1.0
2 to
1.0
6)1.
23 (1
.21
to 1
.25)
0.01
48 (0
.000
)0.
768
0.00
00.
734
M35
–54
1.12
(1.0
9 to
1.1
4)1.
31 (1
.29
to 1
.33)
0.01
48 (0
.000
)
M55
–74
1.07
(1.0
6 to
1.0
9)1.
27 (1
.25
to 1
.28)
0.01
48 (0
.000
)
M75
–84
1.03
(1.0
2 to
1.0
5)1.
23 (1
.21
to 1
.24)
0.01
48 (0
.000
)
Uns
tab
le
angi
na‡
F35
–54
1.09
(1.0
7 to
1.1
0)1.
15 (1
.13
to 1
.16)
0.00
47 (0
.000
)
F55
–74
1.09
(1.0
7 to
1.1
0)1.
15 (1
.14
to 1
.16)
0.00
47 (0
.000
)
F75
–84
1.07
(1.0
6 to
1.0
9)1.
14 (1
.12
to 1
.15)
0.00
47 (0
.000
)0.
000
0.01
00.
445
M35
–54
1.12
(1.1
0 to
1.1
3)1.
18 (1
.16
to 1
.20)
0.00
47 (0
.000
)
M55
–74
1.10
(1.0
9 to
1.1
1)1.
16 (1
.15
to 1
.17)
0.00
47 (0
.000
)
M75
–84
1.09
(1.0
8 to
1.1
1)1.
15 (1
.14
to 1
.17)
0.00
47 (0
.000
)
Sta
ble
ang
ina‡
F35
–54
1.05
(1.0
4 to
1.0
6)1.
07 (1
.06
to 1
.08)
0.00
15 (0
.000
)
F55
–74
1.03
(1.0
3 to
1.0
4)1.
05 (1
.05
to 1
.06)
0.00
15 (0
.000
)
F75
–84
1.03
(1.0
3 to
1.0
4)1.
05 (1
.05
to 1
.06)
0.00
15 (0
.000
)0.
031
0.00
00.
776
M35
–54
1.04
(1.0
4 to
1.0
5)1.
06 (1
.05
to 1
.07)
0.00
15 (0
.000
)
M55
–74
1.03
(1.0
3 to
1.0
3)1.
05 (1
.04
to 1
.05)
0.00
15 (0
.000
)
M75
–84
1.03
(1.0
2 to
1.0
4)1.
05 (1
.04
to 1
.06)
0.00
15 (0
.000
)
Oth
er C
HD
‡F
35–5
41.
05 (1
.03
to 1
.07)
1.06
(1.0
3 to
1.0
8)0.
0003
(0.5
83)
F55
–74
1.03
(1.0
2 to
1.0
4)1.
04 (1
.03
to 1
.05)
0.00
03 (0
.583
)
F75
–84
1.04
(1.0
3 to
1.0
6)1.
05 (1
.03
to 1
.06)
0.00
03 (0
.583
)0.
057
0.07
20.
630
M35
–54
1.04
(1.0
3 to
1.0
5)1.
04 (1
.03
to 1
.05)
0.00
03 (0
.583
)
M55
–74
1.03
(1.0
2 to
1.0
4)1.
03 (1
.03
to 1
.04)
0.00
03 (0
.583
)
M75
–84
1.03
(1.0
2 to
1.0
4)1.
04 (1
.03
to 1
.05)
0.00
03 (0
.583
)
*P v
alue
s fo
r se
x an
d a
ge g
roup
are
from
the
res
pec
tive
mod
els
but
with
out
the
age
grou
p ×
sex
inte
ract
ion
term
.†F
rom
the
mod
el: r
atio
=co
nsta
nt +
(ad
mis
sion
yea
r –
2000
) + a
ge g
roup
+ s
ex +
age
gro
up ×
sex
+ (a
dm
issi
on y
ear
– 20
00)2 .
‡Fro
m t
he m
odel
: rat
io=
cons
tant
+ (a
dm
issi
on y
ear
– 20
00) +
age
gro
up +
sex
+ a
ge g
roup
× s
ex.
CA
, con
tiguo
us a
dm
issi
on; C
HD
, cor
onar
y he
art
dis
ease
; F, f
emal
e; M
, mal
e;N
STE
MI,
non-
STE
MI;
STE
MI,
ST
elev
atio
n m
yoca
r dia
l inf
arct
ion.
on April 7, 2022 by guest. P
rotected by copyright.http://bm
jopen.bmj.com
/B
MJ O
pen: first published as 10.1136/bmjopen-2017-019226 on 17 N
ovember 2017. D
ownloaded from
8 Lopez D, et al. BMJ Open 2017;7:e019226. doi:10.1136/bmjopen-2017-019226
Open Access
Tab
le 4
E
stim
ated
rat
ios
of C
A v
ersu
s 28
-day
ep
isod
e-le
vel c
ount
s (d
iagn
osis
hie
rarc
hy a
pp
roac
h) fr
om 2
000
to 2
013,
by
CH
D s
ubty
pe,
sex
and
age
gro
up
Dia
gno
sis
Sex
Ag
e g
roup
Rat
io (C
I) in
2000
Rat
io (C
I) in
2013
Tren
d c
oef
fici
ent
(P v
alue
)P
val
ues
for
test
s co
mp
arin
g
Year
Year
sq
uare
dS
ex*
Ag
e g
roup
*S
ex ×
ag
e g
roup
STE
MI†
F35
–54
1.10
(1.0
5 to
1.1
4)1.
01 (0
.99
to 1
.03)
−0.
0064
(0.0
00)
F55
–74
1.08
(1.0
6 to
1.0
9)1.
01 (1
.00
to 1
.02)
−0.
0064
(0.0
00)
F75
–84
1.05
(1.0
3 to
1.0
6)1.
03 (1
.02
to 1
.05)
−0.
0064
(0.0
00)
0.94
60.
000
0.79
9
M35
–54
1.09
(1.0
6 to
1.1
1)1.
01 (0
.98
to 1
.03)
−0.
0064
(0.0
00)
M55
–74
1.08
(1.0
7 to
1.0
9)1.
01 (1
.00
to 1
.02)
−0.
0064
(0.0
00)
M75
–84
1.05
(1.0
4 to
1.0
6)1.
04 (1
.02
to 1
.06)
−0.
0064
(0.0
00)
NS
TEM
I‡F
35–5
41.
10 (1
.06
to 1
.14)
1.05
(1.0
3 to
1.0
8)−
0.00
36 (0
.000
)
F55
–74
1.07
(1.0
6 to
1.0
9)1.
03 (1
.01
to 1
.04)
−0.
0036
(0.0
00)
F75
–84
1.08
(1.0
6 to
1.1
0)1.
04 (1
.02
to 1
.05)
−0.
0036
(0.0
00)
0.47
00.
937
0.03
3
M35
–54
1.08
(1.0
6 to
1.1
0)1.
03 (1
.02
to 1
.05)
−0.
0036
(0.0
00)
M55
–74
1.10
(1.0
8 to
1.1
2)1.
05 (1
.04
to 1
.07)
−0.
0036
(0.0
00)
M75
–84
1.09
(1.0
7 to
1.1
1)1.
04 (1
.03
to 1
.06)
−0.
0036
(0.0
00)
Uns
tab
le
angi
na§
F35
–54
1.15
(1.1
3 to
1.1
7)1.
09 (1
.07
to 1
.10)
−0.
0124
(0.0
00)
0.00
06 (0
.001
)
F55
–74
1.15
(1.1
4 to
1.1
7)1.
09 (1
.08
to 1
.10)
−0.
0124
(0.0
00)
0.00
06 (0
.001
)
F75
–84
1.17
(1.1
5 to
1.1
9)1.
11 (1
.09
to 1
.12)
−0.
0124
(0.0
00)
0.00
06 (0
.001
)0.
000
0.04
00.
017
M35
–54
1.18
(1.1
6 to
1.2
0)1.
12 (1
.10
to 1
.14)
−0.
0124
(0.0
00)
0.00
06 (0
.001
)
M55
–74
1.21
(1.1
9 to
1.2
2)1.
15 (1
.13
to 1
.16)
−0.
0124
(0.0
00)
0.00
06 (0
.001
)
M75
–84
1.20
(1.1
8 to
1.2
1)1.
13 (1
.12
to 1
.15)
−0.
0124
(0.0
00)
0.00
06 (0
.001
)
Sta
ble
ang
ina§
F35
–54
1.14
(1.1
2 to
1.1
6)1.
08 (1
.07
to 1
.10)
−0.
0115
(0.0
00)
0.00
06 (0
.004
)
F55
–74
1.15
(1.1
4 to
1.1
7)1.
10 (1
.09
to 1
.11)
−0.
0115
(0.0
00)
0.00
06 (0
.004
)
F75
–84
1.14
(1.1
2 to
1.1
6)1.
08 (1
.07
to 1
.10)
−0.
0115
(0.0
00)
0.00
06 (0
.004
)0.
000
0.00
90.
097
M35
–54
1.20
(1.1
8 to
1.2
3)1.
15 (1
.13
to 1
.16)
−0.
0115
(0.0
00)
0.00
06 (0
.004
)
M55
–74
1.20
(1.1
8 to
1.2
2)1.
14 (1
.13
to 1
.15)
−0.
0115
(0.0
00)
0.00
06 (0
.004
)
M75
–84
1.18
(1.1
6 to
1.2
0)1.
13 (1
.11
to 1
.14)
−0.
0115
(0.0
00)
0.00
06 (0
.004
)
Oth
er C
HD
§F
35–5
41.
18 (1
.15
to 1
.22)
1.11
(1.0
8 to
1.1
4)−
0.02
11 (0
.000
)0.
0012
(0.0
00)
F55
–74
1.19
(1.1
6 to
1.2
2)1.
12 (1
.10
to 1
.14)
−0.
0211
(0.0
00)
0.00
12 (0
.000
)
F75
–84
1.19
(1.1
6 to
1.2
1)1.
11 (1
.09
to 1
.13)
−0.
0211
(0.0
00)
0.00
12 (0
.000
)0.
000
0.35
90.
542
M35
–54
1.22
(1.2
0 to
1.2
5)1.
15 (1
.13
to 1
.17)
−0.
0211
(0.0
00)
0.00
12 (0
.000
)
M55
–74
1.23
(1.2
0 to
1.2
5)1.
15 (1
.14
to 1
.17)
−0.
0211
(0.0
00)
0.00
12 (0
.000
)
M75
–84
1.21
(1.1
9 to
1.2
4)1.
14 (1
.12
to 1
.15)
−0.
0211
(0.0
00)
0.00
12 (0
.000
)
*P v
alue
s fo
r se
x an
d a
ge g
roup
are
from
the
res
pec
tive
mod
els
but
with
out
the
age
grou
p ×
sex
inte
ract
ion
term
.†F
rom
the
mod
el: r
atio
=co
nsta
nt +
(ad
mis
sion
yea
r –
2000
) + a
ge g
roup
+ s
ex +
age
gro
up ×
sex
+ a
ge ×
(ad
mis
sion
yea
r –
2000
).‡F
rom
the
mod
el: r
atio
=co
nsta
nt +
(ad
mis
sion
yea
r –
2000
) + a
ge g
roup
+ s
ex +
age
gro
up ×
sex
.§F
rom
the
mod
el: r
atio
=co
nsta
nt +
(ad
mis
sion
yea
r –
2000
) + a
ge g
roup
+ s
ex +
age
gro
up ×
sex
+ (a
dm
issi
on y
ear
– 20
00)2 .
CA
, con
tiguo
us a
dm
issi
on; C
HD
, cor
onar
y he
art
dis
ease
; F, f
emal
e; M
, mal
e; N
STE
MI,
non-
STE
MI;
STE
MI,
ST
elev
atio
n m
yoca
rdia
l inf
arct
ion.
on April 7, 2022 by guest. P
rotected by copyright.http://bm
jopen.bmj.com
/B
MJ O
pen: first published as 10.1136/bmjopen-2017-019226 on 17 N
ovember 2017. D
ownloaded from

9Lopez D, et al. BMJ Open 2017;7:e019226. doi:10.1136/bmjopen-2017-019226
Open Access
The development of the CA method accounts for transfers and allows for classification by CHD subtype where multiple admissions with differing discharge diag-noses are present. As each transfer and admission to the receiving hospital has its own principal discharge diag-nosis, we compared four approaches to assigning a single clinically relevant diagnosis for each CA. Of the four approaches to assigning diagnosis, we contend that diag-nosis hierarchy is the most clinically relevant approach and indicator of healthcare burden as it prioritises disease severity according to a physician’s clinical judge-ment. Of the four approaches, diagnosis hierarchy results in the highest CHD counts and would therefore result in the most conservative differences between unlinked and CA. Hospital hierarchy is based on resourcing of hospitals with coronary care services and the level of resourcing may differ in other jurisdictions. The recent introduc-tion of coronary care services in rural hospitals in WA means that the hospital hierarchy method may become less applicable. Diagnosis based on first or last admission in a CA may not identify CHD-related admissions that occur in the middle of a CA, highlighted by the resulting low counts that occurred when using these methods to assign a diagnosis. A small number of patients have an MI during an admission for non-cardiac conditions16 and diagnosis based on first admission may not identify these CHD cases if they are subsequently transferred.
The ratios of unlinked versus CA counts for almost all subtypes (except STEMI and All MI) increased in a linear fashion, indicating a consistent increase in the overin-flation of admission numbers in unlinked data due to transfers. This likely reflects a complex mix of changes in clinical guidelines and practice, facilitated by direct transfers to hospitals with PCI capability for ACS cases and prehospital care protocols during this period. The widening difference between unlinked and CA counts for NSTEMI indicates an increasing rate of transfer for this group of patients. Given that patients with NSTEMI are still at risk of future adverse events, clinical guidelines now recommend that these patients undergo early coronary angiography and hospitalisation if indicated.2 17 Patients who are not at a hospital with advanced coronary care services may be transferred as a priority to a hospital with such capabilities. These findings show that the use of unlinked data would bias temporal trends in NSTEMI hospitalisation rates upwards and that linked data, using the described methods, would provide more reliable trend estimates for hospitalisation rates of NSTEMI in particular.
Furthermore, ratios were higher in the younger than older age groups for all subtypes, indicating that older patients with CHD were less likely to be transferred than younger patients. We also found men had a higher ratio than women for unstable angina and ACS. These sex and age differences in transfers may partly reflect age and sex disparities in ACS care and especially invasive manage-ment reported in earlier studies,18 19 although further studies are needed to support this theory.
Twenty-eight-day episodes have previously only been used to capture early MI readmissions following an index MI admission, thus reducing overestimation of popula-tion rates for MI. Historically, early readmissions were often for coronary procedures or other management related to the initial MI admission. Our method ensures 28-day episodes capture any CHD readmission during this period. In general, our results show that early readmis-sions across All CHD subtypes have decreased, although the trend was not linear for unstable and stable angina, and Other CHD. This could indicate that most acute treatment is now managed during the initial admission or subsequent transfer, thus requiring fewer readmissions.
The findings of this study have important implications for monitoring population trends in MI and Other CHD subtypes. The ratios of counts we presented would have been the same if we had used age-standardised rates (ASRs) as population denominators would have been the same in all three levels of counts. The trends in CA and 28-day episode counts for STEMI and NSTEMI are in accordance with other studies showing that hospital admissions for STEMI have decreased in Western coun-tries, while admissions for NSTEMI have increased.20 21 The use of the CA and 28-day episode methods in linked data offsets overcounting of MI events, which could poten-tially inflate trends in ASRs. The effect of overestimation of MI hospitalisation numbers due to transfers and read-missions could also artificially reduce case fatality because of the impact on case fatality denominators. In addition, it allows accurate representation of other subtypes of CHD, for which there are limited data at a whole-popu-lation level.
There are a number of jurisdictions including Australia where linked data are not available at a national/popula-tion level, for example, the USA, where studies reporting nationwide trends on MI or CHD rely on unlinked data (eg, Nationwide Inpatient Sample), or where the more recent introduction of national linked data necessitates use of unlinked data where long-term trends are required (eg, Hospital Episode Statistics data in England).22 23 Therefore we contend our methods and data will be of interest to countries outside of Australia. Although we have described an approach to dealing with transfers and defining episodes of care for use with CHD, these methods could be applied to other conditions that have high rates of transfer and readmissions, such as major trauma and head injury, where many patients are transferred from rural sites to major tertiary hospitals with intensive care and/or head injury units and rehabilitation.
Strengths and limitationsStrengths of our study include use of state-wide data that capture all hospital admissions in WA. Record linkage allowed the identification of CAs to account for transfers and 28-day episodes. The limitations of this study include the validity of coding for CHD. An earlier WA study using linked data showed that the sensitivity of hospital coding for MI was 76.9% in patients aged 35–69.14 The use of
on April 7, 2022 by guest. P
rotected by copyright.http://bm
jopen.bmj.com
/B
MJ O
pen: first published as 10.1136/bmjopen-2017-019226 on 17 N
ovember 2017. D
ownloaded from

10 Lopez D, et al. BMJ Open 2017;7:e019226. doi:10.1136/bmjopen-2017-019226
Open Access
28-day episodes may miss a small number of related read-missions that occur beyond 28 days. Furthermore, we did not adjust for confounders such as remoteness and Indigenous status, which may influence transfer and read-mission patterns.6 24 The complex pattern of counts and ratios we presented is from WA for 2000–2013 and may not be generalisable to other jurisdictions (because of different healthcare systems) or beyond the study period; however, the methods we described are generalisable to other states and territories.
COnCluSIOnSAlthough unlinked data have its place in measurement of hospital health service utilisation, its use in epidemiolog-ical estimates of CHD hospitalisations overestimates CHD counts. We contend that CA (accounting for transfers) and 28-day episode (accounting for transfers and read-missions) counts are more aligned with epidemiological studies of CHD. The degree of overestimation of counts using only unlinked records varies in a complex manner with CHD subtype, time, sex and age group, and it is not possible to apply a simple correction factor to counts obtained from unlinked data.
Acknowledgements The authors thank the staff at the Western Australian Data Linkage Branch and the Department of Health Inpatient Data Collections for the provision of linked data.
Contributors MSTH, FMS, LN and MK conceived the study. MSTH, FMS, LN, MK, JH, JB and TGB contributed to protocol development study design and methods. DL performed all the data and statistical analyses, with statistical advice from MK. DL constructed the figures and tables, and led the write-up of this manuscript. SM and AR provided advice on monitoring and linked data methods. DL, LN, MK, MSTH, TGB, DBP, JH, JB, SM, AR and FMS have interpreted the results, reviewed and approved this manuscript for submission.
Funding This work was supported by the National Health and Medical Research Council (NHMRC) of Australia project grant 1078978. The grant agency does not impose restrictions on conduct of analyses or dissemination of findings. LN is funded by a National Health and Medical Research Council of Australia Early Career Fellowship.
Competing interests None declared.
ethics approval This study was approved by the Human Research Ethics Committees of the Western Australian Department of Health and The University of Western Australia.
Provenance and peer review Not commissioned; externally peer reviewed.
Data sharing statement We will consider requests for data sharing on an individual basis, with an aim to sharing data whenever possible for appropriate research purposes. However the research project uses secondary (third party) data derived from Australian (State or Federal) government registries, which are ultimately governed by their ethics committees and data custodians. Therefore, any requests to share these data will be subject to formal approval from their ethics committees overseeing the use of these data sources, along with the data custodian(s) for the data of interest.
Open Access This is an Open Access article distributed in accordance with the Creative Commons Attribution Non Commercial (CC BY-NC 4.0) license, which permits others to distribute, remix, adapt, build upon this work non-commercially, and license their derivative works on different terms, provided the original work is properly cited and the use is non-commercial. See: http:// creativecommons. org/ licenses/ by- nc/ 4. 0/
© Article author(s) (or their employer(s) unless otherwise stated in the text of the article) 2017. All rights reserved. No commercial use is permitted unless otherwise expressly granted.
ReFeRenCeS 1. Australian Institute of Health and Welfare. Trends in coronary heart
disease mortality: age groups and populations. Canberra: AIHW, 2014.
2. Jespersen L, Hvelplund A, Abildstrøm SZ, et al. Stable angina pectoris with no obstructive coronary artery disease is associated with increased risks of major adverse cardiovascular events. Eur Heart J 2012;33:734–44.
3. Jamrozik K, Dobson A, Hobbs M, et al. Monitoring the incidence of cardiovascular disease in Australia. AIHW Cat. No. CVD 16. AIHW: Canberra, 2001.
4. Australian Institute of Health and Welfare. Monitoring acute coronary syndrome using national hospital data: an information paper on trends and issues. Canberra: AIHW, 2011.
5. Ranasinghe I, Barzi F, Brieger D, et al. Long-term mortality following interhospital transfer for acute myocardial infarction. Heart 2015;101:1032–40.
6. Lopez D, Katzenellenbogen JM, Sanfilippo FM, et al. Transfers to metropolitan hospitals and coronary angiography for rural Aboriginal and non-Aboriginal patients with acute ischaemic heart disease in Western Australia. BMC Cardiovasc Disord 2014;14:58.
7. Dunlay SM, Weston SA, Killian JM, et al. Thirty-day rehospitalizations after acute myocardial infarction: a cohort study. Ann Intern Med 2012;157:11–18.
8. Curtis JP, Schreiner G, Wang Y, et al. All-cause readmission and repeat revascularization after percutaneous coronary intervention in a cohort of medicare patients. J Am Coll Cardiol 2009;54:903–7.
9. Clark A, Preen DB, Ng JQ, et al. Is Western Australia representative of other Australian States and Territories in terms of key socio-demographic and health economic indicators? Aust Health Rev 2010;34:210–5.
10. Australian Bureau of Statistics. Australian demographic statistics - December quarter 2013. Canberra: ABS, 2014.
11. Wei-Randall HK, Davidson MJ, Jin J, et al. Acute myocardial infarction hospitalization and treatment: Areas with a high percentage of First Nations identity residents. Health Rep 2013;24:3–10.
12. Löwel H, Dobson A, Keil U, et al. Coronary heart disease case fatality in four countries. A community study. The Acute Myocardial Infarction Register Teams of Auckland, Augsburg, Bremen, FINMONICA, Newcastle, and Perth. Circulation 1993;88:2524–31.
13. Thygesen K, Alpert JS, Jaffe AS, et al. Third universal definition of myocardial infarction. Circulation 2012;126:2020–35.
14. Sanfilippo FM, Hobbs MS, Knuiman MW, et al. Can we monitor heart attack in the troponin era? Evidence from a population-based cohort study. BMC Cardiovasc Disord 2011;11:35.
15. Department of Health Western Australia. The model of care for acute coronary syndromes in Western Australia. Perth: DOHWA, 2009.
16. Maynard C, Lowy E, Rumsfeld J, et al. The prevalence and outcomes of in-hospital acute myocardial infarction in the Department of Veterans Affairs Health System. Arch Intern Med 2006;166:1410–6.
17. Chew DP, Scott IA, Cullen L, et al. National heart foundation of Australia & cardiac society of Australia and New Zealand: Australian clinical guidelines for the management of acute coronary syndromes 2016. Heart Lung Circ 2016;25:895–951.
18. Worrall-Carter L, McEvedy S, Wilson A, et al. Gender differences in presentation, coronary intervention, and outcomes of 28,985 acute coronary syndrome patients in Victoria, Australia. Womens Health Issues 2016;26:14–20.
19. Hao K, Takahashi J, Ito K, et al. Clinical characteristics of patients with acute myocardial infarction who did not undergo primary percutaneous coronary intervention- report from the miyagi-ami registry study. Circ J 2015;79:2009–16.
20. Amit G, Gilutz H, Cafri C, et al. What have the new definition of acute myocardial infarction and the introduction of troponin measurement done to the coronary care unit? Impacts on admission rate, length of stay, case mix and mortality. Cardiology 2004;102:171–6.
21. Jennings SM, Bennett K, Lonergan M, et al. Trends in hospitalisation for acute myocardial infarction in Ireland, 1997-2008. Heart 2012;98:1285–9.
22. Mason A, Roberts S, Goldacre M. 2001. Hospital admission, case fatality and mortality rates: myocardial infarction studies - full report. Oxford: University of Oxford.
23. Gupta A, Wang Y, Spertus JA, et al. Trends in acute myocardial infarction in young patients and differences by sex and race, 2001 to 2010. J Am Coll Cardiol 2014;64:337–45.
24. Lopez D, Katzenellenbogen JM, Sanfilippo FM, et al. Disparities experienced by Aboriginal compared to non-Aboriginal metropolitan Western Australians in receiving coronary angiography following acute ischaemic heart disease: the impact of age and comorbidities. Int J Equity Health 2014;13:93.
on April 7, 2022 by guest. P
rotected by copyright.http://bm
jopen.bmj.com
/B
MJ O
pen: first published as 10.1136/bmjopen-2017-019226 on 17 N
ovember 2017. D
ownloaded from